
Ch8_000
83
Blocher, Stout, Cokins, Chen, Cost Management, 4/e 8-1 ©The McGraw-Hill Companies 2008 CHAPTER 8: STRATEGY AND THE MASTER BUDGET QUESTIONS 8-1 Compel strategic planning and facilitate implementation of strategic plans . An organization’s strategy, strategic plans, and budgets are interrelated. Preparing budgets compels reviews of an organization’s strategy and its strategic plans and can facilitate implementations of the strategic plan. Feedback from budgets often results in improvements to an organization’s strategy and strategic plan. Serve as a basis for performance evaluation . Budgets serve as the benchmark against which actual performance can be compared. Budgets are a better basis for judging performance than past performance for two reasons. First, budgeted amounts take into account expected changes and improvements in the environment. Second, past performance is a result of past events and operations and may not be suitable to serve as a benchmark. To the extent past performance was not effective/efficient it does not make sense to use this as the standard against which actual performance is compared. Motivate managers and employees . Budgets, if internalized, serve as goals for managers and employees and, if properly implemented, can motivate them toward achievements of the goals. Promote coordination and communication within the organization . Budgets compel managers to think of interdependencies and interrelationships among subunits of the organization. A budget is also a communication device that helps all employees and managers understand and accept the organization’s objectives and expected roles and contributions over the coming period. Authorization to act . The approved budget, particularly in a not-for-profit setting, gives the manager authorization to act (make decisions, etc.). Other benefits include serving as a basis for resource allocation, aiding cash-flow management, and providing authorization documentation. 8-2 An organization’s strategic plan describes how the organization matches its strengths and weaknesses with the opportunities and threats in the marketplace in order to accomplish its long-term goals (e.g., achieve sustainable competitive advantage). It is the guideline for the firm’s short-term and long-term operations. A strategic plan may extend over several budget periods (e.g., years) covered by a master budget. A master budget is a comprehensive operational plan of action for the coming year. It includes both operating budgets and financial budgets and culminates in a set of forecasted (i.e., pro-forma) financial statements (cash flow, income statement, and balance sheet). The strategic plan of a firm guides, in a general sense, the determination of the master budgets prepared annually by the organization. Specialized consulting companies now provide software that can be used to integrate master budgets with strategic plans as part of a comprehensive performance management system. (See, for example, Geac, at www.performance.geac.com.)
-
Upload
khawarsher -
Category
Documents
-
view
31 -
download
0
description
chapter 8, accounting
Transcript of Ch8_000
Blocher, Stout, Cokins, Chen, Cost Management, 4/e 8-1 ©The McGraw-Hill Companies 2008
CHAPTER 8: STRATEGY AND THE MASTER BUDGET
QUESTIONS 8-1 Compel strategic planning and facilitate implementation of strategic plans. An
organization’s strategy, strategic plans, and budgets are interrelated. Preparing budgets compels reviews of an organization’s strategy and its strategic plans and can facilitate implementations of the strategic plan. Feedback from budgets often results in improvements to an organization’s strategy and strategic plan. Serve as a basis for performance evaluation. Budgets serve as the benchmark against which actual performance can be compared. Budgets are a better basis for judging performance than past performance for two reasons. First, budgeted amounts take into account expected changes and improvements in the environment. Second, past performance is a result of past events and operations and may not be suitable to serve as a benchmark. To the extent past performance was not effective/efficient it does not make sense to use this as the standard against which actual performance is compared. Motivate managers and employees. Budgets, if internalized, serve as goals for managers and employees and, if properly implemented, can motivate them toward achievements of the goals. Promote coordination and communication within the organization. Budgets compel managers to think of interdependencies and interrelationships among subunits of the organization. A budget is also a communication device that helps all employees and managers understand and accept the organization’s objectives and expected roles and contributions over the coming period. Authorization to act. The approved budget, particularly in a not-for-profit setting, gives the manager authorization to act (make decisions, etc.). Other benefits include serving as a basis for resource allocation, aiding cash-flow management, and providing authorization documentation.
8-2 An organization’s strategic plan describes how the organization matches its strengths
and weaknesses with the opportunities and threats in the marketplace in order to accomplish its long-term goals (e.g., achieve sustainable competitive advantage). It is the guideline for the firm’s short-term and long-term operations. A strategic plan may extend over several budget periods (e.g., years) covered by a master budget.
A master budget is a comprehensive operational plan of action for the coming year. It includes both operating budgets and financial budgets and culminates in a set of forecasted (i.e., pro-forma) financial statements (cash flow, income statement, and balance sheet). The strategic plan of a firm guides, in a general sense, the determination of the master budgets prepared annually by the organization. Specialized consulting companies now provide software that can be used to integrate master budgets with strategic plans as part of a comprehensive performance management system. (See, for example, Geac, at www.performance.geac.com.)
Blocher, Stout, Cokins, Chen, Cost Management, 4/e 8-2 ©The McGraw-Hill Companies 2008
8-3 A master budget is a comprehensive plan of action for an organization for a future period while a capital budget is an investment (and financing) plan for a major project or program that has long-range effects on operations. As indicated in text Exhibit 8.3, resources specified in the capital budget of the current period are included in the master budget of the period.
8-4 A master budget is a comprehensive plan of action for a future period; as such, the
master budget includes both operating and financial budgets. An operating budget consists of plans regarding revenues and resource acquisition/use across all major operating areas of the organization (e.g., sales, production, purchasing, marketing, research and development, and general administrative activities). The set of operating budgets culminates in a budgeted income statement. Financial budgets relate to sources and uses of funds for an upcoming period. The set of financial budgets culminates in a budgeted cash flow statement and budgeted balance sheet.
8-5 Successful budgeting systems typically:
� have full support by one or more key managers in the organization � become personalized budgets of the people who have the responsibility for
carrying them out; as such, they serve an important motivational function � are perceived by managers and employees as planning and coordinating tools,
not pressure devices or mechanisms designed to stifle creativity and opportunity � are not viewed as a basis for placing blame. � provide for a two-way flow of information in the budget-preparation process � include budgets that are “highly achievable”
8-6 The budget committee of an organization is the highest authority in the organization for all matters related to the budget. The committee sets or approves the overall budget goals for the organization and its major business units, directs and coordinates budget preparation, resolves conflicts and differences that may arise during the budget-preparation process, approves the final budget, monitors operations as the year unfolds, and reviews operating results at the end of the period. The budget committee also approves major revisions of the budget during the period.
8-7 No, these terms are not synonymous. The term “sales forecast” refers to estimated
sales volume for an upcoming period. As such, the sales forecast is generally the starting point in preparing the sales budget for the period. The term “sales budget” refers to forecasted sales dollars for an upcoming period.
Alternatively, rather than focusing on the difference between sales volume and
sales dollars, some writers distinguish between these two terms on the basis of the level of control: we use the term sales forecast to refer to both units and dollars because, unlike costs, these elements are affected by external (e.g., competitor actions) as well as internal factors (e.g., product promotion expenditures).
Blocher, Stout, Cokins, Chen, Cost Management, 4/e 8-3 ©The McGraw-Hill Companies 2008
8-8 The sales budget is often regarded as the cornerstone in the master budget because all operating activities in a business emanate from efforts to attain the level of sales specified in the sales budget. A firm can complete the plan for other activities of a period only after it knows the expected sales levels for the current and the immediate future periods. A manufacturing firm, for example, cannot complete its production schedule for the upcoming period without knowing the number of units it must produce for each of its products. The firm can ascertain the number of units to be produced only after it knows both forecasted sales and the desired ending inventory. The units to be produced, in turn, affect many other activities of the firm including amount and kinds of materials to be purchased, number of employees to be hired, levels of factory overhead, and selling and administrative expenses.
8-9 When sales volume is seasonal in nature, the three most significant items to
coordinate are: production volume, finished goods inventory, and sales volume. 8-10 Additional factors include:
� beginning and desired ending inventories of work-in-process and finished goods � the required material inputs (in lbs., liters, etc.) for each product � beginning and desired ending inventories of direct materials � the cost of materials (per lb., liter, etc.)
8-11 The two factors that determine the amount of factory overhead for a period are
management decision and planned production volume. The former refers to capacity-related (i.e., fixed overhead) costs while the latter refers to the planned utilization of that capacity (i.e., variable overhead costs).
8-12 A cash budget generally includes three major components:
� Cash available (i.e., beginning cash balance plus budgeted cash receipts) � Cash disbursements (other than interest expense), and � Financing activity (new financing, repayment of principal, and interest expense)
8-13 The following are some of the similarities between cash budgets and cash-flow
statements required by GAAP:
� Both include sources and uses of funds � Both are prepared for a period of time � Neither includes any non-cash revenues and expenses
Among differences between these two statements are:
� A cash-flow statement reports the results of past activities while a cash budget describes effects of planned operations.
� A firm needs to follow GAAP in preparing cash-flow statement while the guiding principle for preparing a cash budget is relevance and usefulness to management.

Blocher, Stout, Cokins, Chen, Cost Management, 4/e 8-4 ©The McGraw-Hill Companies 2008
� The major categories of cash-flow statements are operating, financing, and investing activities. Each of these categories may include both sources and uses of cash. The major categories of cash budgets are cash available, cash disbursements, and financing. Both cash available and cash disbursements may include cash from either operating or investing activities.
8-14 In comparison with manufacturing organizations, unique budget characteristics of
service organizations include:
� absence of production and materials purchases budgets � emphasis on workforce planning
8-15 In contrast to business firms (i.e., for-profit entities), a not-for-profit organization:
� has no single bottom-line amount such as operating income � is more likely to use its budgets as the source of authorization for its activities � limits the total amount in the budget to the expected total revenues (Federal
budgets are exceptions) 8-16 Zero-base budgeting (ZBB) is a budgeting process that requires managers to
prepare budgets each period from ground zero for all operations.
A typical budgeting process is “incremental” in nature. That is, budgets for the upcoming period start from the approved budgets for the current period, with amounts added to reflect planned changes for the upcoming period. Thus, traditional budgets assume that most, if not all, of the current activities and functions will continue into the coming budget period. In contrast, a zero-base budgeting process allows no activities or functions to be included in the budget unless managers can justify their need. Pure forms of ZBB are expensive and time-consuming. For this reason, some companies have partial ZBB systems.
A number of companies (e.g., Xerox, Texas Instruments) and government organizations (e.g., State of Georgia) have at one time or another used ZBB.
8-17 No. Kaizen budgeting is a budgeting approach that explicitly incorporates continuous
improvement standards/expectations in the approved budgets.
In contrast, activity-based budgeting (ABB) is a budgeting process that relies on the costs of activities and activity-cost drivers to prepare budgets. In other words, ABB develops master budget data using the organization’s activity-based cost (ABC) system. Thus, ABB begins by quantifying products and services to be produced for an upcoming period. These forecasts are then used to estimate the amount of activities, across the internal value chain, that are needed to meet forecasted output (products or services). The budgeting process is completed by assigning estimated resource costs to the specified activities. Both American Express and AT&T Paradyne provide examples of actual implementation of ABB systems. See, Player, S. & Keys, D. E. (eds.), Activity-Based Management: Arthur Andersen’s Lessons from the ABM Battlefield. New York: John Wiley & Sons, 1999.

Blocher, Stout, Cokins, Chen, Cost Management, 4/e 8-5 ©The McGraw-Hill Companies 2008
8-18 Budgetary slack, or "padding" the budget, is the practice of knowingly including a higher amount of expenditure in the budget (or lower amount of revenue) than managers actually believe should be the case. One reason that it is common to find slacks in budgets is the desire of managers to use such slack as a cushion for unpredictable/uncontrollable future events (e.g., worker attrition, machine breakdowns/malfunctions). Another reason is the increased recognition or reward that might accrue to those who “beat” their budget target. Finally, managers may believe that the budgets they submit will be “cut” in the budget negotiation process. Therefore, such managers must “pad” their budgets in order to secure the amount of resources they feel they actually need.
8-19 A “highly achievable” budget has a target that is achievable by most managers “most
of the time” (e.g., 80 to 90 percent of the time). In a study by Merchant (1990), the author finds that a budget with a highly achievable target serves well in the vast majority of organizational situations, especially when accompanied by extra rewards for performance exceeding the target.
Among the advantages of using a highly achievable budget target are the following:
1. Increasing managers' commitment to achieving the budget target. 2. Maintaining managers' confidence in the budget. 3. Decreasing organizational control cost. 4. Reducing the risk that managers will engage in harmful earnings-
management practices or violate corporate ethical standards. 5. Allowing effective and efficient managers greater operating flexibility. 6. Improving predictability of earnings or operating results. 7. Enhancing the usefulness of a budget as a planning and coordinating tool.
8-20 Participative budgeting is a “bottom-up” approach that involves everyone in the
budget-preparation process—from low-level workers all the way to the top managers of the organization. The principal idea is to have employees/managers “internalize” (i.e., take ownership of) the budgets that are prepared.
For participative budgeting to be effective, top management needs to be actively involved. Furthermore, top management should institute incentives to guard against excessive budget padding, and encourage the generation of accurate budgetary projections. Finally, top managers may have to serve as arbiters when irreconcilable differences occur in the budget preparation process.

Blocher, Stout, Cokins, Chen, Cost Management, 4/e 8-6 ©The McGraw-Hill Companies 2008
BRIEF EXERCISES 8-21
Q2 Q3 Sales—2007 16,000 15,000
Projected % increase for 2008 25% 25% Estimated Sales Volume—2008 20,000 18,750 x Estimated Unit Selling Price—2008 $4.00 $4.00 Estimated Sales Dollars—2008 $80,000 $75,000 8-22 Payment history: % paid in month of purchase: 25% % paid in month following month of purchase: 75% Expected Cash Disbursements: February: ($5,500 x 0.75) + ($6,500 x 0.25) = $5,750 March: ($6,500 x 0.75) + ($8,000 x 0.25) = $6,875 8-23 Number of units produced in Qtr. 1:
Ending inventory of DM (in lbs.) = 50,000 Target ending inventory % = 25% of following month’s production
requirements Therefore, RM used for production in Qtr. 1 = 50,000/0.25 = 200,000 lbs.
Units produced in Qtr. 1 = lbs. of RM used/lbs. of RM per unit of output = 200,000/8 = 25,000 units
DM requirements (in lbs.), Qtr. 2 = Planned production, Qtr. 2 x DM lbs./unit = (25,000 units x 1.10) x 8 lbs./unit = 27,500 units x 8 lbs./unit = 220,000 lbs. 8-24 Scheduled Production, Quarter 2:
Units required to meet estimated sales, Qtr. 2 = 12,000 units Units required to meet targeted ending inventory: 15,000 units x 10% = 1,500 units Total units needed 13,500 units Less: Beginning inventory, Qtr.2 (12,000 units x 10%) = 1,200 units Scheduled production, Quarter 2 = 12,300 units 8-25 Current level of monthly operating costs = $10,000:
Estimated operating costs, January = $10,000 x 0.991 = $9,900 Estimated operating costs, June = $10,000 x 0.996 = $9,415 Estimated operating costs, December = $10,000 x 0.9912 = $8,864
Blocher, Stout, Cokins, Chen, Cost Management, 4/e 8-7 ©The McGraw-Hill Companies 2008
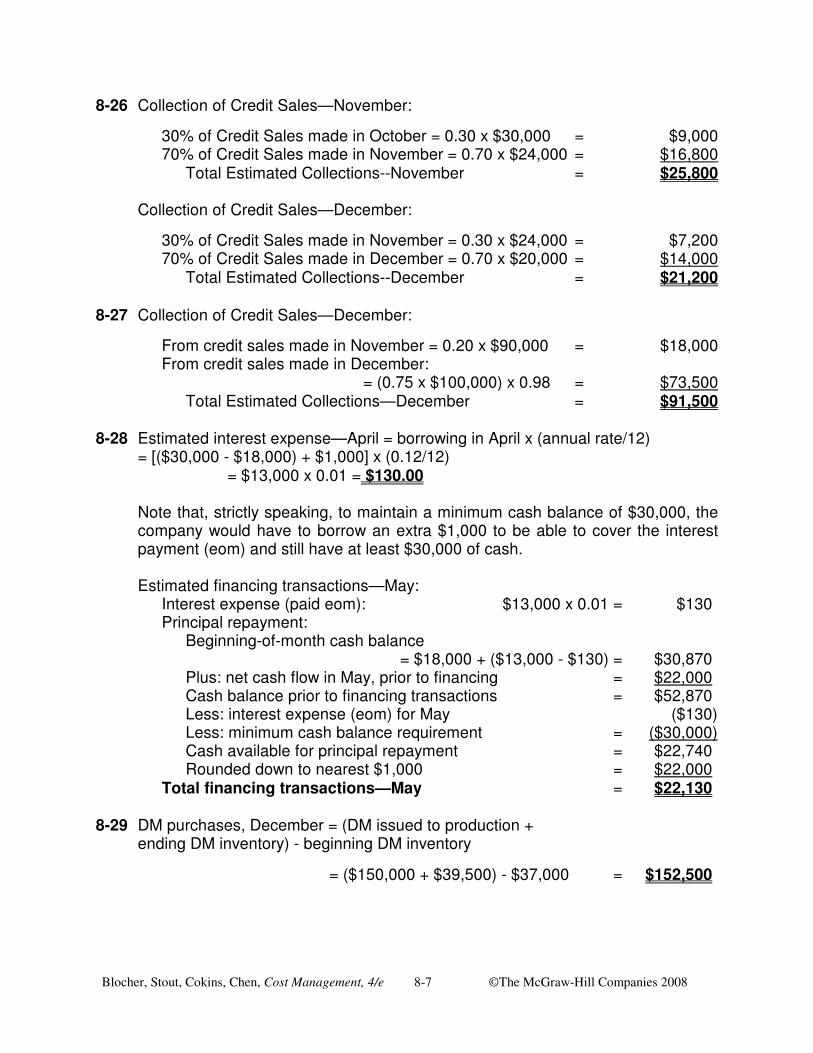
8-26 Collection of Credit Sales—November:
30% of Credit Sales made in October = 0.30 x $30,000 = $9,000 70% of Credit Sales made in November = 0.70 x $24,000 = $16,800 Total Estimated Collections--November = $25,800 Collection of Credit Sales—December:
30% of Credit Sales made in November = 0.30 x $24,000 = $7,200 70% of Credit Sales made in December = 0.70 x $20,000 = $14,000 Total Estimated Collections--December = $21,200 8-27 Collection of Credit Sales—December:
From credit sales made in November = 0.20 x $90,000 = $18,000 From credit sales made in December: = (0.75 x $100,000) x 0.98 = $73,500 Total Estimated Collections—December = $91,500 8-28 Estimated interest expense—April = borrowing in April x (annual rate/12) = [($30,000 - $18,000) + $1,000] x (0.12/12) = $13,000 x 0.01 = $130.00 Note that, strictly speaking, to maintain a minimum cash balance of $30,000, the
company would have to borrow an extra $1,000 to be able to cover the interest payment (eom) and still have at least $30,000 of cash.
Estimated financing transactions—May: Interest expense (paid eom): $13,000 x 0.01 = $130 Principal repayment: Beginning-of-month cash balance = $18,000 + ($13,000 - $130) = $30,870 Plus: net cash flow in May, prior to financing = $22,000 Cash balance prior to financing transactions = $52,870 Less: interest expense (eom) for May ($130) Less: minimum cash balance requirement = ($30,000) Cash available for principal repayment = $22,740 Rounded down to nearest $1,000 = $22,000 Total financing transactions—May = $22,130 8-29 DM purchases, December = (DM issued to production +
ending DM inventory) - beginning DM inventory
= ($150,000 + $39,500) - $37,000 = $152,500

Blocher, Stout, Cokins, Chen, Cost Management, 4/e 8-8 ©The McGraw-Hill Companies 2008
8-30 Total estimated marketing expenses, 4th quarter:
Variable costs = $0.05/unit x (4,000 units x 1.10) = $0.05/unit x 4,400 units = $220 Fixed costs: Salaries = $10,000 Depreciation = $5,000 Insurance = $2,000 $17,000 Total estimated marketing expenses, 4th quarter $17,220 Less: non-cash charges: Depreciation expense $5,000 Estimated cash payments for marketing expenses $12,220

Blocher, Stout, Cokins, Chen, Cost Management, 4/e 8-9 ©The McGraw-Hill Companies 2008
EXERCISES
8-31 “What-If” Analysis (20 Minutes) 1. The term “what if” analysis is one example of the more general term “sensitivity
analysis” and is used to explore the effects (e.g., on a decision or a budget for an upcoming period) of different marketing, production, or selling strategies (e.g., the effect on revenues of lowering product selling prices, the profit-effect of using a different sales-promotion plan). That is, a “what-if” analysis examines how a result will change if the original (base-line) data are not achieved or, as in the present case, if an underlying assumption (viz., rate of bad-debts expense) changes.
2. 3. Managers today work in a world of uncertainty. One way to cope with uncertainty in
the master budgeting process is to model the underlying relationships associated with the various budgets that are prepared and then to perform sensitivity analysis. One form of sensitivity analysis is the “what-if” analysis described above. For Tyson Company, this type of analysis can help the firm decide whether it might need to implement a more restrictive credit-granting policy and, if so, how much it might be willing to spend in this regard.

Blocher, Stout, Cokins, Chen, Cost Management, 4/e 8-10 ©The McGraw-Hill Companies 2008
8-32 Behavioral Considerations (15 Minutes) There are at least two issues here. One is the failure to take advantage of all the
cash discount included in the sales term. (In this regard, see Exercise 8-37.) The other is the constant occurrence of rush orders, last-minute changes, and other operating emergencies that require the purchasing department to do last minute purchases.
Janet needs to ensure that the Accounting Department records all purchases at the net price whenever a purchase is made with cash discounts included in the sales terms. Any additional amount that the firm has to pay because of the failure to make the payment within the payment terms should be charged to the finance department as a loss and not treated as an adjustment to the cost of purchase.
The firm needs to be very clear in its operating procedures about the minimum amount of time required for purchases. Any additional acquisition cost because of rush orders, last-minute changes, or operating emergencies should be borne by the department making the request.
Blocher, Stout, Cokins, Chen, Cost Management, 4/e 8-11 ©The McGraw-Hill Companies 2008
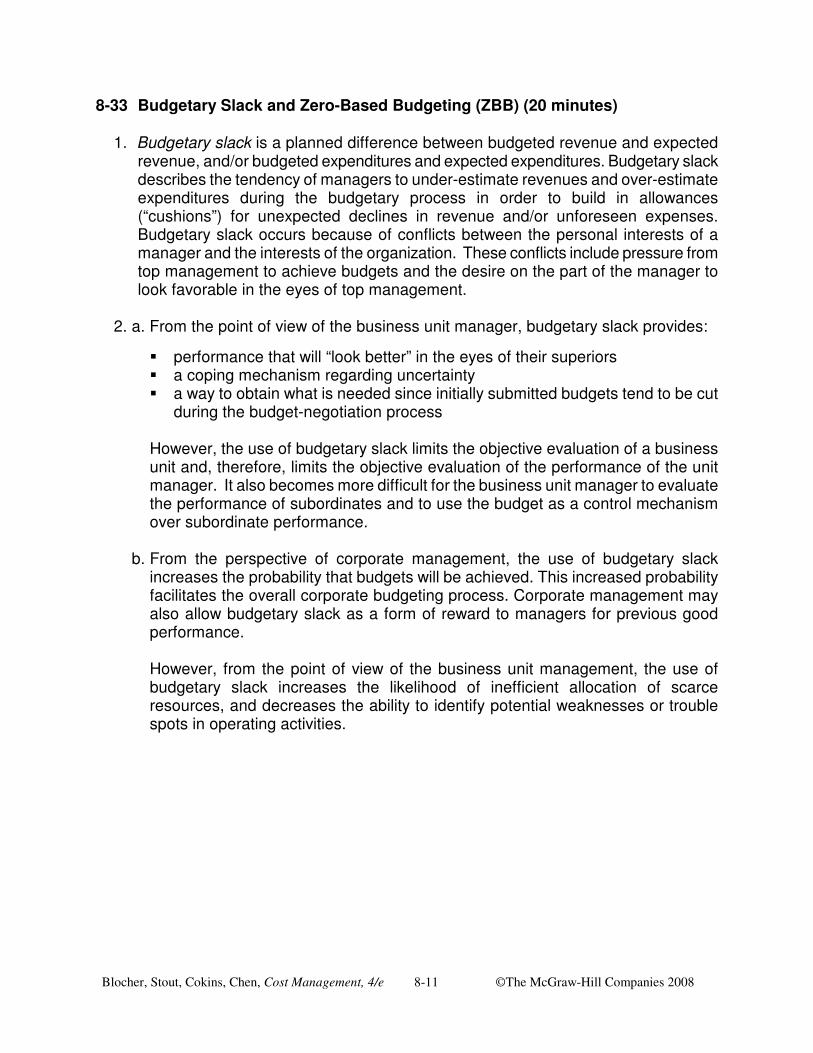
8-33 Budgetary Slack and Zero-Based Budgeting (ZBB) (20 minutes)
1. Budgetary slack is a planned difference between budgeted revenue and expected revenue, and/or budgeted expenditures and expected expenditures. Budgetary slack describes the tendency of managers to under-estimate revenues and over-estimate expenditures during the budgetary process in order to build in allowances (“cushions”) for unexpected declines in revenue and/or unforeseen expenses. Budgetary slack occurs because of conflicts between the personal interests of a manager and the interests of the organization. These conflicts include pressure from top management to achieve budgets and the desire on the part of the manager to look favorable in the eyes of top management.
2. a. From the point of view of the business unit manager, budgetary slack provides:
� performance that will “look better” in the eyes of their superiors � a coping mechanism regarding uncertainty � a way to obtain what is needed since initially submitted budgets tend to be cut
during the budget-negotiation process
However, the use of budgetary slack limits the objective evaluation of a business unit and, therefore, limits the objective evaluation of the performance of the unit manager. It also becomes more difficult for the business unit manager to evaluate the performance of subordinates and to use the budget as a control mechanism over subordinate performance.
b. From the perspective of corporate management, the use of budgetary slack
increases the probability that budgets will be achieved. This increased probability facilitates the overall corporate budgeting process. Corporate management may also allow budgetary slack as a form of reward to managers for previous good performance.
However, from the point of view of the business unit management, the use of budgetary slack increases the likelihood of inefficient allocation of scarce resources, and decreases the ability to identify potential weaknesses or trouble spots in operating activities.
Blocher, Stout, Cokins, Chen, Cost Management, 4/e 8-12 ©The McGraw-Hill Companies 2008
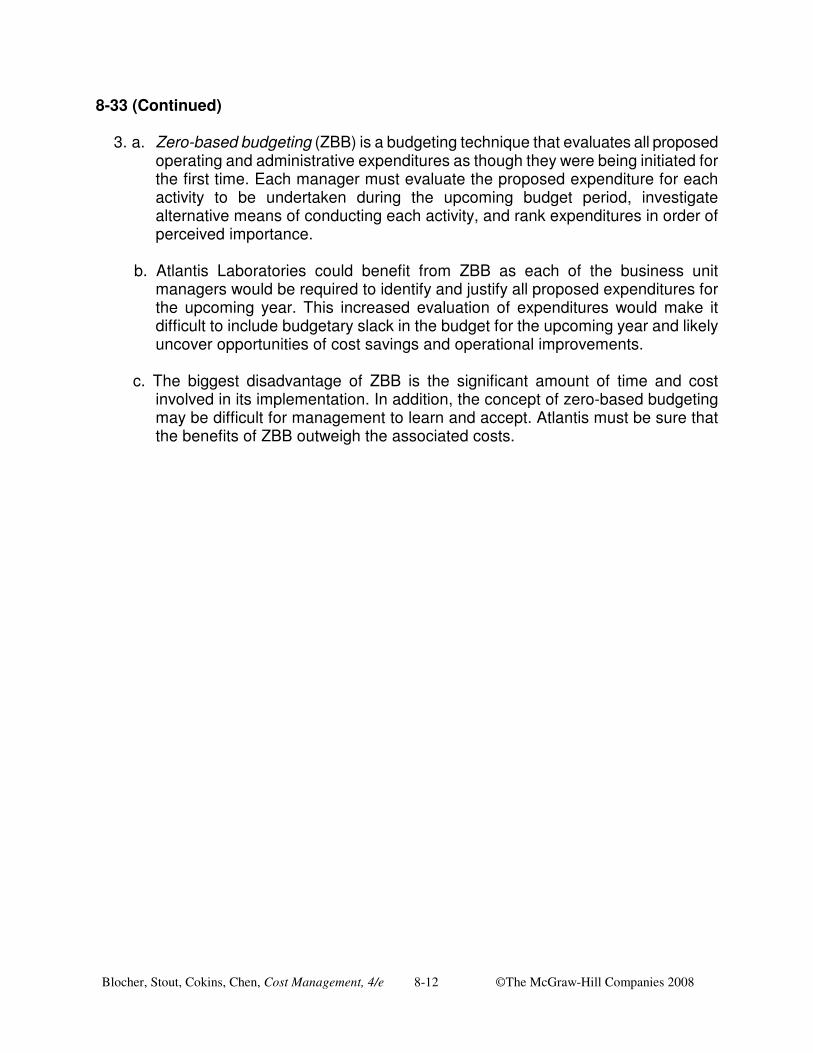
8-33 (Continued)
3. a. Zero-based budgeting (ZBB) is a budgeting technique that evaluates all proposed operating and administrative expenditures as though they were being initiated for the first time. Each manager must evaluate the proposed expenditure for each activity to be undertaken during the upcoming budget period, investigate alternative means of conducting each activity, and rank expenditures in order of perceived importance.
b. Atlantis Laboratories could benefit from ZBB as each of the business unit
managers would be required to identify and justify all proposed expenditures for the upcoming year. This increased evaluation of expenditures would make it difficult to include budgetary slack in the budget for the upcoming year and likely uncover opportunities of cost savings and operational improvements.
c. The biggest disadvantage of ZBB is the significant amount of time and cost
involved in its implementation. In addition, the concept of zero-based budgeting may be difficult for management to learn and accept. Atlantis must be sure that the benefits of ZBB outweigh the associated costs.
Blocher, Stout, Cokins, Chen, Cost Management, 4/e 8-13 ©The McGraw-Hill Companies 2008
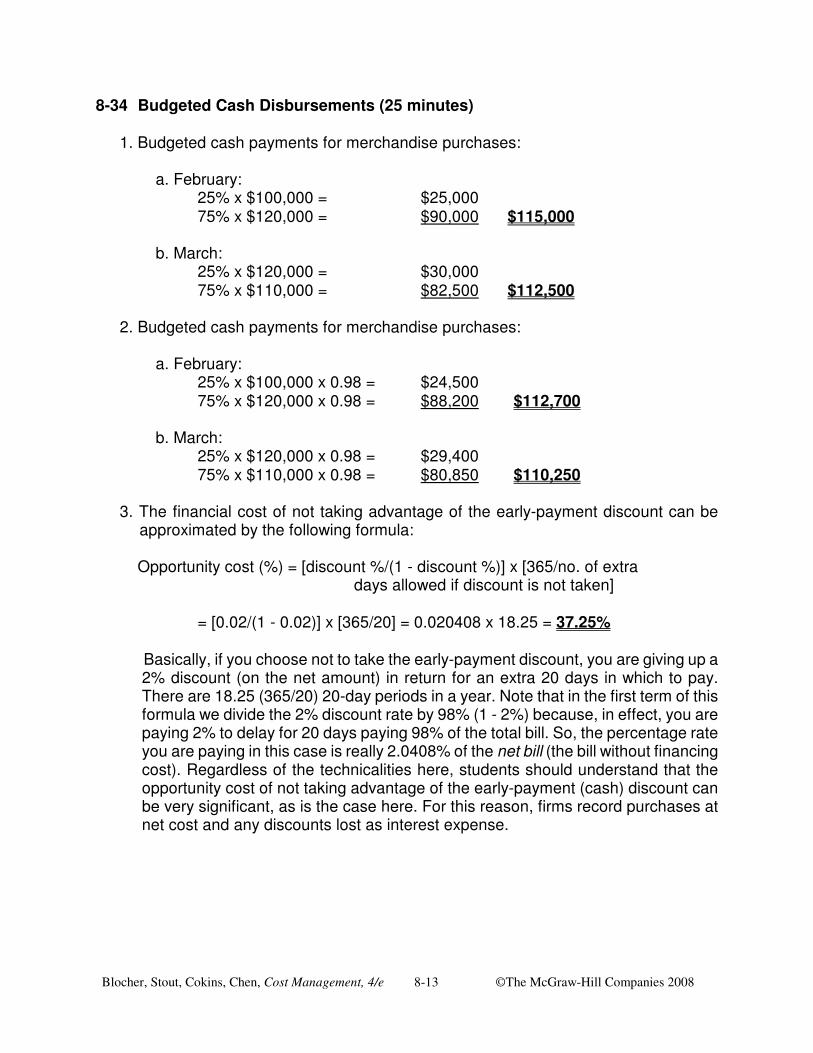
8-34 Budgeted Cash Disbursements (25 minutes) 1. Budgeted cash payments for merchandise purchases: a. February: 25% x $100,000 = $25,000 75% x $120,000 = $90,000 $115,000 b. March: 25% x $120,000 = $30,000 75% x $110,000 = $82,500 $112,500 2. Budgeted cash payments for merchandise purchases: a. February: 25% x $100,000 x 0.98 = $24,500 75% x $120,000 x 0.98 = $88,200 $112,700 b. March: 25% x $120,000 x 0.98 = $29,400 75% x $110,000 x 0.98 = $80,850 $110,250
3. The financial cost of not taking advantage of the early-payment discount can be approximated by the following formula:
Opportunity cost (%) = [discount %/(1 - discount %)] x [365/no. of extra days allowed if discount is not taken] = [0.02/(1 - 0.02)] x [365/20] = 0.020408 x 18.25 = 37.25%
Basically, if you choose not to take the early-payment discount, you are giving up a 2% discount (on the net amount) in return for an extra 20 days in which to pay. There are 18.25 (365/20) 20-day periods in a year. Note that in the first term of this formula we divide the 2% discount rate by 98% (1 - 2%) because, in effect, you are paying 2% to delay for 20 days paying 98% of the total bill. So, the percentage rate you are paying in this case is really 2.0408% of the net bill (the bill without financing cost). Regardless of the technicalities here, students should understand that the opportunity cost of not taking advantage of the early-payment (cash) discount can be very significant, as is the case here. For this reason, firms record purchases at net cost and any discounts lost as interest expense.
Blocher, Stout, Cokins, Chen, Cost Management, 4/e 8-14 ©The McGraw-Hill Companies 2008
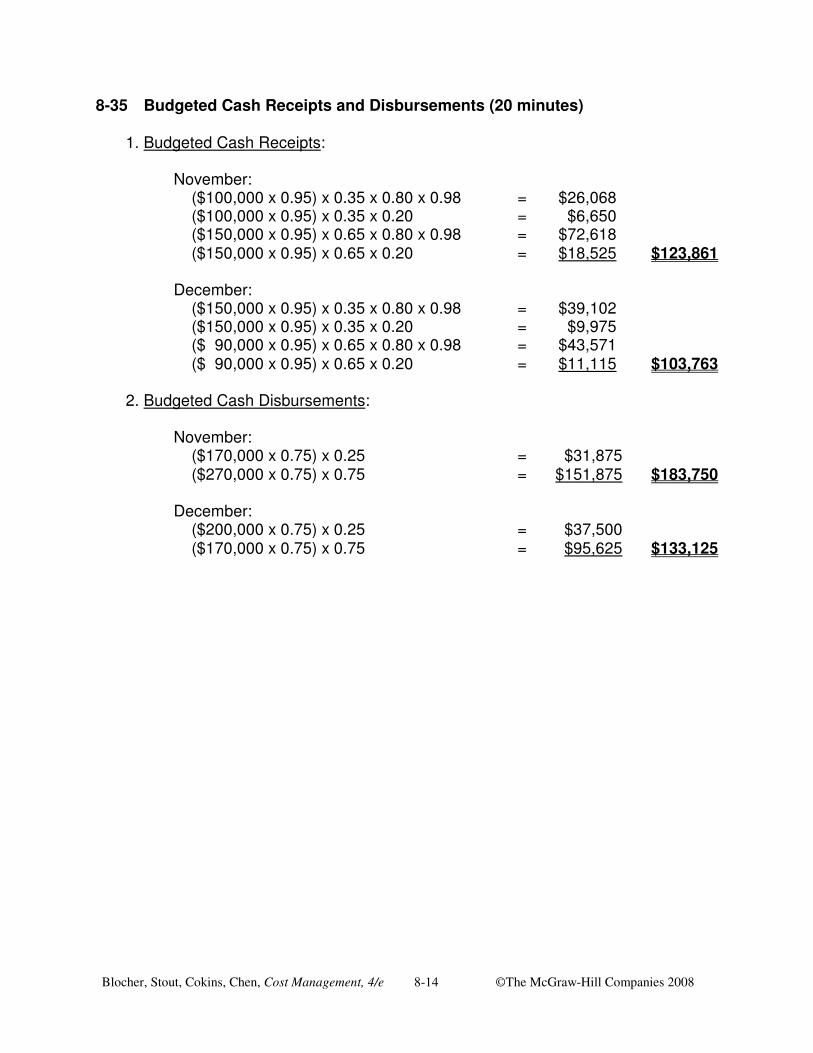
8-35 Budgeted Cash Receipts and Disbursements (20 minutes) 1. Budgeted Cash Receipts: November: ($100,000 x 0.95) x 0.35 x 0.80 x 0.98 = $26,068 ($100,000 x 0.95) x 0.35 x 0.20 = $6,650 ($150,000 x 0.95) x 0.65 x 0.80 x 0.98 = $72,618 ($150,000 x 0.95) x 0.65 x 0.20 = $18,525 $123,861 December: ($150,000 x 0.95) x 0.35 x 0.80 x 0.98 = $39,102 ($150,000 x 0.95) x 0.35 x 0.20 = $9,975 ($ 90,000 x 0.95) x 0.65 x 0.80 x 0.98 = $43,571 ($ 90,000 x 0.95) x 0.65 x 0.20 = $11,115 $103,763 2. Budgeted Cash Disbursements: November: ($170,000 x 0.75) x 0.25 = $31,875 ($270,000 x 0.75) x 0.75 = $151,875 $183,750 December: ($200,000 x 0.75) x 0.25 = $37,500 ($170,000 x 0.75) x 0.75 = $95,625 $133,125
Blocher, Stout, Cokins, Chen, Cost Management, 4/e 8-15 ©The McGraw-Hill Companies 2008
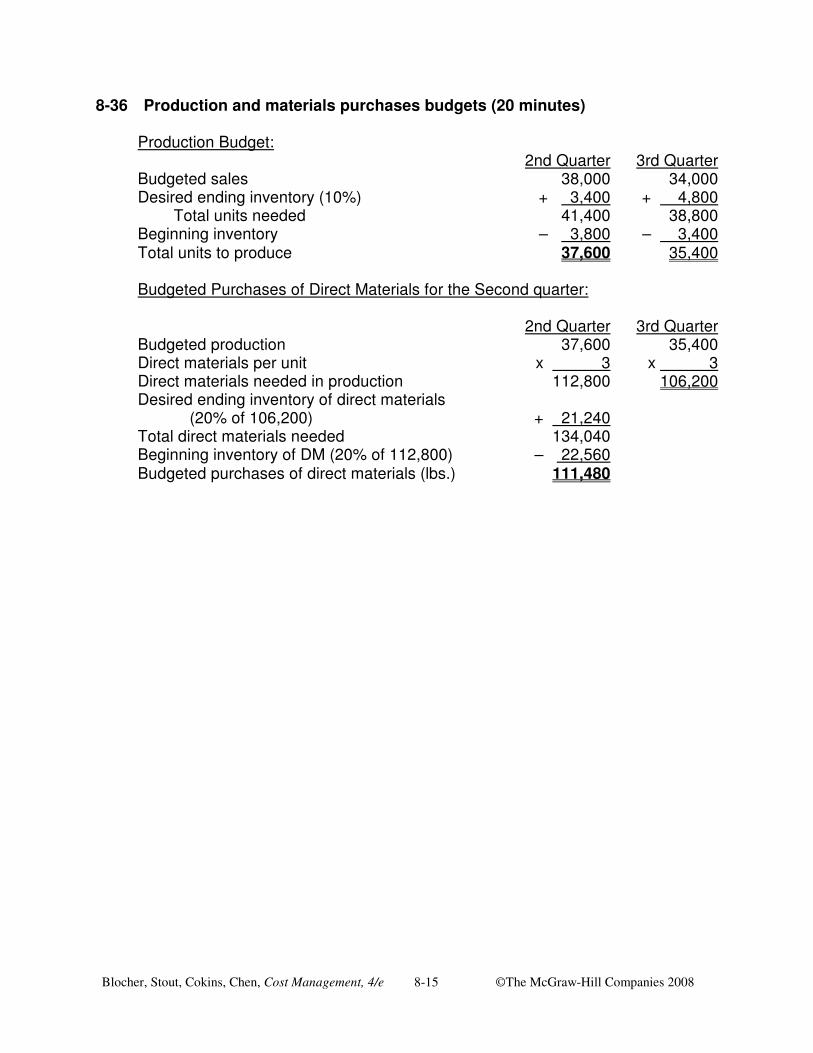
8-36 Production and materials purchases budgets (20 minutes) Production Budget: 2nd Quarter 3rd Quarter Budgeted sales 38,000 34,000
Desired ending inventory (10%) + 3,400 + 4,800 Total units needed 41,400 38,800
Beginning inventory – 3,800 – 3,400 Total units to produce 37,600 35,400 Budgeted Purchases of Direct Materials for the Second quarter: 2nd Quarter 3rd Quarter Budgeted production 37,600 35,400 Direct materials per unit x 3 x 3 Direct materials needed in production 112,800 106,200 Desired ending inventory of direct materials (20% of 106,200) + 21,240 Total direct materials needed 134,040 Beginning inventory of DM (20% of 112,800) – 22,560 Budgeted purchases of direct materials (lbs.) 111,480

Blocher, Stout, Cokins, Chen, Cost Management, 4/e 8-16 ©The McGraw-Hill Companies 2008
8-37 Purchase Discounts on Credit Purchases (20 minutes)
The financial cost of not taking advantage of the early-payment discount for purchases made on credit can be approximated by the following formula (we use the term “approximate” here to denote the fact that the estimate below does not assume compounding of interest and as such provides a conservative estimate):
Opportunity cost (%) = [discount %/(1 - discount %)] x [365/no. of extra days allowed if discount is not taken] 1. In the case of 2/10, n/30, the approximate economic cost of not taking
advantage of the early-payment discount is: = [0.02/(1 - 0.02)] x [365/20] = 0.020408 x 18.25 = 37.25%
Basically, if you choose not to take the early-payment discount, you are giving up a 2% discount (on the net amount) in return for an extra 20 days in which to pay. There are 18.25 (365/20) 20-day periods in a year. Note that in the first term of this formula we divide the 2% discount rate by 98% (1 - 2%) because, in effect, you are paying 2% to delay for 20 days paying 98% of the total bill. So, the percentage rate you are paying in this case is really 2.0408% of the net bill (the bill without financing cost).
2. In the case of 1/10, n/30, the opportunity cost of not taking advantage of the
early-payment cash discount is: = [0.01/(1 - 0.01)] x [365/20] = 0.010101 x 18.25 = 18.43%
3. Given the significant opportunity cost of not taking advantage of early-payment cash discounts, good accounting practice would be to record purchases at their net-of-discount amount and then to record as “interest expense” or “purchase discounts lost” any cash discounts not taken advantage of.

Blocher, Stout, Cokins, Chen, Cost Management, 4/e 8-17 ©The McGraw-Hill Companies 2008
8-38 Production and materials budgets--process costing (20 minutes) 1. Budgeted Production (XPL30): Units
Budgeted sales 480,000 Budgeted finished goods ending inventory (June 30, 2008) + 50,000 Total number of units needed 530,000 Less: Budgeted finished goods beginning inventory – 80,000 Budgeted production (units) 450,000
2. Units of XPL30 to Start into Production: Budgeted production (from (1) above) 450,000 Budgeted WIP ending inventory (June 30, 2008) + 20,000 Total number of units needed 470,000 Less: Budgeted WIP beginning inventory (July 1, 2007) – 10,000 Total units of XPL30 to start into production 460,000 3. Raw Materials Purchases Budget: Units of XPL30 to start into production (from (2) above) 460,000
Units of raw materials needed per unit of XPL30 x 2 Total raw materials needed for production 920,000 Budgeted raw materials ending inventory (June 30, 2008) + 50,000 Total number of units of raw materials needed 970,000 Budgeted raw materials beginning inventory (July 1, 2007) – 40,000 Total units of raw materials that must be purchased 930,000
4. While the timing of the addition of materials would affect the calculation for number of
equivalent units produced, number of equivalent units in the ending WIP inventory, and the raw materials cost per equivalent unit, it will have no impact on the budgeted purchases of materials for the period.
Blocher, Stout, Cokins, Chen, Cost Management, 4/e 8-18 ©The McGraw-Hill Companies 2008
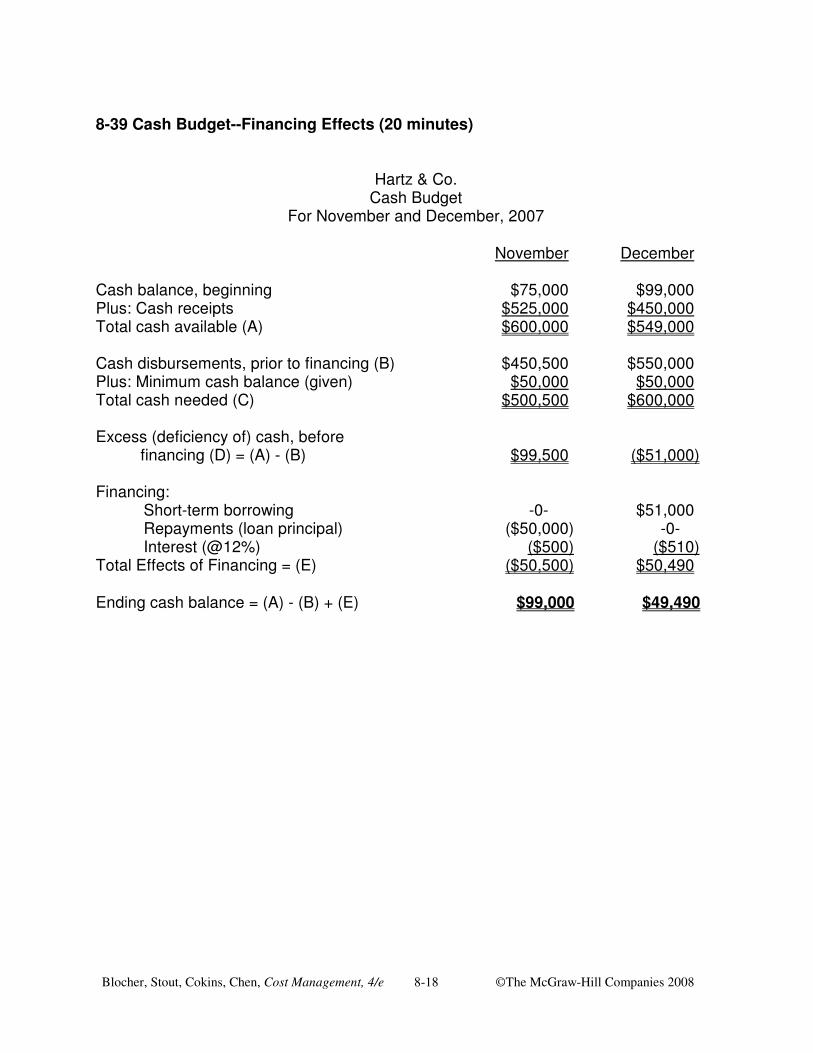
8-39 Cash Budget--Financing Effects (20 minutes)
Hartz & Co. Cash Budget
For November and December, 2007
November December Cash balance, beginning $75,000 $99,000 Plus: Cash receipts $525,000 $450,000 Total cash available (A) $600,000 $549,000 Cash disbursements, prior to financing (B) $450,500 $550,000 Plus: Minimum cash balance (given) $50,000 $50,000 Total cash needed (C) $500,500 $600,000 Excess (deficiency of) cash, before financing (D) = (A) - (B) $99,500 ($51,000) Financing: Short-term borrowing -0- $51,000 Repayments (loan principal) ($50,000) -0- Interest (@12%) ($500) ($510) Total Effects of Financing = (E) ($50,500) $50,490 Ending cash balance = (A) - (B) + (E) $99,000 $49,490

Blocher, Stout, Cokins, Chen, Cost Management, 4/e 8-19 ©The McGraw-Hill Companies 2008
8-40 Cash budget (10-15 minutes) Cash Available Cash balance, beginning $ 10,000 Cash collections from customers + 150,000 Total cash available $160,000 Cash Disbursements Direct materials purchases $ 25,000 Operating expenses $50,000 Less: Depreciation expenses - 20,000 30,000 Payroll 75,000 Income taxes 6,000 Machinery purchase + 30,000 Total cash disbursements prior to financing $166,000 Financing: Cash excess (shortage) before financing ($ 6,000) Minimum cash balance desired - 20,000 Financing need $26,000
Blocher, Stout, Cokins, Chen, Cost Management, 4/e 8-20 ©The McGraw-Hill Companies 2008
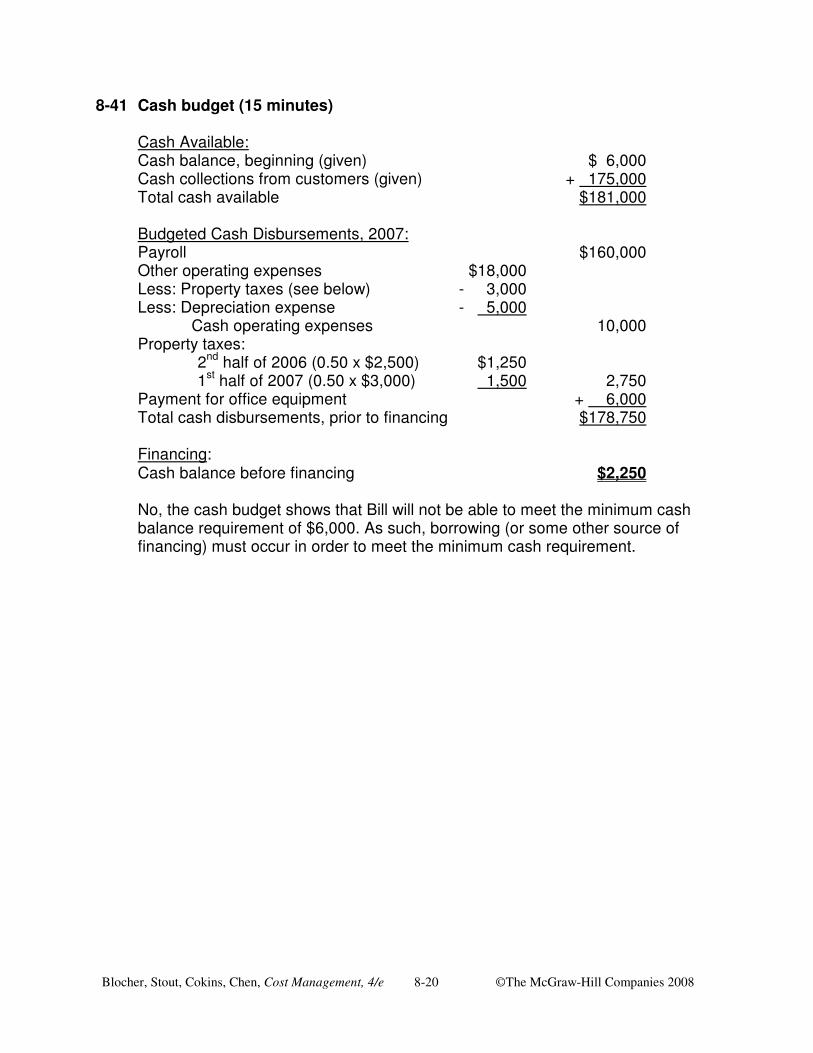
8-41 Cash budget (15 minutes) Cash Available: Cash balance, beginning (given) $ 6,000 Cash collections from customers (given) + 175,000 Total cash available $181,000 Budgeted Cash Disbursements, 2007: Payroll $160,000 Other operating expenses $18,000 Less: Property taxes (see below) - 3,000 Less: Depreciation expense - 5,000 Cash operating expenses 10,000 Property taxes: 2nd half of 2006 (0.50 x $2,500) $1,250 1st half of 2007 (0.50 x $3,000) 1,500 2,750 Payment for office equipment + 6,000 Total cash disbursements, prior to financing $178,750 Financing: Cash balance before financing $2,250 No, the cash budget shows that Bill will not be able to meet the minimum cash
balance requirement of $6,000. As such, borrowing (or some other source of financing) must occur in order to meet the minimum cash requirement.
Blocher, Stout, Cokins, Chen, Cost Management, 4/e 8-21 ©The McGraw-Hill Companies 2008
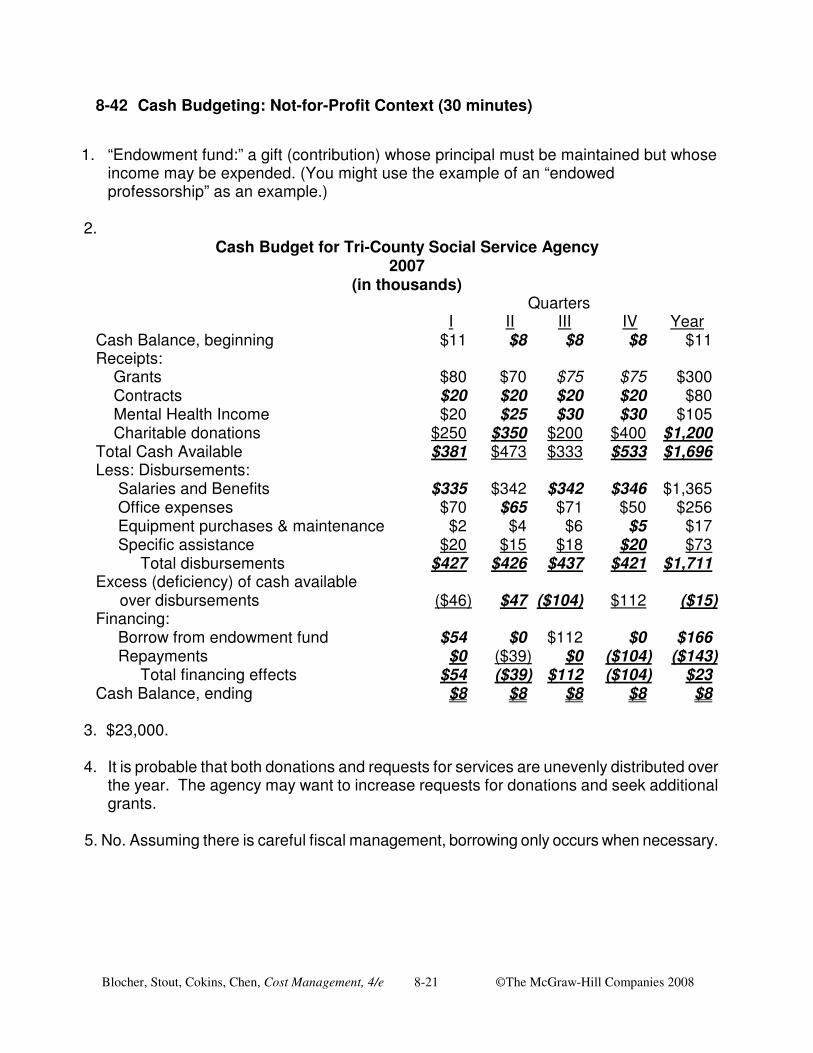
8-42 Cash Budgeting: Not-for-Profit Context (30 minutes)
1. “Endowment fund:” a gift (contribution) whose principal must be maintained but whose
income may be expended. (You might use the example of an “endowed professorship” as an example.)
2.
Cash Budget for Tri-County Social Service Agency 2007
(in thousands) Quarters I II III IV Year Cash Balance, beginning $11 $8 $8 $8 $11 Receipts: Grants $80 $70 $75 $75 $300 Contracts $20 $20 $20 $20 $80 Mental Health Income $20 $25 $30 $30 $105 Charitable donations $250 $350 $200 $400 $1,200 Total Cash Available $381 $473 $333 $533 $1,696 Less: Disbursements: Salaries and Benefits $335 $342 $342 $346 $1,365 Office expenses $70 $65 $71 $50 $256 Equipment purchases & maintenance $2 $4 $6 $5 $17 Specific assistance $20 $15 $18 $20 $73 Total disbursements $427 $426 $437 $421 $1,711 Excess (deficiency) of cash available over disbursements ($46) $47 ($104) $112 ($15) Financing: Borrow from endowment fund $54 $0 $112 $0 $166 Repayments $0 ($39) $0 ($104) ($143) Total financing effects $54 ($39) $112 ($104) $23 Cash Balance, ending $8 $8 $8 $8 $8
3. $23,000.
4. It is probable that both donations and requests for services are unevenly distributed over
the year. The agency may want to increase requests for donations and seek additional grants.
5. No. Assuming there is careful fiscal management, borrowing only occurs when necessary.

Blocher, Stout, Cokins, Chen, Cost Management, 4/e 8-22 ©The McGraw-Hill Companies 2008
8-43 Collection of Accounts Receivable (15-20 minutes) 1. Month Total % to be Collected Budgeted Cash of Sale Credit Sales in October Collection In October October $90,000 70% $ 63,000
September 80,000 15% 12,000
August 70,000 10% 7,000
July 60,000 4% 2,400
Estimated Total Cash Collections in October $84,400
2. Amount Budgeted collection Month of Credit % Collected in in the 4th quarter from of Sale Sales Oct. Nov. Dec. sales in the 4th Quarter October $ 90,000 70% $ 63,000
15% 13,500
10% 9,000
November 100,000 70% 70,000
15% 15,000
December 85,000 70% 59,500
Total budgeted cash collections in the 4th quarter from credit sales made in the 4th quarter $230,000
Blocher, Stout, Cokins, Chen, Cost Management, 4/e 8-23 ©The McGraw-Hill Companies 2008
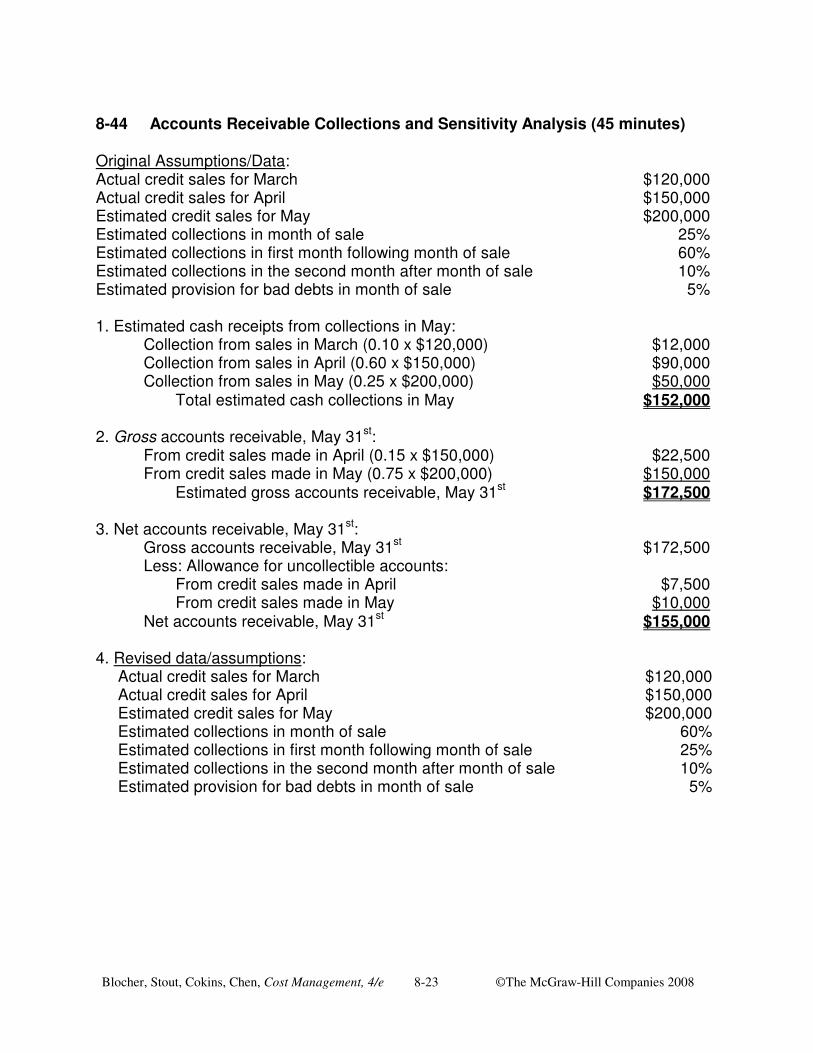
8-44 Accounts Receivable Collections and Sensitivity Analysis (45 minutes) Original Assumptions/Data: Actual credit sales for March $120,000 Actual credit sales for April $150,000 Estimated credit sales for May $200,000 Estimated collections in month of sale 25% Estimated collections in first month following month of sale 60% Estimated collections in the second month after month of sale 10% Estimated provision for bad debts in month of sale 5% 1. Estimated cash receipts from collections in May: Collection from sales in March (0.10 x $120,000) $12,000 Collection from sales in April (0.60 x $150,000) $90,000 Collection from sales in May (0.25 x $200,000) $50,000 Total estimated cash collections in May $152,000 2. Gross accounts receivable, May 31st: From credit sales made in April (0.15 x $150,000) $22,500 From credit sales made in May (0.75 x $200,000) $150,000 Estimated gross accounts receivable, May 31st $172,500 3. Net accounts receivable, May 31st: Gross accounts receivable, May 31st $172,500 Less: Allowance for uncollectible accounts: From credit sales made in April $7,500 From credit sales made in May $10,000 Net accounts receivable, May 31st $155,000 4. Revised data/assumptions:
Actual credit sales for March $120,000 Actual credit sales for April $150,000 Estimated credit sales for May $200,000 Estimated collections in month of sale 60% Estimated collections in first month following month of sale 25% Estimated collections in the second month after month of sale 10% Estimated provision for bad debts in month of sale 5%

Blocher, Stout, Cokins, Chen, Cost Management, 4/e 8-24 ©The McGraw-Hill Companies 2008
8-44 (Continued) a. Estimated cash receipts from collections in May: Collection from sales in March (0.10 x $120,000) $12,000 Collection from sales in April (0.25 x $150,000) $37,500 Collection from sales in May (0.60 x $200,000) $120,000 Total cash collections in May $169,500 b. Gross accounts receivable, May 31st: From credit sales made in April (0.15 x $150,000) $22,500 From credit sales made in May (0.40 x $200,000) $80,000 Gross accounts receivable, May 31st $102,500
Note to Instructor: An Excel spreadsheet solution file is embedded in this document. You can open the spreadsheet “object” that follows by doing the following:
1. Right click anywhere in the worksheet area below. 2. Select “worksheet object” and then select “Open.” 3. To return to the Word document, select “File” and then “Close and return
to...” while you are in the spreadsheet mode. The screen should then return you to the Word document.
5. The principal benefit is the accelerated receipt of cash, which the company can
potentially employ to pay down debt, reduce borrowing, invest, etc. Principal costs would relate to whatever programs are needed to secure the accelerated collection of cash. These costs could include personal, travel, mailings, telephone, incentive programs, and costs related to customer relations.
Input Data
Actual credit sales for March $120,000Actual credit sales for April $150,000Estimated credit sales for May $200,000Estimated collections in month of sale 25%Estimated collections in first month following month of sale 60%Estimated collections in the second month after month of sale 10%

Blocher, Stout, Cokins, Chen, Cost Management, 4/e 8-25 ©The McGraw-Hill Companies 2008
8-45 Budgeting: Not-for-Profit Sector (25 minutes)
1. Stewardship is defined by Merriam-Webster Online Dictionary as “the conducting, supervising, or managing of something; especially: the careful and responsible management of something entrusted to one's care.”
The Socially Responsible Investment Guidelines cited states: “Although it is a moral and legal fiduciary responsibility of the trustees to ensure an adequate return on investment for the support of the work of the church, their stewardship embraces broader moral concerns.” Also, the principles of stewardship lists two fundamental and interdependent principles: “The Conference should exercise responsible financial stewardship over its economic resources.” and “The Conference should exercise ethical and social stewardship in its investment policy.”
The latter states: “Socially responsible investment involves investment strategies based on Catholic moral principles. These strategies are based on the moral demands posed by the virtues of prudence and justice. They recognize the reality that socially beneficial activities and socially undesirable or even immoral activities are often inextricably linked in the products produced and the policies followed by individual corporations. Given the realities of mergers, buyouts and conglomeration, it is increasingly likely that investments will be in companies whose policies or products make the holding of their stock a "mixed investment" from a moral and social point of view. Nevertheless, by prudently applying traditional Catholic moral teaching, and employing traditional principles on cooperation and toleration, as well as the duty to avoid scandal, the Conference can reflect moral and social teaching in investments.”
2. “These two major principles work together to encourage the Conference to identify
investment opportunities that meet both our financial needs and our social criteria. These principles are carried out through strategies that seek: 1) to avoid participation in harmful activities, 2) to use the Conference's role as stockholder for social stewardship, and 3) to promote the common good.”
3. No. (Reasons should vary.) 4. Yes.

Blocher, Stout, Cokins, Chen, Cost Management, 4/e 8-26 ©The McGraw-Hill Companies 2008
8-46 Budgeting Cash Receipts: Cash Discounts Allowed on Receivables (30
Minutes) 1. Breakdown of Cash/
Sales Data Amount Bank Credit-Card Sales June $60,000 Cash sales 40% July $80,000 Credit cards 60% August $90,000 September $96,000 Bank charges 3% October $88,000 Credit sales: Collection of Credit Sales Current month 20% Sales Breakdown and Terms 1st month 50% Cash and bank credit card sales 25% 2nd month 15% Credit sales 75% 3rd month 12% Terms 1/eom, n/45 Late charge/mo. 2%
Sales % % Cash September Total % Paid Collected Receipts Cash sales $96,000 25% 40% $ 9,600 Bank credit card sales $96,000 25% 60% 97% $13,968 Collections of A/R: September credit sales $96,000 75% 20% 99% $14,256 August credit sales $90,000 75% 50% $33,750 July credit sales $80,000 75% 15% $ 9,000 June credit sales $60,000 75% 12% 102% $ 5,508 Total Cash Receipts, September $86,082 2. Appropriate accounting treatment for: a) Bank service (collection) fees: these can be considered an offset to gross sales and
thus can be reflected as a deduction in determining “net sales” (see text Exhibit 8.15). Alternatively, these amounts can be considered “selling expenses” and, as such, be treated as an “operating expense,” (i.e., an element of “Selling and Administrative Expenses” on the Income Statement).
b) Cash discounts allowed on collection of receivables: these can be considered a
“selling expense” and, as such, would be included within the “Selling and Administrative” expense category on the Income Statement.
Blocher, Stout, Cokins, Chen, Cost Management, 4/e 8-27 ©The McGraw-Hill Companies 2008
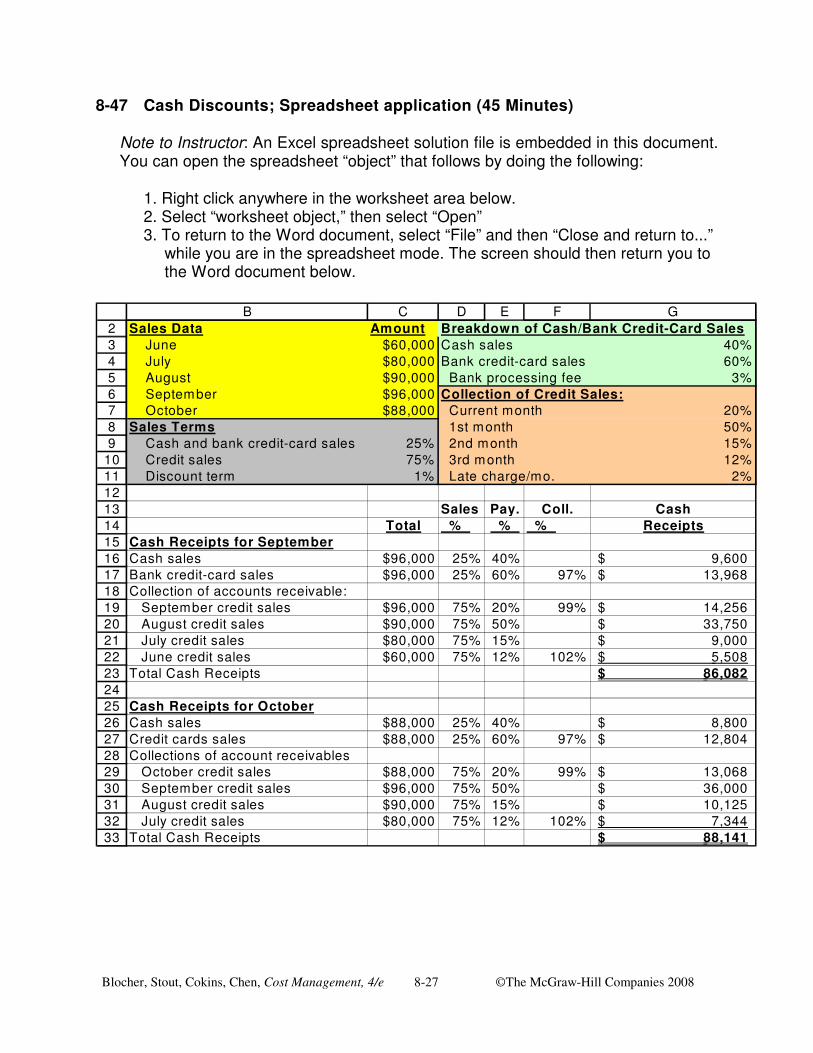
8-47 Cash Discounts; Spreadsheet application (45 Minutes)
Note to Instructor: An Excel spreadsheet solution file is embedded in this document. You can open the spreadsheet “object” that follows by doing the following:
1. Right click anywhere in the worksheet area below. 2. Select “worksheet object,” then select “Open” 3. To return to the Word document, select “File” and then “Close and return to...”
while you are in the spreadsheet mode. The screen should then return you to the Word document below.
23456789
101112131415161718192021222324252627282930313233
B C D E F GSales Data Amount Breakdown of Cash/Bank Credit-Card Sales June $60,000 Cash sales 40% July $80,000 Bank credit-card sales 60% August $90,000 Bank processing fee 3% September $96,000 Collection of Credit Sales: October $88,000 Current month 20%Sales Terms 1st month 50% Cash and bank credit-card sales 25% 2nd month 15% Credit sales 75% 3rd month 12% Discount term 1% Late charge/mo. 2%
Sales Pay. Coll. CashTotal % % % Receipts
Cash Receipts for SeptemberCash sales $96,000 25% 40% 9,600$ Bank credit-card sales $96,000 25% 60% 97% 13,968$ Collection of accounts receivable: September credit sales $96,000 75% 20% 99% 14,256$ August credit sales $90,000 75% 50% 33,750$ July credit sales $80,000 75% 15% 9,000$ June credit sales $60,000 75% 12% 102% 5,508$ Total Cash Receipts 86,082$
Cash Receipts for OctoberCash sales $88,000 25% 40% 8,800$ Credit cards sales $88,000 25% 60% 97% 12,804$ Collections of account receivables October credit sales $88,000 75% 20% 99% 13,068$ September credit sales $96,000 75% 50% 36,000$ August credit sales $90,000 75% 15% 10,125$ July credit sales $80,000 75% 12% 102% 7,344$ Total Cash Receipts 88,141$
Blocher, Stout, Cokins, Chen, Cost Management, 4/e 8-28 ©The McGraw-Hill Companies 2008
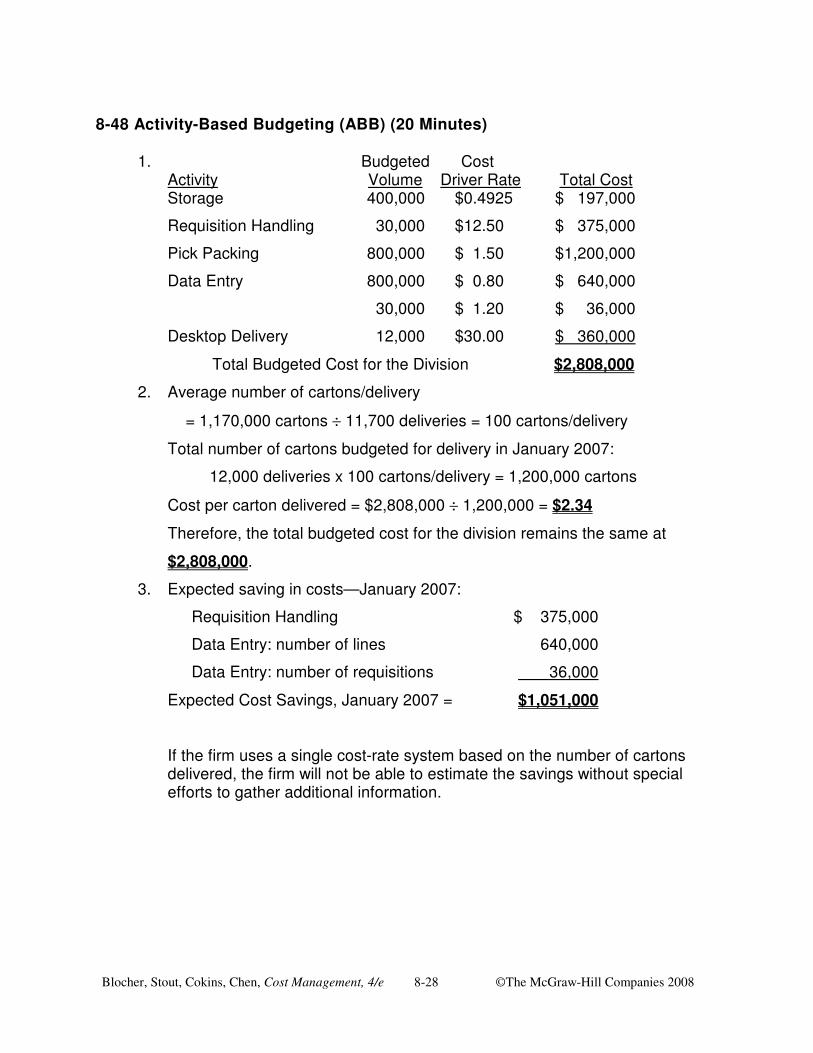
8-48 Activity-Based Budgeting (ABB) (20 Minutes) 1. Budgeted Cost
Activity Volume Driver Rate Total Cost Storage 400,000 $0.4925 $ 197,000
Requisition Handling 30,000 $12.50 $ 375,000
Pick Packing 800,000 $ 1.50 $1,200,000
Data Entry 800,000 $ 0.80 $ 640,000
30,000 $ 1.20 $ 36,000
Desktop Delivery 12,000 $30.00 $ 360,000
Total Budgeted Cost for the Division $2,808,000
2. Average number of cartons/delivery
= 1,170,000 cartons ÷ 11,700 deliveries = 100 cartons/delivery
Total number of cartons budgeted for delivery in January 2007:
12,000 deliveries x 100 cartons/delivery = 1,200,000 cartons
Cost per carton delivered = $2,808,000 ÷ 1,200,000 = $2.34
Therefore, the total budgeted cost for the division remains the same at
$2,808,000.
3. Expected saving in costs—January 2007:
Requisition Handling $ 375,000
Data Entry: number of lines 640,000
Data Entry: number of requisitions 36,000
Expected Cost Savings, January 2007 = $1,051,000
If the firm uses a single cost-rate system based on the number of cartons delivered, the firm will not be able to estimate the savings without special efforts to gather additional information.
Blocher, Stout, Cokins, Chen, Cost Management, 4/e 8-29 ©The McGraw-Hill Companies 2008
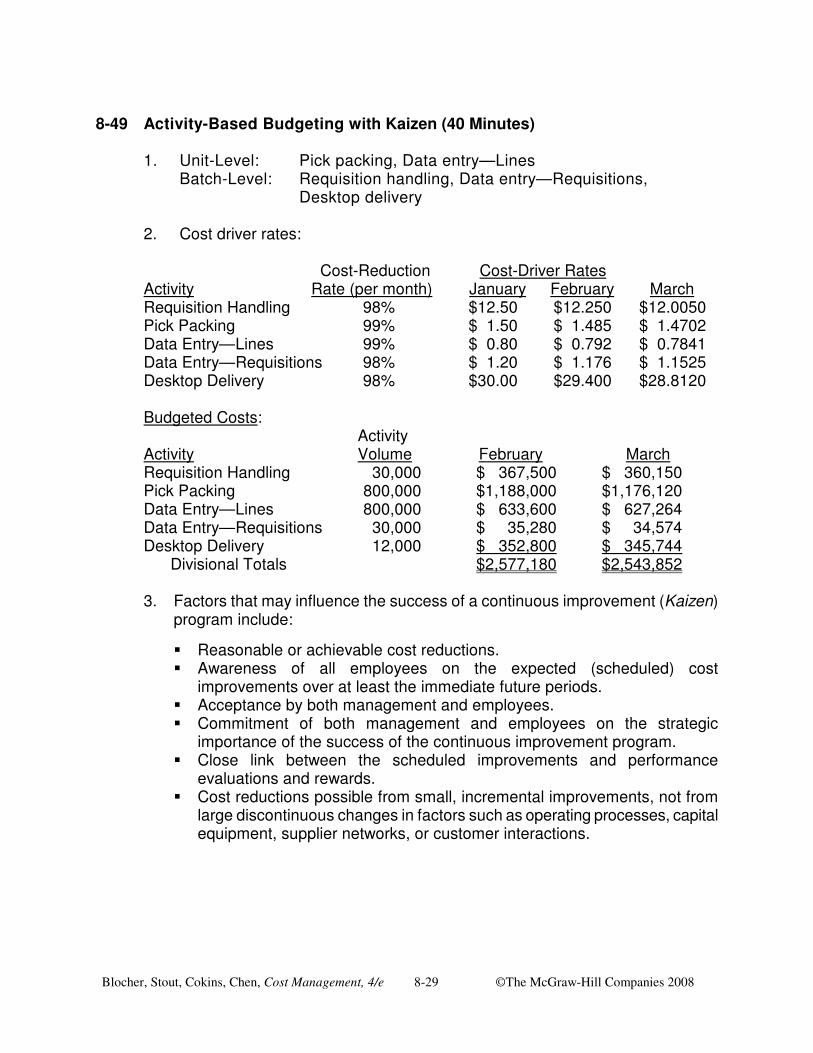
8-49 Activity-Based Budgeting with Kaizen (40 Minutes)
1. Unit-Level: Pick packing, Data entry—Lines Batch-Level: Requisition handling, Data entry—Requisitions, Desktop delivery 2. Cost driver rates: Cost-Reduction Cost-Driver Rates Activity Rate (per month) January February March Requisition Handling 98% $12.50 $12.250 $12.0050 Pick Packing 99% $ 1.50 $ 1.485 $ 1.4702 Data Entry—Lines 99% $ 0.80 $ 0.792 $ 0.7841 Data Entry—Requisitions 98% $ 1.20 $ 1.176 $ 1.1525 Desktop Delivery 98% $30.00 $29.400 $28.8120 Budgeted Costs: Activity Activity Volume February March Requisition Handling 30,000 $ 367,500 $ 360,150 Pick Packing 800,000 $1,188,000 $1,176,120 Data Entry—Lines 800,000 $ 633,600 $ 627,264 Data Entry—Requisitions 30,000 $ 35,280 $ 34,574 Desktop Delivery 12,000 $ 352,800 $ 345,744 Divisional Totals $2,577,180 $2,543,852
3. Factors that may influence the success of a continuous improvement (Kaizen)
program include:
� Reasonable or achievable cost reductions. � Awareness of all employees on the expected (scheduled) cost
improvements over at least the immediate future periods. � Acceptance by both management and employees. � Commitment of both management and employees on the strategic
importance of the success of the continuous improvement program. � Close link between the scheduled improvements and performance
evaluations and rewards. � Cost reductions possible from small, incremental improvements, not from
large discontinuous changes in factors such as operating processes, capital equipment, supplier networks, or customer interactions.

Blocher, Stout, Cokins, Chen, Cost Management, 4/e 8-30 ©The McGraw-Hill Companies 2008
8-49 (Continued)
4. Primary criticisms of Kaizen (continuous improvement) budgets include the following:
� The budgeting process tends to place enormous pressure on employees to
reduce all costs, which can lead to employee “burnout.” � The use of Kaizen budgets tends to motivate small, incremental rather than
major/significant process improvements. � If the Kaizen targets are confined to the manufacturing function (including
product and process design engineering), frictions can arise if manufacturing believes that other parts of the organization (e.g., marketing) are not subjected to the same budgetary pressure.
Blocher, Stout, Cokins, Chen, Cost Management, 4/e 8-31 ©The McGraw-Hill Companies 2008
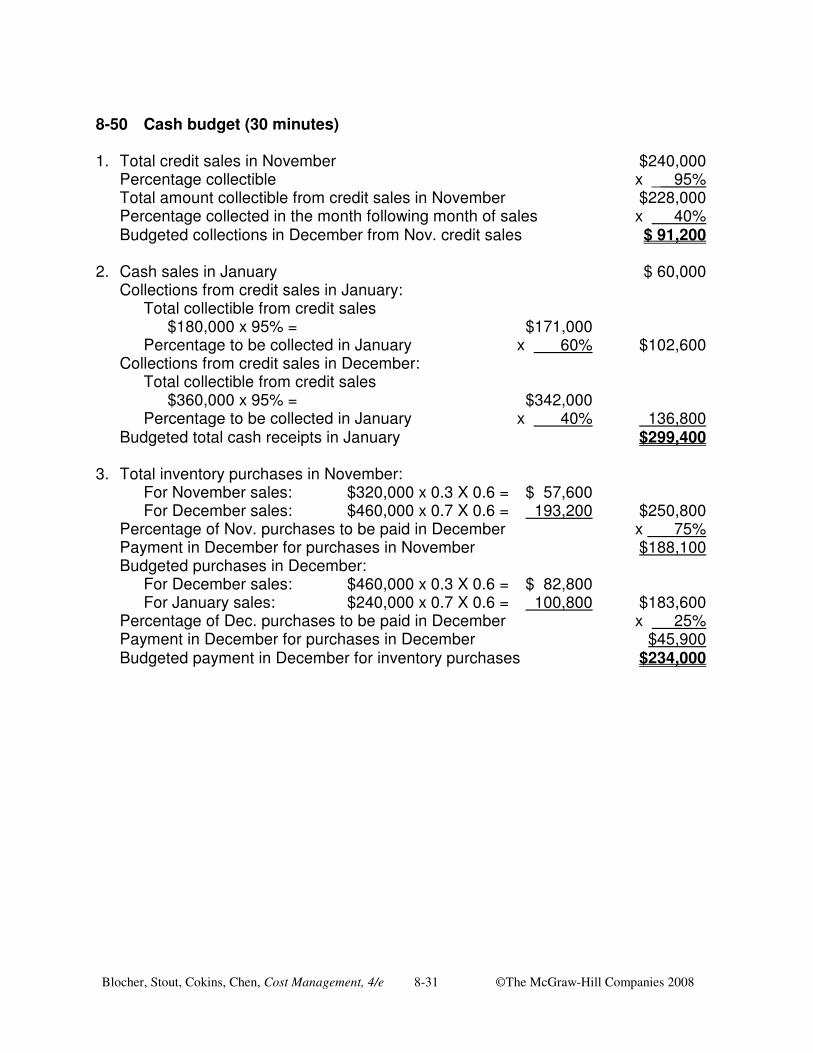
8-50 Cash budget (30 minutes) 1. Total credit sales in November $240,000
Percentage collectible x _ 95% Total amount collectible from credit sales in November $228,000 Percentage collected in the month following month of sales x 40% Budgeted collections in December from Nov. credit sales $ 91,200
2. Cash sales in January $ 60,000
Collections from credit sales in January: Total collectible from credit sales $180,000 x 95% = $171,000 Percentage to be collected in January x 60% $102,600
Collections from credit sales in December: Total collectible from credit sales $360,000 x 95% = $342,000 Percentage to be collected in January x 40% 136,800
Budgeted total cash receipts in January $299,400 3. Total inventory purchases in November: For November sales: $320,000 x 0.3 X 0.6 = $ 57,600 For December sales: $460,000 x 0.7 X 0.6 = 193,200 $250,800 Percentage of Nov. purchases to be paid in December x 75% Payment in December for purchases in November $188,100
Budgeted purchases in December: For December sales: $460,000 x 0.3 X 0.6 = $ 82,800 For January sales: $240,000 x 0.7 X 0.6 = 100,800 $183,600 Percentage of Dec. purchases to be paid in December x 25% Payment in December for purchases in December $45,900
Budgeted payment in December for inventory purchases $234,000

Blocher, Stout, Cokins, Chen, Cost Management, 4/e 8-32 ©The McGraw-Hill Companies 2008
8-51 Budgeting for a Service Firm (60-75 minutes) Total hours for the budgeted activities: Total Hourly Revenue Rate Total (Given) (Given) Hours Business return $1,000,000 $250 4,000 Complex individual return $1,200,000 $100 12,000 Simple individual return $1,640,000 $50 32,800 $3,840,000 Staff requirements for the budgeted activities: Senior Total Hours Partner Manager Consultant Required Each Total Each Total Each Total Each Total Business return 4,000 0.30 1,200 0.20 800 0.50 2,000 0.00 0 Complex individual return 12,000 0.05 600 0.15 1,800 0.40 4,800 0.40 4,800 Simple individual return 32,800 0.00 0 0.00 0 0.20 6,560 0.80 26,240 Total Hours 48,800 1,800 2,600 13,360 31,040 Hours per week 50 45 40 40 # of weeks needed 36 58 334 776 # of weeks per employee per year 40 45 45 48 # of employees needed 1 2 8 16 Excess (deficiency) hours 1,040 (320) Note: Because Consultants can be hired on a part-time basis, we round the calculation DOWN for this class of labor. The other three labor classes are given (i.e., do not have to be planned for based on data in the problem).

Blocher, Stout, Cokins, Chen, Cost Management, 4/e 8-33 ©The McGraw-Hill Companies 2008
8-51 (Continued) SOLUTION: 1. Since, according to the present staffing plan and anticipated workload needs, there is an
excess of senior consultant hours, the budgeted cost for overtime hours worked by senior consultants would be $0.
2. Number of full-time consultants needed for the year: Total number of consultant-weeks needed for the year = 776 Number of weeks per full-time consultant per year = 48 Number of full-time consultants needed per year = 16 3. The manager's total compensation, assuming that the revenues from preparing tax
returns remains the same:
Annual Salaries: Per partner = $250,000 Per manager = $90,000 Per senior consultant = $90,000 Per support staff = $40,000 Consultant's pay (assumed paid on an hourly basis): Earnings per year = $60,000 Hrs. worked/year = 1,920 Hourly pay rate = $31.25 Staffing Plan: Partners = 1 Managers = 1 Senior consultants = 8 Full-time Consultants = 16 Support staff = 5 Number of part-time (PT) hours, consultants = 320
Blocher, Stout, Cokins, Chen, Cost Management, 4/e 8-34 ©The McGraw-Hill Companies 2008
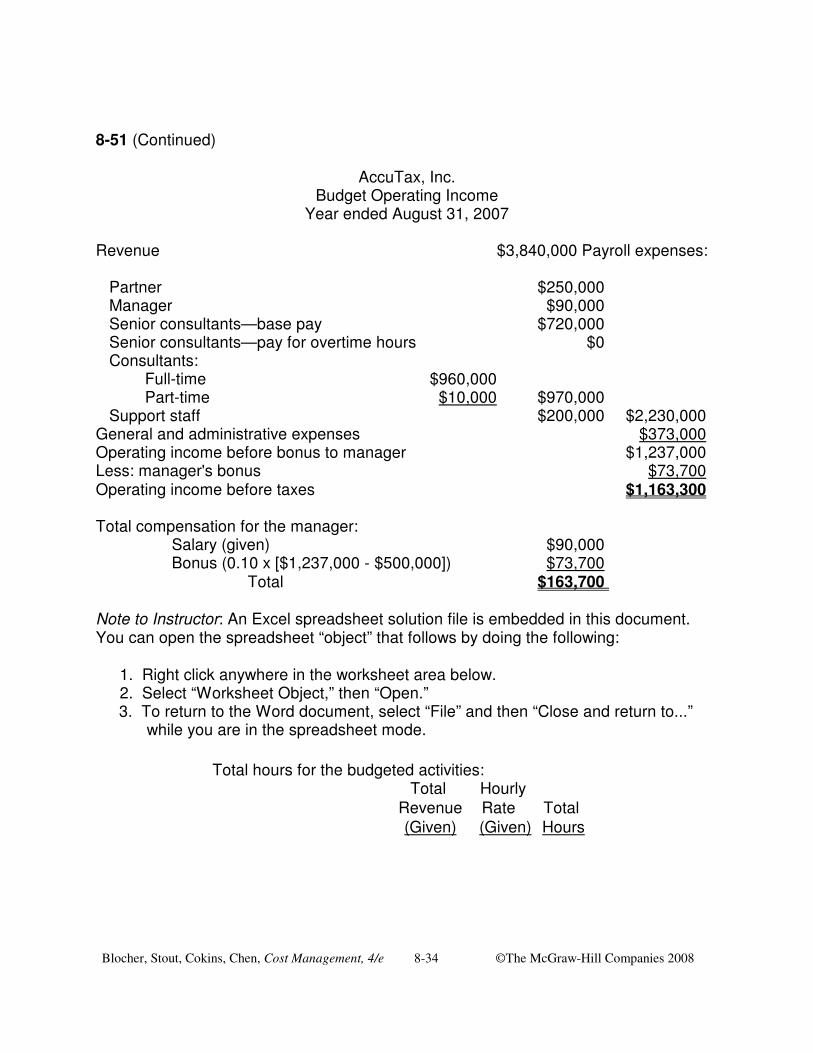
8-51 (Continued)
AccuTax, Inc. Budget Operating Income
Year ended August 31, 2007 Revenue $3,840,000 Payroll expenses: Partner $250,000 Manager $90,000 Senior consultants—base pay $720,000 Senior consultants—pay for overtime hours $0 Consultants: Full-time $960,000 Part-time $10,000 $970,000 Support staff $200,000 $2,230,000 General and administrative expenses $373,000 Operating income before bonus to manager $1,237,000 Less: manager's bonus $73,700 Operating income before taxes $1,163,300 Total compensation for the manager: Salary (given) $90,000 Bonus (0.10 x [$1,237,000 - $500,000]) $73,700 Total $163,700 Note to Instructor: An Excel spreadsheet solution file is embedded in this document. You can open the spreadsheet “object” that follows by doing the following:
1. Right click anywhere in the worksheet area below. 2. Select “Worksheet Object,” then “Open.” 3. To return to the Word document, select “File” and then “Close and return to...”
while you are in the spreadsheet mode.
Total hours for the budgeted activities:Total Hourly
Revenue Rate Total (Given) (Given) Hours
Blocher, Stout, Cokins, Chen, Cost Management, 4/e 8-35 ©The McGraw-Hill Companies 2008
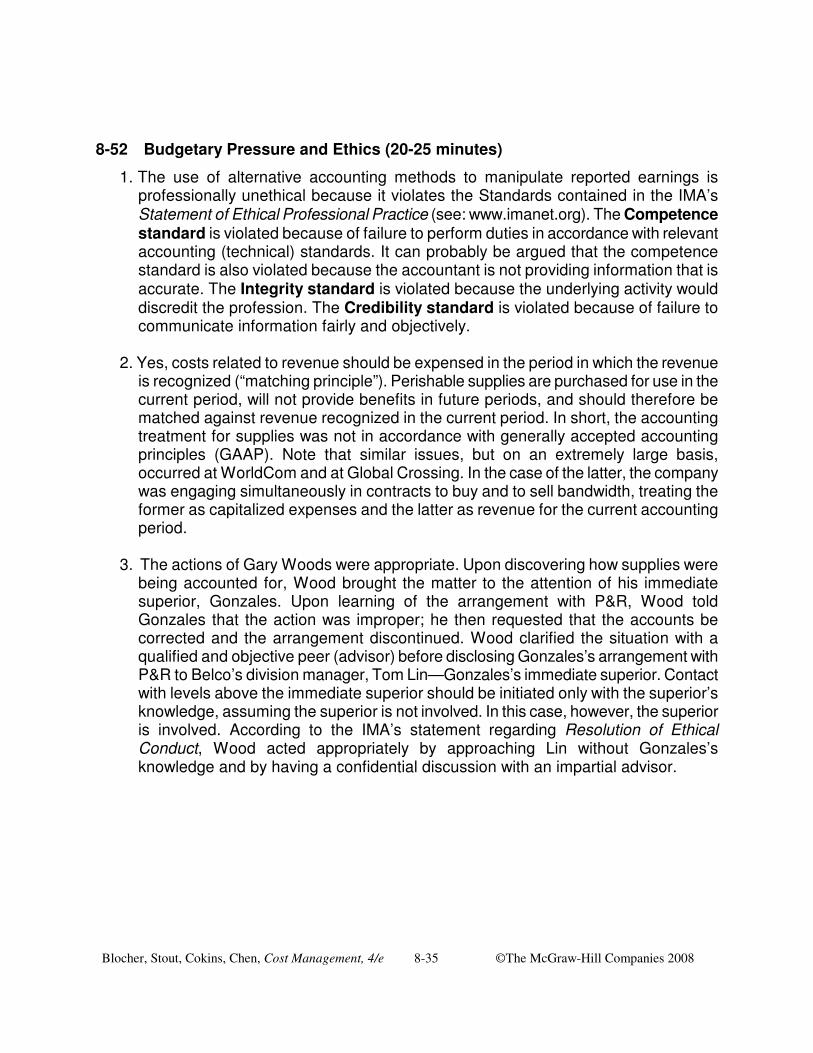
8-52 Budgetary Pressure and Ethics (20-25 minutes)
1. The use of alternative accounting methods to manipulate reported earnings is professionally unethical because it violates the Standards contained in the IMA’s Statement of Ethical Professional Practice (see: www.imanet.org). The Competence standard is violated because of failure to perform duties in accordance with relevant accounting (technical) standards. It can probably be argued that the competence standard is also violated because the accountant is not providing information that is accurate. The Integrity standard is violated because the underlying activity would discredit the profession. The Credibility standard is violated because of failure to communicate information fairly and objectively.
2. Yes, costs related to revenue should be expensed in the period in which the revenue
is recognized (“matching principle”). Perishable supplies are purchased for use in the current period, will not provide benefits in future periods, and should therefore be matched against revenue recognized in the current period. In short, the accounting treatment for supplies was not in accordance with generally accepted accounting principles (GAAP). Note that similar issues, but on an extremely large basis, occurred at WorldCom and at Global Crossing. In the case of the latter, the company was engaging simultaneously in contracts to buy and to sell bandwidth, treating the former as capitalized expenses and the latter as revenue for the current accounting period.
3. The actions of Gary Woods were appropriate. Upon discovering how supplies were
being accounted for, Wood brought the matter to the attention of his immediate superior, Gonzales. Upon learning of the arrangement with P&R, Wood told Gonzales that the action was improper; he then requested that the accounts be corrected and the arrangement discontinued. Wood clarified the situation with a qualified and objective peer (advisor) before disclosing Gonzales’s arrangement with P&R to Belco’s division manager, Tom Lin—Gonzales’s immediate superior. Contact with levels above the immediate superior should be initiated only with the superior’s knowledge, assuming the superior is not involved. In this case, however, the superior is involved. According to the IMA’s statement regarding Resolution of Ethical Conduct, Wood acted appropriately by approaching Lin without Gonzales’s knowledge and by having a confidential discussion with an impartial advisor.
Blocher, Stout, Cokins, Chen, Cost Management, 4/e 8-36 ©The McGraw-Hill Companies 2008
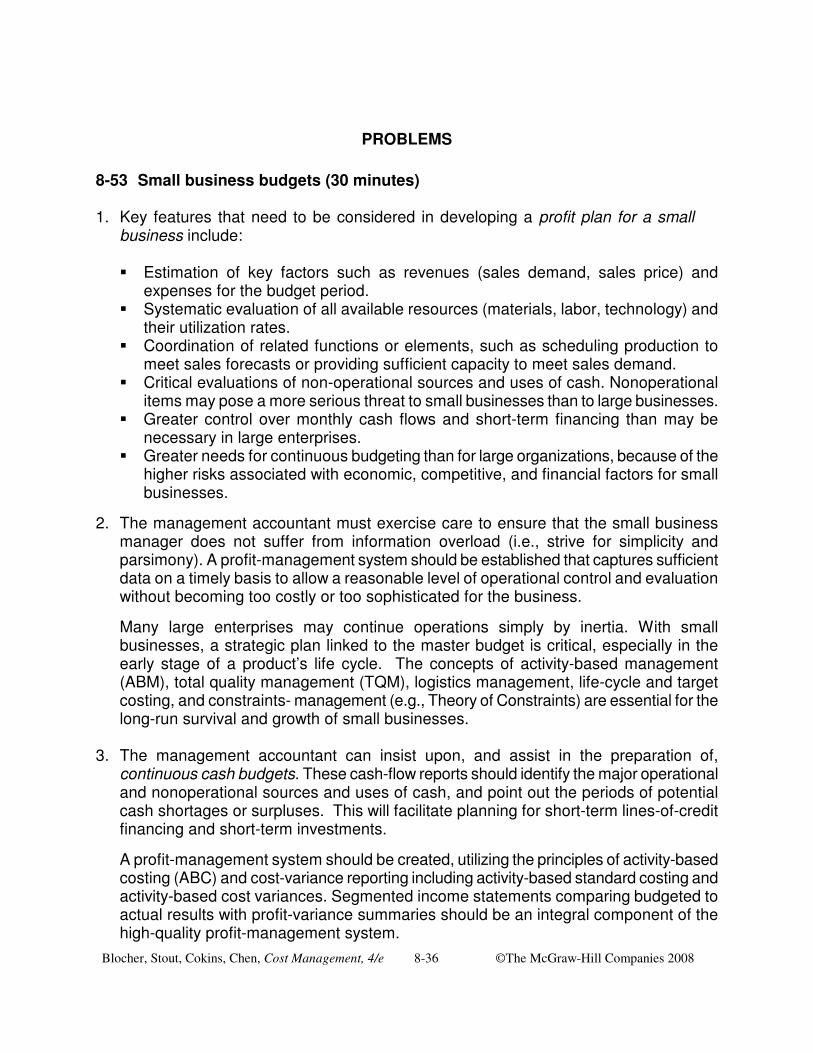
PROBLEMS
8-53 Small business budgets (30 minutes) 1. Key features that need to be considered in developing a profit plan for a small
business include:
� Estimation of key factors such as revenues (sales demand, sales price) and expenses for the budget period.
� Systematic evaluation of all available resources (materials, labor, technology) and their utilization rates.
� Coordination of related functions or elements, such as scheduling production to meet sales forecasts or providing sufficient capacity to meet sales demand.
� Critical evaluations of non-operational sources and uses of cash. Nonoperational items may pose a more serious threat to small businesses than to large businesses.
� Greater control over monthly cash flows and short-term financing than may be necessary in large enterprises.
� Greater needs for continuous budgeting than for large organizations, because of the higher risks associated with economic, competitive, and financial factors for small businesses.
2. The management accountant must exercise care to ensure that the small business manager does not suffer from information overload (i.e., strive for simplicity and parsimony). A profit-management system should be established that captures sufficient data on a timely basis to allow a reasonable level of operational control and evaluation without becoming too costly or too sophisticated for the business.
Many large enterprises may continue operations simply by inertia. With small businesses, a strategic plan linked to the master budget is critical, especially in the early stage of a product’s life cycle. The concepts of activity-based management (ABM), total quality management (TQM), logistics management, life-cycle and target costing, and constraints- management (e.g., Theory of Constraints) are essential for the long-run survival and growth of small businesses.
3. The management accountant can insist upon, and assist in the preparation of,
continuous cash budgets. These cash-flow reports should identify the major operational and nonoperational sources and uses of cash, and point out the periods of potential cash shortages or surpluses. This will facilitate planning for short-term lines-of-credit financing and short-term investments.
A profit-management system should be created, utilizing the principles of activity-based costing (ABC) and cost-variance reporting including activity-based standard costing and activity-based cost variances. Segmented income statements comparing budgeted to actual results with profit-variance summaries should be an integral component of the high-quality profit-management system.
Blocher, Stout, Cokins, Chen, Cost Management, 4/e 8-37 ©The McGraw-Hill Companies 2008
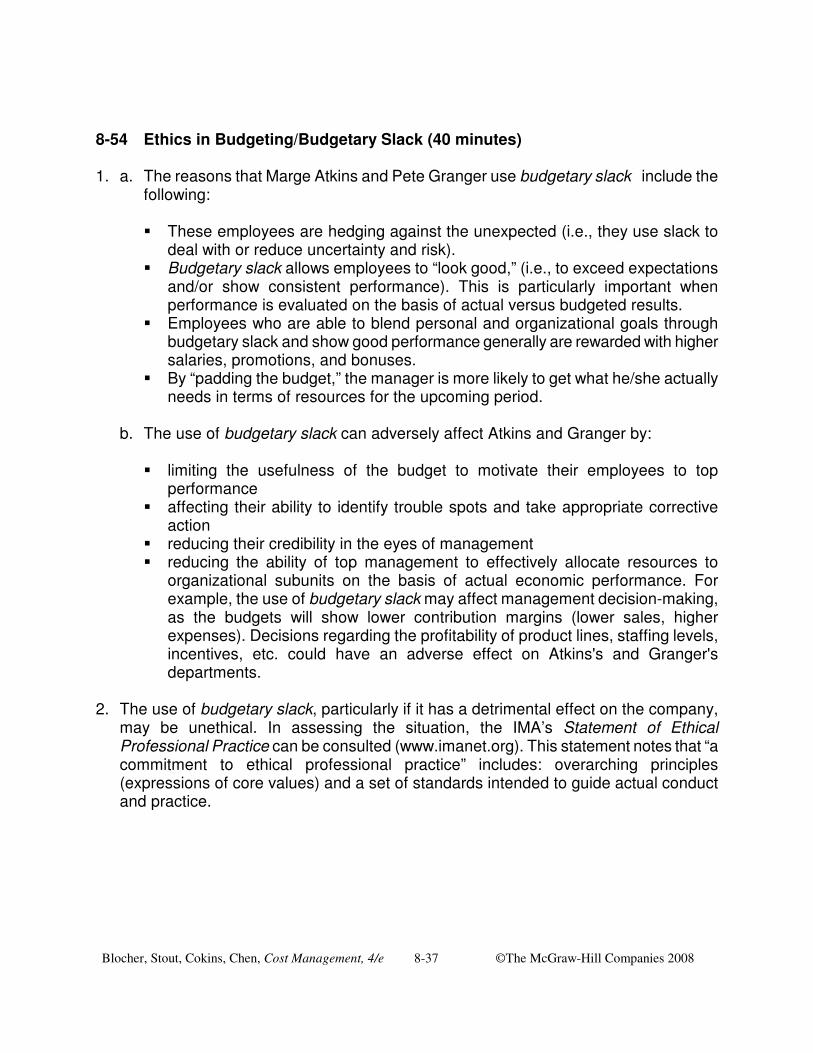
8-54 Ethics in Budgeting/Budgetary Slack (40 minutes) 1. a. The reasons that Marge Atkins and Pete Granger use budgetary slack include the
following:
� These employees are hedging against the unexpected (i.e., they use slack to deal with or reduce uncertainty and risk).
� Budgetary slack allows employees to “look good,” (i.e., to exceed expectations and/or show consistent performance). This is particularly important when performance is evaluated on the basis of actual versus budgeted results.
� Employees who are able to blend personal and organizational goals through budgetary slack and show good performance generally are rewarded with higher salaries, promotions, and bonuses.
� By “padding the budget,” the manager is more likely to get what he/she actually needs in terms of resources for the upcoming period.
b. The use of budgetary slack can adversely affect Atkins and Granger by:
� limiting the usefulness of the budget to motivate their employees to top performance
� affecting their ability to identify trouble spots and take appropriate corrective action
� reducing their credibility in the eyes of management � reducing the ability of top management to effectively allocate resources to
organizational subunits on the basis of actual economic performance. For example, the use of budgetary slack may affect management decision-making, as the budgets will show lower contribution margins (lower sales, higher expenses). Decisions regarding the profitability of product lines, staffing levels, incentives, etc. could have an adverse effect on Atkins's and Granger's departments.
2. The use of budgetary slack, particularly if it has a detrimental effect on the company,
may be unethical. In assessing the situation, the IMA’s Statement of Ethical Professional Practice can be consulted (www.imanet.org). This statement notes that “a commitment to ethical professional practice” includes: overarching principles (expressions of core values) and a set of standards intended to guide actual conduct and practice.
Blocher, Stout, Cokins, Chen, Cost Management, 4/e 8-38 ©The McGraw-Hill Companies 2008
8-54 (Continued)
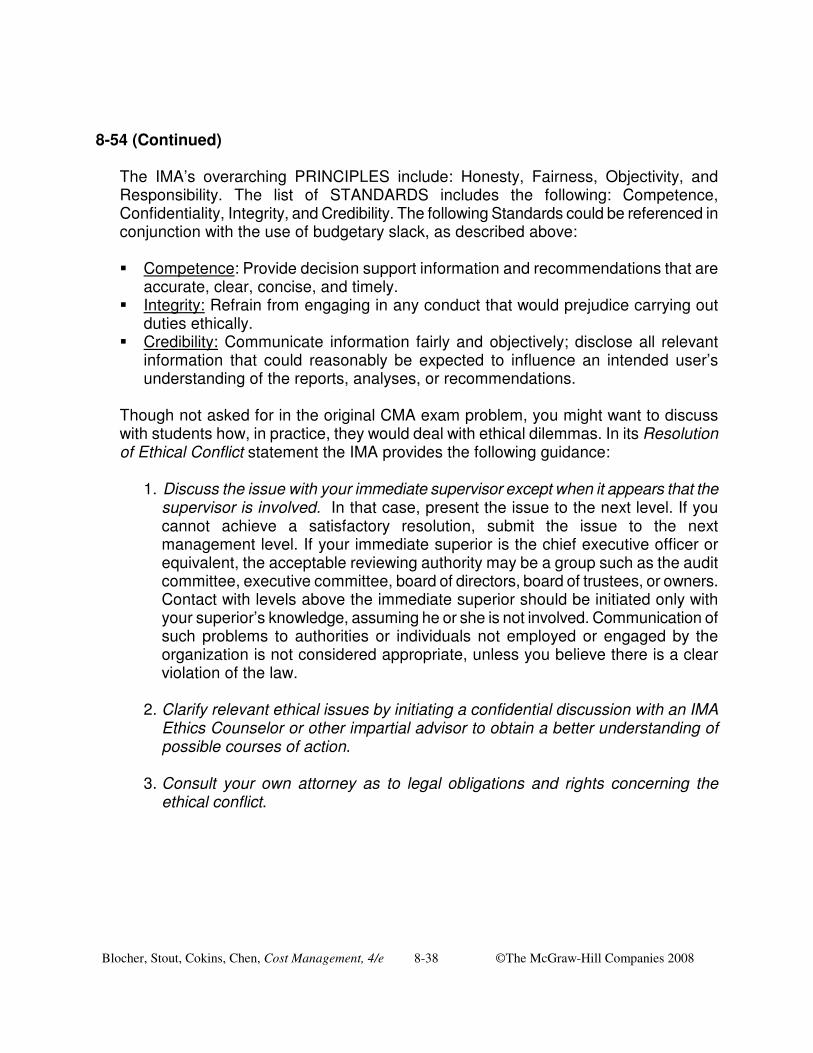
The IMA’s overarching PRINCIPLES include: Honesty, Fairness, Objectivity, and Responsibility. The list of STANDARDS includes the following: Competence, Confidentiality, Integrity, and Credibility. The following Standards could be referenced in conjunction with the use of budgetary slack, as described above:
� Competence: Provide decision support information and recommendations that are
accurate, clear, concise, and timely. � Integrity: Refrain from engaging in any conduct that would prejudice carrying out
duties ethically. � Credibility: Communicate information fairly and objectively; disclose all relevant
information that could reasonably be expected to influence an intended user’s understanding of the reports, analyses, or recommendations.
Though not asked for in the original CMA exam problem, you might want to discuss with students how, in practice, they would deal with ethical dilemmas. In its Resolution of Ethical Conflict statement the IMA provides the following guidance:
1. Discuss the issue with your immediate supervisor except when it appears that the supervisor is involved. In that case, present the issue to the next level. If you cannot achieve a satisfactory resolution, submit the issue to the next management level. If your immediate superior is the chief executive officer or equivalent, the acceptable reviewing authority may be a group such as the audit committee, executive committee, board of directors, board of trustees, or owners. Contact with levels above the immediate superior should be initiated only with your superior’s knowledge, assuming he or she is not involved. Communication of such problems to authorities or individuals not employed or engaged by the organization is not considered appropriate, unless you believe there is a clear violation of the law.
2. Clarify relevant ethical issues by initiating a confidential discussion with an IMA
Ethics Counselor or other impartial advisor to obtain a better understanding of possible courses of action.
3. Consult your own attorney as to legal obligations and rights concerning the
ethical conflict.
Blocher, Stout, Cokins, Chen, Cost Management, 4/e 8-39 ©The McGraw-Hill Companies 2008
8-55 Master Budget (40-45 minutes) 1. The benefits that can be derived from implementing a master budgeting system include
the following:
� The preparation of budgets forces management to plan ahead and to establish goals and objectives that can be quantified.
� Budgeting compels departmental managers to make plans that are in congruence with the plans of other departments as well as the objectives of the entire firm.
� The budgeting process promotes internal communication and coordination of subunit activities.
� Budgets provide directions for day-to-day operations, clarify duties to be performed, and assign responsibility for these duties.
� Budgets provide a framework for measuring financial performance. � A properly implemented budgeting system can motivate employees and managers
to higher levels of performance, particularly if goals and outputs are linked through appropriate incentives.
� Budgets allow managers to anticipate problem areas (e.g., cash short-falls) and opportunities (e.g., short-term investment of excess cash).

Blocher, Stout, Cokins, Chen, Cost Management, 4/e 8-40 ©The McGraw-Hill Companies 2008
8-55 (Continued) 2. a & b: The basic intent here is to demonstrate the interrelationships that exist among
budgets contained in the organization’s master budget.
Subsequent Schedule/Statement Budget Schedule/Statement Sales Budget Production Budget Selling Expense Budget Budgeted Income Statement Ending Inventory Budget (units) Production Budget Production Budget (units) Direct Materials Purchases Budget Direct Materials Usage Budget Direct Labor Budget Factory Overhead Budget Direct Materials Budget Cost of Goods Manufactured Budget Direct Labor Budget Cost of Goods Manufactured Budget Factory Overhead Budget Cost of Goods Manufactured Budget Cost of Goods Manufactured Cost of Goods Sold Budget Budget Cost of Goods Sold Budget Budgeted Income Statement
Budgeted Balance Sheet
Selling Expense Budget Budgeted Income Statement Research & Development Budget Budgeted Income Statement Budgeted Income Statement Budgeted Balance Sheet Capital Expenditures Budget Cash Budget Cash Receipts Budget Cash Budget Cash Disbursements Budget Cash Budget Cash Budget Budgeted Balance Sheet
Blocher, Stout, Cokins, Chen, Cost Management, 4/e 8-41 ©The McGraw-Hill Companies 2008
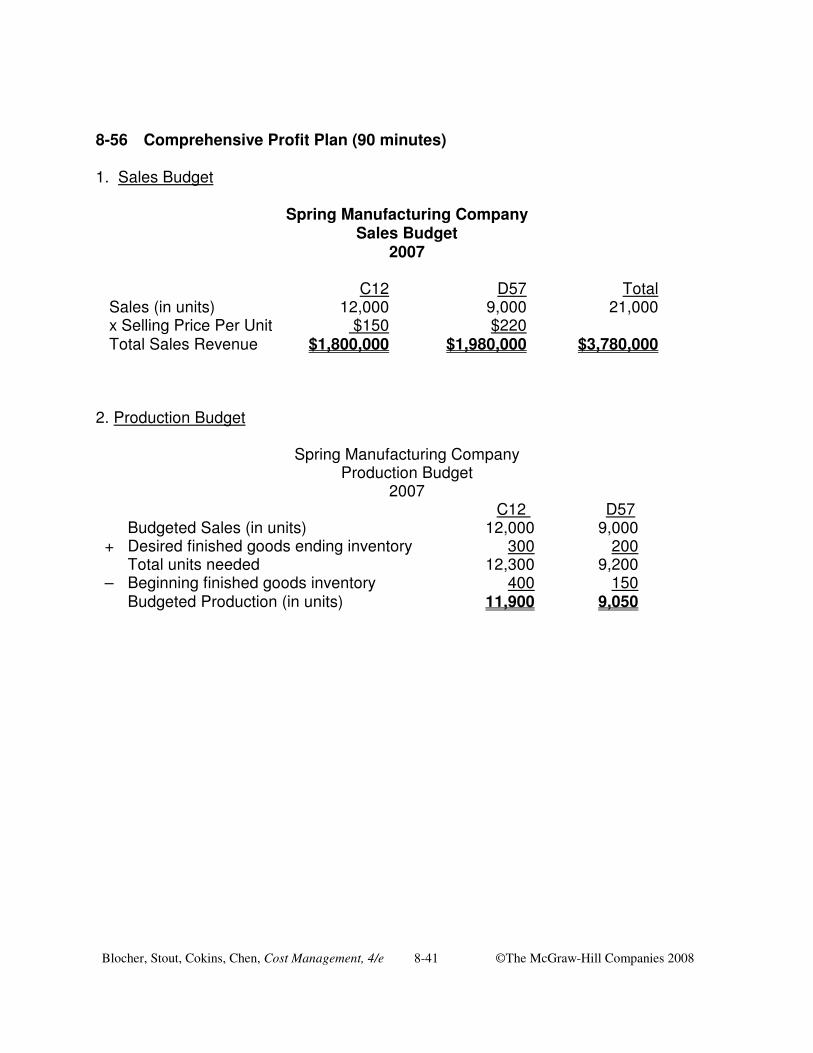
8-56 Comprehensive Profit Plan (90 minutes) 1. Sales Budget
Spring Manufacturing Company Sales Budget
2007 C12 D57 Total Sales (in units) 12,000 9,000 21,000 x Selling Price Per Unit $150 $220 Total Sales Revenue $1,800,000 $1,980,000 $3,780,000 2. Production Budget
Spring Manufacturing Company Production Budget
2007 C12 D57 Budgeted Sales (in units) 12,000 9,000 + Desired finished goods ending inventory 300 200
Total units needed 12,300 9,200 – Beginning finished goods inventory 400 150
Budgeted Production (in units) 11,900 9,050

Blocher, Stout, Cokins, Chen, Cost Management, 4/e 8-42 ©The McGraw-Hill Companies 2008
8-56 (Continued-1) 3. Direct Materials Purchases Budget
Spring Manufacturing Company Direct Materials Purchases Budget (units and dollars)
2007 C12 D57 Total Raw Material (RM) 1: Budgeted Production 11,900 9,050 Pounds per Unit x 10 x 8 RM 1 needed for production 119,000 72,400 191,400 Plus: Desired Ending Inventory (lbs.) 4,000 Total RM 1 needed (lbs.) 195,400 Less: Beginning inventory (lbs.) 3,000 Required purchases of RM 1 (lbs.) 192,400 Cost per pound $2.00 Budgeted purchases, RM 1 $384,800 Raw Material (RM) 2: Budgeted Production 11,900 9,050 Pounds per Unit x 0 x 4 RM 2 needed for production 0 36,200 36,200 Plus: Desired Ending Inventory (lbs.) 1,000 Total RM 2 needed (lbs.) 37,200 Less: Beginning inventory (lbs.) 1,500 Required purchases of RM 2 (lbs.) 35,700 Cost per pound $2.50 Budgeted purchases, RM 2 $89,250 Raw Material 3: Budgeted Production 11,900 9,050 Pounds per Unit x 2 x 1 RM 3 needed for production 23,800 9,050 32,850 Plus: Desired Ending Inventory (lbs.) 1,500 Total RM 3 needed (lbs.) 34,350 Less: Beginning inventory (lbs.) 1,000 Required purchases of RM 3 (lbs.) 33,350 Cost per pound $0.50 Budgeted purchases, RM 3 $16,675

Blocher, Stout, Cokins, Chen, Cost Management, 4/e 8-43 ©The McGraw-Hill Companies 2008
8-56 (Continued-2) 4. Direct Manufacturing Labor Budget
Spring Manufacturing Company Direct Labor Budget
2007
C12 D57 Total Budgeted production 11,900 9,050 Direct labor hours per unit x 2 x 3 Total direct labor hours needed 23,800 27,150 50,950 Hourly wage rate $25.00 Budgeted direct labor costs $1,273,750
5. Factory Overhead Budget
Spring Manufacturing Company Factory Overhead Budget
2007
Variable Factory Overhead: Indirect materials $10,000 Miscellaneous supplies and tools 5,000 Indirect labor 40,000 Payroll taxes and fringe benefits 250,000 Maintenance costs 10,080 Heat, light, and power 11,000 $326,080 Fixed Factory Overhead: Supervision $120,000 Maintenance costs 20,000 Heat, light, and power 43,420 Total Cash Fixed Factory Overhead $183,420 Depreciation 71,330 $254,750 Total Budgeted Factory Overhead $580,830
Blocher, Stout, Cokins, Chen, Cost Management, 4/e 8-44 ©The McGraw-Hill Companies 2008
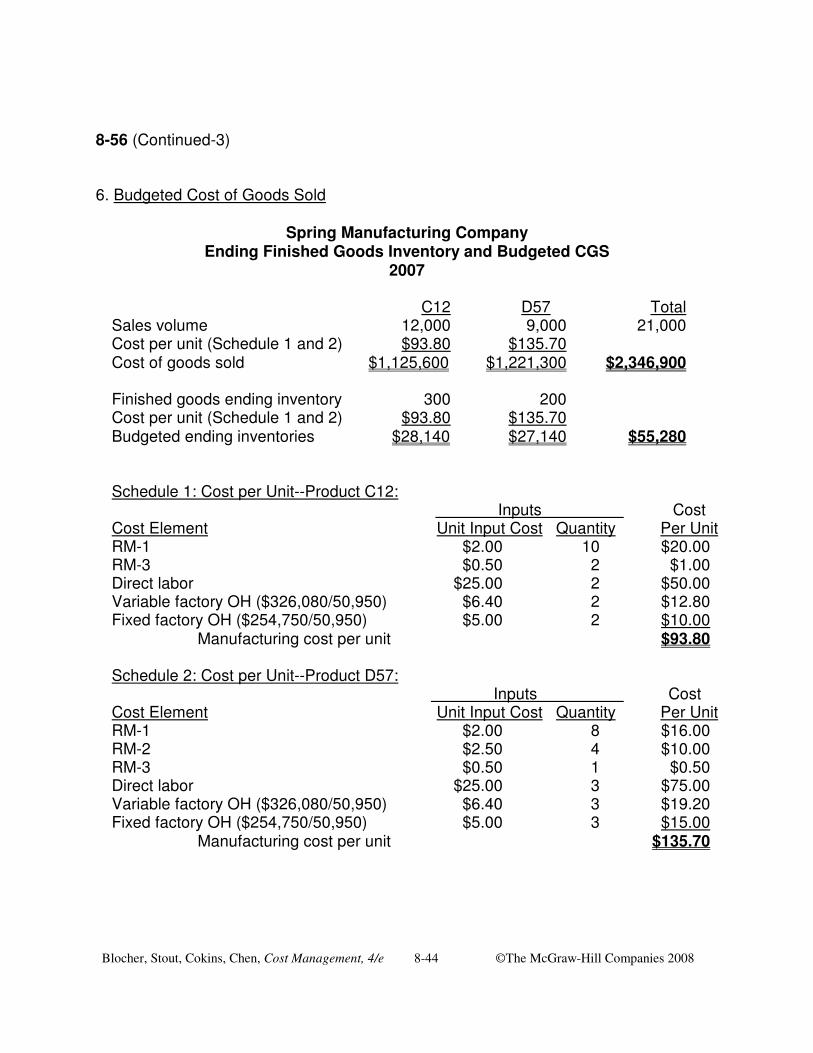
8-56 (Continued-3) 6. Budgeted Cost of Goods Sold
Spring Manufacturing Company Ending Finished Goods Inventory and Budgeted CGS
2007
C12 D57 Total Sales volume 12,000 9,000 21,000 Cost per unit (Schedule 1 and 2) $93.80 $135.70 Cost of goods sold $1,125,600 $1,221,300 $2,346,900 Finished goods ending inventory 300 200 Cost per unit (Schedule 1 and 2) $93.80 $135.70 Budgeted ending inventories $28,140 $27,140 $55,280
Schedule 1: Cost per Unit--Product C12: Inputs Cost Cost Element Unit Input Cost Quantity Per Unit RM-1 $2.00 10 $20.00 RM-3 $0.50 2 $1.00 Direct labor $25.00 2 $50.00 Variable factory OH ($326,080/50,950) $6.40 2 $12.80 Fixed factory OH ($254,750/50,950) $5.00 2 $10.00 Manufacturing cost per unit $93.80
Schedule 2: Cost per Unit--Product D57: Inputs Cost Cost Element Unit Input Cost Quantity Per Unit RM-1 $2.00 8 $16.00 RM-2 $2.50 4 $10.00 RM-3 $0.50 1 $0.50 Direct labor $25.00 3 $75.00 Variable factory OH ($326,080/50,950) $6.40 3 $19.20 Fixed factory OH ($254,750/50,950) $5.00 3 $15.00 Manufacturing cost per unit $135.70

Blocher, Stout, Cokins, Chen, Cost Management, 4/e 8-45 ©The McGraw-Hill Companies 2008
8-56 (Continued-4) 7. Budgeted selling and administrative expenses:
Spring Manufacturing Company Selling and Administrative Expense Budget
2007
Selling Expenses: Advertising $60,000 Sales salaries 200,000 Travel and entertainment 60,000 Depreciation 5,000 $325,000 Administrative expenses:
Offices salaries $60,000 Executive salaries 250,000 Supplies 4,000 Depreciation 6,000 $320,000 Total selling and administrative expenses $645,000 8. Budgeted Income Statement:
Spring Manufacturing Company Budget Income Statement
For the Year 2007 C12 D57 Total Sales (part 1) $1,800,000 $1,980,000 $3,780,000 Cost of goods sold (part 6) 1,125,600 1,221,300 2,346,900 Gross profit $674,400 $758,700 $1,433,100 Selling and administrative expenses (part 7) $645,000 Pre-tax operating income $788,100 Income taxes (@40%) $315,240 After-tax operating income $472,860
Blocher, Stout, Cokins, Chen, Cost Management, 4/e 8-46 ©The McGraw-Hill Companies 2008
8-56 (Continued-5)
Note to Instructor: An Excel spreadsheet solution file is embedded in this document. You can open the spreadsheet “object” that follows by doing the following:
1. Right click anywhere in the worksheet area below. 2. Select “Worksheet Object,” then “Open.” 3. To return to the Word document, select “File” and then “Close and return to...”
while you are in the spreadsheet mode.
8-56 Spring Manufacturing Company
1. Sales BudgetSpring Manufacturing Company
Sales Budget
C12 D57 Total
2007

Blocher, Stout, Cokins, Chen, Cost Management, 4/e 8-47 ©The McGraw-Hill Companies 2008
8-57 Spring Manufacturing Company—Comprehensive Profit Plan (90 Minutes, but much less if used in conjunction with 8-56 and completed with an Excel spreadsheet)
1. Sales Budget
Spring Manufacturing Company Sales Budget
2007
C12 D57 Total Sales (in units) 12,000 18,000 30,000 x Selling Price Per Unit $160 $180 Total revenue $1,920,000 $3,240,000 $5,160,000
2. Production Budget
Spring Manufacturing Company Production Budget
2007
C12 D57 Budgeted Sales (in units) 12,000 18,000 Plus: Desired finished goods ending inventory 300 200 Total units needed 12,300 18,200 Less: Beginning finished goods inventory 400 150 Budgeted Production (in units) 11,900 18,050
Blocher, Stout, Cokins, Chen, Cost Management, 4/e 8-48 ©The McGraw-Hill Companies 2008
8-57 (Continued-1)
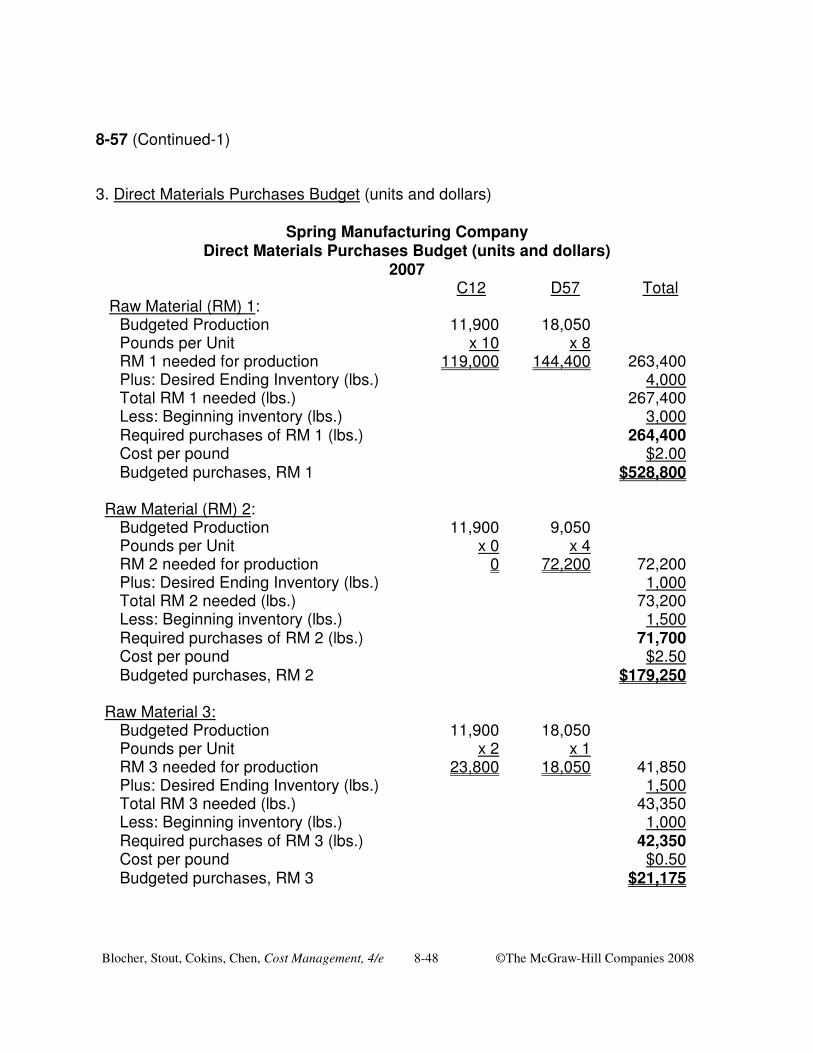
3. Direct Materials Purchases Budget (units and dollars)
Spring Manufacturing Company Direct Materials Purchases Budget (units and dollars)
2007 C12 D57 Total Raw Material (RM) 1: Budgeted Production 11,900 18,050 Pounds per Unit x 10 x 8 RM 1 needed for production 119,000 144,400 263,400 Plus: Desired Ending Inventory (lbs.) 4,000 Total RM 1 needed (lbs.) 267,400 Less: Beginning inventory (lbs.) 3,000 Required purchases of RM 1 (lbs.) 264,400 Cost per pound $2.00 Budgeted purchases, RM 1 $528,800 Raw Material (RM) 2: Budgeted Production 11,900 9,050 Pounds per Unit x 0 x 4 RM 2 needed for production 0 72,200 72,200 Plus: Desired Ending Inventory (lbs.) 1,000 Total RM 2 needed (lbs.) 73,200 Less: Beginning inventory (lbs.) 1,500 Required purchases of RM 2 (lbs.) 71,700 Cost per pound $2.50 Budgeted purchases, RM 2 $179,250 Raw Material 3: Budgeted Production 11,900 18,050 Pounds per Unit x 2 x 1 RM 3 needed for production 23,800 18,050 41,850 Plus: Desired Ending Inventory (lbs.) 1,500 Total RM 3 needed (lbs.) 43,350 Less: Beginning inventory (lbs.) 1,000 Required purchases of RM 3 (lbs.) 42,350 Cost per pound $0.50 Budgeted purchases, RM 3 $21,175

Blocher, Stout, Cokins, Chen, Cost Management, 4/e 8-49 ©The McGraw-Hill Companies 2008
8-57 (Continued-2) 4. Direct Manufacturing Labor Budget
Spring Manufacturing Company Direct Labor Budget
2007
C12 D57 Total Budgeted production 11,900 18,050 Direct labor hours (DLH) per unit x 2 x 3 Total direct labor hours needed 23,800 54,150 77,950 Hourly wage rate $25.00 Budgeted direct labor costs $1,948,750 5. Factory Overhead Budget Variable OH per DLH (from Prob. 8-56): $6.40
Spring Manufacturing Company Factory Overhead Budget
2007
Variable Factory Overhead ($6.40/DLH x 77,950) $498,880 Fixed Factory Overhead: Supervision $120,000 Maintenance costs 20,000 Heat, light, and power 43,420 Total Cash Fixed Factory Overhead $183,420 Depreciation 71,330 $254,750 Total Budgeted Factory Overhead $753,630 Variable OH rate per DLH $6.40 Fixed OH rate per DLH ($254,750/77,950 DLHs) $3.26812

Blocher, Stout, Cokins, Chen, Cost Management, 4/e 8-50 ©The McGraw-Hill Companies 2008
8-57 (Continued-3) 6. Budgeted CGS and Ending Finished Goods Inventory Budget
Spring Manufacturing Company Ending Finished Goods Inventory and Budgeted CGS
2007
C12 D57 Total Sales volume 12,000 18,000 30,000 Cost per unit (Schedule 1 and 2) $90.33624 $130.50436 Cost of goods sold $1,084,035 $2,349,079 $3,433,114 Finished goods ending inventory 300 200 Cost per unit (Schedule 1 and 2) $90.33624 $114.50 Budgeted ending inventories $27,101 $26,101 $53,202
Schedule 1: Cost per Unit—Product C12: Inputs Cost Cost Element Unit Input Cost Quantity Per Unit RM-1 $2.00 10 $20.00 RM-3 $0.50 2 $1.00 Direct labor $25.00 2 $50.00 Variable factory OH ($326,080/50,950) $6.40 2 $12.80 Fixed factory OH ($254,750/77,950) $3.26812 2 $6.53624 Manufacturing cost per unit $90.33624
Schedule 2: Cost per Unit—Product D57: Inputs Cost Cost Element Unit Input Cost Quantity Per Unit RM-1 $2.00 8 $16.00 RM-2 $2.50 4 $10.00 RM-3 $0.50 1 $0.50 Direct labor $25.00 3 $75.00 Variable factory OH ($326,080/50,950) $6.40 3 $19.20 Fixed factory OH ($254,750/77,950) $3.26812 3 $9.80436 Manufacturing cost per unit $130.50436
Blocher, Stout, Cokins, Chen, Cost Management, 4/e 8-51 ©The McGraw-Hill Companies 2008
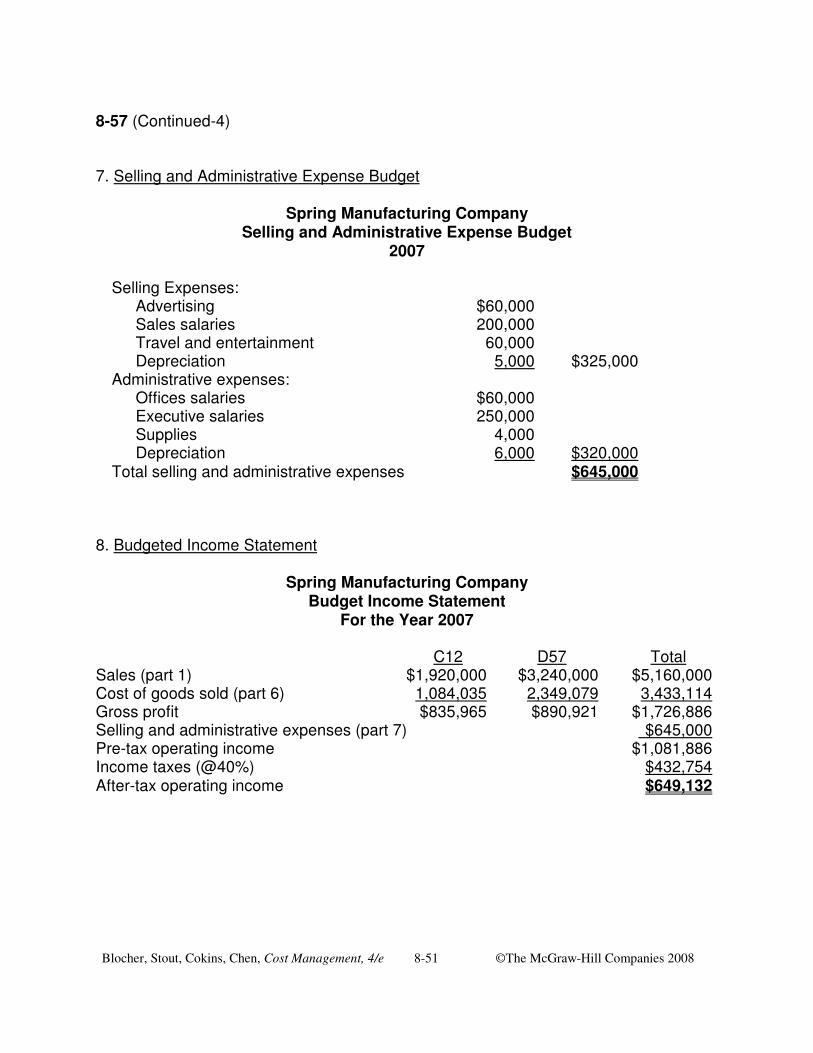
8-57 (Continued-4) 7. Selling and Administrative Expense Budget
Spring Manufacturing Company Selling and Administrative Expense Budget
2007
Selling Expenses: Advertising $60,000 Sales salaries 200,000 Travel and entertainment 60,000 Depreciation 5,000 $325,000 Administrative expenses:
Offices salaries $60,000 Executive salaries 250,000 Supplies 4,000 Depreciation 6,000 $320,000 Total selling and administrative expenses $645,000 8. Budgeted Income Statement
Spring Manufacturing Company Budget Income Statement
For the Year 2007 C12 D57 Total Sales (part 1) $1,920,000 $3,240,000 $5,160,000 Cost of goods sold (part 6) 1,084,035 2,349,079 3,433,114 Gross profit $835,965 $890,921 $1,726,886 Selling and administrative expenses (part 7) $645,000 Pre-tax operating income $1,081,886 Income taxes (@40%) $432,754 After-tax operating income $649,132
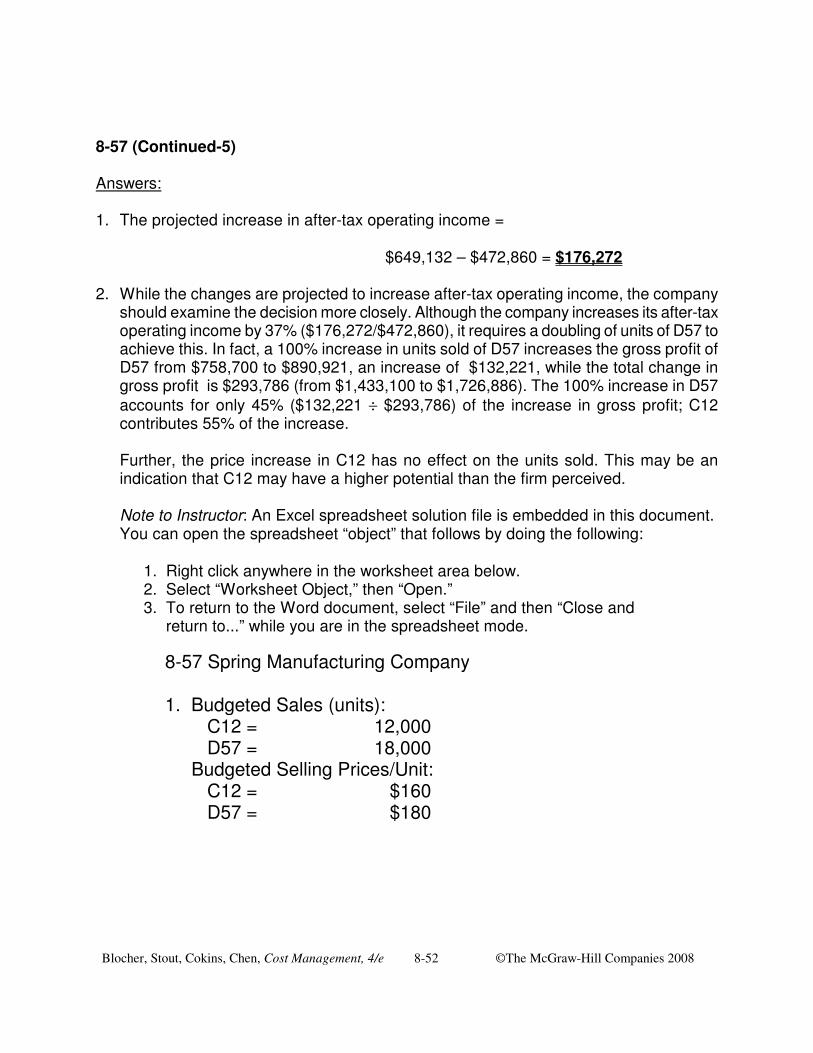
Blocher, Stout, Cokins, Chen, Cost Management, 4/e 8-52 ©The McGraw-Hill Companies 2008
8-57 (Continued-5) Answers: 1. The projected increase in after-tax operating income = $649,132 – $472,860 = $176,272 2. While the changes are projected to increase after-tax operating income, the company
should examine the decision more closely. Although the company increases its after-tax operating income by 37% ($176,272/$472,860), it requires a doubling of units of D57 to achieve this. In fact, a 100% increase in units sold of D57 increases the gross profit of D57 from $758,700 to $890,921, an increase of $132,221, while the total change in gross profit is $293,786 (from $1,433,100 to $1,726,886). The 100% increase in D57 accounts for only 45% ($132,221 ÷ $293,786) of the increase in gross profit; C12 contributes 55% of the increase.
Further, the price increase in C12 has no effect on the units sold. This may be an
indication that C12 may have a higher potential than the firm perceived.
Note to Instructor: An Excel spreadsheet solution file is embedded in this document. You can open the spreadsheet “object” that follows by doing the following:
1. Right click anywhere in the worksheet area below. 2. Select “Worksheet Object,” then “Open.” 3. To return to the Word document, select “File” and then “Close and return to...” while you are in the spreadsheet mode.
8-57 Spring Manufacturing Company
1. Budgeted Sales (units): C12 = 12,000 D57 = 18,000 Budgeted Selling Prices/Unit: C12 = $160 D57 = $180
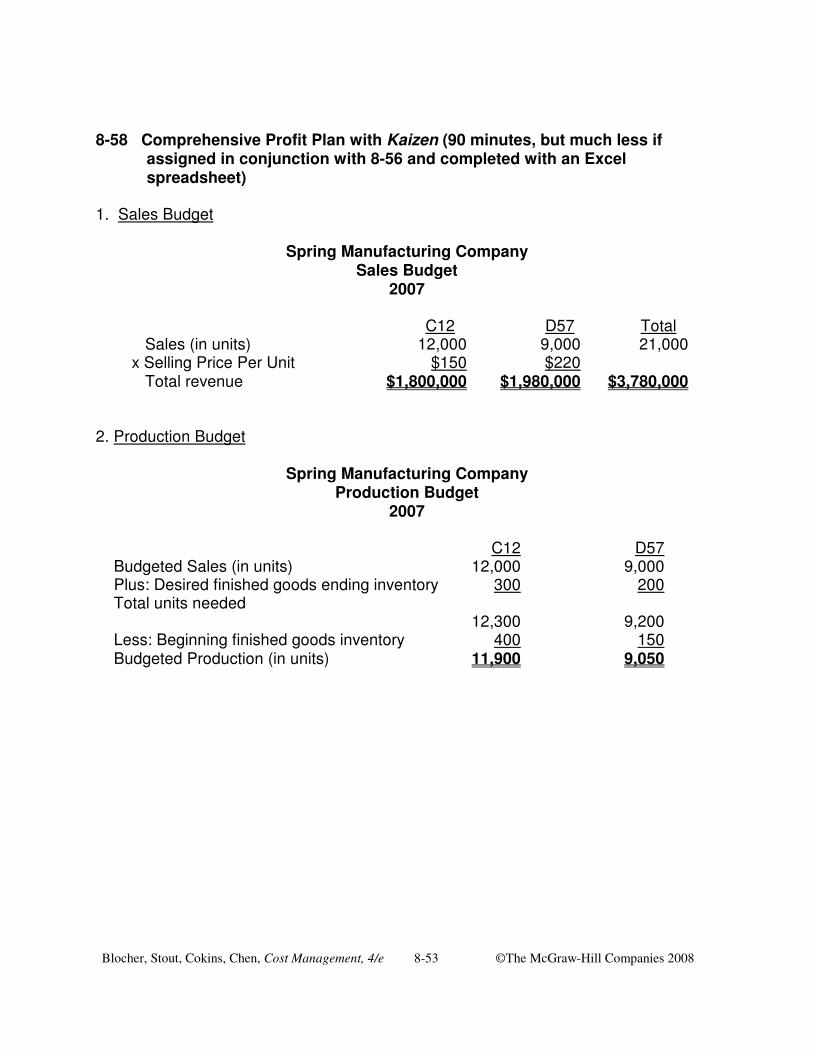
Blocher, Stout, Cokins, Chen, Cost Management, 4/e 8-53 ©The McGraw-Hill Companies 2008
8-58 Comprehensive Profit Plan with Kaizen (90 minutes, but much less if
assigned in conjunction with 8-56 and completed with an Excel spreadsheet)
1. Sales Budget
Spring Manufacturing Company Sales Budget
2007
C12 D57 Total Sales (in units) 12,000 9,000 21,000 x Selling Price Per Unit $150 $220 Total revenue $1,800,000 $1,980,000 $3,780,000
2. Production Budget
Spring Manufacturing Company Production Budget
2007
C12 D57 Budgeted Sales (in units) 12,000 9,000 Plus: Desired finished goods ending inventory 300 200 Total units needed 12,300 9,200 Less: Beginning finished goods inventory 400 150 Budgeted Production (in units) 11,900 9,050

Blocher, Stout, Cokins, Chen, Cost Management, 4/e 8-54 ©The McGraw-Hill Companies 2008
8-58 (Continued-1)
3. Direct Materials Purchases Budget (units and dollars)
Spring Manufacturing Company Direct Materials Purchases Budget (units and dollars)
2007
C12 D57 Total Raw Material (RM) 1: Budgeted Production 11,900 9,050 Pounds per Unit x 9 x 7 RM 1 needed for production 107,100 63,350 170,450 Plus: Desired Ending Inventory (lbs.) 4,000 Total RM 1 needed (lbs.) 174,450 Less: Beginning inventory (lbs.) 3,000 Required purchases of RM 1 (lbs.) 171,450 Cost per pound $2.00 Budgeted purchases, RM 1 $342,900 Raw Material (RM) 2: Budgeted Production 11,900 9,050 Pounds per Unit x 0 x 3.6 RM 2 needed for production 0 32,580 32,580 Plus: Desired Ending Inventory (lbs.) 1,000 Total RM 2 needed (lbs.) 33,580 Less: Beginning inventory (lbs.) 1,500 Required purchases of RM 2 (lbs.) 32,080 Cost per pound $2.50 Budgeted purchases, RM 2 $80,200 Raw Material 3: Budgeted Production 11,900 9,050 Pounds per Unit x 1.8 x 0.8 RM 3 needed for production 21,420 7,240 28,660 Plus: Desired Ending Inventory (lbs.) 1,500 Total RM 3 needed (lbs.) 30,160 Less: Beginning inventory (lbs.) 1,000 Required purchases of RM 3 (lbs.) 29,160 Cost per pound $0.50 Budgeted purchases, RM 3 $14,580
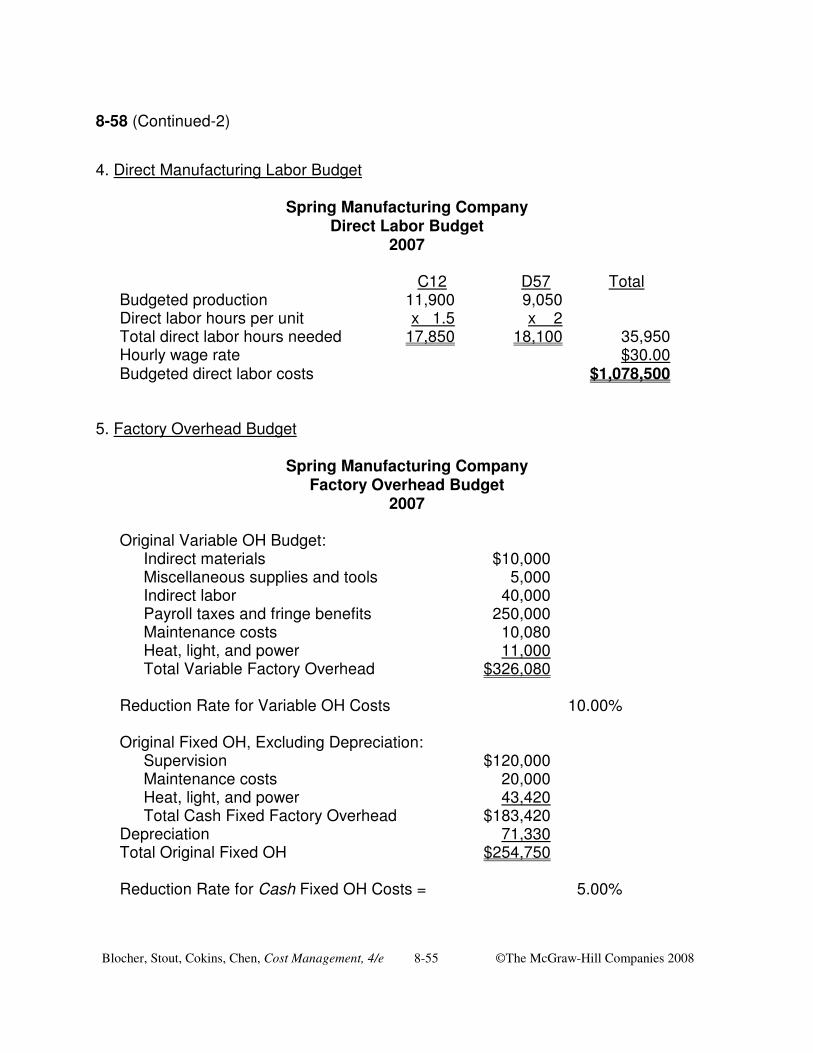
Blocher, Stout, Cokins, Chen, Cost Management, 4/e 8-55 ©The McGraw-Hill Companies 2008
8-58 (Continued-2)
4. Direct Manufacturing Labor Budget
Spring Manufacturing Company Direct Labor Budget
2007
C12 D57 Total Budgeted production 11,900 9,050 Direct labor hours per unit x 1.5 x 2 Total direct labor hours needed 17,850 18,100 35,950 Hourly wage rate $30.00 Budgeted direct labor costs $1,078,500
5. Factory Overhead Budget
Spring Manufacturing Company Factory Overhead Budget
2007 Original Variable OH Budget: Indirect materials $10,000 Miscellaneous supplies and tools 5,000 Indirect labor 40,000 Payroll taxes and fringe benefits 250,000 Maintenance costs 10,080 Heat, light, and power 11,000 Total Variable Factory Overhead $326,080 Reduction Rate for Variable OH Costs 10.00% Original Fixed OH, Excluding Depreciation: Supervision $120,000 Maintenance costs 20,000 Heat, light, and power 43,420 Total Cash Fixed Factory Overhead $183,420 Depreciation 71,330 Total Original Fixed OH $254,750 Reduction Rate for Cash Fixed OH Costs = 5.00%
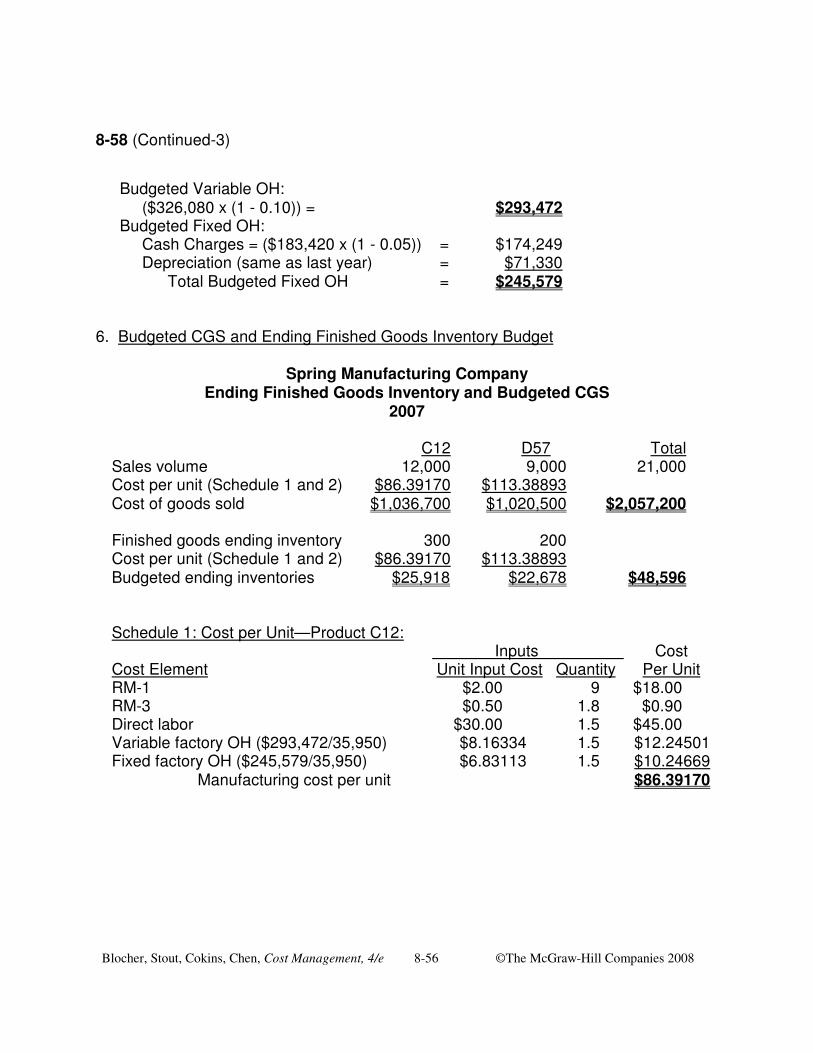
Blocher, Stout, Cokins, Chen, Cost Management, 4/e 8-56 ©The McGraw-Hill Companies 2008
8-58 (Continued-3)
Budgeted Variable OH: ($326,080 x (1 - 0.10)) = $293,472 Budgeted Fixed OH: Cash Charges = ($183,420 x (1 - 0.05)) = $174,249 Depreciation (same as last year) = $71,330 Total Budgeted Fixed OH = $245,579 6. Budgeted CGS and Ending Finished Goods Inventory Budget
Spring Manufacturing Company Ending Finished Goods Inventory and Budgeted CGS
2007
C12 D57 Total Sales volume 12,000 9,000 21,000 Cost per unit (Schedule 1 and 2) $86.39170 $113.38893 Cost of goods sold $1,036,700 $1,020,500 $2,057,200 Finished goods ending inventory 300 200 Cost per unit (Schedule 1 and 2) $86.39170 $113.38893 Budgeted ending inventories $25,918 $22,678 $48,596 Schedule 1: Cost per Unit—Product C12: Inputs Cost Cost Element Unit Input Cost Quantity Per Unit RM-1 $2.00 9 $18.00 RM-3 $0.50 1.8 $0.90 Direct labor $30.00 1.5 $45.00 Variable factory OH ($293,472/35,950) $8.16334 1.5 $12.24501 Fixed factory OH ($245,579/35,950) $6.83113 1.5 $10.24669 Manufacturing cost per unit $86.39170
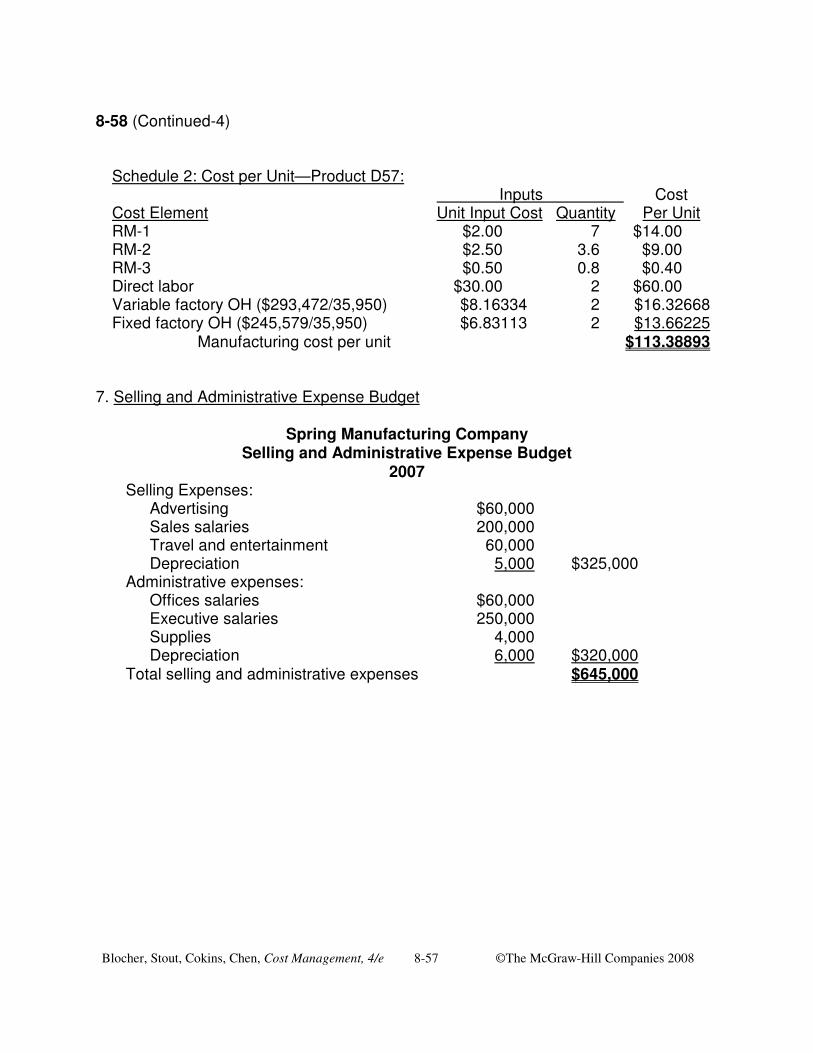
Blocher, Stout, Cokins, Chen, Cost Management, 4/e 8-57 ©The McGraw-Hill Companies 2008
8-58 (Continued-4) Schedule 2: Cost per Unit—Product D57: Inputs Cost Cost Element Unit Input Cost Quantity Per Unit RM-1 $2.00 7 $14.00 RM-2 $2.50 3.6 $9.00 RM-3 $0.50 0.8 $0.40 Direct labor $30.00 2 $60.00 Variable factory OH ($293,472/35,950) $8.16334 2 $16.32668 Fixed factory OH ($245,579/35,950) $6.83113 2 $13.66225 Manufacturing cost per unit $113.38893
7. Selling and Administrative Expense Budget
Spring Manufacturing Company Selling and Administrative Expense Budget
2007 Selling Expenses: Advertising $60,000 Sales salaries 200,000 Travel and entertainment 60,000 Depreciation 5,000 $325,000 Administrative expenses: Offices salaries $60,000 Executive salaries 250,000 Supplies 4,000 Depreciation 6,000 $320,000 Total selling and administrative expenses $645,000
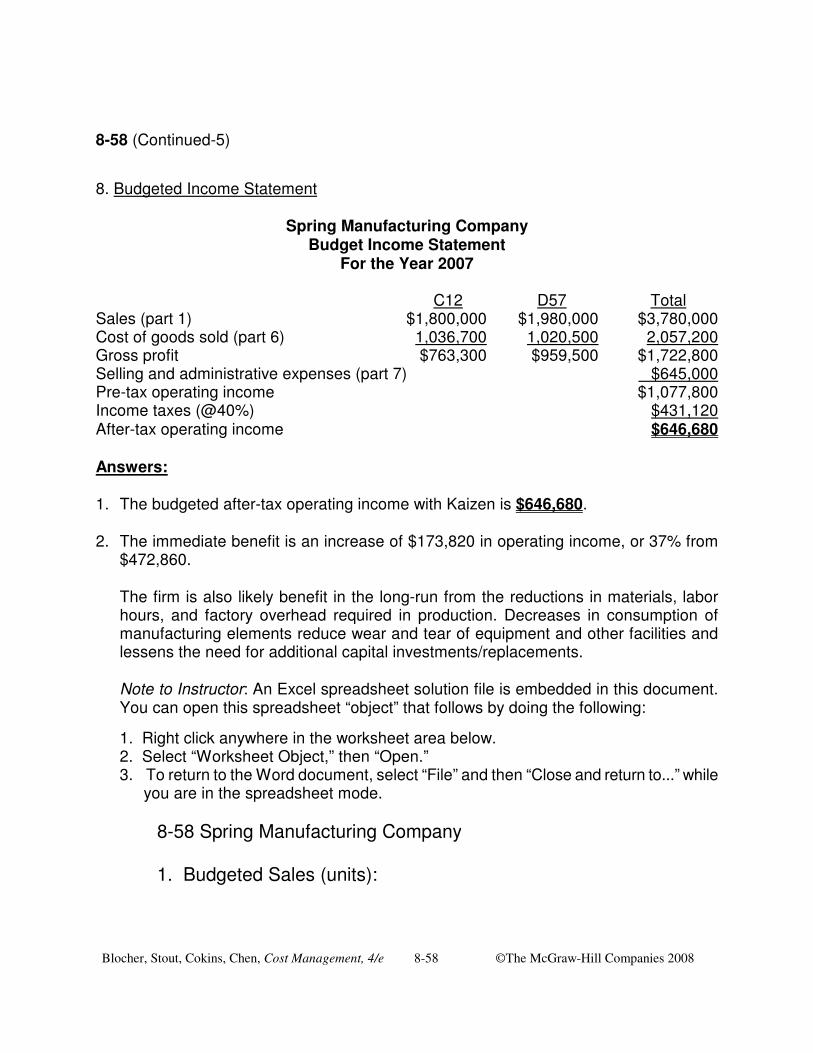
Blocher, Stout, Cokins, Chen, Cost Management, 4/e 8-58 ©The McGraw-Hill Companies 2008
8-58 (Continued-5)
8. Budgeted Income Statement
Spring Manufacturing Company Budget Income Statement
For the Year 2007 C12 D57 Total Sales (part 1) $1,800,000 $1,980,000 $3,780,000 Cost of goods sold (part 6) 1,036,700 1,020,500 2,057,200 Gross profit $763,300 $959,500 $1,722,800 Selling and administrative expenses (part 7) $645,000 Pre-tax operating income $1,077,800 Income taxes (@40%) $431,120 After-tax operating income $646,680 Answers: 1. The budgeted after-tax operating income with Kaizen is $646,680. 2. The immediate benefit is an increase of $173,820 in operating income, or 37% from
$472,860. The firm is also likely benefit in the long-run from the reductions in materials, labor
hours, and factory overhead required in production. Decreases in consumption of manufacturing elements reduce wear and tear of equipment and other facilities and lessens the need for additional capital investments/replacements.
Note to Instructor: An Excel spreadsheet solution file is embedded in this document.
You can open this spreadsheet “object” that follows by doing the following:
1. Right click anywhere in the worksheet area below. 2. Select “Worksheet Object,” then “Open.” 3. To return to the Word document, select “File” and then “Close and return to...” while
you are in the spreadsheet mode.
8-58 Spring Manufacturing Company
1. Budgeted Sales (units):

Blocher, Stout, Cokins, Chen, Cost Management, 4/e 8-59 ©The McGraw-Hill Companies 2008
8-59 Retailer Budget (45-50 minutes) 1. Budgeted merchandise purchases
D. Tomlinson Retail Budgeted Merchandise Purchases
May and June May June July Sales (in units) 11,900 11,400 12,000 Cost per unit x $20 x $20 x $20 Cost of Goods Sold (CGS) $238,000 $228,000 $240,000 Ending inventory (130% of next month's CGS) + 296,400 + 312,000 Total needed $534,400 $540,000 Beginning inventory (130% of this month's CGS) – 309,400 – 296,400 Budgeted Merchandise Purchases $225,000 $243,600 2. Budgeted cash disbursements S, G, & A expenses: May June Sales revenue $357,000 $342,000 S, G, & A expense ratio x 0.15 x 0.15 Total S, G, & A expense $ 53,550 $ 51,300 Less: Depreciation – 2,000 – 2,000 Out-of-pocket S, G & A expense $ 51,550 $ 49,300
D. Tomlinson Retail Budgeted Cash Disbursements for June
May June Merchandise purchases $ 225,000 $ 243,600 Out-of-Pocket S, G, & A expenses + 51,550 + 49,300 Total payables $276,550 $292,900 Payment for the current month’s payables (54%) $158,166 Owed from last month (46%) + 127,213 Budgeted cash outflow for payables $285,379

Blocher, Stout, Cokins, Chen, Cost Management, 4/e 8-60 ©The McGraw-Hill Companies 2008
8-59 (Continued)
3. Budgeted cash collections
D. Tomlinson Retail Cash Collections
May From last month's (April) credit sales Within the discount period ($363,000) x 60% x 97% = $211,266 After the discount period $363,000 x 25% = 90,750
From credit sales two months ago (i.e., March) Collection of credit sales made in March $354,000 x 9% = 31,860
Total cash collections $333,876 4. Gross and Net Balance of Accounts Receivable (AR) as of May 31 March April May Total Sales $354,000 $363,000 $357,000 Remaining AR % 6% 15% 100% AR Balance (Gross) $21,240 $54,450 $357,000 $432,690 Bad-debt allowance* $21,240 $21,780 $21,420 64,440 AR Balance (Net) $368,250 * @ 6% of gross sales dollars

Blocher, Stout, Cokins, Chen, Cost Management, 4/e 8-61 ©The McGraw-Hill Companies 2008
8-60 Sales budget and pro-forma financial statements (75 minutes) 1.
Original Budget Data Sales (units):
Beginning inventory of finished goods (9/1/2007) 9,300
Estimated production for the 2007-8 fiscal year 162,000
Units available for sale 171,300
Planned ending finished goods inventory (8/31/2008) 3,300
Projected unit sales, 2007-8 fiscal year 168,000 Selling price/unit:
a. & b. Revised sales volume--units and dollars:
Sales in units in the original budget (see above) 168,000
Increase in units of production (170,000 - 162,000)* + 8,000
Revised total sales—units 176,000
Selling price per unit (see above) x $ 186
Revised projected dollar-volume of net sales $32,736,000 *With no change in the ending finished goods inventory (3,300 units) the increase in production is a result of the expected increase in sales.
$186 = 168,000
0$31,248,00 =
SalesUnit Projected
Sales of Dollars Projected = Price/Unit Selling
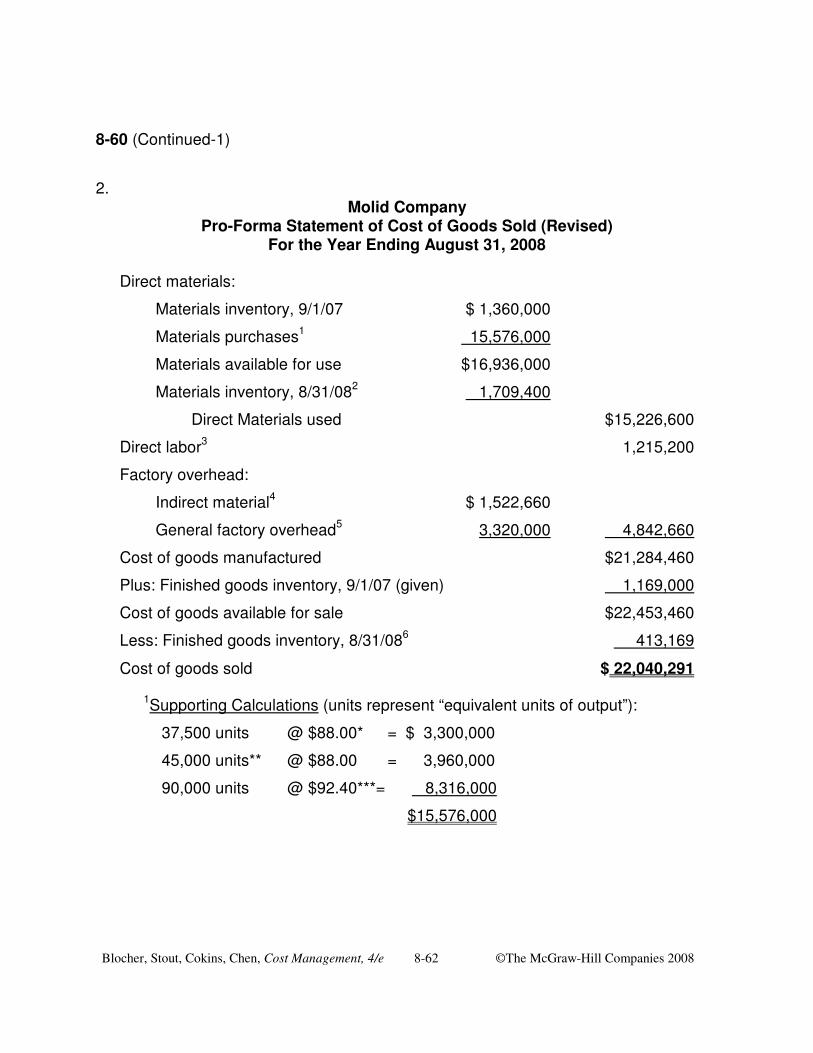
Blocher, Stout, Cokins, Chen, Cost Management, 4/e 8-62 ©The McGraw-Hill Companies 2008
8-60 (Continued-1)
2. Molid Company
Pro-Forma Statement of Cost of Goods Sold (Revised) For the Year Ending August 31, 2008
Direct materials:
Materials inventory, 9/1/07 $ 1,360,000
Materials purchases1 15,576,000
Materials available for use $16,936,000
Materials inventory, 8/31/082 1,709,400
Direct Materials used $15,226,600
Direct labor3 1,215,200
Factory overhead:
Indirect material4 $ 1,522,660
General factory overhead5 3,320,000 4,842,660
Cost of goods manufactured $21,284,460
Plus: Finished goods inventory, 9/1/07 (given) 1,169,000
Cost of goods available for sale $22,453,460
Less: Finished goods inventory, 8/31/086 413,169
Cost of goods sold $ 22,040,291 1Supporting Calculations (units represent “equivalent units of output”):
37,500 units @ $88.00* = $ 3,300,000
45,000 units** @ $88.00 = 3,960,000
90,000 units @ $92.40***= 8,316,000
$15,576,000
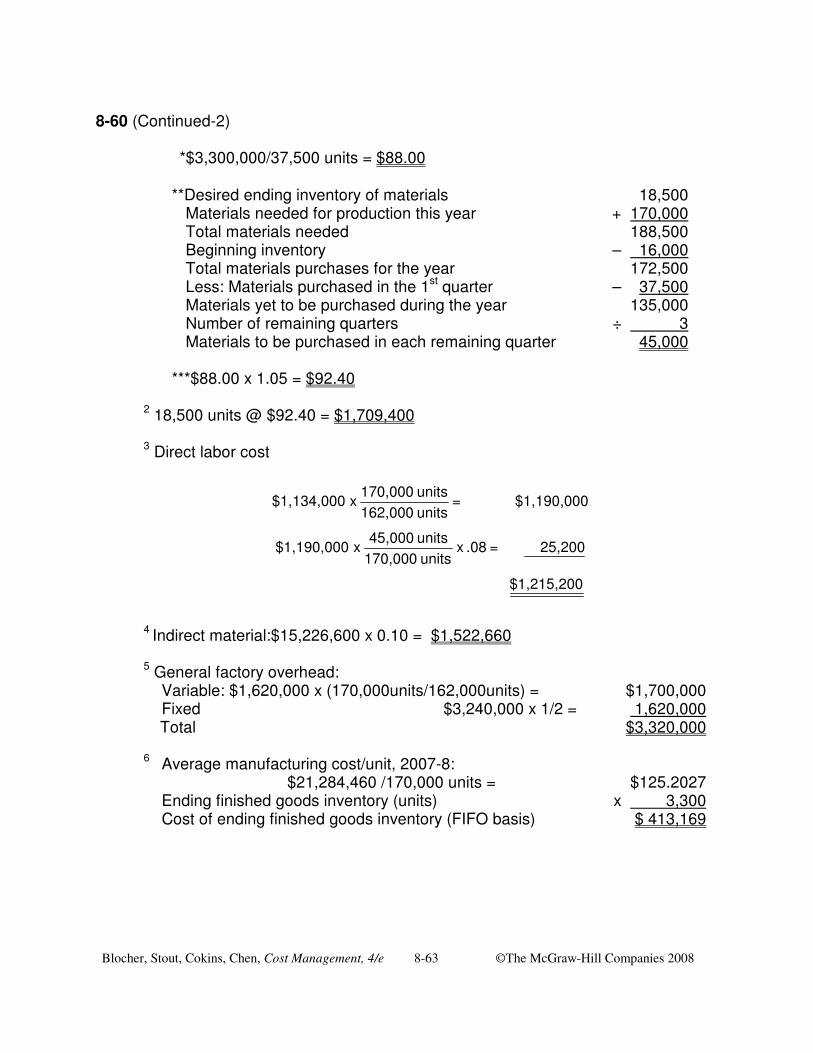
Blocher, Stout, Cokins, Chen, Cost Management, 4/e 8-63 ©The McGraw-Hill Companies 2008
8-60 (Continued-2) *$3,300,000/37,500 units = $88.00
**Desired ending inventory of materials 18,500 Materials needed for production this year + 170,000 Total materials needed 188,500 Beginning inventory – 16,000 Total materials purchases for the year 172,500 Less: Materials purchased in the 1st quarter – 37,500 Materials yet to be purchased during the year 135,000 Number of remaining quarters ÷ 3 Materials to be purchased in each remaining quarter 45,000
***$88.00 x 1.05 = $92.40
2 18,500 units @ $92.40 = $1,709,400
3 Direct labor cost
4 Indirect material:$15,226,600 x 0.10 = $1,522,660 5 General factory overhead: Variable: $1,620,000 x (170,000units/162,000units) = $1,700,000
Fixed $3,240,000 x 1/2 = 1,620,000 Total $3,320,000
6 Average manufacturing cost/unit, 2007-8: $21,284,460 /170,000 units = $125.2027 Ending finished goods inventory (units) x 3,300 Cost of ending finished goods inventory (FIFO basis) $ 413,169
$1,215,200
25,200 = .08 x units 170,000units 45,000
x $1,190,000
$1,190,000 = units 162,000units 170,000
x $1,134,000

Blocher, Stout, Cokins, Chen, Cost Management, 4/e 8-64 ©The McGraw-Hill Companies 2008
8-60 (Continued-3) 3. a. Savings in working capital from eliminating ending inventory:
Finished goods $ 413,169 Direct materials $92.40 x (18,500 – 100) = 1,700,160
Total savings $2,113,329 The firm can reduce the need for working capital by $2,113,329. The final net savings depends on the cost of capital of the firm. At 10%, the company saves financing costs of over $200,000 per year. The firm can save more than $211,333 per year if the cost of capital exceeds 10%. Note that this estimate refers to financing (cost-of-capital-related) costs, not operating costs.
b. Yes. Under the assumption that the company’s cost of capital is 10%, the economic
savings would represent about 4% of its current pre-tax operating income figure, as shown below. Note that these savings put the company in an improved economic position, although the formal accounting statements might not reflect this. As such, this gives the instructor the opportunity to discuss with students the notion of “Economic Value Added” (EVA®) as alternative financial performance indicator to conventional accounting income statements.
Molid Company
Pro-Forma Statement Income Statement For the Year Ending August 31, 2008
Net sales (part 1b above) $32,736,000 Cost of goods sold (part 2 above) 22,040,291 Gross profit $10,695,709 Operating expenses (given—see text):
Marketing $3,200,000 General and administrative 2,200,000 5,400,000
Income from operations before income taxes $ 5,295,709 $211,333/$5,295,709 = 4% c. In addition to financial terms, the firm needs to consider carefully, among other items:
� adequacy of the firm's equipment to support the new system � proficiency of the firm's accounting information system to handle the new system � support of vendors � acceptance of factory managers and production workers

Blocher, Stout, Cokins, Chen, Cost Management, 4/e 8-65 ©The McGraw-Hill Companies 2008
8-61 Budgeting for a Merchandising Firm (50-60 minutes) 1. Budgeted cash collections—December: From November’s sales = net A/R, November 30th = $ 76,000 From December’s sales = $220,000 x 60% x 99% = 130,680 Budgeted cash collections--December $206,680 2. Net accounts receivable—December 31st: Budgeted sales in December (given) $220,000 Allowance for doubtful accounts $220,000 x 2% = 4,400 Net A/R from sales in December $215,600 Collections of December sales in December $220,000 x 60% = 132,000 Net Accounts Receivable—December 31st $ 83,600
3. Budgeted pre-tax operating income—December: Total sales $220,000 Gross margin ratio x 25% Gross margin $ 55,000 Operating expenses: Monthly cash operating expenses $22,600 Bad-debts expense $220,000 x 2% = 4,400 Depreciation expense $216,000/12 = 18,000 45,000 Pre-tax operating income $10,000
4. Budgeted Inventory—December 31st:
Inventory, December 31st = ($200,000 x 0.75) x 80% = $120,000
5. Budgeted Purchases—December:
Inventory, December 1st (given) = $132,000 Plus: Purchases during December (plug figure) = 153,000 Cost of goods available for sale $285,000 Less: Cost of goods sold $220,000 x 75% = 165,000 Inventory, December 31st (part 4 above) = $120,000

Blocher, Stout, Cokins, Chen, Cost Management, 4/e 8-66 ©The McGraw-Hill Companies 2008
8-61 (Continued)
6. Budgeted Accounts Payable—December 31st: Accounts Payable, December 1st (given) $162,000 Plus: Budgeted Purchases, December (part 5 above) $153,000 Total Accounts Payable during December $315,000 Less: Payments in December (entire beginning balance) $162,000 Budgeted Accounts Payable, December 31st $153,000 Alternatively, the end-of-December Accounts Payable Balance = Purchases
made in December = answer to Part 5 above.
Blocher, Stout, Cokins, Chen, Cost Management, 4/e 8-67 ©The McGraw-Hill Companies 2008
8-62 Budgets for a Service Firm (50 Minutes) 1. The annual cash budget is presented on the next page. 2. Operating problems that Triple-F Health Club could experience include:
� The cash contribution from lessons and classes will decrease because the projected wage increase for lesson and class employees is significantly greater than the projected increases in revenues (i.e., in additional volume). Last year, the cash generated from these operations was $39,000 ($234,000 – $195,000). The 2009 projection is only $12,675 ($304,200 – $291,525).
� Operating expenses are increasing faster than revenues from membership fees. Last year (2008), cash generated from regular operations was $91,000 [($355,000 + $2,000) – ($461,000 – $195,000)]. The 2009 projection is only $92,482 [($402,215 + $2,667) – ($603,925 – $291,525)]. The increase in cash from regular operations is projected to be about 4%, whereas these revenues are projected to increase 13%.
� Triple-F Health Club seems to have a cash-management problem. The club does not generate enough cash from operations to meet its obligations. It may not be able to meet expenditures for day-to-day operations if the trend continues. To avoid cash crises, the club should prepare monthly cash budgets to help cash management.
� Non-operational payments are projected to use up virtually all of the cash generated from operations. Given the recent declines in mortgage interest rates, management should consider refinancing this debt to reduce this cash drain.
3. Jane Crowe's concern with regard to the Board's expansion goals is justified. The 2009
budget projections show only a minimal increase in the cash balance (i.e., an increase of only $2,757). The total cash available is well short of the $60,000 annual additional cash needed for the land purchase. If the Board desires to purchase the adjoining property, it is going to have to consider increases in fees, refinancing existing debt, or other methods of financing the acquisition (such as additional mortgage debt or membership bonds).

Blocher, Stout, Cokins, Chen, Cost Management, 4/e 8-68 ©The McGraw-Hill Companies 2008
8-62 (continued)
TRIPLE-F HEALTH CLUB Cash Budget
For the Year Ending October 31, 2009
Price 2008 Growth Increase 2009 Operating Cash Inflows: Annual membership fees $355,000 3.0% 10.0% $402,215 Lesson and class fees 234,000 30.0% 304,200 Miscellaneous 2,000 33.33% 2,667 Total Operating Cash Inflows $591,000 $709,082 Operating Cash Outflows: Manager’s salary and benefits $36,000 15.0% $41,400 Employee wages and benefits: Regular employees 190,000 15.0% 218,500 Lesson and class employees 195,000 30.0% 15.0% 291,525 Towels and supplies 16,000 25.0% 20,000 Utilities (heat and lights) 22,000 25.0% 27,500 Miscellaneous 2,000 25.0% 2,500 Payoff of outstanding A/P N/A given 2,500 Total Operating Cash Outflows $461,000 $603,925 Net Operating Cash Flow $130,000 $105,157 Non-Operating Cash Outflows: Payoff of equipment payable given $15,000 Mortgage principal given 30,000 Mortgage interest 32,4001
Planned equipment purchases given 25,000 Total Non-Operating Cash Outflow $102,400 Net Cash Flow $2,757 Beginning Cash Balance (given) 7,300 Budgeted Ending Cash Balance $10,057 _______________ 1$360,000 x 0.09 = $32,400 ($360,000 = principal balance at beginning of the year)

Blocher, Stout, Cokins, Chen, Cost Management, 4/e 8-69 ©The McGraw-Hill Companies 2008
8-63 Budgeting for Marketing Expenses; Strategy (45-50 minutes) 1. The following screen shots are from the Excel spreadsheet created for this problem. It shows that the original monthly budgeted marketing expense is $338,000 and that the revised (budgeted) amount is $372,628, an overall increase of 10.24%.

Blocher, Stout, Cokins, Chen, Cost Management, 4/e 8-70 ©The McGraw-Hill Companies 2008
8-63 (Continued)
2. In order to achieve the monthly targeted cost of $350,000, the rate of “telephone and mailing” costs cannot increase at all (as is the case in the proposed budget); in fact, the results of the “goal seek” analysis indicates that such rates must be decreased by approximately 43%, as shown below:
These results are generated by completing the following dialog box that appears after activating the “goal-seek” command from the Tools menu in Excel:
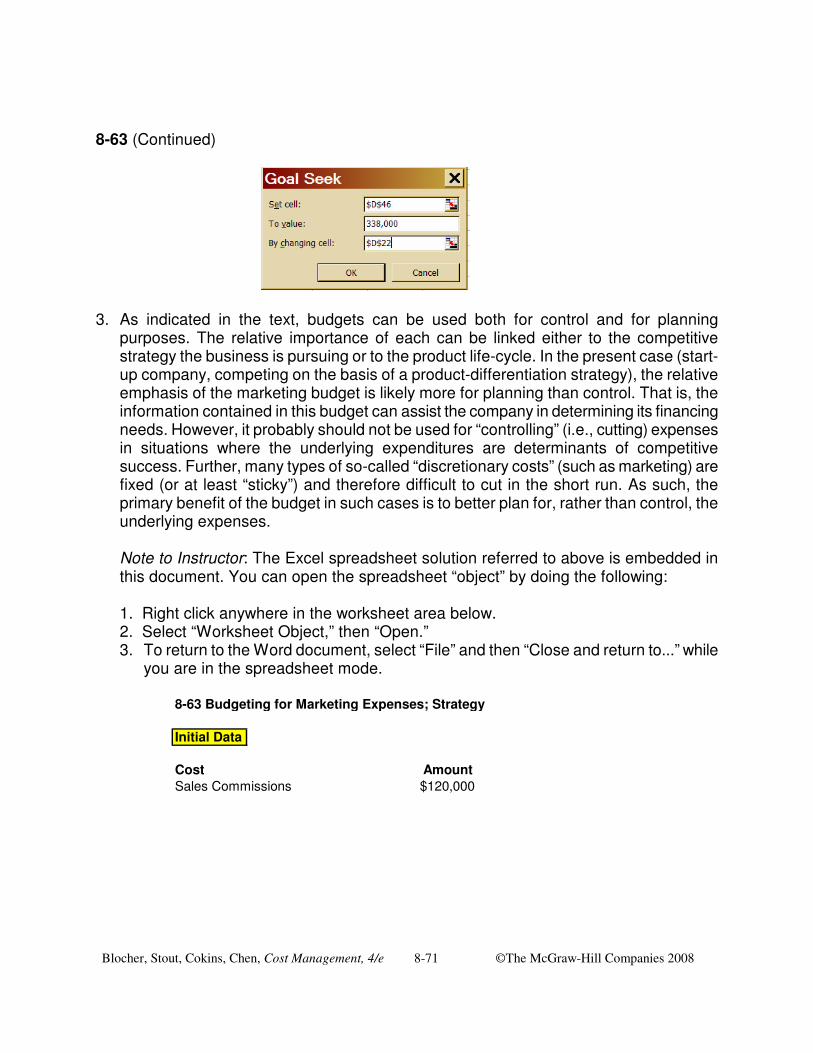
Blocher, Stout, Cokins, Chen, Cost Management, 4/e 8-71 ©The McGraw-Hill Companies 2008
8-63 (Continued)
3. As indicated in the text, budgets can be used both for control and for planning
purposes. The relative importance of each can be linked either to the competitive strategy the business is pursuing or to the product life-cycle. In the present case (start-up company, competing on the basis of a product-differentiation strategy), the relative emphasis of the marketing budget is likely more for planning than control. That is, the information contained in this budget can assist the company in determining its financing needs. However, it probably should not be used for “controlling” (i.e., cutting) expenses in situations where the underlying expenditures are determinants of competitive success. Further, many types of so-called “discretionary costs” (such as marketing) are fixed (or at least “sticky”) and therefore difficult to cut in the short run. As such, the primary benefit of the budget in such cases is to better plan for, rather than control, the underlying expenses.
Note to Instructor: The Excel spreadsheet solution referred to above is embedded in this document. You can open the spreadsheet “object” by doing the following:
1. Right click anywhere in the worksheet area below. 2. Select “Worksheet Object,” then “Open.” 3. To return to the Word document, select “File” and then “Close and return to...” while
you are in the spreadsheet mode.
8-63 Budgeting for Marketing Expenses; Strategy
Initial Data
Cost AmountSales Commissions $120,000

Blocher, Stout, Cokins, Chen, Cost Management, 4/e 8-72 ©The McGraw-Hill Companies 2008
8-64 Strategy, product life-cycle, and cash flow (25-30 minutes) 1. The development stage is generally characterized by large cash outflows and little or no
cash inflows. Expenditures for research and development, plant and equipment, retooling, distribution, and promotion are required. During this stage, a project or company normally generates losses and may require an infusion of outside capital.
During the growth stage, sales and revenues rise rapidly. Significant cash inflows are generally present; however, these may be offset in part or completely by cash outflows to build production capacity and for growing inventories and receivables. During this stage, manufacturing efficiencies will improve contribution margins as volume increases.
During the maturity stage, net cash inflows are generally at an optimum. Production capacity is in place and inventories and receivables should approach a steady state. However, by this stage, competitors generally have entered the market resulting in higher promotional costs to maintain market share. As a consequence, margins may begin to decline.
During the decline stage, both sales volume and profits fall. Increased price competition and the increased availability of alternative products will reduce margins. The declining volume will generally increase the unit cost at the manufacturing level. Sometimes, significant cash inflows can be generated from the liquidation of inventories and other product-related assets.
2. The maturity stage, the period of optimum net cash inflows, is missing from Burke
Company's product cycle. The company must be able to generate or raise sufficient cash to support R & D, capital investment, and promotional costs during the development stages and depend on the growth stage for significant cash inflows. This will require rapid improvement in manufacturing efficiencies and careful investment in production facilities and inventories. In addition, inventory control is extremely important in order to minimize cash investment and reduce potential obsolescence.
3. The techniques that Devin Ward should consider to cope with Burke Company's cash-
management problems include: � careful, timely cash-flow projections and monitoring, matching the cash receipts
from products in the growth stage with the expenditures for products in the development stage.
� establishing good banking relationships and flexible lines of credit to facilitate short-term borrowing needs.
� aggressive accounts-receivable management. � tight control of materials purchasing and inventory management. � improved cost controls. � timely decisions on inventory liquidation as product life cycles near collapse.

Blocher, Stout, Cokins, Chen, Cost Management, 4/e 8-73 ©The McGraw-Hill Companies 2008
8-65 Continuous budgeting (25-30 minutes) 1.a. The increase in sales could have the following effects on production:
� Production capacity may have to be reallocated to the three models based upon the composition of the sales increase.
� Some parts, in addition to the molded doors, may have to be purchased from outside suppliers.
� Depending upon the ability to purchase parts from outside suppliers and long-term sales projections, additional capacity may be required.
1.b. The increase in sales could have the following effects on finance and accounting:
� Short-term financing may be needed to finance increased receivable levels and for the replacement of depleted inventories.
� Long-term financing may be needed to expand production capacity. � Budgeting may have to be revised because sales volume is probably beyond the
relevant range assumed for the current budget. 1.c. The increase in sales could have the following effects on marketing:
� The need to advertise will probably decrease. � Investigation into the credit-worthiness of potential credit customers may need
to become more thorough and the number of investigations will probably increase.
� Collection efforts may have to be increased unless credit-granting is tightened. � Customers may have to accept extended shipping dates or may receive units on
some rational basis of output allocation. 1.d. The increase in sales could have the following effects on personnel:
� Increased stress levels because of the increased volume. � Need to schedule additional shifts or overtime, which the employees may deem
unnecessary or not beneficial. � Need to hire additional workers to meet the increase in demand.
2.a. A continuous (rolling) budget is the preparation of a new twelve-month budget as
each period (e.g., month, quarter) is completed. At the end of each period, the budget amounts for the period just completed are deleted, the amounts for the remaining periods of the old budget are revised as necessary, and budgeted amounts for the new period are added. Thus, a twelve-month budget is rolled forward as each period is completed.
2.b. The preparation of a continuous budget would force WestWood's management to
engage in planning on an almost continuous basis. Shorter planning cycles increase the chances that management will anticipate and give attention to problem situations earlier than would otherwise be the case. Thus, planning would be enhanced in all of the functional areas and there would not be any periods when a budget did not exist.

Blocher, Stout, Cokins, Chen, Cost Management, 4/e 8-74 ©The McGraw-Hill Companies 2008
8-66 Cash Budget (45-50 minutes) Quarters I II III IV Year Cash balance, beginning $30,000 $38,000 $30,520 $30,770 $30,000 Plus: Cash receipts: Collections from customers 425,000 437,000 479,480 460,000 1,801,480 Equipment disposal 0 0 0 5,000 5,000 Total cash available = (A) $455,000 $475,000 $510,000 $495,770 $1,836,480 Cash disbursements: Raw material purchases $200,000 $220,000 $250,000 $270,000 $940,000 Payroll 117,000 120,000 115,000 122,000 474,000 S, G, & A expenses 60,000 62,000 58,000 64,000 244,000 Equipment purchase 20,000 30,000 30,000 0 80,000 Bond interest (@9%) 0 11,250 0 11,250 22,500 Bond sinking fund payment 0 20,000 0 0 20,000 Income taxes 20,000 21,000 25,000 18,000 84,000 Total cash disbursements, prior to financing = (B) $417,000 $484,250 $478,000 $485,250 $1,864,500 Plus: Minimum cash balance $30,000 $30,000 $30,000 $30,000 $30,000 Total cash needed = (C) $447,000 $514,250 $508,000 $515,250 $1,894,500 Excess cash (cash deficiency), prior to financing (D) = (A) - (C) $8,000 ($39,250) $2,000 ($19,480) $(58,020) Financing: Short-term borrowing $0 $41,000 $0 $22,000 $63,000 Repayment (principal) $0 $0 $0 $0 $0 Interest (@12%) $0 ($1,230) ($1,230) ($1,890) ($4,350) Total Effects of Financing = (E) $0 $39,770 ($1,230) $20,110 $58,650 Ending cash balance = (A) - (B) + (E) $38,000 $30,520 $30,770 $30,630 $30,630
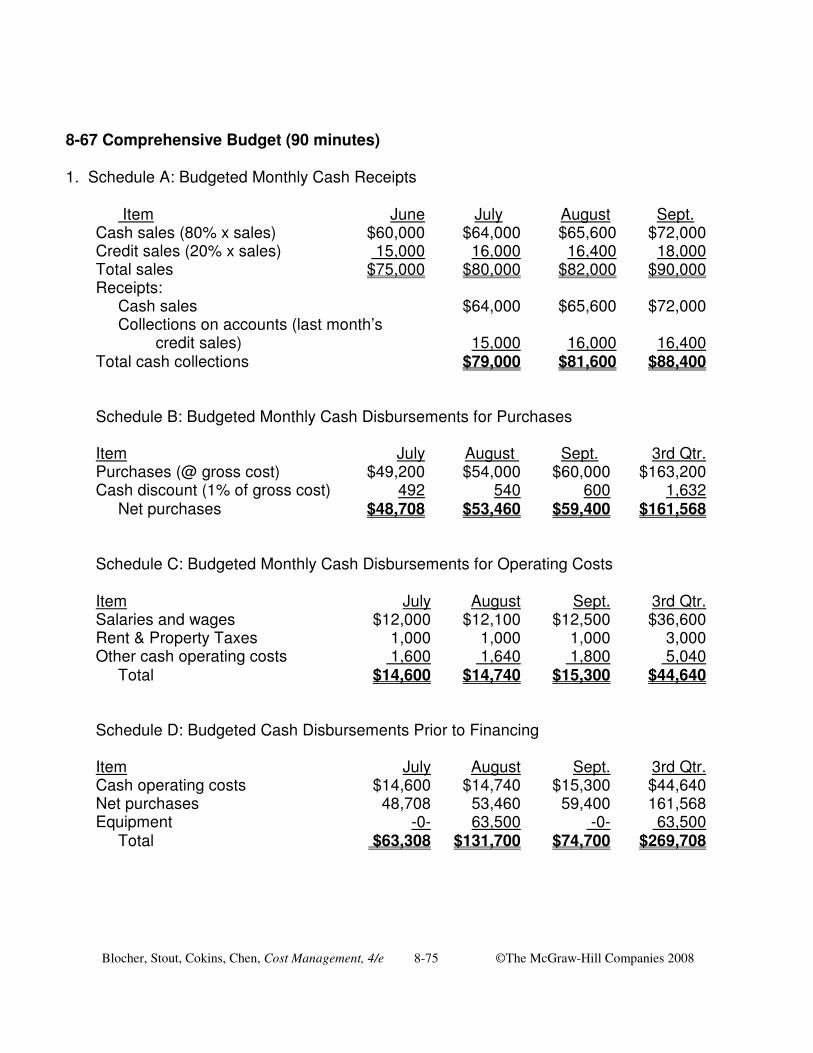
Blocher, Stout, Cokins, Chen, Cost Management, 4/e 8-75 ©The McGraw-Hill Companies 2008
8-67 Comprehensive Budget (90 minutes) 1. Schedule A: Budgeted Monthly Cash Receipts
Item June July August Sept. Cash sales (80% x sales) $60,000 $64,000 $65,600 $72,000 Credit sales (20% x sales) 15,000 16,000 16,400 18,000 Total sales $75,000 $80,000 $82,000 $90,000 Receipts: Cash sales $64,000 $65,600 $72,000 Collections on accounts (last month’s credit sales) 15,000 16,000 16,400 Total cash collections $79,000 $81,600 $88,400
Schedule B: Budgeted Monthly Cash Disbursements for Purchases Item July August Sept. 3rd Qtr. Purchases (@ gross cost) $49,200 $54,000 $60,000 $163,200 Cash discount (1% of gross cost) 492 540 600 1,632 Net purchases $48,708 $53,460 $59,400 $161,568 Schedule C: Budgeted Monthly Cash Disbursements for Operating Costs Item July August Sept. 3rd Qtr. Salaries and wages $12,000 $12,100 $12,500 $36,600 Rent & Property Taxes 1,000 1,000 1,000 3,000 Other cash operating costs 1,600 1,640 1,800 5,040 Total $14,600 $14,740 $15,300 $44,640 Schedule D: Budgeted Cash Disbursements Prior to Financing Item July August Sept. 3rd Qtr. Cash operating costs $14,600 $14,740 $15,300 $44,640 Net purchases 48,708 53,460 59,400 161,568 Equipment -0- 63,500 -0- 63,500 Total $63,308 $131,700 $74,700 $269,708
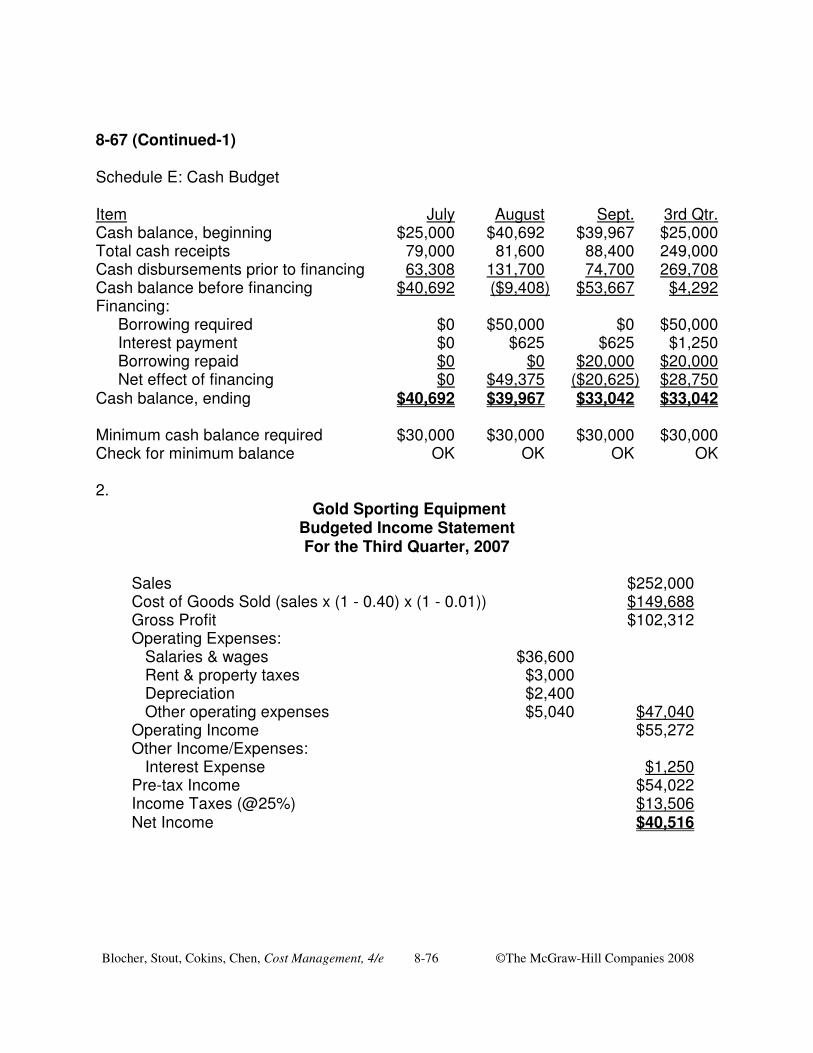
Blocher, Stout, Cokins, Chen, Cost Management, 4/e 8-76 ©The McGraw-Hill Companies 2008
8-67 (Continued-1) Schedule E: Cash Budget Item July August Sept. 3rd Qtr. Cash balance, beginning $25,000 $40,692 $39,967 $25,000 Total cash receipts 79,000 81,600 88,400 249,000 Cash disbursements prior to financing 63,308 131,700 74,700 269,708 Cash balance before financing $40,692 ($9,408) $53,667 $4,292 Financing: Borrowing required $0 $50,000 $0 $50,000 Interest payment $0 $625 $625 $1,250 Borrowing repaid $0 $0 $20,000 $20,000 Net effect of financing $0 $49,375 ($20,625) $28,750 Cash balance, ending $40,692 $39,967 $33,042 $33,042 Minimum cash balance required $30,000 $30,000 $30,000 $30,000 Check for minimum balance OK OK OK OK 2.
Gold Sporting Equipment Budgeted Income Statement For the Third Quarter, 2007
Sales $252,000 Cost of Goods Sold (sales x (1 - 0.40) x (1 - 0.01)) $149,688 Gross Profit $102,312 Operating Expenses: Salaries & wages $36,600 Rent & property taxes $3,000 Depreciation $2,400 Other operating expenses $5,040 $47,040 Operating Income $55,272 Other Income/Expenses: Interest Expense $1,250 Pre-tax Income $54,022 Income Taxes (@25%) $13,506 Net Income $40,516
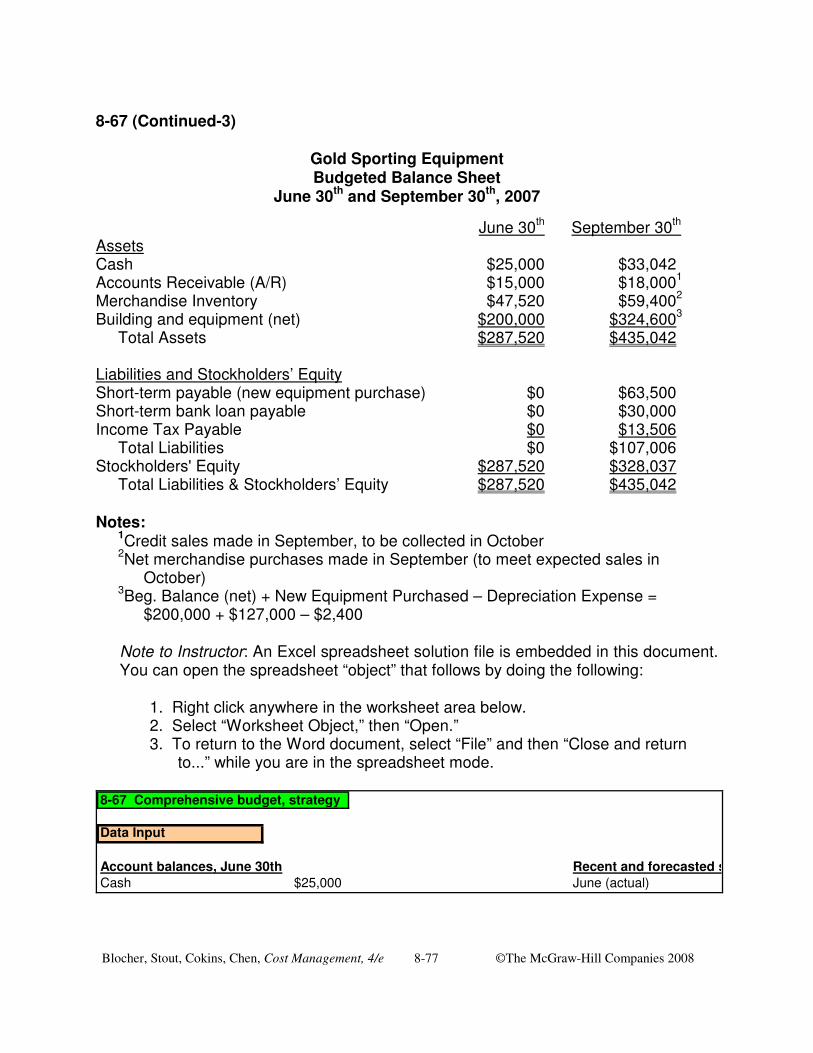
Blocher, Stout, Cokins, Chen, Cost Management, 4/e 8-77 ©The McGraw-Hill Companies 2008
8-67 (Continued-3)
Gold Sporting Equipment Budgeted Balance Sheet
June 30th and September 30th, 2007
June 30th September 30th Assets Cash $25,000 $33,042 Accounts Receivable (A/R) $15,000 $18,0001
Merchandise Inventory $47,520 $59,4002
Building and equipment (net) $200,000 $324,6003
Total Assets $287,520 $435,042 Liabilities and Stockholders’ Equity Short-term payable (new equipment purchase) $0 $63,500 Short-term bank loan payable $0 $30,000 Income Tax Payable $0 $13,506 Total Liabilities $0 $107,006 Stockholders' Equity $287,520 $328,037 Total Liabilities & Stockholders’ Equity $287,520 $435,042 Notes: 1Credit sales made in September, to be collected in October 2Net merchandise purchases made in September (to meet expected sales in
October) 3Beg. Balance (net) + New Equipment Purchased – Depreciation Expense =
$200,000 + $127,000 – $2,400
Note to Instructor: An Excel spreadsheet solution file is embedded in this document. You can open the spreadsheet “object” that follows by doing the following:
1. Right click anywhere in the worksheet area below. 2. Select “Worksheet Object,” then “Open.” 3. To return to the Word document, select “File” and then “Close and return
to...” while you are in the spreadsheet mode. 8-67 Comprehensive budget, strategy
Data Input
Account balances, June 30th Recent and forecasted salesCash $25,000 June (actual)

Blocher, Stout, Cokins, Chen, Cost Management, 4/e 8-78 ©The McGraw-Hill Companies 2008
8-67 (Continued-4) 3. Gold needs to borrow to finance part of the payment for the new equipment during the
third quarter. In addition, fluctuations in business may require the firm to seek short-term loans. Payrolls, materials, and supplies have to be paid before collections from customers. In anticipation of rising sales in the coming season, Gold may experience a peak demand for cash to pay for the increased purchases of materials, payrolls, and supplies while collections from customers may be at the lowest point of the year as the firm comes out of a low-activity season.
A short-term financing arrangement is the best way to meet seasonal cash needs. A
short-term loan can be repaid as soon as activities in cash collections increase and payrolls and purchases of materials and supplies decrease as the firm enters into a slow season. Although the firm may have to pay a higher cost for short-term borrowing, the total financing cost likely would be lower than if the firm raised sufficient funds through either issuing long-term bonds or capital stock to meet peak demands for cash. A bond requires interest payments whether or not the firm uses the funds raised from the bond in operations. Additional capital stock is not without cost. Management needs to earn a desired return on equity to satisfy investors.
Furthermore, studies have shown that management is prone to be careless in spending
when abundant funds are available. 4. The scenarios described involved many simplified assumptions in order to make the
problem managable. Among possible complicating factors are:
� No bad debts are considered. � Customers always make payment as prescribed in sales terms. � Within a given month cash inflows are in time to meet cash outflows. It is
conceivable that the bulk of cash inflows occur toward the end of the month while payments need to go out at the beginning of the month.
� Cash customers do not use bank credit cards for the purchases.
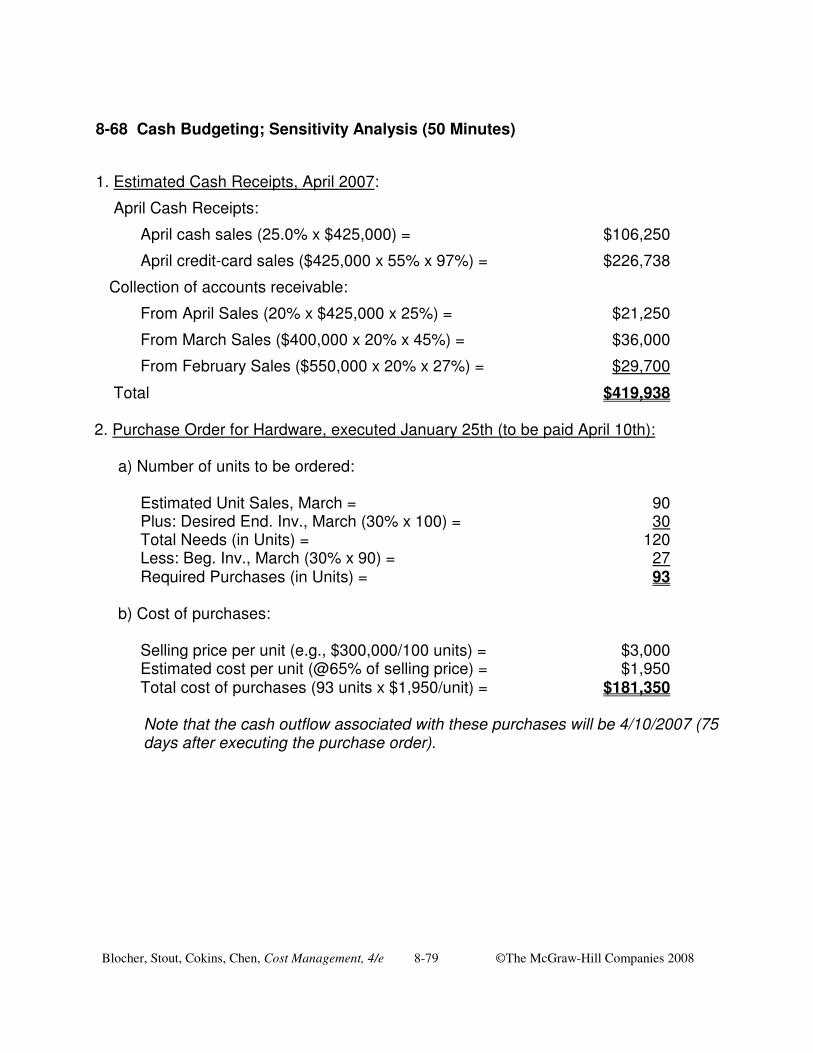
Blocher, Stout, Cokins, Chen, Cost Management, 4/e 8-79 ©The McGraw-Hill Companies 2008
8-68 Cash Budgeting; Sensitivity Analysis (50 Minutes)
1. Estimated Cash Receipts, April 2007:
April Cash Receipts:
April cash sales (25.0% x $425,000) = $106,250
April credit-card sales ($425,000 x 55% x 97%) = $226,738
Collection of accounts receivable:
From April Sales (20% x $425,000 x 25%) = $21,250
From March Sales ($400,000 x 20% x 45%) = $36,000
From February Sales ($550,000 x 20% x 27%) = $29,700
Total $419,938 2. Purchase Order for Hardware, executed January 25th (to be paid April 10th): a) Number of units to be ordered:
Estimated Unit Sales, March = 90 Plus: Desired End. Inv., March (30% x 100) = 30 Total Needs (in Units) = 120 Less: Beg. Inv., March (30% x 90) = 27 Required Purchases (in Units) = 93 b) Cost of purchases:
Selling price per unit (e.g., $300,000/100 units) = $3,000 Estimated cost per unit (@65% of selling price) = $1,950 Total cost of purchases (93 units x $1,950/unit) = $181,350
Note that the cash outflow associated with these purchases will be 4/10/2007 (75 days after executing the purchase order).
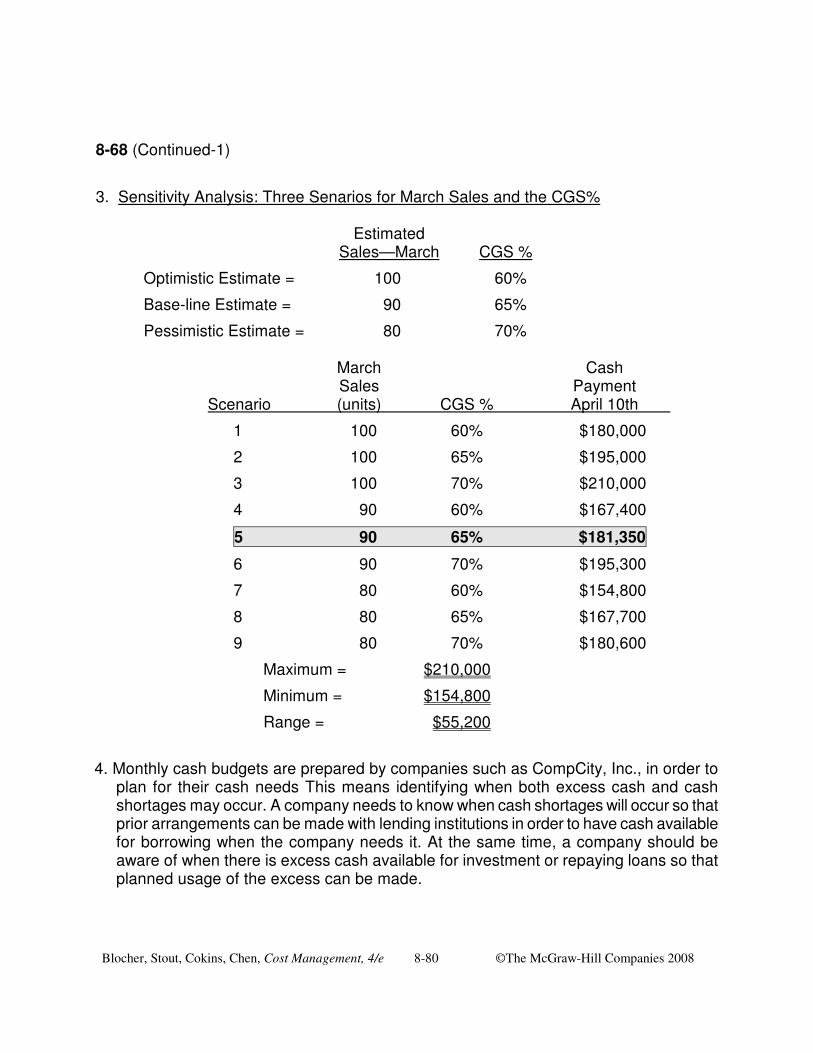
Blocher, Stout, Cokins, Chen, Cost Management, 4/e 8-80 ©The McGraw-Hill Companies 2008
8-68 (Continued-1)
3. Sensitivity Analysis: Three Senarios for March Sales and the CGS% Estimated Sales—March CGS %
Optimistic Estimate = 100 60%
Base-line Estimate = 90 65%
Pessimistic Estimate = 80 70% March Cash Sales Payment Scenario (units) CGS % April 10th
1 100 60% $180,000
2 100 65% $195,000
3 100 70% $210,000
4 90 60% $167,400
5 90 65% $181,350
6 90 70% $195,300
7 80 60% $154,800
8 80 65% $167,700
9 80 70% $180,600
Maximum = $210,000
Minimum = $154,800
Range = $55,200
4. Monthly cash budgets are prepared by companies such as CompCity, Inc., in order to plan for their cash needs This means identifying when both excess cash and cash shortages may occur. A company needs to know when cash shortages will occur so that prior arrangements can be made with lending institutions in order to have cash available for borrowing when the company needs it. At the same time, a company should be aware of when there is excess cash available for investment or repaying loans so that planned usage of the excess can be made.
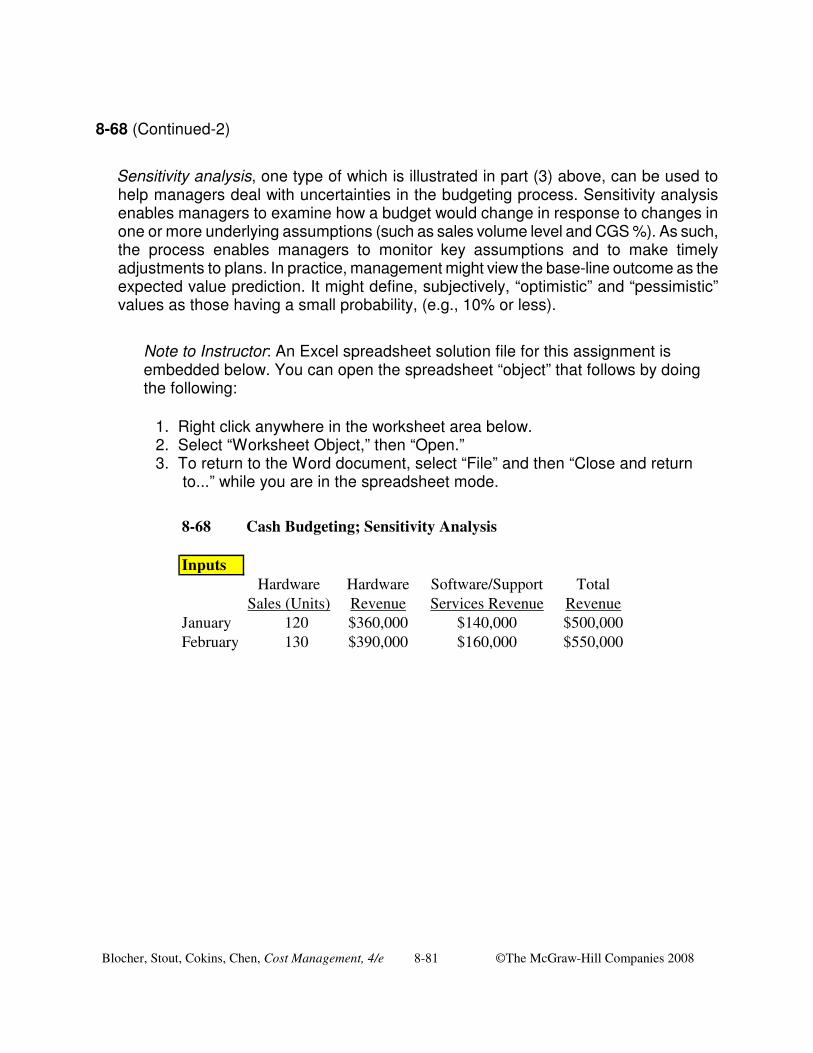
Blocher, Stout, Cokins, Chen, Cost Management, 4/e 8-81 ©The McGraw-Hill Companies 2008
8-68 (Continued-2)
Sensitivity analysis, one type of which is illustrated in part (3) above, can be used to help managers deal with uncertainties in the budgeting process. Sensitivity analysis enables managers to examine how a budget would change in response to changes in one or more underlying assumptions (such as sales volume level and CGS %). As such, the process enables managers to monitor key assumptions and to make timely adjustments to plans. In practice, management might view the base-line outcome as the expected value prediction. It might define, subjectively, “optimistic” and “pessimistic” values as those having a small probability, (e.g., 10% or less).
Note to Instructor: An Excel spreadsheet solution file for this assignment is embedded below. You can open the spreadsheet “object” that follows by doing the following:
1. Right click anywhere in the worksheet area below. 2. Select “Worksheet Object,” then “Open.” 3. To return to the Word document, select “File” and then “Close and return
to...” while you are in the spreadsheet mode.
8-68 Cash Budgeting; Sensitivity Analysis
InputsHardware Hardware Software/Support Total
Sales (Units) Revenue Services Revenue RevenueJanuary 120 $360,000 $140,000 $500,000February 130 $390,000 $160,000 $550,000
Blocher, Stout, Cokins, Chen, Cost Management, 4/e 8-82 ©The McGraw-Hill Companies 2008
Check Figures: Chapter 8
8-31 Base case (5%) for March: $5,500
8-32 No check figure
8-33 No check figure
8-34 1(a) = $115,000; 2(b) = $110,250; 3 = 37.25%
8-35 1 (Nov.) = $123,861; 2 (Nov.) = $183,750
8-36 Production, Qtr. 2 = 37,600 units; Purchases, Qtr. 2 = 111,480 lbs.
8-37 1 = 37.25%; 2 = 18.43%
8-38 1 = 450,000; 2 = 460,000; 3 = 930,000
8-39 Ending cash balances: $99,500 (Nov.); $50,490 (Dec.)
8-40 $26,000
8-41 Cash balance before financing = $2,250
8-42 2. Qtr. I: Total cash available = $381; Salaries & benefits = $335; Total financing effects = $54.
8-43 1 = $84,400; 2 = $230.000
8-44 1 = $152,000; 2 = $172,500; 3 = $155,000; 4(a) = $169,500, 4(b) = $102,500
8-45 No check figure
8-46 1. $86,082
8-47 Total cash receipts: September = $86,082; October = $88,141
8-48 1. $2,808,000; 2. cost/carton delivered = $2.34; 3 = $1,051,000 (expected cost savings, January 2007)
8-49 2. Budgeted cost-driver rates, Data entry—Requisitions: $1.20 (Jan.), $1.176 (Feb.), and $1.1525 (March)
8-50 1 = $91,200; 2 = $299,400; 3 = $234,000
8-51 1 = $0 (no budgeted overhead for senior consultants); 2 = 16; 3 = $163,700 (total compensation)
8-52 No check figure
8-53 No check figure
8-54 No check figure
8-55 No check figure
8-56 1 = $1,800,000 (C12); 2 = 11,900 (C12); 3 = $384,800 (budgeted purchases, RM1); 4 = $1,273,750; 5 = $580,830 (total budgeted overhead); 6 = $2,346,900 (CGS), $55,280 (Ending Inventory); 7 = $645,000; 8 = $472,860 (after-tax income).
Blocher, Stout, Cokins, Chen, Cost Management, 4/e 8-83 ©The McGraw-Hill Companies 2008
8-57 1 = $1,920,000 (C12); 2 = 11,900 (C12); 3 = $528,800 (budgeted purchases, RM1); 4 = $1,948,750; 5 = $753,630 (total budgeted overhead); 6 = $3,433,113 (CGS), $50,002 (Ending Inventory); 7 = $645,000; 8 = $649,132 (after-tax income)
8-58 1 = $1,800,000 (C12); 2 = 11,900 (C12); 3 = $342,900 (budgeted purchases, RM1); 4 = $1,078,500; 5 = $293,472 (budgeted variable overhead), $245,579 (budgeted fixed overhead); 6 = $2,057,200 (CGS), $45,596 (Ending Inventory); 7 = $645,000; 8 = $646,680 (after-tax income)
8-59 1 = $225,000 (May); 2 = $285,379; 3 = $333,876; 4 = $368,250 (net accounts receivable)
8-60 1a = 176,000 units; 1b = $32,736,000; 2 = $22,040,291 (CGS); 3 = reduced investment in working capital = $2,113,329
8-61 1 = $206,680; 2 = $83,600; 3 = $10,000; 4 = $120,000; 5 = 153,000 units; 6 = $153,000
8-62 1. Total operating cash inflows, 2009 = $709,082; Total operating cash outflows: $461,000 (2008), $603,925 (2009); Budgeted ending cash balance, 2009 = $10,057.
8-63 1 = $372,628; 2: cost-reduction rate = 43%
8-64 No check figure
8-65 No check figure
8-66 Qtr. 1: Cash available = $455,000; bond sinking-fund payment = $0; Excess cash, prior to financing transactions = $8,000; total effects of financing = $0.
Qtr. IV: Beginning cash balance = $30,770; payroll = $122,000; total cash needs = $515,250; total effect of financing = $20,110; ending cash balance = $30,630
8-67 1. Cash receipts: $79,000 (July); Cash Disbursements for Purchases: $59,400 (Sept.); Cash Disbursements for Operating Costs: $14,600 (July); Ending Cash Balance: $40,692 (July), $39,967 (August), $33,042 (Sept.).
2. Net Income = $40,516; Sept. 30th Balances: Total Assets = $435,042; Total Liabilities = $107, 006.
8-68 1 = $419,938; 2a = 93 units; 2b = $181,350; 3: Budgeted cash payment on April 10th when March Sales = 100 units and CGS % = 60%, is $180,000.


