
Ch6_101221-LO
53
6 .1 Gr at x ctations: shr v ort-caddo 2030 Mast r Lan Living in Shr eveport- Caddo: Neighborhoods and Housing h 1 2 3 4 4 5 5 6 7 8 9 10 11 12 13 “ Our neighborhoods are physicallybeautiful,mixed- income,raciallyandage diverse,community-minded andinterlinkedwithallother neighborhoods.” pel eme:
-
Upload
goody-clancy-planning-urban-design -
Category
Documents
-
view
220 -
download
0
Transcript of Ch6_101221-LO

8/3/2019 Ch6_101221-LO
http://slidepdf.com/reader/full/ch6101221-lo 1/53
6 .1G r a t x c t a t i o n s : s h r v o r t - c a d d o 2 0 3 0 M a s t r L a n
Living in Shreveport-Caddo: Neighborhoods
and Housing
h
1
2
34 4
5 5
6
7
8
9
10
11
12
13
“Ourneighborhoodsare
physicallybeautiful,mixed-
income,raciallyandage
diverse,community-minded
andinterlinkedwithallother
neighborhoods.”
pel eme:

8/3/2019 Ch6_101221-LO
http://slidepdf.com/reader/full/ch6101221-lo 2/53
6 | L i v i n g i n S h v p o t - c a d d o : n i g h b o h o o d S a n d h o S i n g
6 . 2 G r a t x c t a t i o n s : s h r v o r t - c a d d o 2 0 3 0 M a s t r L a n
Chapter Summary
This chapter focuses on five issues: neighborhood form and types; neighborhood quality
of life; neighborhood planning and participation in land use decisions; neighborhood
commercial districts and resident access to retail; and overall housing markets and
housing needs, including providing safe and decent housing to residents of all incomes.
The discussion on neighborhood form and types analyzes the urban, suburban, exurban and
rural areas and categorizes neighborhoods based on the different conditions affecting quality of
life and new development. Enhancement of quality of life focuses especially on code enforcement
and on creating a system to give residents a more structured role in land use decision making.
Access to neighborhood-serving retail was an important issue for many residents and this
chapter provides market evaluations at Youree Drive and 70th Street and for potential “urban
villages” at locations in the areas of Pines Road/I-20, Mansfield Road/Bert Kouns, and MLK/
Blanchard Highway. The chapter includes an analysis of housing development and affordablehousing needs, with recommendations for changes in approach. More detailed revitalization
neighborhood strategies are discussed at length in Chapter 11 and urban design issues are
discussed in Chapter 12.
Strategies and actions for neighborhoods and housing include:
• Establish an administrative court to deal with code enforcement and quality of life violations
• Create a series of district and area plans to engage residents and other stakeholders in
proactive planning connected to the Master Plan and its policies.
• In a new Unified Development Code, establish design standards for compatible infill
development and provide for compact centers with neighborhood-serving retail.
• Create a community-based Housing Policy Advisory Council, including representatives of
government staff, neighborhood organizations, for-profit and non-profit housing developers,
realtors, and representatives of economic development organizations.
• Establish a rental housing code and strengthen city building codes to meet the minimum
standards in the federal Section 8 code.
8/3/2019 Ch6_101221-LO
http://slidepdf.com/reader/full/ch6101221-lo 3/53
6 | L i v i n g i n S h v p o t - c a d d o : n i g h b o h o o d S a n d h o S i n g
6 . 3G r a t x c t a t i o n s : s h r v o r t - c a d d o 2 0 3 0 M a s t r L a n
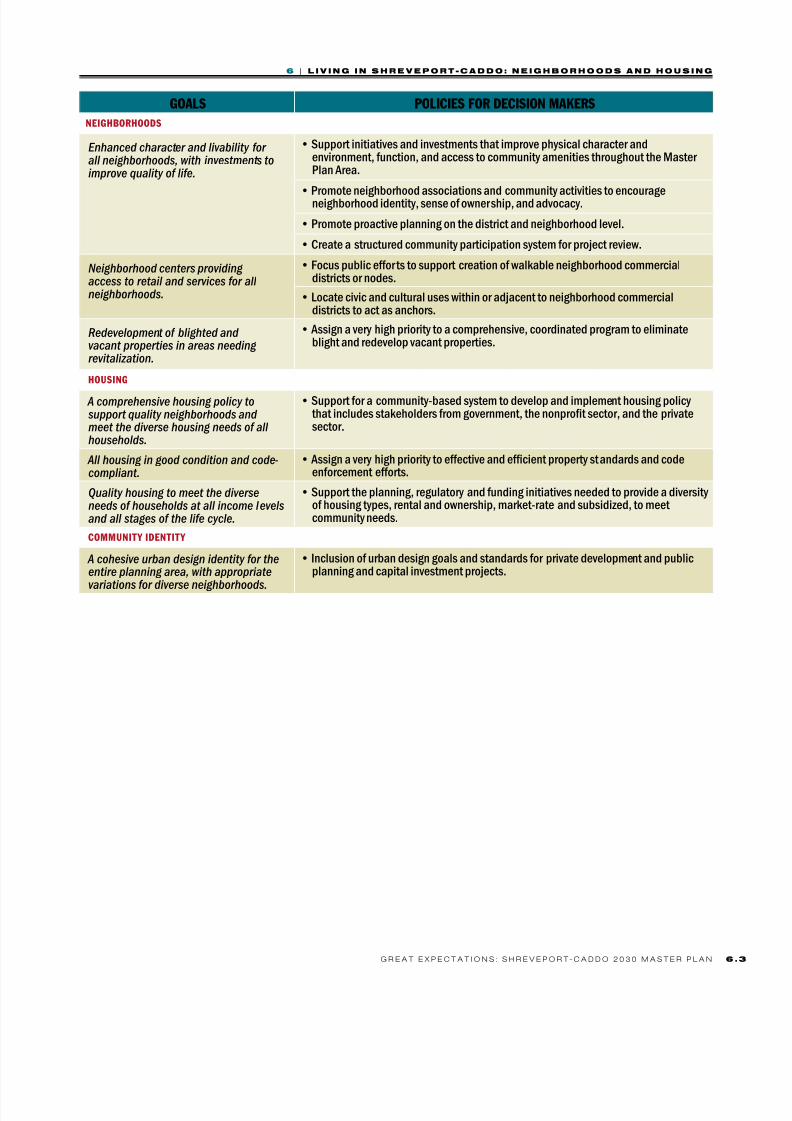
GOALS POLICIES FOR DECISION MAKERS
NEIGhbORhOODS
Enhanced character and livability for all neighborhoods, with investments toimprove quality of life.
• Support initiatives and investments that improve physical character andenvironment, function, and access to community amenities throughout the Master Plan Area.
• Promote neighborhood associations and community activities to encourageneighborhood identity, sense of ownership, and advocacy.
• Promote proactive planning on the district and neighborhood level.
• Create a structured community participation system for project review.
Neighborhood centers providing access to retail and services for all neighborhoods.
• Focus public efforts to support creation of walkable neighborhood commercialdistricts or nodes.
• Locate civic and cultural uses within or adjacent to neighborhood commercialdistricts to act as anchors.
Redevelopment of blighted and vacant properties in areas needing revitalization.
• Assign a very high priority to a comprehensive, coordinated program to eliminateblight and redevelop vacant properties.
hOuSING
A comprehensive housing policy tosupport quality neighborhoods and meet the diverse housing needs of all households.
• Support for a community-based system to develop and implement housing policy that includes stakeholders from government, the nonprot sector, and the privatesector.
All housing in good condition and code- compliant.
• Assign a very high priority to effective and efcient property standards and codeenforcement efforts.
Quality housing to meet the diverseneeds of households at all income levelsand all stages of the life cycle.
• Support the planning, regulatory and funding initiatives needed to provide a diversity of housing types, rental and ownership, market-rate and subsidized, to meet community needs.
COMMuNIty IDENtIty
A cohesive urban design identity for theentire planning area, with appropriate
variations for diverse neighborhoods.
• Inclusion of urban design goals and standards for private development and publicplanning and capital investment projects.
8/3/2019 Ch6_101221-LO
http://slidepdf.com/reader/full/ch6101221-lo 4/53
6 | L i v i n g i n S h v p o t - c a d d o : n i g h b o h o o d S a n d h o S i n g
6 . 4 G r a t x c t a t i o n s : s h r v o r t - c a d d o 2 0 3 0 M a s t r L a n
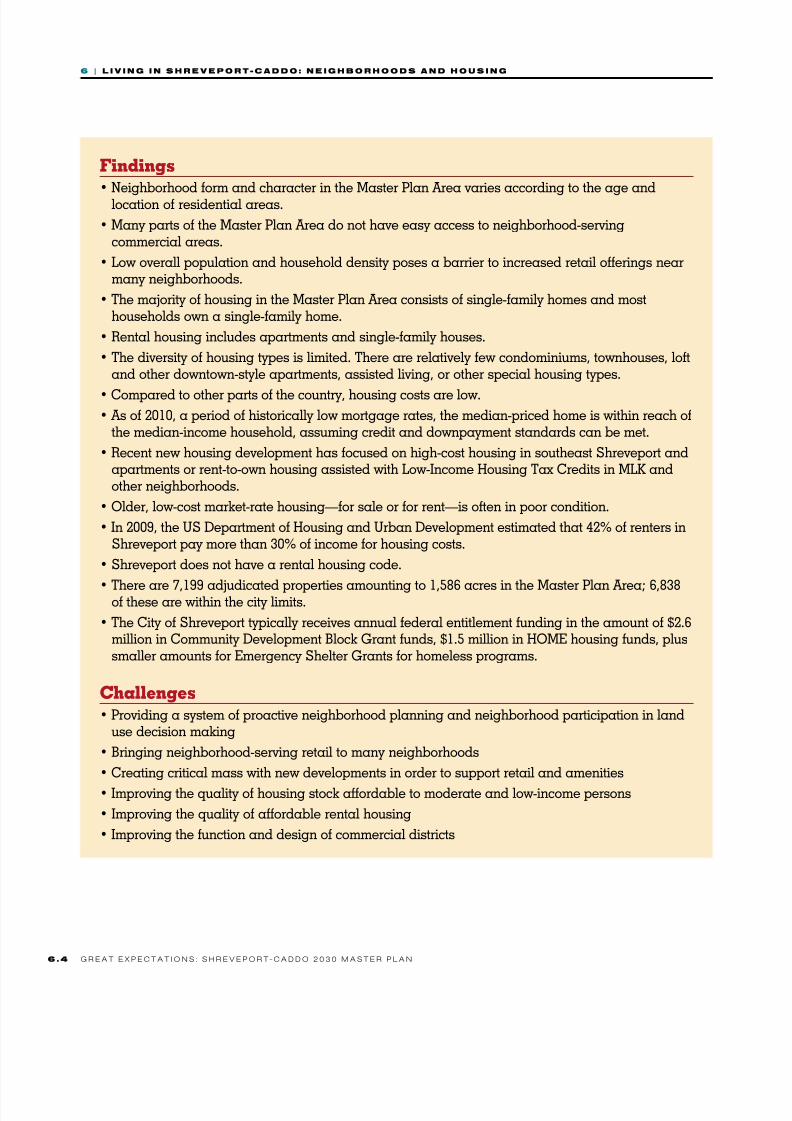
Findings• Neighborhood form and character in the Master Plan Area varies according to the age and
location of residential areas.
• Many parts of the Master Plan Area do not have easy access to neighborhood-servingcommercial areas.
• Low overall population and household density poses a barrier to increased retail offerings nearmany neighborhoods.
• The majority of housing in the Master Plan Area consists of single-family homes and mosthouseholds own a single-family home.
• Rental housing includes apartments and single-family houses.
• The diversity of housing types is limited. There are relatively few condominiums, townhouses, loftand other downtown-style apartments, assisted living, or other special housing types.
• Compared to other parts of the country, housing costs are low.• As of 2010, a period of historically low mortgage rates, the median-priced home is within reach of
the median-income household, assuming credit and downpayment standards can be met.
• Recent new housing development has focused on high-cost housing in southeast Shreveport andapartments or rent-to-own housing assisted with Low-Income Housing Tax Credits in MLK andother neighborhoods.
• Older, low-cost market-rate housing—for sale or for rent—is often in poor condition.
• In 2009, the US Department of Housing and Urban Development estimated that 42% of renters inShreveport pay more than 30% of income for housing costs.
• Shreveport does not have a rental housing code.
• There are 7,199 adjudicated properties amounting to 1,586 acres in the Master Plan Area; 6,838of these are within the city limits.
• The City of Shreveport typically receives annual federal entitlement funding in the amount of $2.6million in Community Development Block Grant funds, $1.5 million in HOME housing funds, plussmaller amounts for Emergency Shelter Grants for homeless programs.
Challenges• Providing a system of proactive neighborhood planning and neighborhood participation in land
use decision making
• Bringing neighborhood-serving retail to many neighborhoods
• Creating critical mass with new developments in order to support retail and amenities
• Improving the quality of housing stock affordable to moderate and low-income persons
• Improving the quality of affordable rental housing
• Improving the function and design of commercial districts

8/3/2019 Ch6_101221-LO
http://slidepdf.com/reader/full/ch6101221-lo 5/53
6 | L i v i n g i n S h v p o t - c a d d o : n i g h b o h o o d S a n d h o S i n g
6 . 5G r a t x c t a t i o n s : s h r v o r t - c a d d o 2 0 3 0 M a s t r L a n
a. curre cs
Neighborhoods of ChoiCe with
deCeNt housiNg for All
Good neighborhoods are the bedrock of quality of life,
and quality of life is a critical determinant of what makes
metropolitan areas successful in the 21st century. Businesses
locate where people want to be, and good neighborhoods,
along with a great open-space system and a vibrant
cultural life, rank among the key attractions that any
city and metropolitan area can offer. As jobs increasingly
follow people in the 21st century, rather than the other
way around, investing in a high quality of life is also an
economic development strategy.
What makes a good neighborhood? On a basic level, good
neighborhoods are safe, clean and healthy, supported
by well-maintained and well-run public services. They
are comfortable and attractive, provide good access and
circulation internally, as well as multiple transportation
choices for travel to and from the neighborhood. To many
people, good city neighborhoods have the advantage of
diversity, whether among the people who live there or
the variety of uses and things to do. Ultimately, good
neighborhoods are about people and connections. The
physical and social organization of a neighborhood shouldencourage people to get to know and trust one another.
Over time, neighborhoods develop traditions expressed in
care for public places such as a school or park, in festivals,
and in holiday activities.
During the visioning process for this master plan, the
majority of Shreveporters were clear that they want to see
“smart growth” development policies and that they want
every neighborhood to be a “neighborhood of choice.” At
its foundation, smart growth means focusing resources and
development in the city core, rather than promoting sprawl.
In order to be successful at smart growth, each neighborhood
within the city, regardless of household income level, should
provide safety, decent and sanitary housing, infrastructure
systems that are well-maintained, environmental and
aesthetic amenities such as street trees, and easy access to
parks, public spaces, and neighborhood retail and services.
These are the characteristics of neighborhoods of choice.
Outside the city limits, many rural and exurban locations
are not neighborhoods in the traditional sense. Expectations
for nearby services and amenities are typically limited,
as residents have made a choice to live outside theneighborhood context of a city or suburb. This is particularly
the case with development along rural road frontage and
small, scattered subdivisions surrounded by rural areas.
However, in some cases exurban development takes the
form of larger subdivisions that have more of a suburban
neighborhood character, and residents expect future
annexation by the City. In the context of smart growth and
neighborhoods of choice, development in the unincorporated
parts of the Master Plan Area should be channeled to form
compact nodes that can grow to function as village centers.
Neighborhoods
The 308 square miles of the Shreveport-Caddo Master Plan
Area include the City of Shreveport (approximately 124
square miles) and a ve-mile planning and zoning jurisdiction
area in unincorporated areas of Caddo Parish (approximately
184 square miles). As noted in Chapter 3, development
patterns vary greatly within the Master Plan Area, from the
urban character of much of the city “within the loop” to the
complex mix of suburban, exurban and rural areas “outside
the loop.”
Map 6.1 InsIde/outsIde the loop
Sources: NLCOG, Goody Clancy
8/3/2019 Ch6_101221-LO
http://slidepdf.com/reader/full/ch6101221-lo 6/53
6 | L i v i n g i n S h v p o t - c a d d o : n i g h b o h o o d S a n d h o S i n g
6 . 6 G r a t x c t a t i o n s : s h r v o r t - c a d d o 2 0 3 0 M a s t r L a n
In recent decades, the Master Plan Area has been
experiencing the phenomenon of sprawl without growth.
Even though the population has remained stable and
the Shreveport-Caddo area added few new households,large areas in the urban center have been abandoned
for new development at the edges of the city and in
the unincorporated area outside the city limits. Overall
density in the city has decreased over the last generation
from 2,124 persons per square mile in 1980 to less than
1,700 persons per square mile in 2009. During the same
period, the city annexed over 25 square miles of land,
bringing in new subdivisions that arose in the periphery
of the city and keeping the city’s population stable at
around 200,000 people.
The Master Plan Area is divided into 72 named areas—
residential neighborhoods and commercial or industrial
districts. Residents often identify most strongly with
their particular neighborhood rather than with the
city as a whole. The form, character and condition of
neighborhoods reect the economic, racial, political,
and development history of Shreveport. Neighborhoods
as discussed in this section of the master plan are made
up of the residential units, parks and public spaces, and
local commercial areas that primarily serve neighborhood
residents. Areas that are centers of non-residential land usesare discussed in Chapter 7 and Chapter 12.
Neighborhood form and character
Neighborhood character is a composite of many features
that together give an area its distinctive physical form
and appearance. The relationship between structures
and public spaces often molds social interactions, use
of public space and sense of community. The physical
environment or envelope in which people live does
not determine what people do in an area, but it can
set limits on what is possible or what they are likely
to do. (For example, places without sidewalks do not
encourage people to walk.) Features that help dene a
neighborhood’s character include streets and sidewalks,
the scale of buildings and public spaces, internal and
external connections, building materials, architectural
styles, land uses, the number and type of public and
social spaces, historic features, and development types.
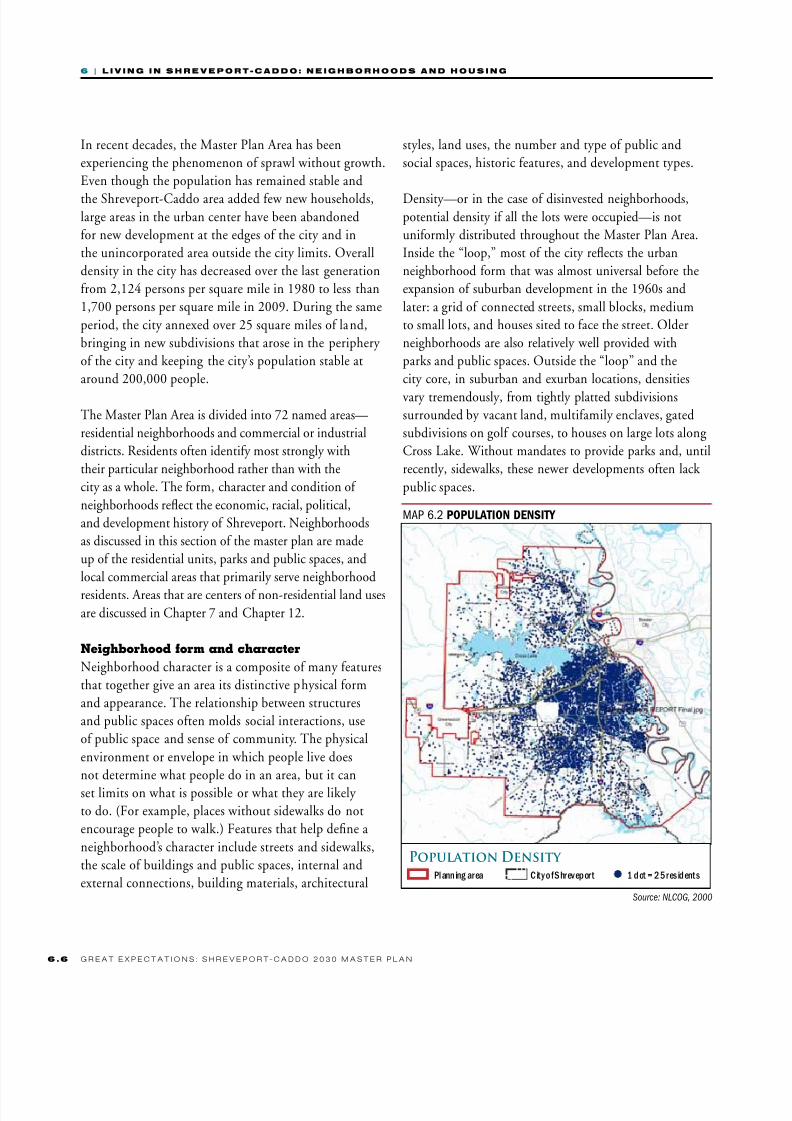
Density—or in the case of disinvested neighborhoods,potential density if all the lots were occupied—is not
uniformly distributed throughout the Master Plan Area.
Inside the “loop,” most of the city reects the urban
neighborhood form that was almost universal before the
expansion of suburban development in the 1960s and
later: a grid of connected streets, small blocks, medium
to small lots, and houses sited to face the street. Older
neighborhoods are also relatively well provided with
parks and public spaces. Outside the “loop” and the
city core, in suburban and exurban locations, densities
vary tremendously, from tightly platted subdivisionssurrounded by vacant land, multifamily enclaves, gated
subdivisions on golf courses, to houses on large lots along
Cross Lake. Without mandates to provide parks and, until
recently, sidewalks, these newer developments often lack
public spaces.
Map 6.2 populatIon densIty
Population Density Pl anning area City of Shreveport 1 dot = 25 residents
Source: NLCOG, 2000
8/3/2019 Ch6_101221-LO
http://slidepdf.com/reader/full/ch6101221-lo 7/53
6 | L i v i n g i n S h v p o t - c a d d o : n i g h b o h o o d S a n d h o S i n g
6 . 7G r a t x c t a t i o n s : s h r v o r t - c a d d o 2 0 3 0 M a s t r L a n
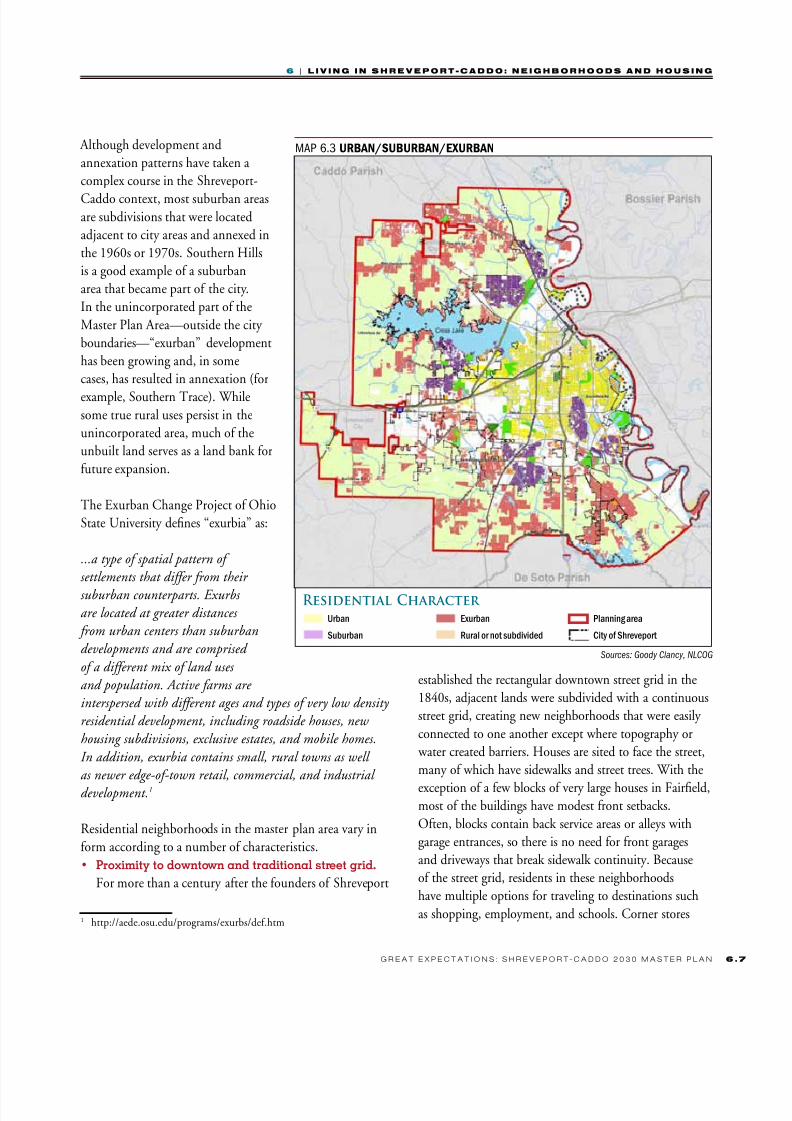
Although development and
annexation patterns have taken a
complex course in the Shreveport-
Caddo context, most suburban areasare subdivisions that were located
adjacent to city areas and annexed in
the 1960s or 1970s. Southern Hills
is a good example of a suburban
area that became part of the city.
In the unincorporated part of the
Master Plan Area—outside the city
boundaries—“exurban” development
has been growing and, in some
cases, has resulted in annexation (for
example, Southern Trace). Whilesome true rural uses persist in the
unincorporated area, much of the
unbuilt land serves as a land bank for
future expansion.
The Exurban Change Project of Ohio
State University denes “exurbia” as:
...atypeofspatialpatternof
settlementsthatdifferfromtheir
suburbancounterparts.Exurbs
arelocatedatgreaterdistances
fromurbancentersthansuburban
developmentsandarecomprised
ofadifferentmixoflanduses
andpopulation.Activefarmsare
interspersedwithdifferentagesandtypesofverylowdensity
residentialdevelopment,includingroadsidehouses,new
housingsubdivisions,exclusiveestates,andmobilehomes.
Inaddition,exurbiacontainssmall,ruraltownsaswell
asneweredge-of-townretail,commercial,andindustrial
development.1
Residential neighborhoods in the master plan area vary in
form according to a number of characteristics.
• Proximitytodowntownandtraditionalstreetgrid.
For more than a century after the founders of Shreveport
1 http://aede.osu.edu/programs/exurbs/def.htm
Map 6.3 urban/suburban/exurban
Residential Character Urban
Suburban
Exurban
Rural or not subdivided
Planning area
City of Shreveport
Sources: Goody Clancy, NLCOG
established the rectangular downtown street grid in the
1840s, adjacent lands were subdivided with a continuous
street grid, creating new neighborhoods that were easily
connected to one another except where topography or
water created barriers. Houses are sited to face the street,
many of which have sidewalks and street trees. With the
exception of a few blocks of very large houses in Faireld,most of the buildings have modest front setbacks.
Often, blocks contain back service areas or alleys with
garage entrances, so there is no need for front garages
and driveways that break sidewalk continuity. Because
of the street grid, residents in these neighborhoods
have multiple options for traveling to destinations such
as shopping, employment, and schools. Corner stores
8/3/2019 Ch6_101221-LO
http://slidepdf.com/reader/full/ch6101221-lo 8/53
6 | L i v i n g i n S h v p o t - c a d d o : n i g h b o h o o d S a n d h o S i n g
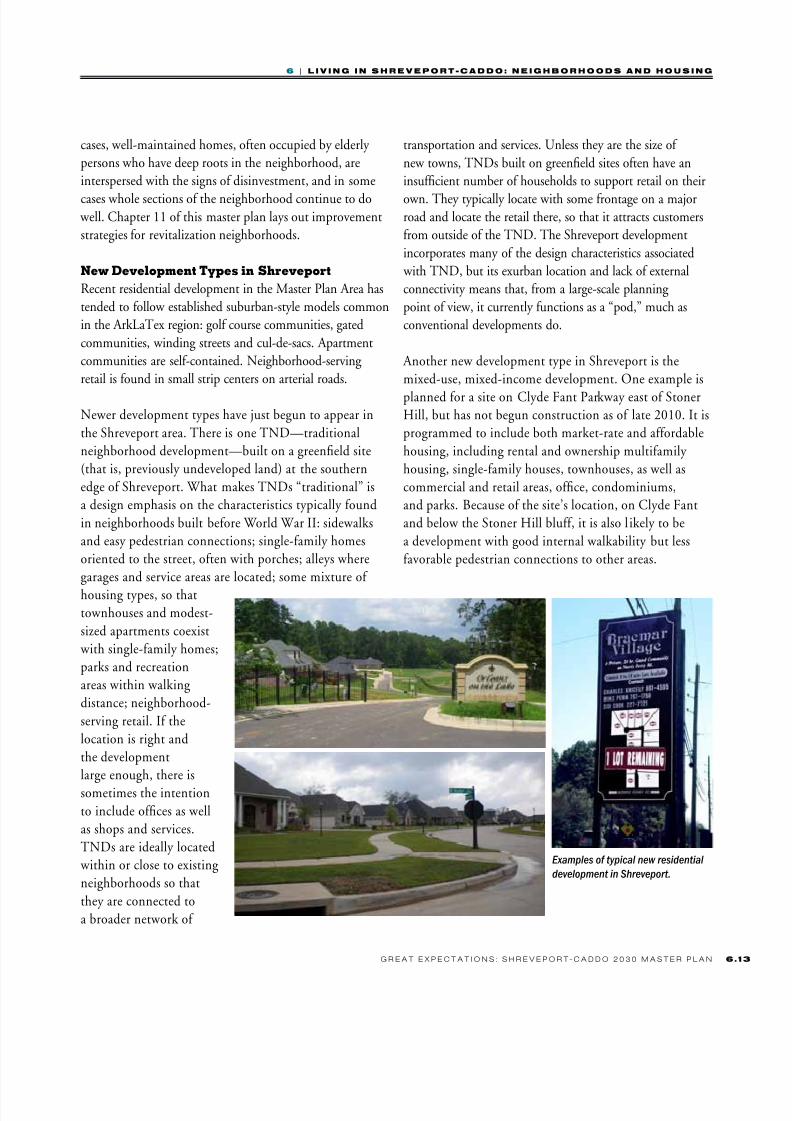
6 . 8 G r a t x c t a t i o n s : s h r v o r t - c a d d o 2 0 3 0 M a s t r L a n
Exurban development: a mixture of small subdivisions, mobile home
parks, and nonresidential development separated by undeveloped land
in the Keithville area.
B l o
m
B l v d
C h a s e W a y
B a i r d R d
C r a b a p p
l e D r
P i t c h P i n e
D r
H o l l y
O a k
D r
C h a s e
I s l a n d D r
E v e r g r e e n D r
Kirkwood Dr
C h a
s eB e n
d
S h
o r t
L e a f
D r
S h a
r t e l
Dulverton Ct
B r o o k s i d
e C i r
Sherringham Ct
C l a
u s e n
C t
S o m e
r s w o r t h D r
H e m
l o c k
C i r
C h a s e
C o v e
¯
0 500 1,000250
Feet
Single Family Residential
Buildings
Parcels
Surface Water
Curved roadways, larger blocks and multiple cul-de-sacs typical of
postwar suburban development
E l l e r b
e R d
N o r r
i s F
e r r y
R d
S t o n e h e d g e D r
C l i f f e
w o o d
P l
W a t e r f o
r dD r
E l l e
r b e
C r e e k
C i rS
t o n e h e d
g e C i r
g e n c y
E l l e r b
e R d
N o r r i s
F e r r y
R d
¯0 500 1,000250
Feet
Single Family Residential
Buildings
Parcels
Surface Water
Recent large-lot suburban development outside city limits in the
southeast
Sources: NLCOG, Goody Clancy
G i l b
e r
t
Merrick S t
College S t
Boulevard St
C r e s w
e l l
A v
H i g h l a
n d A
v
C e n
t e n
a r y
B l v d
Robinson
Wilkinson St
C o
t y S
t
Dalzell St
Prospect S t P i n
e h
u r s
t B
l v d
W h
e e
l e s s
A v
M o r e h e a d A v
D i l l a
r d S
t
obinson
M o r e h e a d A v
lzell St
Dalzell St
Wilkinson St
Prospect S t
Robinson
Dalzell St
¯
0 500 1,000250
Feet
Single Family Residential
Buildings
Parcels
Surface Water
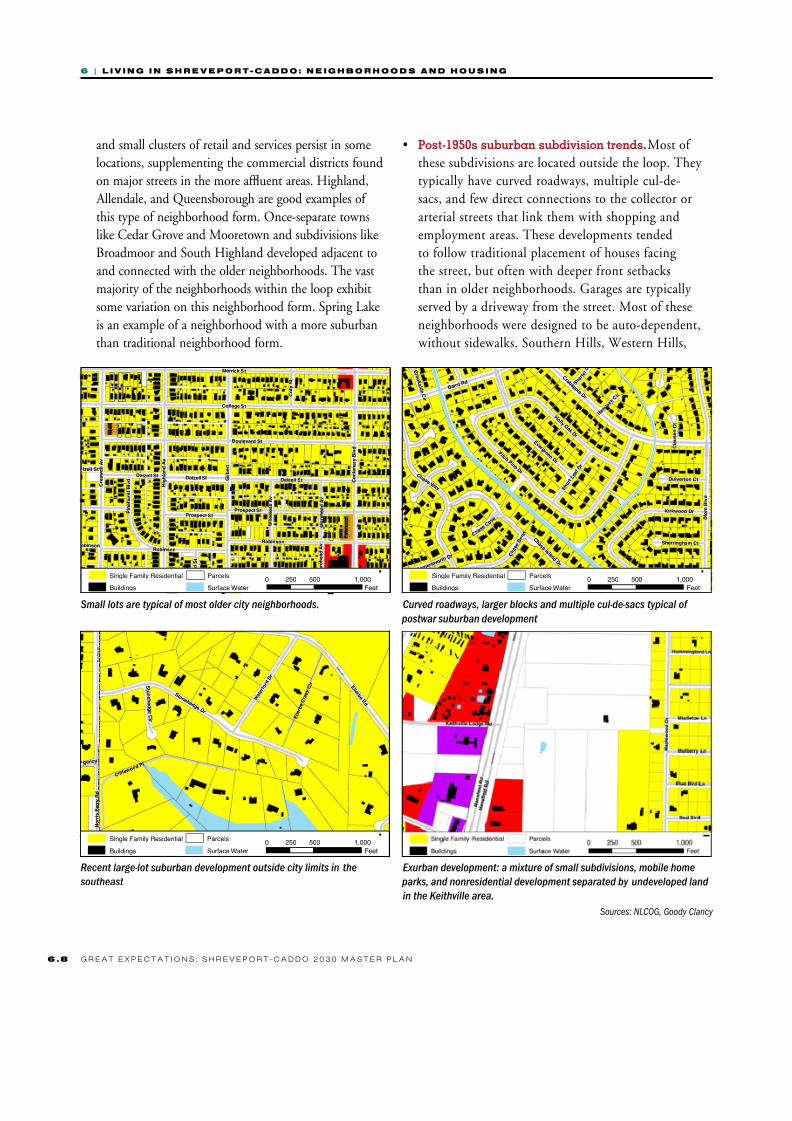
Small lots are typical of most older city neighborhoods.
and small clusters of retail and services persist in some
locations, supplementing the commercial districts found
on major streets in the more afuent areas. Highland,
Allendale, and Queensborough are good examples of this type of neighborhood form. Once-separate towns
like Cedar Grove and Mooretown and subdivisions like
Broadmoor and South Highland developed adjacent to
and connected with the older neighborhoods. The vast
majority of the neighborhoods within the loop exhibit
some variation on this neighborhood form. Spring Lake
is an example of a neighborhood with a more suburban
than traditional neighborhood form.
• Post-1950ssuburbansubdivisiontrends.Most of
these subdivisions are located outside the loop. They
typically have curved roadways, multiple cul-de-
sacs, and few direct connections to the collector orarterial streets that link them with shopping and
employment areas. These developments tended
to follow traditional placement of houses facing
the street, but often with deeper front setbacks
than in older neighborhoods. Garages are typically
served by a driveway from the street. Most of these
neighborhoods were designed to be auto-dependent,
without sidewalks. Southern Hills, Western Hills,

8/3/2019 Ch6_101221-LO
http://slidepdf.com/reader/full/ch6101221-lo 9/53
6 | L i v i n g i n S h v p o t - c a d d o : n i g h b o h o o d S a n d h o S i n g
6 . 9G r a t x c t a t i o n s : s h r v o r t - c a d d o 2 0 3 0 M a s t r L a n
Map 6.4 shreveport neIghborhoods
Neighborhoods
Source: NLCOG, 2009
Planning area
City boundary
8/3/2019 Ch6_101221-LO
http://slidepdf.com/reader/full/ch6101221-lo 10/53
6 | L i v i n g i n S h v p o t - c a d d o : n i g h b o h o o d S a n d h o S i n g
6. 10 G r a t x c t a t i o n s : s h r v o r t - c a d d o 2 0 3 0 M a s t r L a n
and North Highland are typical of this type of
subdivision.
• Large-lot,large-house,andgatedcommunity
marketdemandattheturnofthe21stcentury. Large-lot, single-family subdivisions, luxury townhouse
or condominium developments, or golf course
communities, often gated and at exurban, “leapfrog”
locations, are generally connected by only one or two
entrances or exits to a single arterial road. Most of this
type of development is located in southeast Shreveport,
both inside and outside the city limits.
• Sprawlingexurbandevelopmentinsemi-rural
areas.Sprawl at the edges of the
master plan area, both inside and
outside city limits, takes the form of
custom houses on large lots; small,
isolated subdivisions; scattered
clusters of single-family houses
along rural roads; mobile home
parks; and unplanned mixtures
of residential and nonresidential
development along arterial roads.
• Continuingexistenceofrural
residencesoutsidethecity.
Houses or mobile homes on largefarm or forestry parcels continue
to exist in the rural parts of the
Master Plan Area.
The Master Plan Area has examples
of a wide range of development
formats, though not necessarily
as wide a range of housing
types. Single-family residences
are the overwhelming majority,
including some developments with attached units. Outside of
older neighborhoods, multifamily
developments are typically not
integrated into the surrounding
context by street connections and
suitable transitions in scale. They are
surrounded by fences and provide one
or two entrances/exits from a single collector or arterial
street. This pod-like site plan for multifamily development
is required by current zoning.
Neighborhood types
Planning agencies typically put neighborhoods into
categories according to their needs. For the Shreveport-
Caddo Master Plan Area, four different neighborhood
categories were identied:
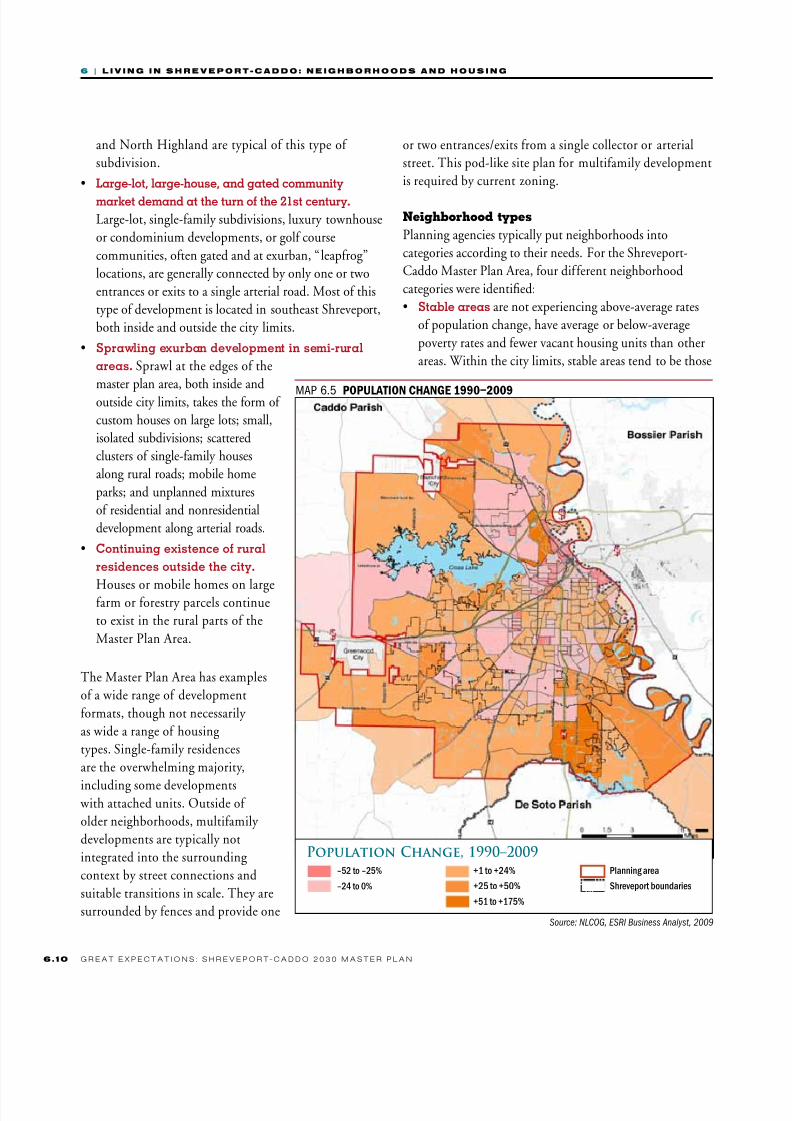
• Stableareas are not experiencing above-average rates
of population change, have average or below-average
poverty rates and fewer vacant housing units than other
areas. Within the city limits, stable areas tend to be those
Map 6.5 populatIon change 1990–2009
Population Change, 1990–2009–52 to –25%
–24 to 0%
+1 to +24%
+25 to +50%
+51 to +175%
Planning area
Shreveport boundaries
Source: NLCOG, ESRI Business Analyst, 2009

8/3/2019 Ch6_101221-LO
http://slidepdf.com/reader/full/ch6101221-lo 11/53
6 | L i v i n g i n S h v p o t - c a d d o : n i g h b o h o o d S a n d h o S i n g
6. 1G r a t x c t a t i o n s : s h r v o r t - c a d d o 2 0 3 0 M a s t r L a n
with the strongest housing markets and highest-income
households. They are located predominantly in the
eastern part of the city, outside of the city, and in rural
parts of the planning area.• Changingareas are in transition and may require
attention to shape change in positive direction
> Generational transition areas are those where the
population is stable in number, but residents and
the housing stock are aging. There has been little
recent development activity and special attention is
required to ensure continued stability and encourage
reinvestment.
> Development interestareas are those where
population has increased as a result of recent
development and where additional vacant and
underutilized land continues to draw interest for new housing development opportunities.
• Revitalizationareas are losing population; have a
higher poverty rate than other areas; have concentrated
locations with adjudicated property; have a higher
percentage of vacant housing units; and include
census tracts that are eligible for expenditure of federal
Community Development Block Grant funds because
at least 51% of the households in those tracts qualify as
low- or moderate-income.
Stable areas
• Stable city neighborhoods.
Stable areas in the city do
not experience large changes
in population, development
activity, or income. Residents in
these neighborhoods are most
concerned with assuring that
their neighborhoods are safe
and well-maintained, with good
code enforcement, security,and well-maintained public
services and public spaces. They
focus on whether any inll
development is compatible with
neighborhood character and
want development that occurs at
the edges of the neighborhood
to be positive, to incorporate
appropriate transitions, and to
avoid adverse impacts. Many of
these neighborhoods have strongneighborhood associations, and
most are located either in the
eastern part of the city—south
of Kings Highway and east of
I-49, such as South Highland and
Broadmoor—or they are located
outside the loop and toward the
Map 6.6 neIghborhood types
Source: NLCOG, Goody Clancy
Neighborhood TypesStable area
Revitalization area
Generationaltransition
Development interest
Shreveport neighborhoods
Planning area
City boundary
Surface water
8/3/2019 Ch6_101221-LO
http://slidepdf.com/reader/full/ch6101221-lo 12/53
6 | L i v i n g i n S h v p o t - c a d d o : n i g h b o h o o d S a n d h o S i n g
6. 12 G r a t x c t a t i o n s : s h r v o r t - c a d d o 2 0 3 0 M a s t r L a n
edges of city boundaries (for example, Southern Hills,
Western Hills, and North Highland).
• Stable rural areas. These areas are considered
relatively stable because, although most have grown
modestly in population since 1990, they have not yet
experienced the strong development activity seen in
the southeastern part of the master plan area and a few
other locations. The northwestern and western parts
of the master plan area tend to see less development
because of several barriers: Cross Lake, a sparse road
network and limited connections to major arterials and
highways, infrastructure costs, and undevelopable land.
Over the long term, if other parts of the Master Plan
Area become more developed, these areas may start to
see development pressure. The construction of I-49 in
the north may spur development near the interchange.
Changes in the zoning ordinance recommended in
this master plan in Chapter 12 will set a framework
for orderly future development within the context of a
smart growth land use pattern.
• Planning implications. Stable areas need vigilance
to make sure that they continue to do well. Within
the city, many will continue to be Shreveport’s mostsought-after neighborhoods, but others need to be
monitored. Maintenance and enforcement are critical
tools in preserving stability, plus careful attention to
neighborhood edges and transitions, as well as amenities.
Policies need to be put in place for rural areas that
are currently stable in order to be ready for future
development pressures, when more detailed planning
would be needed.
Changing areas
• Generational transition neighborhoods. Some areashave been experiencing population decline as a result
of aging households or people moving out. Some are
adjacent to revitalization areas that have seen signicant
disinvestment in recent decades. These neighborhoods
may be at risk of further decline. For example, Southern
Hills remains a strong neighborhood, but many of its
households comprise empty-nesters who are growing
older. In order for the neighborhood to continue to be
successful, a gradual generational turnover must occur,
with younger families moving in.
• Development interest areas. Most of the changing
areas where population has been growing over the last 20
years are located outside the loop, with the exception of
the area around LSUS and a few North Shreveport areas.
Typically exurban, they are also often characterized by
“leapfrog” development, particularly south of the city.
• Planning implications. Monitoring current
development, real estate, land use, demographic and
other community conditions in changing neighborhoodsand identifying potential future issues is essential. If
change is coming in the form of new development,
ensuring quality development that reinforces the positive
qualities of the neighborhood should be the goal. Where
conditions are deteriorating, identication of the source
of problems and early intervention to correct them is
critical. In both cases, a neighborhood planning process
that involves existing residents and property owner will
set the framework for positive change. Incorporation of
enhanced development standards in zoning and other
relevant ordinances, as recommended in this master plan, will help implement the resulting plans.
Revitalization neighborhoods
Revitalization neighborhoods are located in the city
rather than in exurban and rural areas. They contain high
numbers of adjudicated properties, boarded-up houses,
vacant lots, deteriorated housing, and vacant commercial
and industrial sites. A signicant portion of remaining
property is in the hands of absentee owners, and there
are many transient, low-income residents. In some
neighborhoods, such as Ledbetter Heights and parts of Allendale and Cedar Grove, demolition of substandard
housing has created a landscape of overgrown lots
interspersed with traditional housing, often in poor repair,
and a few areas of redevelopment. Strategies to revitalize
these neighborhoods must focus on community assets,
such as employment centers, to create a critical mass of
revitalization that can attract private investment. In many
8/3/2019 Ch6_101221-LO
http://slidepdf.com/reader/full/ch6101221-lo 13/53
6 | L i v i n g i n S h v p o t - c a d d o : n i g h b o h o o d S a n d h o S i n g
6. 1G r a t x c t a t i o n s : s h r v o r t - c a d d o 2 0 3 0 M a s t r L a n
cases, well-maintained homes, often occupied by elderly
persons who have deep roots in the neighborhood, are
interspersed with the signs of disinvestment, and in some
cases whole sections of the neighborhood continue to do well. Chapter 11 of this master plan lays out improvement
strategies for revitalization neighborhoods.
New Development Types in Shreveport
Recent residential development in the Master Plan Area has
tended to follow established suburban-style models common
in the ArkLaTex region: golf course communities, gated
communities, winding streets and cul-de-sacs. Apartment
communities are self-contained. Neighborhood-serving
retail is found in small strip centers on arterial roads.
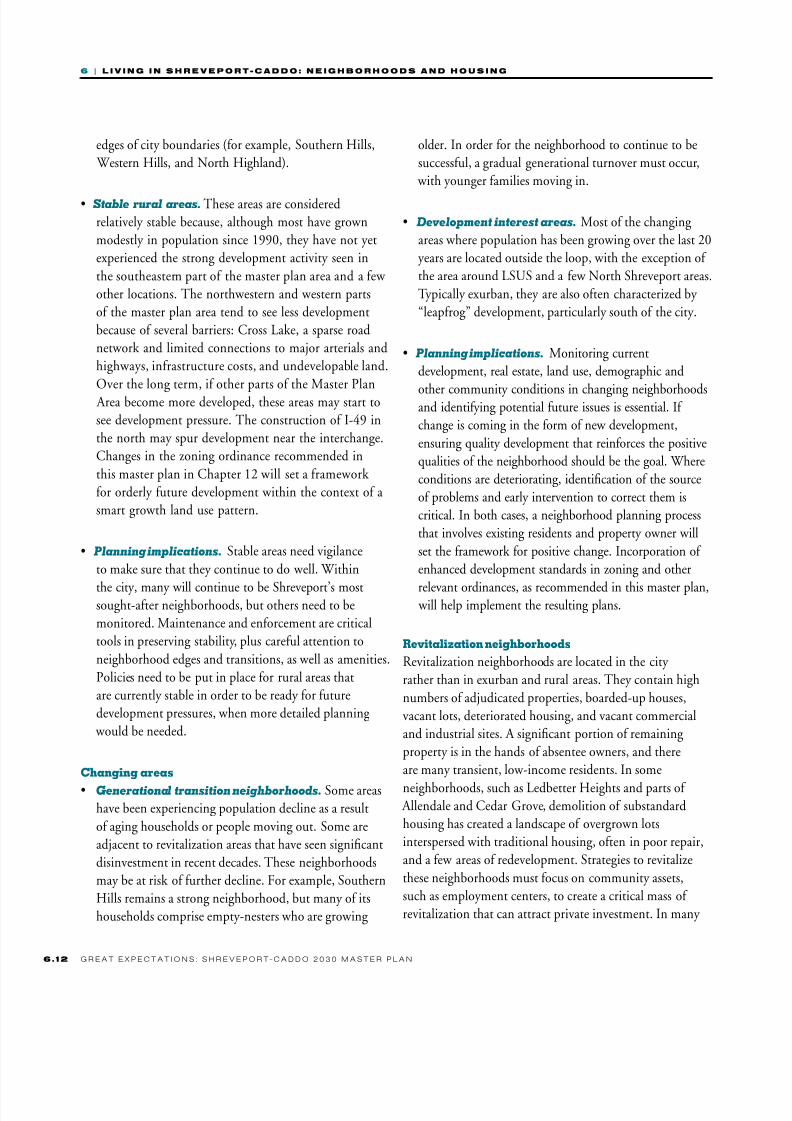
Newer development types have just begun to appear in
the Shreveport area. There is one TND—traditional
neighborhood development—built on a greeneld site
(that is, previously undeveloped land) at the southern
edge of Shreveport. What makes TNDs “traditional” is
a design emphasis on the characteristics typically found
in neighborhoods built before World War II: sidewalks
and easy pedestrian connections; single-family homes
oriented to the street, often with porches; alleys where
garages and service areas are located; some mixture of
housing types, so thattownhouses and modest-
sized apartments coexist
with single-family homes;
parks and recreation
areas within walking
distance; neighborhood-
serving retail. If the
location is right and
the development
large enough, there is
sometimes the intention
to include ofces as well
as shops and services.
TNDs are ideally located
within or close to existing
neighborhoods so that
they are connected to
a broader network of
transportation and services. Unless they are the size of
new towns, TNDs built on greeneld sites often have an
insufcient number of households to support retail on their
own. They typically locate with some frontage on a majorroad and locate the retail there, so that it attracts customers
from outside of the TND. The Shreveport development
incorporates many of the design characteristics associated
with TND, but its exurban location and lack of external
connectivity means that, from a large-scale planning
point of view, it currently functions as a “pod,” much as
conventional developments do.
Another new development type in Shreveport is the
mixed-use, mixed-income development. One example is
planned for a site on Clyde Fant Parkway east of StonerHill, but has not begun construction as of late 2010. It is
programmed to include both market-rate and affordable
housing, including rental and ownership multifamily
housing, single-family houses, townhouses, as well as
commercial and retail areas, ofce, condominiums,
and parks. Because of the site’s location, on Clyde Fant
and below the Stoner Hill bluff, it is also l ikely to be
a development with good internal walkability but less
favorable pedestrian connections to other areas.
Examples of typical new residential
development in Shreveport.
8/3/2019 Ch6_101221-LO
http://slidepdf.com/reader/full/ch6101221-lo 14/53
6 | L i v i n g i n S h v p o t - c a d d o : n i g h b o h o o d S a n d h o S i n g
6. 14 G r a t x c t a t i o n s : s h r v o r t - c a d d o 2 0 3 0 M a s t r L a n
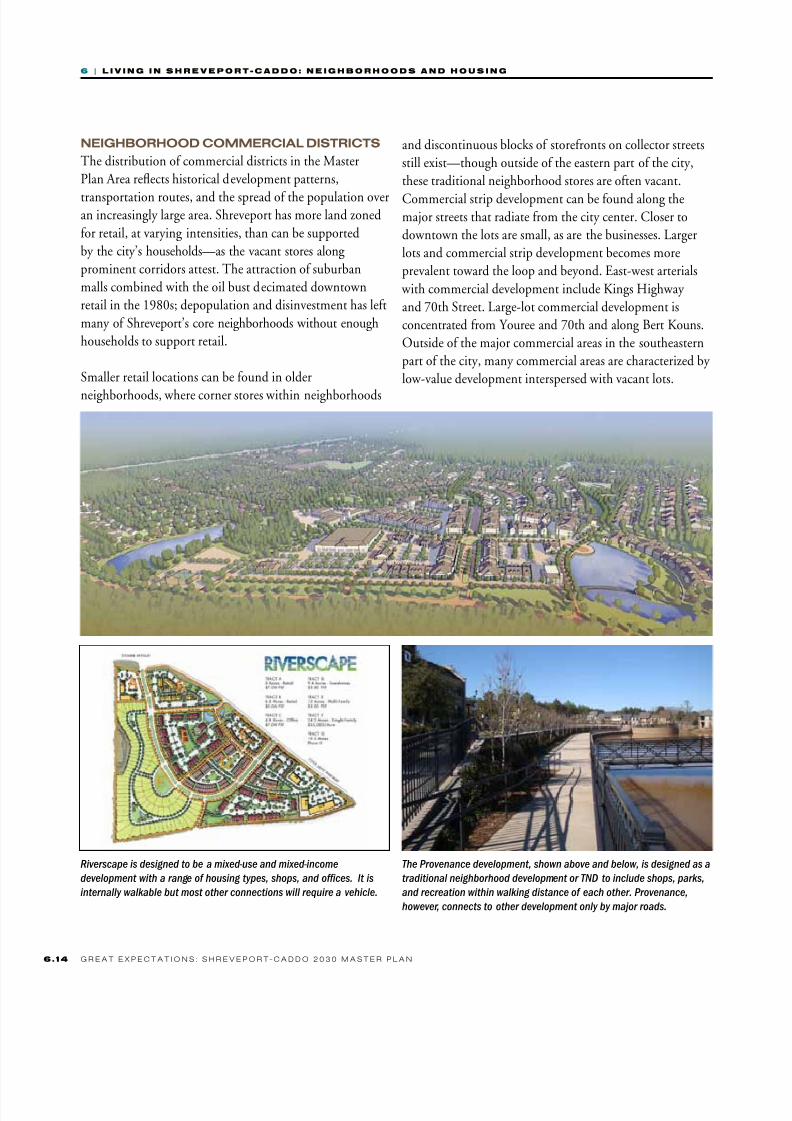
Neighborhood CommerCiAl distriCts
The distribution of commercial districts in the Master
Plan Area reects historical development patterns,
transportation routes, and the spread of the population overan increasingly large area. Shreveport has more land zoned
for retail, at varying intensities, than can be supported
by the city’s households—as the vacant stores along
prominent corridors attest. The attraction of suburban
malls combined with the oil bust decimated downtown
retail in the 1980s; depopulation and disinvestment has left
many of Shreveport’s core neighborhoods without enough
households to support retail.
Smaller retail locations can be found in older
neighborhoods, where corner stores within neighborhoods
and discontinuous blocks of storefronts on collector streets
still exist—though outside of the eastern part of the city,
these traditional neighborhood stores are often vacant.
Commercial strip development can be found along themajor streets that radiate from the city center. Closer to
downtown the lots are small, as are the businesses. Larger
lots and commercial strip development becomes more
prevalent toward the loop and beyond. East-west arterials
with commercial development include Kings Highway
and 70th Street. Large-lot commercial development is
concentrated from Youree and 70th and along Bert Kouns.
Outside of the major commercial areas in the southeastern
part of the city, many commercial areas are characterized by
low-value development interspersed with vacant lots.
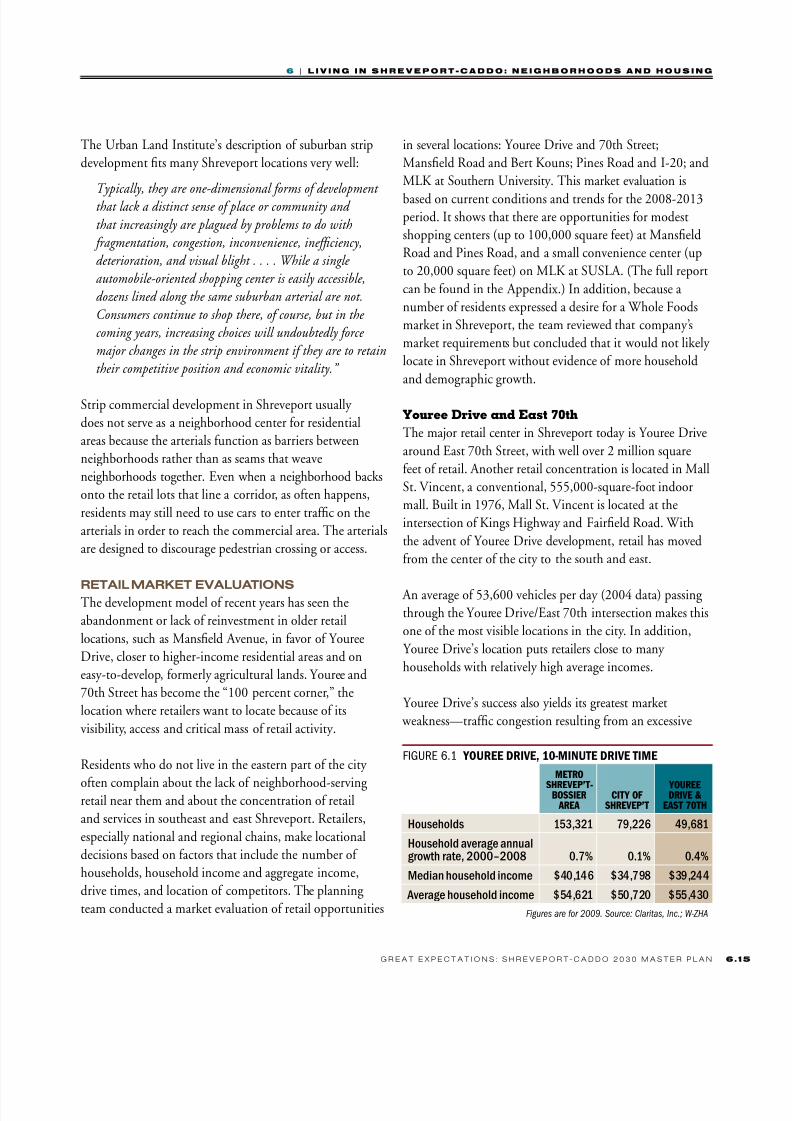
The Provenance development, shown above and below, is designed as a
traditional neighborhood development or TND to include shops, parks,
and recreation within walking distance of each other. Provenance,
however, connects to other development only by major roads.
Riverscape is designed to be a mixed-use and mixed-income
development with a range of housing types, shops, and ofces. It is
internally walkable but most other connections will require a vehicle.
8/3/2019 Ch6_101221-LO
http://slidepdf.com/reader/full/ch6101221-lo 15/53
6 | L i v i n g i n S h v p o t - c a d d o : n i g h b o h o o d S a n d h o S i n g
6. 1G r a t x c t a t i o n s : s h r v o r t - c a d d o 2 0 3 0 M a s t r L a n
The Urban Land Institute’s description of suburban strip
development ts many Shreveport locations very well:
Typically,theyareone-dimensionalformsofdevelopmentthatlackadistinctsenseofplaceorcommunityand
thatincreasinglyareplaguedbyproblemstodowith
fragmentation,congestion,inconvenience,inefciency,
deterioration,andvisualblight....Whileasingle
automobile-orientedshoppingcenteriseasilyaccessible,
dozenslinedalongthesamesuburbanarterialarenot.
Consumerscontinuetoshopthere,ofcourse,butinthe
comingyears,increasingchoiceswillundoubtedlyforce
majorchangesinthestripenvironmentiftheyaretoretain
theircompetitivepositionandeconomicvitality.”
Strip commercial development in Shreveport usually
does not serve as a neighborhood center for residential
areas because the arterials function as barriers between
neighborhoods rather than as seams that weave
neighborhoods together. Even when a neighborhood backs
onto the retail lots that line a corridor, as often happens,
residents may still need to use cars to enter trafc on the
arterials in order to reach the commercial area. The arterials
are designed to discourage pedestrian crossing or access.
retAil mArket evAluAtioNs
The development model of recent years has seen the
abandonment or lack of reinvestment in older retail
locations, such as Manseld Avenue, in favor of Youree
Drive, closer to higher-income residential areas and on
easy-to-develop, formerly agricultural lands. Youree and
70th Street has become the “100 percent corner,” the
location where retailers want to locate because of its
visibility, access and critical mass of retail activity.
Residents who do not live in the eastern part of the city
often complain about the lack of neighborhood-servingretail near them and about the concentration of retail
and services in southeast and east Shreveport. Retailers,
especially national and regional chains, make locational
decisions based on factors that include the number of
households, household income and aggregate income,
drive times, and location of competitors. The planning
team conducted a market evaluation of retail opportunities
in several locations: Youree Drive and 70th Street;
Manseld Road and Bert Kouns; Pines Road and I-20; and
MLK at Southern University. This market evaluation is
based on current conditions and trends for the 2008-2013period. It shows that there are opportunities for modest
shopping centers (up to 100,000 square feet) at Manseld
Road and Pines Road, and a small convenience center (up
to 20,000 square feet) on MLK at SUSLA. (The full report
can be found in the Appendix.) In addition, because a
number of residents expressed a desire for a Whole Foods
market in Shreveport, the team reviewed that company’s
market requirements but concluded that it would not likely
locate in Shreveport without evidence of more household
and demographic growth.
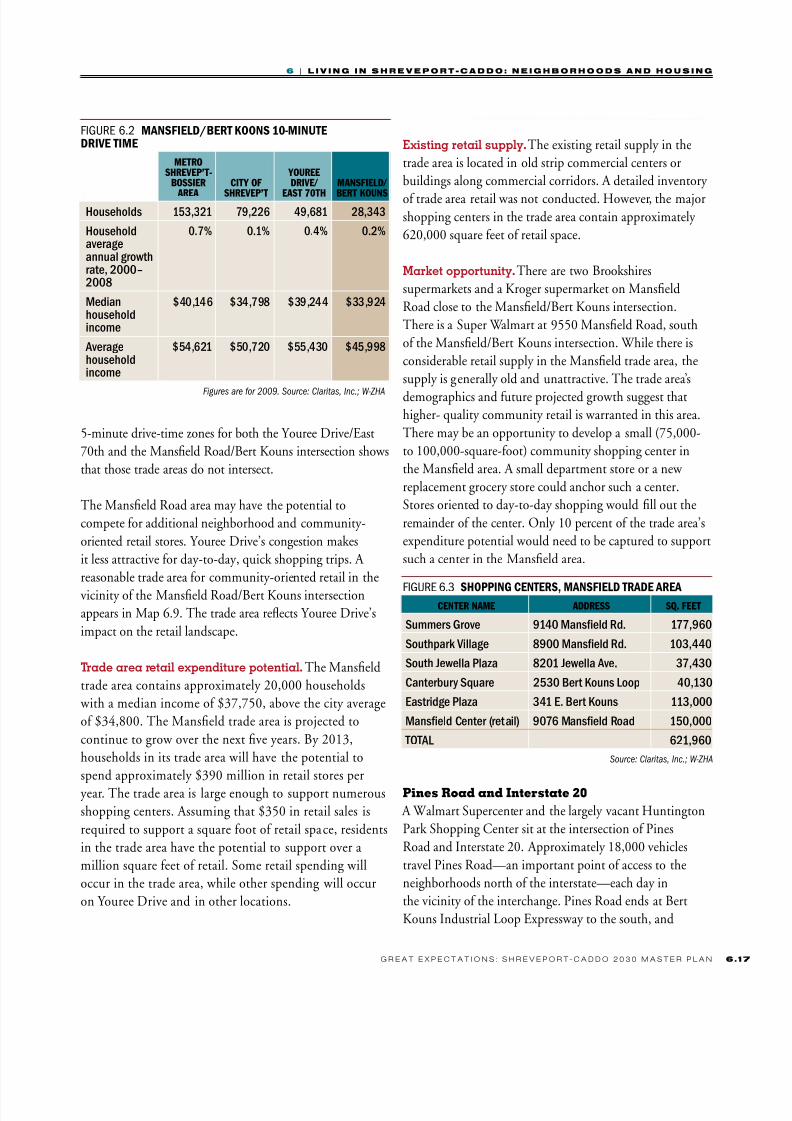
Youree Drive and East 70th
The major retail center in Shreveport today is Youree Drive
around East 70th Street, with well over 2 million square
feet of retail. Another retail concentration is located in Mall
St. Vincent, a conventional, 555,000-square-foot indoor
mall. Built in 1976, Mall St. Vincent is located at the
intersection of Kings Highway and Faireld Road. With
the advent of Youree Drive development, retail has moved
from the center of the city to the south and east.
An average of 53,600 vehicles per day (2004 data) passingthrough the Youree Drive/East 70th intersection makes this
one of the most visible locations in the city. In addition,
Youree Drive’s location puts retailers close to many
households with relatively high average incomes.
Youree Drive’s success also yields its greatest market
weakness—trafc congestion resulting from an excessive
Figure 6.1 youree drIve, 10-mInute drIve tIme
MEtRO
ShREvEP’t-bOSSIER AREA
CIty OF ShREvEP’t
yOuREEDRIvE &
EASt 70th
Households 153,321 79,226 49,681
Household average annualgrowth rate, 2000–2008 0.7% 0.1% 0.4%
Median household income $40,146 $34,798 $39,244
Average household income $54,621 $50,720 $55,430
Figures are for 2009. Source: Claritas, Inc.; W-ZHA

8/3/2019 Ch6_101221-LO
http://slidepdf.com/reader/full/ch6101221-lo 16/53
6 | L i v i n g i n S h v p o t - c a d d o : n i g h b o h o o d S a n d h o S i n g
6. 16 G r a t x c t a t i o n s : s h r v o r t - c a d d o 2 0 3 0 M a s t r L a n
number of driveways. For day-to-day shopping, Youree
Drive is not convenient to residents who live beyond a
5- to 7-minute drive. However, because it offers such
breadth and depth of shoppers’ goods stores for comparison
shopping, Youree Drive’s primary trade area is likely a
15-minute drive zone—a trade area that encompasses most
of the City of Shreveport.
Mansfield Road and Bert Kouns Industrial Loop
Expressway intersection area
The market within a 10-minute drive of the Manseld
Road/Bert Kouns intersection is not as strong as the Youree
Drive/70th Street market, but it is stable and growing.
TradeArea:MansfieldRoad/BertKouns.Large
community centers can draw from a 10-minute-drive trade
area, depending on the competition. Map 6.7 illustrates the
10-minute drive areas from both Youree Drive/East 70th
and Manseld Road/Bert Kouns intersections. The trade
areas overlap between Manseld Road and Youree Drive,
south of Hollywood Avenue and north of the Inner Loop.
Given its location and character, Youree Drive retail is
likely to continue to be a strong investment location for
comparison-shopping retail. Specialty stores, apparel,
jewelry, furniture, and other stores that target the
regional market will demand a Youree Drive location
because of its depth and breadth of retail offerings. The
Manseld area does not represent a competitive location
for these types of retailers.
Neighborhood retail—small shopping centers anchored by a
grocery store—typically draw a majority of their patronage
from households within a 5-minute drive. Mapping the
Map 6.9 communIty-orIented retaIl trade area formansfIeld/bert Kouns
Sources: Claritas, Inc.; W-ZHA
Map 6.7 15-mInute drIve tIme from youree/70th
Sources: Claritas, Inc.; W-ZHA
Map 6.8 10-mInute drIve tImes from youree/70th and from mansfIeld/bert Kouns
Sources: Claritas, Inc.; W-ZHA
8/3/2019 Ch6_101221-LO
http://slidepdf.com/reader/full/ch6101221-lo 17/53
6 | L i v i n g i n S h v p o t - c a d d o : n i g h b o h o o d S a n d h o S i n g
6. 1G r a t x c t a t i o n s : s h r v o r t - c a d d o 2 0 3 0 M a s t r L a n
5-minute drive-time zones for both the Youree Drive/East
70th and the Manseld Road/Bert Kouns intersection shows
that those trade areas do not intersect.
The Manseld Road area may have the potential to
compete for additional neighborhood and community-
oriented retail stores. Youree Drive’s congestion makes
it less attractive for day-to-day, quick shopping trips. A
reasonable trade area for community-oriented retail in the
vicinity of the Manseld Road/Bert Kouns intersection
appears in Map 6.9. The trade area reects Youree Drive’s
impact on the retail landscape.
Tradearearetailexpenditurepotential.The Manseld
trade area contains approximately 20,000 households
with a median income of $37,750, above the city average
of $34,800. The Manseld trade area is projected to
continue to grow over the next ve years. By 2013,
households in its trade area will have the potential to
spend approximately $390 million in retail stores per
year. The trade area is large enough to support numerous
shopping centers. Assuming that $350 in retail sales is
required to support a square foot of retail space, residents
in the trade area have the potential to support over a
million square feet of retail. Some retail spending will
occur in the trade area, while other spending will occur
on Youree Drive and in other locations.
Existingretailsupply.The existing retail supply in the
trade area is located in old strip commercial centers or
buildings along commercial corridors. A detailed inventory
of trade area retail was not conducted. However, the majorshopping centers in the trade area contain approximately
620,000 square feet of retail space.
Marketopportunity.There are two Brookshires
supermarkets and a Kroger supermarket on Manseld
Road close to the Manseld/Bert Kouns intersection.
There is a Super Walmart at 9550 Manseld Road, south
of the Manseld/Bert Kouns intersection. While there is
considerable retail supply in the Manseld trade area, the
supply is generally old and unattractive. The trade area’s
demographics and future projected growth suggest thathigher- quality community retail is warranted in this area.
There may be an opportunity to develop a small (75,000-
to 100,000-square-foot) community shopping center in
the Manseld area. A small department store or a new
replacement grocery store could anchor such a center.
Stores oriented to day-to-day shopping would ll out the
remainder of the center. Only 10 percent of the trade area’s
expenditure potential would need to be captured to support
such a center in the Manseld area.
Pines Road and Interstate 20
A Walmart Supercenter and the largely vacant Huntington
Park Shopping Center sit at the intersection of Pines
Road and Interstate 20. Approximately 18,000 vehicles
travel Pines Road—an important point of access to the
neighborhoods north of the interstate—each day in
the vicinity of the interchange. Pines Road ends at Bert
Kouns Industrial Loop Expressway to the south, and
Figure 6.2 mansfIeld/bert Koons 10-mInutedrIve tIme
MEtRO ShREvEP’t-
bOSSIER
AREA
CIty OF
ShREvEP’t
yOuREEDRIvE/
EASt 70th
MANSFIELD/
bERt KOuNS
Households 153,321 79,226 49,681 28,343
Householdaverageannual growthrate, 2000–2008
0.7% 0.1% 0.4% 0.2%
Medianhouseholdincome
$40,146 $34,798 $39,244 $33,924
Averagehouseholdincome
$54,621 $50,720 $55,430 $45,998
Figures are for 2009. Source: Claritas, Inc.; W-ZHA
Figure 6.3 shoppIng centers, mansfIeld trade area CENtER NAME ADDRESS Sq. FEEt
Summers Grove 9140 Manseld Rd. 177,960
Southpark Village 8900 Manseld Rd. 103,440
South Jewella Plaza 8201 Jewella Ave. 37,430
Canterbury Square 2530 Bert Kouns Loop 40,130
Eastridge Plaza 341 E. Bert Kouns 113,000
Manseld Center (retail) 9076 Manseld Road 150,000
TOTAL 621,960
Source: Claritas, Inc.; W-ZHA
8/3/2019 Ch6_101221-LO
http://slidepdf.com/reader/full/ch6101221-lo 18/53
6 | L i v i n g i n S h v p o t - c a d d o : n i g h b o h o o d S a n d h o S i n g
6. 18 G r a t x c t a t i o n s : s h r v o r t - c a d d o 2 0 3 0 M a s t r L a n
the 5-minute-drive area will be necessary to support
additional neighborhood retail. The Walmart retards
neighborhood shopping growth because it incorporates
the typical anchors of neighborhood centers—generalmerchandise, grocery and drug stores. Further
compromising the Pines Road/I-20 area is the appearance
and performance of the Huntington Park center.
In the near term, however, because of household count,
trafc volume and projected household growth to the
south along Interstate 49, Manseld Road/Bert Kouns
is considered a stronger community retail location than
Pines Road/I-20. In the near term, it is important to
either redevelop Huntington Park Shopping Center or re-
tenant it with non-retail establishments.
Martin Luther King Drive and Shreveport
Blanchard Highway Intersection Area
There is a mix of education, healthcare, transportation
and residential uses in the vicinity of the intersection of
Martin Luther King Drive and Shreveport Blanchard
Highway. In addition to Southern University, the David
Raines Community Health Center and Kansas City
Southern Railroad are employment centers in this area.
The area is primarily residential in character.
According to representatives of Southern University,
whose campus sits adjacent to the intersection, Southern
is the sixth fastest-growing two-year university in the
country; enrollment during its fall 2010 semester reached
approximately 2,835. The university offers technical
training and associates degrees. Among eleven buildings
on the 103-acre campus there are 240 dormitory rooms.
With little retail nearby, the university relies for a
shopping area on North Market Street, where there are
two supermarkets, drug stores, and other neighborhood-
and community-serving retail establishments.
There is considerable of trafc on North Market Street.
While over 48,000 vehicles travel through the North
Market/Martin Luther King Boulevard intersection each
day, only 12,400 vehicles travel through the Martin
Luther King Drive and Shreveport Blanchard Highway
intersection.
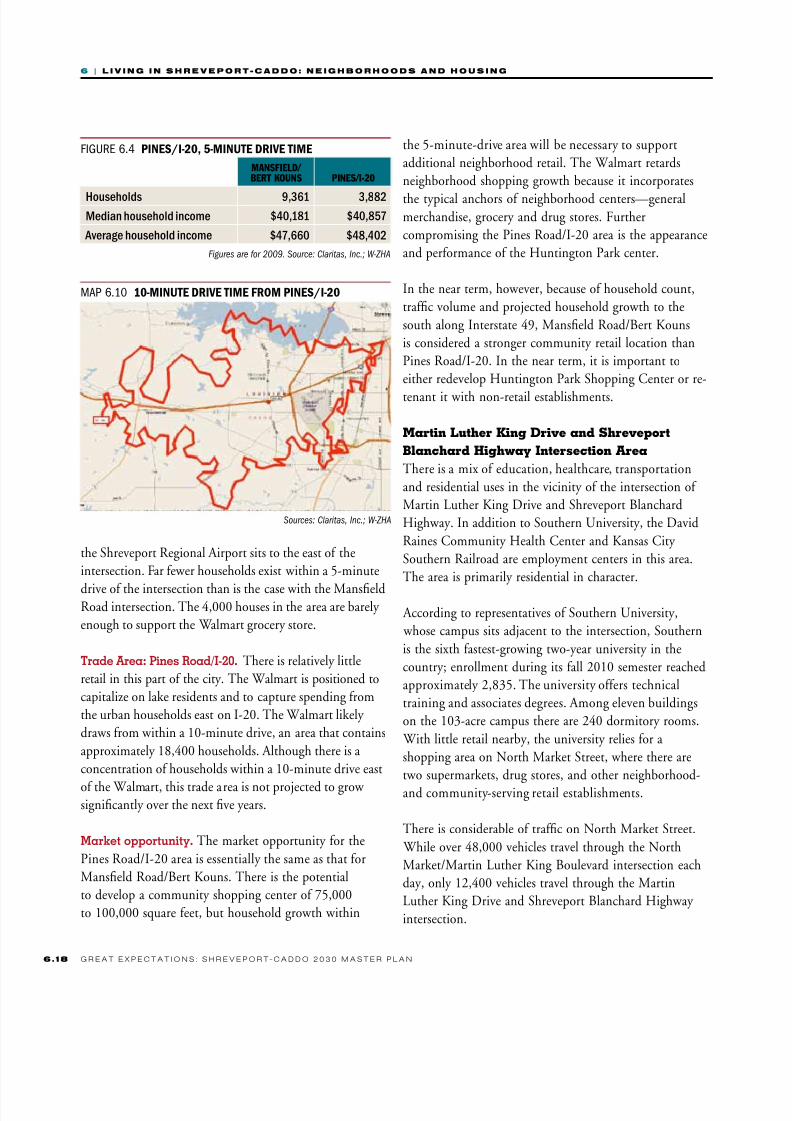
the Shreveport Regional Airport sits to the east of the
intersection. Far fewer households exist within a 5-minute
drive of the intersection than is the case with the ManseldRoad intersection. The 4,000 houses in the area are barely
enough to support the Walmart grocery store.
TradeArea:PinesRoad/I-20.There is relatively little
retail in this part of the city. The Walmart is positioned to
capitalize on lake residents and to capture spending from
the urban households east on I-20. The Walmart likely
draws from within a 10-minute drive, an area that contains
approximately 18,400 households. Although there is a
concentration of households within a 10-minute drive east
of the Walmart, this trade area is not projected to grow signicantly over the next ve years.
Marketopportunity.The market opportunity for the
Pines Road/I-20 area is essentially the same as that for
Manseld Road/Bert Kouns. There is the potential
to develop a community shopping center of 75,000
to 100,000 square feet, but household growth within
Figure 6.4 pInes/I-20, 5-mInute drIve tIme
MANSFIELD/ bERt KOuNS PINES/I-20
Households 9,361 3,882
Median household income $40,181 $40,857
Average household income $47,660 $48,402
Figures are for 2009. Source: Claritas, Inc.; W-ZHA
Map 6.10 10-mInute drIve tIme from pInes/I-20
Sources: Claritas, Inc.; W-ZHA
8/3/2019 Ch6_101221-LO
http://slidepdf.com/reader/full/ch6101221-lo 19/53
6 | L i v i n g i n S h v p o t - c a d d o : n i g h b o h o o d S a n d h o S i n g
6. 1G r a t x c t a t i o n s : s h r v o r t - c a d d o 2 0 3 0 M a s t r L a n
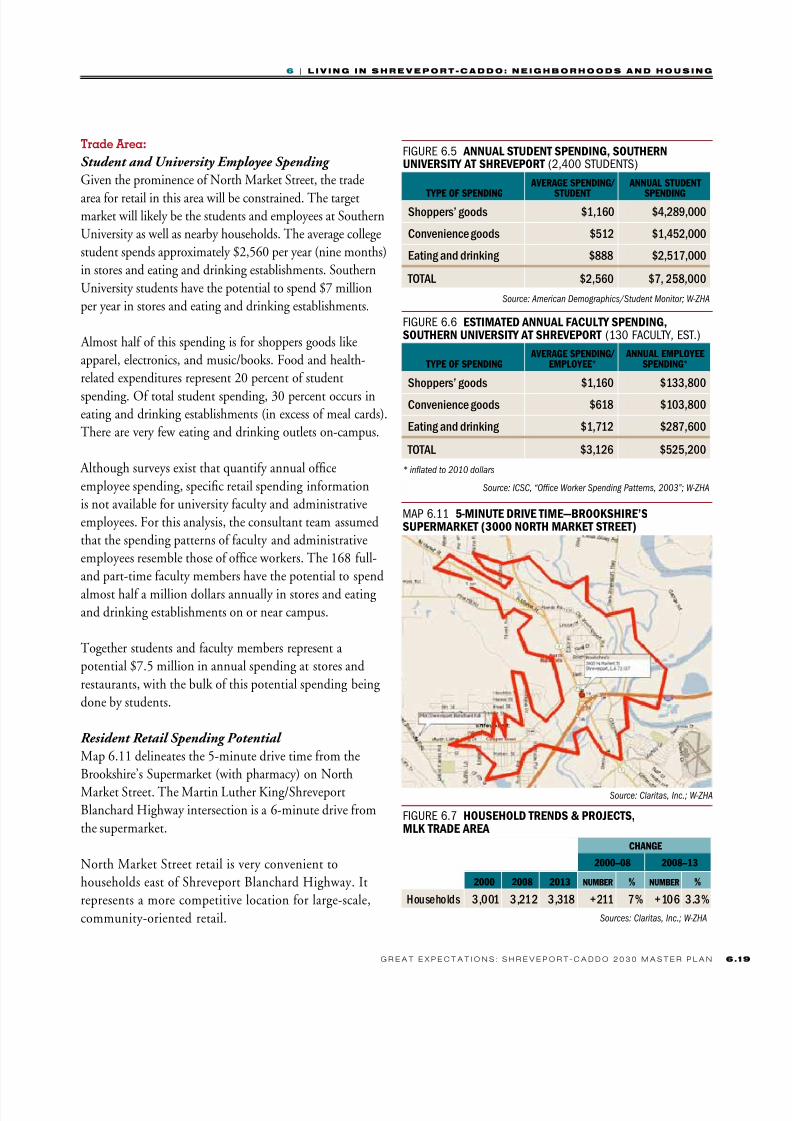
TradeArea:
Student and University Employee Spending
Given the prominence of North Market Street, the trade
area for retail in this area will be constrained. The targetmarket will likely be the students and employees at Southern
University as well as nearby households. The average college
student spends approximately $2,560 per year (nine months)
in stores and eating and drinking establishments. Southern
University students have the potential to spend $7 million
per year in stores and eating and drinking establishments.
Almost half of this spending is for shoppers goods like
apparel, electronics, and music/books. Food and health-
related expenditures represent 20 percent of student
spending. Of total student spending, 30 percent occurs ineating and drinking establishments (in excess of meal cards).
There are very few eating and drinking outlets on-campus.
Although surveys exist that quantify annual ofce
employee spending, specic retail spending information
is not available for university faculty and administrative
employees. For this analysis, the consultant team assumed
that the spending patterns of faculty and administrative
employees resemble those of ofce workers. The 168 full-
and part-time faculty members have the potential to spend
almost half a million dollars annually in stores and eatingand drinking establishments on or near campus.
Together students and faculty members represent a
potential $7.5 million in annual spending at stores and
restaurants, with the bulk of this potential spending being
done by students.
Resident Retail Spending Potential
Map 6.11 delineates the 5-minute drive time from the
Brookshire’s Supermarket (with pharmacy) on North
Market Street. The Martin Luther King/Shreveport
Blanchard Highway intersection is a 6-minute drive from
the supermarket.
North Market Street retail is very convenient to
households east of Shreveport Blanchard Highway. It
represents a more competitive location for large-scale,
community-oriented retail.
Figure 6.5 annual student spendIng, southernunIversIty at shreveport (2,400 students)
tyPE OF SPENDING
AvERAGE SPENDING/
StuDENt
ANNuAL StuDENt
SPENDING
Shoppers’ goods $1,160 $4,289,000
Convenience goods $512 $1,452,000
Eating and drinking $888 $2,517,000
TOTAL $2,560 $7, 258,000
Source: American Demographics/Student Monitor; W-ZHA
Figure 6.6 estImated annual faculty spendIng,southern unIversIty at shreveport (130 Faculty, est.)
tyPE OF SPENDING AvERAGE SPENDING/
EMPLOyEE* ANNuAL EMPLOyEE
SPENDING*
Shoppers’ goods $1,160 $133,800
Convenience goods $618 $103,800
Eating and drinking $1,712 $287,600
TOTAL $3,126 $525,200
* inated to 2010 dollars
Source: ICSC, “Ofce Worker Spending Patterns, 2003”; W-ZHA
Figure 6.7 household trends & projects,mlK trade area
ChANGE
2000–08 2008–13
2000 2008 2013 NuMbER % NuMbER %
Households 3,001 3,212 3,318 +211 7% +106 3.3%
Sources: Claritas, Inc.; W-ZHA
Map 6.11 5-mInute drIve tIme—brooKshIre’ssupermarKet (3000 north marKet street)
Source: Claritas, Inc.; W-ZHA
8/3/2019 Ch6_101221-LO
http://slidepdf.com/reader/full/ch6101221-lo 20/53
6 | L i v i n g i n S h v p o t - c a d d o : n i g h b o h o o d S a n d h o S i n g
6 . 2 0 G r a t x c t a t i o n s : s h r v o r t - c a d d o 2 0 3 0 M a s t r L a n
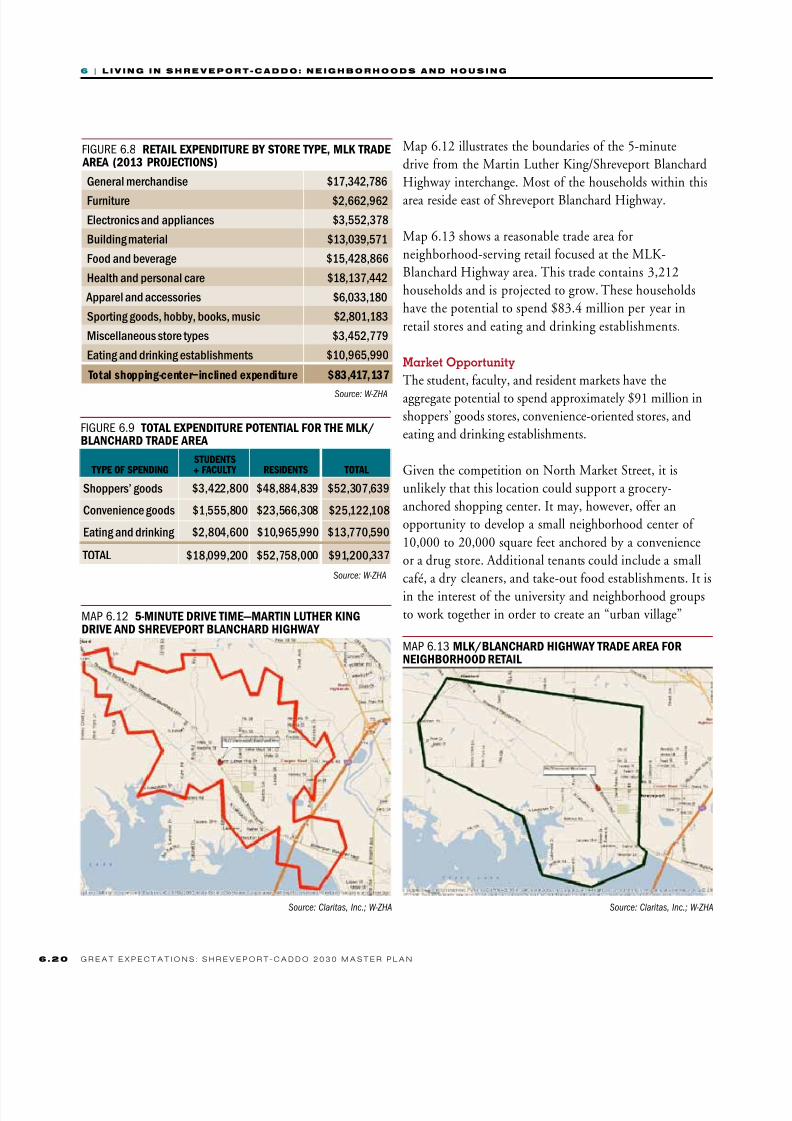
Map 6.12 illustrates the boundaries of the 5-minute
drive from the Martin Luther King/Shreveport Blanchard
Highway interchange. Most of the households within this
area reside east of Shreveport Blanchard Highway.
Map 6.13 shows a reasonable trade area for
neighborhood-serving retail focused at the MLK-
Blanchard Highway area. This trade contains 3,212
households and is projected to grow. These households
have the potential to spend $83.4 million per year in
retail stores and eating and drinking establishments.
MarketOpportunity
The student, faculty, and resident markets have the
aggregate potential to spend approximately $91 million inshoppers’ goods stores, convenience-oriented stores, and
eating and drinking establishments.
Given the competition on North Market Street, it is
unlikely that this location could support a grocery-
anchored shopping center. It may, however, offer an
opportunity to develop a small neighborhood center of
10,000 to 20,000 square feet anchored by a convenience
or a drug store. Additional tenants could include a small
café, a dry cleaners, and take-out food establishments. It is
in the interest of the university and neighborhood groups
to work together in order to create an “urban village”
Figure 6.9 total expendIture potentIal for the mlK/blanchard trade area
tyPE OF SPENDING StuDENtS+ FACuLty RESIDENtS tOtAL
Shoppers’ goods $3,422,800 $48,884,839 $52,307,639
Convenience goods $1,555,800 $23,566,308 $25,122,108
Eating and drinking $2,804,600 $10,965,990 $13,770,590
TOTAL $18,099,200 $52,758,000 $91,200,337
Source: W-ZHA
Figure 6.8 retaIl expendIture by store type, mlK trade area (2013 projectIons)
General merchandise $17,342,786
Furniture $2,662,962
Electronics and appliances $3,552,378
Building material $13,039,571
Food and beverage $15,428,866
Health and personal care $18,137,442
Apparel and accessories $6,033,180
Sporting goods, hobby, books, music $2,801,183
Miscellaneous store types $3,452,779
Eating and drinking establishments $10,965,990
t i-–ii xiu $83,417,137
Source: W-ZHA
Map 6.13 mlK/blanchard hIghway trade area forneIghborhood retaIl
Source: Claritas, Inc.; W-ZHA
Map 6.12 5-mInute drIve tIme—martIn luther KIngdrIve and shreveport blanchard hIghway
Source: Claritas, Inc.; W-ZHA
8/3/2019 Ch6_101221-LO
http://slidepdf.com/reader/full/ch6101221-lo 21/53
6 | L i v i n g i n S h v p o t - c a d d o : n i g h b o h o o d S a n d h o S i n g
6 . 2G r a t x c t a t i o n s : s h r v o r t - c a d d o 2 0 3 0 M a s t r L a n
at this area that serve both residents and the university
community. This urban village, over time, can develop to
serve as a mixed-use activity center balancing the North
Market Street commercial area at the other end of MartinLuther King Drive.
AttrACtiNg food stores to
uNderserved Neighborhoods
Communities adopt a number of strategies to recruit
grocery stores. These strategies fall into two broad
categories: 1) data and marketing and 2) financial
incentives.
Dataandmarketing.There is clear evidence that
urban markets can be underserved simply becausethe buying power of the market is not understood or
well documented. Communities perform their own
market analyses to demonstrate market opportunities
to potential grocers. The market analysis documents
household characteristics and buying power as well asthe current lack of supply to tap this market.
Incentives.Cities employ many incentives to persuade
a quality food store to locate in a community. One
strategy is to assemble a site of sufficient size to
accommodate a grocery store and to transfer the site to a
store for a nominal fee. Other strategies include the use
of tax-increment financing to underwrite development
costs or property tax abatements in order to lower
operating costs. Federal New Market Tax Credits have
been used to support development of a grocery store inlarger, mixed-use projects.
Grocery stores apply several criteria when
selecting a location. The two primary ones are
market potential and site visibility/accessibility.
• In terms of market potential, grocery stores
consider the number of households and the
character of the competition. Grocery stores typically
locate in market areas that are growing.
• Grocery stores prefer sites that have easy access from
major thoroughfares. High traffic volume is con-
sidered an asset, especially if the site is on the side
of the street where traffic volume is high on the trip
home. Sites visible from the road and convenient to
growth areas are valuable to grocery stores as well.
• Households spend approximately 10 to 15 per-
cent of total income in food stores. Lower-income
households spend a higher share and upper-income
households spend a lower share. Approximately 5.7
percent of disposable income in America is spent on“food at home.”
• To turn a profit, grocery stores need to achieve sales
of $350 to $500 per square foot of space per year. For
conventional grocery stores, 70 to 80 percent of store
sales are derived from households within three miles
of the store. Specialty stores like Whole Foods and
Trader Joe’s can draw from a broader area.
• Supermarkets generally range in size from 50,000 to
75,000 square feet. By definition, supermarkets bring
in at least $2 million in sales per year, although the
Food Marketing Institute calculates the average at
above $18 million. It takes $200 to $300 million in
income or a minimum of 4,500 to 5,000 households
in the primary market to support a supermarket The
number of households required to support a super-
market increases with the presence of competition.
• Smaller stores, like Trader Joe’s, range in size from
10,000 to 15,000 square feet. Neighborhood stores
can be 5,000 to 10,000 square feet.
• Two thousand households is the minimum required
to support a food store that is not a convenience
store.
• Specialty natural foods stores, like Whole Foods,
seek locations with high concentrations of well-
educated households and households withoutchildren. The market within a 10-minute drive of East
70th and Youree Drive does not appear to have the
income and educational characteristics comparable
to other locations where there is a Whole Foods.
Mrke eles fr grery Sres
8/3/2019 Ch6_101221-LO
http://slidepdf.com/reader/full/ch6101221-lo 22/53
6 | L i v i n g i n S h v p o t - c a d d o : n i g h b o h o o d S a n d h o S i n g
6 . 2 2 G r a t x c t a t i o n s : s h r v o r t - c a d d o 2 0 3 0 M a s t r L a n
Pennsylvania’sFreshFoodInitiative. In 2003
Pennsylvania passed the nation’s rst statewide economic
development initiative aimed at improving access to
markets that sell healthy food in underserved rural andurban communities. Using $10 million of state-provided
seed money, the program assembled a nancing pool worth
$40 million that combined bank loans and New Market
Tax Credits. The pool helps nance fresh-food retailers that
locate in communities that are underserved by conventional
nancial institutions. The initiative provides a range of
nancing resources such as pre-development grants and
loans, land acquisition and equipment nancing, capital
grants for project funding gaps and construction, and
permanent nance.
Specialtyfoodstores.In Shreveport, the master plan
team analyzed the characteristics of the market within a
10-minute drive of the corner of East 70th and Youree
Drive. The prole of this market does not compare
favorably to the other Whole Food locations. While
household density is comparable to some locations,
income and educational attainment fall below the
comparables. For these reasons, it may be difcult to
recruit a Whole Foods.
housiNg
The master plan area offers some variety in housing types—
that is, it contains single-family homes, small apartment
buildings, garden apartments, large apartment complexes,
townhouses, a few midrise apartment houses, and mobile
homes. All these housing types exist as both owner-
occupied and rental units. Other tenure arrangements, like
condominiums or cooperatives, are rare.
Housing characteristics
Numberandtypeofhousingunits.The Shreveport-
Caddo Master Plan Area in 2009 had an estimated total of
103,466 housing units, of which 90,316 (87%) are located
within the city itself and 13,150 are outside the city limits
in unincorporated areas of Caddo Parish. Almost 13%
of the total housing units are vacant. Most people in
the Shreveport-Caddo area live in single-family houses,
and that is likely to continue to be the case over the
long term, even if new housing types are introduced.
According to 2000 Census data, over 70% of the housing
units in the Master Plan Area are single-family homes.
Approximately 14% of the housing units are in two- to
nine-unit buildings. Medium-sized multifamily structuresof ten to forty-nine units account for 4% of all housing
units, and more than 5% of units are in structures
containing 50 or more units. In addition, 5% of the
housing units are mobile homes.
Smaller and older multifamily buildings can be found
in older parts of the city where they are integrated into
the neighborhood. Newer multifamily developments
tend to be located and designed as self-contained “pod”
developments near highways. The zoning ordinance
requires that they be surrounded at a minimum by a six-foot fence and generally treats new multifamily
development as a necessary evil. Map 6.13 shows the
location of market-rate apartment house complexes with
more than 50 units surveyed by the LSUS Center for
Business and Economic Research. For the most part they
are located at the edges of the city or near highways. The
overall occupancy rate for multifamily complexes of this
type in the Shreveport-Bossier market remained stable at
approximately 94% between 2001 and 2008.2
2 LSUS Center for Business and Economic Research, Shreveport-BossierCityCommercialandMulti-FamilyRealEstateMarketReport,Year End2008.
a ne hus d
The most precise and reliable data on housing
remains the decennial census. This master
plan is being developed in 2009-2010, and
the 2000 census data is by now quite out of date.
Because population in the Shreveport-Caddo MPC
planning area has remained relatively stable since
the 1980s, however, 2000 census data can still beused to analyze many aspects of the area’s housing
conditions. When available, 2009 estimates on
housing and population data are provided, as well
as 2014 projections based on the assumption that
current trends will continue. These data were created
by ESRI Business Analyst, a proprietary database,
based on the census and other sources.

8/3/2019 Ch6_101221-LO
http://slidepdf.com/reader/full/ch6101221-lo 23/53
6 | L i v i n g i n S h v p o t - c a d d o : n i g h b o h o o d S a n d h o S i n g
6 . 2G r a t x c t a t i o n s : s h r v o r t - c a d d o 2 0 3 0 M a s t r L a n
Housingtenure.The majority of
housing units in the Master Plan
Area are owner-occupied (60% of the
occupied units and 54% of all units).Cities normally have more rental units
than suburban or rural areas, and
this is also the case in the Shreveport-
Caddo Master plan area, where
42% of the occupied housing units
within the city boundaries are rentals,
in contrast to the area outside the
city limits, where 20% of occupied
housing units are rentals. The rent-
to-own model has been introduced
in a few recent subdivisions, with a15-year rental period after which the
tenant has the option to purchase.
The number and percentage of rentals
has increased slightly over the last
two decades. In the city, the number
of rental units increased by 3,000,
with a corresponding increase from
39% to 42% of occupied housing
units. Shreveport’s proportion of
rental housing is not particularly high,compared to most cities. Lafayette,
Oklahoma City, Chattanooga and
Fayetteville have similar percentages
of renter households, while Little
Rock has 59% renters and Dallas has
52% renters. Larger cities often have
more renters.
Ageofhousing. According to the 2000 census, more
than three-quarters of the housing units in the city were
built before 1980, with another 15% built during the
1980s. Reecting the city’s stable population and modest
growth in households, fewer than 10% of the housing
units counted in 2000 had been built during the 1990s.
About a third of the city’s housing units are more than 50
years old, and some 6,800 units (8% of the total) were
built before 1940. This reects the post-World War II
boom when Shreveport was growing quickly. Although
the city proper saw some residential development during
the 2000s, the general age distribution of the city’s
housing stock has not changed signicantly. Precise data
on age of housing are not available for the part of the plan
area outside the city boundaries. Housing developmentsin Keithville and North Highlands began in the 1970s
and 80s, but there has also been subdivision development
in recent decades.
Netproductionofnewhousing.Between 2000 and
2008, building permits were issued for 4,207 single-family
homes and 958 units in multifamily developments in the
Map 6.14 multIfamIly housIng
Market-rate Apartment Complexes (50+ units)50–100 units
101–200 units
201–300 units
301–475 units
Planning area
Shreveport boundaries
Map does not show Housing Authority properties.
Source: Goody Clancy (data from LSUS Shreveport-Bossier City Commercial and
Multi-Family Real Estate Market Report)

8/3/2019 Ch6_101221-LO
http://slidepdf.com/reader/full/ch6101221-lo 24/53
6 | L i v i n g i n S h v p o t - c a d d o : n i g h b o h o o d S a n d h o S i n g
6 . 2 4 G r a t x c t a t i o n s : s h r v o r t - c a d d o 2 0 3 0 M a s t r L a n
Figure 6.13 cIty of shreveport net housIngproductIon, 2000–2009
RESIDENtIALbuILDINGPERMItS
RESIDENtIALDEMOLItION
PERMItSNEt
NEw uNItS
2000–2009 total* 4,807 1,983 2,824
Annual average 502 207 295
* Through August 5, 2009
Source: City of Shreveport
city. Although not hit as hard as other regions by the end
of the housing bubble in 2008, the number of single-
family building permits in the city in 2008 and 2009 was
approximately half the 2006 number.
In the city, from 1990 to 2007, the number of housing
units increased by about 3 percent, from 87,473 to 90,334.
In Caddo Parish outside the city, the number of housing
units increased by 13 percent from 20,142 in 1990 to
22,789 in 2007. In the same period, the number of Bossier
Parish housing units grew by 35 percent, with a net increase
of 12,422 units.
The net new number of housing units also depends on the
number of demolitions. In the city, from 2000 to 2009, atotal of 4,807 residential building permits were issued along
with 1,983 demolition permits, resulting in a net increase
of residential units of 2,824. This equates to approximately
207 demolished units per year—just under half the number
of new units permitted.
Figure 6.11 multIfamIly housIng: marKet survey total(year end, 2008)
SubMARKEtSNuMbER OFPROPERtIES
NuMbER OFuNItS OCCuPANCy
B—Bo c 25 4,139 95%
c—c 5 806 94%
e—e 9 1,818 95%
n—noh 6 706 93%
se—soh 21 4,501 94%
sW—sohw 20 3,604 90%
W—W 14 2,364 97%
Totals 100 17,938 94%
Source: ESRI Business Analyst
2006 2007 2008 2009
Shreveport
Bossier City
Source: Goody Clancy, based on DouglasS. Bible, Ph.D., and Center for Business
& Economic Research, LSUS
n u m b e r o f p e r m I t s
Figure 6.12 sIngle-famIly buIldIng permIts,shreveport & bossIer cIty
Figure 6.10 housIng unIts: number, vacancy, tenure(2009)
CIty OF
ShREvEPORt
MPC AREA
OutSIDECIty
MAStER
PLAN AREA tOtAL
Total housing units 90,316 13,150 103,466
Occupied units 78,534 11,752 90,286
Vacant units 11,782 1,398 13,180
Percent vacant 13% 11% 13%
Owner-occupied 45,640 9,341 54,981
Percent of total occupied 58% 80% 61%
Renter-occupied 32,894 2,411 35,305
Percent of total occupied 42% 20% 39%
Source: ESRI Business Analyst

8/3/2019 Ch6_101221-LO
http://slidepdf.com/reader/full/ch6101221-lo 25/53
6 | L i v i n g i n S h v p o t - c a d d o : n i g h b o h o o d S a n d h o S i n g
6 . 2G r a t x c t a t i o n s : s h r v o r t - c a d d o 2 0 3 0 M a s t r L a n
Costofhousing.In December of 2009, the average
price of a single-family house was $160,238 in the
Shreveport-Bossier market, and the household income
needed to buy that average-priced home was $33,993.Data for 2008 show a median price at $113,000 (half
cost more, half cost less). The median household income
for the master plan area in 2009 was estimated at
$36,027. Because mortgage rates and housing prices were
quite low, many households had the income to purchase
a single-family house—if they had the creditworthiness
to qualify for a mortgage.3
Adjudicatedproperties. Adjudicated properties are
properties put up for sale by the City or the Parish to
satisfy outstanding property taxes, but that did notnd buyers at the auction. Although they remain in the
care of the governmental bodies, they do not become
government property unless the governments act to
take possession. Louisiana has a very long redemption
period for these properties, with complex notication
requirements and multiple opportunities for owners to
redeem them by paying the taxes owed. This means that
the properties remain vacant in neighborhoods for many
years while the legally required period for redemption
ticks down. It takes a minimum of ve years to transfer
ownership and often many more, and many of theseproperties have clouded title. The vast majority of
adjudicated properties are residential.
The master plan area contains 7,199 adjudicated
properties covering 1,586 acres in total. Ninety-ve
percent of these properties (6,838) lie within the city
limits, and 62% are located inside the loop.
Foreclosureconditions.Because Louisiana did not havea housing bubble, it has not suffered the same foreclosure
rates that accompanied the end of the bubble in otherstates from 2007 on. In 2009, however, Shreveport hadthe highest foreclosure need in Louisiana. In a survey of 13Louisiana jurisdictions receiving CDBG entitlement fundsShreveport ranked:
3 Douglas S. Bible, “Market Trends in Residential Real Estate,Shreveport-Bossier,” July 2009, LSUS. The charts in this section alsocome from this source. www.lsus.edu/cber/Real%20Estate/4th%20Q%20 Combined.pdf
• No. 1 in overall foreclosure need
• No. 2 in percentage of all loans that are consideredsubprime (15.4%)
• No. 1 in percentage of loans more than 30 days
delinquent (10.5%).
Predatory lending has been a problem in the area. People
who are elderly, lack education, or are unsophisticated
about borrowing have become involved without fully
understanding the consequences in a variety of complicated
loan products—such as interest-only loans, adjustable-
rate mortgages, negative-amortization loans, and reverse
mortgages.4
housiNg AffordAbility
Housing is typically dened as “affordable” when ahousehold pays no more than 30 percent of its income
for housing-related costs. For rental housing, this gure
includes rent and utility expenses; for homeowners, it
includes mortgage payments, taxes and insurance. The “no
more than 30% of income” standard is used by the U.S.
4 Foreclosure-response.org; City of Shreveport Consolidated Plan 2009-2013, p. 35.
Figure 6.15 adjudIcated propertIes and acres wIthIn the master plan area
tOtAL PERCENt ACRES
tOtAL AREA(LAND ONLy,IN ACRES)
Total adjudicated parcels 7,199 100% 1,586 196,934
Within city limits 6,838 95% 1,359 77,695
Inside the loop 4,439 62% 1,243 50,303
Figure 6.14 average annual sale prIce sIngle-famIly home (shreveport-bossIer)
Source: Bible, “Market Trends,” LSUS and NW Louisiana Association of Realtors
96 97 98 99 1 2 3 4 5 6 7 8 9Price $90.3 $97.9 $96.6 $98.9 $105 $105.4 $115.6 $126.6 $$139 $148.3 $150 $153.2 $161.6
Ination-adjustedPrice
$57.5 $63.5 $57.5 $58.7 $59.2 $57.5 $57.9 $67 $70.9 $73.5 $71.5 $71.2 $74.7
$20
$40
$60
$80
$100
$120
$140
$160
$180
PRICE
InflatIon-adjustEd PRICE
tHousands

8/3/2019 Ch6_101221-LO
http://slidepdf.com/reader/full/ch6101221-lo 26/53
6 | L i v i n g i n S h v p o t - c a d d o : n i g h b o h o o d S a n d h o S i n g
6 . 2 6 G r a t x c t a t i o n s : s h r v o r t - c a d d o 2 0 3 0 M a s t r L a n
Vacant & Adjudicated Property
Source: NLCOG 2009
Adjudicated
Parcels without structures
Planning area
City boundary
Map 6.15 vacant and adjudIcated propertIes
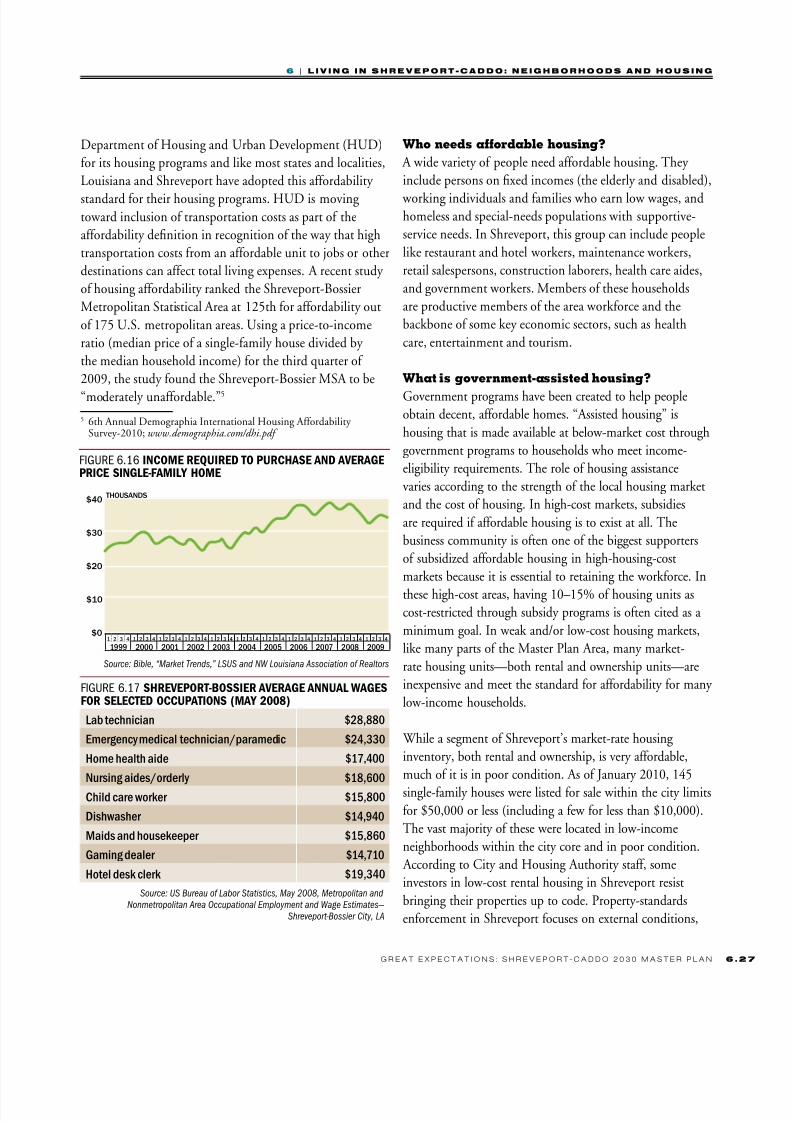
8/3/2019 Ch6_101221-LO
http://slidepdf.com/reader/full/ch6101221-lo 27/53
6 | L i v i n g i n S h v p o t - c a d d o : n i g h b o h o o d S a n d h o S i n g
6 . 2G r a t x c t a t i o n s : s h r v o r t - c a d d o 2 0 3 0 M a s t r L a n
Department of Housing and Urban Development (HUD)
for its housing programs and like most states and localities,
Louisiana and Shreveport have adopted this affordability
standard for their housing programs. HUD is movingtoward inclusion of transportation costs as part of the
affordability denition in recognition of the way that high
transportation costs from an affordable unit to jobs or other
destinations can affect total living expenses. A recent study
of housing affordability ranked the Shreveport-Bossier
Metropolitan Statistical Area at 125th for affordability out
of 175 U.S. metropolitan areas. Using a price-to-income
ratio (median price of a single-family house divided by
the median household income) for the third quarter of
2009, the study found the Shreveport-Bossier MSA to be
“moderately unaffordable.”5
5 6th Annual Demographia International Housing Affordability Survey-2010; www.demographia.com/dhi.pdf
Who needs affordable housing?
A wide variety of people need affordable housing. They
include persons on xed incomes (the elderly and disabled),
working individuals and families who earn low wages, andhomeless and special-needs populations with supportive-
service needs. In Shreveport, this group can include people
like restaurant and hotel workers, maintenance workers,
retail salespersons, construction laborers, health care aides,
and government workers. Members of these households
are productive members of the area workforce and the
backbone of some key economic sectors, such as health
care, entertainment and tourism.
What is government-assisted housing?
Government programs have been created to help peopleobtain decent, affordable homes. “Assisted housing” is
housing that is made available at below-market cost through
government programs to households who meet income-
eligibility requirements. The role of housing assistance
varies according to the strength of the local housing market
and the cost of housing. In high-cost markets, subsidies
are required if affordable housing is to exist at all. The
business community is often one of the biggest supporters
of subsidized affordable housing in high-housing-cost
markets because it is essential to retaining the workforce. In
these high-cost areas, having 10–15% of housing units ascost-restricted through subsidy programs is often cited as a
minimum goal. In weak and/or low-cost housing markets,
like many parts of the Master Plan Area, many market-
rate housing units—both rental and ownership units—are
inexpensive and meet the standard for affordability for many
low-income households.
While a segment of Shreveport’s market-rate housing
inventory, both rental and ownership, is very affordable,
much of it is in poor condition. As of January 2010, 145
single-family houses were listed for sale within the city limits
for $50,000 or less (including a few for less than $10,000).
The vast majority of these were located in low-income
neighborhoods within the city core and in poor condition.
According to City and Housing Authority staff, some
investors in low-cost rental housing in Shreveport resist
bringing their properties up to code. Property-standards
enforcement in Shreveport focuses on external conditions,
Figure 6.17 shreveport-bossIer average annual wagesfor selected occupatIons (may 2008)
Lab technician $28,880
Emergency medical technician/paramedic $24,330
Home health aide $17,400
Nursing aides/orderly $18,600
Child care worker $15,800
Dishwasher $14,940
Maids and housekeeper $15,860
Gaming dealer $14,710
Hotel desk clerk $19,340
Source: US Bureau of Labor Statistics, May 2008, Metropolitan and
Nonmetropolitan Area Occupational Employment and Wage Estimates—
Shreveport-Bossier City, LA
Figure 6.16 Income requIred to purchase and averageprIce sIngle-famIly home
Source: Bible, “Market Trends,” LSUS and NW Louisiana Association of Realtors
$40
$30
$20
$10
$0
tHousands
1 2 3 4 1 2 3 4 1 2 3 4 1 2 3 4 1 2 3 4 1 2 3 4 1 2 3 4 1 2 3 4 1 2 3 4 1 2 3 4 1 2 3 4
1999 2000 2001 2002 2003 2004 2005 2006 2007 2008 2009

8/3/2019 Ch6_101221-LO
http://slidepdf.com/reader/full/ch6101221-lo 28/53
6 | L i v i n g i n S h v p o t - c a d d o : n i g h b o h o o d S a n d h o S i n g
6 . 2 8 G r a t x c t a t i o n s : s h r v o r t - c a d d o 2 0 3 0 M a s t r L a n
and the lack of a rental code means that many rental units,
although affordable, offer substandard living conditions.
Assisted-housing programs have many technical require-ments. In most, households pay no more than 30% of their
income, and the government pays the difference. Standard
denitions are based on an “area median income” (AMI)
that is calculated annually by HUD for metropolitan areas.
The FY 2009 AMI for a family of four in the Shreveport-
Bossier metropolitan area is $52,300. Most HUD programstarget households below 80% of AMI, which is $41,850
in FY2009 for a family of four in Shreveport-Bossier. The
Map 6.16 tax-credIt and housIng authorIty propertIes
Tax-Credit and Housing Authority PropertiesLow-Income Housing Tax Credit property
Shreveport Housing Authority property
Planning area
Shreveport boundaries
Properties include vacant land, single
units, and multifamily developments★
Sources: U.S. Department of HUD; NLCOG, 2009

8/3/2019 Ch6_101221-LO
http://slidepdf.com/reader/full/ch6101221-lo 29/53
6 | L i v i n g i n S h v p o t - c a d d o : n i g h b o h o o d S a n d h o S i n g
6 . 2G r a t x c t a t i o n s : s h r v o r t - c a d d o 2 0 3 0 M a s t r L a n
Low-Income Housing Tax Credit program, described
below, targets households below 60% of AMI, and pub-
lic housing usually focuses on assisting very-low-income
households at 30% of AMI or below. In communities where the gap between housing costs and household in-
comes is particularly wide, state and local governments have
increasingly included households with incomes between
80% and 120% of AMI for homebuyer assistance—which
has been done in Shreveport.
In 2009, HUD released estimates of the number of house-
holds with housing affordability problems based on the
Census’s American Community Survey data for 2005-2007.
In Caddo Parish, 22% of homeowners and 49% of the renter
households were estimated to have housing problems. Asmight be expected, housing problems were particularly severe
among very-low-income renter households making 30% of
AMI of less. Twenty-four percent of all renter households
were making 30% AMI or less ($15,700 dollars annually for
a family of four) and had housing problems.6 The Louisiana
Housing Finance Agency has estimated that in 2012 there
will be demand for 3,685 rental units affordable to house-
holds making less than 80% of AMI, and demand for 3,765
ownership units.7
Assisted housing
HousingChoiceVouchers(Section8).Housing Choice
Vouchers (HCV, previously known as “Section 8”) provide
federal funds to make up the difference between what
a tenant can afford to pay (30% of income) and the
monthly rent, up to limits set annually by HUD. Housing
authorities are assigned a set number of vouchers to
administer. The vouchers can be “project-based,” meaning
tied to a particular physical housing unit, or “tenant-
based,” meaning that individuals can go into the private
housing market to use the voucher. Every year, HUD sets
limits, called Fair Market Rents (FMR), on the amount
of rent payable under vouchers based on unit size and
location. Tenant-based vouchers are not tied to a particular
location, and the holder of the voucher can go anywhere
in the United States to rent a place to live. The Shreveport
metropolitan area has higher FMRs than four of the other
6 http://www.huduser.org/portal/datasets/cp.html 7 LHFA Housing Needs Assessment for Caddo Parish, January 2010
eight Louisiana MSA regions. The FY2010 Fair Market
Rents for the Shreveport-Bossier MSA (which also includes
DeSoto Parish) are:
• Studio—$535• One-bedroom—$615
• Two-bedroom—$719
• Three-bedroom—$912
• Four-bedroom—$941
The Shreveport Housing Authority and the Caddo Parish
Commission administer Section 8 programs. As of January
2010, the Housing Authority was authorized to issue up
to 3,274 tenant-based vouchers, but only about 2,800
were funded, and 2,394 were in use. The average wait time
to get a voucher was three years. Project-based vouchersare assigned to several privately-owned assisted housing
developments: University Oaks I and II; US Goodman
Plaza; McAdoo Hotel (single-room occupancy or SRO);
Buckhalter (SRO).
Publichousing.The Shreveport Housing Authority owns
a total of 719 public housing units, of which 175 are
scattered-site single-family houses. The authority manages
another 294 units, for a total of 1,013 units. As of 2008,
61% of public housing residents were very-low-income (less
than 30% of area median income). In January 2010, there
were 306 names on the waiting list for public housing; on
average, the wait for a public housing unit was six months
to a year.
The Housing Authority owns land in Allendale, where
270 housing units were demolished several years ago.
The authority plans to rebuild that development with
approximately 150 units in a mix of cottages and
townhouses as well as a mix of incomes (up to 80% of
AMI). Approximately 20% of the units would be for
elderly households. The property lies within the proposed
right-of-way for the I-49 Inner City Connector, a highway
project that is under study but has not been approved or
funded (see Chapter 9 for a discussion). Map 6.15 shows
the location of Housing Authority properties, not all of
which represent multifamily developments—some are
single-family houses scattered within neighborhoods and
some locations are vacant parcels.

8/3/2019 Ch6_101221-LO
http://slidepdf.com/reader/full/ch6101221-lo 30/53
6 | L i v i n g i n S h v p o t - c a d d o : n i g h b o h o o d S a n d h o S i n g
6 . 3 0 G r a t x c t a t i o n s : s h r v o r t - c a d d o 2 0 3 0 M a s t r L a n
Supportivehousingforelderlyanddisabledpersons.
Several HUD programs provide funding to nonprot
housing organizations for supportive housing for the
elderly and disabled. Supportive housing includes servicesto help residents in their daily lives, and units involved
in these programs must remain affordable for 40 years.
Shreveport has 349 such housing units.
Low-IncomeHousingTaxCredit(LIHTC)Program.
Created by the 1986 federal Tax Reform Act, the LIHTC
program has become the major source of nancing
for affordable rental housing in the United States by
providing tax benets to developers of housing that meets
specic criteria. The LIHTC program provides a dollar-
for-dollar reduction in a developer’s tax liability for a ten-year period. The major elements of tax credit nancing as
it functions in Louisiana are:
• Projects must have rent-restricted units that meet
either of two conditions: 1) at least 20% of households
have incomes at or below 50% of AMI; or 2) at least
40% of households have incomes at or below 60% of
AMI.
• Projects must meet the low-income requirements for
at least 30 years.
• The State of Louisiana receives a xed allocation of tax
credits based on its population.
• The Louisiana Housing Finance Agency (LHFA)
allocates the tax credits in a competitive process based
on priorities it denes in an annual qualied allocation
plan (QAP).
• Developers raise capital for the project by syndicating
the tax credit to an investor or group of investors.
• State agencies are responsible for monitoring
compliance with the requirements of the projects.
HUD counts 2,461 housing units in 59 ShreveportLIHTC projects placed in service through 2007. The
projects range from 1 to 254 units, with an average of
about 50 per project. A few additional projects have been
approved since 2008. The system for awarding tax credits
is run by the State through LHFA, but the State did
not have a comprehensive housing policy until recently,
and communication about projects with municipalities
was not a priority. As a result, Shreveport historically
has had little inuence over how the QAP, allocation of
tax credits, or approval of projects might address local
priorities for location or design quality—though the City has also lacked policies about affordable housing. Map
6.16 shows the location of LIHTC housing developments
built up to 2007.
City of shreveport housiNg ANd
Neighborhood progrAms
Since 2000, most of the City’s efforts through the
Community Development Department and nonprot
housing developers have been directed toward assisting
low- and moderate-income homeowners and helping
more households become homeowners. The Housing Authority and some nonprots focus on providing
rental housing and programs predominantly for very-
low-income households. LIHTC projects provide rental
housing for low- and moderate-income households.
The Community Development Department operates
housing-related programs using federal and private
funding sources, coordinates volunteer housing activities,
and works with nonprot developers of affordable
housing.
Federal funding
The City of Shreveport is an “entitlement community,”
which means that it receives annual funding from
the federal government for housing and community
development purposes, based on a formula that includes
population, poverty rates, age of housing and similar
criteria. The funds must be used to benet low- and
moderate-income persons (households at 80% or less
of AMI), who can l ive anywhere in the city or in census
tracts that have at least 51% low- and moderate-income
households. In order to receive these funds, the City must
prepare a ve-year strategic plan, called the Consolidated
Plan, and associated one-year action plans.
Every year, the City typically receives about $2.6 million in
CDBG (Community Development Block Grant) entitlement
funds and $1.5 million in HOME (housing) funds, as well as
smaller amounts for emergency grants for homeless shelters.

8/3/2019 Ch6_101221-LO
http://slidepdf.com/reader/full/ch6101221-lo 31/53
6 | L i v i n g i n S h v p o t - c a d d o : n i g h b o h o o d S a n d h o S i n g
6 . 3G r a t x c t a t i o n s : s h r v o r t - c a d d o 2 0 3 0 M a s t r L a n
In addition, the City operates some revolving-fund programs
that produce income as loans are repaid.
The City can use CDBG funds for a wide range of community development activities aimed at revitalizing
neighborhoods, promoting economic development, or
improving community facilities and services. Affordable
housing was identied as the top priority in the 2009-
2013 Consolidated Plan.
Neighborhood revitalization program
The City offers housing programs under the umbrella name
of the Neighborhood Revitalization Program, which focuses
on ownership housing.
HAPPIProgram(HomeBuyersAssistanceProgram
ParticipationInitiative).This program offers
downpayment, buydown and closing-cost assistance up
to 20% of the sales price or appraised value throughparticipating local lenders in partnership with the City of
Shreveport. This assistance is available to income-eligible
rst time homebuyers (dened as not owning a home
within the last three years) who complete an approved
homebuyer-education class. Volunteers of America and
other nonprots run the homebuyer training programs.
The applicants also have to qualify for a mortgage with a
lender approved by the City, and the property itself must
meet HUD housing-quality standards.
The Consolidated Plan calls for moretraining programs in homeownership
and credit counseling; funding
assistance for downpayments, closing
costs and principal write-downs; and
new construction and lease-purchase
programs.
Rehabilitationassistance.
Rehabilitation assistance through
grants or loans is available to
income-eligible owner-occupantsto bring their properties up to
minimum housing-quality standards.
Many clients of these programs are
elderly and/or disabled low-income
households who do not have the
money to maintain and repair their
homes. There are several types of
rehab programs: Emergency Repairs,
Exterior Façade Programs, and
Limited Repair. The Emergency
Repair program is for immediate
health and safety issues. TheExterior
Façade programs include two annual
volunteer programs—Paint Your
Heart Out Shreveport and World
Changers—and programs that
provide wheelchair ramps and roof
Map 6.17 cdbg-elIgIble census tracts
CDBG-eligible AreasCDBG-eligible block groups Planning area Shrevepor t boundaries
Source: NLCOG, 2009

8/3/2019 Ch6_101221-LO
http://slidepdf.com/reader/full/ch6101221-lo 32/53
6 | L i v i n g i n S h v p o t - c a d d o : n i g h b o h o o d S a n d h o S i n g
6 . 3 2 G r a t x c t a t i o n s : s h r v o r t - c a d d o 2 0 3 0 M a s t r L a n
repairs. The LimitedRepairprogram addresses major
system repairs, exterior repairs, energy efciency, and
interior health and safety repairs.
The Consolidated Plan sets goals for emergency repairs,
limited rehabilitation, and reconstruction.
New construction and land acquisition for
affordable housing and homeownership
In the late 1990s and early 2000s, the Community
Development Department commissioned a two-
stage Strategic Neighborhood Revitalization Plan that
identied, analyzed and recommended revitalization
programs for eight neighborhoods in the city core plus
the MLK neighborhood. The City Council, acting as aredevelopment agency, also acquired a relatively small
number of adjudicated lots by eminent domain and sold
or donated them to small nonprots, many of them
faith-based, for redevelopment as affordable ownership
housing. This program ended with voter approval of an
amendment to the Louisiana constitution strictly limiting
the conditions for eminent domain takings by government.
Some of the purchased properties have been developed into
affordable homes, but not all recipient organizations proved
capable of building and selling houses to eligible buyers. As
a result, some of these lots have yet to see any construction.
In 2007, the Community Development Department
launched an initiative to plan and build ownership housing in
income-eligible neighborhoods. As of 2010, the department
has developed or is in process of developing several small
ownership projects. These projects require several layers
of funding for site acquisition, design and other soft costs,
infrastructure and construction. Funding comes from a range
of federal, state, local and private sources. Infrastructure
improvements or completely new infrastructure has proved
necessary in these projects, adding a million dollars or more to
their costs, even though they are located in older parts of the
city. Funding for the infrastructure comes from both public
and private sources. Current projects are:
• Shepherd Place—MLK neighborhood
> 22 three- and four-bedroom single-family houses;
51% restricted to low-/moderate-income households;
> Three-year lease-sale program during which the
lessees received homebuyer and credit counseling;
> 25% subsidy of purchase price for downpayment and
closing costs.
• Concordia Place—Stoner Hill
> 25-40 energy-efcient units in two phases (phase one
under construction 2010);
> most of the land was purchased from a nonprot;
> rst phase homebuyers (12 single-family units)
receive up to $30,000 in downpayment assistance,
homebuyer and credit counseling;
> for households of up to 120% of AMI, or $62,700
for a family of four.
• Heritage Place—Allendale
> future project of 30-40 single-family, 3- and
4-bedroom houses;
> the goal is to demolish 81 blighted buildings and
redevelop 78 vacant properties;
> for households at or below 120% of AMI, with a
quarter of homes being sold to people at or below
50% of AMI;
> because of requirements of the funding source, most
of the lots are adjudicated properties.
• Cedar Grove East
> With the collaboration of Community Support
Programs, a nonprot developer, the project has
entered the conceptual stage. The development will
include a mix of types (apartments, townhouses, and
cottages), tenures (rental and ownership), income
levels, and a possible mixture of uses on Line Avenue.
Community Development plans future ownership
development projects in Ledbetter Heights, Cedar Grove,
Hollywood, Mooretown, Sunset Acres, Cherokee Park, and
Highland. Like the Allendale project, eligibility criteria will
be set at 120% of AMI, with one quarter of the buildings
available to households at or below 50% of AMI. These
housing projects are planned and managed by Community
Development Department staff with the assistance of
consultants. In the case of larger projects, the department
expects to work with local nonprot organizations to build
housing units
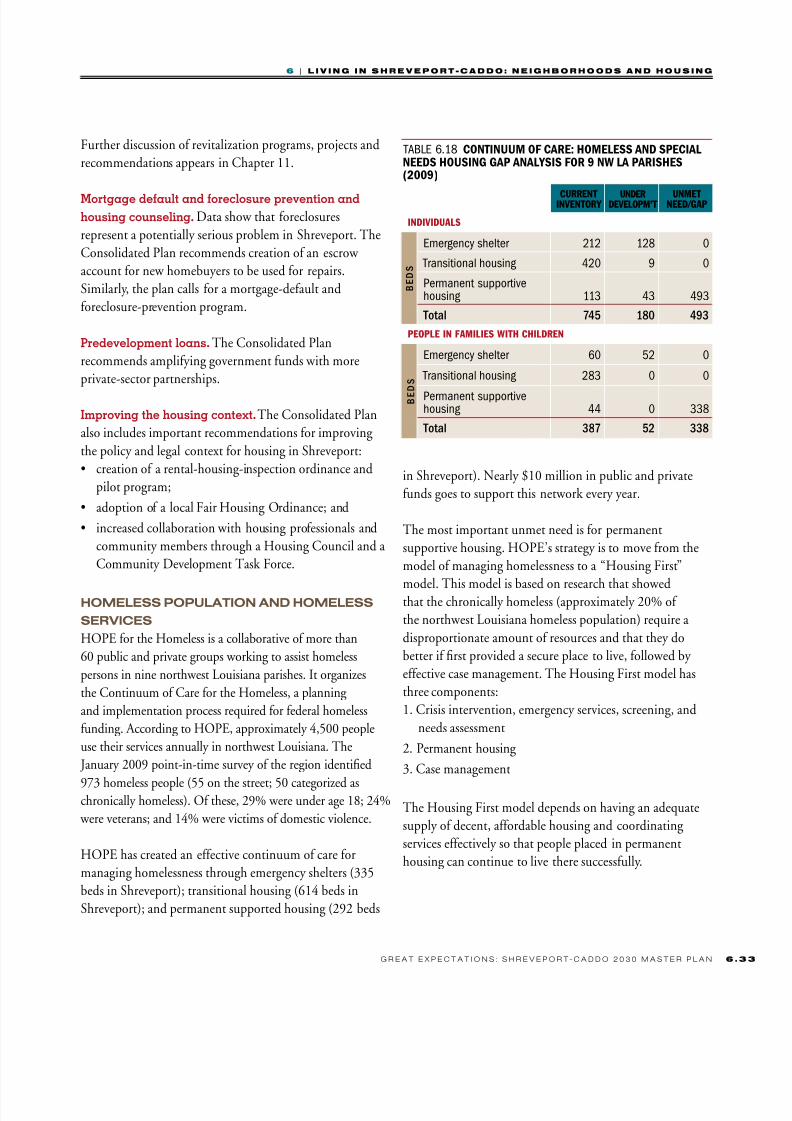
8/3/2019 Ch6_101221-LO
http://slidepdf.com/reader/full/ch6101221-lo 33/53
6 | L i v i n g i n S h v p o t - c a d d o : n i g h b o h o o d S a n d h o S i n g
6 . 3G r a t x c t a t i o n s : s h r v o r t - c a d d o 2 0 3 0 M a s t r L a n
in Shreveport). Nearly $10 million in public and private
funds goes to support this network every year.
The most important unmet need is for permanent
supportive housing. HOPE’s strategy is to move from the
model of managing homelessness to a “Housing First”
model. This model is based on research that showedthat the chronically homeless (approximately 20% of
the northwest Louisiana homeless population) require a
disproportionate amount of resources and that they do
better if rst provided a secure place to live, followed by
effective case management. The Housing First model has
three components:
1. Crisis intervention, emergency services, screening, and
needs assessment
2. Permanent housing
3. Case management
The Housing First model depends on having an adequate
supply of decent, affordable housing and coordinating
services effectively so that people placed in permanent
housing can continue to live there successfully.
taBle 6.18 contInuum of care: homeless and specIalneeds housIng gap analysIs for 9 nw la parIshes(2009)
CuRRENtINvENtORy uNDERDEvELOPM’t uNMEtNEED/GAP
INDIvIDuALS
B E D
S
em h 212 128 0
to ho 420 9 0
pm ovho 113 43 493
Total 745 180 493
PEOPLE IN FAMILIES wIth ChILDREN
B E
D
S
em h 60 52 0
to ho 283 0 0
pm ovho 44 0 338
Total 387 52 338
Further discussion of revitalization programs, projects and
recommendations appears in Chapter 11.
Mortgagedefaultandforeclosurepreventionand
housingcounseling.Data show that foreclosures
represent a potentially serious problem in Shreveport. The
Consolidated Plan recommends creation of an escrow
account for new homebuyers to be used for repairs.
Similarly, the plan calls for a mortgage-default and
foreclosure-prevention program.
Predevelopmentloans.The Consolidated Plan
recommends amplifying government funds with more
private-sector partnerships.
Improvingthehousingcontext.The Consolidated Plan
also includes important recommendations for improving
the policy and legal context for housing in Shreveport:
• creation of a rental-housing-inspection ordinance and
pilot program;
• adoption of a local Fair Housing Ordinance; and
• increased collaboration with housing professionals and
community members through a Housing Council and a
Community Development Task Force.
homeless populAtioN ANd homeless
serviCes
HOPE for the Homeless is a collaborative of more than
60 public and private groups working to assist homeless
persons in nine northwest Louisiana parishes. It organizes
the Continuum of Care for the Homeless, a planning
and implementation process required for federal homeless
funding. According to HOPE, approximately 4,500 people
use their services annually in northwest Louisiana. The
January 2009 point-in-time survey of the region identied
973 homeless people (55 on the street; 50 categorized aschronically homeless). Of these, 29% were under age 18; 24%
were veterans; and 14% were victims of domestic violence.
HOPE has created an effective continuum of care for
managing homelessness through emergency shelters (335
beds in Shreveport); transitional housing (614 beds in
Shreveport); and permanent supported housing (292 beds
8/3/2019 Ch6_101221-LO
http://slidepdf.com/reader/full/ch6101221-lo 34/53
6 | L i v i n g i n S h v p o t - c a d d o : n i g h b o h o o d S a n d h o S i n g
6 . 3 4 G r a t x c t a t i o n s : s h r v o r t - c a d d o 2 0 3 0 M a s t r L a n
b. cmmuy issues
cers
Shreveport-Caddo residents agree that neighborhoodquality of life and housing issues are central to a successful
future for the Shreveport-Caddo planning area.
Public opinion survey
Improving neighborhood quality of life, assuring quality
housing for all, and revitalizing areas with vacant housing
and land consistently attracted strong support in the public
opinion survey:
• 81% of respondents called improving quality of life
“very important” to the future of the Shreveport area.
• 67% said it was “very important” and 23% said it was “somewhat important” to the area’s future to have
quality housing for all income groups.
• 48% said it was “very important” and 34% said it
was “somewhat important” to revitalize central city
neighborhoods.
• 46% said it was “very important” and 34% said it was
“somewhat important” to improve the function and
appearance of commercial areas.
• 52% strongly agreed and 32% agreed that Shreveport’s
future should include redevelopment of areas withvacant buildings and land.
Survey respondents saw room for improvement. While
59% reported that the condition of their neighborhood
had stayed the same in recent years, a greater percentage
felt that conditions in their neighborhood were worsening
(24%) rather than improving (14%). And most did not
yet see the Shreveport area as an excellent place to live.
Only 20% called it excellent, while 39% deemed it good,
and 31% felt it was just average.
Vision forum for the 2030 master plan and
“speak out” neighborhood vision meetings
Neighborhood issues and housing were frequently
mentioned at these meetings. Participants talked about
how much value they put on sense of community, family,
and connected neighborhoods. They saw opportunities for
community renewal and pride, development of a housing
policy and program for affordable housing, and envisioned:
• self-sustaining neighborhoods that are age-, race-
and income-integrated, with local food, recreation,
educational outreach, neighborhood retail, andeconomic opportunities;
• neighborhoods with easy access to work areas and
commerce areas and with better and affordable housing;
• neighborhoods that are well cared for, safe, and that
generate pride; and
• enforcement of laws and regulations in the neighborhoods.
District and neighborhood meetings
The major concerns that surfaced in district and
neighborhood level meetings included:
Enforcementofpropertystandards,housingand
zoningcodes.Residents use the term “code enforcement”
to refer to a broad range of enforcement issues at the
neighborhood level, primarily relating to private property
conditions, especially the following:
• Blight elimination
• Property maintenance and upkeep
• Safe and sanitary housing conditions
• Illegal home businesses
• Littering
• Other “quality of life” violations such as junk cars,
dumping, and so on.
Affordablehousing. While housing costs are relatively low
in the Shreveport-Caddo area, much low-cost housing—
both market rate and subsidized— is of poor quality. In
recent years, new housing assisted through federal Low-
Income Housing Tax Credits (LIHTC) has been the most
common type of subsidized housing. Many residents
believe that LIHTC developments will bring downproperty values, that they will be poorly maintained and
attract crime, and that they are poorly built and designed,
so these residents feel that such housing does not t in
with surrounding neighborhoods. Market-rate affordable
housing, such as mobile home parks and older housing that
is poorly maintained, also concerns many residents because
of potential impacts on neighborhoods.
8/3/2019 Ch6_101221-LO
http://slidepdf.com/reader/full/ch6101221-lo 35/53
6 | L i v i n g i n S h v p o t - c a d d o : n i g h b o h o o d S a n d h o S i n g
6 . 3G r a t x c t a t i o n s : s h r v o r t - c a d d o 2 0 3 0 M a s t r L a n
Neighborhoodretailandservices. With the exception
of the eastern and southeastern parts of the city, Shreveport
neighborhoods would like to see more, or more diverse
neighborhood-serving retail and services. In general,residents mentioned the unattractiveness of almost all
commercial corridors throughout the city.
Walkabilityandconnectivity.Residents in all parts of
the planning area, and particularly in the city, called for
sidewalks and safe and attractive pedestrian conditions.
In addition, many residents recognized a need to better
connect neighborhoods, for community amenities like
parks and neighborhood commercial districts, and asked
for more greenways and bicycle-pedestrian trails.
Participationinplanninganddevelopmentdecisions.
Neighborhood residents reported feeling that they are
not consulted early enough in planning, zoning and
development decisions. Neighborhood input about the
potential impacts of subsidized housing, especially LIHTC
developments, mobile home parks, and commercial projects
ranked as particular concerns.
Infrastructureandotherpublicinvestments.City
residents felt that public resources were going to pay for
infrastructure and services to new development at the city edges (the result of “leapfrog development”) rather than
being applied to repair and maintain existing infrastructure
and keep up services. Residents from all parts of the city
reported infrastructure problems, from ooding and water
main breaks to sewer backups.
Neighborhoods and housing in the Vision and
Principles
The Vision describes neighborhoods as “safe, clean and
welcoming...connected by shared civic spirit and a network
of inviting public spaces and transportation choices….
our diverse neighborhoods offer attractive and affordable
choices for [all kinds of households].”
Many master plan principles directly support neighborhood
and quality of life:
• Connected people and places
• Fairness and opportunity for everyone
• Good stewardship of our natural and cultural heritage
• A green and healthy community
• High standards of quality in development and design
• Communication, transparency and community
participation.
c. Srees as
aee e gls
Enhancedcharacterandlivabilityfor
allneighborhoods,withinvestmentsto
improvequalityoflife.
Goal 1
Policies:
• Support initiatives and investments that improve
physical character and environment, function,
and access to community amenities throughout
the Master Plan Area.
• Promote neighborhood associations and
community activities to encourage neighborhood
identity, sense of ownership, and advocacy.
• Promote proactive planning on the district and
neighborhood level.
• Create a structured community participation
system for project review.
STRATEGIES
A. Revise the regulatory system for residential
districts.
Zoning and other development regulations should
promote infill and new neighborhoods with a diversity
of housing choices, interconnections and appropriate
transitions; support desired neighborhood character;
and make it easy for property owners and developers
to understand the requirements for improving existing
properties or building new housing.

8/3/2019 Ch6_101221-LO
http://slidepdf.com/reader/full/ch6101221-lo 36/53
6 | L i v i n g i n S h v p o t - c a d d o : n i g h b o h o o d S a n d h o S i n g
6 . 3 6 G r a t x c t a t i o n s : s h r v o r t - c a d d o 2 0 3 0 M a s t r L a n
Action
1.Reviseresidentialzoningtoreflectexistingand
desiredcharacter. As noted in Chapter 3, the city contains many
separate single-family/two-family residential
districts distinguished only by very small
differences in density. In other cases, areas
may be zoned for multifamily development but
are predominantly or entirely single-family in
character. Locations suitable for multifamily,
townhouse, or mixed residential and commercial
uses have not been established with planning
criteria. The Future Land Use Map in Chapter 12
provides guidance for residential uses. Zoningthat reflects existing residential character,
where the desire is to retain it, or that reflects
desired future character, where change would
be beneficial, should be put in place. This
process will involve writing standards for infill
development or new housing, as well as for
suitable transitions between areas of higher
density and areas of lower density. Standards
for site design and building form should be the
focus, rather than the current practice of relying on
fences and unconnected streets to create pod-like
development sites that separate different density
levels and land uses.
B. Create a system for Area Plans and engage
neighborhood residents, businesses, property
owners and other stakeholders in proactive
planning connected to the Master Plan and its
policies.
Actions
1.Identifyasetofplanningdistrictsdefinedby
geographyandcharacter.
Shreveport and the Master Plan Area have a large
number of neighborhoods and small subdivisions
in an exceedingly large area. By dividing the
Master Plan Area into a set of planning districts,
the MPC can develop broad policies appropriate
to these areas which will then inform decision-
making about land use, transportation and
infrastructure. The proposed planning districts in
Map 6.18 were created to:
• Use census tracts/block groups and city limits
in district boundaries in order to facilitate data
gathering.
• Reflect policy preferences about areas “inside
the loop” and “outside the loop.”
• Reflect urban, suburban and exurban
character.
The seven large districts were created to reflect
the overall policy focus in the Vision andPrinciples to promote growth within the loop.
Then, Districts 2 through 6 were further subdivided
to reflect different characteristics:
PlanningDistrict1—DowntownandVicinity.
Downtown is unique in character, complexity and
importance, so it is a separate planning district.
Map 6.18 proposed plannIng dIstrIcts
Sources: NLCOG, Goody Clancy
8/3/2019 Ch6_101221-LO
http://slidepdf.com/reader/full/ch6101221-lo 37/53
6 | L i v i n g i n S h v p o t - c a d d o : n i g h b o h o o d S a n d h o S i n g
6 . 3G r a t x c t a t i o n s : s h r v o r t - c a d d o 2 0 3 0 M a s t r L a n
Because the potential for downtown goes beyond
the Central Business District and West Edge,
nearby areas were also included by using the
Downtown Development Authority boundariesfor the planning district. Planning policies for
downtown include promoting housing, historic
preservation, arts and entertainment, access to
the waterfronts, and interconnections to increase
walkability. (See Chapter 10, which focuses on
Downtown and the Waterfront.)
PlanningDistrict2—CoreRevitalizationAreas.
The Core Revitalization Areas are located
within the loop and in the MLK neighborhood.
Although this diverse planning district has a
number of well-kept homes and stable areas,
it is also the location of most vacant buildings,
blight, and adjudicated properties. This area
also has concentrations of older and obsolete
commercial and industrial areas. Because
Planning District 2 is so large, it is divided into
three subdistricts: 2A—within the city limits
north of downtown, including MLK and other
predominantly residential neighborhoods, as
well as residential and nonresidential areas
with the potential to benefit from proximity
to the river and to downtown; 2B—areas that
can benefit from proximity to regional assets
such as a revitalized downtown and the large
employment centers represented by the medical
districts; and 2C—areas with complex mixtures
of residential, commercial and industrial uses
that need significant new planning to reach their
potential. Planning policies for Planning District
2 will take a strategic and integrated approach
to revitalization, making significant investments
to create critical mass.
PlanningDistrict3—East.Planning District
3 contains the largest number of stable
neighborhoods within the loop, the majority of
retail areas, and many neighborhood amenities,
although it also has a share of disinvested
neighborhoods. Subdistrict 3A is the older part
of the East District and includes neighborhoods
in transition such as Highland and Stoner
Hill. Subdistrict 3B has a somewhat different
character because more of it was built after World War II. Planning policies for District 3
should promote neighborhood stability and
selective revitalization, infill housing, pedestrian
and bicycle connections, and improvement of
traffic function.
PlanningDistrict4—North.Planning District 4
encompasses the part of the master plan area
that lies north of the city limits and Cross Lake.
Subdistrict 4A has already seen subdivision
development, and the construction of I-49 may
bring new development pressures. Subdistrict 4B
is more rural, with a few subdivisions. Policies
in Planning District 4 should focus on avoiding
sprawl and scattered exurban development and
shaping orderly suitable development to protect
rural character and sensitive environments.
PlanningDistrict5—West.Planning District 5
is divided into Subdistrict 5A, which includes
subdivisions and other development within the
city limits, and Subdistrict 5B, a mix of industrial,
commercial and exurban development, as well
as rural areas. Planning policies for Subdistrict
5A should focus on identifying areas for infill
and future development, connecting isolated
neighborhoods, integrating into the city’s system
of green infrastructure any environmentally
sensitive areas and other areas not suitable
for development, and planning for more
neighborhood-serving retail as the market
permits.
PlanningDistrict6—Southwest.Planning
District 6 is similar to Planning District 5 in
that Subdistrict 6Ais an established suburban
area within the city limits and Subdistrict
6B is characterized by sprawling, exurban
development. The residential parts of 6A need
monitoring to make sure that as Southern Hills

8/3/2019 Ch6_101221-LO
http://slidepdf.com/reader/full/ch6101221-lo 38/53
6 | L i v i n g i n S h v p o t - c a d d o : n i g h b o h o o d S a n d h o S i n g
6 . 3 8 G r a t x c t a t i o n s : s h r v o r t - c a d d o 2 0 3 0 M a s t r L a n
and other long-established developments in the
area go through a generational transition, with
older residents giving way to younger residents,
the area remains in good condition. Planningpolicies for Subdistrict 6B should focus on
connections and avoiding further sprawl.
PlanningDistrict7—Southeast.Planning
District 7 has attracted higher-cost residential
development and some neighborhood-serving
retail and services. It also includes the port and
its associated industrial land. Developments
that have been annexed by the City have
created costly infrastructure and service
obligations. Planning policies for this area will
need to recognize the existing development,
infrastructure investments and momentum
around certain locations, such as the port.
However, policies should focus on limiting
further sprawl development and assumption of
infrastructure and service demands by the City.
2.PrepareFrameworkPlansforeachPlanning
District.
Because the planning districts and subdistricts
are large and diverse, MPC staff should prepareFramework Plans that translate the policies of the
Shreveport-Caddo Master Plan into more specific
planning principles for each planning district
and subdistrict. Framework Plans should include
policies on the following issues:
• infill development
• subdivision character and connectivity
• mixed use and commercial districts
• open space and green systems
• infrastructure and services
Chapter 12 will provide a foundation for the
Framework Plans. Draft Framework Plans
should be discussed in public meetings with
neighborhood associations, other residents,
business owners, and property owners in
each planning district or subdistrict. Then the
Framework Plans should be presented to the MPC
Board for approval through a public hearing
process and adopted as part of the master plan.
3.PrioritizedevelopmentofFrameworkPlansbasedondevelopmenttrendsandstrategic
investments.
As of mid-2010, areas that are likely to experience
sprawl development pressures are proposed
Planning Districts 7 and 6B. As I-49 construction
moves south toward I-220, Districts 4A and 2A will
also need a planning framework to reduce the
likelihood of sprawl development. The Framework
Plan for Planning District 2B—featured in Chapter
11 as strategic area for revitalization—should
be relatively easy to develop based on theconceptual plan in Chapter 11.
4.DeveloptemplatestocreateAreaPlansfor
neighborhoods,commercialdistricts,andother
areassmallerthanplanningdistrictsorsub-
districts.
In many cities, individual plans are prepared
for neighborhoods and other areas smaller than
planning districts by the city’s planning agency,
and then they are adopted by the planning
commission and the city council as official partsof the city’s master plan. Given a geographically
large and diverse master plan area and limited
resources, it would be difficult for the MPC to
draw up detailed plans for every neighborhood or
nonresidential area. By developing templates for
Area Plans of different types, however, the MPC
can oversee plans that are undertaken by groups
ranging from neighborhood or commercial district
volunteers, to professionals under contract with
government or development entities. The MPC
should identify and give priority to those areasmost in need of new plans or identify existing
plans that are most suitable for adoption as part
of the master plan. Where government funds are
used for planning, MPC staff should be included
on the government planning team that identifies
the planning area, writes the scope of work, and
serves as the client to consultants preparing the

8/3/2019 Ch6_101221-LO
http://slidepdf.com/reader/full/ch6101221-lo 39/53
6 | L i v i n g i n S h v p o t - c a d d o : n i g h b o h o o d S a n d h o S i n g
6 . 3G r a t x c t a t i o n s : s h r v o r t - c a d d o 2 0 3 0 M a s t r L a n
plan. Other city staff, such as transportation and
infrastructure engineers, should also be included
in planning projects.
The process for creating and adopting Area Plans
can follow these steps:
• Initiation. A neighborhood association or other
organized group of residents and stakeholders
can request that the MPC prepare a plan;
provide funding to hire an outside consultant
to prepare the plan; hire their own consultant
(or seek assistance from universities or similar
sources); or even organize themselves to
prepare the plan internally. The MPC Board,
the City Council or the Mayor can also request
that a plan be prepared. In order for a plan to
be adopted, the Planning Commission staff
will need to approve the boundaries of the
planning area and the plan’s basic structure.
• Publicparticipation.The planning process
will need to be overseen by a stakeholder
committee representing all affected interests,
and it should include at least three public
workshops or meetings. The first public
meeting must take place near the start of the
planning process, to elicit ideas for the future
of the neighborhood or district. The second
public meeting must present interim ideas for
the plan and allow public feedback. The third
public meeting must occur when a full draft
of the plan is available, so that the public can
review it and provide comments.
• Elementsoftheplan. The Area Plan must
conform to the goals and policies of the
adopted MPC Master Plan. At a minimum, the
Area Plan must include sections on existing
conditions, including zoning and other
regulations; overall goals; housing; public
realm (parks and public spaces, including
sidewalks); mixed-use or nonresidential areas,
including market support; urban design;
circulation, parking and transportation; and
sustainability (green infrastructure, energy
efficiency, and so on). Other relevant sections
can be added at the discretion of the planning
group. An implementation plan must berequired that identifies actions, responsible
parties, proposed timeline and potential
funding sources.
• Adoption. The MPC can adopt criteria and
procedures for submission and approval of
Area Plans as part of the master plan. In
order for the plan to be adopted as part of
the Shreveport-Caddo Master Plan, the plan
must be reviewed by MPC staff (if they did not
prepare it directly) for conformity with Area
Plan guidelines and for conformity with the
overall goals and policies of the Shreveport-
Caddo Master Plan. If Commission staff
did not prepare the plan, they might ask for
changes to make the Area Plan consistent
with the Shreveport-Caddo Master Plan.
Then the Area Plan will be submitted to the
MPC for a public hearing and adoption. After
adoption by the MPC, a similar submission
with a public hearing may be made to the City
Council and/or the Parish Commission for
approval as an official part of the Shreveport-
Caddo Master Plan.
5.Engageneighborhoodgroupsandstudents
toperformrapid“neighborhoodaudits”ofthe
publicrealmtoaidintargetingresourcesfor
publicimprovements.
Neighborhood audits provide information and
promote priority-setting about how to target
resources for public improvements. The MPC can
work with local organizations, such as Community Renewal, churches, schools, college students,
neighborhood associations or other groups to
develop a consistent format for neighborhood-
based inventories of the condition of sidewalks,
streets, lighting, street trees, drains, blighted
properties, and so on. Regularly scheduled annual
Neighborhood Audit Walks, in which neighbors

8/3/2019 Ch6_101221-LO
http://slidepdf.com/reader/full/ch6101221-lo 40/53
6 | L i v i n g i n S h v p o t - c a d d o : n i g h b o h o o d S a n d h o S i n g
6 . 4 0 G r a t x c t a t i o n s : s h r v o r t - c a d d o 2 0 3 0 M a s t r L a n
walk a particular route (using different routes
each year) and note issues of concern, would
be one way to make this a consistent process.
Today’s handheld computers make it easy toenter information into a spreadsheet, obviating
the need to enter data later. Neighbors could then
prioritize the issues that need attention, taking into
account any City or Parish criteria that government
agencies make available to them.
These audits must then be presented to City and
Parish departments for inclusion in their asset-
management systems and work plans. The City
must also be willing to respond to neighborhood
groups about progress being made on
neighborhood priorities, including explanations
of funding difficulties and any other barriers to
implementation, as well as the criteria used to
evaluate competing improvement projects.
6.ProvidetheMPCwithsufficientresourcesto
supportdistrictandneighborhoodplanning.
In order to implement the master plan, and
provide a foundation of public participation
for District and Area plans, it is essential that
the MPC have the resources to undertake and/ or supervise these planning projects. MPC staff
today devote the bulk of their time to processing
project applications because everything but
single- or two-family projects must receive MPC
board approval. In Chapter 12, this master plan
calls for a new unified development code that
will reform zoning, create higher standards, and
reduce the proportion of development projects
that must come before the MPC. However, there
will still be a need for some MPC staff members
to focus on project approval applications, so
resources for planning are essential.
These resources could take various forms, but in
any case there should be an annual commitment
to completing at least one District Plan and one
Area Plan. Options include:
• reorganization and streamlining of current
staff and work systems to free up time for more
planning
• one or more permanent staff planningpositions
• creation of a roster of approved on-call
planning consultants with funding dedicated to
planning projects
• dedicated funding every year for planning
projects and issuance of RFPs to select
consultants to do the plans in conjunction
with the MPC (and other departments,
if appropriate, such as the Community
Development Department) and with specified
levels of community participation.
C. Create a structured system for neighborhood
consultation on significant development
projects and land use changes.
Actions
1.Provideastructuredmethodforneighborhood
associations,residents,andotherstakeholders
tobeinformedofforthcomingredevelopment
anddevelopmentprojects.
After Area Plans are completed and regulations
amended to reflect the plans, if necessary, there
should be fewer projects that cause community
concern. However, controversial projects will
always emerge, and it is important to give
stakeholders an opportunity to comment before
the public hearing process begins, so that
problems can be worked out in advance. A simple
system can be developed as described here.
The MPC should adopt a policy that private or
government projects meeting certain criteria must
be taken for comment to the residents, property
owners, or business owners who may be affected by
the project. Potential criteria or thresholds, any one
of which could trigger community review, could be:
8/3/2019 Ch6_101221-LO
http://slidepdf.com/reader/full/ch6101221-lo 41/53
6 | L i v i n g i n S h v p o t - c a d d o : n i g h b o h o o d S a n d h o S i n g
6 . 4G r a t x c t a t i o n s : s h r v o r t - c a d d o 2 0 3 0 M a s t r L a n
• request for zoning change8
• 50,000 square feet of nonresidential uses
• 200 housing units
• potential traffic impacts (based on expectedtraffic impacts for the use and intensity as
provided in the most recent ITE (Institute of
Transportation Engineers) Trip Generation
Handbook.
When the MPC becomes aware of a project
that meets one or more of the criteria, it should
inform the project proponent that a meeting with
neighborhood residents or other stakeholders
is required and also inform the affected
neighborhood(s) through existing neighborhood
associations or, if no neighborhood association
exists, through other organizations (nonprofit
groups, schools, churches, libraries and so
on) and through good faith efforts to publicize
a meeting to be held in or near the affected
neighborhood(s). The MPC will then assist
project proponents in setting up a meeting to
introduce the project. MPC staff should also
attend these meeting(s) and provide a written
report on the results.
The goal of this process is for the project
proponent to arrive at the MPC hearing with
potential problems resolved and with the support
of neighborhood stakeholders. Where these kinds
of processes exist, it sometimes takes more than
one meeting to work out mutually agreeable
results, as the project proponent may be asked to
provide information, alter a site plan or building,
or otherwise modify the proposal. Experience
shows that this process often produces better
projects with more community benefits. Although
it may appear to introduce uncertainties and slow
down the development process, it represents a
8 In Chapter 12, this master plan recommends a complete zoningreform for the MPC area, which would be expected to establish zoningdistricts, development standards, and commission procedures that
would be consistent with the master plan and based on community consensus, thus drastically reducing the number of requests for zoningchanges.
significant improvement on the current system,
in which discussions occur only when a project
has already reached the forum of the MPC or
City Council public hearing. In those situations,it is difficult for decision makers to judge how
representative of a broader set of stakeholders
the people who attend a public hearing during
working hours may be. This kind of system will
function best once the land use and development
regulatory framework in the MPC area has been
reformed and improved with higher development
standards, because many projects will be able to
proceed as of right.
2.Updateandmaintainalistofneighborhoodassociationsandpromotetheformationof
neighborhoodassociationswheretheydonot
exist.
The MPC should work with other government
agencies and public officials to update and
maintain its list of neighborhood associations.
Small grants could be made available to a
nonprofit organization, such as Community
Renewal or Volunteers for America, to hold
several training sessions for existing and
prospective neighborhood organizations, in orderto encourage greater capacity and knowledge of
best practices among existing organizations and
promote the formation of new ones.
3.Schedulepublichearingsonmajordevelopment
projectsandplanningissuesintheevening,
whenneeded,toenhancetheopportunityfor
publicparticipation.
Many citizens cannot attend public hearings held
during the working day because they cannot
leave their jobs during that time. It is commonpractice in many cities to schedule nighttime
public hearings of the planning commission and
board of zoning appeals.
8/3/2019 Ch6_101221-LO
http://slidepdf.com/reader/full/ch6101221-lo 42/53
6 | L i v i n g i n S h v p o t - c a d d o : n i g h b o h o o d S a n d h o S i n g
6 . 4 2 G r a t x c t a t i o n s : s h r v o r t - c a d d o 2 0 3 0 M a s t r L a n
D. Establish design standards to guide new
development and redevelopment to contribute
to harmonious neighborhood character.
Actions
1.Establishstandardsinthezoningordinance
toguidethescaleandcharacterofnew
infilldevelopmenttofitwiththecharacterof
establishedresidentialareasandtoensure
appropriatetransitionsfromthoseareas
toredevelopmentofunderutilizedsiteson
neighborhoodedges.
Zoning should set parameters on infill
development so that desired neighborhood
character—whether existing or identified in a
community-based plan—remains consistent with
neighborhood expectations. Where a variety of
scales, building types, and housing unit types
may coexist within a few blocks or even on the
same block, base zoning that recognizes this
heterogeneity will make it easier for property
owners to improve and, within limits, expand
their property as a matter of right. Design
principles and guidelines can be developed
through specific Area Plans and as part of sitemaster plan design guidelines for redevelopment
of larger sites. Although design guidelines
are particularly important in historic districts,
they are worthwhile for other neighborhoods.
Experience in other communities has shown
that even voluntary guidelines, when well
presented and communicated to property owners,
architects, and developers, can result in more
compatible design. These guidelines should not
prescribe architectural styles but rather focus on
compatibility in terms of bulk, height, orientationon the lot and similar measures.
Development in newer parts of the city, and even
in small redevelopment projects within the city,
has tended to rely on creating “pods” of new
development that are unrelated in character and
disconnected physically from the surrounding
urban framework of streets and building
orientation to the street. Small, suburban-style cul-
de-sacs are being inserted into historic street-grid
patterns, disrupting the urban rhythm. Multifamily developments, whether market-rate or assisted
by tax credits to create affordable housing, are
mandated to have high fencing, thus creating
separated enclaves. Standards in the zoning
ordinance can provide for graduated, appropriate
transitions in scale, massing, treatment of
parking and landscape between different types of
housing. Moreover, new development should stay
connected to surrounding neighborhoods, rather
than depending on only one or two access points
to a major road.
2.Createadesigncataloguetoprovide
examplesofhousingdesignscompatiblewith
neighborhoodcharacterindifferentShreveport
neighborhoods.
Building on the Louisiana Speaks Pattern Book, a
catalogue of house and multifamily designs and
design guidelines for use by nonprofit and for-
profit developers and builders, will establish a set
of preferred design types appropriate for different
areas of the city and different lot sizes.9 Whilethese can be particularly useful in development
of assisted housing, they should not be mandated
for all developments but presented as guidance,
with appropriate annotation of the features that
have particular importance.
3.Inareaswithsecurityissues,applyestablished
techniquesofcrimepreventionthrough
environmentaldesigninnewdevelopment.
Crime prevention through environmental design
is an established specialization that emphasizesseveral elements: natural access control, natural
surveillance, territorial reinforcement, and
maintenance. The kinds of security advantages
that people often believe are associated with
gated communities can be obtained with simple
9 The Louisiana Speaks Pattern Book , prepared by Urban Design Associates, is available at: http://www.planningexcellence.org/louisiana_speaks_downloads.asp

8/3/2019 Ch6_101221-LO
http://slidepdf.com/reader/full/ch6101221-lo 43/53
6 | L i v i n g i n S h v p o t - c a d d o : n i g h b o h o o d S a n d h o S i n g
6 . 4G r a t x c t a t i o n s : s h r v o r t - c a d d o 2 0 3 0 M a s t r L a n
des fr crme pree Mulfmly buls
Multifamily buildings do not necessarily mean multiple problems. There is a certain amount of truth to
the saying “there’s safety in numbers.” Management may need to create opportunities for neighbors
to get to know one another and create neighborhood watch programs. When neighbors take
responsibility for themselves and each other it creates a safer environment.
Natural Access Control
• Keep balcony railings and patio enclosures as low as
possible using opaque materials.
• Define entrances to the site and each parking lot
with landscaping, architectural design, or symbolic
gateways.
• Block off dead-end spaces with fences or gates.
• Use devices which automatically lock upon closing on
common building entrances.
• Provide good illumination in hallways.
• Allow no more than four apartments to share
the same entrance; individual entrances are
recommended.
• Limit entrance access to the building to only one or
two points.
Natural Surveillance
• Design buildings so that exterior doors are visible
from the street or by neighbors.
• Use good lighting at all doors that open to the
outside.
• Install windows on all four facades of buildings to
allow good surveillance.
• Assign parking spaces to residents. Locate thespaces next to the resident’s unit, but not marked with
their unit number. This makes unauthorized parking
easier to identify and less likely to happen.
Designate Visitor Parking
• Make parking areas visible from windows and doors.
• Adequately illuminate parking areas and pedestrian
walkways.
• Position recreation areas (pools, tennis courts, club
houses) to be visible from many of the units windows
and doors.
• Screen or conceal dumpsters, but avoid creating
blind spots and hiding places.
• Build elevators and stairwells in locations that are
clearly visible from windows and doors.
• Allow shrubbery to be no more than three feet high for
clear visibility in vulnerable areas.
• Site buildings so that the windows and doors of one
unit are visible from another (although not directly
opposites).
• Construct elevators and stairwells to be open and
well lighted.
• Place playgrounds where they are clearly visible from
units, but not next to parking lots or streets.
Territorial Reinforcement
• Define property lines
• Use low shrubbery three feet maximum and fences to
allow visibility from the street.
• Accentuate building entrances with architectural
elements, lighting and/or landscaping.
• Clearly identify all buildings and residential unitsusing street numbers that are easily observed from
the street.
• Where possible, locate individually locking mailboxes
next to the appropriate units.
Source: Crime Prevention Through Environmental
Design, City of Virginia Beach, VA
design solutions that do not require creating
an isolated enclave unconnected from its
surroundings.
4.Createaprogramtonotifyproperty
ownersabouttheirsidewalkmaintenance
responsibilitiesandofferabettermentprogram
topromotesidewalkrepairandmaintenancein
neighborhoods.
Many property owners do not know that they are
legally responsible for the sidewalks in front oftheir property because the City has typically taken
responsibility for sidewalk repairs—when funds
have been available. If the City is not prepared

8/3/2019 Ch6_101221-LO
http://slidepdf.com/reader/full/ch6101221-lo 44/53
6 | L i v i n g i n S h v p o t - c a d d o : n i g h b o h o o d S a n d h o S i n g
6 . 4 4 G r a t x c t a t i o n s : s h r v o r t - c a d d o 2 0 3 0 M a s t r L a n
to enforce the ordinance requiring private
maintenance of sidewalks, it should eliminate
the ordinance (Sec. 78–136). In many parts of the
city sidewalks are absent, inadequate, or in badcondition. While the City could take responsibility
for sidewalk installation or improvements when
doing reconstruction or redesign of arterials
or when infrastructure improvements are part
of city-funded revitalization projects, sidewalk
maintenance on neighborhood streets could
remain the responsibility of property owners. In
that case, the City should provide standards for
construction and repair of sidewalks, as well as a
list of approved contractors from which a property
owner can choose.
An annual notification in the property tax bill
or other City communication about sidewalk
maintenance responsibilities should also include
information on the required standards for
sidewalks that contractors must meet if property
owners wish to contract for repairs. Liens or
payments on the property tax bill could be used
as enforcement mechanisms.
Another approach is to offer a betterment program.
Under a betterment program, property owners are
assessed all or partial costs for the installation of
new sidewalks or repair of existing sidewalks. The
work is done by the City and the betterment fee
is typically calculated using a formula that takes
into account the length of frontage and the size of
the lot, and assessed through the property tax bill.
The program can be voluntary—in which case a
majority of property owners along a street would
agree to pay the fee and petition the City to get
on the list. The program could also be initiated by
the City when sidewalk installation or upgrades
are needed to meet code requirements or as part
of a broader project. The fees to be paid could
vary according to whether the project is resident-
initiated (in which case the residents could be
asked to pay the entire cost) or city-initiated (in
which case the costs could be shared).
Neighborhoodcentersprovidingaccessto
retailandserviceforallneighborhoods.
Goal 2
Policies:
• Focus public efforts to support creation of walkable
neighborhood commercial districts or nodes.
• Locate civic and cultural uses within or adjacent
to neighborhood commercial districts to act as
anchors.
STRATEGIES
A. Amend commercial strip zoning along arterial
roads to promote more compact, mixed-usedistricts.
Most Shreveport commercial corridors are unattractive
and poorly designed. Long corridors of commercial or
industrial zoning combined with shifting market interest
has resulted in low-density, low-value development and
many vacancies along parts of Youree Drive north of
Southfield, Mansfield Road, North Market Street, parts
of Line Avenue and Kings Highway, and 70th Street.
With few exceptions, the corridors in the older part of
the city, from 70th Street north, tend to have shallow and often small lots backing onto residential areas.
Even if some of the lots can be assembled into bigger
parcels, the shallow lots constrain development by
national retailers. To some degree, local merchants
and small businesses have sought out these locations,
but there is an oversupply of this space exacerbated
by competition from newer chain development in the
southern part of Youree Drive and Bert Kouns Industrial
Loop and the ring of Walmarts in the metropolitan
area. The traffic congestion that affects the areas with
newer retail development is the result of poor access-management design, not lack of road capacity.
Over time, zoning strategies that create incentives to
attract commercial investment to locations that retailers
seek—major intersections—can promote corridors with
focused nodes of development where vehicle access
can be better managed and internal conditions can
8/3/2019 Ch6_101221-LO
http://slidepdf.com/reader/full/ch6101221-lo 45/53
6 | L i v i n g i n S h v p o t - c a d d o : n i g h b o h o o d S a n d h o S i n g
6 . 4G r a t x c t a t i o n s : s h r v o r t - c a d d o 2 0 3 0 M a s t r L a n
be designed to produce more efficient, attractive and
people-friendly environments. Enforceable design
standards are essential for success. Stronger zoning
and enhanced design standards will improve theappearance and function of commercial corridors
as businesses redevelop with the confidence that
neighboring lots will also have to meet enhanced
standards. Areas that are more pleasant for customers
to visit will attract more businesses.
Zoning in itself, however, is not enough to make
development happen or, for example,to attract
neighborhood-serving retail. Marketing efforts can
be helpful in highlighting underserved areas with
significant aggregate demand. Ultimate success will
depend on the ability of the City and Parish to attract
more jobs and residents inside the loop. Achieving
the vision for neighborhoods in this way depends on
achieving the economic development vision.
Actions
1.Designateintersectionsandsectionsof
commercialcorridorsfordifferentintensitiesof
commercialdevelopmentandintroducemixed-
usezoningoptionsthatcreate“urbanvillages.”The urban village areas will promote and
facilitate housing development around
neighborhood commercial centers, including
design standards that require connections
and walkability. Some of these urban villages
can be designated as areas for “transit-ready”
development. This means that over the long term,
as Shreveport gains more population, these
areas will have the development capacity to build
higher-density, mixed-use areas that can support
enhanced transit, such as express buses, busrapid transit, and possibly in the more distant
long term, light rail.
2.Establishaboulevardprogramtoredesign
majorcommercialcorridors,suchasMansfield
Road,tocreateparkway-styleenvironments
withenhancedstreetscapesthatcreatemore
attractivedevelopmentopportunities.
Parts of Mansfield Road and other Shreveport
thoroughfares are already designed for boulevard
treatments because they have internal lanesfor through traffic and parallel service roads.
In many cases, they also have grass-covered
swales for stormwater drainage. Most, however,
lack landscape treatments designed to make
them attractive. Combined with the rezoning
strategy for urban villages and concentration
of commercial activities at specific nodes,
landscaped medians, significant trees (not
small shrubs) along service roads, landscaped
swales for beauty and enhanced treatment of
polluted stormwater, and similar strategies can
make the areas between compact centers more
attractive for multifamily or, in some cases,
single-family development. The “complete streets”
transportation policies recommended in Chapter
8 and the use of natural drainage best practices
as amenities, discussed in Chapter 9, can be
applied to these potential boulevard corridors.
3.Developafaçadeimprovementprogramwitha
matchinggrantorarevolvinglow-interestloan
fundfordesignatedoldercommercialdistricts.The Downtown Development Authority has a
façade improvement program and a similar
program can be created for other parts of the
city where older commercial districts are in
or adjacent to areas where redevelopment
is occurring. CDBG funds can be used if the
business is located in an eligible census tract. It
is beneficial to provide basic design assistance
along with the funding and require approval of
the design before funds are disbursed.
4.Improvethefunctionanddesignforall
neighborhoodcenters,includingaccess
management,internalcirculation,buildings
atthestreetedge,pedestriannetworks,
landscapedanddistributedparkingfields,
andsoon,throughenhanceddevelopment
standardsindevelopmentregulations.
8/3/2019 Ch6_101221-LO
http://slidepdf.com/reader/full/ch6101221-lo 46/53
6 | L i v i n g i n S h v p o t - c a d d o : n i g h b o h o o d S a n d h o S i n g
6 . 4 6 G r a t x c t a t i o n s : s h r v o r t - c a d d o 2 0 3 0 M a s t r L a n
As noted in Chapter 8, traffic problems in
Shreveport are almost entirely due to poor
access management. New mobility, circulation
and development standards in zoning and otherregulations can have a surprisingly rapid effect
in retail areas because retail buildings have the
shortest lifespan of building types. Successful
retailers know they have to redesign their sites
and continue to make them fresh to attract
consumers. Because Shreveport inside the loop
also has many areas with vacant or obsolete
retail space, focused growth over the next several
decades can attract more interest in these sites—
and redevelopment will then result in places that
function better and have better design.
5.Locatenewcivicusestoserveasanchors
withinoradjacenttoneighborhoodcommercial
districtsdesignatedforcurrentorfuture
walkability.
The City and Parish can help bring customers to
commercial districts by locating civic uses such
as libraries, police and fire stations, schools,
clinics, and similar facilities in commercial
districts. New or renovated public facilities
should be pedestrian-friendly and compatible with surrounding development—for example,
locating parking to the side or rear of the
building and providing windows and articulation
on the street façade.
6.Coordinatedispositionofornewusesfor
publiclyownedproperties,includingschools,
withtheMPCtoensurecompatibilitywith
neighborhoodsandcommercialareas.
The disposition of publicly owned properties,
including schools, located in or near commercialdistricts, should be preceded by an evaluation of
potential uses and urban design strategies that
can contribute to strengthening the commercial
district. The school district should work with
the MPC and affected neighborhoods to plan
for preferred outcomes in the case of school-
building reuse. If disposition and private-sector
development of a property is desired, the school
district should prepare an RFP that provides
criteria for the desired range of uses and the
urban design strategy preferred. Transfer toother public entities should also require a
commitment to suitable urban design strategies.
7.Promotethedevelopmentofbusinessor
merchants’associationstoserveasthevoice
ofbusinessownersinspecificcommercial
districts.
A business or merchants’ association organizes
business owners to identify and prioritize the
issues of most concern to them and serves as
the voice and advocate for business interests ina neighborhood district. The existence of such
organizations also benefits both the City and
neighborhood residents during neighborhood
and commercial district planning processes.
8.Recruitneighborhood-servingretailto
underservedneighborhoodswithmarket
analysesandincentives.
A market analysis is essential to understanding
and demonstrating what kind of retail is
possible given the number of households andincomes, competition from Walmarts and similar
nearby businesses, and unfilled market niches
in the area. In some cases, neighborhoods do
not have enough households to support national
chain retail but could support a smaller local
business. Incentives to attract stores could
include fast-track approvals, fee waivers, grants
and loans, land assembly and land discount,
and site preparation assistance.
Where there is sufficient household density,lower-income neighborhoods often wield
significant aggregate purchasing power. The
Institute for a Competitive Inner City, led by
Michael Porter of Harvard Business School,
has found in several studies that lower-income
neighborhoods are often very underserved by all
kinds of retail. Cities like Columbus (OH), San
8/3/2019 Ch6_101221-LO
http://slidepdf.com/reader/full/ch6101221-lo 47/53
6 | L i v i n g i n S h v p o t - c a d d o : n i g h b o h o o d S a n d h o S i n g
6 . 4G r a t x c t a t i o n s : s h r v o r t - c a d d o 2 0 3 0 M a s t r L a n
Diego, Denver, and Oakland have increased
grocery and other retail offerings in urban
neighborhoods by active recruitment.10
9.Supportthedevelopmentandcapacity
offarmersmarketstoincreaseaccessto
fresh,localfoods;tobuildcommunity;and
tosupportlocalagricultureandeconomic
development.
As discussed in more detail in Chapter 4,
expanding community gardens, farmers’ markets,
and urban agriculture enterprises should be part
of an overall strategy to provide access to fresh
food throughout the city.
Redevelopment of blighted and vacant
properties in areas needing revitalization.
Goal 3
See Chapter 11 for discussion, strategies and actions.
A comprehensive housing policy to support
quality neighborhoods and meet the
diverse housing needs of all households.
Goal 4
Policy:
• Support for a community-based system to develop
and implement housing policy that includes
stakeholders from government, the nonprofit
sector, and the private sector.
10 James Miara, “Retail in Inner Cities,” UrbanLand (January 2007),pp.98–105; see also www.icic.org.
STRATEGIES
A. Create a community-based Housing Policy
Advisory Council, including representatives of
government staff, neighborhood organizations,
for-profit and nonprofit housing developers,
realtors, and representatives of economic
development organizations.
Affordable housing needs and policy can be
contentious issues. An advisory group with wide
representation would help educate the public
and advise the Mayor, City Council, the Parish
Commission, and the MPC about housing needs
and help create greater consensus on the location,appearance, and management of assisted housing
in Shreveport. Government staff should include
representatives of the MPC, Community Development
Department, Parish Commission, Housing Authority
and any other appropriate agency, such as the
professional Redevelopment Authority recommended
in Chapter 11.
Action
1.EstablishaHousingPolicyAdvisoryCouncilThe Council should be staffed by the Community
Development Department and MPC and meet at
least quarterly. Its activities should include:
• Development of policies that promote mixed-
income, diverse housing environments and
reduce concentrations of poverty.
• Review of new standards for new and
rehabilitated market-rate and subsidized
housing that create neighborhoods rather
than projects by requiring integration with
surrounding areas.• Annual report on housing needs, priorities,
and policies to the Mayor, Council, Parish
Commission and MPC Board.
• A public hearing on housing needs, priorities
and policies at the MPC once a year.
• Development of policies to communicate local
housing needs and priorities to state and

8/3/2019 Ch6_101221-LO
http://slidepdf.com/reader/full/ch6101221-lo 48/53
6 | L i v i n g i n S h v p o t - c a d d o : n i g h b o h o o d S a n d h o S i n g
6 . 4 8 G r a t x c t a t i o n s : s h r v o r t - c a d d o 2 0 3 0 M a s t r L a n
federal housing agencies, as well as national
nonprofits, and work with LHFA on selection
criteria for tax credit projects.
Allhousingingoodconditionandcode-
compliant.
Goal 5
Policy:
• Assign a very high priority to effective and
efficient property standards and code-
enforcement efforts.
STRATEGIES
A. Establish systems to support enforcement of
quality of life regulations.
Actions
1. Continuetocoordinateandintegratethe
activitiesofallgovernmentofficesthatenforce
propertystandards,thebuildingcode,the
zoningcode,andsimilarregulationsby
assigningcoordinationresponsibilitytoa
specificdepartmentheadorastaffmemberin
theMayor’soffice.
Code enforcement involves a variety of laws,
governmental staff and offices. Shreveport has
already made progress in coordinating efforts
around enforcement of property standards.
Making one person responsible for coordinating
the varied enforcement efforts will help ensure
that resources are applied strategically to the
worst violators.
2. Createadetailedpropertydatabasewithinformationontenure,condition,codestatus,
andotheraspectsofallproperties.
Lack of good information makes it much more
difficult to be effective in code enforcement.
A detailed property database can be created
incrementally.
3. Considercreatingaticketingsystemwithfines
forquality-of-lifeoffensessuchaslitteringand
illegaldumping,storageofjunkcars,lackof
mowing,andnoise.Many communities have developed ticketing
systems with fines for quality-of-life offenses.11 Not
only do these programs improve neighborhoods,
but there is considerable evidence that they help
cut crime. At the same time, funds from the fines
can help pay for increased police time.
B. Establish a rental housing code to ensure that
rental properties are fit for habitation.
The current property standards code in Shreveport
focuses on external conditions. A number of rental
properties in the city, however, appear to provide
substandard living conditions for tenants. The lack
of a rental housing code and organized enforcement
of building and health codes in existing housing
encourages landlords to continue to rent substandard
housing. Tenants in Louisiana may pay for repairs
and seek reimbursement from landlords, as long
as they go through a state-sanctioned process, but,
unlike in many other states, tenants are not allowed
to put rent into an escrow account while negotiating
maintenance or repair issues with a landlord. A
rental housing code will give landlords in Shreveport
the incentive to keep their rental units in safe and
habitable condition. The system should be developed
in consultation with owners of apartment complexes,
as well as single-family rentals. Because the code
would require more inspection staff, fines and fees
collected under the rental code should be returned to
support the program.
The purpose of a rental housing code is to provide
minimum occupancy standards to safeguard the
health, property and the welfare of tenants, occupants,
users and owners of rental housing. The code will
establish minimum standards related to the condition,
11 For example, Buffalo, New York, found that ticketing for quality-of-lifeoffenses cut crime. “Quality-of-life policing helps cut crime in Buffalo’sNortheast District,” BuffaloNews , July 31, 2008.

8/3/2019 Ch6_101221-LO
http://slidepdf.com/reader/full/ch6101221-lo 49/53
6 | L i v i n g i n S h v p o t - c a d d o : n i g h b o h o o d S a n d h o S i n g
6 . 4G r a t x c t a t i o n s : s h r v o r t - c a d d o 2 0 3 0 M a s t r L a n
maintenance and occupancy of rental dwellings in
order to ensure that rental housing is safe, sanitary and
suitable for habitation.
A rental housing code typically includes these
elements:
• Application: The code shall apply to all rental
dwelling units within the City of Shreveport.
Dwelling units include any and all units with
one or more rooms intended to be occupied
by someone other than the owner in exchange
for periodic payments to the owner for the
occupancy. This shall include apartments, multi-
unit complexes, single-family units, dormitories
and boarding houses.
• Registration: All rental housing must be
registered with the City’s Property Standards
Department. A registration fee shall be charged
to offset the cost related to registration,
administration and inspection of rental units.
Any owners who willfully fail to register a unit
shall be guilty of a misdemeanor on the first
offense. Enhancement of penalties for habitual
violators.
• Inspection: A rigorous inspection program will be
required to assure occupants’ safety, structural
and mechanical integrity of buildings and to
avoid the negative impact of substandard units on
surrounding communities and the city as a whole.
All dwelling units must be inspected annually
and certified as safe for occupancy. All certified
dwelling units shall be listed publicly as available
for occupancy. An annual inspection fee shall be
charged for each dwelling unit inspected. The
inspection will include examination of:
> structural elements (roofs, floors, walls,
foundation and overall structure)
> plumbing
> electrical system
> heating and cooling systems
> weatherproofing
> security
> fire safety (smoke detectors and proper exits)
• Enforcement: Enforcement should include both
the opportunity for the tenant to seek redress
and for the landlord to take care of any violation.
The rental code should spell out an enforcementprocess that includes:
> complaint process for the occupant
> inspections after complaints
> notice to owner of finding and/or illegal
condition(s)
> notice to owner of potential penalties
> owner opportunity to cure violation
> reinspection
> administrative court—imposition ofpenalties for
noncompliance
Actions
1. Considerstrengtheningthecitybuildingcode
tothestandardsofthefederalSection8(HCV)
housingcode.
The federal government requires that landlords
who accept Housing Choice Vouchers (Section
8) bring their rental housing units up to what
are considered minimum housing-condition
standards.12 The City of Shreveport’s minimum
standards are less rigorous than the federalstandards. Raising City standards to the level
expected of landlords who receive federal funds
through rental vouchers would improve the
overall quality of housing available for low- and
moderate-income renters throughout the city.
2. EnactaShreveportrentalhousingcode.
The details of a rental housing code should be
developed through a consultative process that
involves government, nonprofit and for-profit
stakeholders. The Community DevelopmentDepartment can take the lead, with assistance
of the City Attorney’s office and then work out
the details with the previously proposed Housing
Policy Advisory Council, as well as other groups.
Many cities have developed rental housing
12 For standards, see: http://www.healthyhomestraining.org/ipm/IPM_ MFH_Ref_2_HUD_HQS_9-11-08.pdf

8/3/2019 Ch6_101221-LO
http://slidepdf.com/reader/full/ch6101221-lo 50/53
6 | L i v i n g i n S h v p o t - c a d d o : n i g h b o h o o d S a n d h o S i n g
6 . 5 0 G r a t x c t a t i o n s : s h r v o r t - c a d d o 2 0 3 0 M a s t r L a n
codes with the elements discussed earlier. The
system should be sufficiently broad to have
the desired effect and support the costs of
enforcement, while minimizing impacts on goodlandlords. A good, relatively simple example
comes from Morgantown, WV.
C. Create an administrative court to deal with
quality-of-life violations.
Legislative amendments passed in 2007 give any
municipality or parish in Louisiana the power to adopt an
administrative adjudication hearing procedure to deal
with violations of ordinances regulating public health,housing, fire codes, environmental matters, and historic
districts. (La. R.S. 13:2575.B.) If Shreveport establishes
a ticketing system for quality-of-life violations, the
administrative court could be limited to those who fail to
pay the fines and who have repeated violations.
The administrative hearing resembles a court
proceeding;comparable administrative courts operate
in cities such as Monroe (“Environmental Court”),
Baton Rouge (“Litter Court”), and Logansport (“Code
Enforcement Court”), offering useful working models.The hearing officer(s) appointed by the municipality
or parish may be the municipal or parish director
of health or his/her designee, or an attorney having
been licensed in Louisiana for two or more years. The
hearing officer(s) may be given authority to:
• administer oaths and affirmations;
• issue orders compelling the attendance of
witnesses and defendants and the production of
documents;
• levy fines, fees, penalties, and hearing costs; and
• order violators to correct violations within astipulated time.
Importantly, to enforce correction of any violations, the
hearing officer may record a lien and privilege against
the property in question. This nonexclusive legal remedy
acts as a judicial mortgage against the property,
allowing any fine and costs imposed to be enforced
against the property itself. Any liens placed against the
property are included in the next annual tax bill, and
failure to pay the lien can make the property subject to
sale through code enforcement lien foreclosure. Unlikea tax sale, this kind of sale can transfer a property with
clean title, avoiding the redemption problems common
to adjudicated properties.
This relatively new legal remedy creates a
streamlined means for enforcing property standards
and similar municipal ordinances without burdening
the docket in either a mayor’s court or criminal district
court and it is also self-financing through payment of
court costs by defendants.
To date, the comparable courts in Monroe and
Logansport have achieved a reputation for
effectiveness that has persuaded almost all
defendants to correct violations prior to any
administrative hearing. Such an administrative court
could be established in Shreveport by ordinance.
Action
1.Establishaquality-of-lifecourtpilotproject—
onceaweekforayeartogaugetheneedandbenefit.
The quality-of-life court would focus on
enforcing property standards, housing and
rental codes, littering ordinances, and public
health ordinances once a week for a year to
gauge the need and benefit.
Qualityhousingtomeetthediverseneeds
ofhouseholdsatallincomelevelsandall
stagesofthelifecycle.
Goal 6
Policy:
• Support the planning, regulatory and funding
initiatives needed to provide a diversity of
housing types, rental and ownership, market-rate
and subsidized, to meet community needs.
8/3/2019 Ch6_101221-LO
http://slidepdf.com/reader/full/ch6101221-lo 51/53
6 | L i v i n g i n S h v p o t - c a d d o : n i g h b o h o o d S a n d h o S i n g
6 . 5G r a t x c t a t i o n s : s h r v o r t - c a d d o 2 0 3 0 M a s t r L a n
STRATEGIES
A. Expand the diversity of housing choices, with
amenities, to reflect the increasing diversity
of ages, household types and backgrounds,
while ensuring appropriate standards and
guidelines for fitting new housing into existing
neighborhoods—for example, condominiums,
townhouses, live-work units, lofts.
Actions
1. Expandfirst-timehomebuyerandcredit-
counselingprogramsandexploreemployer-
assistedhousingprogramswithmajor
employers.
Many Shreveport renters who would like to
own their own homes have the income to pay a
monthly mortgage and to meet the maintenance
needs of a home. They may not, however, have the
credit history to qualify for a mortgage or enough
money for a downpayment or closing costs.
Although Shreveport is not a high-cost housing
market, many employees make low wages,
even with large employers such as the casinos
and health care providers. In employer-assisted
housing programs the employer provides
downpayment or closing-cost assistance to help
employees become homeowners.
2. Expandhousing-rehabilitationprogramswith
strategiessuchasrevolvingloanpools.
The current housing-rehab programs focus
primarily on elderly and disabled homeowner.
Low-interest loan programs can be established
with local banks to assist income-eligible owner-
occupants of any age. In addition, a number of
communities also have rehab programs designed
for rental housing. When a property owner takes
advantage of a low-interest loan to rehab a rental
property, the owner must make a legal agreement
to keep rents affordable to low- and moderate-
income households for a certain number of
years. In this way the rehab funding benefits the
target group, which is income-eligible renters.
This kind of program could work with the Rental
Code registration and enforcement program
recommended earlier.
3. Establishamarketingprogramandaone-stop
housingcenterforallgovernment-assisted
homeownership,rehabilitation,andrental
programs.
In addition to enhancing existing first-time
homebuyer fairs and similar marketing efforts,
Community Development could develop a one-stop
housing center in an easily-accessible location.
4. Supportthedevelopmentofsupportivepermanenthousingforresidentswhoare
atriskofhomelessnessand/orareliving
insubstandardhousing,aswellasother
grouphomes,whilebalancingtheneedsof
neighborhoods.
HOPE is focusing on providing supportive
permanent housing for its clients and should
pursue federal funding for supportive-housing
programs. Because of low housing costs, social
service agencies may tend to cluster their
developments and their clients in certain areas,
such as downtown or older neighborhoods
with big houses. It is important, on the one
hand, to provide for and welcome well-
managed group homes and supportive housing
environments. However, it is also important
that all neighborhoods, including downtown
as a future residential area, have a diversity of
household types and that no one area becomes
over-supplied with supportive housing. HOPE
should be part of the Housing Policy Advisory
Council in order to be part of the discussion aboutcreating diverse and balanced neighborhoods
and housing.
5. Makeinvestmentsininfrastructureand
amenitieswherehousingdevelopmentis
desired.
As noted in Chapter 9, reserving some city funds
for infrastructure and public-realm amenity costs
8/3/2019 Ch6_101221-LO
http://slidepdf.com/reader/full/ch6101221-lo 52/53
6 | L i v i n g i n S h v p o t - c a d d o : n i g h b o h o o d S a n d h o S i n g
6 . 5 2 G r a t x c t a t i o n s : s h r v o r t - c a d d o 2 0 3 0 M a s t r L a n
where housing development is desired will help
advance redevelopment inside the loop.
Acohesiveurbandesignidentityforthe
entireplanningareawithappropriate
variationsfordiverseneighborhoods.
Goal 7
Policy:
• Include urban design goals and standards for
private development and public planning and
capital investment projects.
STRATEGIES
More detailed discussion of the urban design principles
below will be found in Chapter 12.
A. Revise zoning and subdivision regulations
to promote a well-designed, attractive and
functional urban design context and public
realm.
Actions
1. Establishbuilding,street,infillandsubdivision
designstandardsthatfocusonpeoplerather
thanvehicles(whileaccommodatingvehiclesas
needed).
2. Ensuresensitivetransitionsfromresidentialto
nonresidentialareasthroughzoninganddesign
standards.
3. Revisethesignordinancetoensurethatsigns
arecompatiblewithdesiredcharacterofthe
surroundingcontext.
4. Preserveandenhancethecharacterofolder
neighborhoodsbypreservingthestreetgrid,
orientingnewdevelopmenttofitinwith
oldercharacter(intermsofdimensionsand
placementonthelot)andtoharmonizewith
thedesigncharacterofexistingdevelopment
withoutnecessarilycopyingolderforms.
5. Ensurethatnewsubdivisionsorapartment
complexesconnectwiththesurrounding
context,includinganyfutureroads,ratherthan
createisolateddevelopmentswithconnectionstoonlyoneroad.
6. Ensurethatnewsubdivisionsprovide
sidewalks,streettrees,publicopenspace,and
similaramenities.
7. Permitandencouragelow-impactdevelopment
insubdivisionregulations,suchasnarrower
residentialstreets,naturaldrainage,andother
innovativeinfrastructureapproaches.
8. Provideexpeditedapprovalsfornewdevelopmentthatmeetsurbandesign
standardsandislocatedinareaswhere
developmentisdesired.
B. Establish high-quality urban design standards
for the public realm and implement them over
time
Actions
1. Developdesignprinciplesandstandards
forprivateandpublicdevelopmentinall
commercialdistricts.Includemoredetailed
guidelinesforthepublicrealm(streets,
streetscape,publicspaces)inAreaPlans.
Design principles for neighborhood commercial
districts should strive to create human-scaled,
fine-grained physical environments while
accommodating cars as needed. These principles
have repeatedly proven to be successful around
the country in redevelopment of suburban-
style commercial strips and shopping centers,
where people are looking for pedestrian-friendly
environments in their shopping experience, even
if they initially arrive by car. Shreveport already
has an example of this type of environment,
the Shoppes at Bellemeade on Youree Drive.
While not all types of commercial development
can support the detail at this shopping area,
8/3/2019 Ch6_101221-LO
http://slidepdf.com/reader/full/ch6101221-lo 53/53
6 | L i v i n g i n S h v p o t - c a d d o : n i g h b o h o o d S a n d h o S i n g
enhanced design standards can require the
breakup of large parking fields with more shade
trees; designated, landscaped pedestrian
routes through parking areas for safety and
comfort; location of retail closer to the road, with
large parking areas shielded from direct view
of the road; and internal circulation between
commercial parcels to avoid excessive numbers of
curb cuts on the street.
2. Establishacontext-sensitivedesignstandard
forstreetscapesaspartoftheAreaPlans,
andworkwithLADOTDandNLCOGtoplan
improvementsforurbanarterialsthatarestateroads.“CompleteStreets”policies
recommendedinChapter8willenhancecity
streets.
3.Establishaprogramforpublicartin
infrastructureprojects,suchasaOnePercent
forArtprogram.SeeChapter5.
d. ge Sre
Early actions that are not costly will provide a foundation for more ambitious activities.
ACtIONS RESPONSIbLE PARty
Create a Housing Policy Advisory Council that isbroadly representative of the MPC area
Mayor and City Council with Community Developmentand MPC
Enact a rental housing code MPC; Community Development; Mayor and City Council
Create an administrative court to deal with codeenforcement and quality of life violations
Mayor and City Council
Strengthen city building codes to meet the minimumstandards in the federal Section 8 code
Mayor and City Council; Community Development
Establish planning districts for future planning effortsand community consultation on land use issues
MPC


![[Suzanne Duvall Jacobitti] Lo Publico, Lo Privadi y Lo Moral](https://static.fdocuments.us/doc/165x107/577cd8521a28ab9e78a0f37f/suzanne-duvall-jacobitti-lo-publico-lo-privadi-y-lo-moral.jpg)