
Ch2
73
-
Upload
toqa-khaled -
Category
Data & Analytics
-
view
151 -
download
0
Transcript of Ch2

Digital Image Processing
Dr. Rowayda A. Sadek

Light and Color
• Light
– Electromagnetic Wave
– Wavelength 380 to 780 nanometers (nm)
• Color
– Depend on spectral content (wavelength composition)
– E.g. Energy concentrated near 700 nm appears red.
• Spectral color is light with a very narrow bandwidth.
• A white light is achromatic.

Color
• Two types of light sources– Illuminating light source– Reflective light source
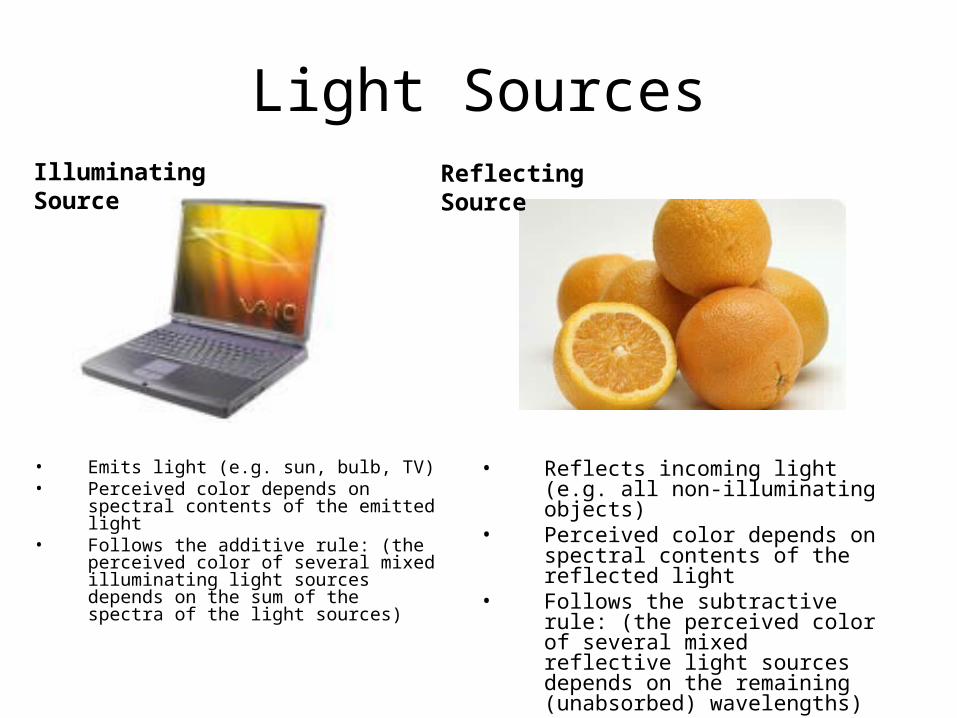
Light Sources
• Emits light (e.g. sun, bulb, TV)• Perceived color depends on
spectral contents of the emitted light
• Follows the additive rule: (the perceived color of several mixed illuminating light sources depends on the sum of the spectra of the light sources)
Illuminating Source Reflecting Source
• Reflects incoming light (e.g. all non-illuminating objects)
• Perceived color depends on spectral contents of the reflected light
• Follows the subtractive rule: (the perceived color of several mixed reflective light sources depends on the remaining (unabsorbed) wavelengths)

Color
• Illuminating light source generates – Light of certain wavelength, or– Light of a wide range of wavelength– Follow additive rule:
• Color of the mixed light depends on the SUM of the spectra of all the light sources

Color
• Examples of illuminating light sources of wide wavelengths
– Sun, stars– Light bulb, florescent tube
• Examples of illuminating light sources of narrow wavelength
– Halogen lamp, Light power light bulb– Phospher, Light Emitting Diode

Color
• Reflecting light– Object absorbs incident light of some wavelengths– Object reflects incident light of remaining
wavelengths– E.g. An object that absorbs wavelengths other than
red would appear red in color– Follow subtractive rule: color of the mixed reflecting
light sources depends on the remaining unabsorbed wavelengths

Color
• Examples of reflecting light source– Mirror and white objects reflects all
wavelengths of light regularly– Most solid objects– E.g. Dye, photos, the moon

Understanding Human Vision System (HVS), Why?
• Image is to be SEEN!• Perceptual Based Image Processing
– Focus on perceptually significant information– Discard perceptually insignificant information
• Issues:– Biological– Psychophysical

Eye Anatomy

Eye Anatomy

Eye Anatomy
•Cornea is the eye's window to the outside world.
•A biological, composed of tissue is transparent similar to a glass windows.
•Iris controls the amount of light entering the eye by adjusting the size of the pupil in a tenth of a second.

Eye Vs. Camera
Optic nerve
Fovea
Retina
Cornea
Iris
LensCircularmuscle

Eye Function
• Eye can function only if cornea, iris, pupil, lens, choroid, sclera, retina, muscles, fovea and optic nerves are present at the same time, in their correct positions.
• This is why it's impossible for the eye to have developed gradually, over a period of time.
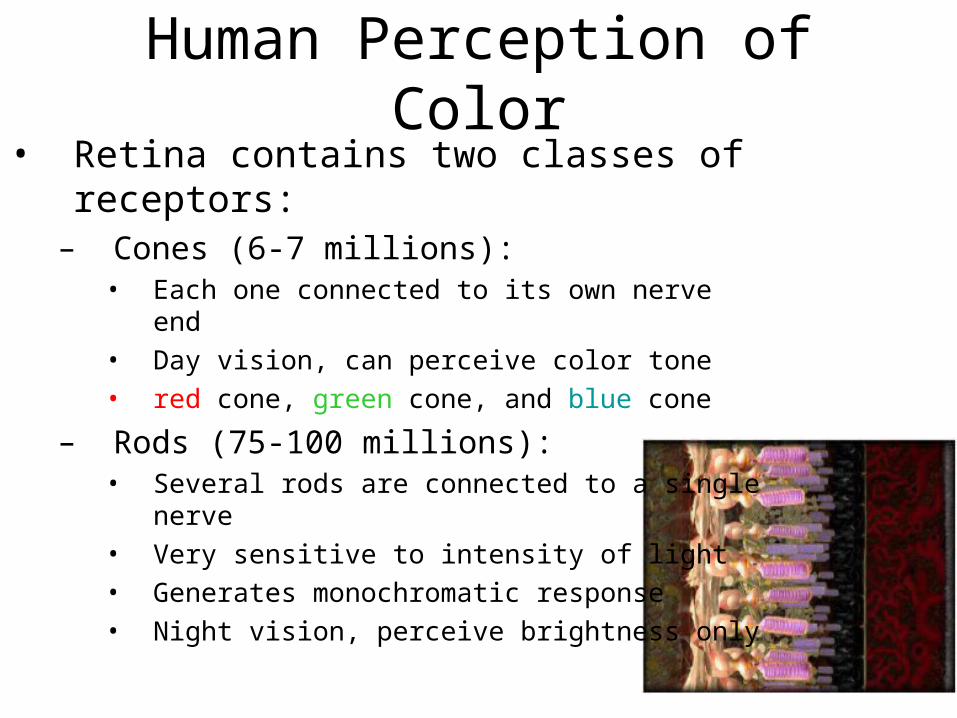
Human Perception of Color• Retina contains two classes of receptors:
– Cones (6-7 millions):• Each one connected to its own nerve end• Day vision, can perceive color tone• red cone, green cone, and blue cone
– Rods (75-100 millions):• Several rods are connected to a single nerve• Very sensitive to intensity of light• Generates monochromatic response• Night vision, perceive brightness only

Human Vision System
• Each part of our eye has some functions– Iris controls the intensity of light entering the eye– Circular muscle controls the thickness of the lens– Lens refracts the light onto the fovea– Optic nerve transmits light signals to the brain
• Brain – interprets the light signals from both eyes– understands the signals as an image

Path of light in the human eye– Enters eye through cornea– Passes through hole within iris– Refracted by the lens– Hits the retina wall inside the eye– Excites some light-sensitive cells
Optic
nerve
Fovea
Retina
Cornea
Iris
LensCircularmuscle

Image Capturing and Formation
• An image is formed by the capture of radiant energy that has been reflected from surfaces that are viewed
• The amount of reflected energy, f(x,y), is determined by two functions:
– The amount of light falling on a scene, i(x,y)
– The reflectivity of the various surfaces in the scene, r(x,y)
• These two functions combine to getf(x,y) = i(x,y) * r(x,y)

Image Formation Model
f(x,y)= i(x,y) r(x,y)
0<f(x,y)<∞
0<i(x,y)<∞
0<r(x,y)<1 reflectance
illumination
Intensity – proportional to energyradiated by a physical source

Image Formation in the Eye
Focal length: 14-17mm Length of tree image2.55mm
For distant objects (>3m), lens exhibits the least refractive power (flattened)
For nearby objects (<1m), lens is most strongly refractive (curved)
• Distance between center of lens and retina (focal length) vary between 14-17 mm.
• When object is 3 m or more away, f = 17mm with lowest refractive power.
• Image length h = 17(mm) x (15/100)
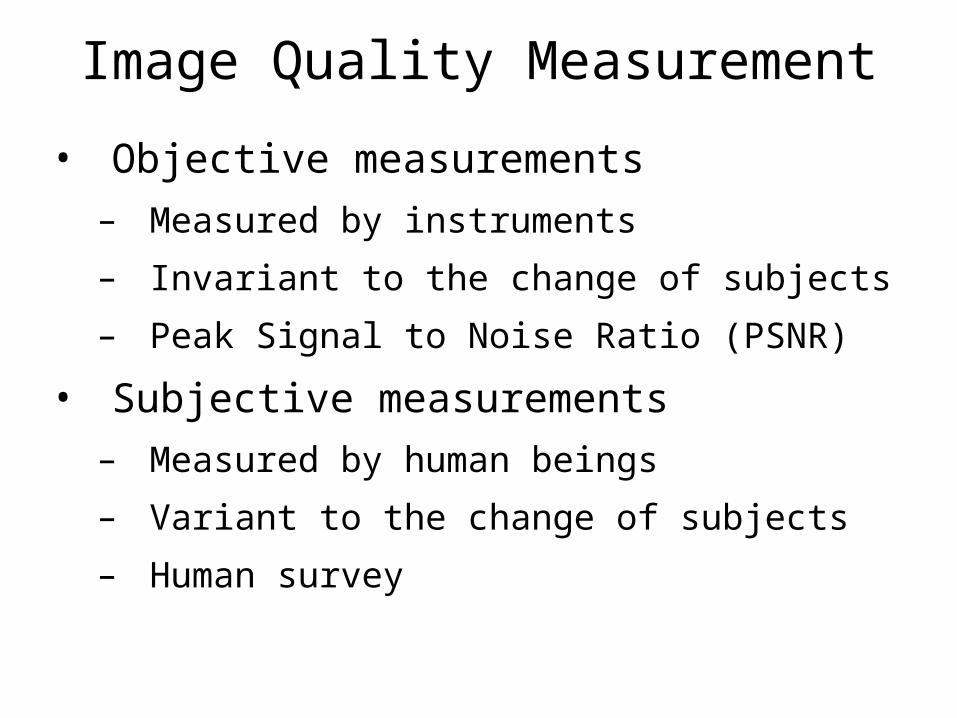
Image Quality Measurement
• Objective measurements
– Measured by instruments
– Invariant to the change of subjects
– Peak Signal to Noise Ratio (PSNR)
• Subjective measurements
– Measured by human beings
– Variant to the change of subjects
– Human survey
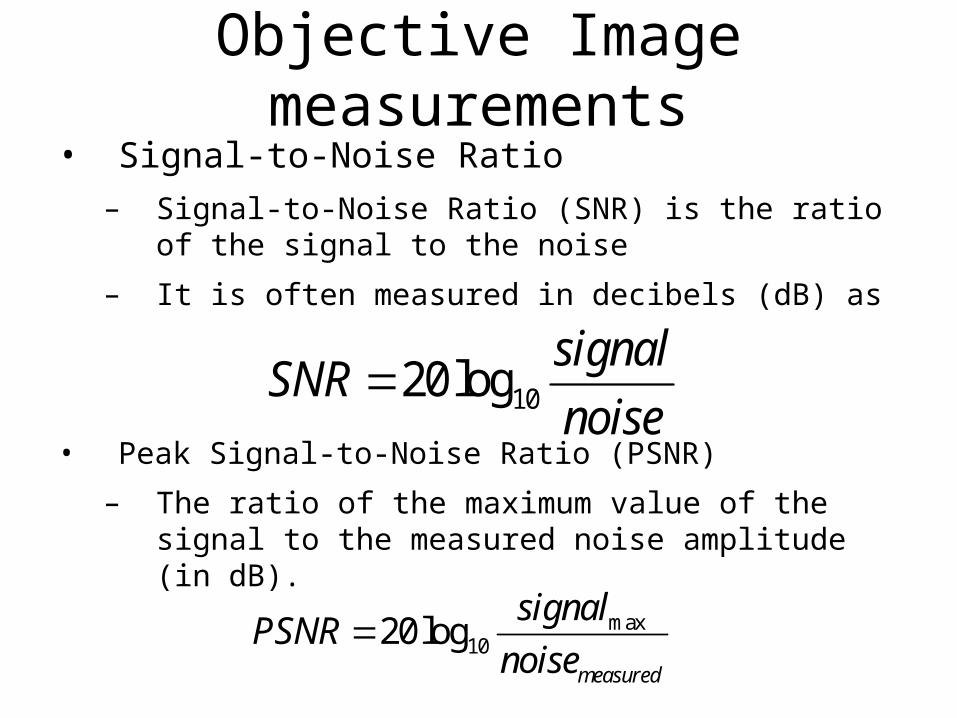
Objective Image measurements• Signal-to-Noise Ratio
– Signal-to-Noise Ratio (SNR) is the ratio of the signal to the noise
– It is often measured in decibels (dB) as
• Peak Signal-to-Noise Ratio (PSNR)
– The ratio of the maximum value of the signal to the measured noise amplitude (in dB).
1020logsignal
SNRnoise
max1020log
measured
signalPSNR
noise

Visual Psychophysics• Brightness Adaptation
• Spatial Threshold Vision– Weber ratio– Visual Masking– Mach Effect
• Temporal vision
• Frequency Threshold Vision

Brightness Adaptation
• HVS can view large intensity range (1010)
• HVS cannot operate over such a high dynamic range simultaneously,
• If one is at Ba intensity (outside) and walk into a dark theater, he can only distinguish up to Bb. It will take much longer for eye to adapt for the scotopic vision to pick up.
• But accomplish such large variation by changes in its overall sensitivity, a phenomenon called “brightness adaptation”

Brightness Discrimination
Weber ratio=I/I
• HVS’s sensitivity to intensity difference differ at different background intensities.
• Weber ratio: I/I: Just noticeable intensity difference versus background intensity. It is a function of log I.

Simultaneous Contrast The perceived brightness of inner square are different due to different
background intensity levels even they are identical.
Same luminance but varying brightness (perceived luminance)

Mach Bands Perceived Brightness changes around strong edges.

Visual Masking
Threshold intensity increases at background with large non-uniform spatial, temporal changes.

Temporal Vision• Perceived spatial resolution reduced
sharply at scene change
• Flicker fusion: the basis of movie and TV
• Eye is more sensitive to flicker at high luminance than low luminance.

Frequency Threshold Vision• Using spatial grating, it is found that
contrast sensitivity is a function of spatial and temporal frequencies.
• In general, the contrast sensitivity decreases as spatial and temporal frequencies increases.

Lightness Illusion
If we cover the right side of the figure and view the left side, it appears that the stripes are due to paint (reflectance). If we cover the left side and view the right, it appears that the stripes are due to different lighting on the stair steps (illumination).

Another Lightness Illusion

Optical Illusions

Illusion Examples

Illusion Example

Illusion Example
Image Resolution
• 3 resolutions1. Spatial resolution (no. of pixels)
2. Brightness (no. of grey levels)
3. Temporal (number of frames per second)
• These resolutions do have a mutual dependency

Image Represented by a Matrix
Spatial resolution?

Spatial Resolution• An image is represented as a 2-D array of sample points called pixels.
• A simple definition of spatial resolutions
spatial resolution = h * v
where h = no. of horizontal pixels and v = no. of vertical pixels.
• E.g. A 320 x 200 image has 320 pixels on each horizontal line and 200 pixels on each vertical line.
320
x x x x x x x x x x x x x x x x x x xx x x x x x x x x x x x x x x x x x xx x x x x x x x x x x x x x x x x x xx x x x x x x x x x x x x x x x x x xx x x x x x x x x x x x x x x x x x xx x x x x x x x x x x x x x x x x x xx x x x x x x x x x x x x x x x x x x
pixel
200

Spatial Resolution
• Field of view, θv : the angle subtended by rays of light that hit the detector at the edge of the image
• Relationship between field of view, the camera detector, and focal length, f.
• r: the smallest resolvable object• Z: the distance from the camera • θ: the angular resolution in radians
θv
fv
h
r
Z
Spatial Resolution
• To resolve an object 2mm in diameter at a range of 1m, the minimum angular resolution, θ, needs to be
θ = 2mm/1m
= 0.002 radian
= 0.1146 degree.

Spatial Resolution
• According to Nyquist theorem, at least two samples per period are needed to represent a periodic signal unambiguously,
• Applying the Nyquist theorem to the spatial dimension, two pixels must span the smallest dimension of an object in order for it to be seen in the image.

Spatial Resolution
• When a fixed size displaying window shows an image of varying resolution
– Low resolution image loses details
– High resolution image shows details
Low resolution High resolution

Spatial Resolution
1024x1024 down-sampling till 32x32.
The gray levels 256

Image Resampling

Brightness Resolution• For monochrome image,
– Brightness resolution = Number of grey levels
• Our eyes can differentiate around 40 shades of grey only
• Image capture devices are limited in differentiating number of grey levels
• Most monochrome images are captured using 8 bit values. Range of grey levels is [0, 255].
• Images with more shades of grey show more details
b&w
8 bit grey

Bit-depth Resolution
(a) Original 256 levels (b-h) With 128, 64, 32, 16, 8, 4, 2 gray levels Spatial resolution constant
Color Resolution
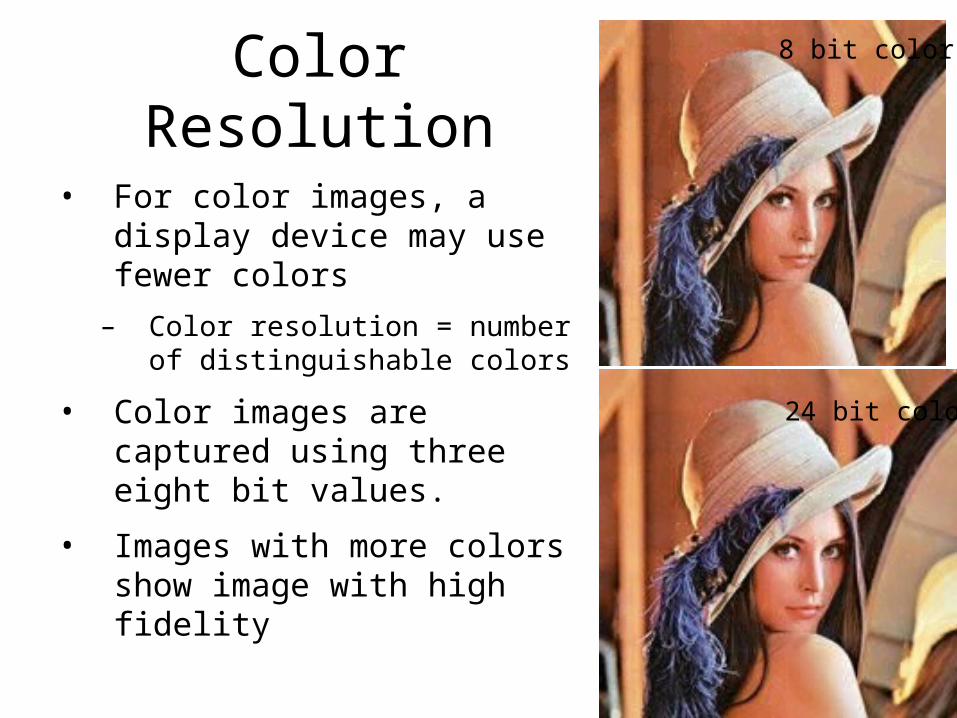
• For color images, a display device may use fewer colors
– Color resolution = number of distinguishable colors
• Color images are captured using three eight bit values.
• Images with more colors show image with high fidelity
8 bit color
24 bit color

Image Bits per Pixel
• 1 bit/pixel: black & white image, facsimile image
• 4 bits/pixel: computer graphics
• 8 bits/pixel: greyscale image
• 16 or 24 bits/pixel: colour images
– colour representations: RGB, HSV, YUV, YCbCr

1-bit Images
Each pixel is stored as a single bit (0 or 1)
Also called, 1-Bit / binary image / bi-level/ two-level/ B&W/ Monochromatic / monochrome (since it contains no color)
640x480 monochrome image requires 38.4 kB of storage (640x480/8).

Grey-scale image Each pixel has a gray-value
between 0 and 255.
Each pixel is represented by a single byte; e.g., a dark pixel might have a value of 10, and a bright one might be 230.
8 bit image can be thought of as a set of 1-bit biplane.
A 640x480 grayscale image requires 300 kB of storage (640x480=307,200)

Image Data Types
• The most common data types for graphics and image file formats - 24-bit color and 8-bit color.
• Most image formats incorporate a compression technique due to the large storage size of image files. Compression techniques either lossless or lossy.
• In a color 24-bit image, each pixel is represented by three bytes, usually representing RGB.
• Many 24-bit color images are actually stored as 32-bit images, with the extra byte of data for each pixel used to store an alpha value representing special effect information (e.g., transparency).

8-Bit Color Images
• Some systems support 8 bits of color information in producing a screen image
• 8-bit color images store only the index, or code value, for each pixel. Then, e.g., if a pixel stores the value 25, means go to row 25 in a color look-up table (LUT).

Image Capture• Images may be captured using
– Cameras– Video cameras– Fax machines– Ultrasound scanners – Radio telescopes
• An image is formed by the capture of radiant energy that has been reflected from surfaces that are viewed
• Cameras main types:– Vidicons, charge coupled devices (CCDs), and
Complementary Metal Oxide Silicon (CMOS).

Image Capture
• The range is practically bounded by the hardware resolution. It is calibrated to 0 for black and to 255 for white. Intermediate values are different intensity of grey.
Image called “Lena” by multimedia scientists - this is a standard image used to illustrate many algorithms.

Image Capture
A color image is formed by combining the 3 images captured by the red, blue, and green sensors.
Red sensor Green sensor Blue sensor

Image Sensing
• Photographic Sensor: an image is typically proportional to the radiant energy received in the EM band to which the sensor/detector is sensitive. Image called Intensity image.
• Tactile Sensor: an image is typically proportional to the sensor deformation caused by the surface of or around of an object.

Image Sensing• Range Finder sensor: an image is a function of the line-of-
sight distance from the sensor position to an object in the 3-D world. This image is called range image
• Thermal Imaging: Thermographic cameras detect in the IR range of EM spectrum and produce images of that radiation.
• IR radiation emitted by all objects based on their temperature.
• Thermography makes it possible to see one’s environment with or without visible illumination.
• Ex. Military application; firefighters, maintenance operations, etc.

Single-sensor Imaging

“Motion” Aids Imaging

Sensor Array: CCD Imaging

Sampling and Quantization: 1D Case

2D Sampling and Quantization

Digital ImageDigital Image
a grid of squares, each of which contains a single color
a grid of squares, each of which contains a single color
each square is called a pixel (for picture element)
each square is called a pixel (for picture element)
Color images have 3 values per pixel; monochrome images have 1 value per pixel.

PixelsPixel Location: p = (r , c)
Pixel Value: I(p) = I(r , c) Pixel : [ p, I(p)]

Sampling and Quantization
sampledreal image quantized sampled & quantized

Sampling and Quantization
sampledreal image quantized sampled & quantized
pixel gridcolumn indexcolumn index
row
index
row
in
dex

Digital Image Formation: Quantization
continuous color input
disc
rete
col
or o
utpu
t
continuous colors mapped to a finite,
discrete set of colors.
continuous colors mapped to a finite,
discrete set of colors.
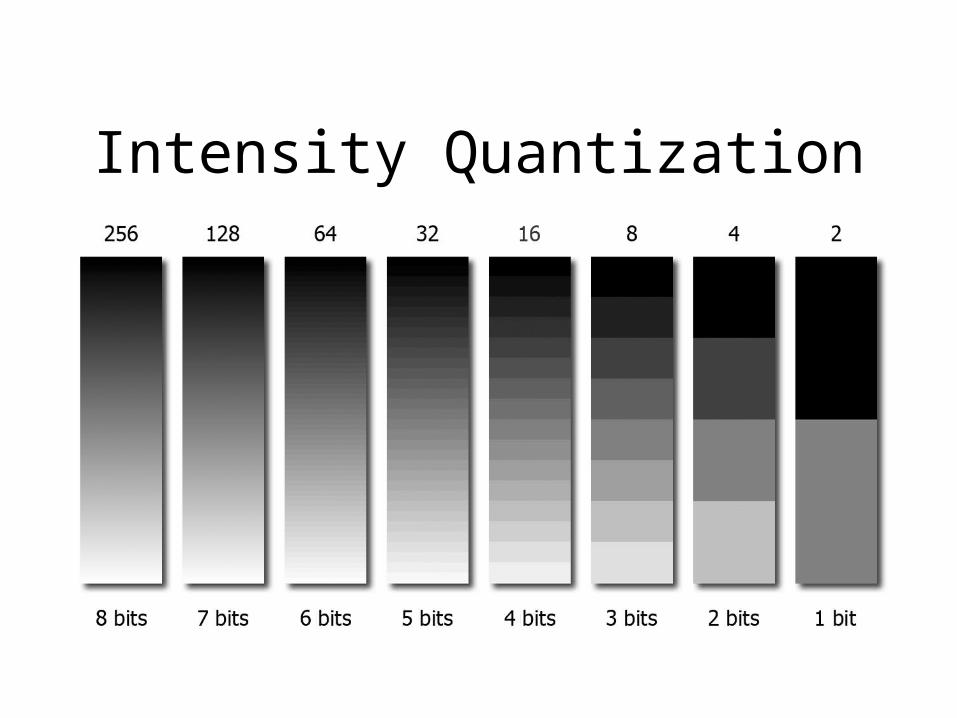
Intensity Quantization

Commonly–used TerminologyCommonly–used Terminology
Neighbors of a pixel p=(i,j)
N4(p)={(i-1,j),(i+1,j),(i,j-1),(i,j+1)}N8(p)={(i-1,j),(i+1,j),(i,j-1),(i,j+1),(i-1,j-1),(i-1,j+1),(i+1,j-1),(i+1,j+1)}
Adjacency
4-adjacency: p,q are 4-adjacent if p is in the set N4(q)
8-adjacency: p,q are 8-adjacent if p is in the set N8(q)
Note that if p is in N4/8(q), then q must be also in N4/8(p)

Euclidean distance (2-norm)
D4 distance (city-block distance)
D8 distance (checkboard distance)
01 1
1
1
01 1
1
1
01 1
1
11 1
1 1
2 2 2 2 2
2
2
2
2 2 2 2
2
2
2
2
2
2
2
2
2
2
2
23
3
3
3 3
3
3
34
4 4
42
2 2
2
2 2
22
22
22 22
22
5
5
55
5
5
5 5
Common Distance Definitions

Block-based Processing
![Synthesis of Novel Electrically Conducting Polymers: Potential ... · PPh3 + Br(CH2). CO2Me ..... > [Ph3P--CH2(CH2). i CO2Me]*Br* [phaP--CH2(CH2)n__CO2Mel*Br -Z--BuL>_phaP=CH (C H2)n_i](https://static.fdocuments.us/doc/165x107/5ebc39ab077be8135d1c1d2a/synthesis-of-novel-electrically-conducting-polymers-potential-pph3-brch2.jpg)


![blog. · Web viewANSWER: B ANSWER: C [CI`(H2O)4C1(NO2)]CI COON HOOC-CH2\N_CCH~_CH___N/H Ml ` | ` \' ' CH2 CH2 -COOH HOOC' HOOC`.."CHZ CH2"COOH \ I /N-CH2-CH2-N\ HOOC""CH2 CH2-COOH](https://static.fdocuments.us/doc/165x107/5ab561c67f8b9a0f058cbd1a/blog-viewanswer-b-answer-c-cih2o4c1no2ci-coon-hooc-ch2ncchchnh.jpg)