Ch10: T-tests 6 Mar 2012 Dr. Sean Ho busi275.seanho.com Please download: 08-TTests.xls 08-TTests.xls...
23
Ch10: T-tests Ch10: T-tests 6 Mar 2012 Dr. Sean Ho busi275.seanho.com Please download: 08-TTests.xls HW5 this week Projects
-
Upload
felicity-melina-hopkins -
Category
Documents
-
view
223 -
download
1
Transcript of Ch10: T-tests 6 Mar 2012 Dr. Sean Ho busi275.seanho.com Please download: 08-TTests.xls 08-TTests.xls...

Ch10: T-testsCh10: T-tests
6 Mar 2012Dr. Sean Ho
busi275.seanho.com
Please download:08-TTests.xls
HW5 this weekProjects
6 Mar 2012BUSI275: t-tests 2
Outline for todayOutline for today
Preview of statistical tests for your projects T-tests (comparing two groups of values):
Standard error When σ1, σ2 are known
When s1, s2 are known, heteroscedastic
When s1, s2 are known, homoscedastic
Using Excel's TTEST() function on data Types of t-test
Independent groups Binomial proportions (σ known) Paired data

6 Mar 2012BUSI275: t-tests 3
Exploratory analysisExploratory analysis
Choosing good research questions: Start with the outcome variable (DV)
e.g., sales volume Research background (prior literature) on the DV
to find likely predictors e.g., marketing budget, consumer trends,
new products from competitors, etc. Select some effect/predictor(s) to examine
In your analysis, control for other covariates Correlation ≠ causation: look for hidden vars
e.g., ice cream correlates with drownings! Why? What are they both correlated with?

6 Mar 2012BUSI275: t-tests 4
Analysis Types by IV/DVAnalysis Types by IV/DV
DV quantitative, IV categorical: IV dichotomous (two groups): t-test IV has many groups: ANOVA Multiple categorical IVs: Factorial ANOVA
Controlling for covariates: ANCOVA DV quantitative, IV quantitative:
One IV: Simple Regression Multiple IVs: Multiple Regression
Also if mix of categorical/quant IVs DV dichotomous: Logistic Regr. (survival an.) DV ordinal: Ordinal Regr.
… and much more!

6 Mar 2012BUSI275: t-tests 5
Comparing two groupsComparing two groups
Assume: quantitative DV Assume: two independent groups
IV is dichotomous (nominal w/ 2 categories) Each participant goes in only one group
Look at difference between pop means: μ1 – μ2. E.g., is CEO salary in US higher than in Can?
DV: salary. IV: country (US vs. Can) HA: μUS – μCan > 0
E.g., does gender affect invest. risk tolerance? DV: risk tolerance. IV: gender (M vs. F) HA: μM – μF ≠ 0

6 Mar 2012BUSI275: t-tests 6
Hypothesis testingHypothesis testing
As before, we can either: Estimate a confidence interval on μ1 – μ2
If 0 is not in the interval, then there is a significant difference between groups
Or do a hypothesis test on μ1 – μ2
x1 – x2 is a threshold: p-val is area in tail
Key components to calculate: Point estimate (x1 – x2), t-score, and Standard error T-distribution also needs a df

6 Mar 2012BUSI275: t-tests 7
How to approach a t-testHow to approach a t-test
What format do you want the output in? Hypothesis test (p-value) or conf. interval?
What info on the data do you have? Full dataset: use Excel's TTEST() function Only means/SD: calculate manually
Standard error (SE) is key ingredient What type of t-test?
Independent groups Homoscedastic or heteroscedastic?
Binomial proportions Paired data

6 Mar 2012BUSI275: t-tests 8
Outline for todayOutline for today
Preview of statistical tests for your projects T-tests (comparing two groups of values):
Standard error When σ1, σ2 are known
When s1, s2 are known, heteroscedastic
When s1, s2 are known, homoscedastic
Using Excel's TTEST() function on data Types of t-test
Independent groups Binomial proportions (σ known) Paired data
6 Mar 2012BUSI275: t-tests 9
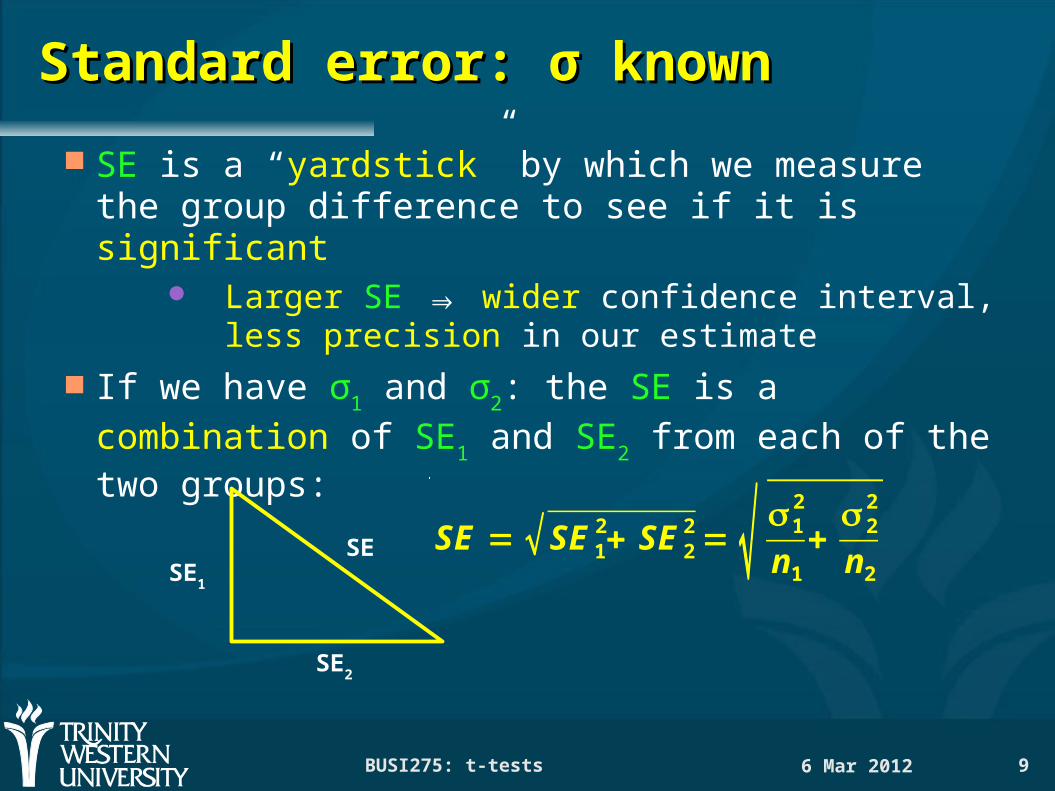
Standard error: σ knownStandard error: σ known
SE is a “yardstick” by which we measure the group difference to see if it is significant
Larger SE ⇒ wider confidence interval,less precision in our estimate
If we have σ1 and σ2: the SE is a combination of SE1 and SE2 from each of the two groups:
SE = √ SE12+ SE2
2 = √ σ 12
n1
+σ 2
2
n2SE1
SE2
SE

6 Mar 2012BUSI275: t-tests 10
Standard error: using sStandard error: using s
More realistically, we would only have s1, s2
As well as n1, n2, x1, x2
SE is the same:
But the t-dist needs a df, and it is messy:
In general, df is somewhere in between min(n1 – 1, n2 – 1) (lower bound), and
n1 + n1 – 2 (upper bound)
SE = √ SE12+ SE2
2 = √ s12
n1
+s2
2
n2
df =( s1
2 /n1 + s22 / n2)
2
( s12 / n1)
2
n1−1+
( s22 / n2)
2
n2−1

6 Mar 2012BUSI275: t-tests 11
Standard error: homoscedasticStandard error: homoscedastic
If s1, s2 are similar, we can try another method: Homoscedasticity: same variance Rule of thumb: s1, s2 are within a factor of 2
df is simpler: df = df1 + df2 = n1 + n2 - 2
The pooled variance sp2
is a weighted sum:
So the pooled SD is:
Then the SE simplifies to: SE = s p√1n1
+ 1n2
s p = √(n1−1) s12+ (n2−1) s2
2
n1+ n2−2
s p2 = (df 1
df )s12+ (df 2
df )s22

6 Mar 2012BUSI275: t-tests 12
Outline for todayOutline for today
Preview of statistical tests for your projects T-tests (comparing two groups of values):
Standard error When σ1, σ2 are known
When s1, s2 are known, heteroscedastic
When s1, s2 are known, homoscedastic
Using Excel's TTEST() function on data Types of t-test
Independent groups Binomial proportions (σ known) Paired data

6 Mar 2012BUSI275: t-tests 13
Example: household incomeExample: household income
RQ: did US household income decrease between 2001 and 2004?
Data: income for each of 100 hholds in 2001;another sample of 100 households in 2004
What format output? (p-value or conf. int.?) What format input? (raw data or just mean/SD?) What kind of t-test?
Indep. groups, proportions, or paired data? Homoscedastic or heteroscedastic?
How can we check? See “Income” in 08-TTests.xls
6 Mar 2012BUSI275: t-tests 14
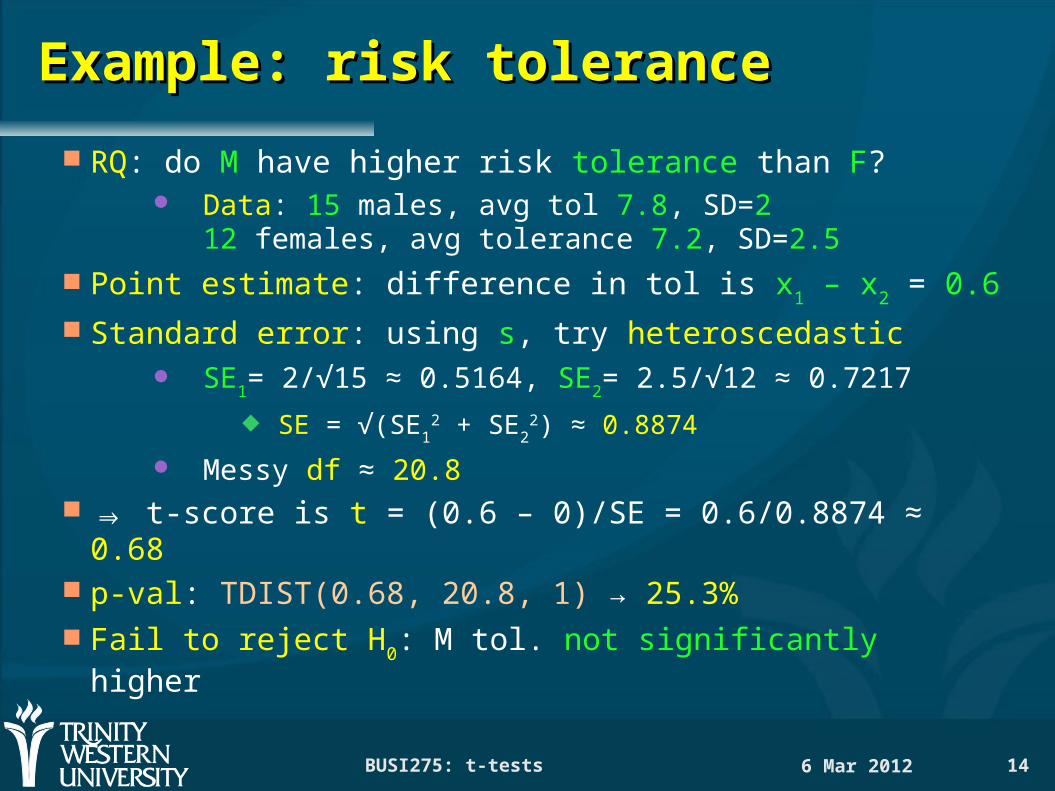
Example: risk toleranceExample: risk tolerance
RQ: do M have higher risk tolerance than F? Data: 15 males, avg tol 7.8, SD=2
12 females, avg tolerance 7.2, SD=2.5
Point estimate: difference in tol is x1 – x2 = 0.6 Standard error: using s, try heteroscedastic
SE1= 2/√15 ≈ 0.5164, SE2= 2.5/√12 ≈ 0.7217
SE = √(SE12 + SE2
2) ≈ 0.8874
Messy df ≈ 20.8 ⇒ t-score is t = (0.6 – 0)/SE = 0.6/0.8874 ≈ 0.68 p-val: TDIST(0.68, 20.8, 1) → 25.3% Fail to reject H0: M tol. not significantly higher

6 Mar 2012BUSI275: t-tests 15
Outline for todayOutline for today
Preview of statistical tests for your projects T-tests (comparing two groups of values):
Standard error When σ1, σ2 are known
When s1, s2 are known, heteroscedastic
When s1, s2 are known, homoscedastic
Using Excel's TTEST() function on data Types of t-test
Independent groups Binomial proportions Paired data

6 Mar 2012BUSI275: t-tests 16
T-test on proportionsT-test on proportions
e.g., customer satisfaction vs. bank branch: See “Banks” in 08-TTests.xls At Langley, 160/200 customers satisfied At Abbt., 210/300 satisfied Is there a significant difference?
Use normal approximation to binomial: When both np, nq > 5 (for both groups)
For confidence intervals, SE = √(SE12 + SE2
2)
Where each SEi = √(piqi/ni)
For hypothesis tests, use a different SE Uses pooled proportion:
6 Mar 2012BUSI275: t-tests 17
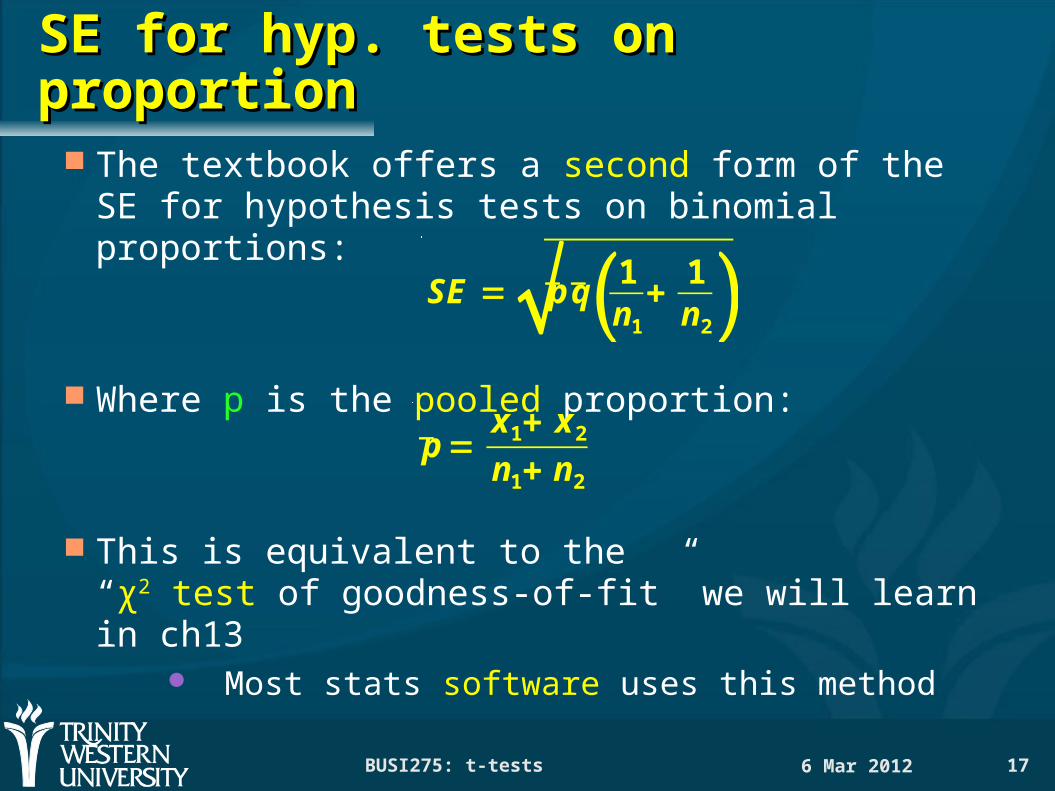
SE for hyp. tests on proportionSE for hyp. tests on proportion
The textbook offers a second form of the SE for hypothesis tests on binomial proportions:
Where p is the pooled proportion:
This is equivalent to the“χ2 test of goodness-of-fit” we will learn in ch13
Most stats software uses this method
SE = √p̄ q̄( 1n1
+ 1n2)
p̄ =x1+ x2
n1+ n2

6 Mar 2012BUSI275: t-tests 18
Proportions: bank exampleProportions: bank example
Langley: xL = 160, nL = 200
Abbt.: xA = 210, nA = 300 Pooled p = (160+210) / (200+300) = 74% SE = √ pq (1/nL + 1/nA) ≈ 4.0042% Sample difference of proportions is
pL – pA = (160/200) – (210/300) = 10%
This means a z-score of z = ((pL – pA) – 0) / SE ≈ 10% / 4.0042% ≈ 2.497
Find the p-value (2-tailed): =2*NORMSDIST(-2.497) → 0.0125 Reject H0: yes, there is a difference

6 Mar 2012BUSI275: t-tests 19
Outline for todayOutline for today
Preview of statistical tests for your projects T-tests (comparing two groups of values):
Standard error When σ1, σ2 are known
When s1, s2 are known, heteroscedastic
When s1, s2 are known, homoscedastic
Using Excel's TTEST() function on data Types of t-test
Independent groups Binomial proportions Paired data
6 Mar 2012BUSI275: t-tests 20
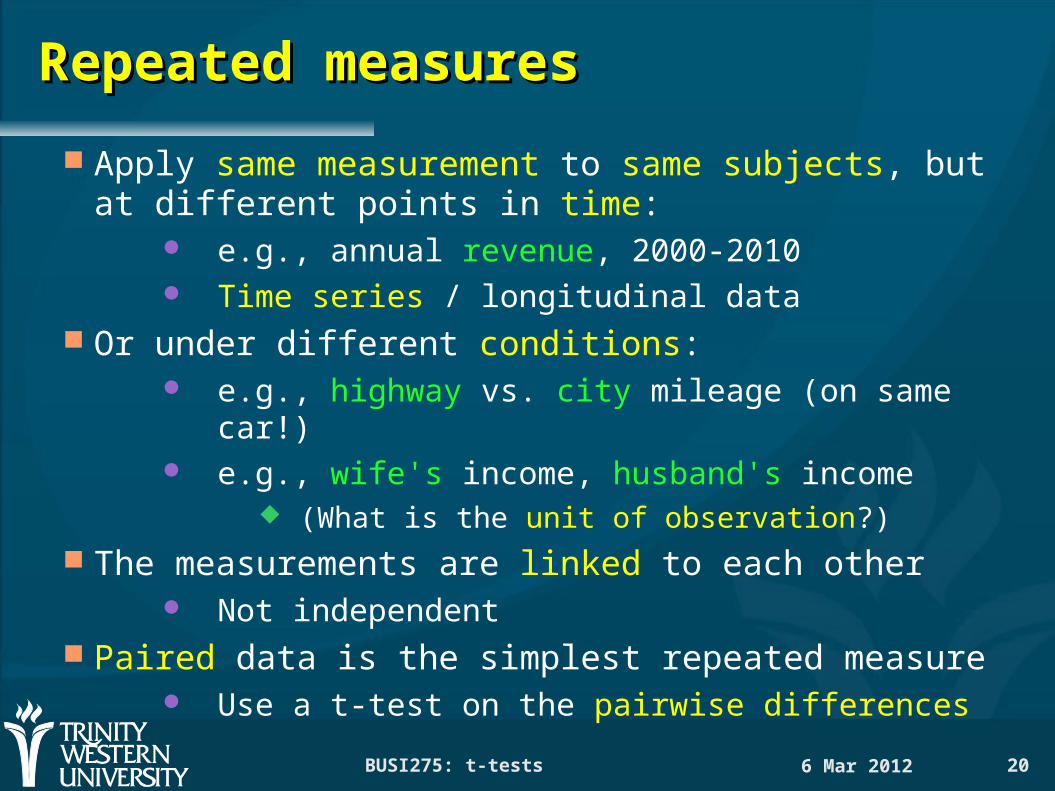
Repeated measuresRepeated measures
Apply same measurement to same subjects, but at different points in time:
e.g., annual revenue, 2000-2010 Time series / longitudinal data
Or under different conditions: e.g., highway vs. city mileage (on same car!) e.g., wife's income, husband's income
(What is the unit of observation?) The measurements are linked to each other
Not independent Paired data is the simplest repeated measure
Use a t-test on the pairwise differences

6 Mar 2012BUSI275: t-tests 21
Types of t-test (as in Excel)Types of t-test (as in Excel)
Type 3: two indep groups, most general: HA: μ1 – μ2 ≠ 0 (or >0)
SE = √(SE12 + SE2
2), df is messy
Type 2: two indep groups, similar SD: HA: μ1 – μ2 ≠ 0 (or >0)
SE = sp√(1/n1 + 1/n2), df = df1 + df2
Type 1: paired observations: Form pairwise diffs: n = # pairs HA: μd ≠ 0 (or >0)
SE = sd / √n, df = n-1
6 Mar 2012BUSI275: t-tests 22
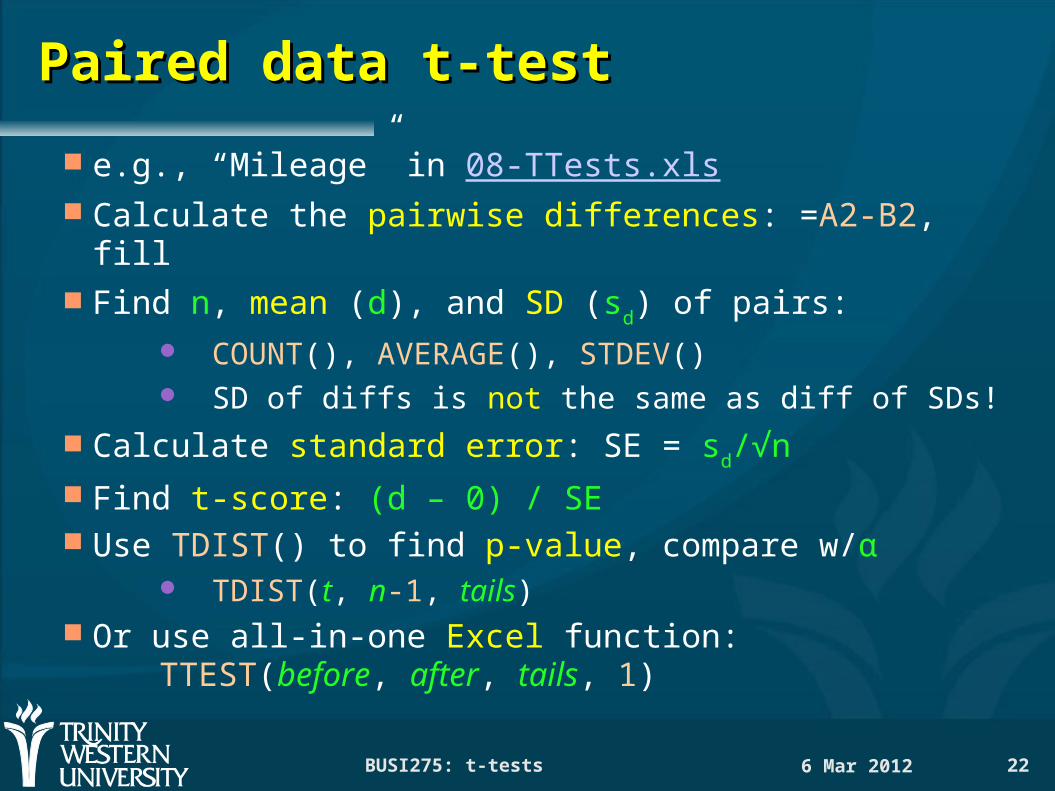
Paired data t-testPaired data t-test
e.g., “Mileage” in 08-TTests.xls Calculate the pairwise differences: =A2-B2, fill Find n, mean (d), and SD (sd) of pairs:
COUNT(), AVERAGE(), STDEV() SD of diffs is not the same as diff of SDs!
Calculate standard error: SE = sd/√n Find t-score: (d – 0) / SE Use TDIST() to find p-value, compare w/α
TDIST(t, n-1, tails) Or use all-in-one Excel function:
TTEST(before, after, tails, 1)

6 Mar 2012BUSI275: t-tests 23
TODOTODO
HW5 due Thu Projects: be pro-active and self-led
If waiting on REB approval:generate fake (reasonable) data andmove forward on analysis, presentation
Remember your potential clients:what questions would they like answered?
Tell a story/narrative in your presentation