Ch 50. Ecology of Populations Ecology: the study of interactions of organisms with other organisms...
47
Ch 50
-
Upload
curtis-howard -
Category
Documents
-
view
215 -
download
0
Transcript of Ch 50. Ecology of Populations Ecology: the study of interactions of organisms with other organisms...

Ch 50

Ecology of Populations
Ecology: the study of interactions of
organisms with other organisms and
with the physical environment

Population: members of the same
species living in the same area

Community: all the different populations in
an area
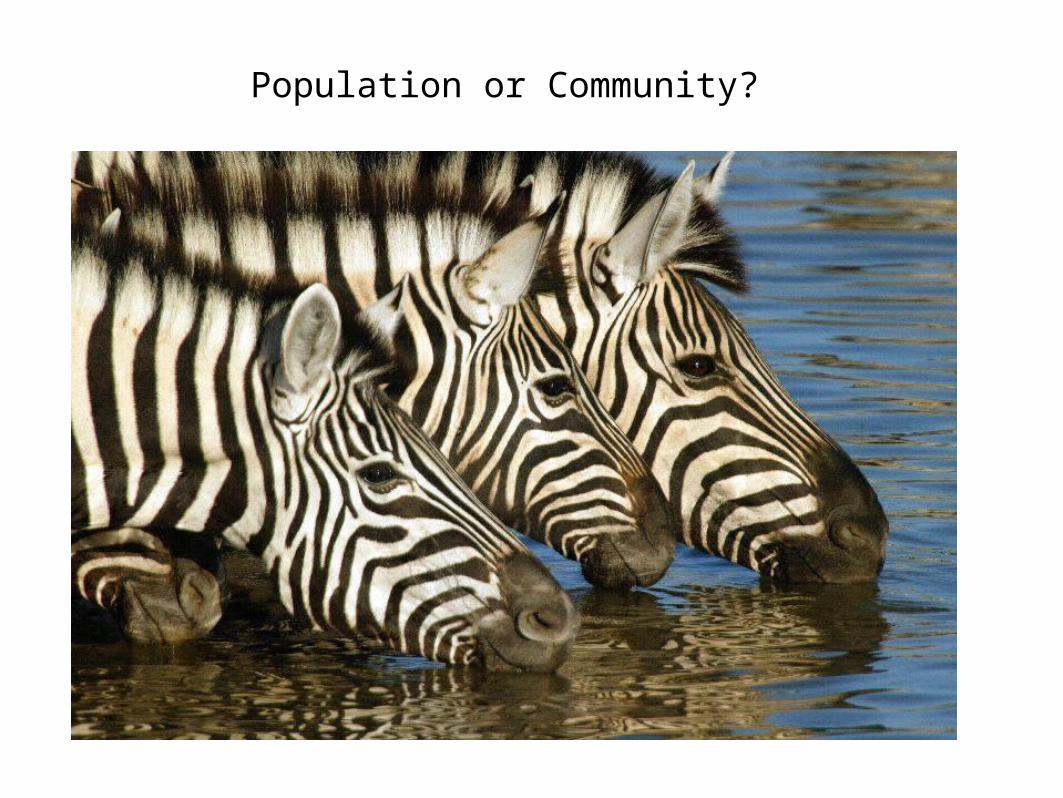
Population or Community?

Ecosystem: the community plus the
nonliving factors


Biosphere: all the areas of the earth that
supports life

Ecologists ask questions about where species occur and why species occur where they do
Figure 40.12-3
Chemicalfactors
Why is speciesX absent froman area?
Does dispersallimit its
distribution?
Area inaccessibleor insufficient time
Predation, parasitism,competition, disease
Water, oxygen, salinity,pH, soil nutrients, etc.
Do biotic factors(other species)
limit itsdistribution?
Temperature, light,soil structure, fire,moisture, etc.
Do abiotic factorslimit its
distribution?
Physicalfactors
Yes
No
YesNo

Ch 52
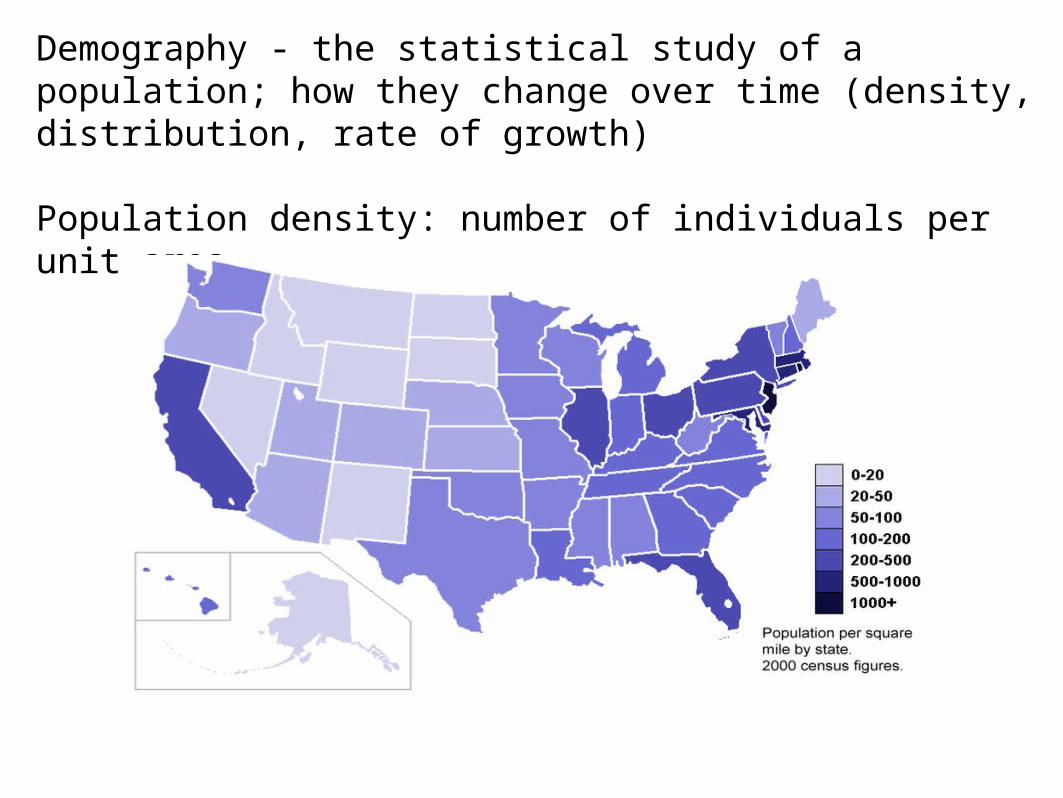
Demography - the statistical study of a population; how they change over time (density, distribution, rate of growth)
Population density: number of individuals per unit area
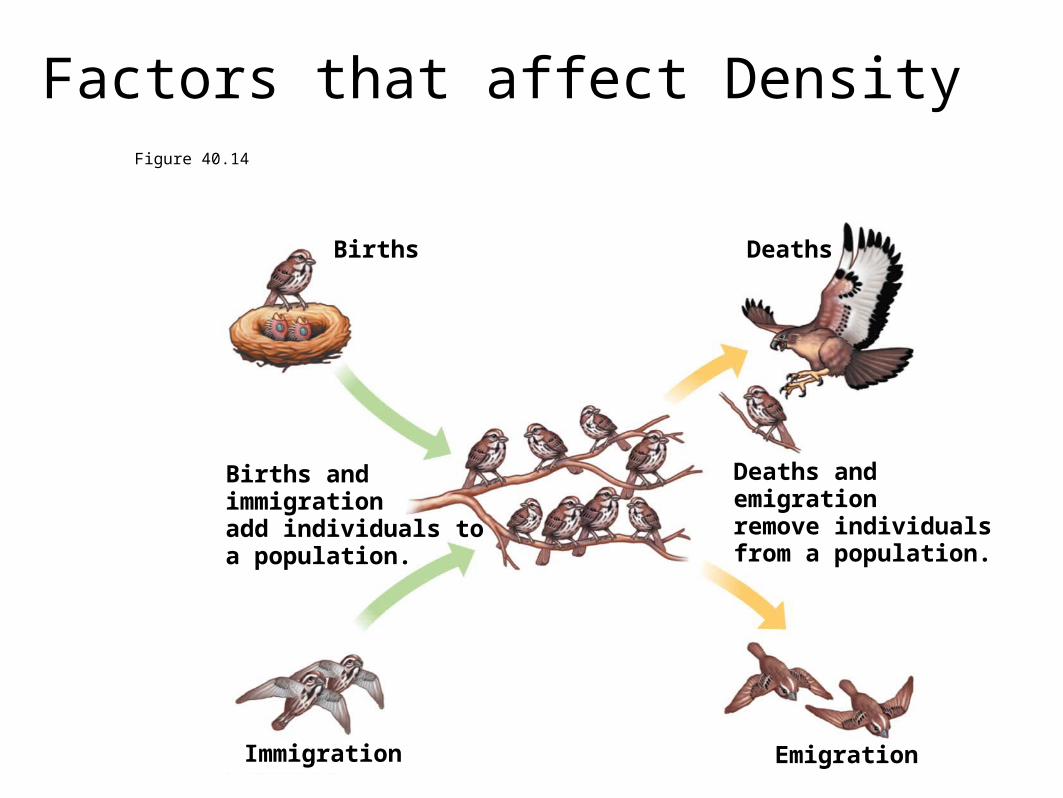
Figure 40.14
Births andimmigrationadd individuals toa population.
Deaths andemigrationremove individualsfrom a population.
Births
Immigration
Deaths
Emigration
Factors that affect Density

Figure 40.15
(a) Clumped
(c) Random(b) Uniform
Why?
Population distribution:
pattern of dispersal of individuals: random, clumped, uniform
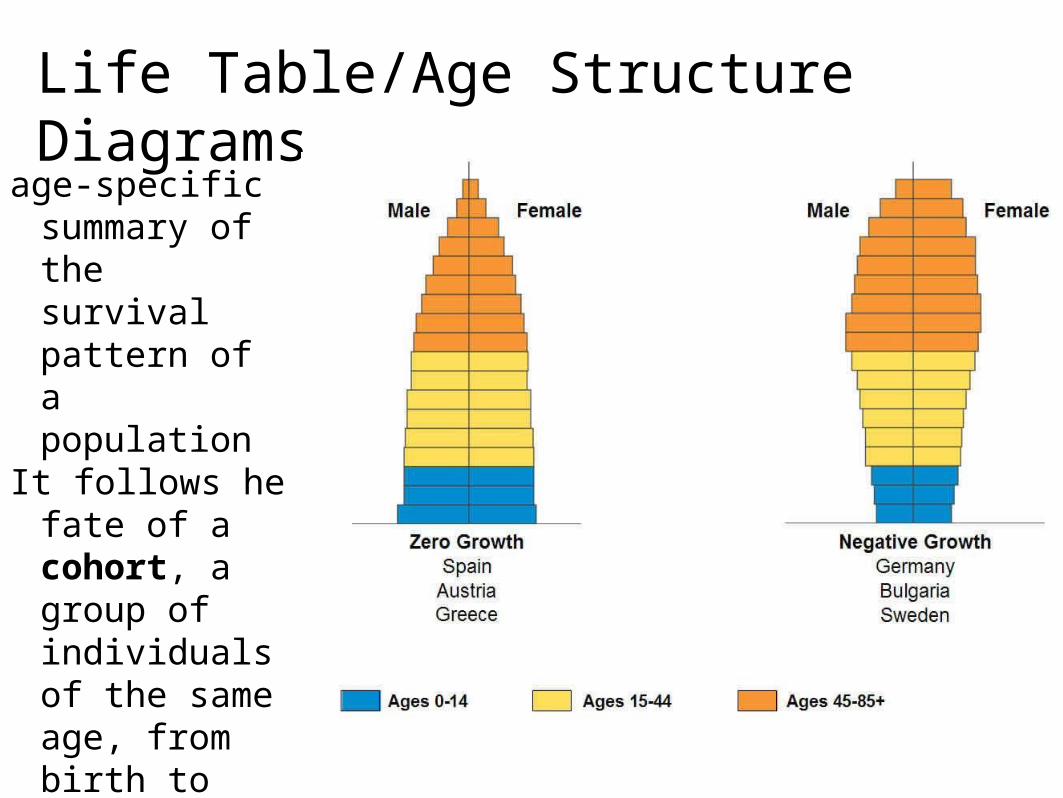
Life Table/Age Structure Diagrams
age-specific summary of the survival pattern of a population
It follows he fate of a cohort, a group of individuals of the same age, from birth to death

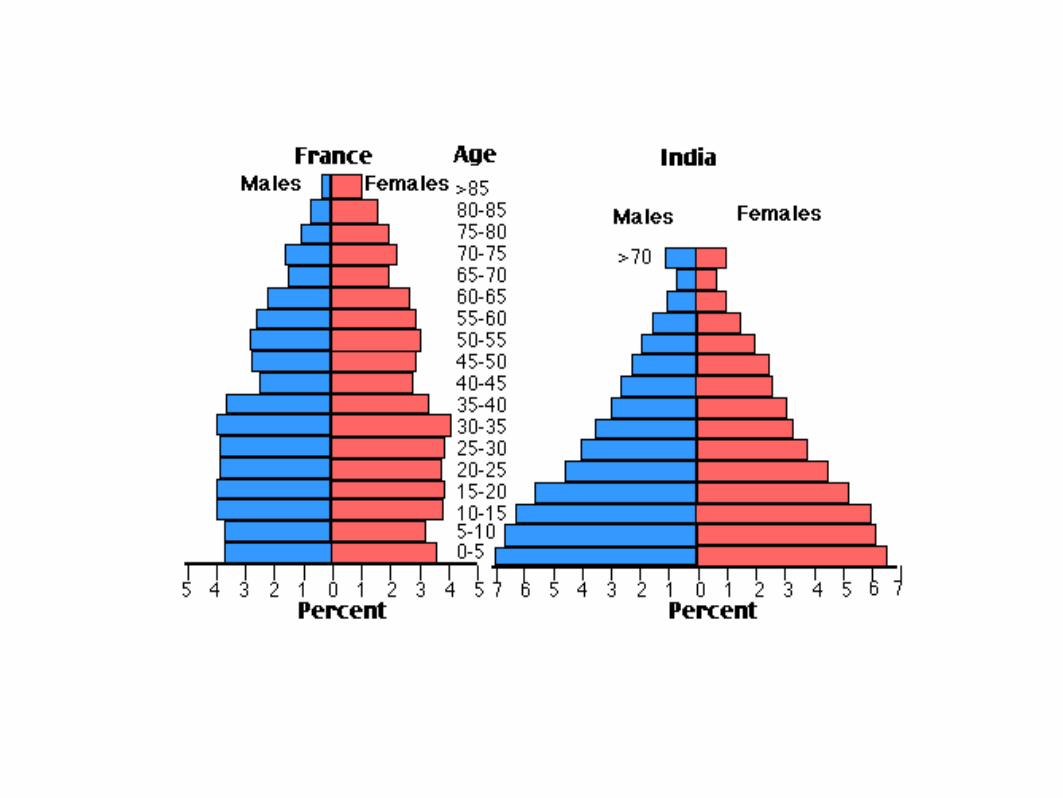
AGE STRUCTURE DIAGRAMS

Figure 46.16

Survivorship curve - probability of newborn individuals surviving to a particular age
Late Loss (Type I)Constant loss (Type II) - death is often unrelated to ageEarly loss (Type III)

Figure 46.4c

Figure 46.4d

You can create a
survivorship curve of a
human population by
studying cemetery data
(Demography Lab)

Compare the two curves below: Which country is probably the better place to live? Defend your answer.

Per Capita Rate of Increase
Change in population size can be defined by the equation
− −Change inpopulation
sizeBirths
Immigrantsentering
populationDeaths
Emigrantsleaving
Population
Population growth = rN
(r = growth rate, N = original population size)

The population growth rate can be expressed mathematically as
where N is the change in population size, t is the time interval, B is the number of births, and D is the number of deaths
Zero Population Growth
- same number enters as leaves the population
ΔNΔt
bN −mN

J-shaped curve showing exponential growth of a population
Requires unlimited resources
S-shaped curve shows how a population becomes limited by environmental factors
Logistic Growth
Carrying Capacity: the maximum size of a population that an area can support
dN = rN(K-N)dt K
dN = rNdt
Population Growth Models


Figure 40.18
6,000
Year
Ele
ph
ant
po
pu
lati
on
0
2,000
8,000
4,000
1900 1930 1940 1950 1960 19701910 1920
the elephant population in Kruger National Park, South Africa, grew exponentially after hunting was banned

Carrying capacity (K) is the maximum population size the environment can support


The Logistic Growth Model
per capita rate of increase declines as carrying capacity is reached
dNdt
rmaxN (K −N)
K

Figure 40.19
1,000
Number of generations
Po
pu
lati
on
siz
e (
N)
1.0N
100
0 155
2,000
1,500
500
1.0N
dt dN
Exponentialgrowth
Population growthbegins slowing here.
K 1,500
dt dN (1,500 N)
1,500
Logistic growth
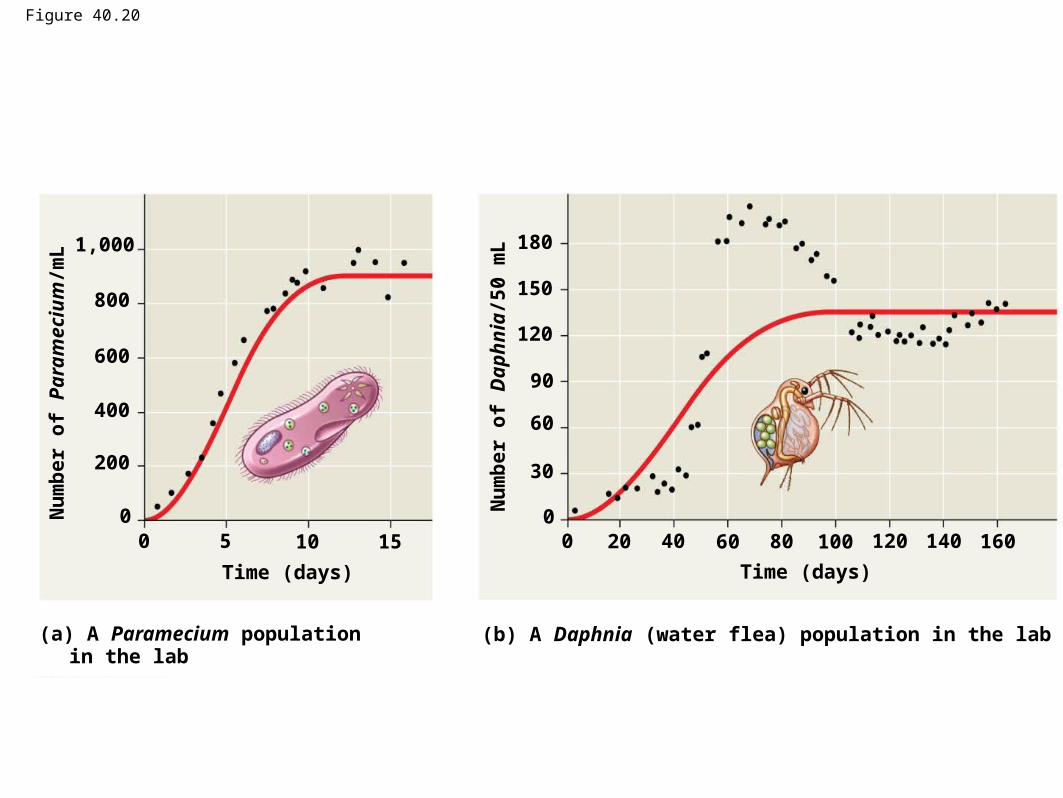
Figure 40.20
1,000
Time (days)
Nu
mb
er
of
Pa
ram
ec
ium
/mL
100
0 155
(a) A Paramecium populationin the lab
800
200
400
600
Time (days)
1400
0 160
30
(b) A Daphnia (water flea) population in the lab
40 6020 100 12080
Nu
mb
er
of
Da
ph
nia
/50
mL
180
60
150
120
90

Regulation of Population Size
Density Independent Factors: weather and other natural disastersDensity Dependent Factors: food, space, water, parasitism, competition
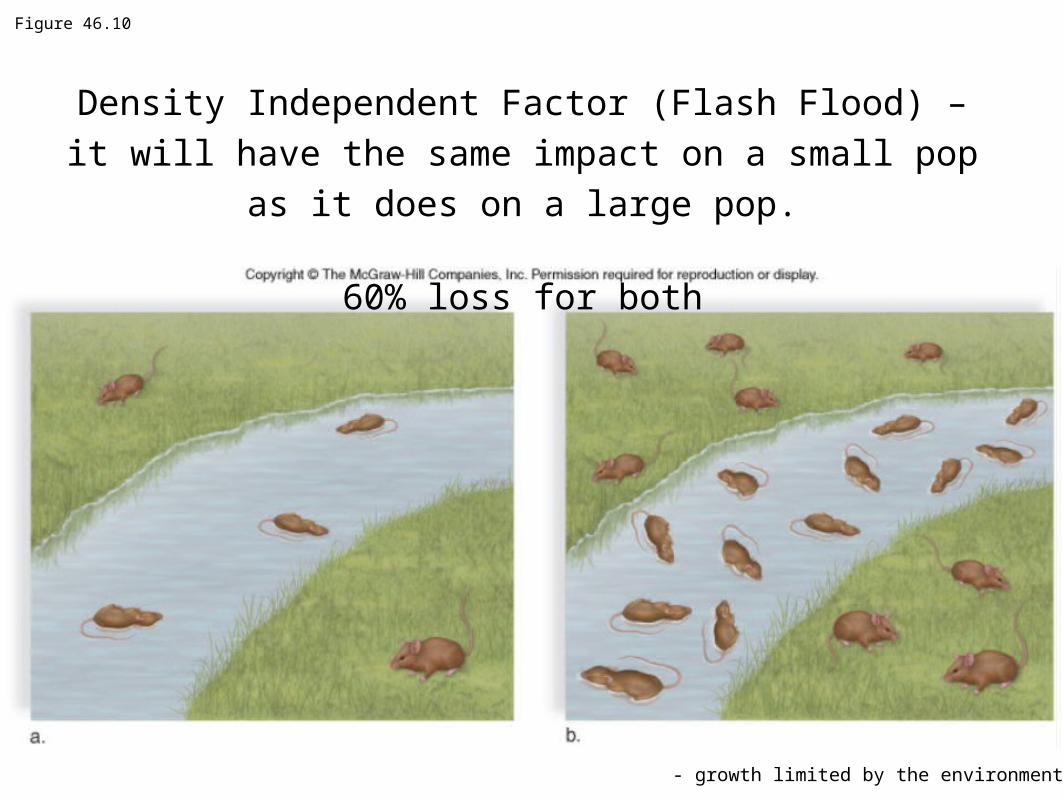
Figure 46.10
Density Independent Factor (Flash Flood) – it will have the
same impact on a small pop as it does on a large pop.
60% loss for both
- growth limited by the environment

Figure 46.11
Density Dependent Factor – as number increases,
not all of them will have access to resources
-the denser the population, the faster the resources get used up

Figure 46.12

Life History Patterns
K-strategists - small numbers of offspring, usually parental care (Kangaroo)
R-strategists - large numbers of offspring, no care, low survivability (Roaches)


Figure 46.14a

Figure 46.14b

Figure 46.13

HUMAN POPULATION GROWTHCurrent World Population: 7 billion (and growing)
•The human population is now in an exponential part of a J-shaped growth curve.
•World population increases the equivalent of one medium-sized city (216,000) per day and 79 million per year.
•The doubling time is the length of time for a population size to double, now 53 years.
•Zero population growth is when the birthrate equals the death rate and the population size remains steady.
•The world population may level off at 8, 10.5 or 14.2 billion, depending on the decline in net reproductive rate.
http://www.census.gov/main/www/popclock.html

Biotic Potential: maximum rate at which a population could grow given optimal conditions (food, water, space)
Factors that influence biotic potential:
1. age of reproduction2. frequency of reproduction3. number of offspring produced4. reproductive life span5. average death rate under ideal conditions
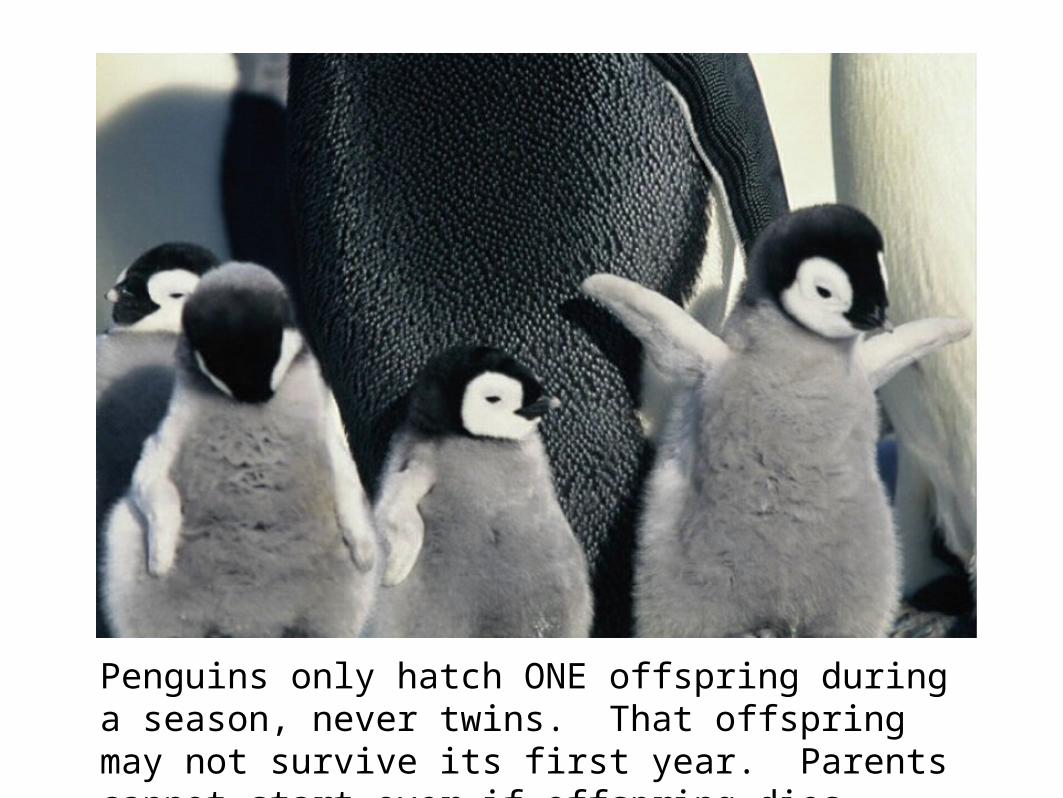
Penguins only hatch ONE offspring during a season, never twins. That offspring may not survive its first year. Parents cannot start over if offspring dies.

Don’t forget, a population can refer to plants,
fungi and bacteria…..
Algae bloom

How to calculate Population Size
Mark and recapturehttp://www.biologycorner.com/flash/mark_recap.swf
Random Sample