Ch 2. Design for Reliability. - IEMS. Design for Reliability.pdf · Ch 2. Design for Reliability....
44
- 1 - Part 2 : System Design & Development. Ch 2. Design for Reliability. Edited by Dr. Seung Hyun Lee (Ph.D., CPL) IEMS Research Center, E-mail : [email protected]
Transcript of Ch 2. Design for Reliability. - IEMS. Design for Reliability.pdf · Ch 2. Design for Reliability....

- 1 -
Part 2 : System Design & Development.
Ch 2. Design for Reliability.
Edited by Dr. Seung Hyun Lee (Ph.D., CPL)IEMS Research Center, E-mail : [email protected]

- 1 -
■ Reliability Definition.[Other Resources]
Definition. ․ The probability that an item can perform its intended function for a specified interval under stated condition. (MIL-STD-721C)
- 2 -
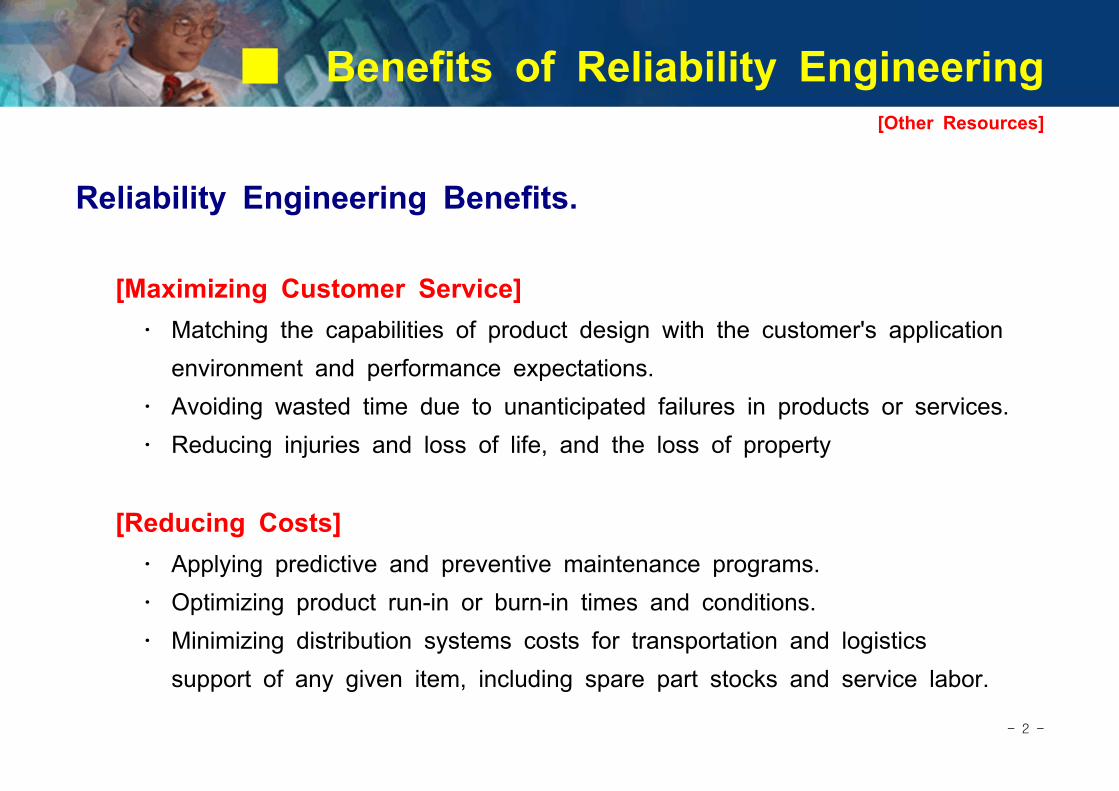
■ Benefits of Reliability Engineering[Other Resources]
Reliability Engineering Benefits.
[Maximizing Customer Service] ․ Matching the capabilities of product design with the customer's application environment and performance expectations. ․ Avoiding wasted time due to unanticipated failures in products or services. ․ Reducing injuries and loss of life, and the loss of property
[Reducing Costs] ․ Applying predictive and preventive maintenance programs. ․ Optimizing product run-in or burn-in times and conditions. ․ Minimizing distribution systems costs for transportation and logistics support of any given item, including spare part stocks and service labor.
- 3 -
■ Classification of Failures.[Other Resources]
Classification of Failure. ■ Catastrophic Failure ․ Catastrophic Failure is the sudden and total failure of a units.
■ Degradation Failure. ․ Degradation failure is indicated by the gradual loss of the unit's output.
■ Intermittent Failure. ․ Intermittent failure is characterized by the sudden loss of operation, followed by the equally sudden restoration of the complete operation.
■ Drift Failure. ․ Drift failure appears, at first, to be degradation failure in that the function is gradually lost. However, drift failure units are restored to full output by cycling (turning off and on) the unit.
- 4 -
■ Objectives of Reliability Engineering.[Other Resources]
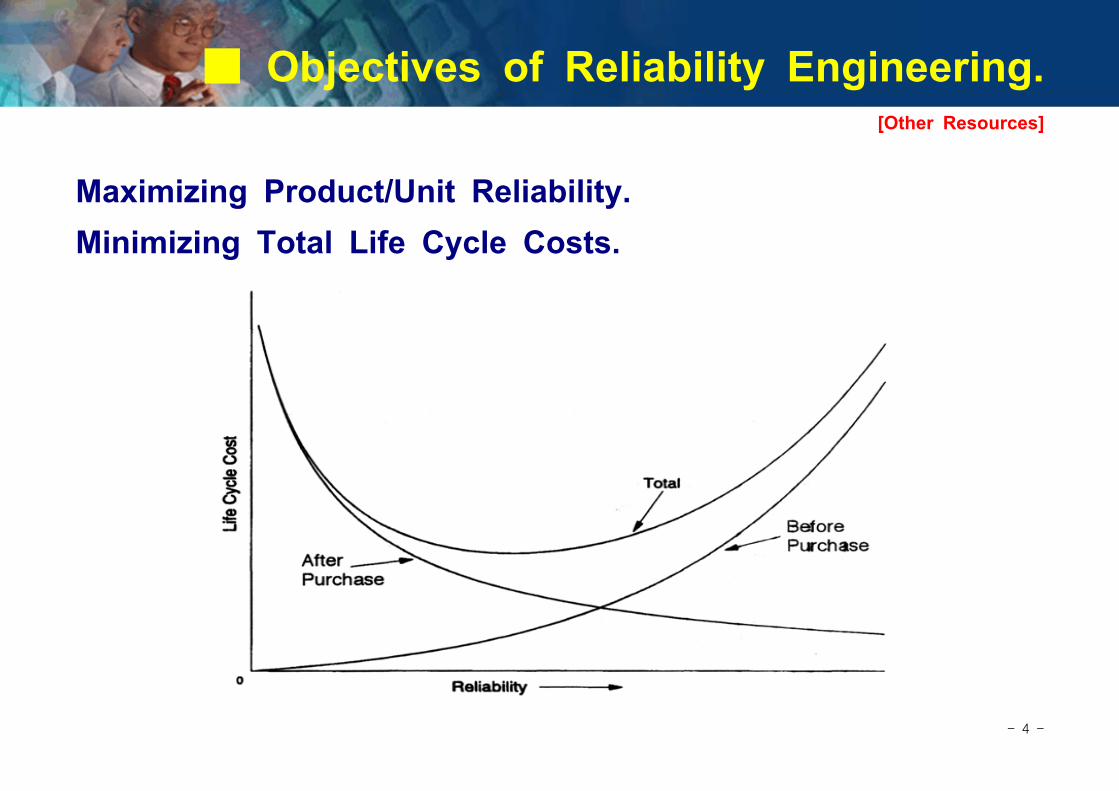
Maximizing Product/Unit Reliability. Minimizing Total Life Cycle Costs.

- 5 -
■ Reliability/Product Life Cycle Relationship. [Other Resources]
Product Cycle Reliability Focus
Conceptual Design․ Formulate ideas, estimate resource, and financial needs. ․ Identify risks requirements.․ Program objective.
Preliminary & Detailed Design
․ Identify and allocate needs and requirements. ․ Propose alternate approaches. ․ Design and test the product. ․ Develop manufacturing, operating, repair/maintenance tasks.
Production/Manufacturing
․ Refine and implement manufacturing procedures. ․ Finalize product equipment. ․ Establish quality processes.․ Build and distribute the product.
Operation/Repair
․ Implement operating, installation, and training procedures. ․ Provide repair and maintenance service.․ Repair warranty items. ․ Provide for performance feedback.
Wearout/Disposal ․ Implement refurbishment and disposal tasks. ․ Resolve potential wearout issues.
- 6 -
■ Elements of Reliability Engineering.[Other Resources]
Related Tasks for Reliability Engineering. ․ Failure Reporting, Analysis and Corrective Action System (FRACAS) ․ Design Review. ․ Vendor and Part Controls. ․ Failure Mode, Effect, and Criticality Analysis (FMECA) ․ Reliability Qualification Testing (RQT) ․ Predictions. ․ Test Analyze and Fix (TAAF) ․ Thermal Analysis. ․ Environmental Stress Screening (ESS)
- 7 -
■ Reliability Measures.[Other Resources]
Reliability : R( t)
Failure Rate : λ( t) Mean Time Between(or To) Failure : MTBF, or MTTF Notations. ․ R(t) : The reliability functions.
․ F(t) : The failure cumulative functions.
․ f(t) : The failure density functions.
․ λ(t) : The hazard functions - The instantaneous failure rate.
․ N 0 : A number of identical items at time t=0.
․ Ns(t) : A number of survived items at time t
․ Nf(t) : A number of failed items at time t
- 8 -
■ Reliability Function (cont).[Other Resources]
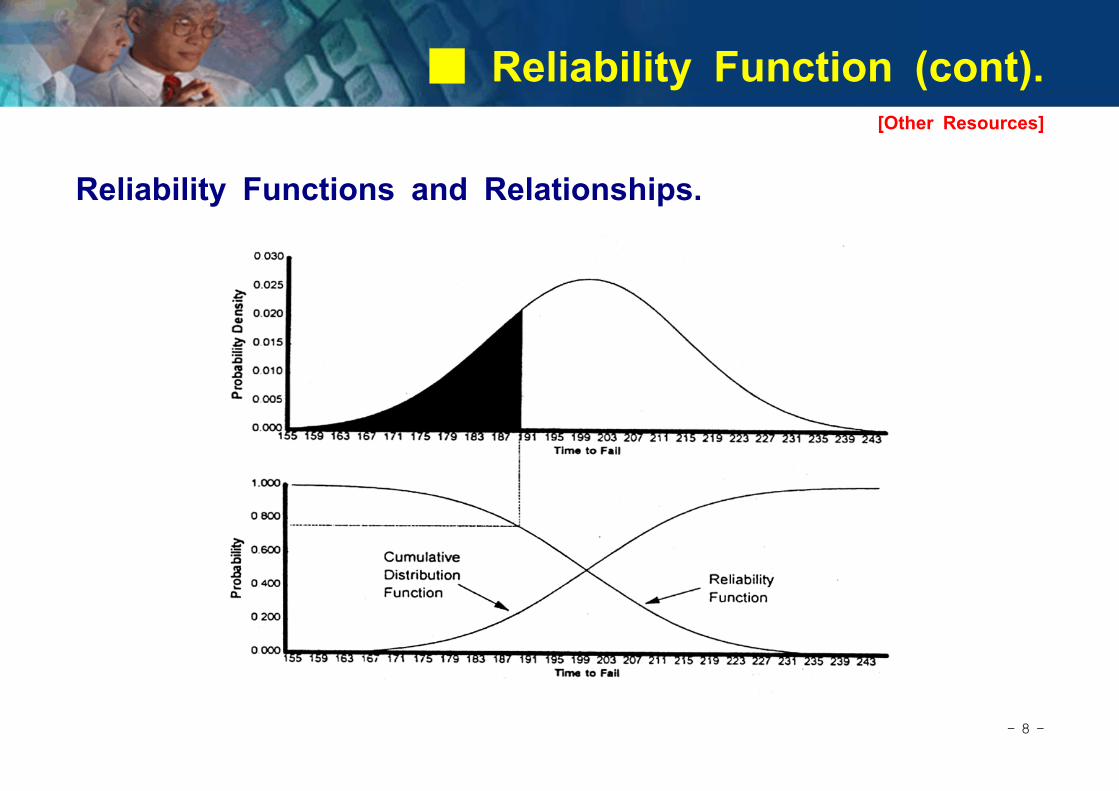
Reliability Functions and Relationships.

- 9 -
■ Reliability Function (cont).[Other Resources]
Reliability Functions and Relationships.
1. R(t) = N s(t)
N 0 =
N 0-N f(t)
N 0 = 1-
N f(t)
N 0
= 1-F( t)
2. f( t) = lim△t→0[ 1
N 0
N s(t)-N s(t+△t)
△t ] = -1N 0
ddtN s(t) (where Ns(t)=N 0R(t))
. = -ddtR( t) =
ddtF( t)
3. λ( t) = lim△t→0(
1△t )[
number of failure in ( t, t+△t)number of survivors at t ]
. = lim△t→0[ 1
N s(t)
N s(t)-N s(t+△t)
△t ] = -1N s(t)
ddtN s(t)
. = N 0f(t)
N s(t) =
f( t)R( t)
- 10 -
■ Reliability Function (cont).[Other Resources]
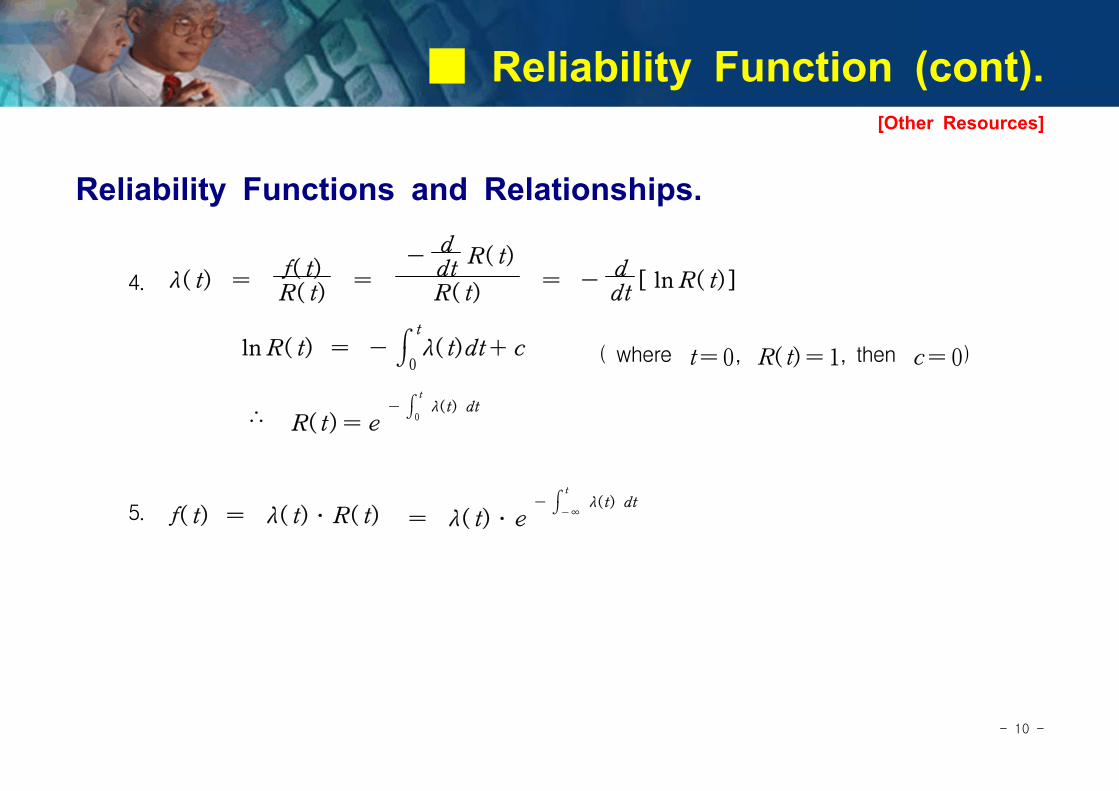
Reliability Functions and Relationships.
4. λ( t) = f( t)R( t)
= -ddtR( t)
R( t) = -
ddt
[ lnR( t)]
lnR( t) = -⌠⌡
t
0λ(t)dt+c ( where t=0 , R(t)=1, then c=0)
∴ R(t)= e-⌠
⌡
t
0 λ(t) dt
5. f( t) = λ( t)․R( t) = λ( t)․e-⌠
⌡
t
-∞ λ(t) dt
- 11 -
■ Typical Hazard Functions.[Other Resources]
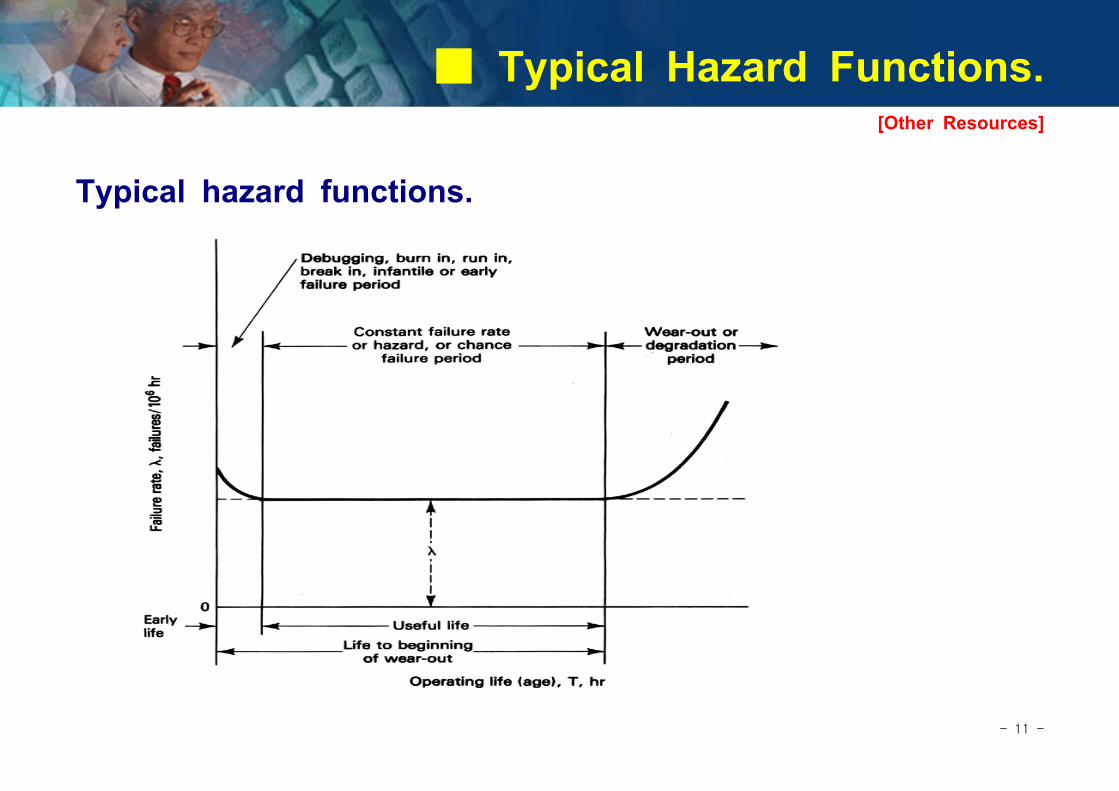
Typical hazard functions.

- 12 -
■ Failure (Density) Functions.[Other Resources]
Exponential Distribution.
․ f(x) = 1θe
-xθ = λe-λx , x ≥ 0
where, λ = the failure rate. θ = the mean
․ Mean = 1λ
․ Variance = σ2 = 1
λ2
- 13 -
■ Failure (Density) Functions.[Other Resources]
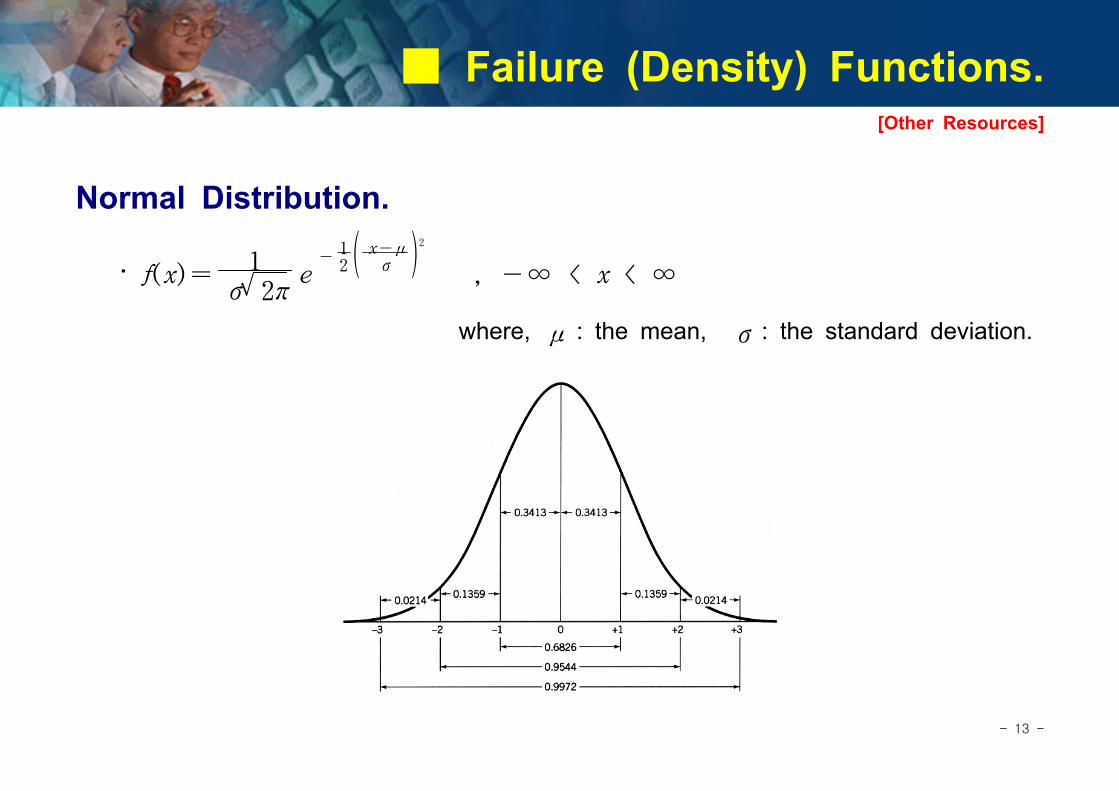
Normal Distribution.
․ f(x)= 1σ 2π
e-
12 ( x-μ
σ )2
, -∞ < x < ∞
where, μ : the mean, σ : the standard deviation.

- 14 -
■ Failure (Density) Functions.[Other Resources]
Weibull Distribution.
․ f(x) = βθ ( x-δ
θ )(β-1)
e ( x-δθ )
β
, x ≥ δ
where β : the shape parameter, θ : the scale parameter.
δ : the location parameter.
- 15 -
■ Estimation of Reliability Functions.[Other Resources]
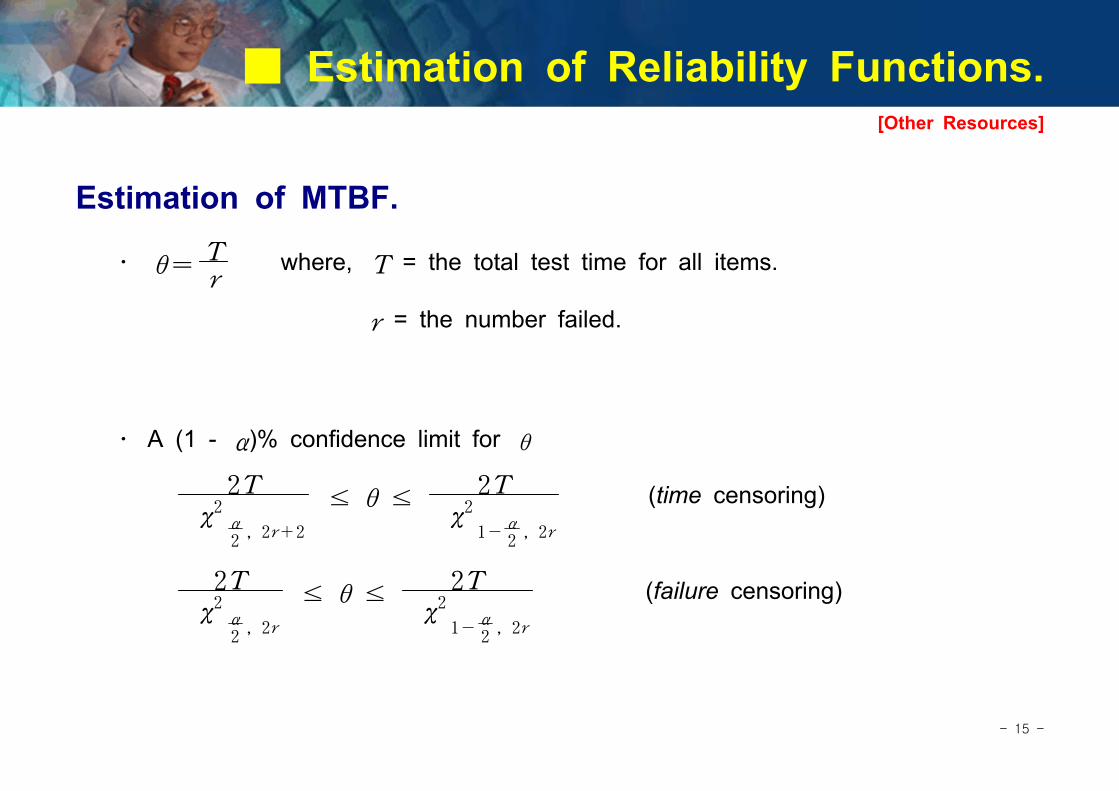
Estimation of MTBF.
․ θ= Tr
where, T = the total test time for all items.
r = the number failed.
․ A (1 - α)% confidence limit for θ
2T
χ2α2, 2r+2
≤ θ ≤ 2T
χ2
1-α2, 2r
(time censoring)
2T
χ2α2, 2r
≤ θ ≤ 2T
χ2
1-α2, 2r
(failure censoring)

- 16 -
■ Reliability Design.[Other Resources]
Stress-Strength Analysis.
․ An item fails when the applied stress exceeds the strength of the item.
․ When the stress distribution and strength distribution are independent of each other, the following relationships apply :
μ X-Y = μX-μY, σ X-Y = σ 2X+ σ2
Y
- 17 -
■ Reliability Design (cont).[Other Resources]
FRACAS. ․ The purpose of the failure reporting, analysis and corrective action system(FRACAS) is to provide a closed loop failure reporting system, procedures for analysis of failures to determine root cause, and documentation for recording corrective actions.
FRACAS Procedures. ․ Initiating failure reporting. ․ The analysis of failures. ․ Feedback of corrective action into the design, manufacturing and test procedures.
- 18 -
■ Reliability Design (cont).[Other Resources]
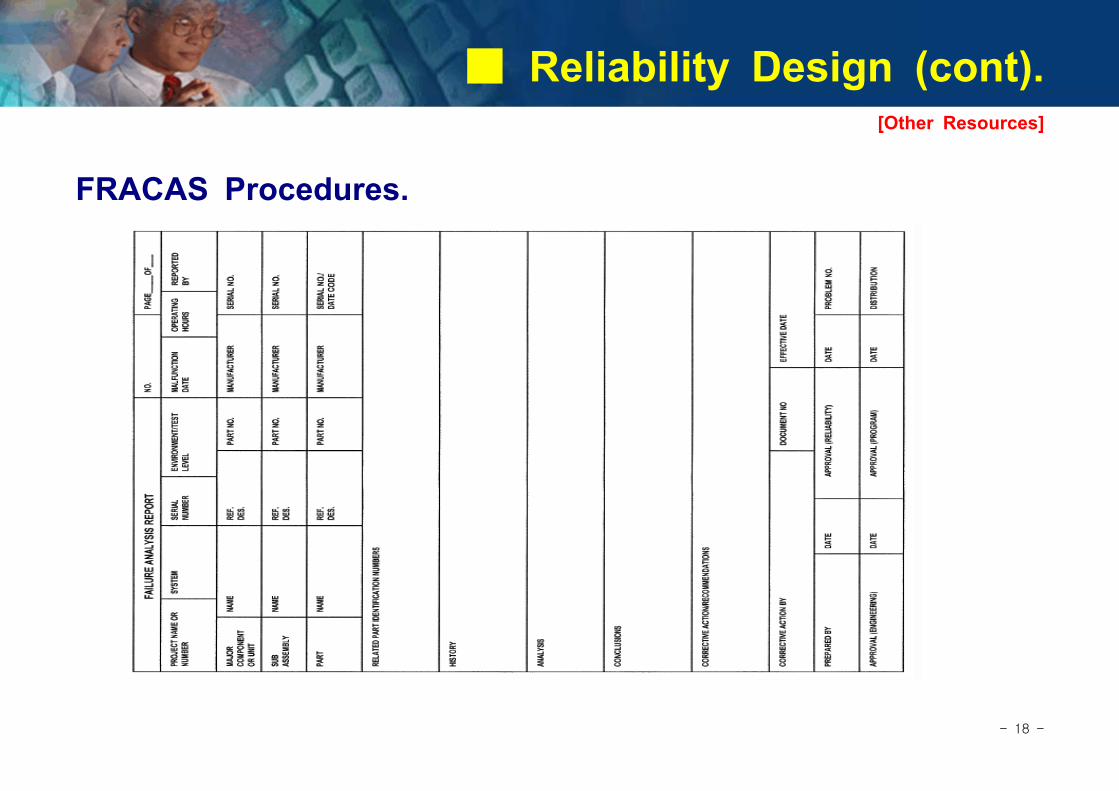
FRACAS Procedures.

- 19 -
■ Reliability Design (cont).[Other Resources]
Closed Loop FRACAS.

- 20 -
■ Reliability Design (cont).[Other Resources]
Failure Mode, Effect and Criticality Analysis (FMECA). ․ A FMECA provides the design engineer, reliability engineer and others a systematic technique to analyze a system, subsystem, or item, for all potential or possible failure modes.
- 21 -
■ Reliability Design (cont).[Other Resources]
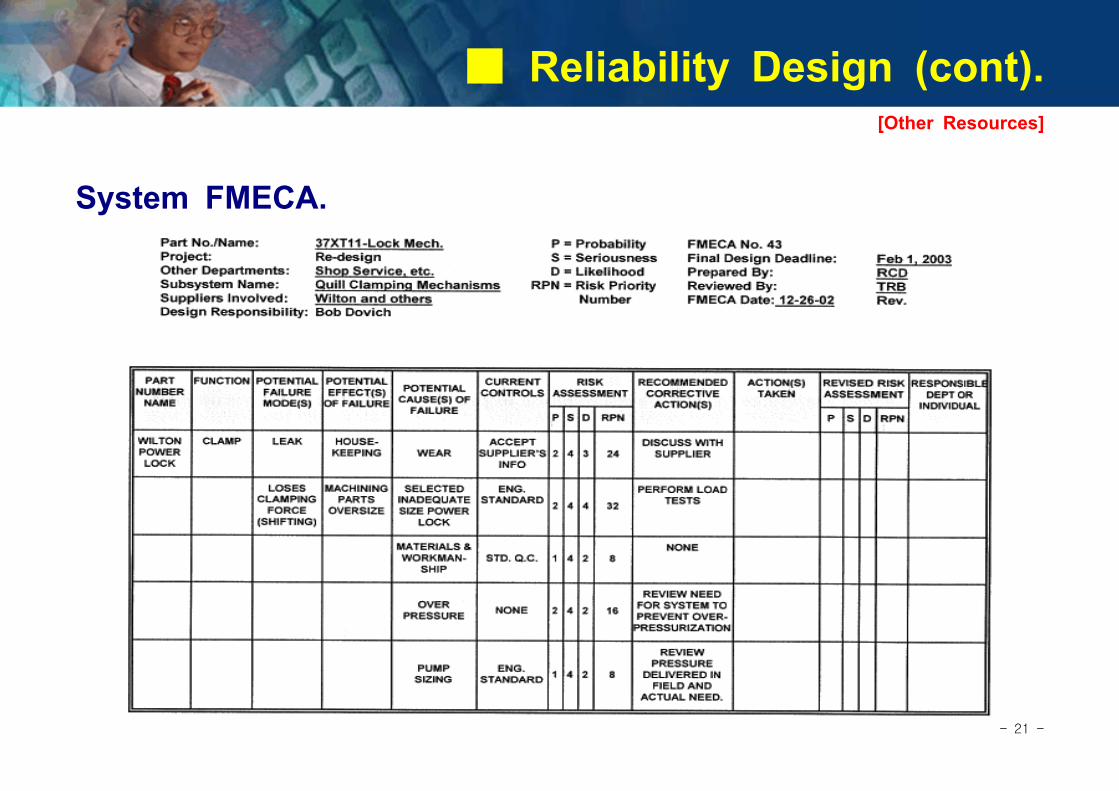
System FMECA.

- 22 -
■ Reliability Design (cont).[Other Resources]
Risk Assessment and RPN. ․ Probability of Failure : P The likelihood of the failure occurring.
․ Severity of Failure : S The effect of the failure on the system, operators, or mission.
․ Detection of Failure : D The effectiveness of the current controls in place to identify the potential weakness or failure prior to release to production.
Risk Priority Number = P × S × D
- 23 -
■ Reliability Design (cont).[Other Resources]
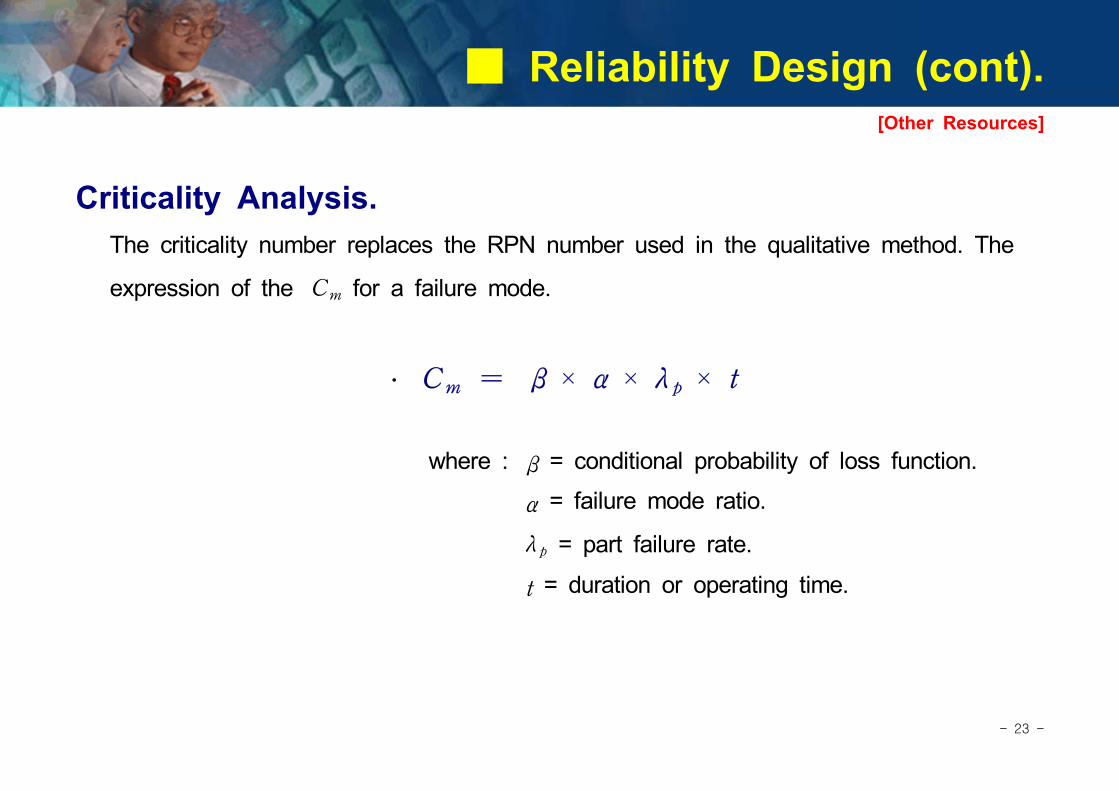
Criticality Analysis. The criticality number replaces the RPN number used in the qualitative method. The
expression of the Cm for a failure mode.
․ Cm = β × α × λ p × t
where : β = conditional probability of loss function.
α = failure mode ratio.
λp = part failure rate.
t = duration or operating time.
- 24 -
■ Reliability Design (cont).[Other Resources]
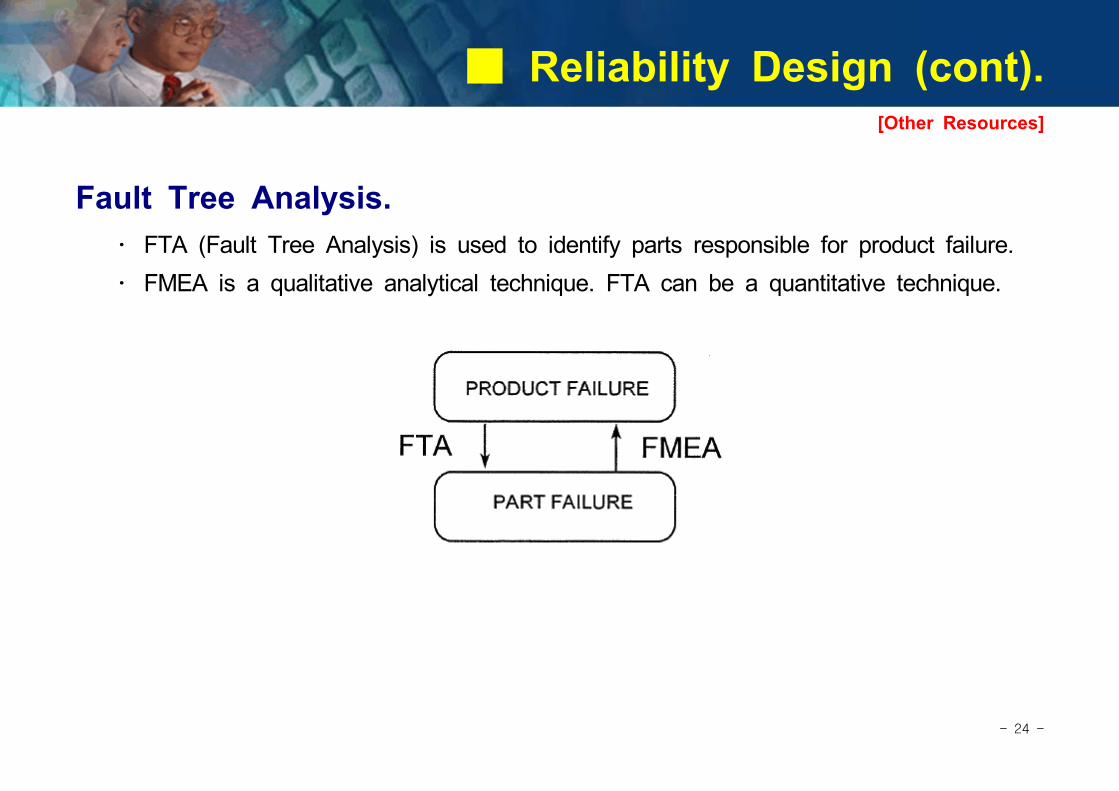
Fault Tree Analysis. ․ FTA (Fault Tree Analysis) is used to identify parts responsible for product failure. ․ FMEA is a qualitative analytical technique. FTA can be a quantitative technique.
- 25 -
■ Reliability Design (cont).[Other Resources]
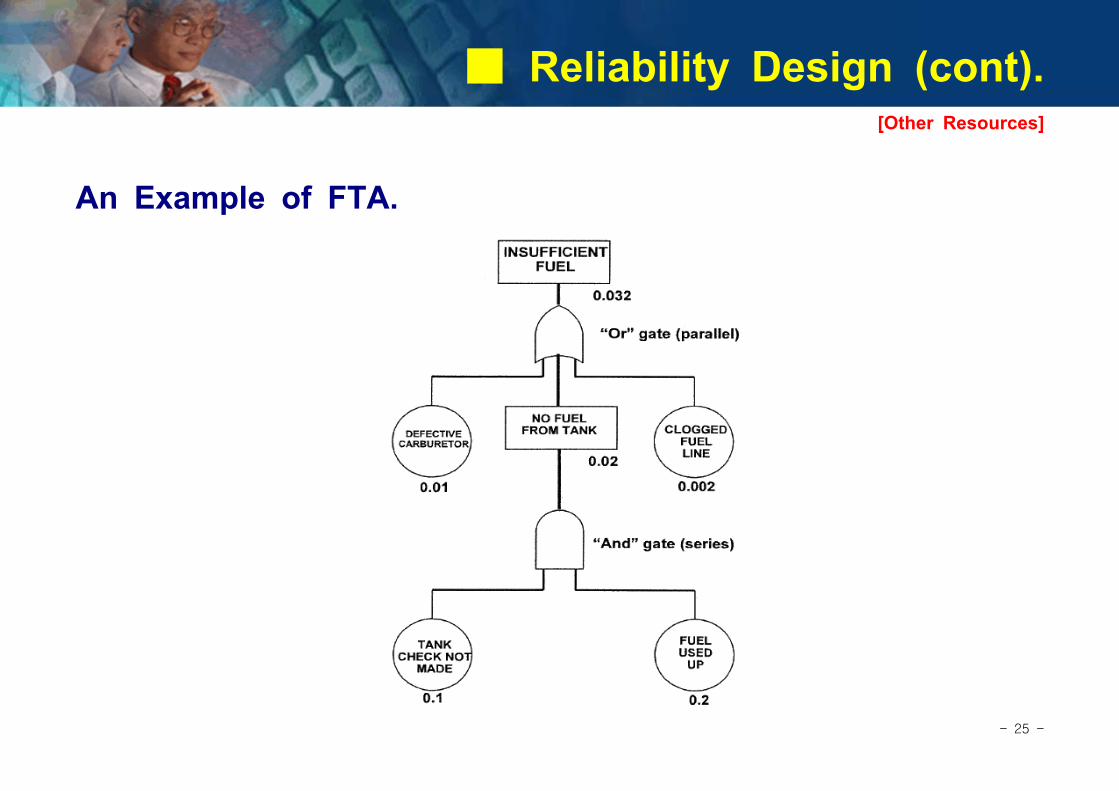
An Example of FTA.

- 26 -
■ Reliability Design (cont).[Other Resources]
Robust Design (Taguchi Method). ․ Robust design concepts. There are a few key variables (signal or noise factors) and their interactions in any process. When these factors are fixed at the right levels, they will make the product characteristics "robust".

- 27 -
■ Reliability Design (cont).[Other Resources]
Other Taguchi Robust Concepts. ․ Concept Design (or System Design) Concept design is the selection of the process or product architecture based on technology, costs, customer requirements, etc..
․ Parameter Design During the parameter design stage the design is established using the lowest cost components and manufacturing techniques. The response is then optimized for control and minimized for noise.
․ Tolerance Design In tolerance design, there is a balance between a given quality level and cost of the design. The measurement criteria is quality losses.

- 28 -
■ Reliability Design (cont).[Other Resources]
Design of Experiment for Parameter Design.

- 29 -
■ Reliability Design (cont).[Other Resources]
Quality Loss Function for Tolerance Design.
TargetTargetLow er
StatisticalLim it
Low erStatistical
Lim it
UpperStatistical
Lim it
UpperStatistical
Lim it
- 30 -
■ Reliability Design (cont).[Other Resources]
Human Factors Consideration. ․ Safety. Safety consideration are obviously of paramount concern in any design. Safety considerations should include not only the expected use of the product, but also the unexpected use.
Safety consideration should ultimately conclude with "fail-safe" features that protect us from ourselves.

- 31 -
■ Reliability Design (cont).[Other Resources]
Human Factors Consideration. ․ Workmanship during manufacturing. Designs which require a high degree of workmanship may be very difficult to produce and thus, the reliability is impacted.
․ Maintainability. Maintainability is another human factor concern in that the device should be maintainability easily by the operators. These considerations should include : 1. Reduction of maintenance. 2. Ease of maintenance.

- 32 -
■ Reliability Design (cont).[Other Resources]
Some human-machine design principles. ․ Standardization. ․ Automation. ․ Simplification. ․ Load Sharing. ․ Sensory Amplification.
- 33 -
■ Reliability Testing.[Other Resources]
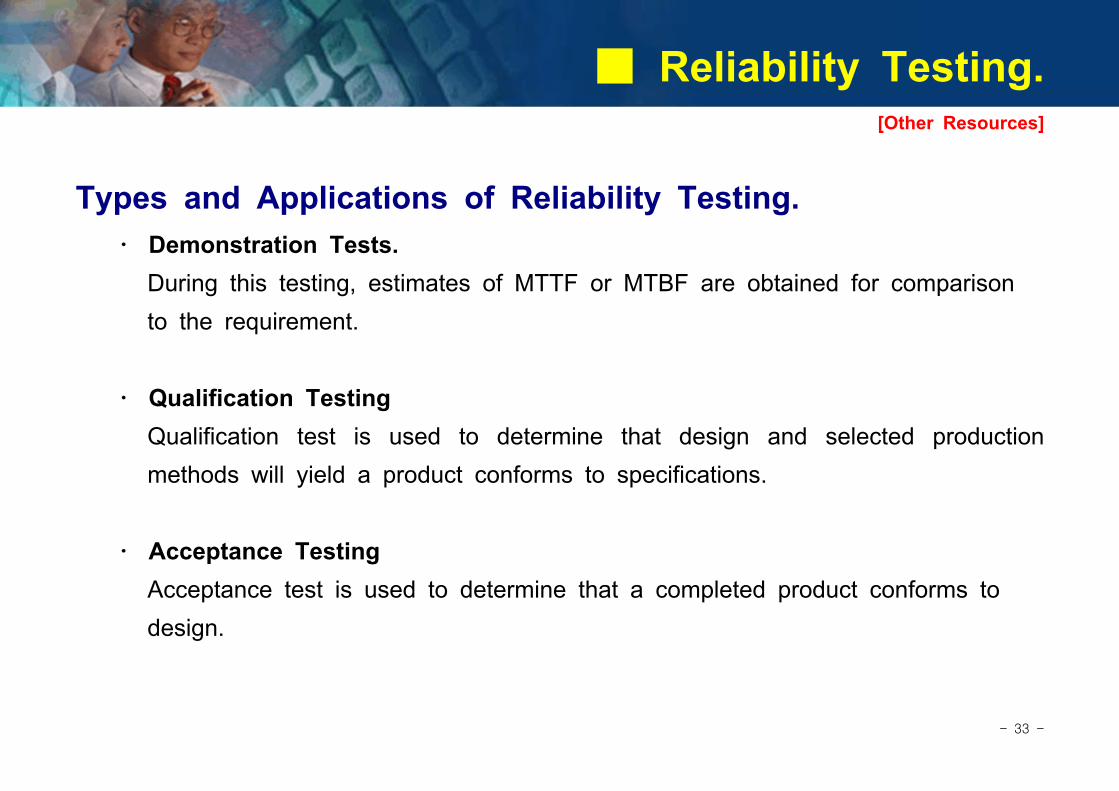
Types and Applications of Reliability Testing. ․ Demonstration Tests. During this testing, estimates of MTTF or MTBF are obtained for comparison to the requirement.
․ Qualification Testing Qualification test is used to determine that design and selected production methods will yield a product conforms to specifications.
․ Acceptance Testing Acceptance test is used to determine that a completed product conforms to design.

- 34 -
■ Reliability Testing.[Other Resources]
Types and Applications of Reliability Testing. ․ Screening. Screening tests are 100% tests performed with the intent of eliminating the infant mortality period.
․ Development Test. The testing is an essential part of the research and design process. 1. Accelerated Life Tests. 2. Step-stress Testing. 3. Reliability Growth Testing.

- 35 -
■ System Reliability.[Other Resources]
Series Models.
․ For a series system to operate successfully, all components must operate successfully.
․ The reliability of a series : Rs = Ri
․ The hazard function : λ s= ∑n
i=1λ i
․ The system mean time to failure : MTTFs=1
∑n
i=1λ i
- 36 -
■ System Reliability.[Other Resources]
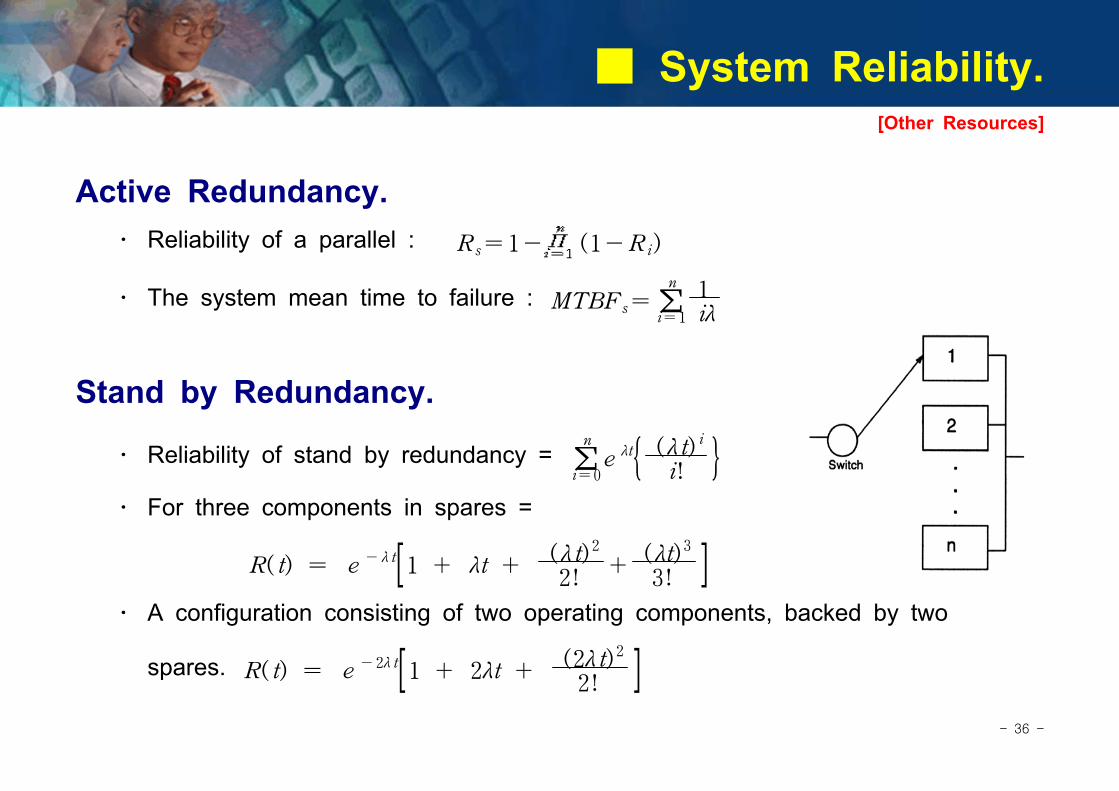
Active Redundancy. ․ Reliability of a parallel : Rs=1- (1-Ri)
․ The system mean time to failure : MTBFs= ∑n
i=1
1iλ
Stand by Redundancy.
․ Reliability of stand by redundancy = ∑n
i=0e λt{ (λt) i
i! } ․ For three components in spares =
R(t) = e-λ t[1 + λt +
(λt)2
2!+
(λt)3
3! ] ․ A configuration consisting of two operating components, backed by two
spares. R(t) = e -2λ t[1 + 2λt + (2λt)2
2! ]

- 37 -
■ Performance Check.
1. The ____________________distribution is continuous and can be used for increasing or decreasing failure rates. A. Exponential B. Poisson. C. Weibull. D. Hypergeometric.
2. Given the following Reliability Block Diagram (RBD) :
R1 = 0.9
R2 = 0.9
The system reliability is : A. 0.96 B. 0.81 C. 0.9 D. 0.99

- 38 -
■ Performance Check.
3. Given the following Reliability Block Diagram (RBD) :
R1 = 0.95 R2 = 0.90 R3 = 0.85 R4 = 0.80
The system reliability is :
A. 0.5814 B. 0.8514 C. 0.3581 D. 0.8752
4. Based on the following subsystem data : Subsystem 1 : 1500 Subsystem 2 : 1200 Subsystem 3 : 1000 Subsystem 4 : 800The system MTBF is :
A. 250 B. 255 C. 1125 D. 267

- 39 -
■ Performance Check.
5. A subsystem is described by the following Reliability Block Diagram (RBD) :
R=0.8 R=0.8
R=0.85 R=0.85 R=0.95
R=0.9 R=0.8 R=0.85
The reliability of the subsystem is :
A. 0.95 B. 0.612 C. 0.913 D. 0.961
- 40 -
■ Performance Check.
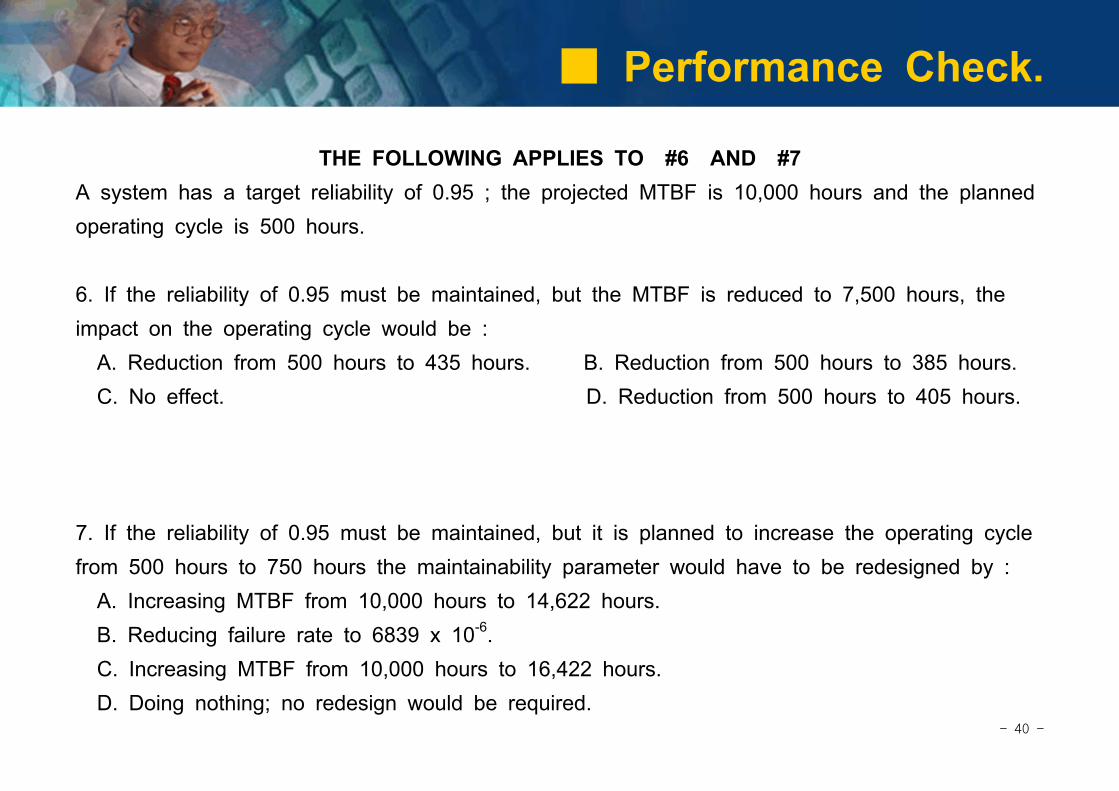
THE FOLLOWING APPLIES TO #6 AND #7A system has a target reliability of 0.95 ; the projected MTBF is 10,000 hours and the planned operating cycle is 500 hours.
6. If the reliability of 0.95 must be maintained, but the MTBF is reduced to 7,500 hours, the impact on the operating cycle would be : A. Reduction from 500 hours to 435 hours. B. Reduction from 500 hours to 385 hours. C. No effect. D. Reduction from 500 hours to 405 hours.
7. If the reliability of 0.95 must be maintained, but it is planned to increase the operating cycle from 500 hours to 750 hours the maintainability parameter would have to be redesigned by : A. Increasing MTBF from 10,000 hours to 14,622 hours. B. Reducing failure rate to 6839 x 10-6. C. Increasing MTBF from 10,000 hours to 16,422 hours. D. Doing nothing; no redesign would be required.
- 41 -
■ Performance Check.
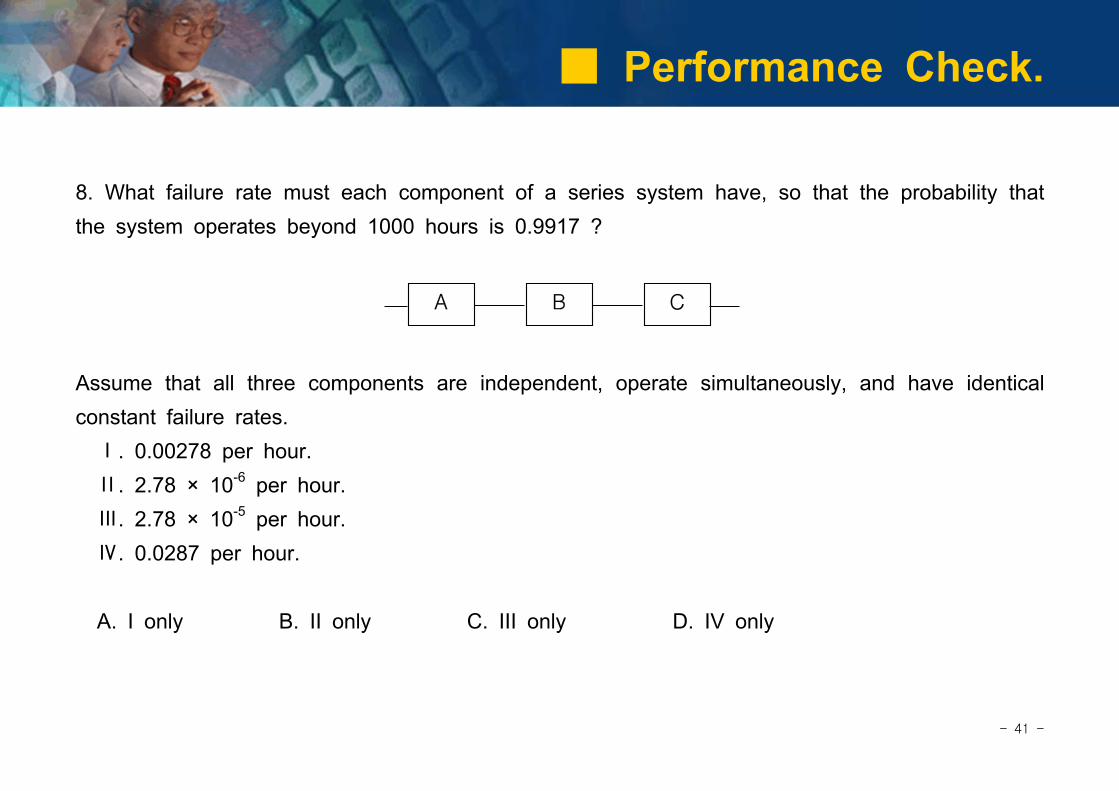
8. What failure rate must each component of a series system have, so that the probability that the system operates beyond 1000 hours is 0.9917 ?
A B C
Assume that all three components are independent, operate simultaneously, and have identical constant failure rates. Ⅰ. 0.00278 per hour. Ⅱ. 2.78 × 10⁻⁶ per hour. Ⅲ. 2.78 × 10⁻⁵ per hour. Ⅳ. 0.0287 per hour.
A. I only B. II only C. III only D. IV only
- 42 -
■ Performance Check.
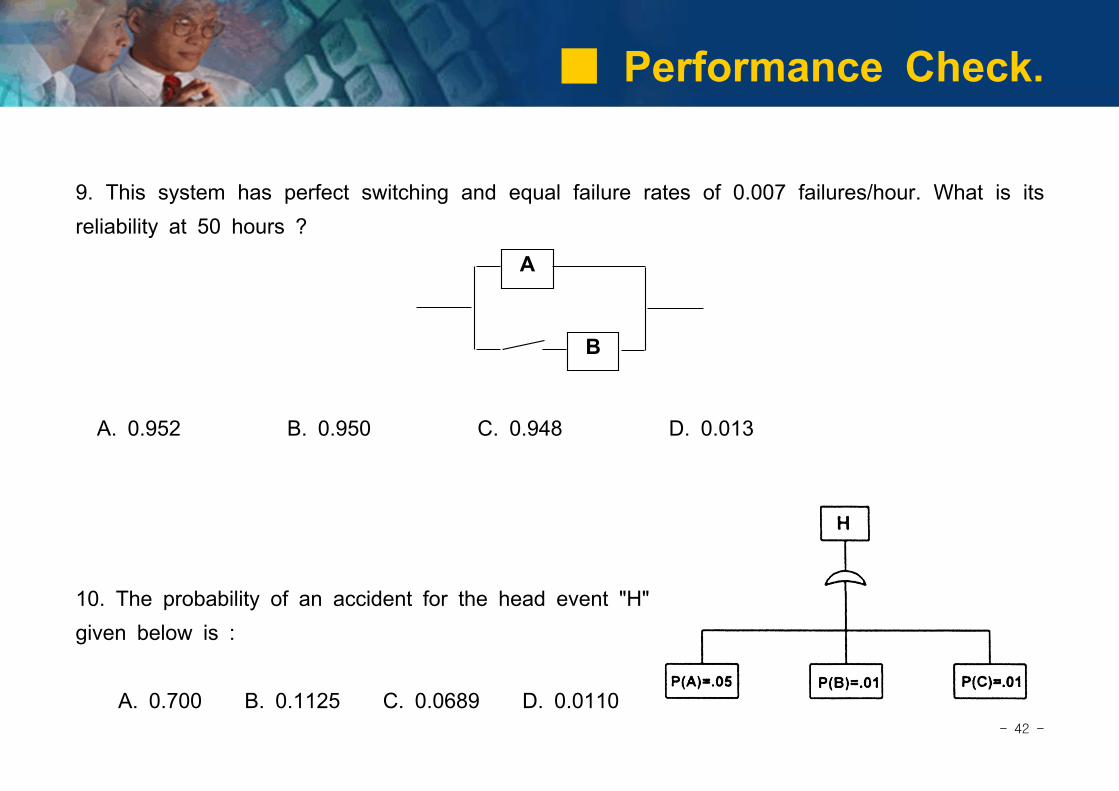
9. This system has perfect switching and equal failure rates of 0.007 failures/hour. What is its reliability at 50 hours ?
A
B
A. 0.952 B. 0.950 C. 0.948 D. 0.013
10. The probability of an accident for the head event "H" given below is :
A. 0.700 B. 0.1125 C. 0.0689 D. 0.0110
- 43 -
■ Performance Check.
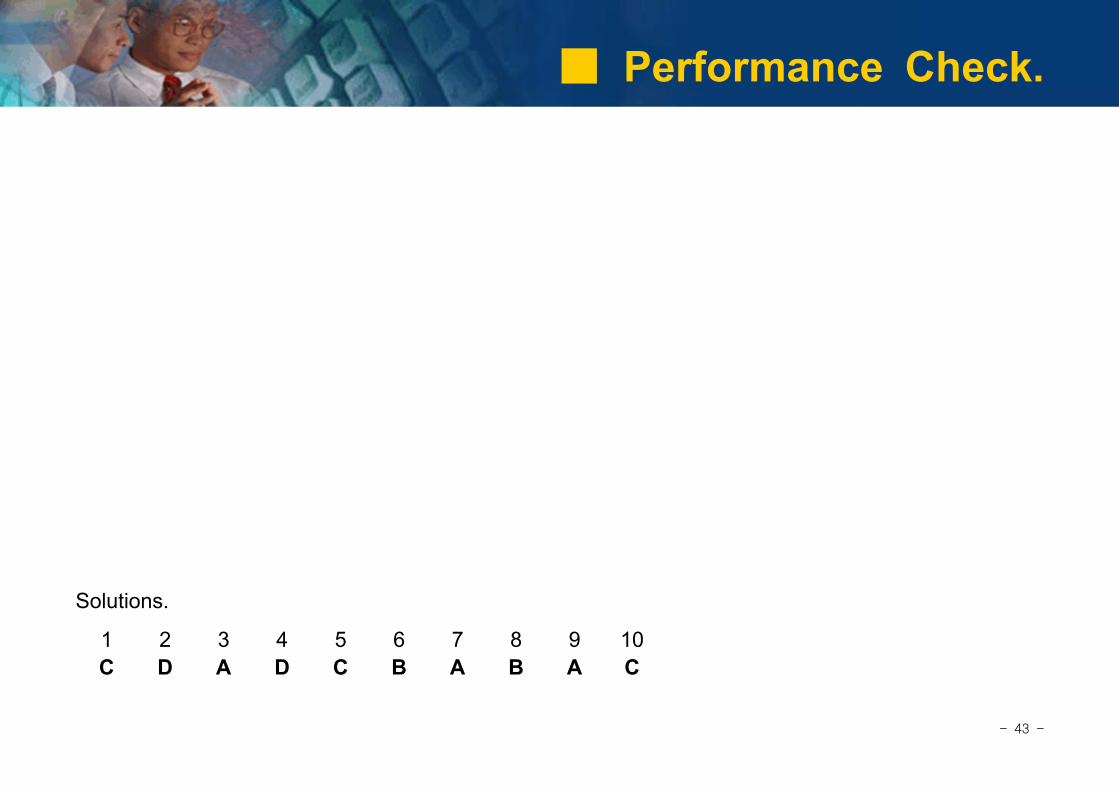
Solutions.
1 2 3 4 5 6 7 8 9 10C D A D C B A B A C