CG86 Coeliac disease: full guideline - appendix 6.6
153
Coeliac disease appendix 6.6 Evidence tables Reference Study type/ Evidenc e level Number of patient s Patient characteristics Interventio n Comparison Length of follow- up Outcome measures Source of funding Abrams JA, Brar P, Diamond B, Rotterdam H, Green PH. Utility in clinical practice of immunoglo bulin a anti- tissue transglut aminase antibody for the diagnosis of celiac disease. Clinical Cohort N=122 Adults USA Inclusion: consecutive suspected celiac disease, Jan 2000 to December 2003, 32.4% male, 67.6% female, 100% white, 44.5yrs (SD 15.4) Exclusion: <16years, selective IgA deficiency (total serum IgA level <0.05g/L), on a GFD, taking immunosuppressants, initial serological testing at >1 lab IgA anti-t TG (human) antibody determinati on before upper endoscopy for duodenal biopsies 1 Serological testing was performed at various commercial labs Control group, those with a normal biopsy Duodenal biopsy (further details not given) Serological testing at commercial labs around the country Pathologic diagnosis of CD required intrathelial lymphocytosis and either partial villous atrophy (Marsh IIIA) or total villous atrophy (Marsh IIIB and IIIC) Diagnosis of CD, had to exhibit Not stated 1 All duodenal biopsies reviewed blinded by a single pathologist who did not know the antibody status NICE clinical guideline 86 Coeliac disease: appendix 6.6 Page 1 of 153
description
Transcript of CG86 Coeliac disease: full guideline - appendix 6.6

Coeliac disease appendix 6.6 Evidence tables
Reference Study type/Evidence level
Number of patients
Patient characteristics Intervention Comparison Length of follow-up
Outcome measures
Source of funding
Abrams JA, Brar P, Diamond B, Rotterdam H, Green PH. Utility in clinical practice of immunoglobulin a anti-tissue transglutaminase antibody for the diagnosis of celiac disease. Clinical Gastroenterology & Hepatology 2006;4:726-30
Cohort N=122
Adults
USA
Inclusion: consecutive suspected celiac disease, Jan 2000 to December 2003, 32.4% male, 67.6% female, 100% white, 44.5yrs (SD 15.4)
Exclusion: <16years, selective IgA deficiency (total serum IgA level <0.05g/L), on a GFD, taking immunosuppressants, initial serological testing at >1 lab
IgA anti-t TG (human) antibody determination before upper endoscopy for duodenal biopsies1
Serological testing was performed at various commercial labs
Control group, those with a normal biopsy
Duodenal biopsy (further details not given)
Serological testing at commercial labs around the country
Pathologic diagnosis of CD required intrathelial lymphocytosis and either partial villous atrophy (Marsh IIIA) or total villous atrophy (Marsh IIIB and IIIC)
Diagnosis of CD, had to exhibit histologic or serologic improvements after 6mths on GFD
Not stated
1 All duodenal biopsies reviewed blinded by a single pathologist who did not know the antibody status
NICE clinical guideline 86 Coeliac disease: appendix 6.6 Page 1 of 111
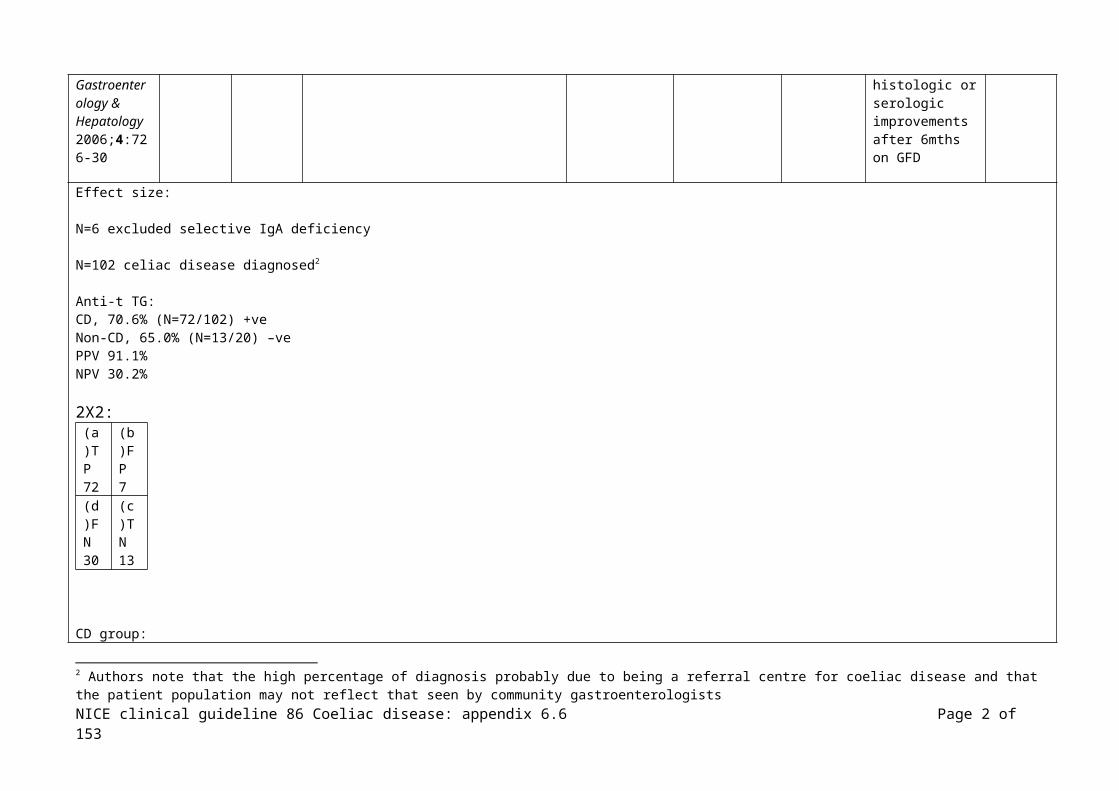
Effect size:
N=6 excluded selective IgA deficiency
N=102 celiac disease diagnosed2
Anti-t TG:CD, 70.6% (N=72/102) +veNon-CD, 65.0% (N=13/20) –ve PPV 91.1%NPV 30.2%
2X2: (a)TP 72
(b)FP 7
(d)FN30
(c)TN13
CD group:Total villous atrophy 90.0% (N=54/60) +ve anti-tTG, sensitivity 90.0 (79.5 to 96.2, 95% CI)Partial villous atrophy 42.3 (N=18/42) +ve anti-t TG, sensitivity 42.9 (27.7 to 59.0, 95% CI)
(p< 0.0001 difference in sensitivity for total and partial villous atrophy)
NS differences in sensitivity when comparing various modes of presentation
(this study considered 2 commercial labs, there were significant differences in sensitivity and specificity values, the labs used different kits and the authors note that they were not aware of how the labs determined their cut-off rates or whether they used the manufacturer’s recommended values) Reference Study
type/Evidence level
Number of patients
Patient characteristics Intervention Comparison Length of follow-up
Outcome measures
Source of funding
2 Authors note that the high percentage of diagnosis probably due to being a referral centre for coeliac disease and that the patient population may not reflect that seen by community gastroenterologists
NICE clinical guideline 86 Coeliac disease: appendix 6.6 Page 2 of 111

Agardh D. Antibodies against synthetic deamidated gliadin peptides and tissue transglutaminase for the identification of childhood celiac disease. Clinical Gastroenterology & Hepatology 2007;5:1276-81
Cohort N=176
Children – age range 0.7 to 19.0 years, median 5.7 in the biopsy abnormal group (75F, 44M), age range 0.9 to 14.6 years, median 3.5 in the biopsy normal group (26F, 31M)
Sweden
Inclusion: children with suspected CD admitted for an intestinal biopsy at a Department of Paediatrics (no further details reported)
Exclusion: none reported
(Other groups included patients with a known diagnosis of celiac disease on a GFD for a median of 4.5 years with serologic analysis and healthy adult blood donors – results not included in this table)
IgAG-DGP/tTG
IgAG-DGP
IgA-DGP
IgG-DGP
IgA-tTG
IgG-tTG
All QUANTA lite tests, used according to manufacturer’s instructions.
Cut-offs defined as –ve if <20AU, weakly +ve if 20-30AU, and +ve if >30
No details of blinding reported.
‘Intestinal biopsy’ – no further details
Diagnostic accuracy of the tests
CD diagnosed with ESPGAN
Faculty of Medicine, Lund University
Skane Council Foundation for Research Development, Malmo University
Kits provided free of charge by manufacturer
Effect size: (CI 95%)
N=119/176 (68%) diagnosed with coeliac disease, using ESPGAN criteria
IgA deficiency 0.04% (N=7/176)
Of the 121 children with a diagnosis other than coeliac disease (ie biopsy results were normal), most frequent diagnoses were cow’s milk protein intolerance, food
allergy, IgA deficiency (5/7 above), lipase deficiency, Helicobacter pylori gastritis, transient EMA (1 with IDDM). Other reasons for investigation were failure to thrive
or short stature, with remaining children having transient GI symptoms.
PPV, NPV and all confidence intervals calculated from the 2x2 data presented in the paper.
NICE clinical guideline 86 Coeliac disease: appendix 6.6 Page 3 of 111
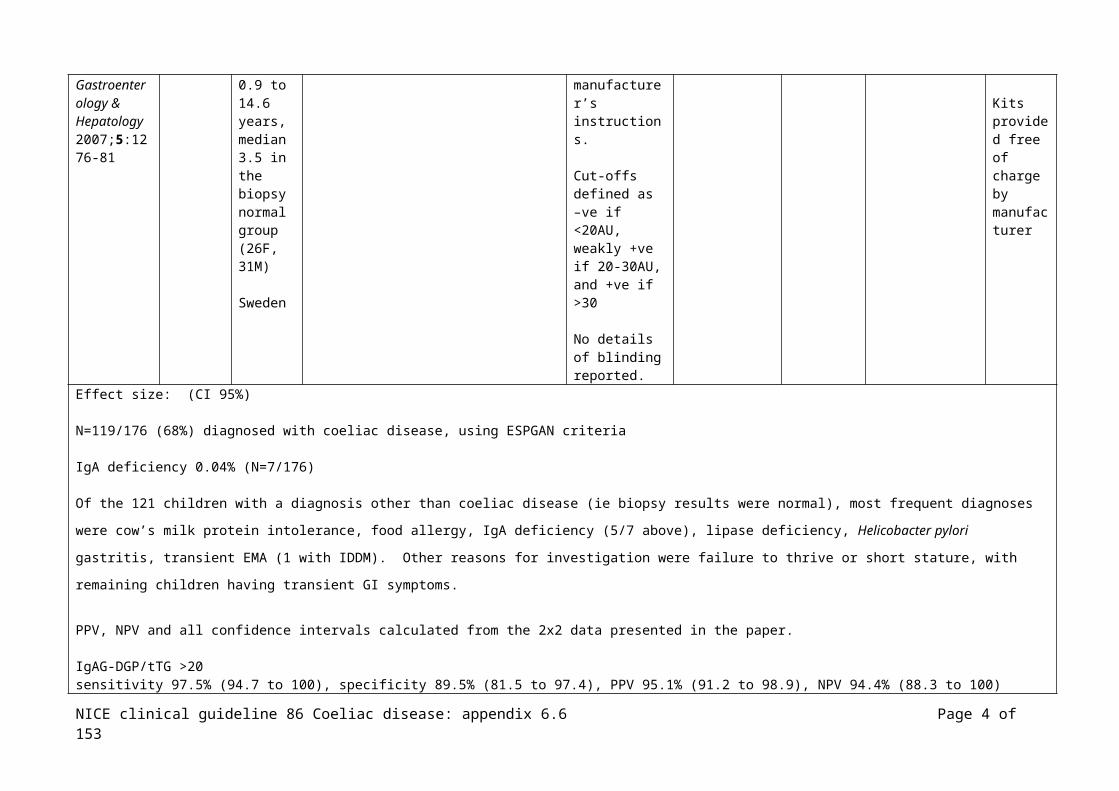
IgAG-DGP/tTG >20sensitivity 97.5% (94.7 to 100), specificity 89.5% (81.5 to 97.4), PPV 95.1% (91.2 to 98.9), NPV 94.4% (88.3 to 100)2X2:
(a)TP 116
(b)FP 6
(c)FN3
(d)TN51
IgAG-DGP/tTG >30sensitivity 100% (n/a), specificity 94.7% (88.9 to 100), PPV 97.5% (94.8 to 100), NPV 100% (n/a)2X2:
(a)TP 119
(b)FP 3
(c)FN0
(d)TN54
IgAG-DGP >20sensitivity 92.4% (87.7 to 97.2), specificity 89.5% (81.5 to 97.4), PPV 94.8% (90.8 to 98.9), NPV 85.0% (76.0 to 94.0)2X2:
(a)TP 110
(b)FP 6
(c)FN9
(d)TN51
IgAG-DGP >30sensitivity 97.5% (94.7 to 100), specificity 98.2% (94.8 to 100), PPV 99.1% (97.5 to 100), NPV 94.9% (89.3 to 100)2X2:
(a)TP116
(b)FP 1
(c)FN3
(d)TN56
NICE clinical guideline 86 Coeliac disease: appendix 6.6 Page 4 of 111

IgA-DGP >20sensitivity 79.8% (72.6 to 87.0), specificity 91.2% (83.9 to 98.6), PPV 95.0% (90.7 to 99.3), NPV 68.4% (58.0 to 78.9)2X2:
(a)TP95
(b)FP 5
(c)FN24
(d)TN52
IgA-DGP >30sensitivity 90.8% (85.6 to 96.0), specificity 94.7% (88.9 to 100), PPV 97.3% (94.3 to 100), NPV 83.1% (74.0 to 92.2)2X2:
(a)TP 108
(b)FP 3
(c)FN11
(d)TN54
IgG-DGP >20sensitivity 88.2% (82.4 to 94.0), specificity 86.0% (76.9 to 95.0), PPV 92.9% (88.2 to 97.6), NPV 77.8% (67.5 to 88.0)2X2:
(a)TP 105
(b)FP 8
(c)FN14
(d)TN49
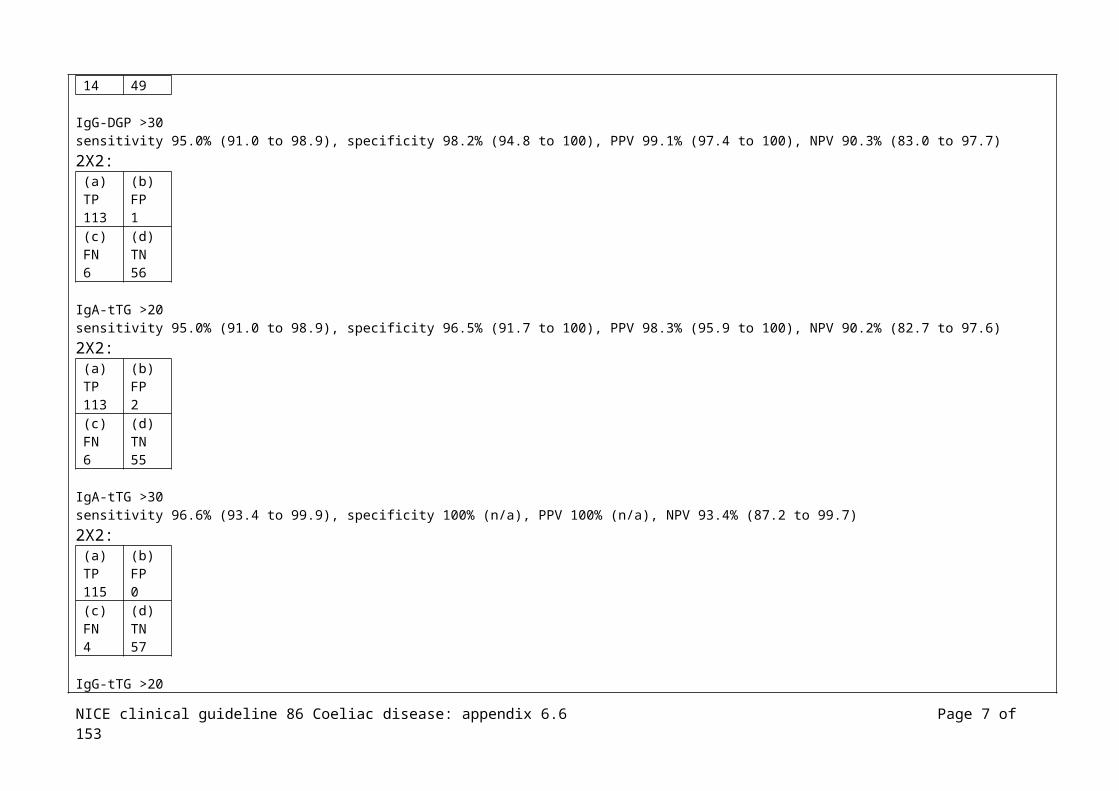
IgG-DGP >30sensitivity 95.0% (91.0 to 98.9), specificity 98.2% (94.8 to 100), PPV 99.1% (97.4 to 100), NPV 90.3% (83.0 to 97.7)2X2:
(a)TP 113
(b)FP 1
(c)FN6
(d)TN56
NICE clinical guideline 86 Coeliac disease: appendix 6.6 Page 5 of 111

IgA-tTG >20sensitivity 95.0% (91.0 to 98.9), specificity 96.5% (91.7 to 100), PPV 98.3% (95.9 to 100), NPV 90.2% (82.7 to 97.6)2X2:
(a)TP 113
(b)FP 2
(c)FN6
(d)TN55
IgA-tTG >30sensitivity 96.6% (93.4 to 99.9), specificity 100% (n/a), PPV 100% (n/a), NPV 93.4% (87.2 to 99.7)2X2:
(a)TP 115
(b)FP 0
(c)FN4
(d)TN57
IgG-tTG >20sensitivity 4.2% (0.6 to 7.8), specificity 100% (n/a), PPV 100% (n/a), NPV 33.3% (26.3 to 40.4)2X2:
(a)TP 5
(b)FP 0
(c)FN114
(d)TN57
IgG-tTG >30sensitivity 12.6% (6.6 to 18.6), specificity 100% (n/a), PPV 100% (n/a), NPV 35.4% (28.0 to 42.8)2X2:
(a)TP 15
(b)FP 0
(c)FN104
(d)TN57
NICE clinical guideline 86 Coeliac disease: appendix 6.6 Page 6 of 111
Reference Study type/Evidence level
Number of patients
Patient characteristics Intervention Comparison Length of follow-up
Outcome measures
Source of funding
Agency for Healthcare Research and Quality (2004) Celiac Disease, Evidence Report/Technology Assessment Number 104
Systematic review
Chapter 2: celiac 2: incidence and prevalence of CD
Included: general populations from North America or Western Europe, first-degree relatives of patients with CD
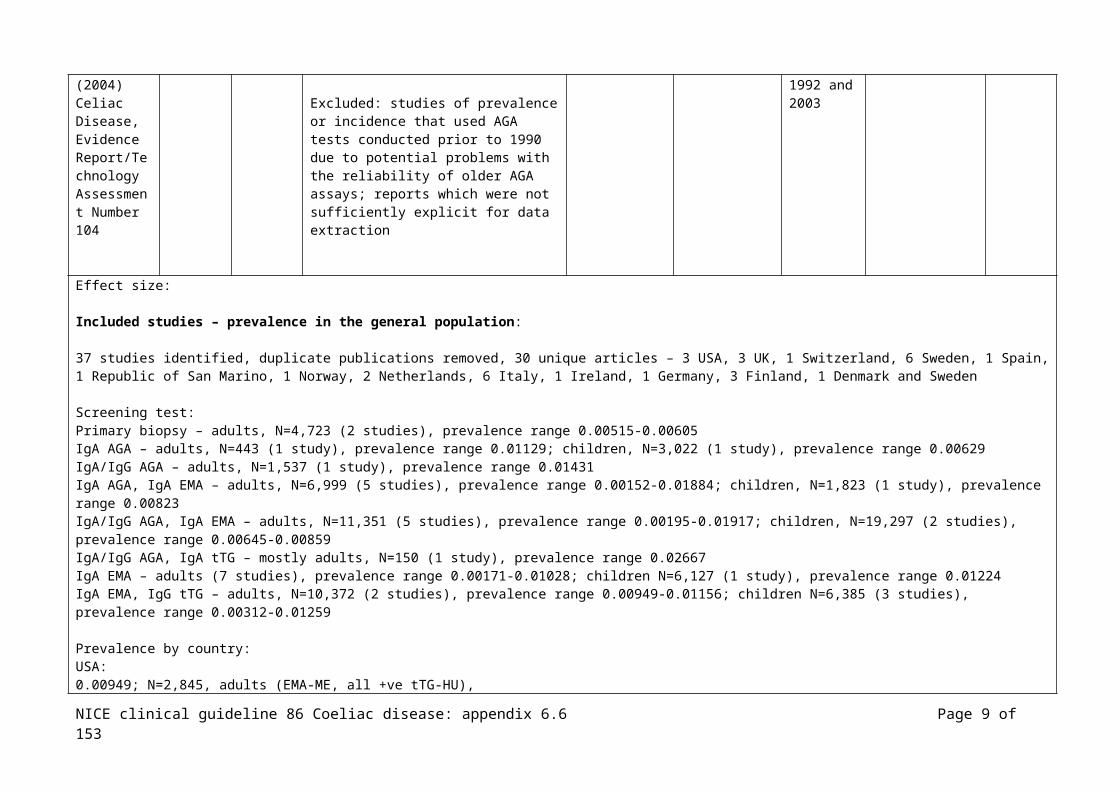
Excluded: studies of prevalence or incidence that used AGA tests conducted prior to 1990 due to potential problems with the reliability of older AGA assays; reports which were not sufficiently explicit for data extraction
All included studies were conducted between 1992 and 2003
AHRQ
Effect size:
Included studies – prevalence in the general population:
37 studies identified, duplicate publications removed, 30 unique articles – 3 USA, 3 UK, 1 Switzerland, 6 Sweden, 1 Spain, 1 Republic of San Marino, 1 Norway, 2 Netherlands, 6 Italy, 1 Ireland, 1 Germany, 3 Finland, 1 Denmark and Sweden
Screening test: Primary biopsy – adults, N=4,723 (2 studies), prevalence range 0.00515-0.00605 IgA AGA – adults, N=443 (1 study), prevalence range 0.01129; children, N=3,022 (1 study), prevalence range 0.00629IgA/IgG AGA – adults, N=1,537 (1 study), prevalence range 0.01431IgA AGA, IgA EMA – adults, N=6,999 (5 studies), prevalence range 0.00152-0.01884; children, N=1,823 (1 study), prevalence range 0.00823IgA/IgG AGA, IgA EMA – adults, N=11,351 (5 studies), prevalence range 0.00195-0.01917; children, N=19,297 (2 studies), prevalence range 0.00645-0.00859IgA/IgG AGA, IgA tTG – mostly adults, N=150 (1 study), prevalence range 0.02667IgA EMA – adults (7 studies), prevalence range 0.00171-0.01028; children N=6,127 (1 study), prevalence range 0.01224IgA EMA, IgG tTG – adults, N=10,372 (2 studies), prevalence range 0.00949-0.01156; children N=6,385 (3 studies), prevalence range 0.00312-0.01259
Prevalence by country:USA:
NICE clinical guideline 86 Coeliac disease: appendix 6.6 Page 7 of 111

0.00949; N=2,845, adults (EMA-ME, all +ve tTG-HU), 0.00312; N=1,281, children (Fasano 2003)0.00515; N=1,749, adults (biopsy)(Green 2000)0.00400; N=2,000, adults (IgG/IgA-AGA, followed by IgA-EMA ME or HU)(Not 1998)
UK: 0.00823; N=1,823, adults (IgA-AGA, IgA-EMA)(Johnston 1998)0.01917 (serology), 0.01000 (biopsy N=22/23); N=1,200, adults (IgG/IgA-EMA ME)(Sanders 2003)0.01156; N=7,527, adults (IgA-EMA ME, IgA tTGA)(West 2003)
Switzerland:0.00759 (serology), 0.00690 (biopsy N=10/11); N=1,450, children (IgA-EMA ME, IgA tTG, IgG/IgA-AGA)(Rutz 2002)
Sweden:0.01452 (serology), 0.01867 (biopsy); N=482, adults, (biopsy, IgA/IgG-AGA, IgA-EMA ME)(Borch 2001)0.00589 (serology), 0.00375 (biopsy); N=1,866, adults (IgA-AGA, (IgA-EMA, prevalence not reported))(Grodzinsky 1996)0.00475 (serology), 0.00475 (biopsy); N=1,894, adults (IgA/IgG-AGA, IgA-EMA ME, serum IgA level)(Ivarsson 1999)0.01431 (serology), 0.00065 (biopsy, N=13/22), N=1,537, adults (IgG/IgA-AGA)(Sjoberg 1994)0.00152 (serology), 0.00152 (biopsy), N=1,970, adults (IgA-AGAIgA confirmed with EMA ME)(Sjoberg 1999)0.01884 (serology), 0.01594 (biopsy), N=690, children (AGA, EMA, biopsy)(Carlsson 2001)
Spain:0.00171 (serology), 0.00256 (biopsy), N=1,170, adults (IgG/IgA-AGA, IgA-EMA)(Riestra 2000)
Republic of San Marino:0.00179 (serology), 0.00179 (biopsy), N=559, adults (IgA-EMA, biopsy)(Corazzo 1997)
Norway: 0.00387 (serology), 0.00388 (biopsy), N=2,069, adults (IgA/IgG-AGA, IgA-EMA)(Hovdenak 1999)
Netherlands:0.00300 (serology), 0.00300 (biopsy), N=1,000, adults (IgA-EMA)(Rostami 1999)0.01224 (serology), 0.00506 (biopsy N=57/75), N=6,127, children (IgA-EMA)(Csizmadia 1999)
Italy:0.00195 (serology), 0.00195 (biopsy N=38/140), N=4,615, adults (IgA/IgG-AGA, IgA-EMA, biopsy)(Pittscieler 1996)0.00250 (serology), 0.00250 (biopsy), N=4,000, adults (IgA-EMA, biopsy)(Trevisiol 1999)0.00574 (serology), 0.00488 (biopsy), N=3,483, adults (mostly)(IgA-EMA HU, biopsy)(Volta 2001)0.00859 (serology), N=2,096, children (IgG/IgA-AGA, IgA-EMA)(Catassi 2000)0.00645 (serology), 0.00477 (biopsy), N=17,201, children (IgA/IgG-AGA, confirmed with EMA and biopsy)(Catassi 1996)0.00629 (serology), 0.00596 (biopsy), N=3,022, children (IgA-AGA, biopsy)(Di Pietralata 1992)
NICE clinical guideline 86 Coeliac disease: appendix 6.6 Page 8 of 111
Ireland: 0.01129 (serology), N=443, adults (IgA-AGA)(Dickey 1992)
Germany:0.02667 (serology), N=150, mostly adults (IgA/IgG-AGA, IgA-tTG)(Jager 2001)
Finland:0.01028 (serology), 0.00748 (biopsy), N=1,070 adults (EMA HU)(Kolho 1998)0.01259 (serology), 0.00739 (biopsy), N=3,654 children (IgA/IgG-tTG, IgA/IgG-EMA, if total serum IgA, HLA DR, DQ2, DQ8)(Maki 2004)0.00605 (serology), N=2,974, mostly adults (biopsy)(Collin 2002)
Denmark & Sweden:0.00254 (serology), N=1,573 adults (serum IgA, IgG-AGA, EMA)(Weile 2001)
Prevalence in patients with suspected coeliac disease:
Adults:N=4 studies, N=3 Italy all from referral centres, N=1 USA at-risk and not-at-risk individuals clinical centre not reported(reasons for suspecting coeliac disease; anaemia, persistent iron deficiency, bowel disturbances, chronic intermittent diarrhoea, abdominal pain, constipation, dyspepsia, severe malabsorption, tiredness and weight loss, mineral metabolism deficienceies, osteoporosis, arthralgias, arthritis, dermatitis, hypertransaminasemia, type 1 diabetes mellitus, infertility, and gluten intolerance in childhood not further investigated)Prevalence:43.3%, N=60 (biopsy)(Bardella 1991), Italy50.0%, N=80 (biopsy)(Bardella 2001), Italy11.6%, N=207 (biopsy)(Carrocio 2002), Italy1.5%, N=1,910 (EMA)(Fasano 2003), USA
Children: N=9 studies, N=3 Canada, N=2 USA, N=1 Denmark, England, Italy, New Zealand(reasons for suspecting coeliac disease; abdominal pain, diarrhoea, failure to thrive/short stature, weight loss, vomiting, abdominal distension, chronic GI symptoms, inflammatory bowel disease, family history of coeliac disease, type 1 diabetes, iron deficiency anaemia, thyroid disease, trisomy 21, enamel hypoplasia, recurrent aphtous stomatitis, autoimmune diseases, IgA deficiency, occult hypertransaminasemia)Prevalence: 13.0%, N=77 (biopsy), referral centre (Chan 2001), Canada17.0%, N=176 (biopsy), referral centre (Chartrand 1997), Canada1.1%, N=92 (EMA), community paediatricians (Fitzpatrick 2001), Canada4.0%, N=1,326 (EMA), clinical setting not reported (Fasano 2003), USA2.5%, N=1,008 (EMA), referral centre (Hill 2000), USA
NICE clinical guideline 86 Coeliac disease: appendix 6.6 Page 9 of 111

7.3%, N=191 (biopsy), referral centre (Bode 1993), Denmark4.6%, N=153 (biopsy), referral centre (Day 2000), New Zealand7.9%, N=381 (biopsy), referral centre (Thomas 1992), England 7.5%, N=240 (biopsy), case-finding community paediatricians (Ventura 2001), Italy
All ages:N=1 study case-finding primary care clinics(entry criteria; irritable bowel syndrome, anaemia, family history of coeliac disease, malaabsorption syndrome, diarrhoea, fatigue, thyroid disease, diabetes mellitus, weight loss, short stature, failure to thrive, epilepsy, infertility, arthralgia, eczema)N=1,000, mean age 42.8yrs, 5.3% <10yrs, 3.1% 80-90yrsN=30 EMA +ve, all confirmed by biopsy (N=1 child)
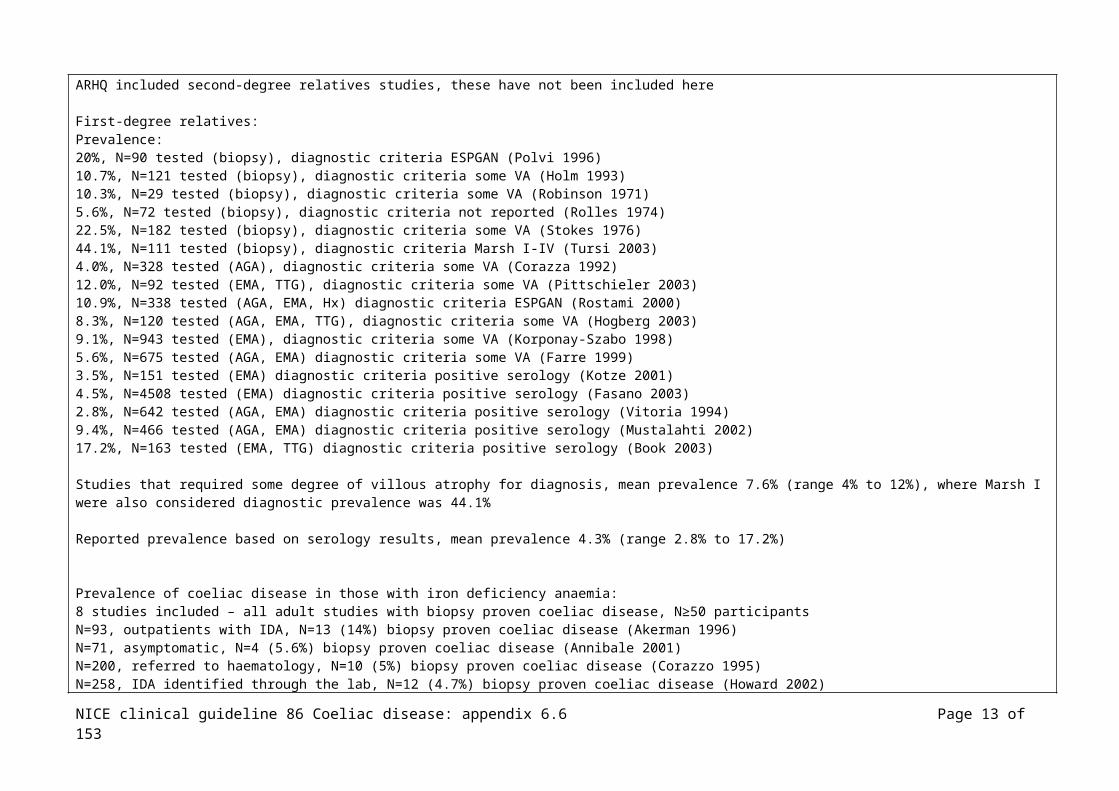
Prevalence in first-degree relatives of those with coeliac disease N=17 studies, N=5 directly evaluated with small bowel biopsy, N=12 serological screening of these N=7 had biopsies in >80% of those positive ARHQ included second-degree relatives studies, these have not been included here
First-degree relatives:Prevalence:20%, N=90 tested (biopsy), diagnostic criteria ESPGAN (Polvi 1996)10.7%, N=121 tested (biopsy), diagnostic criteria some VA (Holm 1993) 10.3%, N=29 tested (biopsy), diagnostic criteria some VA (Robinson 1971)5.6%, N=72 tested (biopsy), diagnostic criteria not reported (Rolles 1974)22.5%, N=182 tested (biopsy), diagnostic criteria some VA (Stokes 1976) 44.1%, N=111 tested (biopsy), diagnostic criteria Marsh I-IV (Tursi 2003)4.0%, N=328 tested (AGA), diagnostic criteria some VA (Corazza 1992)12.0%, N=92 tested (EMA, TTG), diagnostic criteria some VA (Pittschieler 2003)10.9%, N=338 tested (AGA, EMA, Hx) diagnostic criteria ESPGAN (Rostami 2000)8.3%, N=120 tested (AGA, EMA, TTG), diagnostic criteria some VA (Hogberg 2003)9.1%, N=943 tested (EMA), diagnostic criteria some VA (Korponay-Szabo 1998)5.6%, N=675 tested (AGA, EMA) diagnostic criteria some VA (Farre 1999)3.5%, N=151 tested (EMA) diagnostic criteria positive serology (Kotze 2001)4.5%, N=4508 tested (EMA) diagnostic criteria positive serology (Fasano 2003)2.8%, N=642 tested (AGA, EMA) diagnostic criteria positive serology (Vitoria 1994)9.4%, N=466 tested (AGA, EMA) diagnostic criteria positive serology (Mustalahti 2002)17.2%, N=163 tested (EMA, TTG) diagnostic criteria positive serology (Book 2003)
Studies that required some degree of villous atrophy for diagnosis, mean prevalence 7.6% (range 4% to 12%), where Marsh I were also considered diagnostic prevalence was 44.1%
NICE clinical guideline 86 Coeliac disease: appendix 6.6 Page 10 of 111

Reported prevalence based on serology results, mean prevalence 4.3% (range 2.8% to 17.2%)
Prevalence of coeliac disease in those with iron deficiency anaemia: 8 studies included – all adult studies with biopsy proven coeliac disease, N≥50 participantsN=93, outpatients with IDA, N=13 (14%) biopsy proven coeliac disease (Akerman 1996)N=71, asymptomatic, N=4 (5.6%) biopsy proven coeliac disease (Annibale 2001)N=200, referred to haematology, N=10 (5%) biopsy proven coeliac disease (Corazzo 1995)N=258, IDA identified through the lab, N=12 (4.7%) biopsy proven coeliac disease (Howard 2002)N=50, outpatients with IDA, N=3 (6%) biopsy proven coeliac disease (McIntyre 1993)N=113, undergoing endoscopy for IDA, N=17 (15%) biopsy proven coeliac disease (Oxentenko 2002)N=484, referred to haematology, N=11 (2.3%) biopsy proven coeliac disease (Ransford 2002)N=59, pre-menopausal women with IDA, N=5 (8.5%) biopsy proven coeliac disease (Annibale 2003)
Prevalence of coeliac disease in those with low bone mineral density:4 studies included – all adult studies with biopsy proven coeliac disease, N≥50 participantsN=92, consecutive patients with idiopathic osteoporosis, N=3 (3%) biopsy proven coeliac disease (Lindh 1992)N=127, postmenopausal women with osteoporosis, N=1 (0.9%) biopsy proven coeliac disease (Gonzalez 2002)N=96, idiopathic low BMD, N=0 biopsy proven coeliac disease (Mather 2001)N=255, females with osteoporosis, N=6 (2.4%) biopsy proven coeliac disease (Nuti 2001)
Prevalence of coeliac disease in those with type 1 diabetes:21 studies included – all with biopsy proven coeliac disease, N≥50 participantsN=185, adults, N=4 (2.2%) biopsy proven coeliac disease (Talal 2002)N=211, mostly children, N=3 (1.4%) biopsy proven coeliac disease (Rossi 1993)N=62, adults, N=7 (11.3%) biopsy proven coeliac disease (Kaukinen 1999)N=848, adults, N=7 (0.8%) biopsy proven coeliac disease (Sjoberg 1998)N=383, adults, N=10 (2.6%) biopsy proven coeliac disease (Sategna-Guidetti 1994)N=263, children, N=12 (4.6%) biopsy proven coeliac disease (Frazer-Reynolds 1998)N=104, children, N=9 (8.2%) biopsy proven coeliac disease (Hansen 2001)N=776, children, N=19 (2.5%) biopsy proven coeliac disease (Saukkonen 1996)N=205, children, N=6 (2.9%) biopsy proven coeliac disease (Spiekerkoetter 2002)N=498, children, N=16 (3.2%) biopsy proven coeliac disease (Barera 1991)N=273, children, N=9 (3.3%) biopsy proven coeliac disease (Barera 2002)N=383, children, N=32 (3.4%) biopsy proven coeliac disease (Valerio 2002)N=141, children, N=4 (2.8%) biopsy proven coeliac disease (Carelo 1996)N=177, children, N=7 (4%) biopsy proven coeliac disease (Roldan 1998)N=93, children, N=6 (6.5%) biopsy proven coeliac disease (Juan 1998)N=459, children, N=21 (4.6%) biopsy proven coeliac disease (Sigurs 1993)N=162, children, N=6 (3.7%) biopsy proven coeliac disease (Agardh 2001)N=167, children, N=8 (4.8%) biopsy proven coeliac disease (Acerini 1998)
NICE clinical guideline 86 Coeliac disease: appendix 6.6 Page 11 of 111

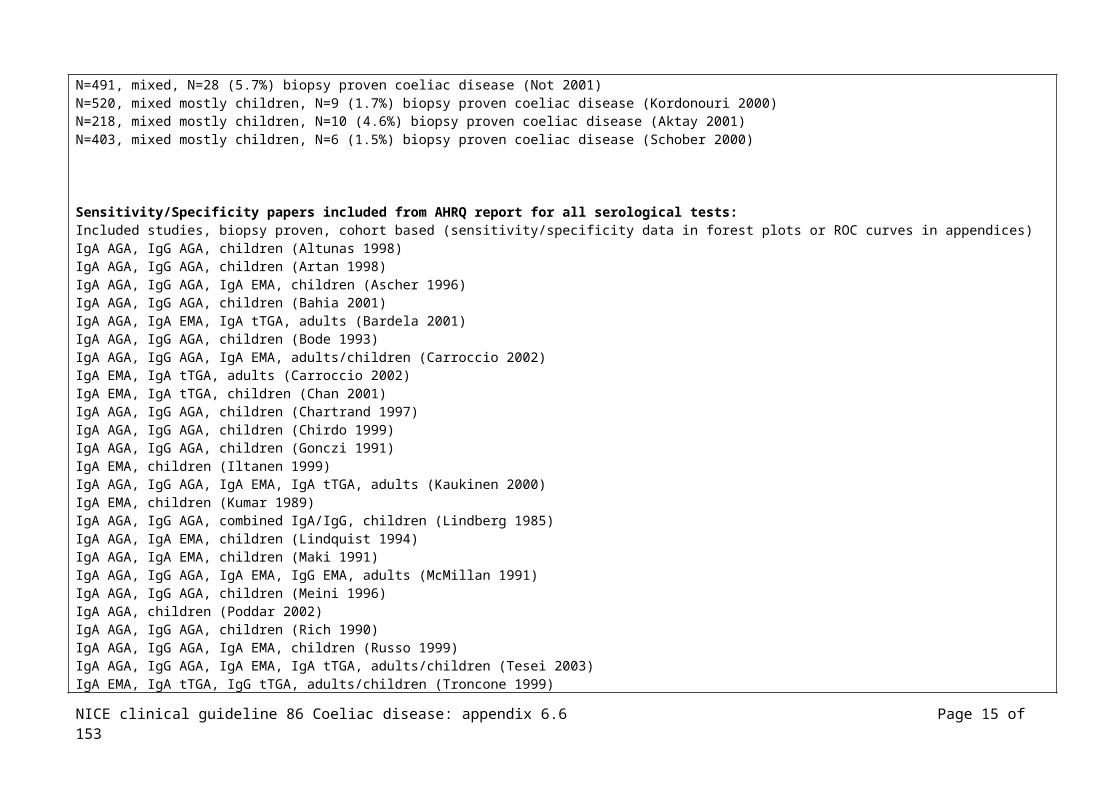
N=233, children, N=14 (6%) biopsy proven coeliac disease (Gillett 2001)N=1114, mixed, N=63 (5.7%) biopsy proven coeliac disease (De Vitis 1996)N=491, mixed, N=28 (5.7%) biopsy proven coeliac disease (Not 2001)N=520, mixed mostly children, N=9 (1.7%) biopsy proven coeliac disease (Kordonouri 2000)N=218, mixed mostly children, N=10 (4.6%) biopsy proven coeliac disease (Aktay 2001)N=403, mixed mostly children, N=6 (1.5%) biopsy proven coeliac disease (Schober 2000)
Sensitivity/Specificity papers included from AHRQ report for all serological tests: Included studies, biopsy proven, cohort based (sensitivity/specificity data in forest plots or ROC curves in appendices) IgA AGA, IgG AGA, children (Altunas 1998)IgA AGA, IgG AGA, children (Artan 1998)IgA AGA, IgG AGA, IgA EMA, children (Ascher 1996)IgA AGA, IgG AGA, children (Bahia 2001)IgA AGA, IgA EMA, IgA tTGA, adults (Bardela 2001)IgA AGA, IgG AGA, children (Bode 1993)IgA AGA, IgG AGA, IgA EMA, adults/children (Carroccio 2002)IgA EMA, IgA tTGA, adults (Carroccio 2002)IgA EMA, IgA tTGA, children (Chan 2001)IgA AGA, IgG AGA, children (Chartrand 1997)IgA AGA, IgG AGA, children (Chirdo 1999)IgA AGA, IgG AGA, children (Gonczi 1991)IgA EMA, children (Iltanen 1999)IgA AGA, IgG AGA, IgA EMA, IgA tTGA, adults (Kaukinen 2000)IgA EMA, children (Kumar 1989)IgA AGA, IgG AGA, combined IgA/IgG, children (Lindberg 1985)IgA AGA, IgA EMA, children (Lindquist 1994)IgA AGA, IgA EMA, children (Maki 1991)IgA AGA, IgG AGA, IgA EMA, IgG EMA, adults (McMillan 1991)IgA AGA, IgG AGA, children (Meini 1996)IgA AGA, children (Poddar 2002)IgA AGA, IgG AGA, children (Rich 1990)IgA AGA, IgG AGA, IgA EMA, children (Russo 1999)IgA AGA, IgG AGA, IgA EMA, IgA tTGA, adults/children (Tesei 2003)IgA EMA, IgA tTGA, IgG tTGA, adults/children (Troncone 1999)IgA AGA, IgA EMA, adults (Valdimarss 1996)IgA AGA, IgG AGA, IgA EMA, adults (Vogelsang 1995)IgA AGA, IgG AGA, IgA EMA, IgA tTGA, children (Wolters 2002)
NICE clinical guideline 86 Coeliac disease: appendix 6.6 Page 12 of 111
Reference Study type/Evidence level
Number of patients
Patient characteristics Intervention Comparison Length of follow-up
Outcome measures
Source of funding
Bdioui F, Sakly N, Hassine M, Saffar H. Prevalence of celiac disease in Tunisian blood donors. Gastroenterologie Clinique et Biologique 2006;30:33-6
Cohort
Tunisia
N=1418 Inclusion: unselected blood donors, N=1090 (77.3%) men, N=328 (22.7%), mean age men 29yrs, mean age women 26yrs
All lab analyses were performed, validated and interpreted by the same investigator
IgA EMA HU, indirect immunofluorescence
Those considered +ve, ATG (anti-tissue transglutaninase) , ELISA
Effect size:
N=3 IgA EMA +ve, N=2 of these ATG +ve these N=2 had vilous atrophy classified Marsh IIIC and IIIA, the N=1 ATG –ve had no histological lesions
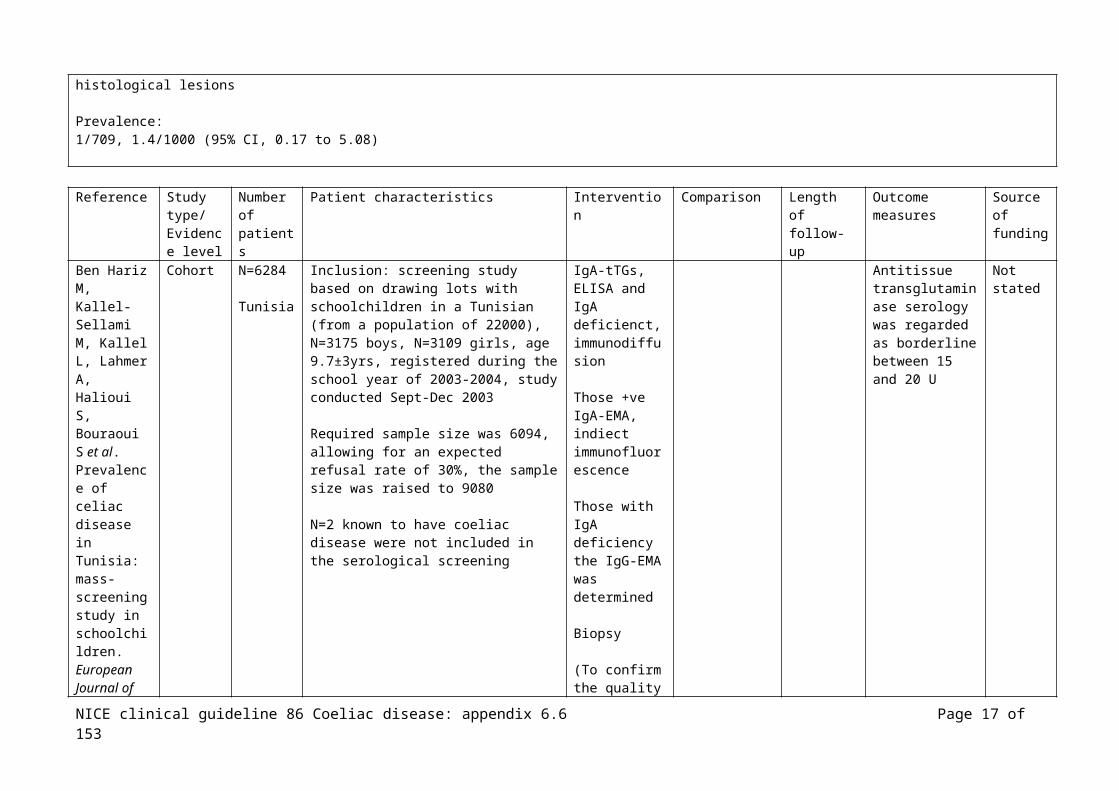
Prevalence: 1/709, 1.4/1000 (95% CI, 0.17 to 5.08)
Reference Study type/Evidence level
Number of patients
Patient characteristics Intervention Comparison Length of follow-up
Outcome measures
Source of funding
Ben Hariz M, Kallel-Sellami M, Kallel L, Lahmer A, Halioui S,
Cohort N=6284
Tunisia
Inclusion: screening study based on drawing lots with schoolchildren in a Tunisian (from a population of 22000), N=3175 boys, N=3109 girls, age 9.7±3yrs, registered during the school year of 2003-2004, study conducted Sept-
IgA-tTGs, ELISA and IgA deficienct, immunodiffusion
Antitissue transglutaminase serology was regarded as borderline between 15 and
Not stated
NICE clinical guideline 86 Coeliac disease: appendix 6.6 Page 13 of 111

Bouraoui S et al. Prevalence of celiac disease in Tunisia: mass-screening study in schoolchildren. European Journal of Gastroenterology & Hepatology 2007;19:687-94
Dec 2003
Required sample size was 6094, allowing for an expected refusal rate of 30%, the sample size was raised to 9080
N=2 known to have coeliac disease were not included in the serological screening
Those +ve IgA-EMA, indiect immunofluorescence
Those with IgA deficiency the IgG-EMA was determined
Biopsy
(To confirm the quality of the ELISA N=500 sera –ve for IgA-tTG were tested for IgA-EMA)
20 U
Effect size:
IgA-TTG:N=139/6284 (2.2%) of these N=87 (1.4%) had a value above 20 U and N=52 (37.4%) had a borderline value between 15 and 20 U
IgA-EMA, determined for all samples in the +ve and borderline groups:- +ve group: N=36/87 (41.3%) had +ve IgA-EMA and IgA-tTG rates vs. -ve group: N=51, p<0.001- borderline group: N=4 (7.7%) IgA-EMA +ve, significant difference compared with the +ve IgA-tTG group, p<0.001
Total IgA was decreased in N=17 (0.27%, 1/370), of these N=3 had complete IgA deficiency (0.03%). None of the 17 had IgG-EMA
N=107/139 returned, of these N=28 positive for both serological tests (IgA-tTG and IgA-AE) and were biopsiedN=26/28 signs of coeliac disease, N=23 had villous atrophy, N=3 rise in intraepithelial lymphocyte density, N=2 normal mucosa
N=79 IgA-tTG positive, IgA-AE negative, N=26 biopsied, none had histology compatible with coeliac disease
Prevalence:N=26 biopsy proven, N=2 previously diagnosed, N=12 positive to both serological tests but not been biopsied, prevalence 1/157 (1/217 to 1/115, 95% CI)Biopsy proven prevalence 1/224 (1/333 to 1/154, 95% CI)
Those who were biopsy proven, none had other autoimmune conditions, N=3 had an affected relative, N=11 were asymptomatic
NICE clinical guideline 86 Coeliac disease: appendix 6.6 Page 14 of 111
Reference Study type/Evidence level
Number of patients
Patient characteristics Intervention Comparison Length of follow-up
Outcome measures
Source of funding
Biagi F, Campanella J, Bianchi PI, Zanellati G, Capriglione I, Klersy C et al. The incidence of coeliac disease in adult first degree relatives.[see comment]. Digestive & Liver Disease 2008;40:97-100
Cohort N=158
Italy
Inclusion: adult first degree of N=73 coeliac patients referred to an out-patient clinic, diagnosed by means of duodenal biopsy and coeliac antibodies, between Jan 1999 – June 2006, mean 46.4yrs±16.9
IgA-EMA, indirect immunofluorescence
Those +ve biopsied
1-year, participants recontacted by phone, mean follow-up 51.5mths
Not stated
Effect size:
N=130/158 initially tested and –ve, 1 year later N=63 retested, none +ve, N=1 had developed coeliac disease
Prevalence, N=28/158 (17.7%, 95% CI 12.1 to 24.6)
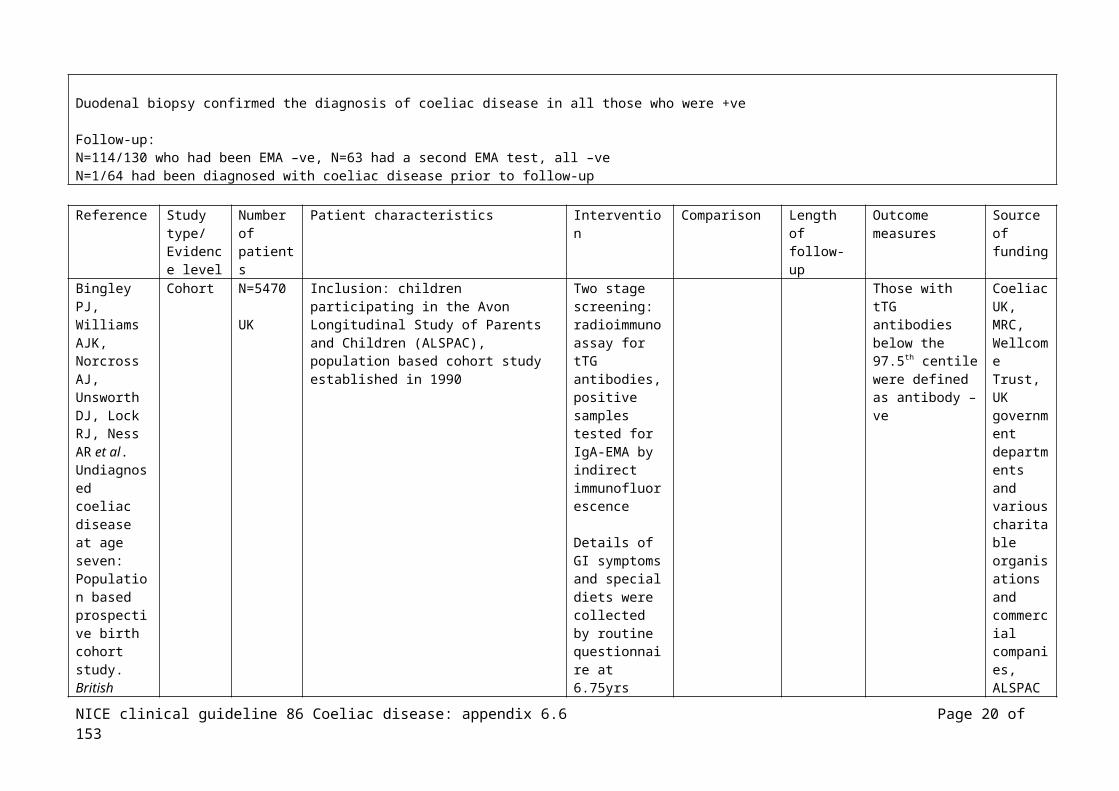
Duodenal biopsy confirmed the diagnosis of coeliac disease in all those who were +ve
Follow-up:N=114/130 who had been EMA –ve, N=63 had a second EMA test, all –ve N=1/64 had been diagnosed with coeliac disease prior to follow-up
Reference Study type/
Number of
Patient characteristics Intervention Comparison Length of follow-up
Outcome measures
Source of
NICE clinical guideline 86 Coeliac disease: appendix 6.6 Page 15 of 111

Evidence level
patients funding
Bingley PJ, Williams AJK, Norcross AJ, Unsworth DJ, Lock RJ, Ness AR et al. Undiagnosed coeliac disease at age seven: Population based prospective birth cohort study. British Medical Journal 2004;328:322-3
Cohort N=5470
UK
Inclusion: children participating in the Avon Longitudinal Study of Parents and Children (ALSPAC), population based cohort study established in 1990
Two stage screening: radioimmunoassay for tTG antibodies, positive samples tested for IgA-EMA by indirect immunofluorescence
Details of GI symptoms and special diets were collected by routine questionnaire at 6.75yrs
Those with tTG antibodies below the 97.5th centile were defined as antibody –ve
Coeliac UK, MRC, Wellcome Trust, UK government departments and various charitable organisations and commercial companies, ALSPAC is part of the WHO initiated European Longitudinal Study of Pregnancy and Childhood
Effect size:
N=137 were tTG antibody +ve but IgA-EMA –ve
IgA-EMA:N=54 IgA-EMA +ve; 1.0% (95% CI; 0.8 to 1.4) IgA EMA more common in females, OR 2.12 (1.20 to 3.75)
NICE clinical guideline 86 Coeliac disease: appendix 6.6 Page 16 of 111
tTG antibody –ve controls (N=5333) compared with IgA-EMA +ve (N=54): at age 7.5yrs (interquartile range):Height; 126 (122.4 to 129.6) vs. 122.1 (118.25 to 125.33), p<0.0001Weight; 25.2 (22.8 to 28.0) vs. 23.4 (21.35 to 25.4), p<0.0001SD for height; 0.23 (-0.43 to 0.88) vs. -0.53 (-1.01 to -0.00), p<0.0001SD for weight; 0.18 (-0.45 to 0.86) vs. -0.36 (-1.01 to 0.28), p<0.0001Hb conc; 125 (120 to 130) vs. 123 (118 to 127), NS
Symptoms: tTG antibody –ve (N=4285 questionnaires) compared with IgA-EMA +ve (N=42): at age 6.75yrs (95% CI):Any diarrhoea; 1450 (34%) vs. 21 (50%), OR 1.96 (1.06 to 3.59), no overall difference in the number of episodes of diarrhoea Any vomiting; 1933 (45%) vs. 23 (55%), OR 1.47 (0.80 to 2.71)Any stomach pains; 2557 (60%) vs. 28 (66%), OR 1.35 (0.71 to 2.57)Any constipation; 435 (10%) vs. 6 (14%), OR 1.48 (0.62 to 3.52)≥3 GI symptoms; 931 (22%) vs. 17 (40%), OR 2.45 (1.33 to 4.5)
Author comment: those with IgA-EMA shorter by more than 0.76 SD scores and lighter by 0.54 SD scores, this equates to about 9mths growth and weight gain in an average child around this age.
Reference Study type/Evidence level
Number of patients
Patient characteristics Intervention Comparison Length of follow-up
Outcome measures
Source of funding
Bizzaro et al (2006) Low specificity of anti-tissue transglutaminase antibodies in patients with primary biliary cirrhosis
Cohort N=105
Adults
Italy
Inclusion: patients with primary biliary cirrhosis, N=91 female, N=14 male, mean age 63yrs (range 39 to 94yrs), diagnosis based on lab findings, the presence of anti-mitochondrial antibodies and liver histology, none had clear symptoms of CD (control group: N=40 with CD and N=40 healthy subjects were also tested with all the kits)
IgA anti-tTG 3
(ELISA, 6 methods)(2 human recombinant, 1human placenta, 1 human erythrocytes, 2 GP liver)
IgG anti-tTG (ELISA 3 kits)(2 human recombinant, 1 human red blood cells)
+ve for anti-tTG tested for
IgA EMA IgG EMA(ME)
+ve EMA advised biopsy
+ve anti-tTG and –ve EMA, HLA testing
Not stated
3 Tests performed in a single lab according to the manufacturer’s instructions, including indicated cut-off levels
NICE clinical guideline 86 Coeliac disease: appendix 6.6 Page 17 of 111

Effect size: (CI 95%)
N=28/105 (26.7%) IgA anti-tTG +ve; N=6/105 (5.7%) IgG anti-tTG +ve; in at least one of the 6 ELISA methods Agreement low, N=7/28 showed reactivity with only 1 method, N=12 with 2 methods, N=2 with 3 methodsOnly N=4 were +ve with all methods, N=3 were +ve with 5 methods For IgG the N=6 +ve were each with only 1 method
N=2/28 were IgA EMA +ve, N=2 biopsied both CD N=0/6 were IgG EMA +ve
HLA determined in N=24/26 tTG+ve and EMA –ve, N=5 HLA +ve, N=4 biopsied
IgA tTG, specificity range; 82.5% to 97.1%IgG tTG, specificity range; 95.1% to 100%
Reference Study type/Evidence level
Number of patients
Patient characteristics Intervention Comparison Length of follow-up
Outcome measures
Source of funding
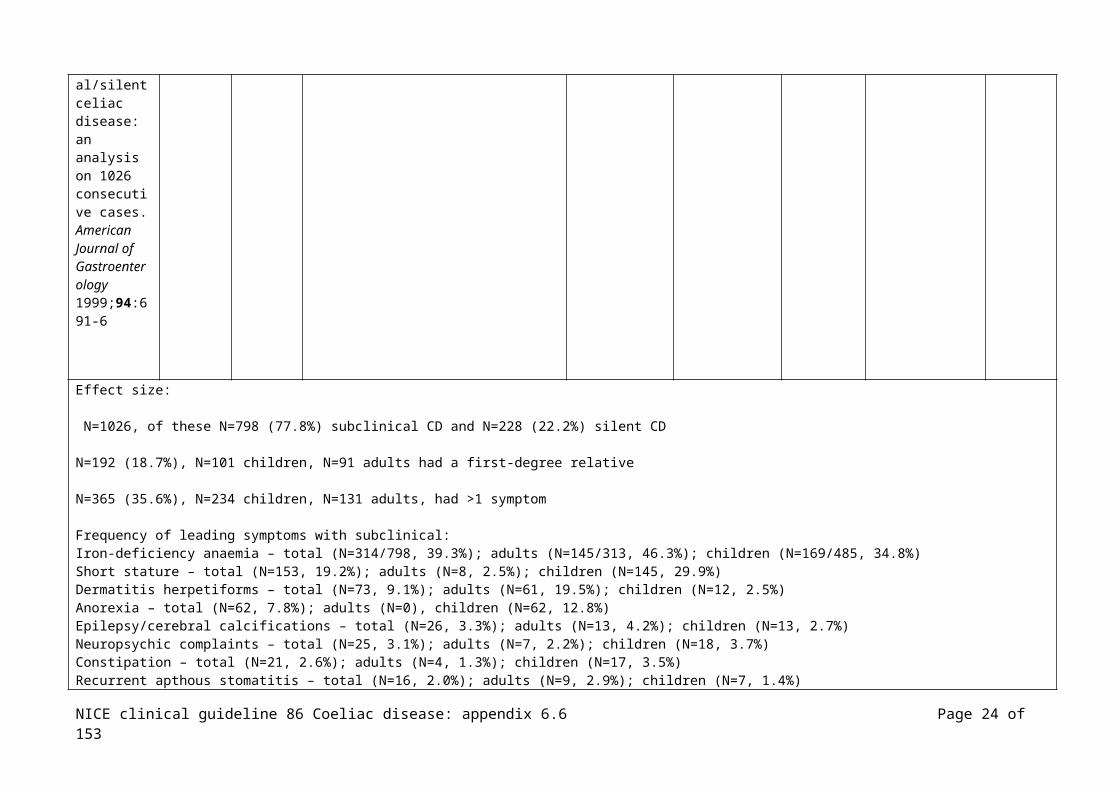
Bottaro G, Cataldo F, Rotolo N, Spina M, Corazza GR. The clinical pattern of subclinical/silent celiac disease: an analysis on 1026 consecutive cases. American Journal of Gastroenterology 1999;94:691
N=1026
Mixed
Italy
Inclusion: all subclinical/silent patients with celiac disease in 42 centres diagnosed between 1990 and 1994, N=382 adults (mean age 24.4±12.5, N=271 females, 70.9%, N=111 males, 29.1%), N=644 children (mean age 7.7±4.2, N=431 females, 66.9%, N=213 males, 33.1%)
Not stated
NICE clinical guideline 86 Coeliac disease: appendix 6.6 Page 18 of 111

-6
Effect size:
N=1026, of these N=798 (77.8%) subclinical CD and N=228 (22.2%) silent CD
N=192 (18.7%), N=101 children, N=91 adults had a first-degree relative
N=365 (35.6%), N=234 children, N=131 adults, had >1 symptom
Frequency of leading symptoms with subclinical:Iron-deficiency anaemia – total (N=314/798, 39.3%); adults (N=145/313, 46.3%); children (N=169/485, 34.8%)Short stature – total (N=153, 19.2%); adults (N=8, 2.5%); children (N=145, 29.9%)Dermatitis herpetiforms – total (N=73, 9.1%); adults (N=61, 19.5%); children (N=12, 2.5%)Anorexia – total (N=62, 7.8%); adults (N=0), children (N=62, 12.8%)Epilepsy/cerebral calcifications – total (N=26, 3.3%); adults (N=13, 4.2%); children (N=13, 2.7%)Neuropsychic complaints – total (N=25, 3.1%); adults (N=7, 2.2%); children (N=18, 3.7%)Constipation – total (N=21, 2.6%); adults (N=4, 1.3%); children (N=17, 3.5%)Recurrent apthous stomatitis – total (N=16, 2.0%); adults (N=9, 2.9%); children (N=7, 1.4%)Dyspepsia – total (N=12, 1.5%); adults (N=8, 2.5%); children (N=4, 0.8%)Thinnes – total (N=12, 1.5%); adults (N=3, 1.0%); children (N=9, 1.8%)Hypertransaminasemia – total (N=11, 1.4%); adults (N=5, 1.6%); children (N=6, 1.2%)Osteoporosis – total (N=11, 1.4%); adults (N=11, 3.5%); children (N=0)
Others ≤N=10 total: arthromyalgia; delayed puberty; dental enamel hypoplasia; atopy; peripheral oedema; amenorrhoea-abortions; recurrent infections; hypoglycaemia; lipothymia; tetania; obersity; polyuria-polydipsy; onychodystrophy; hypothyroidism; hyperparathyroidism
Frequency of celiac-associated disorders:Insulin-dependent diabetes – total (N=76, 7.4%); adults (N=27, 7.1%); children (N=49, 7.6%)Atopy – total (N=32, 3.1%); adults (N=10, 2.6%); children (N=22, 3.4%)Down’s syndrome – total (N=19, 1.9%); adults (N=1, 0.3%); children (N=18, 2.8%)IgA deficiency – total (N=15, 1.5%); adults (N=4, 1.0%); children (N=11, 1.7%)
Others ≤N=10 total: Turner syndrome; thyroiditis; hyperparathyroidism; rheumatoid arthritis; alopecia; Berger’s disease; psoriasis; sarcodosis; livedo reticularis; Basedow’s disease; primary biliary cirrhosis; Plummer’s adenoma; rheumatic fever; medulloblastoma; immunoploferative intestinal disease
Reference Study Number Patient characteristics Intervention Comparison Length of Outcome Source
NICE clinical guideline 86 Coeliac disease: appendix 6.6 Page 19 of 111
type/Evidence level
of patients
follow-up measures of funding
Bottaro G, Failla P, Rotolo N, Sanfilippo G, Azzaro F, Spina M et al. Changes in coeliac disease behaviour over the years. Acta Paediatrica 1993;82:566-8
Retrospective
N=325
Children
Italy
Inclusion: data from children from diagnosed at a Paediatric Gastroenterology Service, children grouped according to year of diagnosis, group A 1984 to 1986, group B 1987 to 1989, age range 3mths to 14yrs, N=176 females, N=146 males
Age at onset of symptoms, age at diagnosis, the three major symptoms related to onset of coeliac disease
Not stated
Effect size:
Symptoms:- chronic diarrhoea; 75.2% in group A and 70.2% in group B- weight loss; 43.6% in group A and 59.6% in group B, p=0.0016- abdominal distension; 35.8% in group A and 28.4% in group B- growth failure; 30.8% in group A and 20.2% in group B- vomiting; 32.5% in group A and 26.1% in group B- anorexia; 25.6% in group A and 35.1% in group B- irritability; 10.3% in group A and 13.9% in group B- minor symptoms; 18.8% in group A and 24.5% in group B
Author’s consider that no changes were noted in the trend of symptoms, notably for chronic diarrhoea
Reference Study type/Evidence level
Number of patients
Patient characteristics Intervention Comparison Length of follow-up
Outcome measures
Source of funding
Brandimarte Cohort N=298 Inclusion: N=81 male, N=217 female, IgA4 and IgG Participant None
NICE clinical guideline 86 Coeliac disease: appendix 6.6 Page 20 of 111

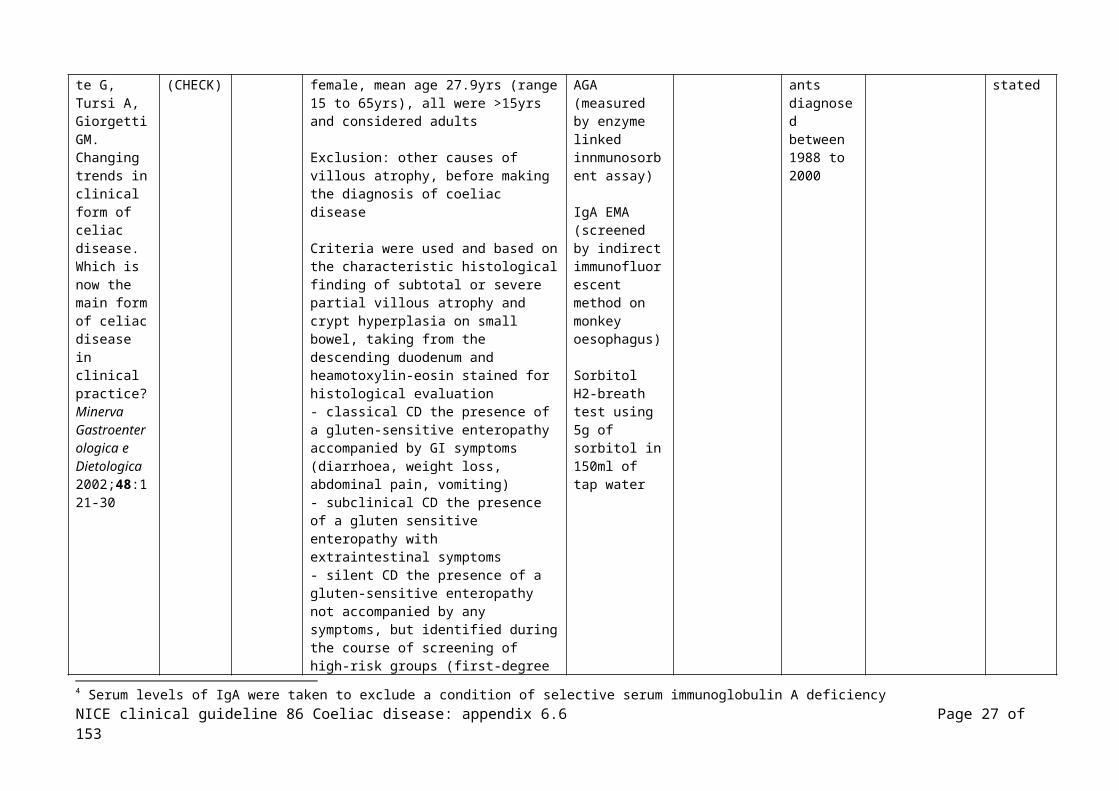
G, Tursi A, Giorgetti GM. Changing trends in clinical form of celiac disease. Which is now the main form of celiac disease in clinical practice? Minerva Gastroenterologica e Dietologica 2002;48:121-30
(CHECK) mean age 27.9yrs (range 15 to 65yrs), all were >15yrs and considered adults
Exclusion: other causes of villous atrophy, before making the diagnosis of coeliac disease
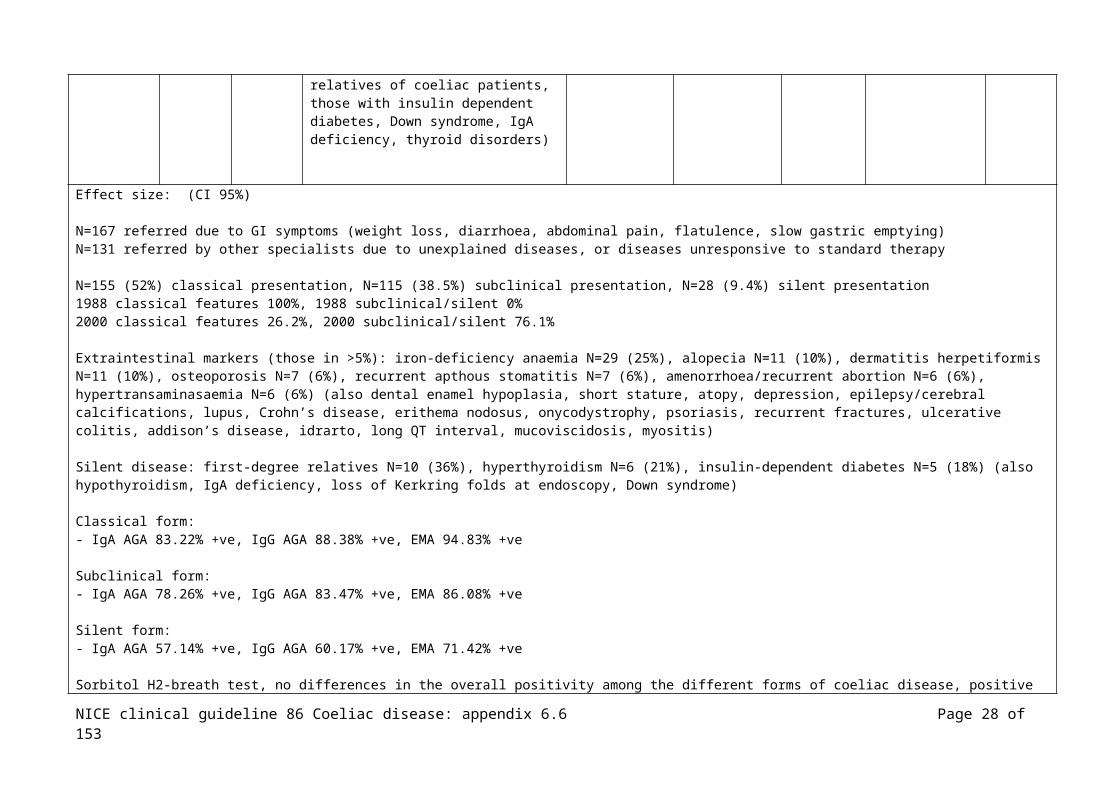
Criteria were used and based on the characteristic histological finding of subtotal or severe partial villous atrophy and crypt hyperplasia on small bowel, taking from the descending duodenum and heamotoxylin-eosin stained for histological evaluation- classical CD the presence of a gluten-sensitive enteropathy accompanied by GI symptoms (diarrhoea, weight loss, abdominal pain, vomiting)- subclinical CD the presence of a gluten sensitive enteropathy with extraintestinal symptoms- silent CD the presence of a gluten-sensitive enteropathy not accompanied by any symptoms, but identified during the course of screening of high-risk groups (first-degree relatives of coeliac patients, those with insulin dependent diabetes, Down syndrome, IgA deficiency, thyroid disorders)
AGA (measured by enzyme linked innmunosorbent assay)
IgA EMA (screened by indirect immunofluorescent method on monkey oesophagus)
Sorbitol H2-breath test using 5g of sorbitol in 150ml of tap water
s diagnosed between 1988 to 2000
stated
Effect size: (CI 95%)
N=167 referred due to GI symptoms (weight loss, diarrhoea, abdominal pain, flatulence, slow gastric emptying)N=131 referred by other specialists due to unexplained diseases, or diseases unresponsive to standard therapy
N=155 (52%) classical presentation, N=115 (38.5%) subclinical presentation, N=28 (9.4%) silent presentation 1988 classical features 100%, 1988 subclinical/silent 0%2000 classical features 26.2%, 2000 subclinical/silent 76.1%
4 Serum levels of IgA were taken to exclude a condition of selective serum immunoglobulin A deficiency
NICE clinical guideline 86 Coeliac disease: appendix 6.6 Page 21 of 111

Extraintestinal markers (those in >5%): iron-deficiency anaemia N=29 (25%), alopecia N=11 (10%), dermatitis herpetiformis N=11 (10%), osteoporosis N=7 (6%), recurrent apthous stomatitis N=7 (6%), amenorrhoea/recurrent abortion N=6 (6%), hypertransaminasaemia N=6 (6%) (also dental enamel hypoplasia, short stature, atopy, depression, epilepsy/cerebral calcifications, lupus, Crohn’s disease, erithema nodosus, onycodystrophy, psoriasis, recurrent fractures, ulcerative colitis, addison’s disease, idrarto, long QT interval, mucoviscidosis, myositis)
Silent disease: first-degree relatives N=10 (36%), hyperthyroidism N=6 (21%), insulin-dependent diabetes N=5 (18%) (also hypothyroidism, IgA deficiency, loss of Kerkring folds at endoscopy, Down syndrome)
Classical form:- IgA AGA 83.22% +ve, IgG AGA 88.38% +ve, EMA 94.83% +ve Subclinical form:- IgA AGA 78.26% +ve, IgG AGA 83.47% +ve, EMA 86.08% +ve
Silent form:- IgA AGA 57.14% +ve, IgG AGA 60.17% +ve, EMA 71.42% +ve
Sorbitol H2-breath test, no differences in the overall positivity among the different forms of coeliac disease, positive in 98.37% (classical), 97.39% (subclinical), 92.85% (silent)
Presence of malabsorption (hypoalbuminemia, hypoproteinemia, low iron levels, hypoferritinemia: classical form N=127/155 (82%), subclinical form N=34/115 (34%), silent form N=4/28 (14%)
Effect of GFD – improvements in GI symptoms and extraintestinal symptoms (disappearance of iron-deficiency anaemia, reversal of osteopenia, disappearance of convulsive crisis in epilepsy, regular pregnancy, better response to mesalazine therapy in ulcerative colitis, reduction of insulin units and insulin administration in diabetes)
Reference Study type/Evidence level
Number of patients
Patient characteristics Intervention Comparison Length of follow-up
Outcome measures
Source of funding
NICE clinical guideline 86 Coeliac disease: appendix 6.6 Page 22 of 111

Carroccio A, Di Prima L, Pirrone G, Scalici C, Florena AM, Gasparin M et al. Anti-transglutaminase antibody assay of the culture medium of intestinal biopsy specimens can improve the accuracy of celiac disease diagnosis. Clinical Chemistry 2006;52:1175-80
Cohort N=273
Mixed
Italy
Inclusion: consecutive patients undergoing intestinal biopsy for suspected CD (pediatric gastroenterology clinic and an internal medicine clinic), January 2001 to June 2003Adults; N=153, N=54 male, N=99 female, median age 32yrs (range 17 to 80yrs)Children; N=120, N=50 male, N=70 female, median age 14mths (range 7mths to 14yrs)
Exclusion: patients who had undergone previous histologic evaluation for suspected CD
IgA EMA (immunofluorescence method, monkey oesophagus)(Anti-endomysium, Eurospital)
IgA anti-tTG (ELISA)(human Eu-tTG IgA, Eurospital)(reference values <7% representing a value >2SD above the mean of 850 healthy individuals)
Serum IgA by ELISA to exclude IgA deficiency
(also included results from culture medium, not included here)
Biopsy, specimens obtained from the second duodenal portion5
Adult patients followed as outpatients, children were hospitalised
Ministero dell’Istruzione, dell’Universita e della Ricerca and Ministero delle Politiche Agricole e Forestali
Effect size: (CI 95%)
None had IgA deficiency
N=166 +ve for serum IgA EMA and/or anti-tTG, of these N=162 confirmed coeliac disease with histologic findings and clinical follow-upN=4 (N=1 EMA +ve and anti-tTG +ve), (N=3 anti-tTG +ve)
Those EMA and anti-tTG –ve and biopsied, CD diagnosed in N=13/83 adults and N=16/24 children
5 Histologic analysis was performed by an examiner unaware of the clinical condition and lab test results
NICE clinical guideline 86 Coeliac disease: appendix 6.6 Page 23 of 111
Total N=81 adults and N=110 children CD diagnosis IgA EMA:2x2:
(a)TP 159
(b)FP 1
(c)FN33
(d)TN81
IgA anti-tTG:2x2:
(a)TP 162
(b)FP 4
(c)FN29
(d)TN78
CD patients with +ve EMA and/or anti-tTG showed more severe intestinal mucosal lesions, grade 3b (25%) and grade 3c (35%) vs. seronegative (P<0.001) or vs. non-CD patients (p<0.0001)Intestinal mucosal damage was less severe in the N=29 with CD with –ve EMA and –ve anti-tTG, none had total villous atrophy
Reference Study type/Evidence level
Number of patients
Patient characteristics Intervention Comparison Length of follow-up
Outcome measures
Source of funding
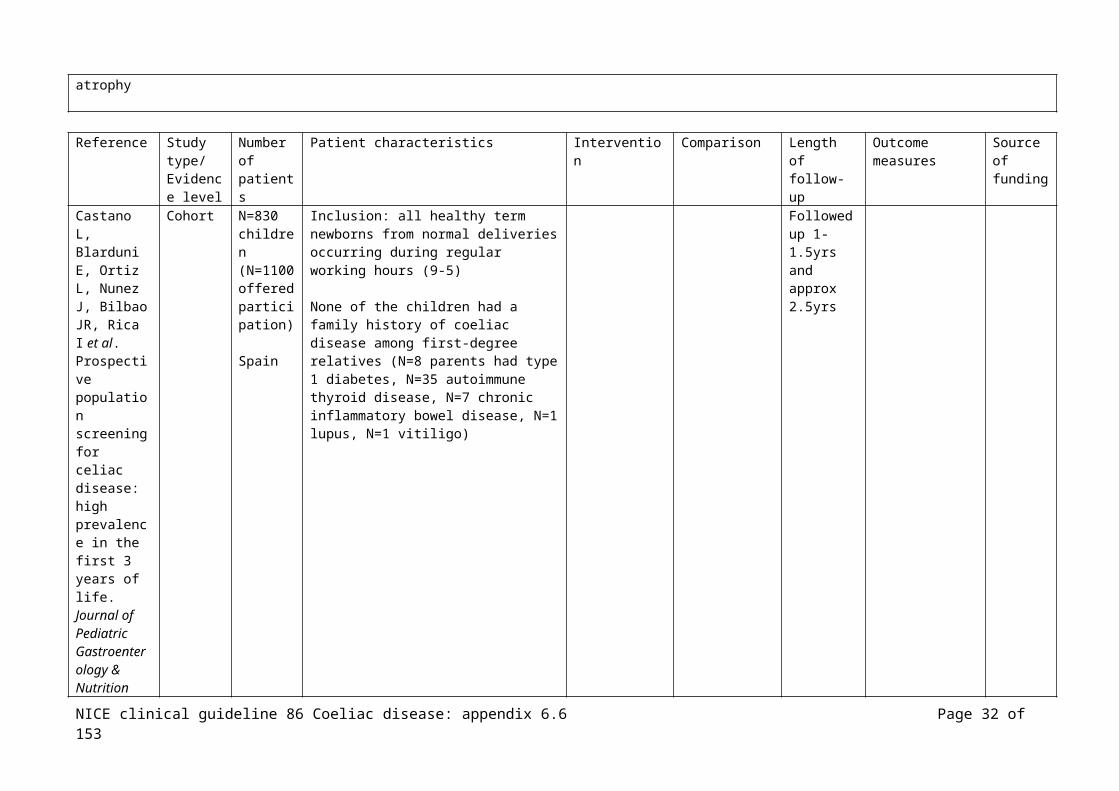
Castano L, Blarduni E, Ortiz L, Nunez J, Bilbao JR, Rica I et al. Prospective population screening for celiac
Cohort N=830 children(N=1100 offered participation)
Spain
Inclusion: all healthy term newborns from normal deliveries occurring during regular working hours (9-5)
None of the children had a family history of coeliac disease among first-degree relatives (N=8 parents had type 1 diabetes, N=35 autoimmune thyroid disease, N=7 chronic inflammatory bowel disease, N=1 lupus, N=1 vitiligo)
Followed up 1-1.5yrs and approx 2.5yrs
NICE clinical guideline 86 Coeliac disease: appendix 6.6 Page 24 of 111

disease: high prevalence in the first 3 years of life. Journal of Pediatric Gastroenterology & Nutrition 2004;39:80-4
Effect size:
1-1.5yrs:N=613/830 (74%) returned; N=0 +ve for anti-tTGase antibodies
2.5yrs:N=484/830 (58.3%) returned N=10 contained anti-tTGase autoantibodies, N=9 repeat +ve result referred to the paediatric GI unit, N=2 –ve AGA and EMA N=7 biopsied all had atrophy of intestinal villi with crypt hyperplasia, all carried coeliac disease risk-associated alleles
Prevalence:Prevalence in the cohort 8.4/1000 children or 1:118 healthy newborns (95% CI, 1:55 to 1:270)Prevalence if include only the N=484 who completed the study 1:69 (95% CI, 1:32 to 1:158)
Reference Study type/Evidence level
Number of patients
Patient characteristics Intervention Comparison Length of follow-up
Outcome measures
Source of funding
Collin P, Reunala T, Pukkala E, Laippala P, Keyrilainen O, Pasternack A. Coeliac disease--associated
Case control
N=335(N=335 control group)
Adults
Finland
Inclusion: adults with coeliac disease diagnosed at a department of internal medicine between 1980 to 1990, N=86 male, N=249 female, mean age at diagnosis 41.4yrs (range 16 to 79)
Control patients selected from outpatients who had upper GI endoscopy, age and sex matched with cases
Grants from the Yrjo Jahnsson Foundation, the Emil Aaltonen Foundation, the
NICE clinical guideline 86 Coeliac disease: appendix 6.6 Page 25 of 111

disorders and survival.[see comment]. Gut 1994;35:1215-8
Finnish Foundation for Gastroenterological Research
Effect size:
Annual number of new coeliac patients 1980 to 1983, range 18 to 26; from 1983 on, range from 29 to 49 N=274 diagnosed after clinical suspicion of coeliac disease, N=61 from serological screening
Results following 1-year follow-up after commencing gluten-free diet not reported here
Associated disorders taken from past and present conditions diagnosed by GPs or in hospitals (associated disorders diagnosed during prospective follow-up not reported here)
Endocrine disorders: 12% (CD) vs. 4.2% (control), p=0.0003- insulin dependent diabetes mellitus, N=18, 5.4% (CD) vs. N=5, 1.5% (control), p=0.0094- autoimmune thyroid N=18, 5.4% (CD) vs. N=9, 2.7% (control), this included autoimmune hypothyreosis, N=11 (CD) vs. N=8 (control) and Graves’ disease N=7 (CD) vs. N=1 (control)- parathyroid adenoma N=2 (CD) vs. N=0 (control)- Addison’s disease N=2 (CD) vs. N=0 (control)
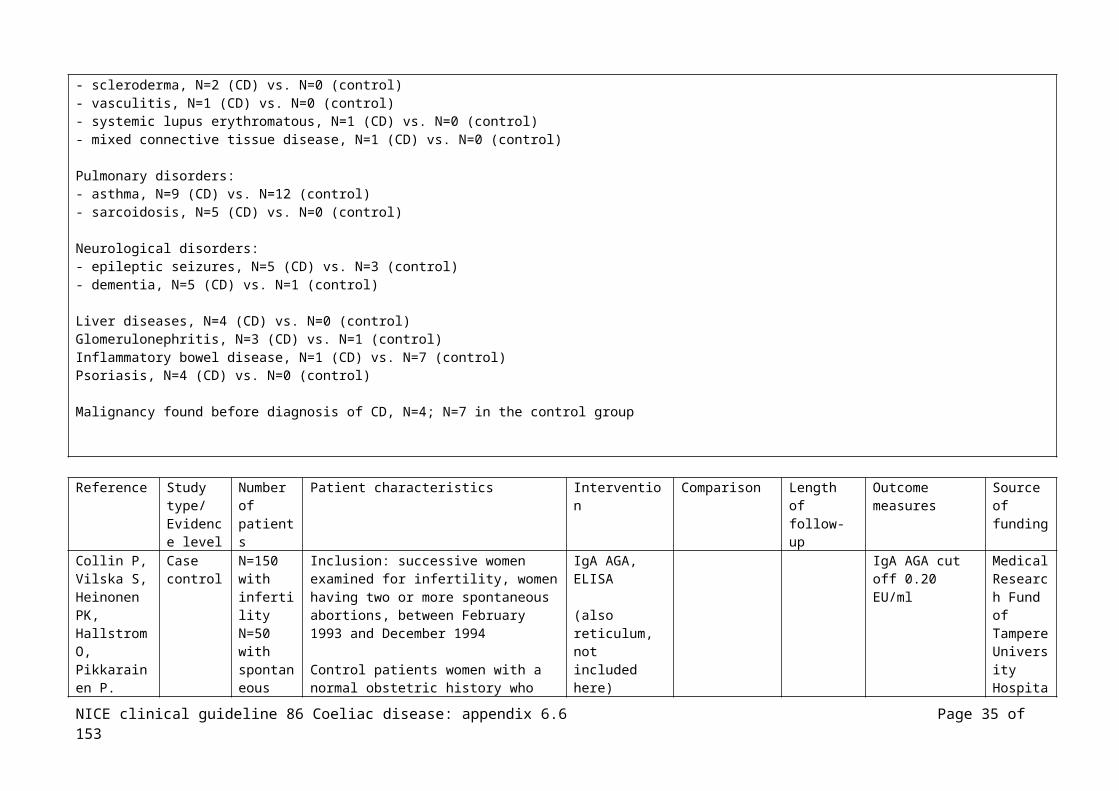
Connective tissue disorders: 7.2% (CD) vs. 2.7% (control), p=0.011- Sjogren’s syndrome, N=11, 3.3% (CD) vs. N=1, 0.3% (control), p=0.0059- rheumatoid arthritis, N=6, 1.8% (CD) vs. N=7, 2.1% (control)- ankylosing spondylitis, N=1 (CD) vs. N=1 (control)- scleroderma, N=2 (CD) vs. N=0 (control)- vasculitis, N=1 (CD) vs. N=0 (control)- systemic lupus erythromatous, N=1 (CD) vs. N=0 (control)- mixed connective tissue disease, N=1 (CD) vs. N=0 (control)
Pulmonary disorders: - asthma, N=9 (CD) vs. N=12 (control)- sarcoidosis, N=5 (CD) vs. N=0 (control)
Neurological disorders:- epileptic seizures, N=5 (CD) vs. N=3 (control)
NICE clinical guideline 86 Coeliac disease: appendix 6.6 Page 26 of 111
- dementia, N=5 (CD) vs. N=1 (control)
Liver diseases, N=4 (CD) vs. N=0 (control)Glomerulonephritis, N=3 (CD) vs. N=1 (control)Inflammatory bowel disease, N=1 (CD) vs. N=7 (control)Psoriasis, N=4 (CD) vs. N=0 (control)
Malignancy found before diagnosis of CD, N=4; N=7 in the control group
Reference Study type/Evidence level
Number of patients
Patient characteristics Intervention Comparison Length of follow-up
Outcome measures
Source of funding
Collin P, Vilska S, Heinonen PK, Hallstrom O, Pikkarainen P. Infertility and coeliac disease.[see comment]. Gut 1996;39:382-4
Case control
N=150 with infertilityN=50 with spontaneous abortion(N=control group)
N=335(N=335 control group)
Adults
Finland
Inclusion: successive women examined for infertility, women having two or more spontaneous abortions, between February 1993 and December 1994
Control patients women with a normal obstetric history who had undergone laproscopic sterilisation
IgA AGA, ELISA
(also reticulum, not included here)
+ve serology had upper gastrointestinal endoscopy including biopsy
IgA AGA cut off 0.20 EU/ml
Medical Research Fund of Tampere University Hospital
Effect size:
N=4/150 (2.7%) in the infertility group compared with none in the control group had coeliac disease, p=0.06All of those with coeliac disease had unexplained fertility so the prevalence of coeliac disease in this group was 4.1% (N=4/98), compared with control group N=0/150, p=0.02
NICE clinical guideline 86 Coeliac disease: appendix 6.6 Page 27 of 111
All N=4 were AGA +ve
Reference Study type/Evidence level
Number of patients
Patient characteristics Intervention Comparison Length of follow-up
Outcome measures
Source of funding
Del Rosario MA, Fitzgerald JF, Chong SK, Croffie JM, Gupta SK. Further studies of anti-endomysium and anti-gliadin antibodies in patients with suspected celiac disease. Journal of Pediatric Gastroenterology & Nutrition 1998;27:191-5
Cohort N=107
Children
USA
Inclusion: untreated patients of the gastroenterology, endocrinology, pulmonary and developmental paediatric services whose symptoms raised suspicion of celiac disease, from one hospital, March 1996 to July 1997, 67 male, mean age 4.8yrs (5 to 16.7yrs)
N=46 persistent GI symptoms, failure to gain weight or both – intestinal biopsy. Those screened by other services did not have a biopsy where serology was negative
IgA EMA (indirect immunoflourescence) using monkey oesophagus
IgA/IgG AGA (enzyme linked immunosorbent assay)
Total serum IgA
Biopsies from the third portion of the duodenum or proximal jejunum, histological exam considered by paediatric pathologists and reviewed by study authors
Not stated
Effect size:
N=107, EMAN=104, AGA
N=46 /107 biopsy (total serum IgA measured in N=19 who had small bowel biopsy)
NICE clinical guideline 86 Coeliac disease: appendix 6.6 Page 28 of 111

EMA:Sensitivity, specificity, PPV, NPV all 100%2X2:
(a)TP 5
(b)FP 0
(d)FN0
(c)TN17
IgA AGA:Sensitivity: 100%Specificity: 92%PPV: 57NPV: 1002X2:
(a)TP 4
(b)FP 3
(d)FN0
(c)TN36
IgG AGA:Sensitivity: 100%Specificity: 38%PPV: 14NPV: 1002X2:
(a)TP 4
(b)FP 24
(d)FN0
(c)TN15
Reference Study type/Evidence
Number of patients
Patient characteristics Intervention Comparison Length of follow-up
Outcome measures
Source of funding
NICE clinical guideline 86 Coeliac disease: appendix 6.6 Page 29 of 111

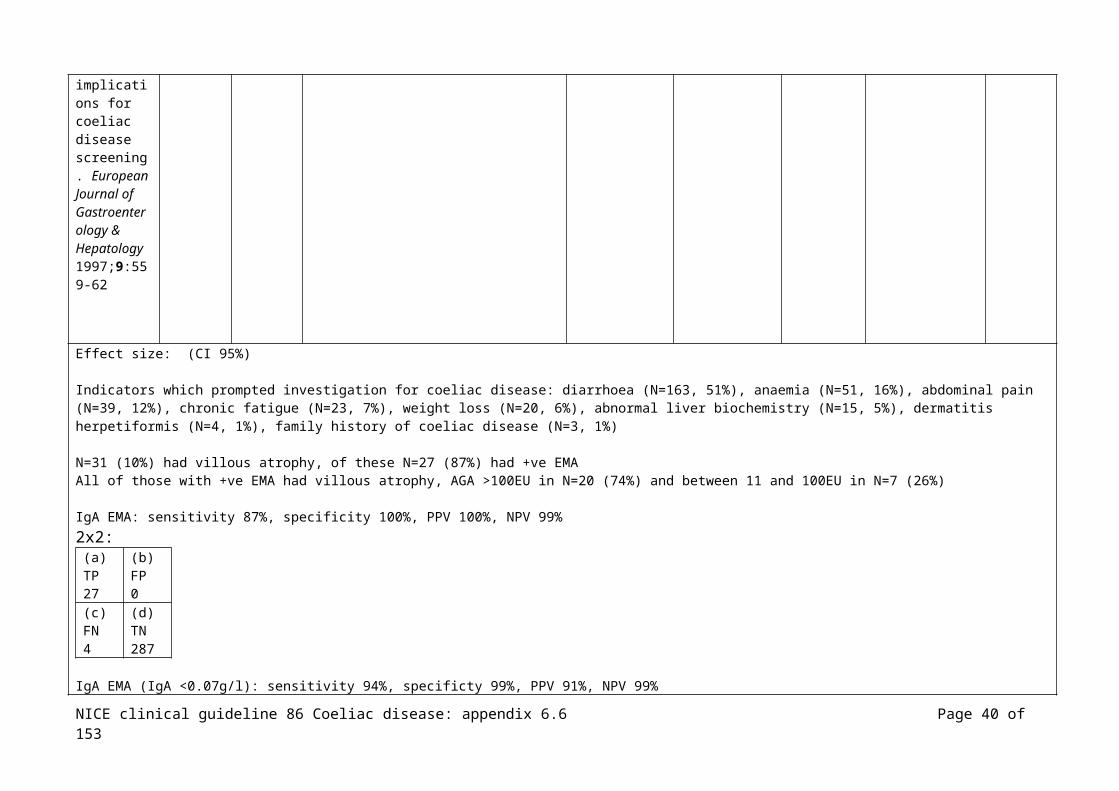
levelDickey W, McMillan SA, McCrum EE, Evans AE. Association between serum levels of total IgA and IgA class endomysial and antigliadin antibodies: implications for coeliac disease screening. European Journal of Gastroenterology & Hepatology 1997;9:559-62
Cohort/case control
N=318
Mixed
N Ireland
Inclusion: patients attending gastroenterology clinics for suspected celiac disease, mean age 42yrs (range 11 to 88yrs), N=192 (60%) female
(N=1959 controls from a previous study – results not reported here)
IgA EMA (indirect immunofluorescence, monkey oesophagus)(Biogiagnostics)(titre of ≥1:5 taken as positive)
IgA AGA (ELISA)(Labmaster)
Total IgA, IgM and IgG
Irrespective of AGA or EMA results patients were biopsied, at least 3 biopsies taken from the distal duodenum, assessed by experienced histiopathologists
IgA less than 0.8g/l considered low, <0.07g/l considered undectable
Not stated
Effect size: (CI 95%)
Indicators which prompted investigation for coeliac disease: diarrhoea (N=163, 51%), anaemia (N=51, 16%), abdominal pain (N=39, 12%), chronic fatigue (N=23, 7%), weight loss (N=20, 6%), abnormal liver biochemistry (N=15, 5%), dermatitis herpetiformis (N=4, 1%), family history of coeliac disease (N=3, 1%)
N=31 (10%) had villous atrophy, of these N=27 (87%) had +ve EMAAll of those with +ve EMA had villous atrophy, AGA >100EU in N=20 (74%) and between 11 and 100EU in N=7 (26%)
IgA EMA: sensitivity 87%, specificity 100%, PPV 100%, NPV 99%2x2:
(a) (b)
NICE clinical guideline 86 Coeliac disease: appendix 6.6 Page 30 of 111

TP 27
FP 0
(c)FN4
(d)TN287
IgA EMA (IgA <0.07g/l): sensitivity 94%, specificty 99%, PPV 91%, NPV 99%2x2:
(a)TP 29
(b)FP 0
(c)FN2
(d)TN284
(no patient with villous atrophy and –ve EMA had an AGA >100EU addition of AGA to protocols added nothing to sensitivity or PPV)
Reference Study type/Evidence level
Number of patients
Patient characteristics Intervention Comparison Length of follow-up
Outcome measures
Source of funding
Emami MH. Diagnostic accuracy of IgA anti-tissue transglutaminase in patients suspected of having coeliac disease in Iran. Journal of Gastrointestinal and Liver
Cohort N=350
Mixed
Iran
Inclusion: consecutive patients with suspected coeliac disease6, between April 2004 and October 2006, research institute Iran, N=195 (55.7%) female, mean age 31.44yrs (range 2 to 83yrs), N=98 <18yrs
Biopsies were read by 2 expert histolopathologists who were blinded to the serological results of the patients
IgA tTG (ELISA)(ORG540 A, ORGENTEC Diagnostica GmbH)
Serum levels of IgA
Upper GI endoscopy, at least 4 biopsies from the second part of the duodenum in all patients
Biopsies evaluated using Marsh
In a normal range study with serum samples from healthy blood donors the cut-off of 10U/ml have been established with the anti-tTG test
Isfahan University of medical Science, Iran
Pour Sina Hakim Research Institution
6 Group I, classical presentation including diarrhoea, weight loss, iron deficiency anaemiaGroup II, non-specific prolonged GI symptoms like abdominal pain, abdominal bloating, constipation, steatorrhoeaGroup III, atypical presentation determined during screening of high risk groups
NICE clinical guideline 86 Coeliac disease: appendix 6.6 Page 31 of 111
Diseases 2008;17:141-6
Effect size:
Marsh I/II classed as lymphocytic enteritisMarsh III classed as CD
71.4% classical presentation, 4.7% atypical presentation, 23.8% non specific prolonged GI symptoms
N=21 coeliac disease (62% female), Marsh IIIa 38%, Marsh IIIb 38%, Marsh IIIc 24%Prevalence 6% (21/350)
N=8 lymphocytic enteritis (Marsh I, N=4, Marsh II, N=4), all tTG –ve
tTGSensitivity 38%, specificity 98%, PPV 57%, NPV 96%
2X2: (a)TP 8
(b)FP 6
(d)FN13
(c)TN323
Anti-tTG antibody +ve 53% (N=8/15) of those with classical presentation, anti-tTG antibody +ve 0% (N=0/1) of those with non specific GI presentation, tTG +ve 0% (N=0/5) of those with atypical presentation (p<0.05):
- classical; sensitivity 47.9%, specificity 96.4%- non-specific GI; sensitivity 0%, specificity 100%- atypical; sensitivity 0%, specificity 98.2%
Those with CD; 80% (N=4/5) with total villous atrophy, 25% (N=4/16) with partial villous atrophy had +ve anti-tTG antibodies (p<0.05)Marsh IIIc; sensitivity 80%, specificity 98%Marsh IIIa and IIIb; sensitivity 36.8%, specificity 98%
(author conclusion: test sensitivity for tTG antibody is significantly lower in those with lesser degrees of histological damage)
NICE clinical guideline 86 Coeliac disease: appendix 6.6 Page 32 of 111

Reference Study type/Evidence level
Number of patients
Patient characteristics Intervention Comparison Length of follow-up
Outcome measures
Source of funding
Ertekin V, Selimoglu MA, Kardas F, Aktas E. Prevalence of celiac disease in Turkish children. Journal of Clinical Gastroenterology 2005;39:689-91
Cohort N=1,263 children
Turkey
Inclusion: randomly selected by systematic sampling method, N=687 (54.4%) male, N=5761 (45.6%) female, mean age 11.9±3.4yrs
None had a family history of coeliac disease
A pathologist blinded to the serology results examined all biopsy specimens according to the modified Marsh criteria
IgA-tTG
Biopsy
Not stated
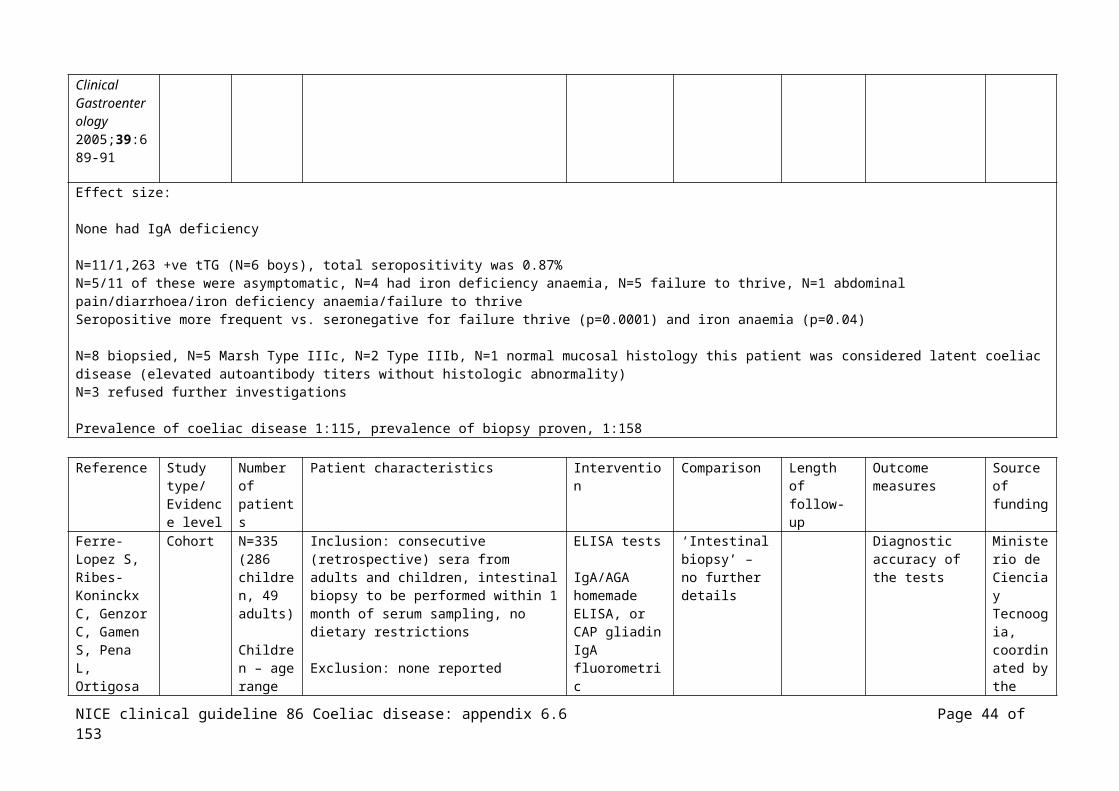
Effect size: None had IgA deficiency
N=11/1,263 +ve tTG (N=6 boys), total seropositivity was 0.87%N=5/11 of these were asymptomatic, N=4 had iron deficiency anaemia, N=5 failure to thrive, N=1 abdominal pain/diarrhoea/iron deficiency anaemia/failure to thrive Seropositive more frequent vs. seronegative for failure thrive (p=0.0001) and iron anaemia (p=0.04)
N=8 biopsied, N=5 Marsh Type IIIc, N=2 Type IIIb, N=1 normal mucosal histology this patient was considered latent coeliac disease (elevated autoantibody titers without histologic abnormality)N=3 refused further investigations
Prevalence of coeliac disease 1:115, prevalence of biopsy proven, 1:158
Reference Study type/Evidence level
Number of patients
Patient characteristics Intervention Comparison Length of follow-up
Outcome measures
Source of funding
Ferre-Lopez Cohort N=335 Inclusion: consecutive (retrospective) sera ELISA tests ‘Intestinal Diagnostic Ministerio
NICE clinical guideline 86 Coeliac disease: appendix 6.6 Page 33 of 111

S, Ribes-Koninckx C, Genzor C, Gamen S, Pena L, Ortigosa L et al. Immunochromatographic sticks for tissue transglutaminase and antigliadin antibody screening in celiac disease. Clinical Gastroenterology & Hepatology 2004;2:480-4
(286 children, 49 adults)
Children – age range 0.9 to 13 yearsAdults – age range 16 to 65 years
Spain
from adults and children, intestinal biopsy to be performed within 1 month of serum sampling, no dietary restrictions
Exclusion: none reported
(group 2: patients with a known diagnosis of celiac disease on a GFD for >2yrs with serologic analysis – results not included in this table)
IgA/AGA homemade ELISA, or CAP gliadin IgA fluorometric immunoassy ’taking into account the cut-off levels of each method for accurate evaulation of results’
IgA-tTG Celikey, with cut-off of 6IU/ml
Stick tests
tTG2-line immunochromatographic sticks
tTG-AGA3-line immunochromatographic sticks
Stick results read blindly within 20 minuntes of testing by 2 independent observers
Blood for
biopsy’ – no further details
accuracy of the tests
de Ciencia y Tecnoogia, coordinated by the group of the Unidad de Gluten, Centro Nacional de Biotecnolgia, and the Operon Company (inventors of the test)
NICE clinical guideline 86 Coeliac disease: appendix 6.6 Page 34 of 111
serological tests taken within 1 month of the biopsy
Effect size: (CI 95%)
N=172/335 (51%, 142 children – 50% - and 30 adults – 61%) diagnosed with coeliac disease, using ESPGAN criteria
IgA deficiency 0.01% in children only (N=3/286), no cases reported in adults
Of the 121 children and 19 adults with a diagnosis other than coeliac disease (ie biopsy results were normal or minor histological changes of the mucosa), most
frequent diagnoses were cow’s milk protein intolerance, giardiasis, postenteritis syndrome.
PPV, NPV and all confidence intervals calculated from the 2x2 data presented in the paper.
IgA tTG ELISA childrensensitivity 96.4% (93.3 to 99.5), specificity 98.3% (96.1 to 100), PPV 98.5% (96.5 to 100), NPV 96.0% (92.5 to 99.4)2X2:
(a)TP 134
(b)FP 2
(c)FN5
(d)TN119
IgA tTG ELISA adultssensitivity 83.3% (70.0 to 96.7), specificity 94.7% (84.7 to 100), PPV 96.2% (88.8 to 100), NPV 78.3% (61.4 to 95.1)2X2:
(a)TP 25
(b)FP 1
(c)FN5
(d)TN18
IgA/G tTG stick childrensensitivity 97.1% (94.3 to 99.9), specificity 98.3% (96.1 to 100), PPV 98.5% (96.5 to 100), NPV 96.7% (93.6 to 99.9)2X2:
(a) (b)
NICE clinical guideline 86 Coeliac disease: appendix 6.6 Page 35 of 111

TP 135
FP 2
(c)FN4
(d)TN119
IgA/G tTG stick adultssensitivity 83.3% (70.0 to 96.7), specificity 100% (n/a), PPV 100% (n/a), NPV 79.2% (62.9 to 95.4)2X2:
(a)TP 25
(b)FP 0
(c)FN5
(d)TN19
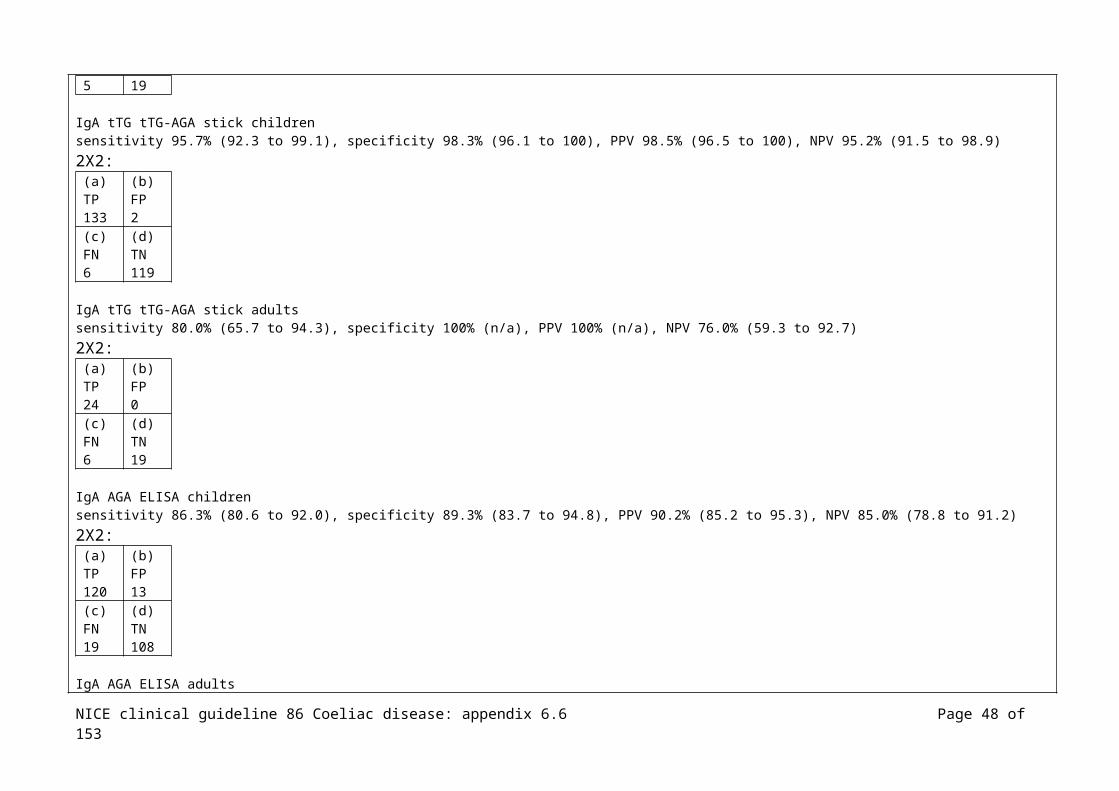
IgA tTG tTG-AGA stick childrensensitivity 95.7% (92.3 to 99.1), specificity 98.3% (96.1 to 100), PPV 98.5% (96.5 to 100), NPV 95.2% (91.5 to 98.9)2X2:
(a)TP 133
(b)FP 2
(c)FN6
(d)TN119
IgA tTG tTG-AGA stick adultssensitivity 80.0% (65.7 to 94.3), specificity 100% (n/a), PPV 100% (n/a), NPV 76.0% (59.3 to 92.7)2X2:
(a)TP 24
(b)FP 0
(c)FN6
(d)TN19
IgA AGA ELISA childrensensitivity 86.3% (80.6 to 92.0), specificity 89.3% (83.7 to 94.8), PPV 90.2% (85.2 to 95.3), NPV 85.0% (78.8 to 91.2)2X2:
(a) (b)
NICE clinical guideline 86 Coeliac disease: appendix 6.6 Page 36 of 111

TP 120
FP 13
(c)FN19
(d)TN108
IgA AGA ELISA adultssensitivity 90.0% (79.3 to 100), specificity 89.5% (75.7 to 100), PPV 93.1% (83.9 to 100), NPV 85.0% (69.4 to 100)2X2:
(a)TP 27
(b)FP 2
(c)FN3
(d)TN17
IgA AGA tTG-AGA stick childrensensitivity 89.2% (84.1 to 94.4), specificity 95.9% (92.3 to 99.4), PPV 96.1% (92.8 to 99.5), NPV 88.5% (83.1 to 94.0)2X2:
(a)TP 124
(b)FP 5
(c)FN15
(d)TN116
IgA AGA tTG-AGA stick adultssensitivity 83.3% (70.0 to 96.7), specificity 100% (n/a), PPV 100% (n/a), NPV 79.2% (62.9 to 95.4)2X2:
(a)TP 25
(b)FP 0
(c)FN5
(d)TN19
IgA tTG+AGA ELISA children (two tests)sensitivity 98.6% (96.6 to 100), specificity 87.6% (81.7 to 93.5), PPV 90.1% (85.4 to 94.9), NPV 98.1% (95.6 to 100)2X2:
(a) (b)
NICE clinical guideline 86 Coeliac disease: appendix 6.6 Page 37 of 111

TP 137
FP 15
(c)FN2
(d)TN106
IgA tTG+AGA ELISA adults (two tests)sensitivity 90.0% (79.3 to 100), specificity 84.2% (67.8 to 100), PPV 90.0% (79.3 to 100), NPV 84.2% (67.8 to 100)2X2:
(a)TP 27
(b)FP 3
(c)FN3
(d)TN16
IgA tTG+AGA stick children (one test)sensitivity 99.3% (97.9 to 100), specificity 95.0% (91.2 to 98.9), PPV 95.8% (92.60 to 99.1), NPV 99.1% (97.5 to 100)2X2:
(a)TP 138
(b)FP 6
(c)FN1
(d)TN115
IgA tTG+AGA stick adults (one test)sensitivity 86.7% (74.5 to 98.8), specificity 100% (n/a), PPV 100% (n/a), NPV 82.6% (67.1 to 98.1)2X2:
(a)TP 26
(b)FP 0
(c)FN4
(d)TN19
Reference Study type/
Number of
Patient characteristics Intervention Comparison Length of follow-up
Outcome measures
Source of
NICE clinical guideline 86 Coeliac disease: appendix 6.6 Page 38 of 111

Evidence level
patients funding
Fraser JS, King AL, Ellis HJ, Moodie SJ, Bjarnason I, Swift J et al. An algorithm for family screening for coeliac disease. World Journal of Gastroenterology 2006;12:7805-9
Cohort N=914
UK
Inclusion: families identified in the GI outpatients, from consultant colleagues, recruitment drive in magazine published by Coeliac UK, total N=151 families, N=73 single affected family, N=78 multiply affected families (range 2-7)
Control; normal control used to set up the parameters for serological testing, healthy and symptom-free lab staff and relatives, age range 24-60yrs; those with any family history of GI problems, diabetes, and auto-immune thyroid disease were excluded
IgA-tTG
Those above the cut off IgA-EMA
IgA-tTG –ve and IgG-tTG +ve had total IgA and IgG1-EMA
Biopsy, those with +ve serological screening
HLA-DQ typing
Coeliac UK, Action Research, German Federal Ministry of Education and Research, European Union
Effect size (all CI 95%):
IgA-tTG antibodies N=60 +ve, of these N=36 IgA-EMA +ve
IgG-tTG antibodies in the absence of IgA-tTG antibodies in N=194, of these N=3 were IgG1-EMA +ve, N=2of these IgA deficient
Singly affected family:- N=73 with coeliac disease, N=223 relatives, N=11 +ve screening, N=11 1st degree relatives
Multiply affected family:- N=232 with coeliac disease, N=691 relatives, N=28 +ve screening, N=22 1st degree relatives, N=2 2nd degree relatives, N=4 not related
Single-affected family relationships:- mother, N=73 tested, N=5 (6.85%) affected- father, N=73 tested, N=4 (5.58%) affected- sibling, N=37 tested, N=2 (5.41%) affected- child, N=18 tested, N=0 affected- uncle/aunt, N=5 tested, N=0 affected- grandparent, N=6 tested, N=0 affected- grandchild, N=2 tested, N=0 affected- nephew/niece, N=3 tested, N=0 affected
NICE clinical guideline 86 Coeliac disease: appendix 6.6 Page 39 of 111
- husband/wife, N=6 tested, N=0 affectedTotal – 5.47% of 1st degree relatives +ve EMA, 0% of 2nd degree relatives (majority of those with coeliac disease in this group were children so not many children of individuals with coeliac disease in this group)
Multiply-affected family relationships:- mother, N=51 tested, N=3 (5.88%) affected- father, N=31 tested, N=3 (9.68%) affected- sibling, N=165 tested, N=9 (5.4%) affected- child, N=137 tested, N=7 (5.11%) affected- uncle/aunt, N=6 tested, N=1 (16.67%) affected- grandparent, N=11 tested, N=0 affected- grandchild, N=39 tested, N=0 affected- nephew/niece, N=67 tested, N=1 (1.49%) affected- 3rd degree or more, N=24 tested, N=0 affected - husband/wife, N=159 tested, N=4 (2.52%) affectedTotal – 5.41% of 1st degree relatives +ve EMA, 1.62% of 2nd degree relatives, N=5 (2.52%) of those related only by marriage to the person with coeliac disease had +ve coeliac antibodies
HLA-typing:N=39 individuals of +ve EMA antibodies had HLA-typing- HLA-type DR3/DRx, N=25 (86.2%)- HLA-type DR3/DR7, N=4 (13.8%)- HLA-type DR5/DR7, DR4, DR3/DR4, DR4/DR7, all N=0
N=35 biopsied, N=32 +ve with partial or sub-total villous atrophy, N=3 normal
Reference Study type/Evidence level
Number of patients
Patient characteristics Intervention Comparison Length of follow-up
Outcome measures
Source of funding
Garampazzi A, Rapa A, Mura S, Capelli A, Valori A, Boldorini R et al. Clinical pattern of celiac disease is still
N=307
Children
Italy
Inclusion: children undergoing oesophagogastroduodenoscopy from 1987 to 2006 were entered on a database from paediatric endoscopy units
Not stated
NICE clinical guideline 86 Coeliac disease: appendix 6.6 Page 40 of 111

changing. Journal of Pediatric Gastroenterology & Nutrition 2007;45:611-4
Effect size:
N=307/2422 undergoing oesophagogastroduodenoscopy had coeliac disease
Numbers diagnosed:1987-1991: N=66/778 (8.5%) with coeliac disease, M/F 25/41, age at diagnosis, median range 6.3 (0.8 to 18)1992-1995: N=113/701 (16.1%) with coeliac disease, M/F 32/81, age at diagnosis 3.1 (0.8 to 16)1996-2000: N=43/386 (11.1%) with coeliac disease, M/F 15/28, age at diagnosis 3.3 (0.9 to 14.7)2001-2006: N=85/557 (15.2%) with coeliac disease, M/F 28/57, age at diagnosis 5.9 (1.1 to 17.4)
Significant difference between the % diagnosed from 1987 to 1995 and 2001 to 2006
Symptoms (typical):1987-1991: failure to thrive N=58 (87%), diarrhoea N=36 (60%), abdominal distension N=16 (24%)1992-1995: failure to thrive N=101 (89%), diarrhoea N=59 (52%), abdominal distension N=44 (39%)1996-2000: failure to thrive N=34 (79%), diarrhoea N=14 (32%), abdominal distension N=9 (21%)2001-2006: failure to thrive N=41 (48%), diarrhoea N=11 (12%), abdominal distension N=17 (20%)
Prevalence of typical symptoms at presentation was significantly higher in 1987-1995 than in 1996-2006, p<0.0001 for failure to thrive, p=0.02 for abdominal distension
Symptoms (atypical):1987-1991: isolated anaemia N=2 (3%), recurrent abdo pain N=7 (11%), constipation N=4 (6%), irregular bowel habits N=3 (4%), family history of CD without symptoms N=3 (5%) 1992-1995: isolated anaemia N=21 (19%), recurrent abdo pain N=12 (11%), constipation N=5 (4%), irregular bowel habits N=5 (4%), family history of CD without symptoms N=01996-2000: isolated anaemia N=2 (5%), recurrent abdo pain N=5 (12%), constipation N=5 (12%), irregular bowel habits N=5 (12%), family history of CD without symptoms N=0 2001-2006: isolated anaemia N=7 (8%), recurrent abdo pain N=18 (21%), constipation N=9 (11%), irregular bowel habits N=4 (5%), family history of CD without symptoms N=9 (10%)
Prevalence of recurrent abdominal pain (p=0.02) was significantly higher in 2001-2006 than in 1987-1995
NICE clinical guideline 86 Coeliac disease: appendix 6.6 Page 41 of 111

Prevalence of children with typical at least 2 or more typical symptoms decreased every 5yrs from 76% in 1987-1990, 63% in 1991-1995, 62% in 1996-2000, 44% in 2001-2006
Reference Study type/Evidence level
Number of patients
Patient characteristics Intervention Comparison Length of follow-up
Outcome measures
Source of funding
Gomez JC, Selvaggio GS, Viola M, Pizarro B, La Motta G, de Barrio S et al. Prevalence of celiac disease in Argentina: screening of an adult population in the La Plata area. American Journal of Gastroenterology 2001;96:2700-4
Cohort N=2000 (offered to N=2011)
Argentina
Inclusion: all couples attending the centralized laboratory for an obligatory prenuptial examination between January 1998-May 2000, were offered participation, mean age 29yr, range 16-79yr, N=996 female
(size of sample was estimated considering a possible prevalence of 0.25%, population of LaPlata area of 643,000; it was calculated that searching 1,280 would be adequate)
IgA/IgG-AGA, those –ve excl
Those +ve for either or both for IgA exclusively tested for IgA EMA
Those +ve for IgG AGA were tested for serum levels of IgA, those with normal total IgA (>200mg/ml) excl, those with low IgA were tested for IgG EMA
Those whose serum samples were +ve for EMA were eligible for small bowel biopsy
The Comision de Investigaciones Cientificas of Buenos Aires Province, Argentina
Effect size:
NICE clinical guideline 86 Coeliac disease: appendix 6.6 Page 42 of 111

N=24; IgA/IgG AGA both +ve- IgA EMA; N=9+ve, N=15-ve
N=190; IgA AGA –ve, IgG AGA +ve- IgA deficit, IgG EMA +ve, N=2- Normal total IgA, N=188
N=23; IgA AGA +ve, IgG AGA –ve - IgA EMA –ve, N=22- IgA EMA +ve, N=1
N=12 who were eligible for an intestinal biopsy, overall prevalence 1:167 (6.0/1000, 95% CI, 3.1 to 10.5)N=8 women, prevalence 1:124, 8.0/1000, 95% CI 3.5 to 15.8N=4 men, prevalence 1:251, 4.0/1000, 95% CI 1.1 to 10.2
N=11/12 had small intestinal biopsy, all were biopsy-proven cases presenting with a flat intestinal mucosa - Median age 26yrs, median body weight 57kgs, median height 165cm, median BMI 21.2 - N=1 chronic diarrhoea, N=3 chronic hypochromatic anaemia, N=8 asymptomatic - N=3 reduced BMI, N=1 +ve family history for coeliac disease
Reference Study type/Evidence level
Number of patients
Patient characteristics Intervention Comparison Length of follow-up
Outcome measures
Source of funding
Greco L, Veneziano A, Di Donato L, Zampella C, Pecoraro M, Paladini D et al. Undiagnosed coeliac disease does not appear to be associated with unfavourable outcome
N=5055
Adults
Italy
Inclusion: pregnant women admitted to one of 14 obstetric and gynaecology wards, from November 2001 to January 2002
Exclusion: non-pregnant women, admission lasting less than 24hrs
Participation rate, 94.64%, sample represented approx 30% of the total 16 500 births expected in the region over this period
IgA anti tissue transglutaminase (TGASE) and endomysial antibodies
Duodenal biopsy not considered feasible by the ethics committee for pregnant women near delivery
Not stated
NICE clinical guideline 86 Coeliac disease: appendix 6.6 Page 43 of 111
of pregnancy. Gut 2004;53:149-51
Effect size:
N=48 TGASE >9 IU, all had +ve EMA and DQ2 or DQ8N=3 with 7-9 IU TGASE had +ve EMA also considered to have CD
N=51 cases considered +ve, N=12 coeliac cases known before screening
Severe anaemia which was x3 more frequent in those with coeliac disease (N=18/51 and N=4/12 vs. N=564/4997, p=0.0045)
No other events significantly different in those with coeliac disease vs. those without coeliac disease
Reference Study type/Evidence level
Number of patients
Patient characteristics Intervention Comparison Length of follow-up
Outcome measures
Source of funding
Green PHR, Fleischauer AT, Bhagat G, Goyal R, Jabri B, Neugut AI. Risk of malignancy in patients with celiac disease. American Journal of Medicine 2003;115:19
Cohort N=381
Adults
USA
Inclusion: patients older than 18yrs, at a hospital which has a referral centre for coeliac disease, N=245, 64% female, age at diagnosis 44±18yrs (SD), duration of symptoms 5±8yrs
Malignancy Not stated
NICE clinical guideline 86 Coeliac disease: appendix 6.6 Page 44 of 111

1-5
Effect size (all CI 95%):
N=43 diagnosed with malignancy, N=34 diagnosed before or simultaneously (during the same month or admission) with coeliac disease
Cancers diagnosed before or simultaneously with coeliac disease:- non-Hodgkin’s lymphoma; N=4 observed, N=0.7 expected, SMR7: 5.3 (2.3 to 13), p<0.001- small bowel; N=3 observed, N=0.1 expected, SMR: 45 (34 to 61), p<0.001- colon; N=3 observed, N=2.6 expected, SMR: 1.2 (0.2 to 7.2), NS (0.80)- oesophageal; N=3 observed, N=0.2 expected, SMR: 16 (9.7 to 26), p<0.001- melanoma; N=4 observed, N=0.8 expected, SMR: 5.0 (2.1 to 12), p<0.001- breast; N=5 observed, N=4.0 expected, SMR: 1.3 (0.2 to 7.2), NS (0.61)- lung; N=2 observed, N=2.8 expected, SMR: 0.7 (0.1 to 7.2), NS (0.64)- total8; N=34 observed, N=14 expected, SMR: 2.4 (0.7 to 8.5), NS (0.16)
Reference Study type/Evidence level
Number of patients
Patient characteristics Intervention Comparison Length of follow-up
Outcome measures
Source of funding
Hopper AD, Hadjivassiliou M, Hurlstone DP, Lobo AJ, McAlindon ME, Egner W et al. What is the role of serologic testing in celiac disease? A prospective, biopsy-confirmed
Cohort/case control
N=2000
Adults (≥16yrs)
UK
Inclusion: consecutive adults referred for gastroscopy without a previous diagnosis of celiac disease at a single endoscopist department from January 2004 to April 2006, N=1167 (58.3%) female, mean age 55.8yrs (range 16 to 94yrs)
Exclusion: known diagnosis of coeliac disease, a coagulopathy (international normalised ratio > 1.3 or platelet count of < 80), active GI bleed or a suspected carcinoma observed during the examination
(group 2: patients with a known diagnosis of celiac disease on a GFD for >1yr undergoing repeat duodenal biopsies and serologic analysis – results not included in
IgA/IgG AGA (ELISA, AESKU Diagnostics)(cut-off > 15 U/mL)
IgA tTG (ELISA, AESKU Diagnostics)(cut-off > 15 U/mL)
IgA EMA (immunofluorescence, primate oesophagus)
Policy of 4 duodenal biopsy specimens from the second part of the duodenum
Marsh criteriaThose with villous atrophy with supporting signs and symptoms were considered to have coeliac disease
Those with villous atrophy (confirmed on a second review of the sample to ensure a well-oriented sample) and a antibody –ve profile were
Not stated
7(? Standardised Morbidity Ratio, ratio of observed to expected)8 Total includes chronic lymphatic leukaemia, ovarian, cervical, liver, prostate, bladder, endometrial, thyroid cancer, Hodgkin’s disease
NICE clinical guideline 86 Coeliac disease: appendix 6.6 Page 45 of 111

study with economic analysis. Clinical Gastroenterology & Hepatology 2008;6:314-20
this table)Total IgA (Behring BN2 nephelometer, Siemens)
Blood for serological tests taken at the same time as the biopsy
classed as seronegative coeliac disease, to confirm this they were required to have DQ2 or DQ* pattern consistent with CD and a clinical and histological response to a GFD
Effect size: (CI 95%)
N=77/1000 diagnosed with coeliac disease (prevalence, all patients attending for gastroscopy of 3.9%); N=29 Marsh 3a, N=30 Marsh 3b, 18 Marsh 3c lesions
IgA deficiency 0.7% (N=14/2000)
Symptoms (coeliac disease vs. non coeliac disease):Weight loss (15.6% vs. 5.3%), p<0.05
Diarrhoea (42.9% vs. 5.2%), p<0.05
Dyspepsia (17.3% vs. 1%), p<0.05
Reflux (13.8% vs 1%), p<0.05
Dysphagia (7.2% vs. 0%), p<0.05
Those with coeliac disease were significantly younger (mean age 48.0 vs. 56.1 yrs), p<0.05, there were significantly more females (70.1% vs. 57.9%), p<0.05, than
those without coeliac disease
IgA tTG sensitivity 90.9% (82.4 to 94.5), specificity 90.9% (89.5 to 92.1), PPV 28.6% (23.3 to 34.5), NPV 99.6% (99.2 to 99.8)2X2:
(a)TP 70
(b)FP 175
(c)FN
(d)TN
NICE clinical guideline 86 Coeliac disease: appendix 6.6 Page 46 of 111

7 1748
IgA EMA sensitivity 87.0% (77.7 to 92.8), specificity 98.0% (97.4 to 98.6), PPV 64.4% (54.9 to 73.0), NPV 99.4% (99.0 to 99.7)2X2:
(a)TP 67
(b)FP 37
(c)FN10
(d)TN1886
If tTG +ve and then EMA +ve (2-step) sensitivity 85.7% (76.2 to 91.8), specificity 98.6% (98.0 to 99.0), PPV 71.7% (61.8 to 79.9), NPV 99.4% (99.4 to 99.0)2X2:
(a)TP 66
(b)FP 26
(c)FN11
(d)TN1897
Both tTG +ve and EMA +ve sensitivity 85.7% (76.2 to 91.8), specificity 98.6% (98.0 to 99.0), PPV 71.7% (61.8 to 79.9), NPV 99.4% (99.4 to 99.0)2X2:
(a)TP 66
(b)FP 26
(c)FN11
(d)TN1897
Either tTG +ve or EMA +ve sensitivity 92.2% (84.0 to 96.4), specificity 90.3% (88.9 to 91.6), PPV 27.6% (22.5 to 33.4), NPV 99.7% (99.3 to 99.8)2X2:
(a)TP 71
(b)FP 186
(c)FN
(d)TN
NICE clinical guideline 86 Coeliac disease: appendix 6.6 Page 47 of 111
6 1737
IgG AGA sensitivity 48.1% (37.3 to 59.0), specificity 95.8% (94.9 to 99.6), PPV 31.6% (23.9 to 40.5), NPV 97.9% (97.1 to 98.4)2X2:
(a)TP 37
(b)FP 77
(c)FN40
(d)TN1849
IgA AGA sensitivity 49.4% (38.5 to 60.2), specificity 89.6% (88.2 to 90.1), PPV 16.0% (11.9 to 21.2), NPV 97.8% (97.0 to 98.4)2X2:
(a)TP 38
(b)FP 200
(c)FN39
(d)TN1723
Both IgA and IgG AGA sensitivity 36.4% (26.5 to 47.5), specificity 98.8% (98.2 to 99.2), PPV 54.9% (41.4 to 67.7), NPV 97.4% (96.7 to 98.1)2X2:
(a)TP 28
(b)FP 23
(c)FN49
(d)TN1900
Using only IgA tTG +ve 245 would have undergone biopsy and 1 in 11 cases of coeliac disease would have been missedUsing only IgA EMA +ve 104 would have undergone biopsy and 1 in 8 cases of coeliac disease would have been missedUsing IgA tTG +ve and then IgA EMA +ve 92 would have undergone biopsy and 1 in 7 cases of coeliac disease would have been missedUsing either IgA tTG +ve or IgA EMA +ve 257 would have undergone biopsy and 1 in 13 cases of coeliac disease would have been missed
Those with partial villous atrophy (Marsh 3a or 3b) had significantly lower mean tTG titre (168.1 U/mL and 165.0 U/mL) than those with total villous atrophy (255 U/mL), p<0.05Those with Marsh 1 or 2 had significantly lower mean tTG titre (27.7 U/mL and 23.0 U/mL) than those with villous atrophy, p<0.05
NICE clinical guideline 86 Coeliac disease: appendix 6.6 Page 48 of 111

EMA sensitivity 79% in partial atrophy, 100% in total atrophy, p<0.01tTG sensitivity 86.0% (Marsh 3a), 100% (Marsh 3c), p<0.05
Reference Study type/Evidence level
Number of patients
Patient characteristics Intervention Comparison Length of follow-up
Outcome measures
Source of funding
Johnston SD, McMillan SA, Collins JS, Tham TC, McDougall NI, Murphy P. A comparison of antibodies to tissue transglutaminase with conventional serological tests in the diagnosis of coeliac disease.[see comment]. European Journal of Gastroenterology & Hepatology 2003;15:1001-4
Cohort N=586
Adults
NI
Inclusion: consecutive adult patients who had undergone serological testing for coeliac disease during the first 18mths of the use of tissue transglutaminase antibody assay (retrospectively analysed), recruited from 5 hospitals in NI, N=220 male, average age 46.6yrs
IgA AGA (ELISA)
EMA (indirect immunoflourescence using monkey oesophagus as the antigen)
tTG (ELISA)
Coeliac disease defined as severe partial villous atrophy, sub-total or total villous atrophy
Not stated
NICE clinical guideline 86 Coeliac disease: appendix 6.6 Page 49 of 111

Effect size:
N=92 (N=33 male, mean age 51.7yrs) had been followed-up with biopsy, identified as the study group
N=29/92 coeliac disease (N=14, 31% male, mean age 52.5yrs), the remaining N=63 acting as controls had normal histology
For N=92 biopsied:Antitransglutaminase antibodies; sensitivity 86%, specificity 84%, PPV 93%, NPV 71%2X2:
(a)TP 25
(b)FP 10
(c)FN4
(d)TN53
Antiendomysial antibodies; sensitivity 90%, specificity 98%, PPV 95%, NPV 96%2X2:
(a)TP 26
(b)FP 1
(c)FN3
(d)TN62
Antigliadin antibodies; sensitivity 76%, specificity 79%, PPV 88%, NPV 63%2X2:
(a)TP 22
(b)FP 13
(c)FN7
(d)TN50
For N=55 in whom there was clinical grounds for biopsy (eg diarrhoea, weight loss, anaemia, family history):Antitransglutaminase antibodies; sensitivity 86%, specificity 76%Antiendomysial antibodies; sensitivity 95%, specificity 100%Antigliadin antibodies; sensitivity 76%, specificity 76%
NICE clinical guideline 86 Coeliac disease: appendix 6.6 Page 50 of 111

Combination of either antiendomysial antibody or tissue transglutaminase antibody positivity gave sensitivity 93%, specificity 83%, PPV 71%, NPV 96%2X2:
(a)TP 27
(b)FP 11
(c)FN2
(d)TN52
Reference Study type/Evidence level
Number of patients
Patient characteristics Intervention Comparison Length of follow-up
Outcome measures
Source of funding
Kocna P, Vanickova Z, Perusicova J, Dvorak M. Tissue transglutaminase-serology markers for coeliac disease. Clinical Chemistry & Laboratory Medicine 2002;40:485-92
Cohort N=1451(a subset from N=2971)
Czech Republic
Inclusion: consecutive samples on which coeliac disease markers had been requested since May 1992, mean age 40.2yrs, N=982 (66%) female, N=510 (34%) male,
IgA/IgG AGA (ELISA, using α-gliadin as antigen)
IgA EMA (indirect immunofluorescence on primate smooth muscle sections)
IgA tTG (ELISA, guinea pig antigen)
Small intestinal biopsy
Ministry of Health and Grant Agency of Charles University, Czech Republic
Effect size:
N=274 biopsied, all coeliac disease markers determined in N=119 cases who were all biopsied, from these sensitivity/specificity markers
NICE clinical guideline 86 Coeliac disease: appendix 6.6 Page 51 of 111

N=50 coeliac disease, N=69 non-coeliac disease (N=7 coeliac disease in remission, N=24 isolated lactase deficiency, N=38 normal small bowel mucosa)
IgA AGA:Sensitivity 84.0%, specificity 71.0%
2X2: (a)TP 42
(b)FP 20
(d)FN8
(c)TN49
IgG AGA:Sensitivity 94.0%, specificity 40.3%
2X2: (a)TP 47
(b)FP 41
(d)FN3
(c)TN28
IgA EMA:Sensitivity 68.0%, specificity 93.5%
2X2: (a)TP 34
(b)FP 4
(d)FN16
(c)TN65
IgA tTG:Sensitivity 88.0%, specificity 64.6%
2X2:
NICE clinical guideline 86 Coeliac disease: appendix 6.6 Page 52 of 111

(a)TP 44
(b)FP 24
(d)FN6
(c)TN45
Two-step screening algorithms based on N=1451 (effectivity % of CD from 50 biopsy-proven caught by the first marker; accuracy I correctly +ve/-ve from all biopsy-proven ranked by first marker; accuracy II calculated for 2-step process using any of two remaining markers)
First step marker Effectivity Accuracy I Number entering second step
Accuracy II
IgA/IgG AGA 96% 0.598 839 0.821 (EMA)0.750 (atTG)
EMA 68% 0.821 115 0.821 (IgA/IgG AGA)0.804 (atTG)
atTG 88% 0.750 323 0.750 (IgA/IgG AGA)0.804 (EMA)
ELISA producer Antigen
sourceCorrelation coefficient (r)
Concordance (%) Cohen’s Number of samples
DPC Human recombinant
0.781 85.0% 0.61 153
Routine method (Genesis)
Guinea pig n/d 84.1% 0.40 1451
Immco Guinea pig 0.509 90.7% 0.45 161Medipan Guinea pig 0.306 57.5% 0.26 40Orgentec Human cells 0.343 80.7% 0.31 119
Reference Study type/Evidence level
Number of patients
Patient characteristics Intervention Comparison Length of follow-up
Outcome measures
Source of funding
NICE clinical guideline 86 Coeliac disease: appendix 6.6 Page 53 of 111
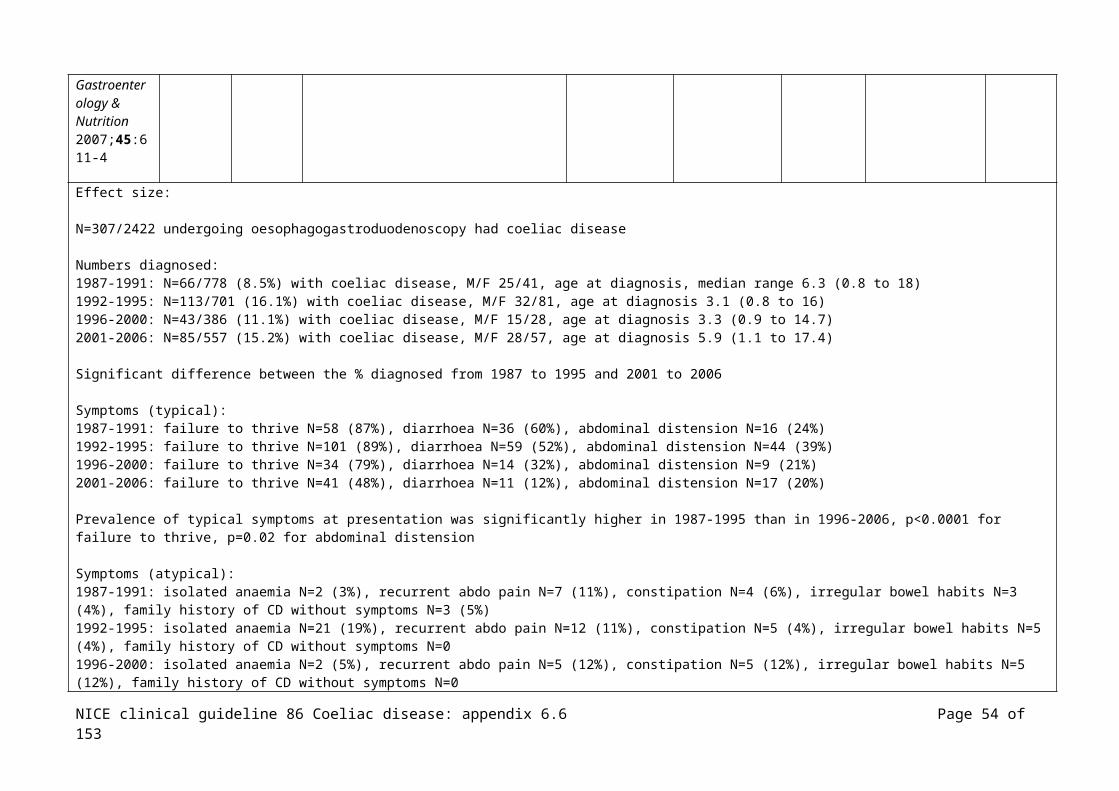
Korponay-Szabo IR, Kovacs JB, Czinner A, Goracz G, Vamos A, Szabo T. High prevalence of silent celiac disease in preschool children screened with IgA/IgG antiendomysium antibodies. Journal of Pediatric Gastroenterology & Nutrition 1999;28:26-30
Cohort N=427
Hungary
Inclusion: apparently healthy, 3-6yr, N=201 female, N=226 male, samples originally obtained for the Hungarian State Institute of Public Health and Health Officer Service of Budapest, children live in the central district of the capital
No known cases of coeliac disease
Collected sera represented 61% of the eligible population
IgA/IgG EMA, indirect immunofluorescence
Those positive IgA/IgG AGA and biopsy
National health Insurance und Administration, the National Institute if Public Health, local authorities of district 5 Budapest
Effect size:
N=6/427 (1.4%) EMA +ve; N=5 strongly +ve, N=1 weakly +ve, N=4 IgA EMA +ve (the 2 –ve cases had IgA deficient sera), N=4 IgG EMA +ve
N=5 (1.17%) severe villous atrophy consistent with coeliac disease
Prevalence of coeliac disease (based only on cases with proven enteropathy) was 1:85 in the study population, 11.6/1000
All celiac cases were IgA-AGA –ve, N=2 with coeliac disease –ve for IgA-AGA and IgG-AGA
None of those with coeliac disease had chronic enteral symptoms or growth retardation, N=2 iron deficiency
(Author note: the sensitivity of AGA tests decreases with age)
NICE clinical guideline 86 Coeliac disease: appendix 6.6 Page 54 of 111

Reference Study type/Evidence level
Number of patients
Patient characteristics Intervention Comparison Length of follow-up
Outcome measures
Source of funding
Leeds JS, Horoldt BS, Sidhu R, Hopper AD, Robinson K, Toulson B, Dixon L, Lobo AJ, McAlindon ME, Hurlstone DP, Sanders DS. Is there an association between coeliac disease and inflammatory bowel diseases? A study of relative prevalence in comparison with population controls. Scandinavian Journal of Gastroenterology 2007;42:1214-1220
Case control
N=354 with IBD, N=173 Crohn’s diseaseN=154 ulcerative colitis
N=305 with coeliac disease
(N=601 control)
Adults
UK
Inclusion: patients registered as having irritable bowel disease in one hospital recruited during attendance at out-patient clinics, N=209 female, median age 45yrs; patients with coeliac disease recruited from the specialist clinic during the annual review, N=222 female, median age 52yrs
Control: recruited from 5 general practices in one region
Those in the coeliac disease group were significantly older than those in the IBD group (p<0.0001) and the control group (p=0.002)
Those with IBD who have coeliac diseaseThose with coeliac disease who have IBD
Unfunded study
NICE clinical guideline 86 Coeliac disease: appendix 6.6 Page 55 of 111
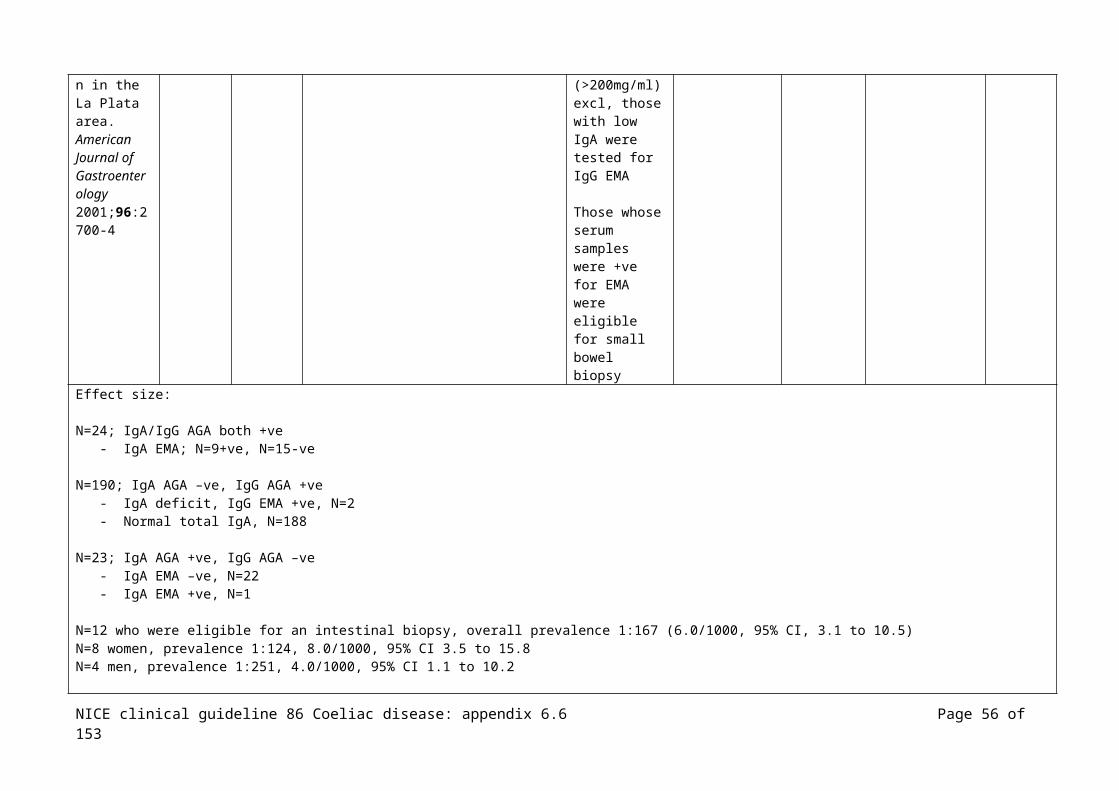
Effect size: Results of those with coeliac disease who had irritable bowel disease – the prevalence of IBD in coeliac disease 3.3% vs. control 0.33%, OR 9.98 (95%CI, 2.8 to 45.9), p=0.0006
Coeliac disease in those with irritable bowel disease, N=3/354 (0.85%) vs. N=5/601 with control, OR 1.02 (95% CI, 0.24 to 4.29), p=1.0 NS
Stepwise logistical regression was performed to identify factors likely to predict the development of coeliac disease in those with IBD, age, gender, disease type (Crohn’s disease or ulcerative colitis) and extent of disease were NS.
Reference Study type/Evidence level
Number of patients
Patient characteristics Intervention Comparison Length of follow-up
Outcome measures
Source of funding
Lenhardt et al (2004) Role of human-tissue transglutaminase IgG and anti-gliadin IgG antibodies in the diagnosis of coeliac disease in patients with selective immunoglobulin A deficiency
Cohort N=126
Children
Italy
Inclusion: total IgA deficiency, referred to paediatric units, N=60 male, N=66 female, median age 10.8yrs (range 2 to 20yrs), from June 1999 to January 2002, all had recurrent respiratory, none were diagnosed with coeliac disease, all were on a normal diet, levels of other immunoglobulin were normal
IgG AGA (immunoenzyme assay)(Eurospital)(manufacturer cut-off <4U/mL)
IgA/IgG htTG (ELISA)(normal values <16% for IgA and <42% for IgG)
HLA typing
Those +ve for either IgG AGA or IgG htTG had intestinal biopsy following the ESPGHAN criteria
Grants from IRCCS ‘Burlo Garofolo’ and MUIR
NICE clinical guideline 86 Coeliac disease: appendix 6.6 Page 56 of 111

Effect size: (CI 95%)
N=27/126 (21%) IgG AGA +veN=18/126 (14%) IgG htTG +ve N=5/27 IgG AGA and IgG htTG +ve , all N=5 CD on biopsy, N=22 normal biopsy
N=10/13 IgG htTG +ve alone biopsied, N=5 CD lesions
N=11 total CD diagnosis, 8.7% of those with IgA deficiency, all N=11 were IgG htTG +ve, N=5 were also IgG AGA +ve
Reference Study type/Evidence level
Number of patients
Patient characteristics Intervention Comparison Length of follow-up
Outcome measures
Source of funding
Liu E, Bao F, Barriga K, Miao D, Yu L, Erlich HA et al. Fluctuating transglutaminase autoantibodies are related to histologic features of celiac disease. Clinical Gastroenterology & Hepatology 2003;1:356-62
Cohort
Children
N=1803 newborns (from N=25000)
First-degree relatives N=773
Type 1 diabetes N=86
USA
Inclusion: children with 2 types of gentic risk for CD: - newborns with HLA-DR3 subgroup selected for prospective monitoring for the development of transglutaminase autoantibodies
- type 1 diabetes
- first-degree relatives of patients with T1D
Exclusion: biopsy specimens inadequate for proper interpretation
A single pathologist who was unaware of the clinical and lab findings interpreted the sample according to Marsh
Transglutaminase autoantibodies (radiobinding assay developed in vitro, +ve and –ve controls were included in every assay, the upper limit of normal was established, all +ve results and a subset of –ve results were retested, if results were discordant a 3rd
aliquot was evaluated and the status determine by 2 of the 3 samples)
Small intestinal biopsy (2 to 4 samples from the distal duodenum)
Serological screening for CD obtained at blood draws at 9, 15, and 24mths and yearly after
Mean follow-up 1.8yrs
Not stated
NICE clinical guideline 86 Coeliac disease: appendix 6.6 Page 57 of 111
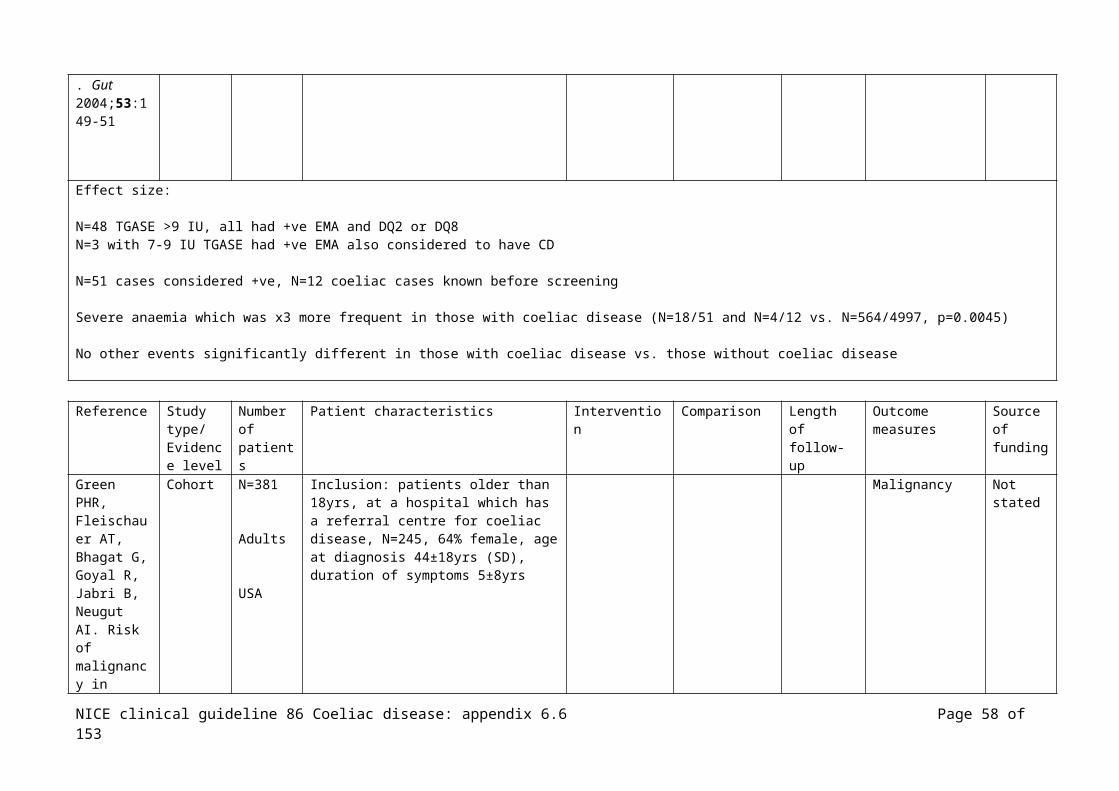
Total IgA (nephelometric method)
Effect size:
Any positive test (TGAA index >0.05) was repeated in 3-6months. Where 2 blood samples drawn on separate visits showed a +ve TGAA result the family was referred to a pediatric gastroenterologist, tTGA was repeated at the time of intestinal biopsy.
Persistent TGAASeropositivity in N=52 (N=25/1083 (2.3%) newborns, N=5/86 (5.8%) with T1D, N=22/773 (2.8%) 1st degree relatives of those with T1D
N=42 biopsied, N=28/42 (67%) CD (Marsh 2 or 3), N=12/42 (29%) normal biopsy, N=2 indeterminate biopsy (Marsh 1)
TGAA remained consistently +ve in N=39/42(93%) Mean age at 1st +ve TGAA (±SD) 4.5 (±1.6) for all:- 4.4±1.4 (N=8) for those with a normal biopsy (N=12); 4.6±1.7 (N=14) for those with a positive biopsy (N=28); NS difference
Correlation between TGAA index at the point of biopsy and the degree of intestinal pathology (Marsh score) - +ve biopsy N=22/28 TGAA titer >0.5, adjusting the TGAA level (index) threshold from 0.05 to 0.5 as a cut off improves PPV from 76% to 96% and decrease NPV from 100% to 65%- N=6/28 TGAA titer below 0.5 (p<0.0001)
TG index (cut off) 0.05 0.1 0.25 0.5 0.75PPV 0.76 0.80 0.89 0.96 1NPV 1 1 0.75 0.65 0.39
2X2 cut off 0.05: (a)TP 28
(b)FP 9
(c)FN0
(d)TN3
2X2 cut off >0.5: (a)TP
(b)FP
NICE clinical guideline 86 Coeliac disease: appendix 6.6 Page 58 of 111

22 1(c)FN6
(d)TN11
Reference Study type/Evidence level
Number of patients
Patient characteristics Intervention Comparison Length of follow-up
Outcome measures
Source of funding
Liu E, Li M, Bao F, Miao D, Rewers MJ, Eisenbarth GS et al. Need for quantitative assessment of transglutaminase autoantibodies for celiac disease in screening-identified children. Journal of Pediatrics 2005;146:494-9
Cohort
Children
N=54 (N=27 T1D
N=14 1st degree relative of T1D N=13 HLA-DQ2
USA
Inclusion: children under 18yrs identified to be at risk for CD based on; T1D; first-degree relative of T1D; at birth expressing HLA-DQ2
Sera from N=10 healthy donors used as –ve control subjects
Exclusion: prior diagnosis of CD and gluten-free diet
TGAA assay (cut off):- RIA (0.05 index)- Inova Quanta Lite (20U)- Eurospital Eu-tTG (7AU/mL- IMMCO (20 EU/mL)- Biofans (15 AU)- Binding site (4U/mL)
Biopsy (2 samples from the proximal and 2 samples from the distal duodenum, in a few cases only one biopsy was obtained from each site
Selected for biopsy on +ve RIA (confirmed by repeat measures)
Serological screening for CD obtained at blood draws at 9, 15, and 24mths and yearly after
Marsh criteria 9
Marsh 1 was considered indeterminate for CD, Marsh 2 and 3 were considered consistent with CD
Conducted without support from any company manufacturing the assays used
Effect size:
Any positive test (TGAA index >0.05) was repeated in 3-6months, referred for evaluation and biopsy when 2 samples drawn on separate visits were TGAA +ve or
9 A single pathologist who was unaware of clinical and lab findings interpreted the sample according to the system described by Marsh
NICE clinical guideline 86 Coeliac disease: appendix 6.6 Page 59 of 111

sooner if requested, TGAA measured at the time of biopsy
N=34 biopsy confirmation of CD, N=20 biopsies without evidence of villous atrophy
Each TGAA assay: (those in bold normal cut-off)- Radioimmunoassay (AUC = 0.8765)
Cut-off 0.05 0.5 0.75 1Sensitivity 100 82 68 38Specificity - 65 95 100
PPV 63 80 95 100NPV - 68 44 49LR - 2.35 12.35 -
2X2 cut off 0.05: (a)TP 34
(b)FP 20
(c)FN0
(d)TN0
- Inova (AUC = 0.8529)Cut-off 20 60 124 140
Sensitivity 97 82 65 56Specificity 20 70 95 100
PPV 67 70 95 100NPV 80 82 61 57LR 1.21 70 12.94 -
2X2 cut off 20: (a)TP 33
(b)FP 16
(c)FN1
(d)TN4
- IMMCO (AUC = 0.8838)Cut-off 20 40 90 121
Sensitivity 91 79 62 59Specificity 70 80 95 100
NICE clinical guideline 86 Coeliac disease: appendix 6.6 Page 60 of 111

PPV 84 87 95 100NPV 82 70 59 59LR 3.04 3.97 12.35 -
2X2 cut off 20: (a)TP 31
(b)FP 6
(c)FN3
(d)TN14
- Biofons (AUC = 0.8676)Cut-off 15 35 70 100
Sensitivity 91 74 65 59Specificity 65 75 95 100
PPV 82 83 56 100NPV 81 63 61 59LR 2.61 2.94 12.94 -
2X2 cut off 15: (a)TP 31
(b)FP 7
(c)FN3
(d)TN13
- Binding site (AUC = 0.8644)Cut-off 4 15 26 30
Sensitivity 91 73 67 15Specificity 47 74 95 100
PPV 75 83 96 100NPV 75 61 62 62LR 1.73 2.76 12.67 -
2X2 cut off 4: (a)TP 31
(b)FP 11
(c)FN
(d)TN
NICE clinical guideline 86 Coeliac disease: appendix 6.6 Page 61 of 111
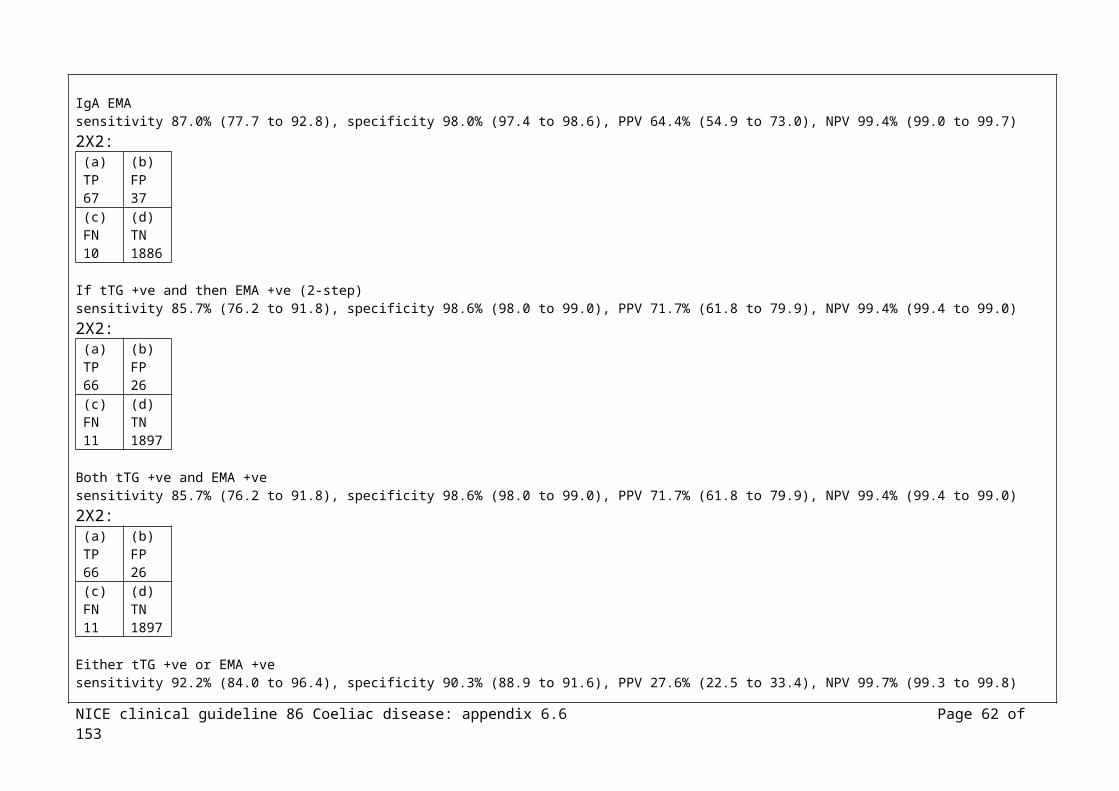
3 9
All samples had high concordance on duplicates for all assays (one exception considered to be human error)In all assays normal control sera were –ve.
N=54 +ve RIA, N=5/54 –ve Inova assay, N=17/54 –ve Euorspital, N=17/54 –ve IMMCO, N=16/54 –ve Biofans, N=12/54 –ve Binding site
Sensitivity when compared with intestinal histology ranged from 91% to 97% for all ELISA assays, specificity ranged from 20% to 70%
Inova and Eurospital more sensitive than IMMCO, Biofans, or Binding site, though Inova was less specific at the normal cut-off values.
Reference Study type/Evidence level
Number of patients
Patient characteristics Intervention Comparison Length of follow-up
Outcome measures
Source of funding
Ludvigsson JF, Montgomery SM, Ekbom A. Celiac disease and risk of adverse fetal outcome: a population-based cohort study. Gastroenterology 2005;129:454-63
Cohort N=2078 with coeliac disease
N=2,822,805 without coeliac disease
Inclusion: women identified with a hospital-based discharge diagnosis of CD from 1964 to 2001, through the Swedish national register10, women and children participants were al-live born single infants from 1973 to 2001 to mothers with coeliac disease aged between 15 to 44yrs
Mothers without a diagnosis of coeliac disease
Women diagnosed prior to infant birth and presumably treated at the time of birth
Women with undiagnosed coeliac disease, diagnosed after infant birth
Low birth weight (<2500g), very low birth weight (<1500g), preterm birth (<37 wks), very preterm birth (<30 wks). Low Apgar score at 5mins (<7), caesarean section, IUGR (weight for age below 2 SD), birth weight, pregnancy duration
Grants from the Orebro Society of Medicine, the Sven Jerring Foundation, Karolinska Institute funds, the Swedish Society of Medicine, the
10 To exclude the possibility that the findings were due to the presence of diabetes mellitus, adjustment was made for the presence of diabetes mellitus in a separate analysis
NICE clinical guideline 86 Coeliac disease: appendix 6.6 Page 62 of 111
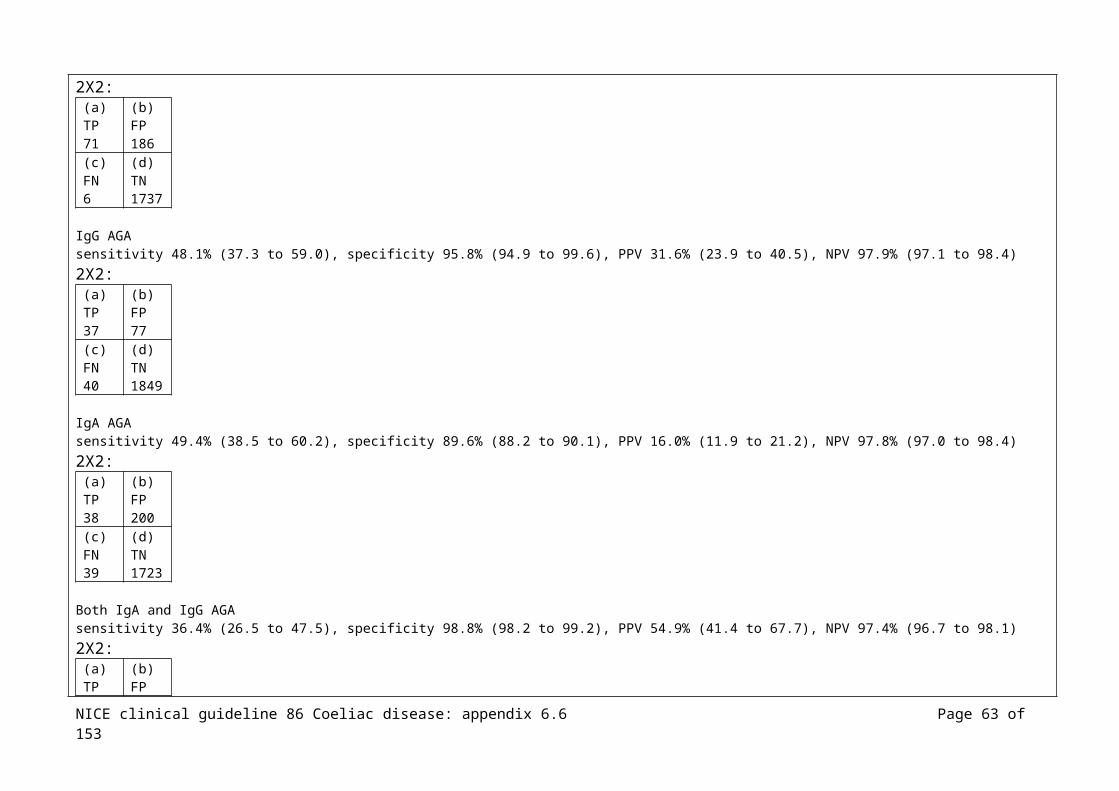
Swedish Research Council, the Majblomman Foundation, Orebro University Hospital
Effect size (all CI 95%):
N=2078 with coeliac disease; N=1149 diagnosed before birth, N=929 undiagnosed (N=255 hospital discharge diagnosis of coeliac disease <5yrs after birth, N=674 diagnosis ≥5yrs after birth)
IUGR; no CD N=88073/2806297 (3.1%) vs. undiagnosed CD N=51/923 (5.5%) (adjusted11 OR 1.62, CI 1.22 to 2.15, p=0.001), CD vs. diagnosed CD (N=39/1141, 3.4%) NS difference
Low birth weight; no CD N=95531/2814664 (3.4%) vs. undiagnosed CD N=65/926 (7.0%) (adjusted OR 2.13, CI 1.66 to 2.75, p<0.001), CD vs. diagnosed CD (N=47/1147, 4.1%) NS difference
Very low birth weight; no CD N=14567/2814664 (0.5%) vs. undiagnosed CD N=11/926 (1.2%) (adjusted OR 2.45, CI 1.35 to 4.43, p=0.003), CD vs. diagnosed CD (N=6/1147, 0.5%) NS difference
Preterm birth; no CD N=139921/2815329 (5.0%) vs. undiagnosed CD N=74/925 (8.0%) (adjusted OR 1.71, CI 1.35 to 2.17, p<0.001), CD vs. diagnosed CD (N=72/1146, 6.3%) NS difference
Very preterm birth; no CD 0.3%, undiagnosed CD 0.6%, diagnosed CD 0.3%, NS difference
Low Apgar score; no CD 1.2%, undiagnosed CD 1.6%, diagnosed CD 1.0%, NS difference
Caesarean section; no CD N=65510/2822693 (2.3%) vs. undiagnosed CD N=32/928 (3.4%) (adjusted OR 1.82, CI 1.27 to 2.60, p=0.001), CD vs. diagnosed CD (N=17/1149, 1.5%) NS difference
Placental weight was significantly lower in women with undiagnosed coeliac disease vs. those without coeliac disease (crude difference -28g (CI, -45 to -10g), p=0.001
(Stratifying by non-smoking and smoking in those with undiagnosed coeliac disease showed some apparent differences, this was further investigated and authors
11 Adjusted for maternal age, parity, nationality, calendar period and infant sex
NICE clinical guideline 86 Coeliac disease: appendix 6.6 Page 63 of 111

concluded that the interaction of smoking with undiagnosed coeliac disease was not evident and did not produce any statistically significant results for any outcomes)
Reference Study type/Evidence level
Number of patients
Patient characteristics Intervention Comparison Length of follow-up
Outcome measures
Source of funding
Ludvigsson JF, Michaelsson K, Ekbom A, Montgomery SM. Coeliac disease and the risk of fractures - a general population-based cohort study. Alimentary Pharmacology & Therapeutics 2007;25:273-85
Hip fractures:N=14187 with coeliac disease
N=68952 without coeliac disease
Any fractures:N=13724 with coeliac disease
N=65627 without coeliac disease
Inclusion: all individuals identified with a hospital-based discharge diagnosis of CD from 1964 to 2003, through the Swedish national inpatient register, N=8311, 58.6% female, 66.0% diagnosed between 0 to 15yrs, 34.0% diagnosed ≥16yrs, 3.5% (1964 to 1973), 27.6% (1974 to 1983), 43.8% (1984 to 1993), 25.1% (1994 to 2003) 12
Reference individuals were matched for age, sex, calendar year and area of residence
Exclusion: those with data irregularities
IPR used to define 2 outcome measures; first hip fracture and first fracture of any type
IPR also used to define diabetes (T1D and T2D), thyroid disease and depression
Grant from the Swedish Society of Medicine, the Juhlin Foundation, the Clas Groschinsky Foundation, the Sven Jerring Foundation, the Orebro Society of Medicine, the Majblomman Foundation, the Karolinska Institutet funds, the
12 80% power to detect increased risk of subsequent hip fracture at 5% significance level in those with CD if more than 190/14187 had a subsequent hip fracture, corresponding to a HR of 1.2
NICE clinical guideline 86 Coeliac disease: appendix 6.6 Page 64 of 111
Swedish Coeliac Society
Effect size (all CI 95%):
Conditional logistic regression estimated the association of coeliac disease and prior hip fracture or prior fractures of any type - increased risk of coeliac disease after hip fracture OR 2.0 (CI: 1.6 to 2.5), p<0.001- increased risk of coeliac disease after any type of fracture OR 1.6 (CI: 1.5 to 1.8), p<0.001
Incidence for hip fractures per 100 000 person-years before and after diagnosis (IR, incidence ratio):- ≥10yrs before diagnosis, no CD 19/100000, CD 37/100000, IR 1.9 (CI: 1.3 to 2.9), p=0.001- 5 to 9.99 yrs before diagnosis, no CD 93/100000, CD 166/100000, IR 1.8 (CI: 1.3 to 2.5), p<0.001- 2 to 4.99 yrs before diagnosis, no CD 181/100000, CD 352/100000, IR 1.9 (CI: 1.4 to 2.6), p<0.001- 0.01 to 1.99 yrs before diagnosis, no CD 310/100000, CD 581/100000, IR 1.9 (CI: 1.4 to 2.5), p<0.001 - 0 to 1.99 yrs after diagnosis, no CD 446/100000, CD 1339/100000, IR 3.0 (CI: 2.4 to 3.7), p<0.001- 2 to 4.99 yrs after diagnosis, no CD 383/100000, CD 871/100000, IR 2.3 (CI: 1.8 to 2.9), p<0.001- 5 to 9.99 yrs after diagnosis, no CD 325/100000, CD 719/100000, IR 2.2 (CI: 1.8 to 2.8), p<0.001- ≥10yrs after diagnosis, no CD 331/100000, CD 565/100000, IR 1.7 (CI: 1.4 to 2.1), p<0.001
Reference Study type/Evidence level
Number of patients
Patient characteristics Intervention Comparison Length of follow-up
Outcome measures
Source of funding
Ludvigsson JF, Elfstrom P, BroomE U, Ekbom A, Montgomery SM. Celiac Disease and Risk of Liver Disease: A General Population-Based Study. Clinical Gastroenterology and
Case control
N=13818 with coeliac disease
N=66584 without coeliac disease
Inclusion: all individuals identified with a hospital-based discharge diagnosis of CD from 1964 to 2003, through the Swedish national inpatient register, N=5710, 41.3% female, 67.4% diagnosed between 0 to 15yrs, 32.6% diagnosed ≥16yrs, 3.5% (1964 to 1973), 27.6% (1974 to 1983), 44.2% (1984 to 1993), 24.8% (1994 to 2003)
Reference individuals were matched for age, sex, calendar year and area of residence
Exclusion: those with data irregularities
Association of coeliac disease with various liver diseases and 2 common symptoms of liver disease (ascites and hepatomegaly)
Grants from the Swedish Research Council, Orebro University Hospital, the Swedish Society of Medicine, the Majblom
NICE clinical guideline 86 Coeliac disease: appendix 6.6 Page 65 of 111

Hepatology 2007;5:63-9
man Foundation, the Juhlin Foundation, the Clas Groschinsky Foundation, the Karolinska Institute funds, the Swedish Coeliac Society
Effect size (all CI 95%):
Coeliac disease and later liver disease – results not reported here
Prior liver disease and coeliac disease13:- acute hepatitis; OR 4.38 (CI: 1.59 to 12.06), p=0.004- chronic hepatitis; OR 5.79 (CI: 3.13 to 10.70), p<0.001- primary sclerosing cholangitis; OR 4.42 (CI: 2.38 to 8.24), p<0.001- fatty liver; OR 5.83 (CI: 1.96 to 17.36), p<0.002- ascites; OR 5.00 (CI: 2.08 to 12.01), p<0.001- liver failure, extended; OR 5.88 (CI: 4.05 to 8.54), p<0.001- liver failure, restricted; OR 8.33 (CI: 1.99 to 34.87), p<0.004- liver cirrhosis/fibrosis; OR 5.83 (CI: 3.86 to 8.81), p<0.001- primary biliary cirrhosis; OR 15.00 (CI: 4.84 to 46.51), p<0.001- hepatomegaly; OR 2.00 (CI: 0.39 to 10.31), NS
Reference Study type/
Number of
Patient characteristics Intervention Comparison Length of follow-up
Outcome measures
Source of
13 Conditional logistic regression estimated the risk of CD with prior liver disease
NICE clinical guideline 86 Coeliac disease: appendix 6.6 Page 66 of 111

Evidence level
patients funding
Ludvigsson JF, Reutfors J, Osby U, Ekbom A, Montgomery SM. Coeliac disease and risk of mood disorders--a general population-based cohort study. Journal of Affective Disorders 2007; 99:117-26
Case control
N=13776with coeliac disease
N=66815 without coeliac disease
Inclusion: all individuals identified with a hospital-based discharge diagnosis of CD from 1973 to 2003, through the Swedish national inpatient register, N=8074, 58.6% female, 67.0% diagnosed between 0 to 15yrs, 33.0% diagnosed ≥16yrs, 29.5% (1973 to 1983), 45.0% (1984 to 1993), 25.4% (1994 to 2003)14
Reference individuals were matched for age, sex, calendar year and area of residence
Exclusion: those with data irregularities
Coeliac disease and mood disorders; depression and bipolar disorder
Grants from the Swedish Research Council, Orebro University Hospital, the Swedish Society of Medicine, the Majblomman Foundation, the Juhlin Foundation, the Clas Groschinsky Foundation, the Karolinska Institute funds, the Swedish Coeliac Society
14 At significance level of 5%, 80% power to detect an increased risk of subsequent depression in those with CD with HR of 1.3 or above, for subsequent bipolar disorder the power to detect an increased HR of 1.5 or above
NICE clinical guideline 86 Coeliac disease: appendix 6.6 Page 67 of 111

Effect size (all CI 95%):
Coeliac disease and subsequent depression, and subsequent bipolar disorder – results not reported here
Conditional logistic regression estimated the association of coeliac disease and prior history of mood disorder- prior depression; OR 2.3 (CI: 2.0 to 2.8), p<0.001- prior bipolar disorder; OR 1.7 (CI: 1.2 to 2.3), p=0.001
Reference Study type/Evidence level
Number of patients
Patient characteristics Intervention Comparison Length of follow-up
Outcome measures
Source of funding
Ludvigsson JF, Olsson T, Ekbom A, Montgomery SM. A population-based study of coeliac disease, neurodegenerative and neuroinflammatory diseases. Alimentary Pharmacology & Therapeutics 2007;25:1317-27
Case control
N=14371 with coeliac disease
N=70096 without coeliac disease
Inclusion: all individuals identified with a hospital-based discharge diagnosis of CD from 1964 to 2003, through the Swedish national inpatient register, N=8442 (58.7%) female, 65.2% diagnosed between 0 to 15yrs old, 34.8% diagnosed ≥16yrs, 3.5% (1964 to 1973), 27.4% (1974 to 1983), 43.8% (1984 to 1993), 25.4% (1994 to 2003)15
Reference individuals were matched for age, sex, calendar year and area of residence
Exclusion: those with data irregularities
Follow-up ended on the date of the first discharge diagnosis of neurological disease, emigration, death or end of the study period (31st
Dec 2003)
Coeliac disease and later neurological disease
Prior neurological disease and coeliac disease
Grants from the Swedish Research Council, Orebro University Hospital, the Swedish Society of Medicine, the Majblomman Foundation, the Juhlin Foundation, the Clas Groschinsky
15 At significance level of 5%, had 80% power to detect increased risk of MS if the HR was ≥2.0, 1.7 for Alzheimer’s disease, 1.5 for Parkinson’s disease, 1.7 for polyneuropathy
NICE clinical guideline 86 Coeliac disease: appendix 6.6 Page 68 of 111
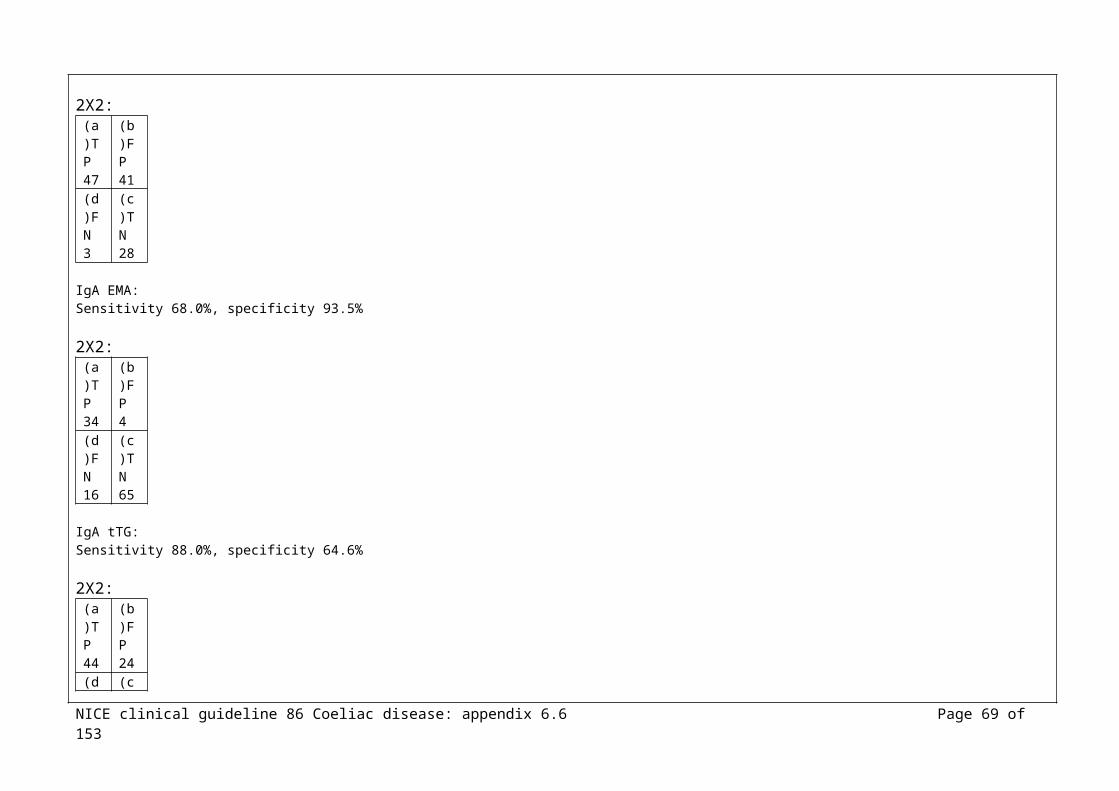
Foundation, the Karolinska Institute funds, the Swedish Coeliac Society
Effect size (all CI 95%):
Those with CD at an increased risk of later polyneuropathy; HR 3.4 (CI, 2.3 to 5.1), p<0.00116, risk estimates NS lower for those diagnosed with CD in childhood (HR 1.4) and those diagnosed in adulthood (HR 3.9)
CD not significantly associated with any other neurological disease; MS (HR: 0.9, CI: 0.3 to 2.3), Parkinson’s disease (HR: 1.2, CI: 0.8 to 1.9), Alzheimer’s disease (HR: 1.5, CI: 0.9 to 2.6), hereditary ataxia (HR: 1.3, CI: 0.5 to 3.6), the symptom ataxia (HR: 1.9, CI: 0.6 to 6.2), Huntington’s disease (HR: 1.7, CI: 0.3 to 8.6), myasthenia gravis (HR: 0.8, CI: 0.2 to 3.8), spinal muscular atrophy (HR: 0.5, CI: 0.1 to 3.8)
Prior polyneuropathy before study entry had increased risk of subsequent CD, OR: 5.4 (CI: 3.6 to 8.2), p<0.001
Other neuro diseases not associated with subsequent CD
NS association between the symptom ataxia and later CD, OR: 2.8 (CI: 0.9 to 8.3)
Reference Study type/Evidence level
Number of patients
Patient characteristics Intervention Comparison Length of follow-up
Outcome measures
Source of funding
Ludvigsson JF, Wahlstrom J, Grunewald J, Ekbom A, Montgomery
Case control
N=14349with coeliac disease
N=69998 without
Inclusion: all individuals identified with a hospital-based discharge diagnosis of CD from 1964 to 2003, through the Swedish national inpatient register, N=5917, 41.2% female, 65.3% diagnosed between 0 to 15yrs, 34.7% diagnosed ≥16yrs, 3.5% (1964 to 1973), 27.4% (1974 to 1983),
Link between coeliac disease and sarcoidosis
Grants from the Swedish Research Council, Orebro Universit
16 Adjustment for those with diabetes mellitus did not affect risk estimate, exclusion of those with a diagnosis of lymphoma did not affect risk estimates
NICE clinical guideline 86 Coeliac disease: appendix 6.6 Page 69 of 111

SM. Coeliac disease and risk of sarcoidosis. Sarcoidosis Vasculitis & Diffuse Lung Diseases 2007;24:121-6
coeliac disease
43.8% (1984 to 1993), 25.3% (1994 to 2003)
Reference individuals were matched for age, sex, calendar year and area of residence
Exclusion: those with data irregularities
y Hospital, the Swedish Society of Medicine, the Majblomman Foundation, the Juhlin Foundation, the Clas Groschinsky Foundation, the Karolinska Institute funds, the Swedish Coeliac Society
Effect size (all CI 95%):
Coeliac disease and subsequent sarcoidosis – results not reported here
Coeliac disease and prior history of sarcoidosis:Conditional logistic regression showed an increased risk in those with prior sarcoidosis; OR 3.58 (CI; 1.98 to 6.45), p<0.001
Reference Study type/Evidence level
Number of patients
Patient characteristics Intervention Comparison Length of follow-up
Outcome measures
Source of funding
NICE clinical guideline 86 Coeliac disease: appendix 6.6 Page 70 of 111

Ludvigsson JF, Olen O, Bell M, Montgomery SM. Coeliac disease and risk of sepsis. Gut 2008;57:1074-1080.
Cohort N=15,533 with coeliac disease
N=14,494 inpatient reference individuals
Inclusion: all individuals identified with a hospital-based discharge diagnosis of CD from 1964 to 2003, through the Swedish national inpatient register, N=8956, 58.4% female, 25.1% diagnosed between 0 to 15yrs, 74.9% diagnosed ≥16yrs, 3.5% (1964 to 1973), 26.4% (1974 to 1983), 42.3% (1984 to 1993), 27.8% (1994 to 2003)
Reference individuals were matched for age, sex, calendar year and country
Exclusion: those with data irregularities
Sepsis Grant from the Swedish Society of Medicine, the Swedish research Council, the Sven Jerring Foundation, the Obrebro Society of Medicine, the Karolinska Institute, the Clas Groschinsly Foundation, the Juhlin Foundationm the Majblomman Foundation, Obrebro University Hospital, the Swedish Coeliac
NICE clinical guideline 86 Coeliac disease: appendix 6.6 Page 71 of 111

Society, the Mjolkdroppen Fund
Effect size (all CI 95%):
Coeliac disease and subsequent sepsis – results not reported here
Conditional logistic regression found an increased risk of subsequent coeliac disease in individuals with prior sepsis; OR 2.2 (1.7 to 3.0), p<0.001
Reference Study type/Evidence level
Number of patients
Patient characteristics Intervention Comparison Length of follow-up
Outcome measures
Source of funding
Ludvigsson JF, Wahlstrom J, Grunewald J, Ekbom A, Montgomery SM. Coeliac disease and risk of tuberculosis: A population based cohort study. Thorax 2007;62:23-8.
Cohort N=14,335 with coeliac disease
N=69,888 without coeliac disease
Inclusion: all individuals identified with a hospital-based discharge diagnosis of CD from 1964 to 2003, through the Swedish national inpatient register, N=8426, 58.8% female, N=9368 diagnosed between 0 to 15yrs, N=4967 diagnosed ≥16yrs, 3.5% (1964 to 1973), 27.3% (1974 to 1983), 43.8% (1984 to 1993), 25.3% (1994 to 2003)
Reference individuals were matched for age, sex, calendar year and country
Exclusion: those with data irregularities
TB Grant from the Swedish Society of Medicine, the Swedish Research Council, the Sven Jerring Foundation, the Orebro Society of Medicine, the Majblomman Foundation, the Swedish
NICE clinical guideline 86 Coeliac disease: appendix 6.6 Page 72 of 111

Coeliac Society
Effect size (all CI 95%):
Coeliac disease and subsequent tuberculosis – results not reported here
Conditional logistic regression found an increased risk of subsequent coeliac disease in individuals with prior tuberculosis; OR 2.5 (1.75 to 3.55), p<0.001
Reference Study type/Evidence level
Number of patients
Patient characteristics Intervention Comparison Length of follow-up
Outcome measures
Source of funding
Melo SB, Fernandes MI, Peres LC, Troncon LE, Galvao LC. Prevalence and demographic characteristics of celiac disease among blood donors in Ribeirao Preto, State of Sao Paulo, Brazil. Digestive Diseases & Sciences 2006;51:1020-5
Cohort N=3000
Brazil
Inclusion: apparently healthy Brazilian blood donors, from Ribeirao Peto, from Sept 2001-Oct 2002, N=15000 male, N=1500 female, aged 18-45yrs (mean 27.9yrs), female 18-24yrs (42.4%), 25-34yrs (32.8%), 35-45yrs (24.8%), male 18-24yrs (32.7%), 25-34yrs (35.4%), 35-45yrs (0.9%)
Significant difference in age between the sexes, women being younger
IgA anti-hTG, ELISA
Those positive had IgA EMA, indirect immunofluorescence
Positive to both, biopsy
Not stated
NICE clinical guideline 86 Coeliac disease: appendix 6.6 Page 73 of 111

Effect size (all CI 95%):
N=13; weakly +ve anti-hTG antibodies (20-30 IU), -ve EMA N=24; moderate/strongly +ve anti-htTG (=30 IU), N=15 of these +ve EMA, N=9 were –ve EMA
N=13/15 biopsied, of these N=2 Marsh 0, N=2 Marsh II, N=4 Marsh III, N=1 Marsh IV
Prevalence of coeliac disease 1:273 (0.36%, 95% CI, 0.15 to 0.58), N=1 male, N=10 female (81.8%)N=9 (77%) GI symptoms; constipation, abdominal pain, feeling of fullness, more than 3 evacuations/day, N=1 had raised transaminanse levelsN=0 extraintestinal disease
Those with coeliac disease vs. those without had significantly higher family history of GI cancer, p<0.05
Reference Study type/Evidence level
Number of patients
Patient characteristics Intervention Comparison Length of follow-up
Outcome measures
Source of funding
Meloni GF, Dessole S, Vargiu N, Tomasi PA, Musumeci S. The prevalence of coeliac disease in infertility. Human Reproduction 1999;14:2759-61
Case control
N=99
Adults
Italy
Inclusion: successive women examined for infertility in a university department of obstetrics and gynaecology, mean age 33.38±4.17yrs, range 26 to 45yrs), between August 1997 to October 1998
Control group used the data from a previous screening study for coeliac disease carried out on a sample of 1607 apparently healthy schoolchildren from the same geographical area, that showed a 1.06% (17/1607) prevalence of histologically proven coeliac disease
IgA/G AGA, ELISA
IgA AEA, indirect immunofluorescence using HU
Total serum IgA measured in those who were IgG AGA +ve and EMA –ve All who tested +ve for at least 2/3 underwent jejunal biopsy, samples taken from the descending part of the
Infertility classed according to a specified protocol
Cut off 7 IU for IgA AGA Cut off 15 IU for IgG AGA
All biopsy samples examined by the same pathologist and classified according to Marsh criteria
Not stated
NICE clinical guideline 86 Coeliac disease: appendix 6.6 Page 74 of 111

duodenum Effect size (all CI 95%):
N=0/99 IgA AGA +veN=4 (4.04%) IgG AGA +ve and IgA AEA +ve, N=3 (3.03%) had histological features of coeliac disease on jejunal biopsy
N=2 with coeliac disease had unexplained infertility
The frequency of coeliac disease was about x3 that in the population as a whole (N=3/99 vs. N=17/1607, NS) With unexplained fertility this was N=2/25 vs. N=17/1607, p=0.037
Reference Study type/Evidence level
Number of patients
Patient characteristics Intervention Comparison Length of follow-up
Outcome measures
Source of funding
Niveloni S, Sugai E, Cabanne A, Vazquez H, Argonz J, Smecuol E et al. Antibodies against synthetic deamidated gliadin peptides as predictors of celiac disease: prospective assessment in an adult population with a high pretest probability of disease. Clinical
Cohort N=141
Adults
Argentina
Inclusion: unselected consecutive adult patients at first attendance at a small bowel disease clinic from December 2004 to December 2005, median age 38yrs (range 16 to 80yrs), N=114 female, N=27 male
Exclusion: previous diagnosis of CD, prior treatment with a GFD, CD-related serology tests performed before enrolment, diagnosis of dermatitis herpetiforms
IgA anti-tissue trasnglutaminase (a-tTG) (Quanta Lite h-tTG IgA, Inova Diagnostic, manufacturer cut-off 20kU/L)
IgG/IgA anti-deamidated gliadin-related peptide (a-DGP)ELISA(Diagnostic cut-off determined in a former study, 20 kU/L)
IgA antiactin antibodies (AAAs)ELISA(according to previous study cut-off was 25
Intestinal biopsy, samples obtained from the distal duodenum following a standard protocol, at least 3 samples were obtained using conventional endoscopic forceps
Categorised on histological criteria (Marsh II lesion or greater)
Consejo de Investigacion en Salud del Ministerio de Salud del Gobierno Autonomo de la Ciudad de Buenos Aires, Argentina
NICE clinical guideline 86 Coeliac disease: appendix 6.6 Page 75 of 111

Chemistry 2007;53:2186-92
kU/L)
Effect size: (CI 95%)
All study participants underwent intestinal biopsy irrespective of the clinical and/or endoscopic findings; serum samples were obtained from all study patients at the time of the endoscopic procedure
Symptoms inducing consultation: chronic diarrhoea (N=114), weight loss (N=115), chronic anaemia (N=95), distension (N=11)
Histology criteria used as gold standard, N=60/141 CD
Mean BMI with CD 19.3 (3.2) kg/cm2, mean without CD 21.5 (4.2) kg/cm2 (p<0.002)
N=3 of those with CD had –ve a-tTG and EmA results, diagnosis supported by improvement of the intestinal mucosa at rebiopsy
IgA a-DGP sensitivity 98.3% (91.0 to 99.7), specificity 93.8% (86.2 to 97.9), PPV 92.2%, NPV 98.7%, PLR 15.9, NLR 0,02 AUC/ROC 0.9952X2 for20kU/L cut-off:
(a)TP 59
(b)FP 5
(c)FN1
(d)TN76
IgG a-DGP sensitivity 96.7% (88.4 to 99.5), specificity 100% (95.5 to 100), PPV 100%, NPV 97.6%, PLR N/R, NLR 0.03 AUC/ROC 0.9892X2 for20kU/L cut-off:
(a)TP 58
(b)FP 0
(c)FN2
(d)TN81
IgA+IgG a-DGP sensitivity 98.3% (91.0 to 99.7), specificity 98.8% (93.3 to 99.8), PPV 98.3%, NPV 98.8%, PLR 79.6, NLR 0.02 AUC/ROC 0.996
NICE clinical guideline 86 Coeliac disease: appendix 6.6 Page 76 of 111

2X2 for20kU/L cut-off: (a)TP 59
(b)FP 1
(c)FN1
(d)TN80
IgA a-tTG sensitivity 95.0% (86.1 to 98.9), specificity 97.5% (91.3 to 99.6), PPV 96.6%, NPV 96.3%, PLR 38.5, NLR 0.05 AUC/ROC 0.9962X2 for20kU/L cut-off:
(a)TP 57
(b)FP 2
(c)FN3
(d)TN79
IgA AAA – results not included in this ET
IgA a-DGP and IgA a-t TGSensitivity 100% (94.0 to 100), specificity 92.6% (84.6 to 97.2), PPV 96.7, NPV 100, PLR 40, NLR 0
IgG a-DPG and IgA a-tTGSensitivity 100% (94.0 to 100), specificity 97.5% (91.3 to 99.6), PPV 96.7, NPV 100, PLR 40, NLR 0
IgA and IgG a-DGP and a-tTG Sensitivity 100% (94.0 to 100), specificity 96.3% (89.5 to 99.2), PPV 95.2, NPV 100, PLR 27.0, NLR 0
Reference Study type/Evidence level
Number of patients
Patient characteristics Intervention Comparison Length of follow-up
Outcome measures
Source of funding
Olen O, Montgomery SM, Elinder G, Ekbom A, Ludvigsson JF.
Case control
N=14347with coeliac disease
N=69967
Inclusion: all individuals identified with a hospital-based discharge diagnosis of CD from 1964 to 2003, through the Swedish national inpatient register, N=8430, 58.8% female, N=9353 diagnosed between 0 to 15yrs, N=4994 diagnosed ≥16yrs, 3.5%
Coeliac disease and immune thrombocytopenic purpura (ITP)
Grants from the Sachs’ Children’s Hospital,
NICE clinical guideline 86 Coeliac disease: appendix 6.6 Page 77 of 111

Increased risk of immune thrombocytopenic purpura among inpatients with coeliac disease. Scandinavian Journal of Gastroenterology 2008;43:416-22
without coeliac disease
(diagnosed 1964 to 1973) 27.4% (1974 to 1983), 43.8% (1984 to 1993), 25.3% (1994 to 2003) 17
Reference individuals were matched for age, sex, calendar year and area of residence
Exclusion: those with data irregularities
Subject information anonymised prior to analysis
Swedish Research Council, Orebro University Hospital, the Swedish Society of Medicine, the Majblomman Foundation, the Juhlin Foundation, the Clas Groschinsky Foundation, the Karolinska Institute funds, the Swedish Coeliac Society
Effect size (all CI 95%):
Coeliac disease and later ITP of any kind or later chronic ITP – results not reported here
Prior immune thrombocytopenic purpura and coeliac disease- prior ITP was a +ve risk factor for subsequent coeliac disease; OR 2.96 (CI; 1.60 to 5.50), p=0.001
17 At a significance level of 5% had a power of 80% to detect a 1.7 fold increased risk of later ITP in those with CD and a 2.7 fold increased risk of later chronic ITP
NICE clinical guideline 86 Coeliac disease: appendix 6.6 Page 78 of 111

- those with prior chronic ITP had a 6-fold increased risk for later CD; OR 6.00 (CI; 1.83 to 19.66), p=0.003- with unspecified thrombocytopenia excluded, ITP of any kind, OR for coeliac disease 1.88 (CI: 0.50 to 7.07), NS; chronic ITP, OR for coeliac disease 15.00
(CI: 1.56 to 144.20), p=0.019
Reference Study type/Evidence level
Number of patients
Patient characteristics Intervention Comparison Length of follow-up
Outcome measures
Source of funding
Oliveira RP, Sdepanian VL, Barreto JA, Cortez AJ, Carvalho FO, Bordin JO et al. High prevalence of celiac disease in Brazilian blood donor volunteers based on screening by IgA antitissue transglutaminase antibody. European Journal of Gastroenterology & Hepatology 2007;19:43-9
Cohort N=3000
Brazil
Inclusion: blood donor volunteers, Sept 2003-July 2004, Sao Paulo, consecutive blood donors, good health, aged 18-65yrs, >50kg, average age 34.4yrs, age range 18-65yrs, N=1500 male
N=9 had anaemia, N=8 male
Exclusion: those who presented the criteria for exclusion established by the blood donation sites
Power calculated on an estimated prevalence of coeliac disease of 0.16%, power at 80%, significance level 5%
Antitissue transglutaminase antibody, ELISA
>10 IU biopsy
Not stated
NICE clinical guideline 86 Coeliac disease: appendix 6.6 Page 79 of 111
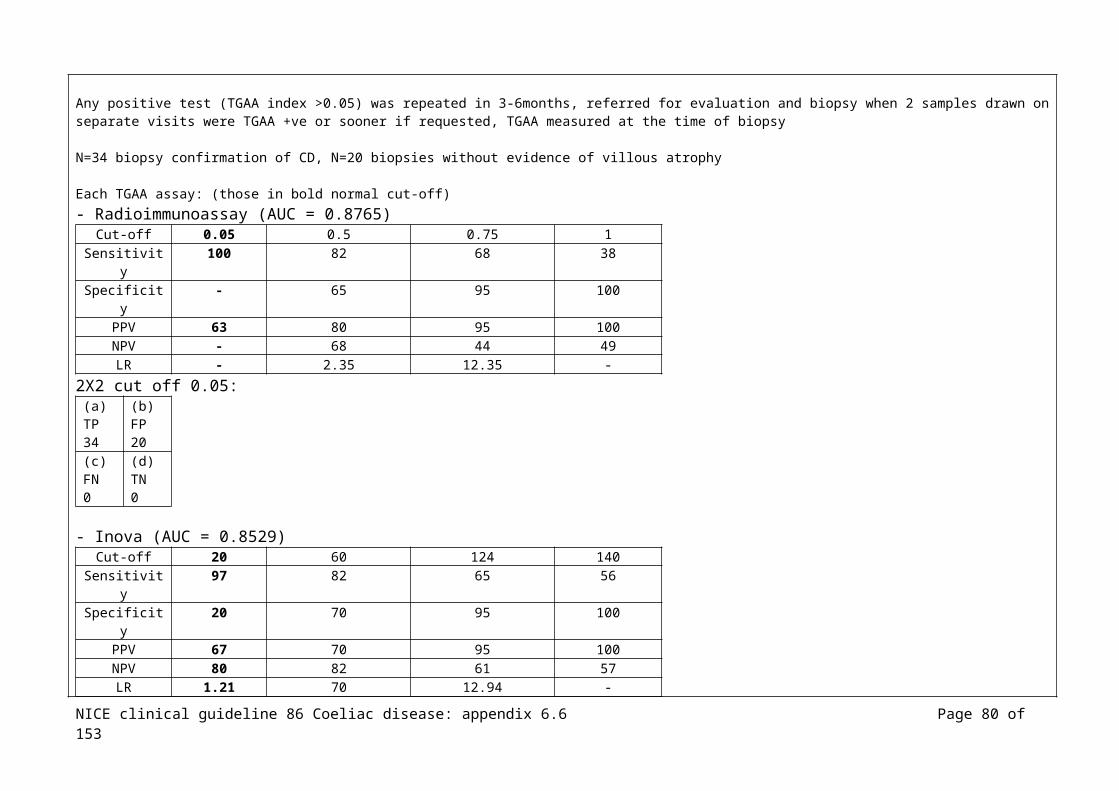
Effect size (all CI 95%):
N=45/3000 (1.5%) +ve, >10 IU/ml; weakly +ve N=94/3000 (3.1%), 4-10 IU/ml
N=21/45 (46.7%) biopsied; N=14/21 (66.7%) Marsh III, N=3/21 (14.3%) Marsh I, N=4/21 (19.0%) normal biopsy
Coeliac disease diagnosis probable N=14/3000, 1 out of every 214 blood donor volunteers
NS difference in the proportion of coeliac disease between female (N=8/1484, 0.54%) and male (N=6/1492, 0.40%) NS difference between those who were white and nonwhite
Reference Study type/Evidence level
Number of patients
Patient characteristics Intervention Comparison Length of follow-up
Outcome measures
Source of funding
Pereira MA, Ortiz-Agostinho CL, Nishitokukado I, Sato MN, Damiao AO, Alencar ML et al. Prevalence of celiac disease in an urban area of Brazil with predominantly European ancestry. World Journal of Gastroenterology 2006;12:6546-50
Cohort N=2086
Brazil
Inclusion: healthy blood donors, Curitiba, from January to December 2001, aged 20-62yrs, mean 33yrs
All serological tests for HIV, hepatitis B, hepatitis C and alanine transaminase were normal
N=1437 (68.88%) male, N=649 (31.12%), mean age 33yrsN=1179 claimed European ancestry
Samples +ve for IgA anti-tTG by ELISA had an immunofluorescence test for IgA EMA using HU Those +ve for both IgA anti-tTG and IgA EMA underwent small bowel endoscopic biopsy in which 4 samples were collected (this is the procedure accepted by ESPGAN for confirmation of a diagnosis of coeliac disease)
NICE clinical guideline 86 Coeliac disease: appendix 6.6 Page 80 of 111

Effect size:
N=6 (N=4 male, N=2 female) +ve for both anti-tTG and EMA N=5 biopsy (N=1 refused)N=3 Marsh IIIb lesions, N=2 Marsh II
Prevalence: Biopsy confirmed coeliac disease: 1:417 among healthy blood donorsConfirmed through EMA prevalence 1:347 among healthy blood donors
(sensitivity anti-tTG 100%, specificity 96%)
Reference Study type/Evidence level
Number of patients
Patient characteristics Intervention Comparison Length of follow-up
Outcome measures
Source of funding
Rampertab SD, Pooran N, Brar P, Singh P, Green PH. Trends in the presentation of celiac disease.[see comment]. American Journal of Medicine 2006;119:355-14
N=590
Adults
USA
Inclusion: all patients presenting to a single medical centre between 1981 and 2004, adults (>16yrs), biopsy-proven coeliac disease, N=401 female, N=189 male, mean age at diagnosis 44.9±18.7yrs (men), 42.7±16.8yrs (women), 25.1% known family history of coeliac disease, 9% initially diagnosed in childhood and subsequently rediagnosed in adults
6 groups based on year of diagnosis:Group 1, before 1981Group 2, between 1981 and 1985Group 3, between 1986 and 1990Group 4, between 1991 and 1995Group 5, between 1996 and 2000Group 6, after 2000
Not stated
Effect size:
Mean duration of symptoms before diagnosis was 4.6±7.5yrs (range 0 to 60yrs)
Diarrhoea presenting manifestation in 46.7%
NICE clinical guideline 86 Coeliac disease: appendix 6.6 Page 81 of 111

There was a significant negative linear trend in the proportion presenting with diarrhoea, from 91.3% before 1981 and 37.2% after 2000 (p<0.001)
There was a significant positive linear trend in the proportion detected by screening 0% groups 1-4 to a mean of 15.2% for the groups 5-6 (p<0.001)
NS difference in time of those presenting with bone disease, anaemia or incidentally at biopsy
Reference Study type/Evidence level
Number of patients
Patient characteristics Intervention Comparison Length of follow-up
Outcome measures
Source of funding
Reeves GE, Squance ML, Duggan AE, Murugasu RR, Wilson RJ, Wong RC et al. Diagnostic accuracy of coeliac serological tests: a prospective study.[see comment]. European Journal of Gastroenterology & Hepatology 2006;18:493-501
Cohort N=254
Mixed (mostly adult, 3.5% children)
Australia
Inclusion: those referred for endoscopic biopsy with symptoms consistent with CD, mean age 47.8 (age range 6 to 82yrs), N=177 female, N=77 male
Exclusion: <4yrs, receiving anticoagulant treatment
IgA TTG
IgG TTG
IgA AGA
IgG AGA
(number of kits used, all test performed according to kit recommendations)
IgA EMA (indirect immunofluroscence)( primate substrate)(Immco)(1:10 considered +ve)
All had endoscopic biopsy
Not stated (kits provided free by several manufacturers)
Effect size:
N=26 biopsy-confirmed coeliac disease, N=228 no biopsy evidence of coeliac disease
NICE clinical guideline 86 Coeliac disease: appendix 6.6 Page 82 of 111

IgA deficiency, those with coeliac disease (N=3, 11.5%), those without coeliac disease (N=24, 10.6%)
IgA EMA:Dual (IgA and IgG????) EMA, monkey bladder; sensitivity (68.4%), specificity (98.6%), AUROC (0.83; 0.73 to 0.94), +ve LR (47.8), -ve LR (0.32) IgA EMA, monkey oesophagus; sensitivity (61.9%), specificity (92.1%), AUROC (0.77; 0.66 to 0.88), +ve LR (7.88), -ve LR (0.48)IgA EMA, monkey bladder; sensitivity (61.9%), specificity (80.0%), AUROC (0.71; 0.60 to 0.82), +ve LR (3.10), -ve LR (0.67)
Results from best performing kits:Dual (IgA and IgG????) EMA; sensitivity (68.4%), specificity (98.6%), AUROC (0.83; 0.73 to 0.94), +ve LR (47.8), -ve LR (0.32) 2X2:
(a)TP 18
(b)FP 3
(c)FN8
(d)TN225
IgA TTG; sensitivity (88.5%), specificity (83.8%), AUROC (0.91; 0.82 to 1.00), +ve LR (5.45), -ve LR (0.14) 2X2:
(a)TP 23
(b)FP 37
(c)FN3
(d)TN191
IgG TTG; sensitivity (84.6%), specificity (89.0%), AUROC (0.88; 0.78 to 0.97), +ve LR (7.72), -ve LR (0.17)2X2:
(a)TP 22
(b)FP 25
(c)FN4
(d)TN203
Dual TTG; sensitivity (92.3%), specificity (%), AUROC (0.92; 0.86 to 0.99), +ve LR (5.40), -ve LR (0.09)2X2:
(a)TP 24
(b)FP 39
NICE clinical guideline 86 Coeliac disease: appendix 6.6 Page 83 of 111
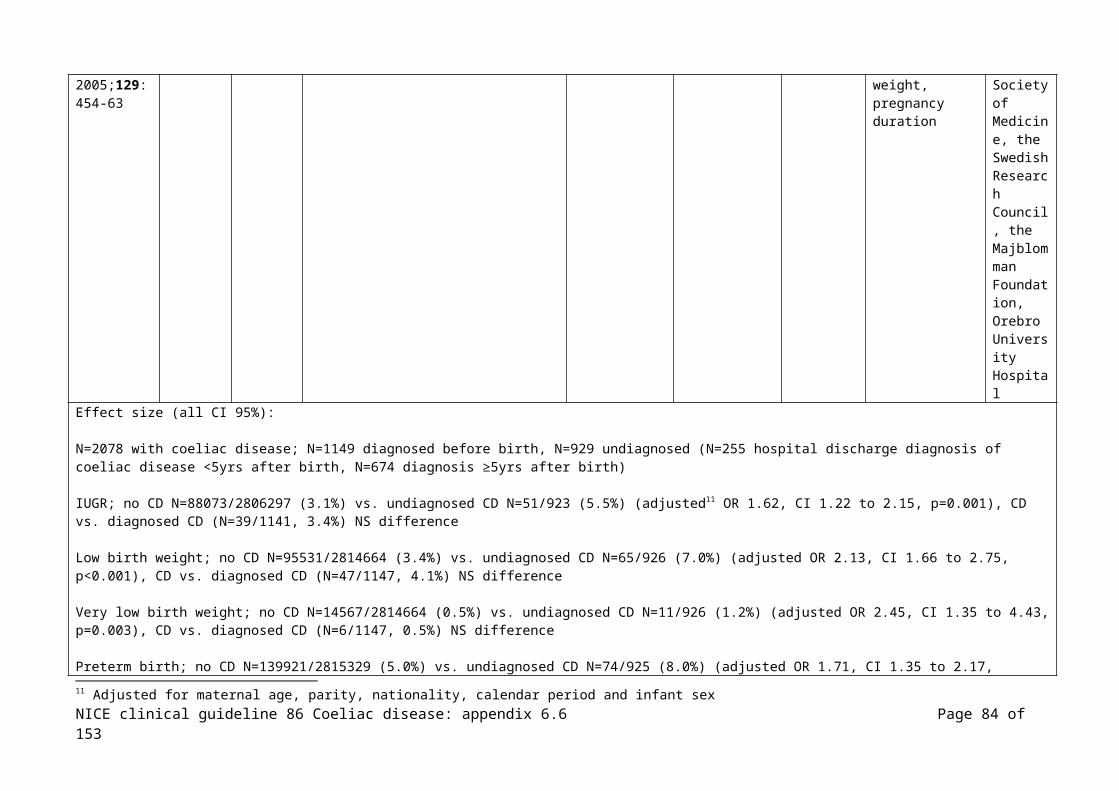
(c)FN2
(d)TN189
IgA AGA; sensitivity (46.2%), specificity (85.1%), AUROC (0.75; 0.65 to 0.86), +ve LR (3.10), -ve LR (0.63)2X2:
(a)TP 12
(b)FP 34
(c)FN14
(d)TN194
IgG AGA; sensitivity (61.5%), specificity (84.1%), AUROC (0.82; 0.74 to 0.89), +ve LR (3.87), -ve LR (0.46)2X2:
(a)TP 16
(b)FP 36
(c)FN10
(d)TN192
IgA def; sensitivity (15.7%), specificity (89.5%), AUROC (0.53), +ve LR (1.50), -ve LR (0.94)2X2:
(a)TP 4
(b)FP 24
(c)FN22
(d)TN204
Reference Study type/Evidence level
Number of patients
Patient characteristics Intervention Comparison Length of follow-up
Outcome measures
Source of funding
Roka V, Potamianos SP,
Cohort N=2230
Greece
Inclusion: apparently healthy individuals recruited after random sampling from the Registry of the Prefecture, data collected
Not stated
NICE clinical guideline 86 Coeliac disease: appendix 6.6 Page 84 of 111

Kapsoritakis AN, Yiannaki EE, Koukoulis GN, Stefanidis I et al. Prevalence of coeliac disease in the adult population of central Greece. European Journal of Gastroenterology & Hepatology 2007;19:982-7
between Oct 2002-Feb 2006, N=1004 male, N=1226 female, mean age 46yrs, range 18-80yrs, 18-25yrs (308, 14%), 26-35yrs (387, 17%), 36-45yrs (400, 18%), 46-55yrs (422, 19%), 56-65yrs (385, 17%), >66yrs (328, 15%)
NS difference were found in age and sex distribution between the participants of the study NS difference between those who consented to participate and those who did not
Exclusion: migrants or minorities to ensure a homogenous population
Sample size considered to be adequate after a power analysis that considered 1% as a possible prevalence rate
Effect size (all CI 95%):
N=2230 (74%) acceptance rate Total IgA normal for all N=2230
N=12; IgA-tTG +ve and IgG-tTG –veN=2210; IgA-tTG -ve and IgG-tTG –veN=0; IgA-tTG +ve and IgG-tTG +veN=8; IgA-tTG -ve and IgG-tTG +ve
Of the N=12 IgA-tTG +ve and IgG-tTG –ve; N=4 EMA +ve, N=8 EMA –ve Of the N=8 IgA-tTG – ve and IgG-tTG +ve; N=0 EMA +ve, N=8 EMA –ve
The N=4 EMA +ve biopsied and HLA typed, all coeliac disease
Prevalence of coeliac disease, 1:558 (0.18%, 1.8/1000, SE 0.13)
Reference Study type/
Number of
Patient characteristics Intervention Comparison Length of follow-up
Outcome measures
Source of
NICE clinical guideline 86 Coeliac disease: appendix 6.6 Page 85 of 111
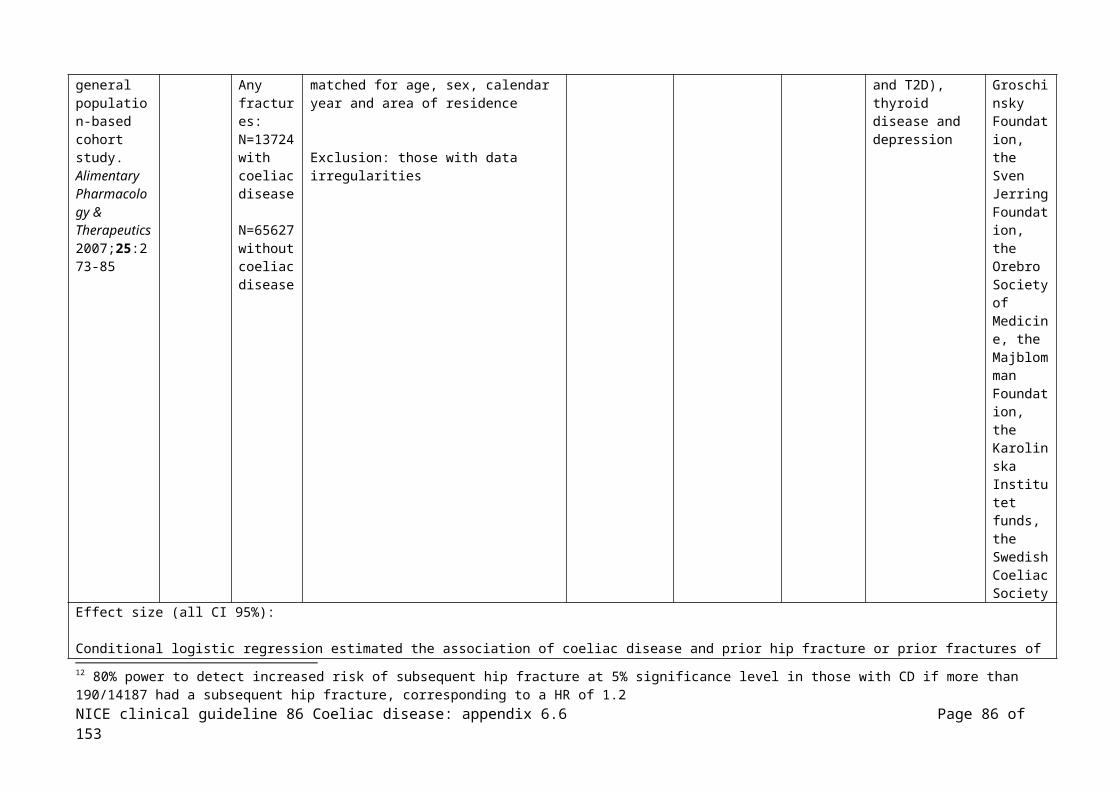
Evidence level
patients funding
Rostami K, Kerckhaert J, Tiemessen R, von Blomberg BM, Meijer JW, Mulder CJ. Sensitivity of antiendomysium and antigliadin antibodies in untreated celiac disease: disappointing in clinical practice.[see comment]. American Journal of Gastroenterology 1999;94:888-94
Case control (CHECK)
N=69 untreated coeliac disease
N=16 controls
Inclusion: untreated coeliac disease, median age 41yrs (range 2 to 76yrs), N=25 male, N=44 female
Controls: first-degree relatives with minor histological abnormalities (Marsh I, II)
Diagnosis of coeliac disease was based on small intestinal biopsy specimens showing the appropriate histopathological features and clinical improvement of GFD, according to diagnostic criteria
18
IgA EMA (verified in 2 labs using monkey oesophagus as substrate in the immunoflurorescence assay)
IgA AGA (enzyme linked immunosorbent assay, ELISA)
Serum IgA levels (levels >25AU/ml was considered elevated)
Small intestinal biopsy sampling was done, minimal requirements were 4 distal duodenal or jejunal biopsies19
Princess Irene Children’s Hospital Foundation
Effect size: (CI 95%)
Histological evaluation:Partial villous atrophy (Marsh IIIa) N=29/69, subtotal villous atrophy (Marsh IIIb) N=23/69, total villous atrophy (Marsh IIIc) N=17/69
Sensitivity:EMA; overall 60% (N=42/69); subgroups with Marsh IIIc 100%; Marsh IIIa N=9/29 (31%), Marsh IIIb N=16/23 (70%) were EMA positive
18 Serum samples and intestinal biopsies were analysed in a blinded fashion 19 Biopsy specimens were evaluated according to Marsh
NICE clinical guideline 86 Coeliac disease: appendix 6.6 Page 86 of 111
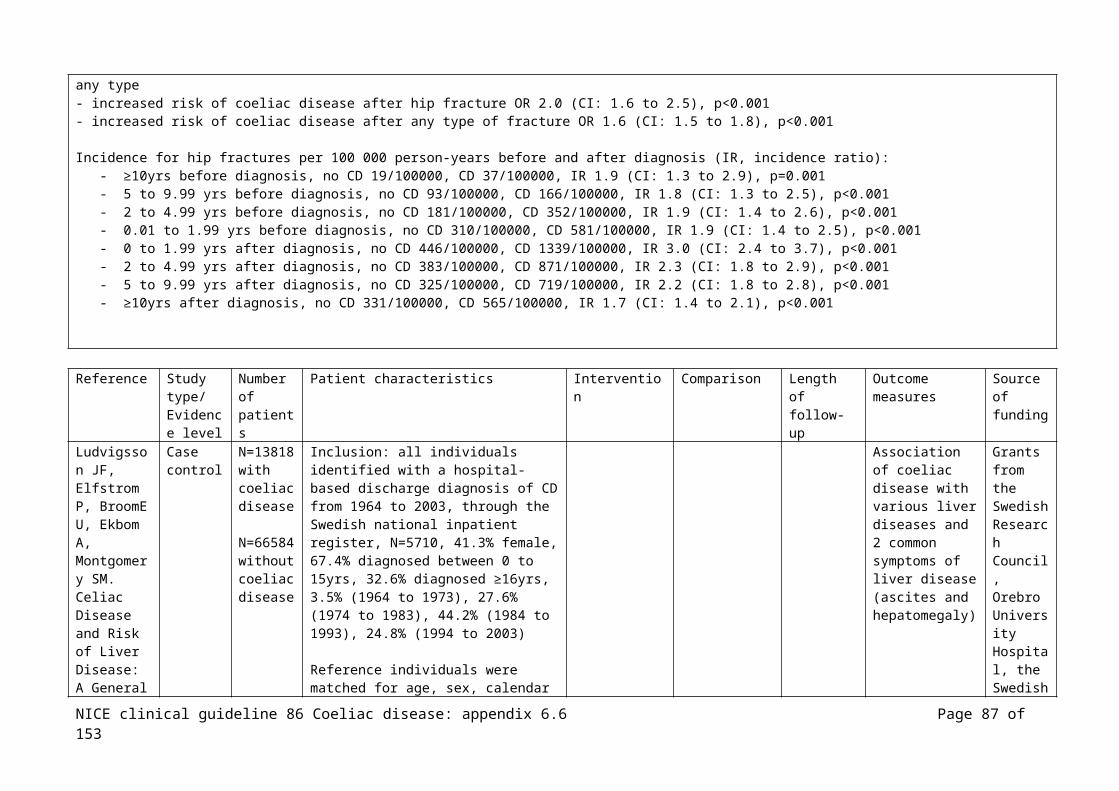
The difference between EMA positive results was significant between Marsh IIIa and Marsh IIIc (p=0.013)
Total IgA, (N=3 had IgA deficiency):AGA positive N=9/29 (31%) with Marsh IIIa, N=16/23 (70%) with Marsh IIIb, N=14/17 (82%) with Marsh IIIc AGA detected in N=39/69 (56%)The difference between Marsh IIIa and Marsh IIIb compared with Marsh IIIc was significant (p<0.01)
IgA EMA 2X2:
(a)TP 42
(b)FP 0
(c)FN27
(d)TN16
IgA AGA 2X2:
(a)TP 39
(b)FP 3
(c)FN30
(d)TN13
Combination of EMA and AGA showed sensitivity of 76% (N=53/69) for all histopathological subgroupsIgA EMA/AGA 2X2:
(a)TP 53
(b)FP 3
(c)FN16
(d)TN13
Reference Study type/
Number of
Patient characteristics Intervention Comparison Length of follow-up
Outcome measures
Source of
NICE clinical guideline 86 Coeliac disease: appendix 6.6 Page 87 of 111

Evidence level
patients funding
Salardi S, Volta U, Zucchini S, Fiorini E, Maltoni G, Vaira B et al. Prevalence of celiac disease in children with type 1 diabetes mellitus increased in the mid-1990 s: an 18-year longitudinal study based on anti-endomysial antibodies. Journal of Pediatric Gastroenterology & Nutrition 2008;46:612-4
Cohort N=331
Children
Italy
Inclusion: consecutive unselected with type 1 diabetes at a paediatric clinic, mean age at diagnosis 8.1±4.3yrs (range 0.08 to 14.9yrs)
Immunological evaluation at diagnosis of diabetes, every 6 to 12mths after (duration 1 to 18yrs, mean 9yrs
EMA (same immunology lab, prospectively 1994 to 2004, retrospectively 1987 to 1993), sensitivity and specificity of test remained constant throughout the study
Coeliac disease Not stated
Effect size (all CI 95%):
N=2/331 previously diagnosed CD
N=29 EMA +ve, N=23 biopsied, N=18 CD (of the N=5 with normal mucose N=2 had subsequent biopsies (N=1 at 1yr, N=1 at 4.5yrs) +ve for CD, the remaining N=3 were –ve at subsequent biopsies (2 to 8yrs))
Overall N=22/331 (6.6%) coeliac disease in those with type 1 diabetes
NICE clinical guideline 86 Coeliac disease: appendix 6.6 Page 88 of 111

1987 to 1994; N=6/180 (3.3%) with coeliac disease1995 to 2004; N=16/151 (10.6%) with coeliac disease
(author’s comment: same screening methods (EMA), all tests carried out in the same reference lab, consistent assay performance, population referring to the clinic did not change over time, suggest that the risk of CD increased in diabetic children after 1994)
Reference Study type/Evidence level
Number of patients
Patient characteristics Intervention Comparison Length of follow-up
Outcome measures
Source of funding
Sanders DS, Hopper AD, Azmy IA, Rahman N, Hurlstone DP, Leeds JS et al. Association of adult celiac disease with surgical abdominal pain: a case-control study in patients referred to secondary care. Annals of Surgery 2005;242 :201-7
Case control
N=300(N=591 control)
Inclusion: consecutive, unselected patients presenting with acute abdominal pain in a university hospital, from November 2002 to November 2003, median age 57yrs (range 16 to 95yrs), N=150 female
Control: recruited from local GR surgeries from those accompanying patients, age and sex matched
Coeliac disease Not stated
NICE clinical guideline 86 Coeliac disease: appendix 6.6 Page 89 of 111
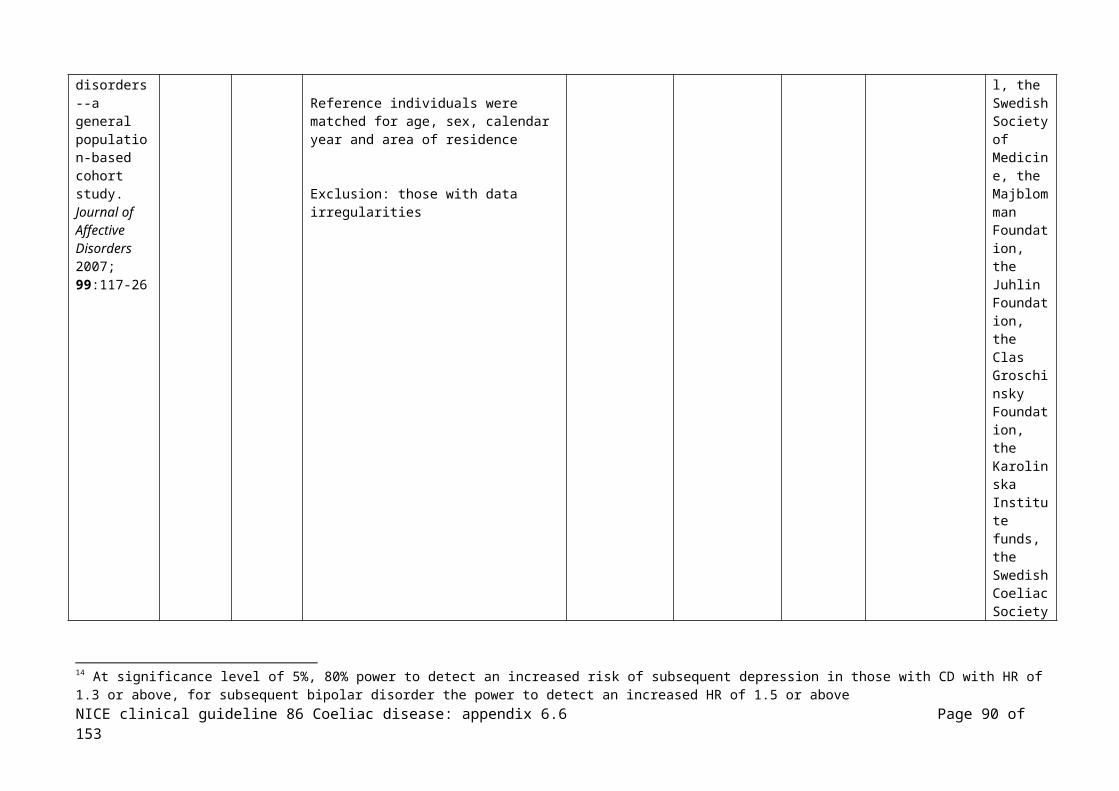
Effect size:
Diagnosis of those with abdo pain: nonspecific abdominal pain N=86 (28.7%), urologic obstruction N=40 (13.3%), medical cause N=29 (9.7%), urologic infection N=27 (9%), abdominal malignancy N=17 (5.7%), miscellaneous urologic cause N=15 (5%), inflammatory bowel disease N=16 (5.3%), diverticular disease N=14 (4.7%), gall stone disease N=13 (4.3%), other >N=10
N=9 (3%) of 300 with acute abdo pain, all had nonspecific abdominal pain so prevalence of CD in those with nonspecific abdo pain 10.5% (N=9/86)OR of having CD whe presenting with acute abdo pain 4.6 (CI: 1.11 to 19.05), NS
Prevalence of coealic disease with nonspecific abdominal pain, p=0.006
Reference Study type/Evidence level
Number of patients
Patient characteristics Intervention Comparison Length of follow-up
Outcome measures
Source of funding
Shahbazkhani B, Malekzadeh R, Sotoudeh M, Moghadam KF, Farhadi M, Ansari R et al. High prevalence of coeliac disease in apparently healthy Iranian blood donors. European Journal of Gastroenterology & Hepatology
Cohort N=2000
Iran
Inclusion: apparently healthy blood donors, Nov 1998-Feb 1999, N=1580 male, N=420 female, mean age 35.5yrs, range 18-65yrs, all Caucasion
Exclusion: IgA deficient cases
All biopsy specimens reviewed by two investigators
Total serum IgA
IgA AGA, ELISA
Those +ve had IgA EMA, immunofluorescence
Both +ve, biopsy
Digestive Disease Research Centre
NICE clinical guideline 86 Coeliac disease: appendix 6.6 Page 90 of 111

2003;15:475-8
Effect size (all CI 95%):
N=49; +ve IgA AGA (N=38 male, N=11 female, mean age 38.6yrs), >20 IU considered +ve Of the N=49, N=12 +ve EMA (N=10 male, N=2 female), of these N=12, N=5 flatulence, N=2 of these occasional dyspepsia, no other major abdominal or extra-abdominal symptoms, N=2 mild anaemia
N=12 biopsies compatible with gluten sensitive enteropathy, N=3 Marsh I, N=4 Marsh II, N=5 Marsh IIIa
Prevalence calculated as 1/116 in asymptomatic blood donors, if only Marsh III (N=5) as the prerequisite then the minimum prevalence is 1/400
Reference Study type/Evidence level
Number of patients
Patient characteristics Intervention Comparison Length of follow-up
Outcome measures
Source of funding
Silano M, Volta U, Mecchia AM, Dessi M, Di Benedetto R, De Vincenzi M et al. Delayed diagnosis of coeliac disease increases cancer risk. BMC Gastroenterology 2007;7:8
Cohort N=1968 Inclusion: those diagnosed with coeliac disease at collaborating centres between 1st January 1982 and 31st March 2005 , N=1485 female, female: male ratio 2.6, mean age at diagnosis 36.2±13.8yrs
Coeliac disease and cancer risk
Not stated
NICE clinical guideline 86 Coeliac disease: appendix 6.6 Page 91 of 111
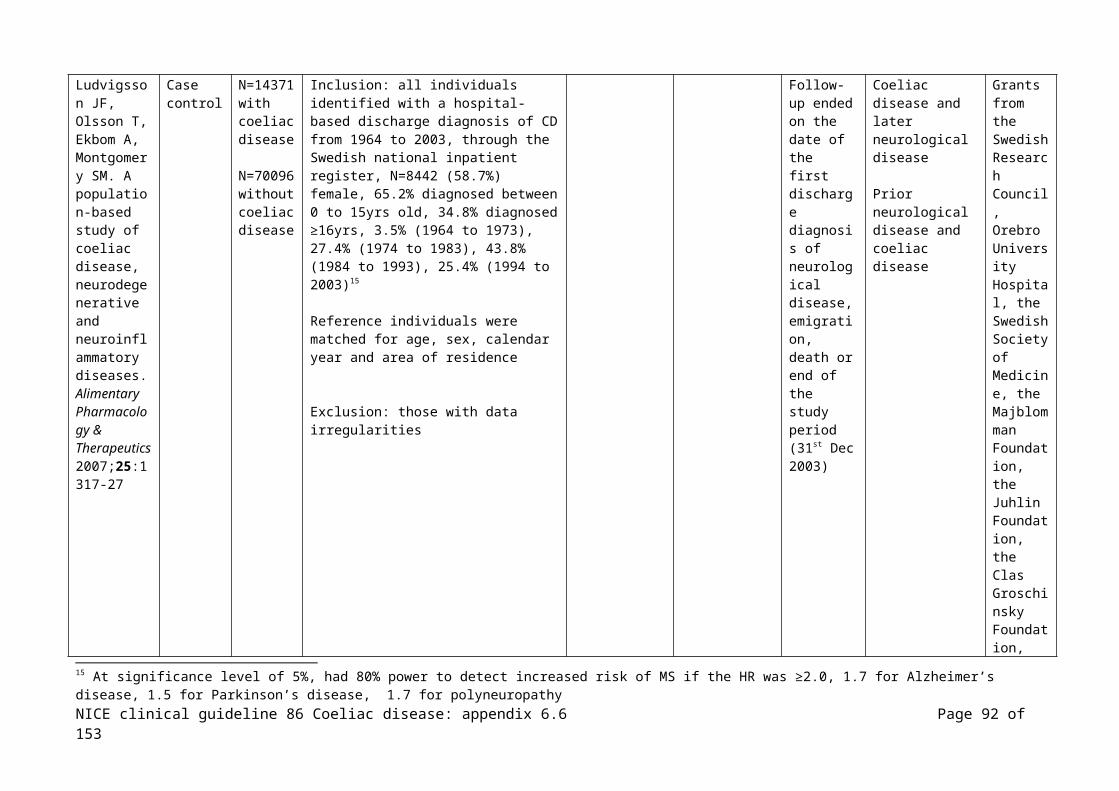
Effect size (all CI 95%):
Mean duration of symptoms before diagnosis of coeliac disease 6±2.2yrs
N=55/1968 (2.09%) diagnosed with cancer before or simultaneously with the diagnosis of coeliac disease compared with 42.1 expected20 (SIR21=1.3, 95% CI: 1.0 to 1.7), p=0.001
Cancer where those with coeliac disease showed a higher risk;- Non-Hodgkin’s lymphoma, observed N=20, expected 4.2, SIR 4.7 (CI: 2.9 to 7.3), p<0.001- colon, observed N=7, expected 6.2, SIR 1.1 (CI: 0.68 to 1.56), p<0.001 - small bowel, observed N=5, expected 0.19, SIR 25 (CI: 8.5 to 51.4), p<0.001- Hodgkin’s lymphoma, observed N=4, expected 0.4, SIR 10 (CI: 2.7 to 25), p=0.01- stomach, observed N=3, expected N=1, SIR 3 (CI: 1.3 to 4.9), p=0.08
Cancer where those with coeliac disease showed a lower risk;- breast, observed N=3, expected N=14, SIR 0.2 (CI: 0.04 to 0.62), p<0.001- others, observed N=13, expected N=12, SIR 1 (CI: 0.9 to 8.5), p=0.06
The mean age at diagnosis of coeliac disease for those diagnosed with cancer before or simultaneously 47.6±10.2yrs which was significantly higher than the age at diagnosis of those who did not develop a malignancy 28.6±18.2yrs
Reference Study type/Evidence level
Number of patients
Patient characteristics Intervention Comparison Length of follow-up
Outcome measures
Source of funding
Szaflarska-Szczepanik A,.Czerwionka-Szaflarska M. The frequency of occurrence and clinical picture of celiac disease in
Cohort N=254
Poland
Inclusion: pairs of parents randomly selected children with celiac disease diagnosed in accordance with the ESPGHAN criteria, 25-58yrs (mean 38.8yrs), 96.1% one child with coeliac disease, N=5 (3.9%) two siblings with coeliac disease
Total IgA
IgA/IgG EMA, indirect immunofluorescence
Those +ve biopsied
Not stated
20 Expected number of malignancies calculated in eah sex and 5-yr stratum of the population by multiplying the number of patients in each stratum by the site specific incidence rate from WHO Globoscan 200221 Standardised Incidence Ratio, ratio of the observed to the expected cases
NICE clinical guideline 86 Coeliac disease: appendix 6.6 Page 92 of 111

the parents of children with the disease. Medical Science Monitor 2001;7:971-6
Effect size (all CI 95%):
IgA normal in all
N=5 (2%) IgA EMA +ve, N=3 male
IgA EMA varied within the limits of +20 IF to +640 IF
N=4/5 biopsied, all had atrophy of the villi of the mucous membrane in the small intestine, class IV (N=3) or class III/IV
N=3 abdominal pains, N=3 short stature, N=1 no symptoms
Reference Study type/Evidence level
Number of patients
Patient characteristics Intervention Comparison Length of follow-up
Outcome measures
Source of funding
Vestergaard P,.Mosekilde L. Fracture risk in patients with celiac Disease, Crohn's disease, and ulcerative colitis: a nationwide follow-up study of 16,416
Case control
N=1021 with coeliac disease
Adults
Denmark
Inclusion: all patients diagnosed with new cases of coeliac disease between 1st January 1983 and 31st December 1996, fracture occurrence assessed between 1980 and 1996, identified through the National Patient Discharge Register, N=588, 58% males, N=433, 42% females, mean age at diagnosis 31.5yrs (SD 24.7),
Exclusion: those not residing in Denmark
Controls: drawn randomly from the background population, 3 age and gender matched controls for each patient
Fracture risk Aarhus University Research Foundation
NICE clinical guideline 86 Coeliac disease: appendix 6.6 Page 93 of 111

patients in Denmark. American Journal of Epidemiology 2002;156:1-10
Effect size (all CI 95%):
Results for Crohn’s disease and ulcerative colitis not reported here
Fracture risks before diagnosis: - all fractures, N=24 cases, N=103 controls, IRR 0.70 (0.45 to 1.09)- skull and jaws, N=0 cases, N=5 controls, IRR 0- spine, rib and pelvis, N=5 cases, N=7 controls, IRR 2.14 (0.70 to 6.57)- upper arm, N=24 cases, N=103 controls, IRR 0.70 (0.45 to 1.09)- forearm, N=7 cases, N=17 controls, IRR 1.23 (0.51 to 2.97)- Colles’ fracture, N=4 cases, N=6 controls, IRR 2.00 (0.58 to 6.91)- hand and finger, N=2 cases, N=4 controls, IRR 1.50 (0.28 to 8.09)- hip and femur, N=7 cases, N=29 controls, IRR 0.72 (0.32 to 1.65)- femoral neck, N=5 cases, N=21 controls, IRR 0.71 (0.27 to 1.89)- lower leg, N=4 cases, N=32 controls, IRR 0.37 (0.14 to 1.02)- foot, N=0 cases, N=2 controls, IRR 0 - osteoporosis, N=1 cases, N=1 controls, IRR 3.00 (0.21 to 41.91)
Patients with coeliac disease had no increase in fracture risk before or after diagnosis, age was the only significant risk factor (risk estimate 1.02, CI: 1.01 to 1.03)
Reference Study type/Evidence level
Number of patients
Patient characteristics Intervention Comparison Length of follow-up
Outcome measures
Source of funding
Vilppula A, Collin P, Maki M, Valve R, Luostarinen M, Krekela I et al.
N=2815
Adults
Inclusion: 66% of the N=4242 from the original GOAL study (Good Ageing in the Lahti region) which included randomly selected individuals in the years 1946-1950, 1936-1940 and 1926-1930 living in a hospital district, study sample was representative of the general population in
Competitive Research Funding of the Pirkanmaa
NICE clinical guideline 86 Coeliac disease: appendix 6.6 Page 94 of 111
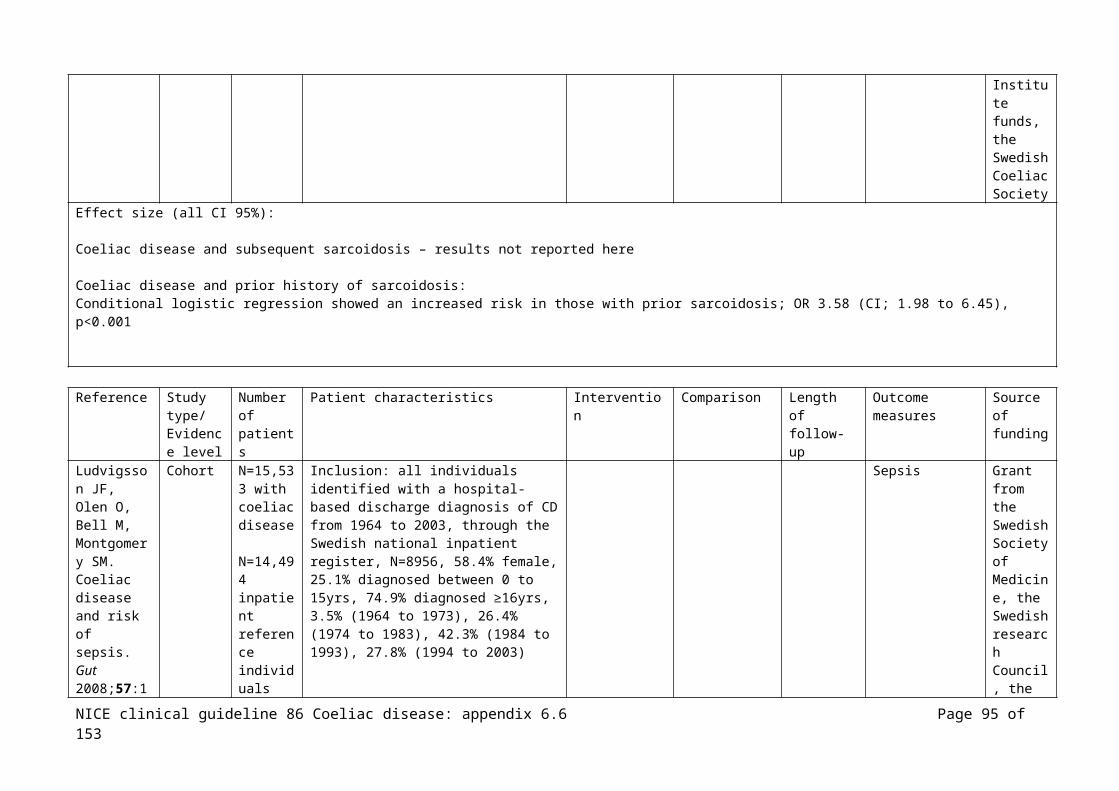
Undetected coeliac disease in the elderly: a biopsy-proven population-based study. Digestive & Liver Disease 2008;40:809-13
Finland the respective age groups, age 52 to 74yrs
Hospital District and Paijat-Hame Central Hospital and the Academy of Finland
Effect size (all CI 95%):
N=25 (0.89%)/2815 had previously established coeliac disease
N=44 tTG and EMA +ve, N=39 biopsied, N=35 coeliac disease, total frequency of coeliac disease in the elderly population was N=60/2815, 2.13% (CI: 1.60 to 2.67)
Symptoms:- diarrhoea N=15 (N=14 clinically detected, N=1 screen detected)- weight loss N=10 (N=9 clinically detected, N=1 screen detected)- anaemia or malabsorption N=14 (N=10 clinically detected, N=4 screen detected)- dermatitis herpetiformis (N=6 clinically detected)- abdominal pain, distension, flatulence N=19 (N=5 clinically detected, N=14 screen detected)- occasional diarrhoea or loose stools N=13 (N=4 clinically detected, N=9 screen detected)- fatigue N=5 (N=2 clinically detected, N=3 screen detected)- blisters in mouth N=2 (N=2 screen detected)- no symptoms N=20 (N=20 screen detected)
Associated conditions:- lymphoma N=2 (N=2 clinically detected)- carcinoma of stomach N=2 (N=1 clinically detected, N=1 screen detected)- ovarian cancer N=1 (N=1 screen detected)- autoimmune thyroid disease N=8 (N=1 clinically detected, N=7 screen detected)- Sjogren’s syndrome N=1 (N=1 clinically detected)- pernicious anaemia N=2 (N=1 clinically detected, N=1 screen detected)- Type 1 diabetes N=1 (N=1 screen detected)- psoriasis N=3 (N=3 screen detected)
NICE clinical guideline 86 Coeliac disease: appendix 6.6 Page 95 of 111
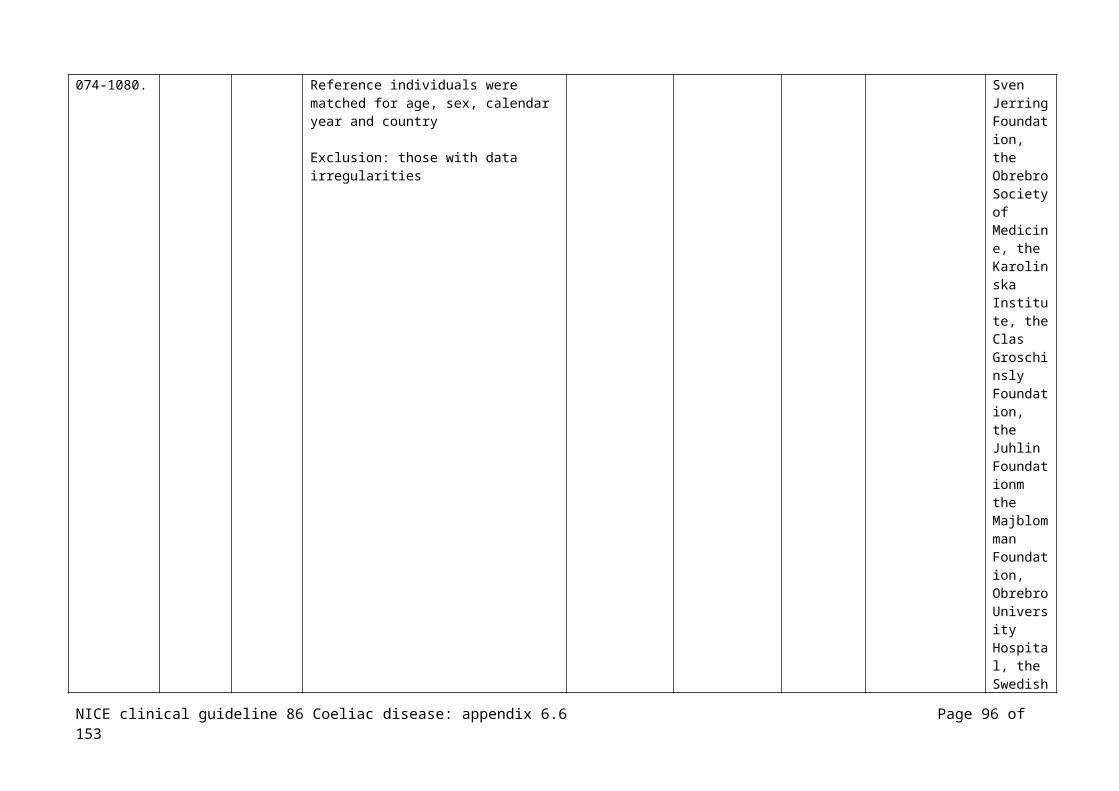
Reference Study type/Evidence level
Number of patients
Patient characteristics Intervention Comparison Length of follow-up
Outcome measures
Source of funding
Viola L, Lugli L, Melegari A, Marotti E, Amarri S, Balli F. Antitransglutaminase enzyme-linked immune-adsorbed assay in coeliac disease diagnosis: evaluation of a diagnostic algorithm. Pediatria Medica e Chirurgica 2004;26:126-31
Cohort/case control??
N=91
(N=23 coeliac disease controls, results not reported here)
Children
Italy
Inclusion: symptoms suggestive of coeliac disease referred to a paediatric clinic, N=51 male, N=40 female, median age 6.1yrs (range 1 to 18yrs)
IgA values were normal for all participants
IgA/IgG AGA (ELISA, Eurospital)(cut-off, ≥15 index were considered positive)
IgA EMA (indirect immunoflourescence, monkey oesophagus, Eurospital)(tests considered +ve where there was fluorescence observed)
IgA tTG (ELISA, Eurospital, guinea pig)(cut off, ≥ 7 AU were considered +ve)
Duodenojejunal biopsy in those with +ve AGA and/or EMA
Not stated
Effect size: (CI 95%)
All participants had EMA and IgA tTG, those under 4yrs also had IgA/IgG AGA
N=31/91 (34.1%) IgA tTG +ve, N=29/92 (31.9%) EMA +ve, N=27 biopsy confirmed CD
N=4 +ve IgA tTG and –ve EMA, none had biopsy confirmed coeliac disease
NICE clinical guideline 86 Coeliac disease: appendix 6.6 Page 96 of 111

IgA AGA; those without CD 2.74 (2.00 to 3.75), those with CD 5.73 (3.19 to 10.28), p=0.015IgG AGA; those without CD 12.09 (8.73 to 16.76), those with CD 23.51 (14.26 to 38.76), p=0.022IgA tTG; those without CD 1.24 (0.92 to 1.67), those with CD 11.10 (2.51 to 7.81), p<0.001
IgA tTGsensitivity 93.1%, specificity 93.6%, PPV 87.1%, NPV 96.7% 2X2 for ≥ 7 AU cut-off:
(a)TP 27
(b)FP 4
(c)FN2
(d)TN58
EMAsensitivity 93.1%, specificity 96.7%, PPV 93.1%, NPV 96.7% 2X2 for EMA +ve:
(a)TP 27
(b)FP 2
(c)FN2
(d)TN60
IgA AGAsensitivity 31.8%, specificity 81.0%, PPV 46.7%, NPV 69.4% 2X2 for index ≥ 7cut-off:
(a)TP 7
(b)FP 8
(c)FN15
(d)TN34
IgG AGAsensitivity 68.2%, specificity 59.5%, PPV 46.9%, NPV 78.1% 2X2 for index ≥ 15 cut-off:
NICE clinical guideline 86 Coeliac disease: appendix 6.6 Page 97 of 111

(a)TP 15
(b)FP 17
(c)FN7
(d)TN25
Age ≤ 2yrs:IgA tTG; sensitivity 90.9%, specificity 93.8%, PPV 90.9%, NPV 93.8% IgA EMA; sensitivity 90.9%, specificity 93.8%, PPV 90.9%, NPV 93.8% IgA AGA; sensitivity 37.5%, specificity 72.7%, PPV 50.0%, NPV 61.5% IgG AGA; sensitivity 75.0%, specificity 45.5%, PPV 50.0%, NPV 71.4%
Age > 2yrs:IgA tTG; sensitivity 94.4%, specificity 93.5%, PPV 85.0%, NPV 97.7% IgA EMA; sensitivity 94.4%, specificity 97.8%, PPV 94.4%, NPV 97.8% IgA AGA; sensitivity 28.6%, specificity 83.9%, PPV 44.4%, NPV 72.2% IgG AGA; sensitivity 64.3%, specificity 64.5%, PPV 45.0%, NPV 80.0%
Evidence tables below are for those with specified conditions who were tested for the presence of coeliac disease. Note; assumption that all studies have CD confirmed by ESPGAN or biopsy and having used AGA, EMA or tTG tests – otherwise studies were excluded; all CI 95%
Reference Study type/Evidence level
Number of patients
Patient characteristics Intervention Comparison Outcome measures
Effect size Source of funding
Bonamico M, Mariani P, Danesi HM, Crisogianni M, Failla P, Gemme G et al. Prevalence and clinical
Cohort N=1202(N=1110 children, N=92 adults)
Mixed
Inclusion: consecutively enrolled patients with Down Syndrome enrolled by the Italian Society of Paediatric Gastroenterology and Hepatology and the Clinical Genetics Group of the Italian Society of Paediatrics, N=1110 children; aged 15mths to 18yrs, N=92 adults; 18 to 46yrs, N=609 males, N=593 females
Coeliac disease
N=55 (N=48 children, N=7 adults)(4.6%) with CD
N=55 with CD had higher
Not stated
NICE clinical guideline 86 Coeliac disease: appendix 6.6 Page 98 of 111
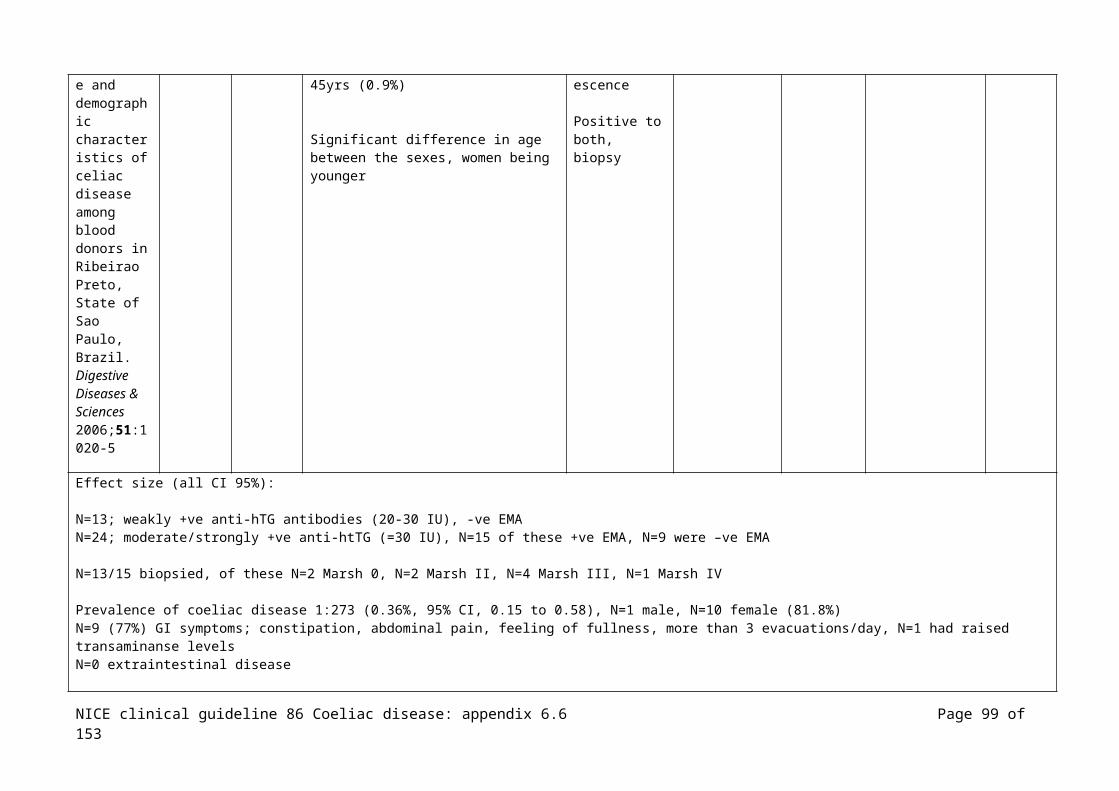
picture of celiac disease in italian down syndrome patients: a multicenter study. Journal of Pediatric Gastroenterology & Nutrition 2001;33:139-43
Italy
percentages of those with growth failure (p<0.001), anorexia (p<0.01), constipation (p<0.05), and higher frequency of cases of low haemoglobin, low serum iron and low calcium (p<0.01) than in N=55 who were IgA AGA +ve and IgA EMA –ve, and than N=57 IgA AGA –ve and IgA EMA –ve
N=38 (69%) classic CD, N=6 (11%) atypical symptoms, N=11 (20%) silent CD
Bonamico Cohort N=389 Inclusion: patients with Turner syndrome Coeliac IgA AGA Consiglio
NICE clinical guideline 86 Coeliac disease: appendix 6.6 Page 99 of 111

M, Pasquino AM, Mariani P, Danesi HM, Culasso F, Mazzanti L et al. Prevalence and clinical picture of celiac disease in Turner syndrome. Journal of Clinical Endocrinology & Metabolism 2002;87:5495-8
Mixed
Italy
enrolled by the Italian Society of Pediatric Gastroenterology and Hepatology and the TS Italian Study Group from various centres of the northern, central, southern, and insular regions, making the sample fairly representative of the whole population, age range 7 to 38yrs
disease and/or EMA and biopsies, N=25 (6.4%) diagnosed with coeliac disease
N=10 (40%) classic form of coeliac disease, N=8 (32%) atypical, N=7 (28%) silent
Nazionale delle Ricerche Grant
Collin P, Vilska S, Heinonen PK, Hallstrom O, Pikkarainen P. Infertility and coeliac disease Gut 1996;39:382-384
Cohort N=150 women with infertilityN=50 women with spontaneous abortions(N=150 control)
Adults
Finland
Inclusion: successive women examined for infertility and women having 2 or more spontaneous abortions, treated at a department of obstetrics and gynaecology in a university hospital, between February 1993 and December 1994
Control: women with normal obstetric history who had undergone laproscopic sterilisation
Coeliac disease
N=4/150 (2.7%) in the infertility group and N=0 in the control group had coeliac disease, p=0.06
All of the N=4/98 (4.1%) had unexplained infertility vs. N=0/150 with
Grant from the Medical Research Fund of Tampere University Hospital
NICE clinical guideline 86 Coeliac disease: appendix 6.6 Page 100 of 111
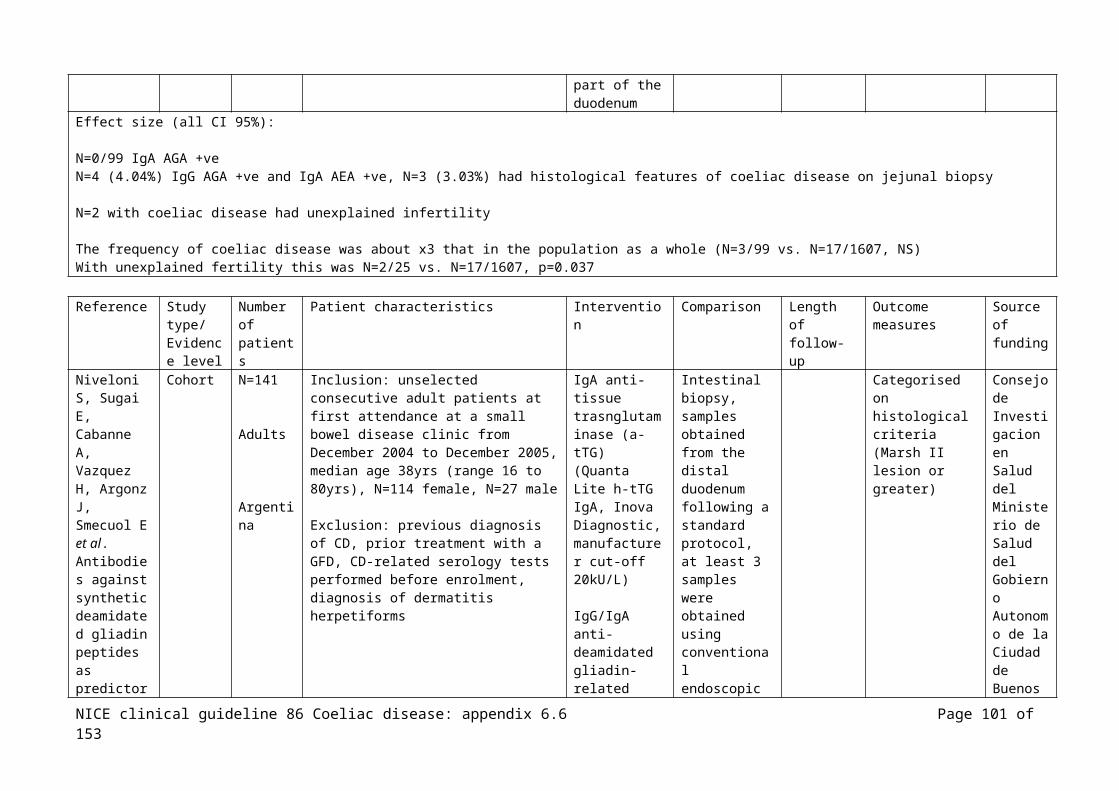
control, p=0.02
Cronin CC, Jackson LM, Feighery C, Shanahan F, Abuzakouk M, Ryder DQ et al. Coeliac disease and epilepsy. Qjm 1998;91:303-8
Case control
N=177(N=488 control group)
Adults
Ireland
Inclusion: patients attending a seizure clinic of a university hospital, N=80 male, N=97 female, N=80 male, mean age 36yrs (range 14 to 80yrs), median age at onset of epilepsy was 14yrs (range 1 to 63yrs)
Control group from patients attending an ante natal clinic
Coeliac disease
N=4 EMA +ve, +ve for coeliac disease on biopsy, frequency of CD 1:44
(control N=2 EMA +ve, frequency of CD 1:244)
Not stated
Dickey W, McMillan SA, Callender ME. High prevalence of celiac sprue among patients with primary biliary cirrhosis. Journal of Clinical Gastroenterology 1997;25:328-9
Cohort N=57
Adults
N Ireland
Inclusion: those attending clinics with primary biliary cirrhosis, N=52 female, mean age 57yrs (30 to 79yrs), none had low total serum IgA
Coeliac disease
N=6 (11%) EMA +ve, N=4 biopsied all had results consistent with coeliac disease
Prevalence of coeliac disease; 1:14 (7%)
Not stated
Farre C, Domingo-Domenech E, Font R, Marques T,
Case control
N=298 (N=251 controls)
Adults
Inclusion: consecutive patients with lymphoid malignancy at 4 centres in Spain, May 1998 to January 2000, mean 58yrs, N=173 male, B-cell lymphoma (79.83%), T-cell lymphoma (8.72%),
Coeliac disease
Coeliac disease in N=2/298 (0.67%) vs. N=3/251
Spanish Ministry of Health
NICE clinical guideline 86 Coeliac disease: appendix 6.6 Page 101 of 111

Fernandez dS, Alvaro T et al. Celiac disease and lymphoma risk: a multicentric case--control study in Spain. Digestive Diseases & Sciences 2004;49:408-12
Spain
Hodgkin’s lymphoma (11.74%) (1.2%) controls
Francis J, Carty JE, Scott BB. The prevalence of coeliac disease in rheumatoid arthritis. European Journal of Gastroenterology & Hepatology 2002;14:1355-6
Cohort N=160
Adults
UK
Inclusion: consecutive patients with rheumatoid arthritis attending the rheumatology outpatients, mean age 61yrs (range 20 to 84yrs), N=107 (67%) female, mean disease duration 12yrs
Coeliac disease
N=1 with CD, which had been previously diagnosed, prevalence of CD in RA 0 (95% CI; 0 to 24%)
Rheumatology Fund, Lincoln County Hospital, Postgraduate Medical federation, Lincoln
Frustaci A, Cuoco L, Chimenti C, Pieroni M, Fioravanti G, Gentiloni N et al. Celiac disease
Case control
N=187
Adults
Italy
Inclusion: consecutive patients with myocarditis admitted with either heart failure (N=110), with cardiac arrhythmias (N=77), N=118 male, mean age 41.7±14.3yrs, none had IgA deficiency
Coeliac disease
N=13 +ve IgA-tTGN=9 +ve for AEA and had iron-deficiency anaemia
MURST project
NICE clinical guideline 86 Coeliac disease: appendix 6.6 Page 102 of 111

associated with autoimmune myocarditis. Circulation 2002;105:2611-8
and had histologic evidence of coeliac disease
Prevalence of coeliac disease 4.4% with myocarditis vs. N=1 (0.3%), p<0.003
George EK, Hertzberger-ten Cate R, Suijlekom-Smit LW, von Blomberg BM, Stapel SO, van Elburg RM et al. Juvenile chronic arthritis and coeliac disease in The Netherlands. Clinical & Experimental Rheumatology 1996;14:571-5
Cohort N=62
Children
Netherlands
Inclusion: children with juvenile chronic arthritis (JCA) being followed at 3 departments of paediatric rheumatology during 1993 and 1994, N=36 female, mean age 9.9±3.5SD (range 3.3 to 16.8yrs), IgG AGA used in one case of IgA deficiency
Coeliac disease
N=8 with at least 1 +ve screening test, N=5 biopsed, N=4 normal biopsy
Frequency of coeliac disease 1.5%
Not stated
Germenis Case N=738 Inclusion: consecutive patients with Coeliac N=4/738 Not
NICE clinical guideline 86 Coeliac disease: appendix 6.6 Page 103 of 111
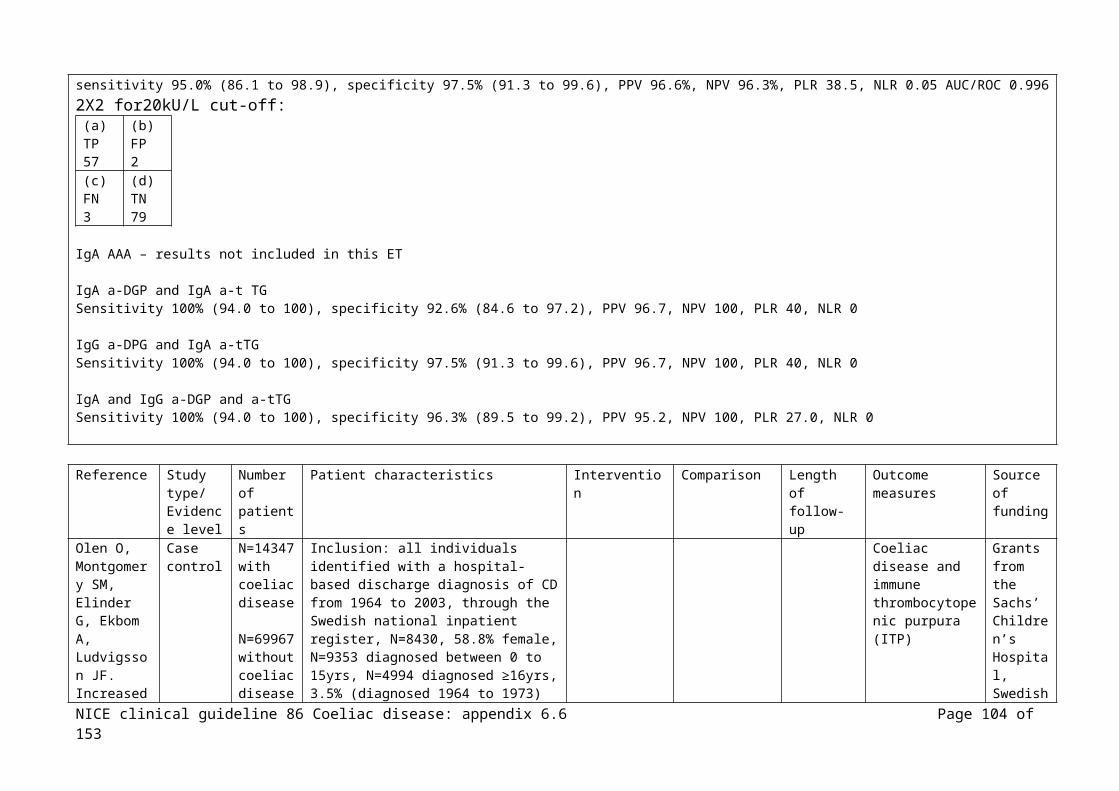
AE, Yiannaki EE, Zachou K, Roka V, Barbanis S, Liaskos C et al. Prevalence and clinical significance of immunoglobulin A antibodies against tissue transglutaminase in patients with diverse chronic liver diseases. Clinical & Diagnostic Laboratory Immunology 2005;12:941-8
controls (N=1350 controls)
Mixed
Greece
chronic liver disease at an academic liver unit, over the last 5yrs, N=406 males, median age 53yrs (range 6 to 85yrs)(N=462 with viral hepatitis; N=117 with autoimmune hepatitis; N=113 with alcoholic liver disease/non-alcoholic fatty liver diseaseTotal IgA levels in all subjects were within normal limits
disease with diverse chronic liver disease IgA EMA +ve; prevalence 1:185 (0.54%)
N=3/4 biopsied, N=2 coeliac disease
N=4/1350 controls IgA EMA +ve, all biopsied and had histologic changes compatible with coeliac disease; prevalence 1:338 (0.3%)
stated
Goldacre MJ, Wotton CJ, Seagroatt V, Yeates D. Cancers and immune related
Case control
N=1453(N=460000 control)
Mixed
Inclusion: data from the Oxford Record Linkage Study, this includes brief statistical abstracts of records of all hospital admissions, including day cases in the NHS and all deaths wherever they occurred, in defined populations within the former Oxford NHS region from January 1963 to March 1999, the Down’s
Coeliac disease (rates of each cancer or immune related disease based on person-years at risk
Results for cancers and other immune conditions not reported here
Oxford Health Authority, Research and Development Directora
NICE clinical guideline 86 Coeliac disease: appendix 6.6 Page 104 of 111

diseases associated with Down's syndrome: a record linkage study. Archives of Disease in Childhood 2004;89:1014-8
UKsyndrome cohort obtained from statistical records, the reference cohort from records of admission for other medical and surgical conditions, N=937 0 to 14yrs, N=516 15 to 59yrs
N=4 with coeliac disease observed in the Down’s cohort, expected number N=0.9, Adjusted risk ratio 4.7 (CI: 1.3 to 12.2)
te at the Department of Health
Guliter S, Yakaryilmaz F, Ozkurt Z, Ersoy R, Ucardag D, Caglayan O et al. Prevalence of coeliac disease in patients with autoimmune thyroiditis in a Turkish population. World Journal of Gastroenterology 2007;13:1599-601
Case control
N=136
Adults
Turkey
Inclusion: consecutive patients with newly diagnosed autoimmune thyroiditis between January and September 2006, mean age 43.1±10.5 (range 17 to 65yrs), none had other autoimmune diseases
Control, healthy blood donors
Age and gender were similar in both groups
Coeliac disease
IgA tTG +ve in N=8(5.9%), N=1 control, OR7.38 (CI: 0.91 to 59.85), p=0.04
N=6 biopsied, N=4 had CD
N=1 control biopsied, had CD
Not stated
Imanzadeh F, Sayyari AA, Yaghoobi M,
Case control
N=825(N=825 control)
Inclusion: consecutive patients with small bowel type chronic diarrhoea (voluminous watery diarrhoea lasting 6wks or more) attending a department of
Coeliac disease
N=57 (6.9%) IgA EMA +ve vs. N=7
Not stated
NICE clinical guideline 86 Coeliac disease: appendix 6.6 Page 105 of 111
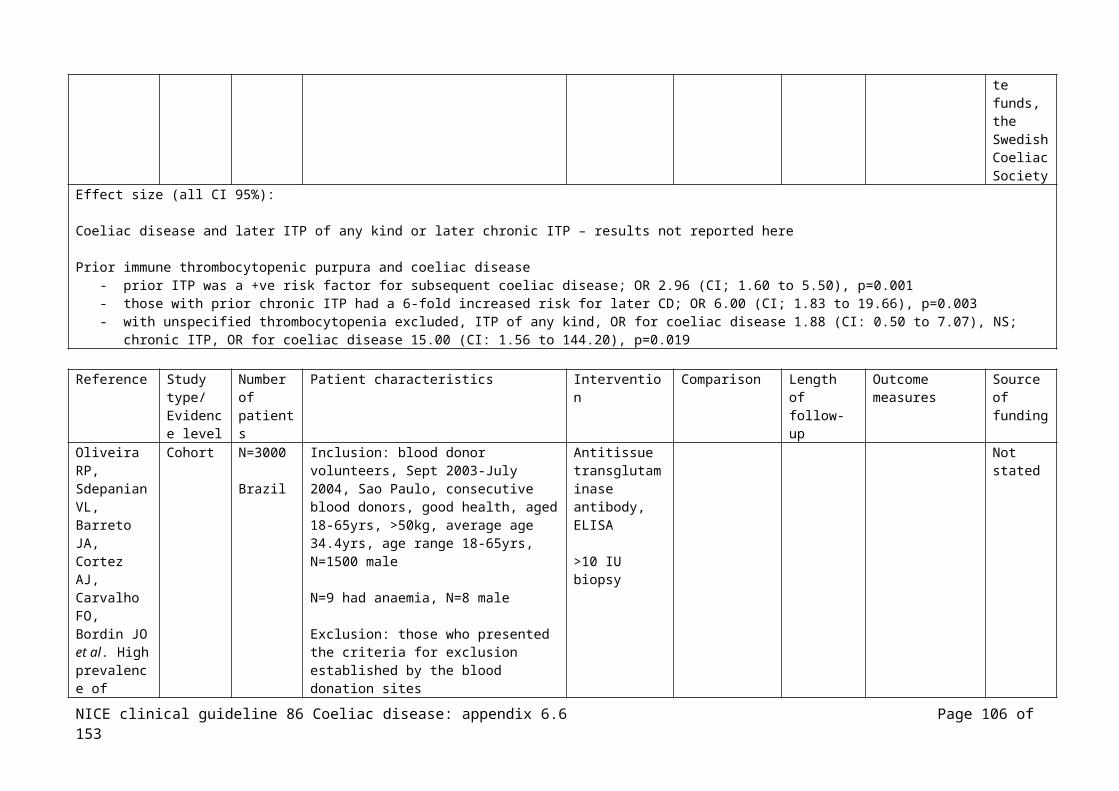
Akbari MR, Shafagh H, Farsar AR. Celiac disease in children with diarrhea is more frequent than previously suspected.[comment]. Journal of Pediatric Gastroenterology & Nutrition 2005;40:309-11
Children
Iran
gastroenterology, June 1997 to March 2003, N=389 female, N=436 male, mean age 8.5yrs (range 3mths to 14yrs), total serum IgA within normal limits in all
Exclusion: those with bloody diarrhoea, renal failure, previous CD
Control group, those attending paediatric clinics with non-GI symptoms
(0.8%) with the control groupN=57 biopsied, N=54 (8.96%) diagnosis coeliac disease vs. N=5/825 (0.61%) control group, p<0.001
(some data on other symptoms, not reported here)
Karnam US, Felder LR, Raskin JB. Prevalence of occult celiac disease in patients with iron-deficiency anemia: a prospective study. Southern Medical Journal 2004;97:30-4
Cohort N=105
Adults
USA
Inclusion: all patients presenting to an endoscopy unit for evaluation of iron-deficiency anaemia (<12g/dl in women and <14 g/dl in men) between March 1998 and June 2000, were candidates for study entry, all participants had colonscopy and gastroduodenoscopy Average Hb 8.9g/dl and average haematocrit 27.4% (for men 9.0g/dl and 27.8%; for women 8.9g/dl and 26.8%)
Coeliac disease
N=3 had coeliac disease (N=2 haemoccult +ve), none had diarrhoea, skin rash or other evidence of CD
Not stated
NICE clinical guideline 86 Coeliac disease: appendix 6.6 Page 106 of 111
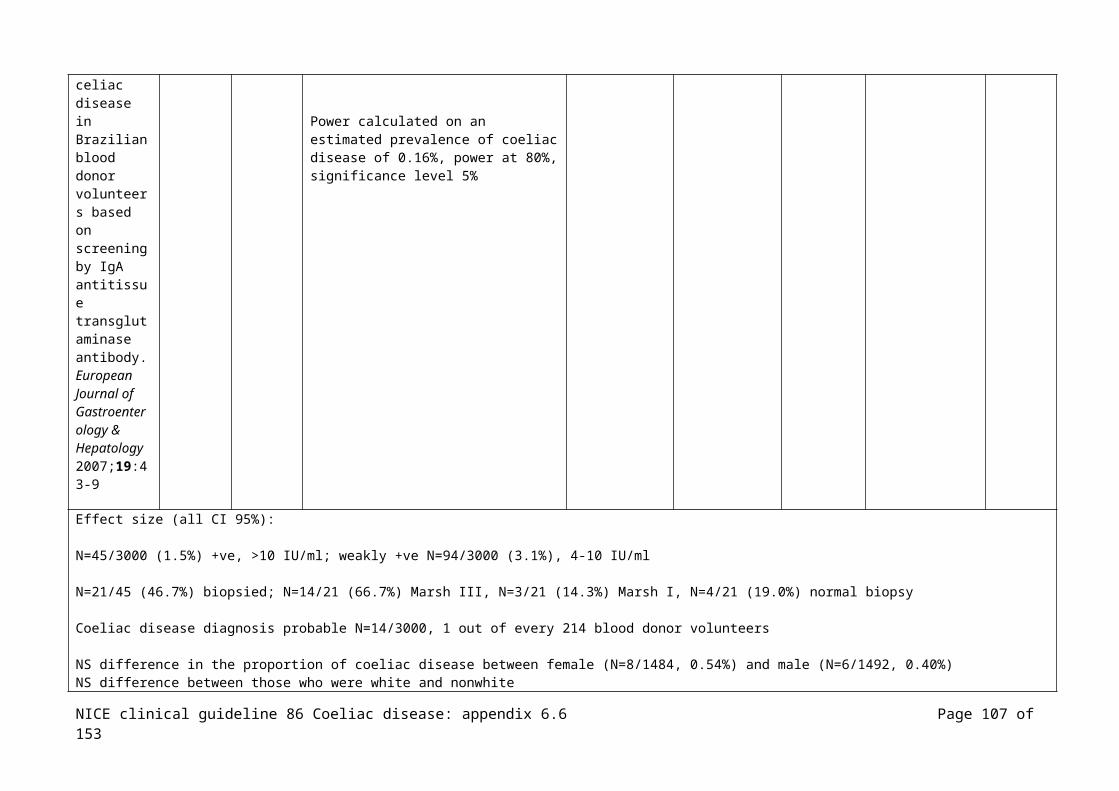
Lepore L, Martelossi S, Pennesi M, Falcini F, Ermini ML, Ferrari R et al. Prevalence of celiac disease in patients with juvenile chronic arthritis. Journal of Pediatrics 1996;129:311-3
Cohort N=119
Children
Italy
Inclusion: children with juvenile chronic arthritis being treated at two centres for paediatric rheumatology, mean age 11.5yrs (range 2 to 16yrs), N=87 female
Coeliac disease
N=4 (3.3%) AEA +ve, N=3 biopsy +ve for CD
Not stated
Meloni GF, Dessole S, Vargiu N, Tomasi PA, Musumeci S. The prevalence of coeliac disease in infertility. Human Reproduction 1999; 14:2759-1999
Case control
N=99(N=1607 control)
Adults
Italy
Inclusion: successive women (and their partners) examined for infertility at a department of obstetrics and gynaecology of a university, mean age 33.38yrs (range 26 to 45yrs), between August 1997 and October 1998
Control: from a previous screening study for coeliac disease carried out on healthy school children from the same geographical area
Coeliac disease
N=4 (4.04%) IgG AGA and EMA +ve, N=3 +ve for coeliac disease on jejunal biopsy (3.03%)
Frequency of coeliac disease: N=3/99 vs. population as a whole N=17/1607, NS difference
Not stated
NICE clinical guideline 86 Coeliac disease: appendix 6.6 Page 107 of 111
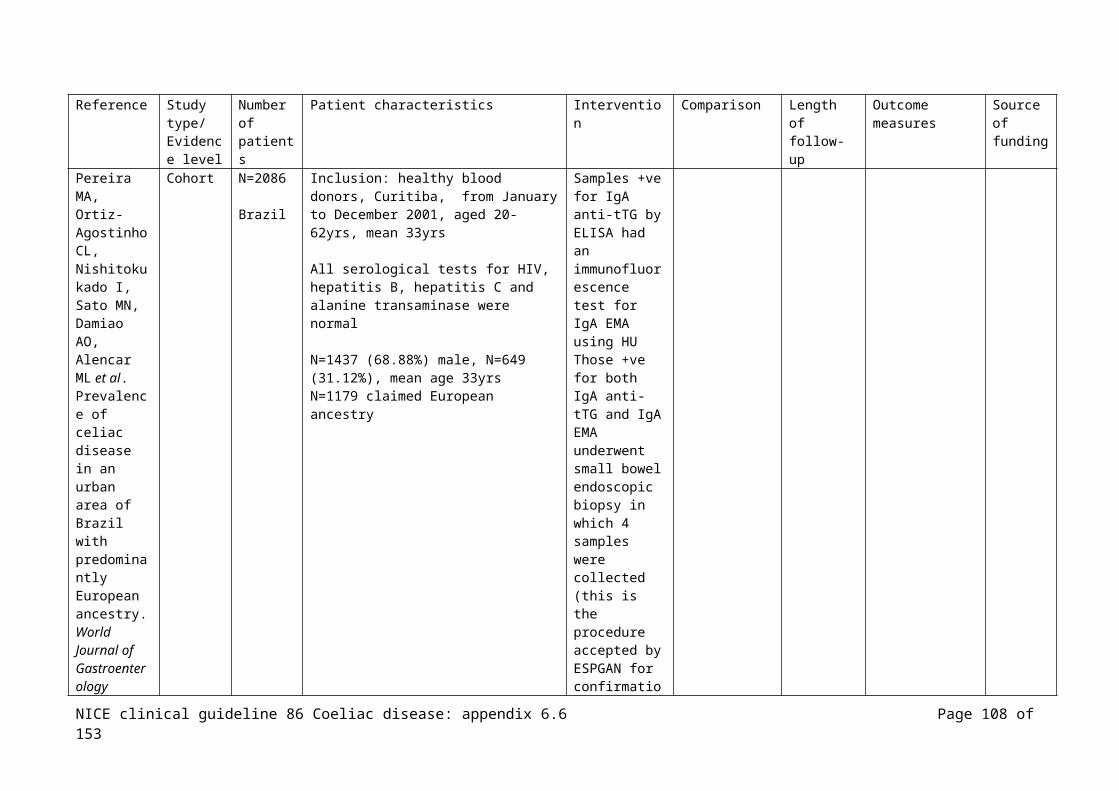
Subgroup with unexplained infertility: N=2/25 vs. population as a whole N=17/1607, p=0.037
Picarelli et al (2005) Anti-endomysial antibody of IgG1 isotype strongly increases the prevalence of coeliac disease in patients affected with type 1 diabetes mellitus
Case control
N=94 (N=83 control)
Adults
Italy
Inclusion: consecutive adult patients with IDDM1 regularly attending a centre for the study of diabetes, N=43 male, N=51 female, mean age 46.9yrs (range 18 to 70yrs), none had any symptoms attributable to enteropathy, any evidence of malabsorbtion or been previously diagnosed with coeliac disease, all on gluten containing diet
Controls: blood donors without IDDM1, CD, other auto-immune conditions, or first-degree relative with any autoimmune condition
Coeliac disease
All had IDDM1 for >15yrs and satisfactory metabolic control
N=13 (6.4%) with coeliac disease
EMA =ve vs. EMA –ve
Ministry of University and Research (MIUR), the non-governmental association for research on coeliac disease and diabetes mellitus
Pratesi R, Gandolfi L, Martins RC, Tauil PL, Nobrega YK, Teixeira WA. Is the prevalence of celiac disease increased among epileptic patients?
Case control
N=255(N=4405 control)
Mixed
Brazil
Inclusion: adults and children attending 2 clinics, N=119 children; N=49 female, mean age 7.97yrs, median age 8yrs (range 1 to 14yrs), N=136 adults; N=64 female, mean age 30.27yrs, median age 29yrs (range 15 to 65yrs)
Control, N=2034 children, N=2371 adults
Coeliac disease
N=2/255 (N=1 adult, N=1 child)with coeliac disease; 1:127
Control N=15/4405 with coeliac disease; 1:293
Not stated
NICE clinical guideline 86 Coeliac disease: appendix 6.6 Page 108 of 111

Arquivos de Neuro-Psiquiatria 2003;61:330-4
Sategna-Guidetti C, Bruno M, Mazza E, Carlino A, Predebon S, Tagliabue M et al. Autoimmune thyroid diseases and coeliac disease.[see comment]. European Journal of Gastroenterology & Hepatology 1998;10:927-31
Case control
N=152 autoimmune thyroid diseases
N=185 with coeliac disease
(N=170 control)
Adults
Italy
Inclusion: consecutive patients at a thyroid outpatients clinic none of who were taking medications that could interfere with the immunological response, N=100 with Graves’ disease, N=52 autoimmune throiditis/ subclinical hypothyroidism/euthyroidism, N=128 female, ages 15 to 80yrs Consecutive patients attending a coeliac disease outpatients, N=53 (N=41 female, median age 36yrs, range 19 to 67yrs) newly diagnosed therefore untreated, N=132 (N=89 female, median age 37yrs, range 16 to 81yrs)on GFD
Controls, healthy volunteers
Coeliac disease in those with autoimmune thyroid disease
Autoimmune thyroid disease in those with coeliac disease
EMA and biopsy +ve N=5/152 (3.29%) of those with autoimmune thyroid diseases
Autoimmune thyroid disease identified in N=38/185 (20.54%) of those with coeliac disease vs. N=19/170 control group (11.17%), X2 =5.09, p=0.02, the prevalence of autoimmune thyroid diseases among patients and controls did not differ among age
Not stated
NICE clinical guideline 86 Coeliac disease: appendix 6.6 Page 109 of 111

groups Szodoray P, Barta Z, Lakos G, Szakall S, Zeher M. Coeliac disease in Sjogren's syndrome--a study of 111 Hungarian patients. Rheumatology International 2004;24:278-82
Cohort N=111
Adults
Hungary
Inclusion: consecutive patients with Sjogren Syndrome attending an outpatient clinic
Coeliac disease
N=5/111 (4.54%) diagnosed with CD
The age of those with CD 39.8 (28 to 53) vs. those without CD 57 (38 to 77), p<0.001
Duration of Sjogren syndrome at the time of the study similar in both groups
GI symptoms, N=41/111 (36.93%) abdo discomfort, N=11 (7.2%) lack of appetite, N=6 (5.4%) nausea, N=10 (9%) diarrhoea, N=6(5.4%) iron
Grants from the National Research Fund and the Ministry of Welfare
NICE clinical guideline 86 Coeliac disease: appendix 6.6 Page 110 of 111

deficiency anaemia due to malabsorbtion
Thevenot T, Denis J, Jouannaud V, Monnet E, Renou C, Labadie H et al. Coeliac disease in chronic hepatitis C: A French multicentre prospective study. Alimentary Pharmacology and Therapeutics 2007;26:1209-16
Cohort N=624
Adults
France
Inclusion: consecutive patients with hepatitis C virus attending 8 outpatients departments between June 2003 and November 2005, N=373 male, mean age 52±14yrs
Exclusion: <18yrs, viral hepatitis B infection, +ve HCV antibodies with –ve HCV-RNA
Coeliac disease
N=1 AEA +ve, biopsy did not show CD, N=34 biopsied in total, none showed CD, prevalence 0%
None
NICE clinical guideline 86 Coeliac disease: appendix 6.6 Page 111 of 111