
CFRP dimensional stability investigations for use on the ... · APS/123-QED CFRP dimensional...
28
APS/123-QED CFRP dimensional stability investigations for use on the LISA mission telescope J. Sanjuan, D. Korytov, A. Spector, and G. Mueller University of Florida, Corner of Gale Lemerand Dr. and M'Usev,m Rd., Gainesville, FL 32611 USA A. Preston and J. Livas NASA Goddard Space Flight Center, Greenbelt, Maryland 20771 USA A. Freise and G. Dixon School of Physics and Astronomy, University of Birmingham, Edgbaston, Birmingham B15 2TT UK (Dated: September 19, 2011) Abstract The Laser Interferometer Space Antenna (LISA) is a mission designed to detect low frequency gravitational-waves. In order for LISA to succeed in its goal of direct measurement of gravitational waves, many subsystems must work together to measure the distance between proof masses on adjacent spacecraft. One such subsystem, the telescope, plays a critical role as it is the laser transmission and reception link between spacecraft. Not only must the material that makes up the telescope support structure be strong, stiff and light, but it must have a dimensional stability of better than 1 pmHz- 1 / 2 at 3 mHz and the distance between the primary and the secondary mirrors must change by less than 2.5 11m over the mission lifetime. CFRP is the current baseline materiaL however, it has not been tested to the pico-meter level as required by the LISA mission. In this paper we present dimensional stability results, outgassing effects occurring in the cavity and discuss its feasibility for use as the telescope spacer for the LISA spacecraft. PACS numbers: 9;S.55.Ym, 07.87.+v. 81.05.U- 1 https://ntrs.nasa.gov/search.jsp?R=20120002001 2018-06-28T00:05:10+00:00Z
Transcript of CFRP dimensional stability investigations for use on the ... · APS/123-QED CFRP dimensional...
APS/123-QED
CFRP dimensional stability investigations for use on the LISA
mission telescope
J. Sanjuan, D. Korytov, A. Spector, and G. Mueller
University of Florida, Corner of Gale Lemerand
Dr. and M'Usev,m Rd., Gainesville, FL 32611 USA
A. Preston and J. Livas
NASA Goddard Space Flight Center, Greenbelt, Maryland 20771 USA
A. Freise and G. Dixon
School of Physics and Astronomy, University of Birmingham,
Edgbaston, Birmingham B15 2TT UK
(Dated: September 19, 2011)
Abstract
The Laser Interferometer Space Antenna (LISA) is a mission designed to detect low frequency
gravitational-waves. In order for LISA to succeed in its goal of direct measurement of gravitational
waves, many subsystems must work together to measure the distance between proof masses on
adjacent spacecraft. One such subsystem, the telescope, plays a critical role as it is the laser
transmission and reception link between spacecraft. Not only must the material that makes up
the telescope support structure be strong, stiff and light, but it must have a dimensional stability
of better than 1 pmHz- 1/ 2 at 3 mHz and the distance between the primary and the secondary
mirrors must change by less than 2.5 11m over the mission lifetime. CFRP is the current baseline
materiaL however, it has not been tested to the pico-meter level as required by the LISA mission.
In this paper we present dimensional stability results, outgassing effects occurring in the cavity
and discuss its feasibility for use as the telescope spacer for the LISA spacecraft.
PACS numbers: 9;S.55.Ym, 07.87.+v. 81.05.U-
1
https://ntrs.nasa.gov/search.jsp?R=20120002001 2018-06-28T00:05:10+00:00Z

I. INTRODUCTION
The Laser Interferometer Space Antenna (LISA) is a proposed space mission conceived to
detect gravitational waves (GWs) from astrophysical objects such as massive black holes and
binary systems in the 0.1 mHz to 1 Hz frequency range [1-3]. LISA consists of a constellation
of three identical spacecraft (SC) forming a triangle of approximately five million kilometers
on a side which orbits the Sun in an Earth-like orbit about 20° behind the Earth. Each
SC contains two proof masses (PMs) in perfect free-fall and laser interferometry is used to
measure the distance between the PMs -see Fig. 1. In this manner GWs will be detected
since they cause geodesic deviations in the free-falling PMs placed in the SC.
The expected PMs geodesic deviations due to GWs are extremely weak [1, 3]. Conse
quently, demanding requirements are imposed on all the LISA subsystems in order to ensure
their detection. Each SC contains two main subsystems: the disturbance reduction system
(DRS) and the interferometer measurement system (IMS)
2

(1)
1/2 12 [ (2,8 mHZ) 4]1/2 m HZ-1/2, W Sx,I'lS(W) ::; 18 x 10- , 1 01 mHz < - < 1 Hz 1V w/21f '- 21f - (2)
and consists primarly of laser shot noise[7]. path-length noise[8], and measurement noise.
I ~ [1 -L (W/21f) 2] 112
0,012
3
A key element of the IMS is the telescope which simultaneously gathers the light coming
from the far SC ('"'-' 1 00 p W) and expands and collimates the small outgoing beam ('::::2 VV)
and sends it to the far SC . The distance between the two mirrors of the telescope is
critical since it forms part of the science interferometer optical path. Therefore, any change
in it translates directly into IMS path-length noise ~see Fig. 2. The required stability of
the distance between the two mirrors is [3]
[
4]1/2 S l/2 (. ) -12 (2.8 mHZ) H -1/2
xTS W :S 10 . 1 / m z , , W 21f
W 0.1 mHz :S 21f :S 1 Hz (5)
which corresponds to 5.5% ofthe total 1;V1S budget ~see Eq. (2). In addition to the stability
requirement ~Eq. the distance between the two mirrors cannot change by more than
"-'2.5 Ifm over the lifetime of the mission to prevent defocussing of the beam and thus
wavefront distortion and [9] ~see Sec. IV.
The current LISA telescope baseline design consists of a two-mirror telescope with a
two-lens ocular in an off-axis design (Schiefspiegler telescope) to avoid stray light sources
and avoid obscuration of the beam path ~see Fig. 3 [10, 11]. The primary and secondary
mirrors are to be made of Zerodur. The diameter of the primary is 40 cm which results
in an equivalent path-length noise due to shot noise of 8 pm HZ- 1/ 2 (dominating noise for
f 2:3mHz). The telescope length is 60cm and consists of a carbon fiber reinforced poly
mer (CFRP) cylinder-shaped spacer. CFRP consists of carbon fiber filaments in a matrix
material which in most cases is a polymer such as an epoxy resin (and thus susceptible to
outgassing). The mechanical, chemical, electrical and thermal properties of the CFRP de
pend on the production process, the fiber used and the matrix material. Advances in both
fiber and resing technologies allow CFRP materials to be produced with a low coefficient
of thermal expansion (CTE) , good vibration damping and excellent fatigue resistance.
The telescope design would also include a re-focusing mechanism to allmv for length changes
that occur between on-ground testing and flight conditions due to the shrinking of the
CFRP, and also to correct for dimensional changes during the mission. In addition an op
tical truss interferometer can be incorporated to the If-.IS to read out all potential length
and the seC:Ollnar mirrors later corrections
in HmveveL a very structure could ~LLULL'LCU,~
need

In this paper we discuss our experimental set-up to test the stability of the CFRP (in
dependent of the geometry of the telescope spacer, i.e., using just an optical cavity made
of CFRP) at the pica-meter level in the LISA frequency band, identify the noise sources
present in the measurements, study the effect of outgassing on the material and discuss the
viability of the CFRP to be used as the telescope support structure for the LISA mission.
The paper is organized as follows: Section II focuses on the experimental set-up together
with the CFRP cavity construction process. Dimensional stability results are presented and
discussed in Sec. III, outgassing measurements are presented in Sec. IV. and main conclusions
and future prospects are summarized in Sec. V.
II. EXPERIMENTAL SET-UP
In order to determine the dimensional stability of the CFRP cavity, the set-up shown
in Fig. 4 was used (see caption for details). A Pound-Drever-Hall (PDH) locking scheme
was used to lock each laser to its respective cavity [13~ 15]. Two vacuum chambers, each
consisting of a vacuum tank containing thermal shields, were used to house the cavities [9, 16,
17]. Tank 1 housed a Zerodur cavity (reference cavity) and contained five cylindrical layers
of gold-coated stainless steel shells (to minimize heat transfer due to radiation) which were
separated by macor spacers to minimize the heat flow between the thermal shields and the
outer wall of the tank due to thermal conduction. Tank 2 housed the CFRP cavity and used
five layers of aluminized polyethylene terephthalate (PET) also separated by macor spacers
to achieve a benign thermal environment.
The relative dirnellsional stability the CFRP ,vas !HCCK",U Uv •• vu.,., the light from
the laser CFRP
is to be more to its
very low 2x
5
by means of a frequency counter (HP 53132A) and they are
(6)
where i CFRP is the length of the CFRP cavity and SSf'CFRP its fluctuations. is the
length of the Zerodur cavity and S6€zer its fluctuations and 1/ is the frequency of the laser
(=281.95 THz, A=1064nm). Our goal was to determine UAt'~~"~(w). In our set-up the lengths
of both cavities are similar (i ~0.25m). thus Eq. (6) becomes
(w)]. (7)
Since the Zerodur cavity is supposed to be more stable than the CFRP, the dimensional
stability of the latter can be estimated as:
(8)
In order to determine the absolute change in length of the CFRP cavity due to outgassing
processes an absolute frequency reference was needed. To do this, a third laser was locked to
a known hyperfine transition of the iodine molecule (P(54)32-0 line al) using the frequency
modulation Doppler-free saturation spectroscopy technique [18~22] as shown in Fig. 5. Such
transition is present around 532 nm. A non-linear crystal (Pp:MgLNO from HC Photonics)
was used to generate the second harmonic of the 1064 nm laser. Laser 2 \vas kept locked to
the CFRP cavity as in the set-up in Fig. 4. By monitoring the beat-note signal between the
CFRP laser and the laser locked to the iodine transition the absolute length change of the
CFRP cavity during the outgassing was measured.
A. CFRP cavity construction
A spacer was the the Space
Dco"yrr,h group. This group has space-
missions and had their on missions Hinode
6
The CFRP cavity was designed to be stiff, strong and have a low CTE. The spacer is 230 mm
in length and consists of a thin outer shell 200 mm in diameter and 5.5 mm thick that is used
to provide additional structural support to an inner tube that has 45 mm outer diameter
and 30 mm inner diameter. A set of struts 4.2 mm thick and spanning the length of the
spacer connects the outer shell to the inner tube ~see Fig. 6.
A multi-step process ,vas used to make the CFRP spacer: the parts were fabricated.
machined and epoxied together. Next a stress relief process based on three temperature
cycles from 60°C to - 20°C was performed. The spacer was cleaned and then vacuum
baked at 100°C for one week. This step helps to accelerate outgassing of the epoxy. The
rough/exposed parts were then machined and vacuum baked at 100°C for one week.
In addition to delivering the CFRP spacer. Zerodur tubes polished on one face were
provided. One flat mirror and one mirror with a radius of curvature (ROC) of 1 m were
optically contacted to the Zerodur tubes. The Zerodur mirror/plugs were then epoxied into
the CFRP tube using Emerson & Cuming Eccobond 285 epoxy to form an optical cavity
-see Fig. 6. The resulting cavity exhibited a linewidth of 160 kHz and a finesse, F, of 4060.
III. DIMENSIONAL STABILITY MEASUREMENTS
This section presents the results obtained during the tests carried out to determine if
the dimensional stability of the CFRP cavity meets the requirement imposed by the LISA
mission Eq. (5). The results are summarized in Fig. 13. Prior to that the different
sources of noise involved in the measurement are identified and quantified.
Two different mechanisms causing length fluctuations in the cavity have been identified
as temperature fluctuations (this effect prevails for f ;S0.5 mHz) and laser power fluctua
tions (from rv 1 mHz to rv30 mHz). For frequencies higher than 50 mHz noise in the PD H
technique from electronics. modulators, power fluctuations, etc. limit the sensitivity of the
measurement.
A. Cavity temperature fluctuations and CTE estimation
CFRP
due to the the material. In
cause
to reduce this
7
was
a vacuum tank and it was surrounded by thermal shields ~see Sec. II and Appendix A.
However. this was not sufficient to attenuate properly the temperature fluctuations in the
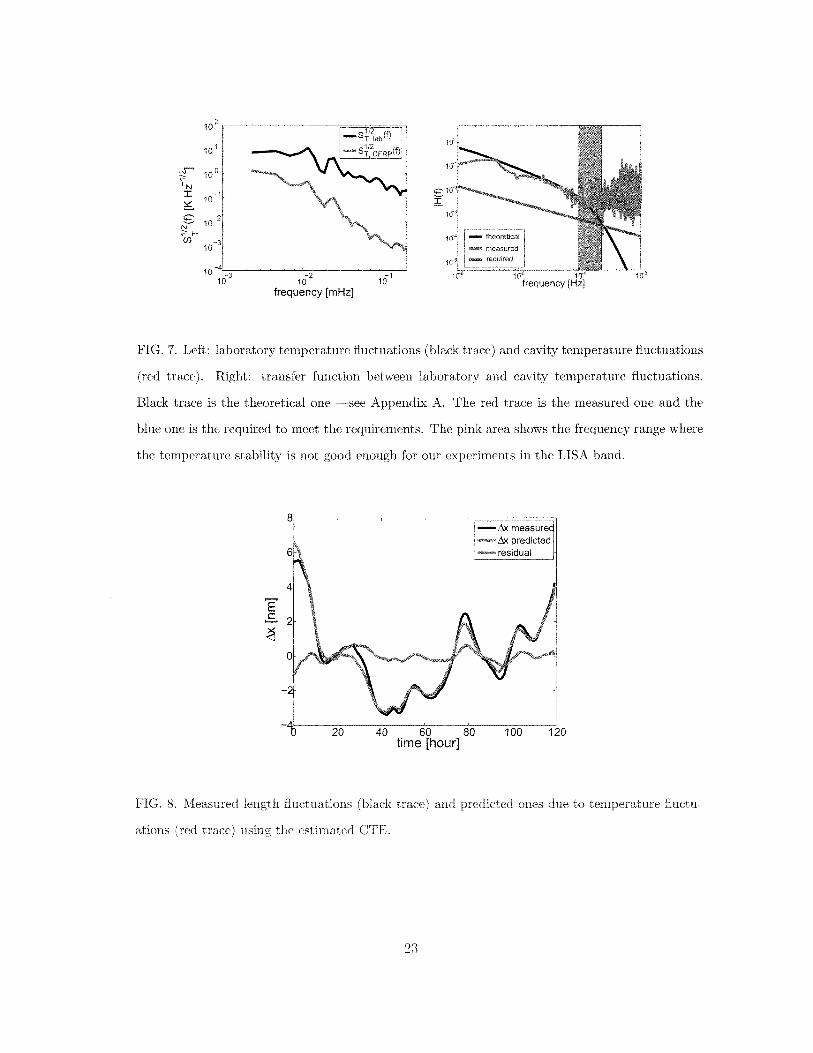
laboratory at frequencies lower than ",0.2 mHz. Figure 7 (left panel) shows the PSDs of
the temperature fluctuations in the laboratory and at the cavity. The right panel shows
the modulus of the transfer function between laboratory and cavity temperature. The
experimental transfer function can only be computed for frequencies lower than "'-'0.2 mHz
since at higher frequencies the temperature measurement inside the cavity is essentially
dominated by electronic noise from thc temperature read-out.
The CTE is an important physical property since this ultimately sets the required thermal
stability for the telescope structure in the LISA SC. It depends on the used components and
the manufacturing process. We estimated the CTE by comparing the changes in the cavity
temperature with the changes in the CFRP beat-note ~see Fig. 8. The CTE was estimated
using a linear least squares approach:
O:CFRP £-1 I::~=1 .i1x[nJT[n]
I::~=1 T2[n] (9)
where x[n] is the beat-note measurement converted to length: i1x fi1v, T[n] is the
temperature of the cavity and N x 105 ) is the number of data points. All the changes
in the beat-note due to temperature are ascribed to the CFRP cavity since the Zerodur
CTE is about two orders of magnitude lower than the CFRP one. Figure 8 shows the
measured length fluctuations of the CFRP (black trace) and the predicted length changes
due to temperature fluctuations using the estimated CTE (red trace). The magenta trace
shows the residual.
The estimated CTE implies that the required temperature stability in the LISA telescope
assuming the real telescope length. 0.6 m. should be
::; 0.58 . [1 (2.8 mHz) 4]
\vhich is 450 11K at 0.1 mHz. The
at 0.1 mHz and
11K HZ- 1/ 2 . :.J
0.1 mHz ::; ') ::; 1 Hz _1f
stability in the LISA
Hmvever. this
a
a different ",UJLUuuL If used the
8
(10)
is
conduc-

is about eight times worse due to the different thermal impedances. This yields an expected
temperature stability of 280 J1K HZ- 1/ 2 at 0.1 mHz, which is still adequate to keep the length
fluctuations of the telescope due to temperature changes within the LISA requirements if
the CFRP telescope is used.
B. Mirror expansion due to laser power fluctuations
In the LISA mid-frequency range (0.5 mHz;S f ;S30 mHz) power fluctuations of the light
hitting the cavity mirrors and the cavity itself cause length fluctuations due to thermal
expansion of these elements. Figure 9 shows this effect.
To quantify this effect the power fluctuations in the transmitted light of the cavity,
Pr , were measured for two levels of incident light power in the cavity: Pr c:::::60 J1VV and
Pr c:::::1.2mW.
The coherence function between power and beat-note data are shown in Fig. 11. Correla
tion is seen in two frequency regions. In the mid-frequency range (from 0.5 mHz to 30 mHz)
power fluctuations cause thermal expansion of the elements of the cavity as explained be
low. Clearly, the correlation is weaker when the power is 60 J1W since the effect in the
mirrors/cavity is smaller. The correlation at higher frequencies between power fluctuations
and beat-note fluctuations is ascribed to technical noise (electronics. modulators, etc.) of
the PDH locking system. Such noise drives the laser frequency around the resonance of the
cavity causing fluctuations which result in changes in the transmitted power which can be
modeled as:
(".) rv 5 X 10-
14 H -1/2
el...v - m z . (11)
Figure 11 (left) shows the LSD of the transmitted light power. The right panel shows the
LSD of the beat-note measurement in units of length. The noise levels are clearly reduced in
the mid-frequency range when Pr =60 J1 vV since power fluctuations are proportional to the
average power and thus the expansion the mirrors/cavity due to heating effects is lower.
Cavity length fluctuations due to the thermal expansion the mirrors and/or the
itself can be i3V,'Wl""""'ri m as
\vhere the power
9
cavity length fluctuations. HM(W) was estimated experimentally by applying a change in
pmver (step function with ilP=1.14mW) while measuring the beat-note. The response of
the system is shown in Fig. 12. Once the drift of the beat-note (caused by low-frequency
temperature changes) is taken out the system can be modeled as a first-order I ow-pass filter,
i.e.,
) B
HM(w c::: -. -'TlW + 1
where .8=5.8 p.m W- I and T=3701 s.
(13)
The transfer function H:vr (w) is used to estimate the noise apportioning of the power
fluctuations in the beat-note measurements as described in Sec. III C.
C. Total noise apportioning
Using the results obtained in the previous sections, we can fully characterize the noise
spectrum of the CFRP cavity. The length fluctuations in the whole measurement bandwidth
are calculated as
(14)
The results are shown in Fig. 13. Temperature fluctuations dominate for f :;0.1 mHz for
high power, and for f :; 0.4 mHz for low power. The expansion/contraction of the optical
elements of the cavity due to power fluctuations is responsible for the noise between 0.1 mHz
and 25 mHz when Pr = 1.2 m W but this effect is significantly reduced when the transmitted
power is 60 p. \V: for f > 3 mHz is negligible. At higher frequencies technical noise dominates
both measurements and no difference is observed.
The blue-dashed trace in Fig. 13 is the telescope dimensional stability requirement for
LISA Eq. which is met for the whole LISA frequency range when low power is
used. At lower frequencies (out of the LISA band) the goal is not met due to temperature
fluctuations in the cavity. Hm,'ever. temperature stability in the LISA telescope spacer
should be than the one u.nuu,,,. in the vacuum tanks. Consequently, the effect of the
'will be milder ,see IlIA.
In summary, the results in 13 show that the CFRP meets the LISA
The the test are due to two
mechanisms which not be !JH:;llH:;;l1LCLU,Vil on the LISA 0!JL'~C"~L in
10

LISA the temperature stability at low frequencies should be significantly better and (ii) the
thermal expansion of the mirrors will be completely different in the LISA telescope. The
second effect will require a detailed study once the design of the telescope is complete.
IV. OUTGASSING MEASUREMENTS
The CFRP cavity was made with an epoxy which is susceptible to outgassing under
vacuum conditions as the ones expected in LISA. Such effect causes the material to shrink
which could produce defocussing in the telescope if it is not well predicted and taken into
account during the manufacturing process.
Outgassing effects were determined using the set-up described in Sec. II. The CFRP
cavity was left in air for 17 days in an environment with a relative humidity around 50% in
order to let it adsorb water vapor. After that the cavity was put in the vacuum chamber
again and measurements started. The pressure was about 10-3 Pa after a couple of days and
remained stable during the rest of the days. The beat signal was recorded for several hours
each day. The results are shown in Fig. 14 for two different runs. The first run lasted for 30
days. The second run was taken in order to verify the results obtained in the first run and
only 17 days of data were recorded since the behavior observed agreed with the first run.
The red trace shows the measured change in length of the CFRP cavity. Together with the
beat-note data the temperature of the cavity was also measured in order to correct for this
effect. The blue trace shows the effect of the temperature on the cavity length. Finally, the
contraction of the cavity due to outgassing (black and magenta traces) is estimated as
~Xtotal(t) - eQCFRP~T(t) (15)
which can be modeled as a second-order system -see Fig. 14:
(t) 1- b(1 -
a 1.53 pm, b -4.89 pm 7 day.
The CFRP b,\'O behaviors: a fast one which a time constant
1.8 1.53 pm and one has a time constant
Thus overall ~H"U~.~ III
is pm. will take to reach its all
11

of the outgassing will be done well in advance: about three months (assuming 57). Also
the shrinkage of the telescope due to outgassing over the mission lifetime (5years) would
be about 1 pm and can be considered negligible. Taking into account the longer length of
CFRP that will be used on the LISA SC. the total length change of the structure will be
-:::::16.7 11m which clearly exceeds the required one: 2.5 j1m.
8 X lO-12. (S2) 1/2
s
(0.8"'3) 1/2 8 x lO-12. __ 0_
0.01
12
(17)
(18)
7.4 X lO-l1 m Hz- 1/ 2 (19)

V. DISCUSSION
The telescope in LISA is a key element of the 1]\'IS since it is in charge of transmitting and
receiving the light between the different SC. Very demanding requirements have been set to
the dimensional stability of the telescope. 1 pm Hz- 1/2
, in order to guarantee GW detection.
The current telescope baseline consists of a CFRP cylinder structure (60 cm in length)
holding the two mirrors of the telescope. We have investigated the CFRP dimensional
stability by using a CFRP cavity of length 23 cm.
The dimensional stability of the CFRP material tested meets the LISA telescope require
ment if the temperature stability is better than 450 11K HZ- 1/ 2 at 0.1 mHz since \ve have
determined its CTE to be 2.87x 10⁻⁶ K- 1 . Another source of noise was detected in the
mid-frequency range due to the thermal expansion of
of the laser. Such was identified and
cavity mirrors caused by power
Uh'CLC~" in order to reach the LISA
In LISA the mirrors will be r·r"nnO""T UU.~LvHC and dedicated
that matter be
W&'3 tested at room
out.
the eX1De(~leG
13
the material
of the LCLC0C,V"IC; will

be around -70°C and further investigations at this temperature should be perfomed in
the future. Despite this, the results at room temperature provide a good estimation of the
behavior of the material since drastic differences are not foreseen at -70°C.
Another requirement for the telescope is the overall length stability which has to change
less than 2.5 ?Lm over the mission lifetime in order to avoid wavefront distortion and keep
the optical efficiency of the telescope about 85%. Outgassing of the material causes length
changes of the cavity. We have performed tests to identify the outgassing behavior of the
CFRP cavity and determined the shrinkage of the cavity to be 6.41?Lm which scaled with
the actual LISA telescope length would be about 17 ?Lm. Such length change is much larger
than the required 2.5?Lm and thus care must be taken when designing and constructing the
telescope.
In addition, a more LISA-like structure needs to be tested in the future. The outer shell
of the cavity confines the inner cylinder to prevent twisting or bending, but results in a
diameter that is too large to be used in the LISA SC. Further testing will need to be done
on a structure with dimensions that will be used on the LISA SC to determine if there is any
twisting or bending that is produced from the material outgassing in a non-uniform fashion.
Appendix A: Thermal insulator transfer function derivation
In this appendix we derive the theoretical transfer function of the thermal insulating
system installed in the vacuum tanks housing the cavities --see Fig. 15. To do so we
have assumed that heat transfer is only due to radiation. If conductive thermal links are
minimized their effect should be small.
Radiation heat transfer from one surface i to another j for spherical grey bodies (we
approximate the closed cylinders to spheres for simplicity: the cylinders are :::::::0.85 m in
height and :::::::1 m in diameter thus the approximation is justified) is
a 5.67 W ],
emissivities.
the
j is:
the
(AI)

where mj and Cj.h are the mass and specific heat, respectively. Equating Eqs. (AI) and (A2)
yields
(A3)
where for notation simplicity we define as
(A4)
In order to be able to solve the differential equation given in (A3) we linearize the terms
Ti;/t), i.e ..
(A5)
where To. k is the initial temperature and b.Tk (t) Tk (t) - To. k. The temperature fluctuations
in the system are small thus the linear approximation is justified (the error in the temperature
range from 300K to 305K is less than 0.2%). Substituion of Eq. (A5) into Eq. (A3) and
assuming To. iTo. j To (both bodies are initially at the same temperature) leads to
d C-b.T(t)
J dt J (A6)
The transfer function can be easily found by using the Laplace transform of Eq. (A6):
(A7)
where b.Ti,j(s) £ [b.Ti .j (t)] and the initial condition is set to zero. The transfer function
between both bodies is simply the ratio between b.TJ and b.T; and we use s iw to transform
from the Laplace domain to the Fourier domain:
1 H(w) = = --,;----
b.Ti(w) + 1 (A8)
which corresponds to a low-pass filter of first order with
1 (A9)
27T
in the CFRP tank contains five of PET -see 15.
h,WOt","" we need to six where
LUH.C'-L"-" between the aluminum
is the
15
function from the last PET layer and the cavity (where the heat capacitance of the stand
has to be taken into account). Obviously the same calculations can be done for the stainless
steel gold coated shields used for the Zerodur cavity.
Figure 16 shows the estimated transfer functions using the values given in Table 1. The
cut-off frequencies of H 1, .... 5 for the CFRP tank are ::::0.2 mHz whereas for the Zerodur tank
are ::::6.6 j.lHz. The difference is essentially due to the larger mass of the stainless steel shields
which pushes the cut-off frequency to the micro-Hertz range. H6 adds a pole at very low
frequency: 0.81 j.lHz and 4.3 j.lHz for the CFRP tank and Zerodur tank respectively. This
pole appears due to the large mass of the cavity and the stand together. The comparison
between the measured CFRP transfer function and the theoretical one is shown in Fig. 7.
The analysis shown here is a very simplified model of the actual one, for instance, con
ductive links have not been taken into account and very simplified geomtries have been used
for the radiative model. However. it is still useful to obtain an approximation of the ideal
transfer function of the system. As shown in Fig. 7 the theoretical and experimental transfer
functions are in good agreement at low frequencies (f ::;0.2 mHz). For higher frequencies the
experimental transfer function cannot be measured due to inherent noise of the temperature
sensors.
[1] LISA Study Team, LISA for the detection and observation of gravitational waves. Pre-phase
A, Tech. Rep. 244 (l\Iax Plank fur Quantenoptik, 1998).
[2] K. Danzmann, Adv. in Space Res. 32, 1233 (2003).
[3] LISA International Science Team (LIST), LISA:
(European Space Agency, 2011).
I'/W'/f'/'f,'.11 a hidden
O. Jennrich. Class. Quantum Grav. 26, 153001 (2009).
Tech. Rep.
:\1. Armano, 1\.1. Benedetti, .l. Bogenstahl, D. Bortolllzzi, P. Bosetti, N. Brandt, A. Caval-
G. Ciani, 1. A. Cruise. K. Danzmann. 1. Diepholz, G. Dixon, R. DolesL
J. Fallste. 1. D. W. Fichter. :tv1. Freschi. A. C. Garda, A. Grynagier,
F. Gllzm'an. E. Fitzsimons. G. Heinzel. ;\1. D. J. Hough, 1\.1. Hueller,
D. O . .1ennrich. B. .lohlander. C.
::\amara. A. D. D. ::":"icolodi. ;\1.
16
D.
11.
1. ">La LCV;::'. P. ;\Ic-
E.

G. Racca, J. Ramos-Castro, D. Robertson, J. Sanjuan, M. Schulte, D. Shaul, M. Smit, 1. Stag
naro, F. Steier, T. Sumner, N. Tateo, D. Tombolato, G. Vischer. S. Vitale, G. 'Wanner,
H. Ward, S. vVaschke, V. Wand, P. Wass, VV. 'Weber, T. Ziegler, and P. Zweifel, Class. Quan
tum Grav. 26, 094001 (2009).
[6] P. Cafiizares. A. Conchillo, E. Garcia-Berro, 1. Gesa, C. GrimanL I. Llori, A. Lobo, I. 11ateos,
M. Nofrarias, J. Ramos-Castro, and J. Sanjuan, Class. Quantum Grav. 26,094005 (2009).
[7] The received power from the far SC is about 100 pW which is equivalent to pathlength noise
of 8pmHz-1/ 2 .
[8] Any distance fluctuation between the different optical components will mimic the effect of
GWs on the PMs.
[9] A. Preston, Stability of mater'ials for use in space-based interferometric missions, Ph.D. thesis,
University of Florida (2010).
[10] M. Sallusti, P. Gath, D. Weise, M. Berger, and H. R. Schulte, Class. Quantum Grav. 26,
094015 (2009).
[11] D. Weise, Telescope Subsystem Specification LISA-ASD-RS3300, Tech, Rep, (EADS Astrium,
2008).
[12] T. Schuldt, M. Gohlke, D. Weise, U. Johann, and C. Braxmaier, Optomechatronic Technologies
(ISOT), 2010 International Symposium on (IEEE) (2009).
[13] R. W. P. Drever, J. L. HalL F. V. Kowalski, J. Hough, G. M. Ford, M. A. J, and H. Ward,
App!. Phys. B 31. 97 (1983).
[14] E. D. Black Am. J. Phys. 69, 79 (2001).
[15] D. Shoemaker, A. Brillet, C. Nary Man. O. Cn§gut. and G. Kerr, Opt. Lett. 14, 609 (1989).
[16] R. Cruz, Development of the UF LISA benchtop simulator
Ph.D. thesis, University of Florida (2006).
the i'ime delay interferometry,
R. Cruz. J. I. Thorpe. A, Preston. R. Delgadillo. ;\1. Hartman. S. Mytrik A. 'Vorley,
G. Boothe. R. G. Sridhar. S. Klimenko, D. B. Tanner. and G. Mueller. Class. Quantum
Grav. 23. S751 (2006).
A. Arie. S. E. K. Gustafson. and R. 1. Opt. Lett. 17, 1204
G. C. W. Lenth. and C. Ortiz. B 32. 145
V. Leonhardt and .1. B. 45. 4142
J. 1. UU",HI',) }\L Taubman. B. Tiemann. F. 1. O. Pfister. and .J.
17

IEEE Trans. Instr. Meas. 48, 583 (1999).
~22] B. Argence, H. Halloin. O. Jeannin, P. PraL O. Turazza. E. de Vismes, G. Auger, and
E. Plagnol, Phys. Rev. D 81. 082002 (2010).
[23] J. L. Culhane, 1. K. Harra, A. :M. James. K. Al-Janabi. 1. J. Bradley, R. A. Chaudry, K. Rees,
J. A. Tandy, P. Thomas, ::\1. C. R. Whillock, B. Winter. G. A. Doschek, C. 1V1. Korendyke,
C. M. Brown. S. Myers, J. ::\:Iariska, J. Seely, J. Lang, B. J. Kent. B. M. Shaughnessy, P. R.
Young, G. M. Simnett, C. M. Castelli. S. Mahmoud, H. Mapson-Menard, B. J. Probyn, R. J.
Thomas, J. Davila, K. Dere, D. \Vindt, J. Shea, R. Hagood, R. Moye, H. Hara. T. 'Watanabe,
K. Matsuzaki, T. Kosugi, V. Hansteen, and O. WikstoL Solar Physics 243, 19 (2007).
[24] A. Davis. LISA quadpod spacer thermal study final report, Tech. Rep. (Edge Space Systems,
2008).
[25] H. Peabody and S. M. ::\lerkowitz, AlP Conf.Proc. 873, 204 (2006).
[26] J. Livas, Personal communication (2011).
[27] .J. Livas, Preliminary Telescope Requirements and Spacer Design, Tech. Rep. LISA Project
internal report LISA-MSE-TN. Version 0, Issue 3 (NASA Goddard Space Flight Center, 2011).
[281 F. Incropera and D. De Witt. Fundamentals of heat transfer (John Wiley & Sons (New York),
1981).
18

FIG. 1. Left: LISA orbit. Right: LISA's equilateral triangle constellation. (Not to scale).
I dOB-PM~ ---t~ ~------, : I
sc sc
FIG. 2. LISA arm scheme. The distance between the PMs must be measured at the pico-meter
level in the milli-Hertz range in order to ensure GvV detection. x=0.6 m, dOB-PM c::::: 0.05 m and
dOB-OB c::::: 5Gm (OB stands for optical bench). Distance fluctuations between the two mirrors
of the telescope translate directly into path-length noise and thus spoil the LISA sensitivity. The
noise budget assigned to this effect is given by Eq. (5).
19

CFRP cylinder - -,
I secondary
30 l=~~=::;~:::==~====::~~=~~£III·to/from OB
to/from far SC
400mm collimated beam
primary mirror
0.6 m
FIG. 3. Scheme of the LISA telescope current baseline design. The cylinder-shaped spacer (0.55 m
diameter and 1 m length) is made of CFRP [10].
BN data
Zerodur PO
Tank 1
FIG. 4. Set-up used to determine the relative dimensional stability of the CFRP cavity. All
the lasers of the set-up are Nd:YAG with a wavelength of 1064 nm. Each laser is locked to its
respective cavity using the PDH technique. In this manner the frequency of the laser tracks the
fluctuations of the EOi-.l: modulator, BS: power beam splitter, PBS:
beam PD: photo-detector and
20
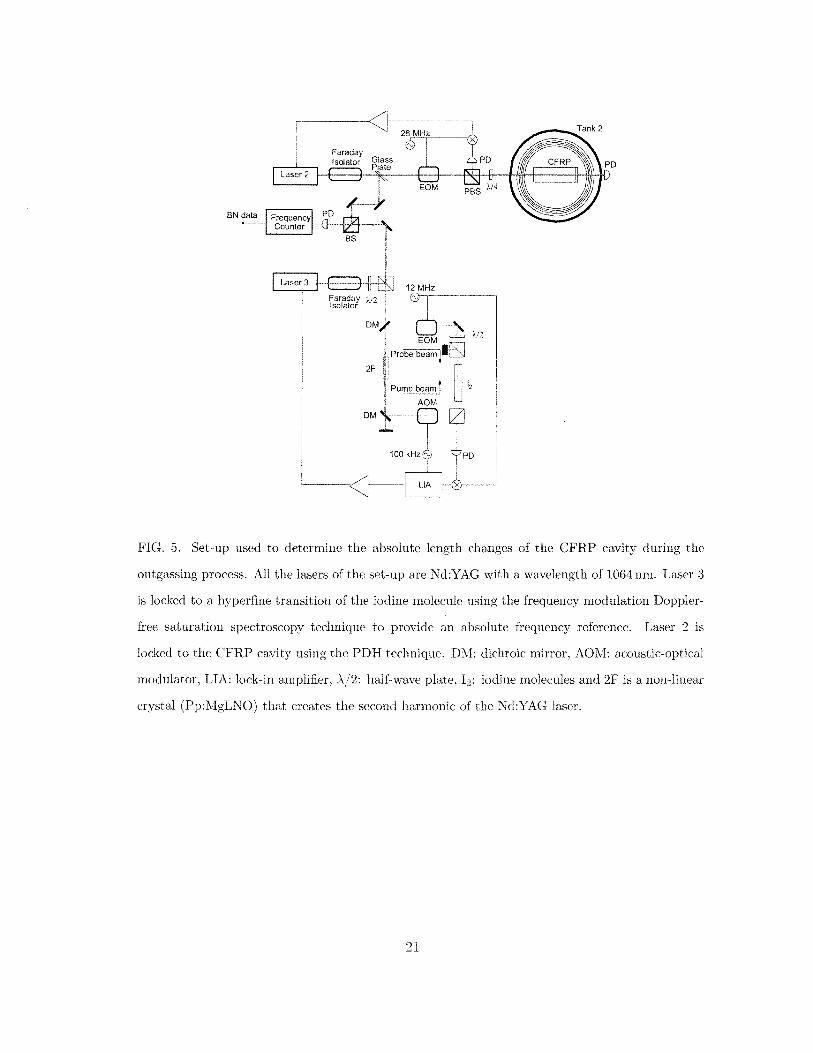
FIG. 5. Set-up used to determine the absolute length changes of the CFRP cavity during the
outgassing process. All the lasers of the set-up are Nd:YAG with a wavelength of 1064 nm. Laser 3
is locked to a hyperfine transition of the iodine molecule using the frequency modulation Doppler-
free saturation spectroscopy technique to provide an absolute frequency reference. Laser 2 is
locked to the CFRP cavity using the PDH technique. DM: dichroic mirror, AO;\!I: acoustic-optical
modulator, LIA: lock-in amplifier, ).,/2: half-wave plate. 12 : iodine molecules and 2F is a non-linear
crystal (Pp:MgLNO) that creates the second harmonic of the Nd:YAG laser.
21
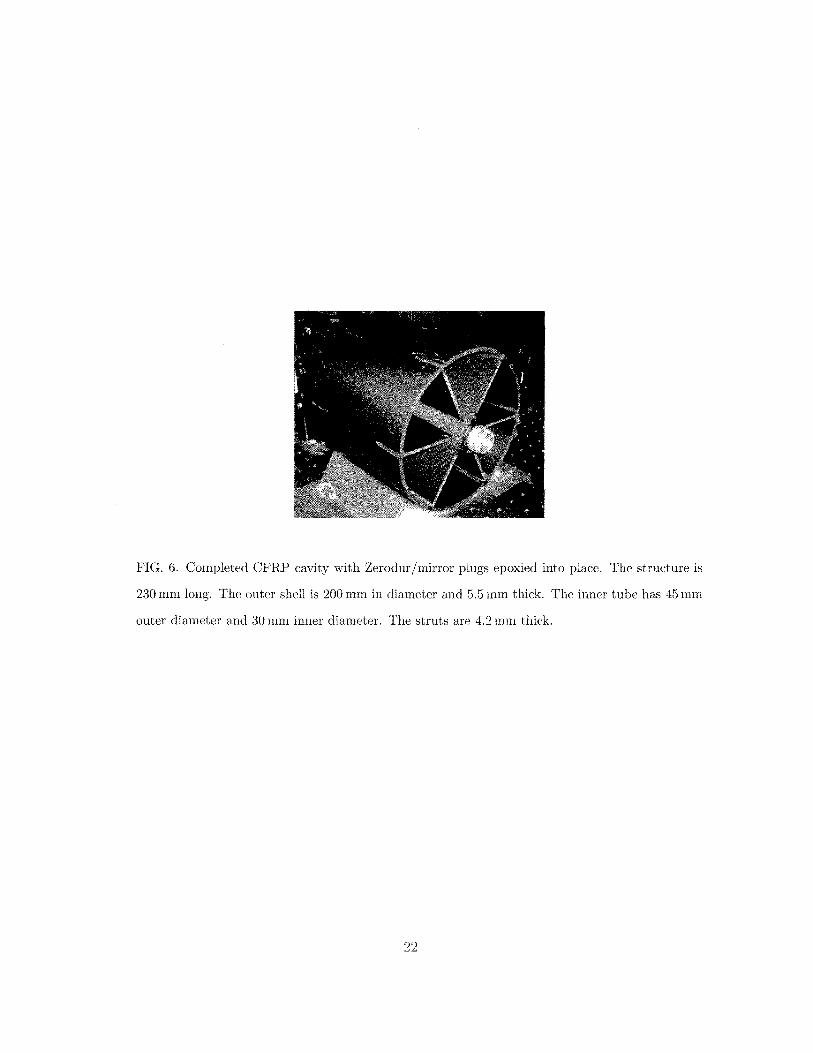
FIG. 6. Completed CFRP cavity with Zerodur/mirror plugs epoxied into place. The structure is
230 mm long. The outer shell is 200 mm in diameter and 5.5 mm thick. The inner tube has 45 mm
outer diameter and 30 mm inner diameter. The struts are 4.2 mm thick.
22
N I
~ S
N :;:01-II)
-2 -1 10 10
frequency [mHzj
FIG. 7. Left: laboratory temperature fluctuations (black trace) and cavity temperature fluctuations
(red trace). Right: transfer function between laboratory and cavity temperature fluctuations.
Black trace is the theoretical one -see Appendix A. The red trace is the measured one and the
blue one is the required to meet the requirements. The pink area shows the frequency range where
the temperature stability is not good enough for our experiments in the LISA band.
FIG. 8. ivleasured
ations
E ..s
fluctuations
the estimated CTE.
and ones due to temperature fluctu-
23

FIG. 9. Expansion/contraction of the mirrors due to the power build up in the cavity. L1 is the
length of the cavity at a given temperature and in absence of light. L2 is the length of the cavity
when the laser is in resonance with the cavity. The temperature of the mirrors increases due to
absorption and, consequently, they expand due to their CTE. The length of the mirrors of the
cavity (and the cavity itself) reaches a steady-state for a given power built up in the cavity. If the
power fluctuates the length of the mirrors fluctuates accordingly.
0.9 I
0.8 I
0.7
0.6
S 0.5 >
N c: ;>- 0.4
0.3
0.2
0.1
0 10-5 10-3 10-2 10-1
frequency [Hz]
FIG. 10. Coherence function between transmitted poweL P" and beat-note for P,=60 /1YV and
mYV.
24
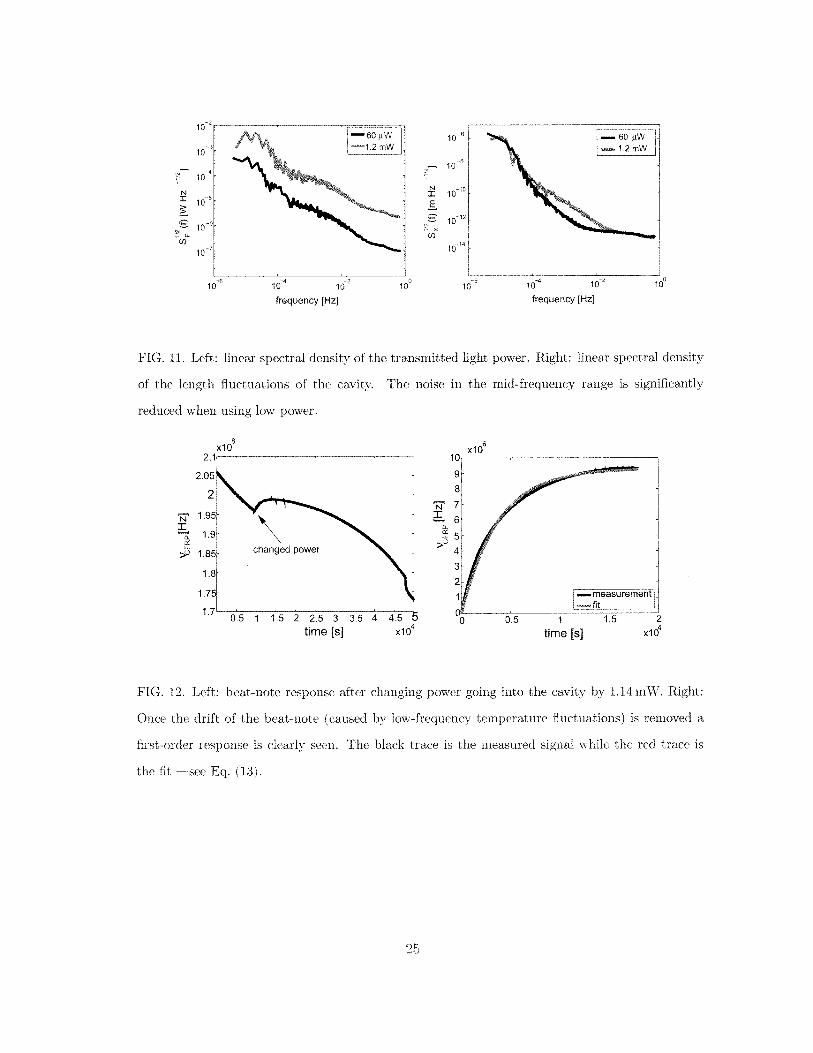
frequency [Hz] frequency [Hz)
FIG. 11. Left: linear spectral density of the transmitted light power. Right: linear spectral density
of the length fluctuations of the cavity. The noise in the mid-frequency range is significantly
reduced when using low power.
8 x10
changed power
1 1.5 2 2.5 3 3.5 4
time [s] x104
o 0.5 1
time [s]
FIG. 12. Left: beat-note response after changing power going into the cavity by 1.14 m VV. Right:
Once the drift of the beat-note (caused by low-frequency temperature fluctuations) is removed a
first-order response is clearly seen. The black trace is the measured signal while the red trace is
the fit --see Eq. (13).
25

1O-~
10-6
10-7
N 10-8
I 10-9
.s
..-.. 10-10 '<-
~ 10-11
'CnX
10-12
10-13
r 10-11
10-5 10-4 10-3 10-2 10-1 10°
frequency [Hz]
FIG. 13. Stability results for two different power levels: 1.2mW (red trace) and 60p,W (magenta
trace). The predicted stability using Eq. (14) is also shown for the two different measurements
(black and green traces). The blue-dashed line is the LISA telescope requirement. The discrepancy
for .f :'SO. 1 mHz is because the temperature and the beat-note data were not measured simulta-
neously and the temperature fluctuations during the beat-note measurement were lower than the
ones during the temperature measurements. The yellow trace shows the Zerodur cavity stability
measurements which sets the noise levels of the CFRP stability measurements.
26

-1
~-2 ~
temperature total
x outgassing (i) outgassing (ii)
fit -~C===~5=====1LO----~15~--~2~O----~25~--~30
time [day]
FIG. 14. Red trace: the measured length change of the CFRP cavity. Black and magenta traces:
length change in the cavity due to outgassing, i.e., after removing the effect of the temperature
(blue trace). The temperature data and total length change traces correspond to the outgassing
data given by the black trace. The same process was done to the magenta trace although the
temperature and total length change are not shown in the plot for clarity.
cavity+stand
PET layers
FIG. 15. Thermal insulator concept. The cavity is inside the tank sitting on top of a stand
and surrounded PET shields. The PET shields closed Idem for the Zerodur
but coated shields instead PET ones.
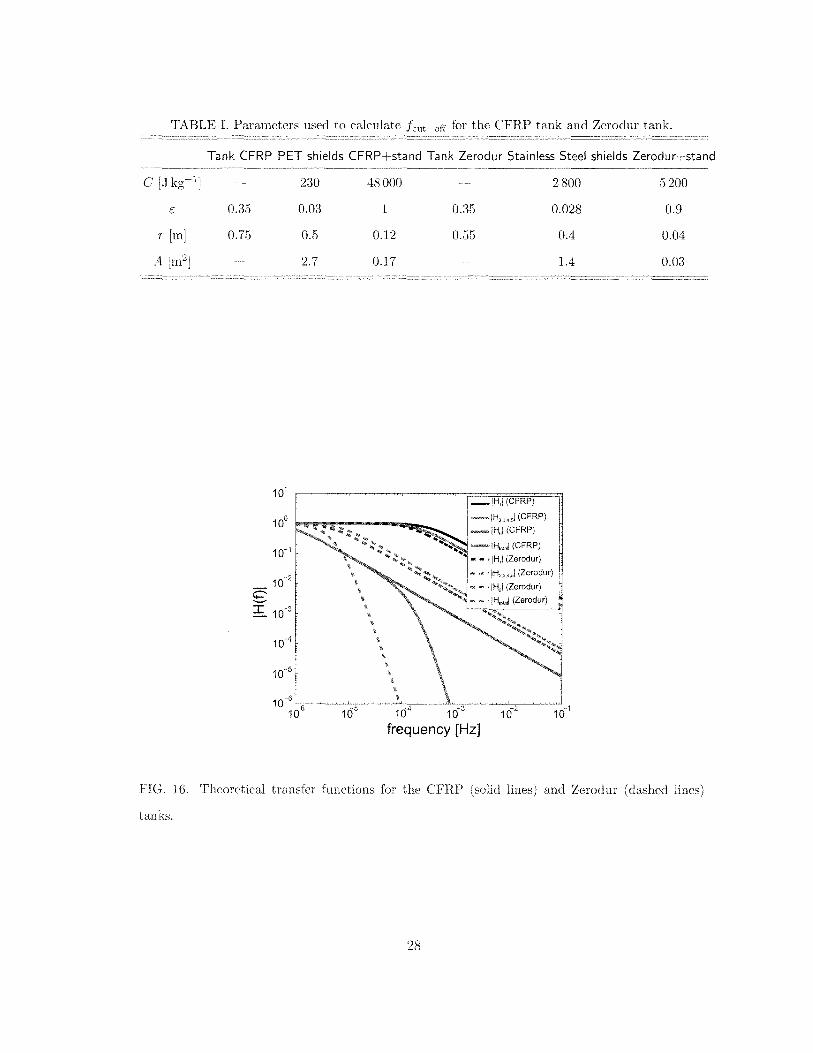
TABLE 1. Parameters used to calculate for the CFRP tank and Zerodur tank.
Tank CFRP PET shields CFRP+stand Tank Zerodur Stainless Steel shields Zerodur+stand
C [J 230 48000 2800 5200
0.35 0.03 1 0.35 0.028 0.9
r [m] 0.75 0.5 0.12 0.55 0.4 0.04
A [m2] 2.7 0.17 1.4 0.03
10-6~~~~~~~'-;-~~~~~~'-;-~~.dl 1(j6 165 164 10-3 10-2 10-1
frequency [Hz]
FIG. 16. Theoretical transfer functions for the CFRP and Zerod ur (dashed
tanks.
28


![CFRP [Wet-preg]](https://static.fdocuments.us/doc/165x107/546e6828b4af9faa268b4674/cfrp-wet-preg.jpg)