CeweCetrics - Cewe :: Home€¦ · · 2015-01-08reports. These can be adapted, and new ones...
40
CeweCetrics Start up manual
Transcript of CeweCetrics - Cewe :: Home€¦ · · 2015-01-08reports. These can be adapted, and new ones...

CeweCetricsStart up manual

2
ContentsIntroduction....................................................................3
What is Cetrics? .................................................................. 3An outline ............................................................................ 3Definitions ........................................................................... 4Typical fields of application ................................................ 6Documentation ................................................................... 7Product support .................................................................. 7
Installation .....................................................................8System requirements ......................................................... 8Operating system requirements ......................................... 8Installing Cetrics ................................................................. 9
An overview of the Cetrics user interface .................. 10Shortcut commands ......................................................... 10Drag and drop .................................................................. 11
Your first system .......................................................... 12Adding a terminal ............................................................. 12Reading ............................................................................ 17Collecting .......................................................................... 18Synchronising the clock ................................................... 19Reviewing collected values ............................................. 19View as graph ................................................................... 20Review series ................................................................... 21Viewing events and notes ................................................ 22Automating data collection ............................................... 23
Using groups and tariffs .............................................. 27Adding a group ................................................................. 27Creating a group template ............................................... 28Creating a tariff ................................................................. 29
Creating reports ........................................................... 33Adapting reports ............................................................... 33
Maintaining the system ............................................... 34Backing up the database ................................................. 34Restoring the database from a backup copy .................. 35Archiving data series and events .................................... 36
Administering users .................................................... 37
3
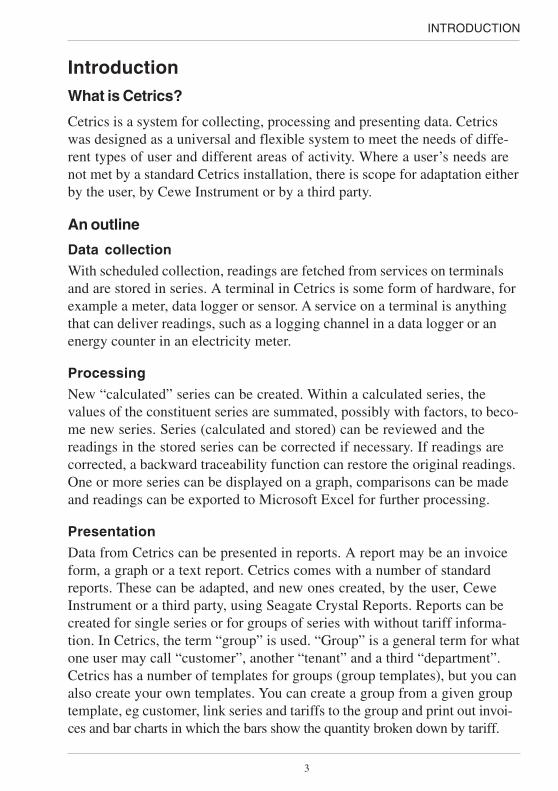
IntroductionWhat is Cetrics?
Cetrics is a system for collecting, processing and presenting data. Cetricswas designed as a universal and flexible system to meet the needs of diffe-rent types of user and different areas of activity. Where a user’s needs arenot met by a standard Cetrics installation, there is scope for adaptation eitherby the user, by Cewe Instrument or by a third party.
An outline
Data collection
With scheduled collection, readings are fetched from services on terminalsand are stored in series. A terminal in Cetrics is some form of hardware, forexample a meter, data logger or sensor. A service on a terminal is anythingthat can deliver readings, such as a logging channel in a data logger or anenergy counter in an electricity meter.
Processing
New “calculated” series can be created. Within a calculated series, thevalues of the constituent series are summated, possibly with factors, to beco-me new series. Series (calculated and stored) can be reviewed and thereadings in the stored series can be corrected if necessary. If readings arecorrected, a backward traceability function can restore the original readings.One or more series can be displayed on a graph, comparisons can be madeand readings can be exported to Microsoft Excel for further processing.
Presentation
Data from Cetrics can be presented in reports. A report may be an invoiceform, a graph or a text report. Cetrics comes with a number of standardreports. These can be adapted, and new ones created, by the user, CeweInstrument or a third party, using Seagate Crystal Reports. Reports can becreated for single series or for groups of series with without tariff informa-tion. In Cetrics, the term “group” is used. “Group” is a general term for whatone user may call “customer”, another “tenant” and a third “department”.Cetrics has a number of templates for groups (group templates), but you canalso create your own templates. You can create a group from a given grouptemplate, eg customer, link series and tariffs to the group and print out invoi-ces and bar charts in which the bars show the quantity broken down by tariff.
INTRODUCTION

4
INTRODUCTION
Definitions
Base unit A base unit has the factor 1. Derived units are statedrelative to the base unit. Example: the base unit forthe derived units kWh (factor 1000) and MWh (factor1000000) is Wh.
Calculated series A series formed by summating the readings from anumber of stored or calculated series.
Data series A data series is a collection of time-discrete readings.Readings collected by Cetrics from terminal servicesare stored in stored data series. Stored series can besummated in calculated series.
Group Since Cetrics is a universal system for differentcategories of user, a universal term is needed to coverwhat one user may call “customer”, another “tenant”and a third “department”. Group templates arecreated for the various types of group (customer,department, etc.).
Event An event may be an alarm, a event or a note. Alarmsare regarded as more serious than events. Notes arealways linked to a reading, whilst alarms and eventsmay refer to a terminal or to the system as a whole.
Stored series A stored data series is a collection of time-discretereadings stored in the Cetrics database.
Reading On reading, values (readings) are collected from theservices of a terminal and presented without beingstored in data series.
Object The term “object” is used as a general term forterminal, series, service, tariff, etc.
Protocol In Cetrics, a protocol is a file containing a set of rulesgoverning communication with one or more types ofterminal. New protocols can be installed in Cetrics.Some protocols can be set up in more than one way.In your system you can set up several types ofterminal which use the same protocol but with
different settings.
5
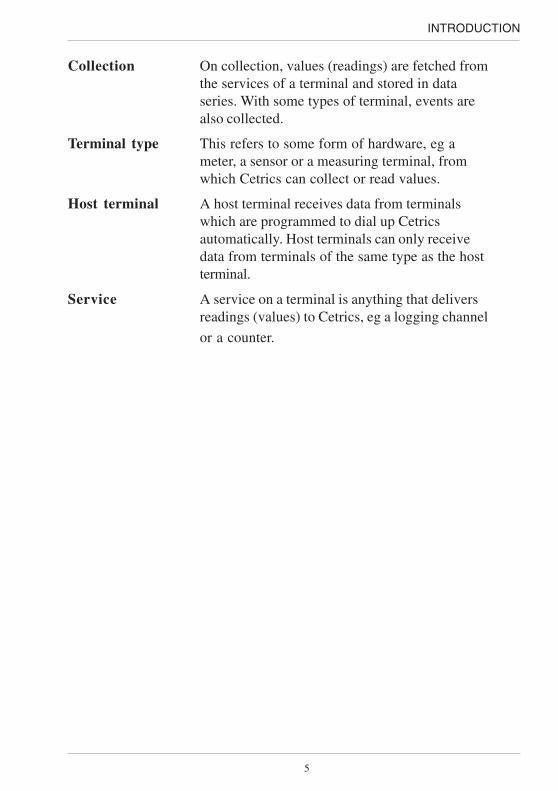
Collection On collection, values (readings) are fetched fromthe services of a terminal and stored in dataseries. With some types of terminal, events arealso collected.
Terminal type This refers to some form of hardware, eg ameter, a sensor or a measuring terminal, fromwhich Cetrics can collect or read values.
Host terminal A host terminal receives data from terminalswhich are programmed to dial up Cetricsautomatically. Host terminals can only receivedata from terminals of the same type as the hostterminal.
Service A service on a terminal is anything that deliversreadings (values) to Cetrics, eg a logging channel
or a counter.
INTRODUCTION

6
Typical fields of application
Industry
Cetrics can be used to create statistics which can form the basis of energyefficiency improvements and so cut energy costs. By studying the energyprofiles, production hours can be planned to create a more uniform profileand reduce the costs of power subscriptions, for example.
In Cetrics, tariffs can be linked to customers. This makes the system aperfect tool for cost allocation, both internally and externally.
The costs of consumption can be followed up and so linked to the productsproduced. This can be very valuable in energy-hungry production processeswhere the costs of consumption are part of the production costs.
Buildings
In many countries, the electricity market is now deregulated, so thateveryone is free to choose their energy supplier. This may not be sosignificant for individuals, but when residents’ associations and tenants joinforces to negotiate a joint agreement, there is ample scope for cutting thecost of energy. Having a joint contract for a large group minimises thenumber of standing charges, a major cost item. The energy costs for thebuilding must now be shared between the residents/tenants. Cetrics is asuitable tool for collecting metered data and allocating the costs fairly.
Power suppliers
Data is collected from metering points at a relatively low cost via one of thecommunication media currently available. Today’s deregulated electricitymarket also demands more frequent readings and correct billing. Customerswant to pay for what they have used and no more.
Cetrics offers an open solution in which different makes of meter can beread. The system is tailored for today’s needs in terms of the billing, export
and presentation of metering data.
INTRODUCTION

7
Documentation
Your Cetrics documentation includes this “Getting Started” manual and on-line help.
Getting Started manual
This “Getting Started” manual provides an overview of what you can do inCetrics and helps you start using the program without delay. It containseverything you need to know about how to install Cetrics and set up yourfirst system.
On-line help
On-line help is a reference manual which is displayed on the computerscreen. To start the on-line help, click Contents and Index in the Helpmenu of the program. You can also press the F1 key in a dialog or click theHelp button to see explanatory text about that particular dialog.
Product support
To ensure that you get the best out of our products, Cewe Instrument offersservices such as technical support, training and consultation. Visit ourwebsite www.ceweinstrument.se for more information or contact us via
e-mail at [email protected].
INTRODUCTION
8
Installation
System requirements
The system requirements for Cetrics depend on the configurationinstalled. A configuration may be everything from a single-user systemwith a small number of terminals and series, to a system with a largenumber of users and thousands of terminals and series. These are theminimum requirements for a single-user system with a few terminalsand series:
• Intel Pentium II 400 MHz
• 128 MB RAM
• CD-ROM (for installation)
• 1 GB free hard disk space (for a more exact calculation of hard diskspace, see below)
• Monitor with a resolution of 800x600 pixels and 256 colours(recommended resolution 1024x768 pixels)
This is how to calculate the required hard disk space in bytes:
Number of series x number of readings stored per day x number ofyears for which data must be stored in the database without beingarchived x 365 x 30.
The calculation only allows for the storage of readings in series. Otherparts of Cetrics also occupy hard disk space, but in relation to thestorage of readings, this is often negligible.
Operating system requirements
Cetrics will run under Windows NT 4.0 with Service Pack 4 or later,
and Windows 2000.
INSTALLATION

9
Installing Cetrics
On the install CD there are two install options:
Full install and installation of a host for connections.
Installation procedure:
1. Click the Windows Start button and choose Run.
2. In the dialog that appears, choose Browse. For a full installation,run Setup.exe directly on the installations CD.
To install the connection host, first open the Connection Hostfolder, then run Setup.exe.
3. Click Open.
4. Click OK in the Run dialog.
5. The install program starts. Follow the instructions on the screen tocomplete the installation.
Registering your program
We recommend that you register your program. To do this, fill in the
registration card supplied and send it to Cewe Instrument.
INSTALLATION

10
AN OVERVIEW OF CETRICS
An overview of the Cetrics user interface
Toolbar – This contains menus and icons for shortcuts to various functions.
System Explorer – Here you can organise your system. The SystemExplorer is also your starting point when you want to perform variousfunctions for the objects you have created. Select an object, eg a terminal,and right-click on it. The menu that appears shows what you can do on thatparticular object. You can open more than one window in the SystemExplorer.
Shortcut commands
The mouse button on the right can be used at many places in Cetrics toperform various functions quickly. Select an object and right-click on it.Possible functions for that object are listed in the pop-up menu that appears.The functions can also be reached via the toolbar menus, but it is quickerand more efficient to right-click.
To obtain help with a given function you can press F1 or click the Helpbutton in the dialog you need help with.
To open the System Explorer quickly, press F9.
To open the Event Log quickly, press F8.
To update the current window, eg the System Explorer, press F5.

11
Drag and drop
There are many places in Cetrics where you can use the “drag and drop”method to move or add objects in a window. To do this, select an object,press and hold down the left mouse button, “drag” the object to the placewhere you want to move/copy it to and release the mouse button. Forexample, in the System Explorer, you can move a terminal to another folder
by using the drag and drop method.
AN OVERVIEW OF CETRICS

12
Your first system
Adding a terminal
A terminal in Cetrics is a hardware device from which readings can be reador collected. Examples of terminals are meters, data loggers and sensors.
When you add a terminal, you must choose a terminal type for it. Cetrics hasa number of pre-installed terminal types, but you can add your own. If youwant to add a terminal of a type that is not pre-installed, you must add theterminal type first. Instructions for doing this are given under Adding aterminal type.
Procedure:
1. Open the System Explorer by clicking the System Explorer icon on thetoolbar or by pressing F9.
2. Click File, New, Terminal and click on the required terminal type (orright-click on the required folder, choose New, Terminal and click onthe required terminal type).
YOUR FIRST SYSTEM

13
The Terminal tab:
3. Give the terminal a name so that you can identify it in the system.
4. The Terminal Type field shows which terminal type you have chosenfor the terminal. You cannot change the terminal type later.
5. In the Description field you can enter information such as date ofpurchase, date of last service, location, etc.
YOUR FIRST SYSTEM

14
The Communication tab:
6. Identity is used by the protocol when communicating with the terminal.What you enter under identity depends on terminal type and protocol.For example, for Cewe Instrument’s Prometer the serial number of theterminal is entered as the identity.
7. Whether or not the Password field must be filled in depends on the typeof terminal. Some types of terminal always require a password, othershave no password. For some types of terminal you can choose whetheror not to use a password.
8. Now you must specify how communication with the terminal will takeplace. Start by specifying the connection method by choosing one of theoptions in the Connect with list.
9. Choose a communication port from the list or type the name of anotherport, eg COM5, directly into the Port field.
YOUR FIRST SYSTEM

15
10. If you chose modem as the method of communication you must enter atelephone number. Enter all the necessary digits, including the digit toaccess an outside line, if needed. If your modem requires a special initia-lisation string you can enter Hayes-compatible commands in the Mo-dem initialisation field. The text string you enter here is sent to themodem before dialup. If your computer is connected to a network, youcan use another computer as a host computer to collect data. When youuse a host computer, you use communication ports on another computeron the network instead of using local ports on your computer. For moreinformation about connection via another computer, see the on-line help.
11. Now check that communication is working by clicking Test.
The Services tab:
12. The services available for the terminal type are shown here. Select therequired services from the Services not activated list and click Add.
YOUR FIRST SYSTEM

16
By default, a data series is created in which all readings are placed whencollected. If you want to change the default settings for the service (youmay want to connect an alarm to the service or change the presentationunit), click Properties. For more information about the properties of aservice, see the on-line help.
Tip: you can use the drag and drop method to add services to the Activatedservices window.
The Collection tab:
13. Fill in this tab if you want to schedule data collection. You do not need tofill in this tab if you are only going to collect data manually from theterminal. To see how to schedule data collection, see under Schedulingdata collection.
14. Click OK.
YOUR FIRST SYSTEM

17
ReadingOn reading, you receive values for the services you chose to read. Thesevalues (readings) are displayed on the screen but are not stored in thedatabase. You can choose to read all the services of a terminal or a singleservice, as well as services from other terminals.
When you choose to read services, a Read services window opens. Onreading, all the services in the window are read in turn.
Procedure:
1. Select the terminal or service you want to read, right-click and clickRead.
2. The Read Services window opens. If you selected a terminal, allservices on that terminal appear in the window.
Tip: You can add services to this window by dragging and dropping terminalsor services from the System Explorer.
3. Click Reading on the menu bar, then Read, or click the Read icon. Allthe services in the window will be read.
4. Cetrics reads the service(s) and displays value, unit, time of reading andcomment for each service.
5. Close the Read Services window. (Note that readings are not stored inthe database.)
YOUR FIRST SYSTEM

18
Note: You cannot read from a terminal from which data is currently beingcollected.
CollectingOn collection, the services of a terminals are read and, unlike when reading,the data obtained is stored in the database.
Another difference compared with reading is that events stored in theterminal are transferred to Cetrics on collection and stored in the Event login the Terminal sublog.
Procedure:
1. In the System Explorer, select the terminal that you want to collectdata from. Right-click and choose Collect.
2. The collector starts. Readings for the services and any events arefetched from the terminal. Collected values for a service are saved in aseries by default. If there is no series linked to the service, the systemcreates a series and stores the readings in it. If something goes wrongduring the collection process, information about this is saved in the eventlog. The event log is covered in Viewing events and notes.
YOUR FIRST SYSTEM

19
Synchronising the clock
On collection, the clock in the terminal is synchronised within the limits setup in Tools | Options under the Collection tab. If you right-click on aterminal and choose Synchronise clock, the clock will be synchronisedregardless of indication error. In other words, the system disregards thelimits set up in Tools | Options.
Tip: If you want to synchronise the clocks of a large number of terminalsyou can select the Set clock at next collection regardless of indicationerror box under the Collection tab in the properties of the terminal. Theclock in the relevant terminal will then be synchronised at the next collection.
Reviewing collected values
When you have done a collection and values have been saved in data seriesyou can review your values in the View as graph and Review seriesfunctions. In View as graph, several series can be displayed at the sametime and the values for the series can be exported to Microsoft Excel. InReview series, “raw data” for a series is displayed. Values in a storedseries are displayed with the times when they were collected. Values in acalculated series are displayed in accordance with the time intervals speci-fied in properties for the series. Values in a stored series can be correctedand new values added to the series.
The time stamp of a value refers to the end of a period. For example, amean value generated between 13:00 and 14:00 is time-stamped 14:00.
YOUR FIRST SYSTEM

20
View as graph
Procedure:
1. Select a data series in the System Explorer, right-click and click Viewas graph.
2. You can choose to review your values over different periods and in differentgroupings. You can find these two functions in the View menu and on thetoolbar. If no grouping is chosen, the values are displayed with the time whenthey were saved to the database. If grouping is chosen, the values aresummated on the basis of the chosen grouping. If you choose to group thevalues on a “per hour” basis, all values between, for example, 00.01 and01.00 will be summated and presented with the time stamp 01.00.Calculated series can only be displayed with grouping.
3. You can view more than one series on the same graph. You can use thedrag and drop method to fetch other series from the System Explorerand drag them to the View graph window.
Tip: If you want to quickly see more of a graph than you can see in thewindow you can right-click on the graph and, keeping the mouse buttonpressed, use the mouse to move the graph to the right, left up or down. Youcan also zoom in on a region by pressing the left mouse button.
YOUR FIRST SYSTEM

21
Review series
Procedure:
1. Select a data series in the System Explorer, right-click and clickReview series.
2. Choose period and click OK.
• You can add values to the series. Select the value and click Insert. Aninserted value is marked “Manually inserted”.
• You can change values in the series. Select the value and click Insert. Anchanged value is marked “Manually changed”. Earlier versions of the valueare saved and can be viewed with the View | Versions function.
3. Notes can be viewed in the View | Notes function. To see notes formore than one series at a time, open the Event log and choose Notes.The event log is covered in Viewing events and notes.
Note that values in calculated series cannot be corrected and new valuescannot be added. So in a calculated series you can only review values.
Tip: When values are added, the time is counted up by the interval stated inthe Interval field in the properties of the series. If you specify an interval in
the properties of the series, entry will be far quicker.
YOUR FIRST SYSTEM

22
Viewing events and notes
Events and notes are stored in a continuously updated list which is displayedin the Event log. The Event log has three sub-logs, System, Terminal andNote. System refers to events that occurred in the system, eg errors on datacollection or incorrect login attempts by a user. Terminal relates to eventscollected from terminals. Events have been found stored in the terminal andtransferred to Cetrics on data collection (not supported by all terminaltypes). Notes relates to events that are linked to a particular value. Theymay be either notes collected together with values from a terminal and notesstored for a value by the system, eg on manual correction in the Reviewseries function. By creating filters, events from a particular source and witha particular id can be hidden.You can sort events in two ways: on the basis of the event’s time-stamp, iewhen the event occurred, and on the basis of the time when the event wascollected. If you want to make sure that new events that have beencollected always go to the top of the list, you must choose to arrange theevents by time of collection (the event may have happened earlier, but hasonly recently been collected by Cetrics). The Arrange events by functionis in the View menu.
For further information about the event log, see the on-line help.
IYOUR FIRST SYSTEM
23
Automating data collection
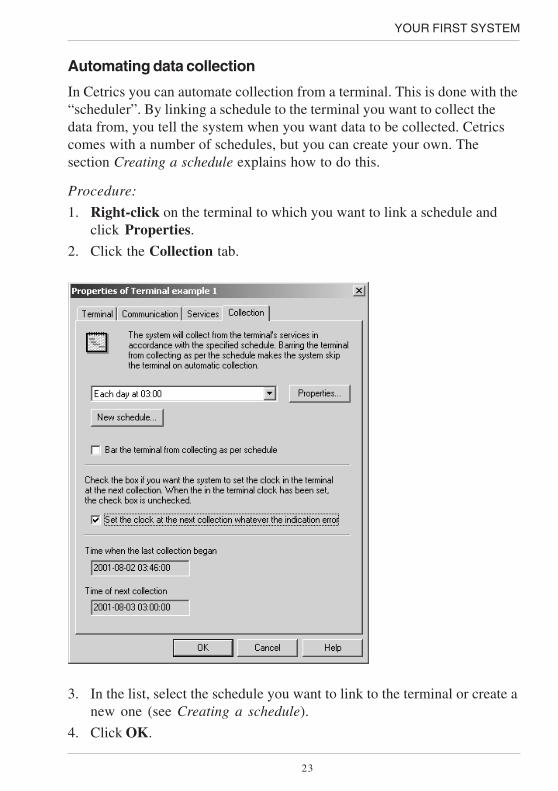
In Cetrics you can automate collection from a terminal. This is done with the“scheduler”. By linking a schedule to the terminal you want to collect thedata from, you tell the system when you want data to be collected. Cetricscomes with a number of schedules, but you can create your own. Thesection Creating a schedule explains how to do this.
Procedure:
1. Right-click on the terminal to which you want to link a schedule andclick Properties.
2. Click the Collection tab.
3. In the list, select the schedule you want to link to the terminal or create anew one (see Creating a schedule).
4. Click OK.
YOUR FIRST SYSTEM

24
5. To activate automatic collection you need to start the Scheduler. ChooseStart scheduler in the Programs menu.
Dial-in terminals
Terminals which initiate collection by contacting Cetrics are known as dial-interminals. A terminal host is required for automated collection from dial-interminals. The terminal host answers calls from all dial-in terminals of thesame type and stores the data from the terminals in the system. Dial-interminal that do not exist in the system are created by the terminal host.
The procedure for adding a terminal host is more or less the same as foradding a terminal (see Adding a terminal), with certain exceptions. Theterminal type for the host specifies the types of terminal for which it isintended. It can only host terminals of the same type. Identity andPassword on the Communication tab do not refer to a specific terminal(the host acts for several terminals). Telephone number is not used.Ignore the Services tab. A terminal host has no services. Do not specify aschedule on the Collection tab. A terminal host is always active when thescheduler is running. On the other hand, you can prevent collection bychecking the Disable terminal host box. The Scheduler must be runningfor the terminal host to receive from dial-in terminals.
YOUR FIRST SYSTEM

25
Creating a schedule
A schedule lays down one or more times when data will be collectedautomatically.
Procedure:
1. In the File menu, choose New and click Schedule.
The Description tab:
2. Give the schedule a name and add a comment if you wish.
The Schedule tab:
3. If you want the schedule apply every day, check the Every day box. Ifnot, check the boxes for the required days of the week and month whenyou want the schedule to operate. By selecting combinations of days ofthe week and days of the month, you can, for instance, specify collectionevery Monday and on the first of every month.
4. Now specify the time of collection. You can choose either a specifictime or an interval. To choose a specific time, set the time in the Timefield and click Add. To choose an interval, click Interval.
YOUR FIRST SYSTEM

26
The Retries tab:
5. Here you can choose whether you want the system to tray again if thefirst collection attempt fails. If it would be inconvenient for retries totake place during a given period, you can prevent retries during thatparticular period.
6. Click OK.
YOUR FIRST SYSTEM
27
USING GROUPS AND TARIFFS
Using groups and tariffs
Adding a group
The term “group” is a general term which has been chosen becausedifferent users define a “group” in different ways. One user may use theterm “customer” whilst another may use “tenant”. Yet another user may usethe word “department”. To add a group you need to use a group template.Cetrics comes with a number of group templates which you can modify tosuit your needs. If you don’t need all the group templates that come with theprogram you can delete unwanted ones. You can also create new grouptemplates. The section Creating a group template explains how to do this.When you have created a group you can add data series and link tariffs tothe group, so that you can create reports for the group.
Procedure:
1. In the File menu, choose New and Group and click on the template youwant to use (alternatively you can right-click on the required folder,choose New, Group and click on the template you want to use).
The General tab:
2. Give the group a unique name and a description if you wish.
3. Fill in the fields under Specific information. Which fields are availabledepends on the group template.
The Series tab:
4. You can link a series to a group. To link a series, click Add a series.When you have added a series, you can link a tariff to the series. Selecta series in the list and click Choose tariff. A tariff must have beencreated, otherwise this does not work. The section Creating a tariffexplains how to do this.
5. Click OK.

28
Creating a group template
You can adapt the group templates supplied with Cetrics, so that they meetyour needs, or create completely new templates.
Procedure:
1. In the Tools menu, choose Group templates.
2. In the Edit menu, choose New group template. (If you want to modifyone of the supplied templates, select that template and clickProperties.)
The General tab:
3. Give the group template a suitable name, eg Customer or Tenant (thesetemplates already exist in the default installation). If you wish, you canenter a description in the Description field.
The Fields tab:
4. This is where you specify the fields that the template will include. Whenyou create a new field, you must give it a name, preferably a namewhich describes what that field will contain. Examples are Address orOccupancy Date. If you wish, you can enter a description of the field.
5. The specify whether the field will contain text, integers, decimal numbersor a date. You cannot change data type later. It can only be specifiedwhen the field is added.
6. You can enter a default value, eg a text or a number, which appearsautomatically in the field when the template is used.
7. If the field must always be filled in, check the Mandatory box.
8. Click OK.
USING GROUPS AND TARIFFS

29
Creating a tariff
A tariff is made up of one or more rates. Rates can have a price. A tariffcan be linked to a data series, which in turn belongs to a group. Reports forthe group (eg invoicing information) can then be created.
If you want to change an existing tariff we recommend creating a newedition of the tariff. Earlier editions remain in the database (provided thatyou have not deleted them) and data can be used, for example, to re-createinvoicing information based on an earlier price. The on-line help explainshow to create a new edition of a tariff.
Procedure:
1. In the File menu, choose New and click Tariff.2. Give the tariff a unique name and a description if you wish. Specify the
date (inclusive) from which the tariff will apply.
3. Add rates by clicking Add.
USING GROUPS AND TARIFFS

30
The General tab:
4. Give the rate a name.
5. Enter a category for the rate. An example of a category is “variablecharge”. Using categories makes it easier to create rates which donot contain “gaps” (see item 9). Categories are also used in somereports to present different rates by group.
6. Enter the price and unit for the rate.
7. Enter the type of charge for the rate. You can choose Fixed charge orVariable charge or Own parameters. If you choose Ownparameters you can combine period and quantity, eg per year and perkW. Fill in the Code and Value fields if you want to use a term of yourown and to set a limit on when the term is to apply. Example: you wantto make a charge for consumption above a certain level. In the Codefield, specify which term you want to use for the charge. In the Valuefield, specify the limit above which the extra charge will be applied. Ifyou choose Own parameters you must make an adapted report inorder to be able to present prices in accordance with the tariff. Thecode and the value you have specified must be stated when you createthe adapted report. For more information about adapted reports, see thesection headed Adapted reports.
USING GROUPS AND TARIFFS

31
The Time conditions tab:
8. Specify whether the rate applies exceptionally, at normal times or atother times. The program considers first conditions from exceptions, thenconditions for normal. Any time outside these conditions (in the samecategory) is interpreted by the system as “other times”.
9. Add any time conditions by clicking Add. If you chose “exception” youmust specify times when exceptions must apply. If you chose normal youhave two options: you can either add limits for when the rate will apply,or add no such limits. If you do not choose any limits, the rate will applyall the time. To prevent gaps occurring, you must make sure that a rate isdefined for all times, either by limits which embrace all times, or by using“other times”.
USING GROUPS AND TARIFFS

32
10. When you add time conditions you can choose between time of theyear, day(s) of the week or time of day. You can also use a combina-tion of these. For a rate to apply, all your choices must be met.
11. When you have finished defining the rate, click OK. To add more rates,click Add again.
12. When you added the rates you want, click OK.
USING GROUPS AND TARIFFS

33
Creating reportsReports can be created for a series or a group. There are a number of typesof report intended for series and a number of other reports for groups.
To create a report, select a series or a group in the System Explorer, right-click and choose Create report. Reports that can be created for the chosenseries or group are presented as possible choices. Data for a series may beclassified (see properties for the series, under the Advanced tab). If datahas been classified, the selection of reports is also limited by theclassification. By choosing Reports from the File menu, you can createreports for more than one series or group at the same time.
Adapting reports
If you need to adapt existing reports or create new ones you can do so witha program called Seagate Crystal Reports. You can also request a quotationfrom Cewe Instrument for consultancy assistance with creating adapted
reports.
REPORTS

34
Maintaining the systemBacking up the database
The database should be backed up regularly. If the database fails, you canload the latest backup copy to restore your system. You can choose whereto save the backup copy. When you make a backup, Cetrics creates twosubfolders, FullBackup1 and FullBackup2, in the folder you specified as thepath. Cetrics saves the backup copy alternately in FullBackup1 andFullBackup2. This ensures that there is always a backup copy if thedatabase fails before a backup in progress is complete. Cetrics keeps trackof which copy is the most recent one. During backup copying, the systemchecks that there are no errors in the database. If an error is found, an errormessage appears.
Procedure:
1. In the Tools menu, choose System maintenance.
2. The Folder for backup copies field shows the path of the folder wherethe backup copy will be saved (the folder where the latest backup copywas saved or, if no backups have been made, the default folder). If youwant the backup copy to be save somewhere else, click the buttonbeside the Folder for backup copies field (or type the path of an
MAINTAINING THE SYSTEM
35
existing or new folder into the field). Choose a folder where the backupcopy will be saved and click OK. The new path appears in the Folderfor backup copies field.
3. Click Backup.
4. Click OK to confirm that you want to back up the database (if youentered a path to a folder that does not exist, you must also confirm thatyou want to create the new folder).
5. The system confirms that the backup copy has been made and showsthe folder where the backup copy has been created. Click OK.
6. Close the System maintenance dialog.
Restoring the database from a backup copy
If the Cetrics database fails, you can restore the database by loading abackup copy. This is done with a separate application known asrecover.exe.
Procedure:
1. Go to the folder where Cetrics is installed (eg C:\Programs\Cetrics).
2. Start recover.exe by double-clicking the file name.3. You will be prompted to close all Cetrics applications. Close any open
applications and click OK.
4. The Folder for backup copies field shows the path to the folder wherethe backup copy is saved. If the computer suffered a total crash or ifyou have re-installed the system, you will have to enter the path yourself.Click the button to the right of the Folder for backup copies field (ortype the path of the folder directly into the grey field). Choose the folderwhere the backup copy was saved and click OK. The new path appearsin the Folder for backup copies field.
MAINTAINING THE SYSTEM

36
6. Click Restore database.
7. The system asks if you want to copy the present database (the one thatfailed) before loading the backup copy (make sure you have enough diskspace for the backup copy. If you click Yes you must choose a folder tosave the copy in.
8. Click OK to confirm that you want to load the specified backup copy.
9. The system confirms that the backup copy has been loaded and that youcan restart the system.
10. Click Close to close the Restore database window.
Archiving data series and events
You can save data up to a specified date. If you wish, you can delete datafrom the Cetrics database. Data series and events can be archived.
The size of the database does not change when data is deleted. A certainamount of space is reserved in the database as data is added to it. If data isdeleted, the database does not get smaller. Since space is reserved in thedatabase, it does not get bigger when data is added to it. There is no need to“clean up” the database unless you are short of hard disk space or if yousimply want to remove old data from your system.
The on-line help explains how to archive data series and events.
MAINTAINING THE SYSTEM
37
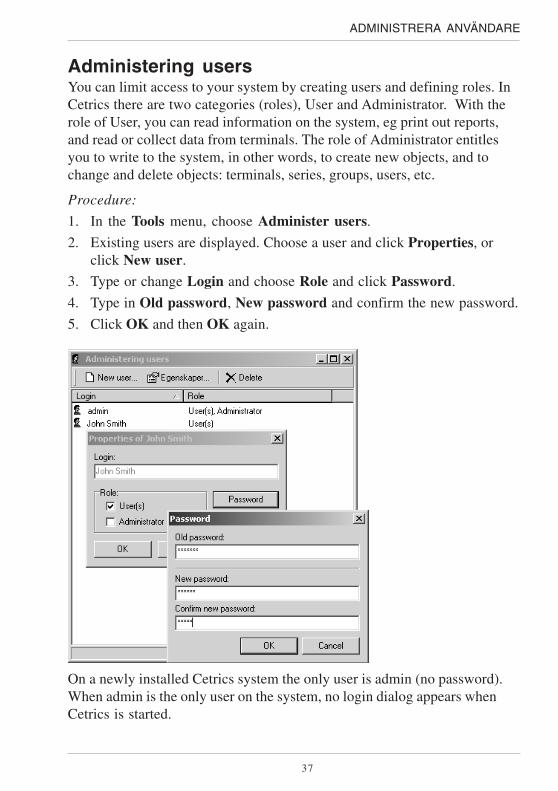
Administering usersYou can limit access to your system by creating users and defining roles. InCetrics there are two categories (roles), User and Administrator. With therole of User, you can read information on the system, eg print out reports,and read or collect data from terminals. The role of Administrator entitlesyou to write to the system, in other words, to create new objects, and tochange and delete objects: terminals, series, groups, users, etc.
Procedure:
1. In the Tools menu, choose Administer users.
2. Existing users are displayed. Choose a user and click Properties, orclick New user.
3. Type or change Login and choose Role and click Password.
4. Type in Old password, New password and confirm the new password.
5. Click OK and then OK again.
On a newly installed Cetrics system the only user is admin (no password).When admin is the only user on the system, no login dialog appears whenCetrics is started.
ADMINISTRERA ANVÄNDARE


Cewe Instrument ABBox 1006 • SE-611 29 Nyköping • SWEDENTel: +46 155 775 00 • Fax: +46 155 775 97
e-mail: [email protected] • www.ceweinstrument.com
A0097e-2