Cesar Victora Federal University of Pelotas, Brazil MCHIP ... · PDF fileCesar Victora....
20
Cesar Victora Federal University of Pelotas, Brazil MCHIP/WWC, April 2011
Transcript of Cesar Victora Federal University of Pelotas, Brazil MCHIP ... · PDF fileCesar Victora....
Cesar VictoraFederal University of Pelotas, Brazil
MCHIP/WWC, April 2011
2
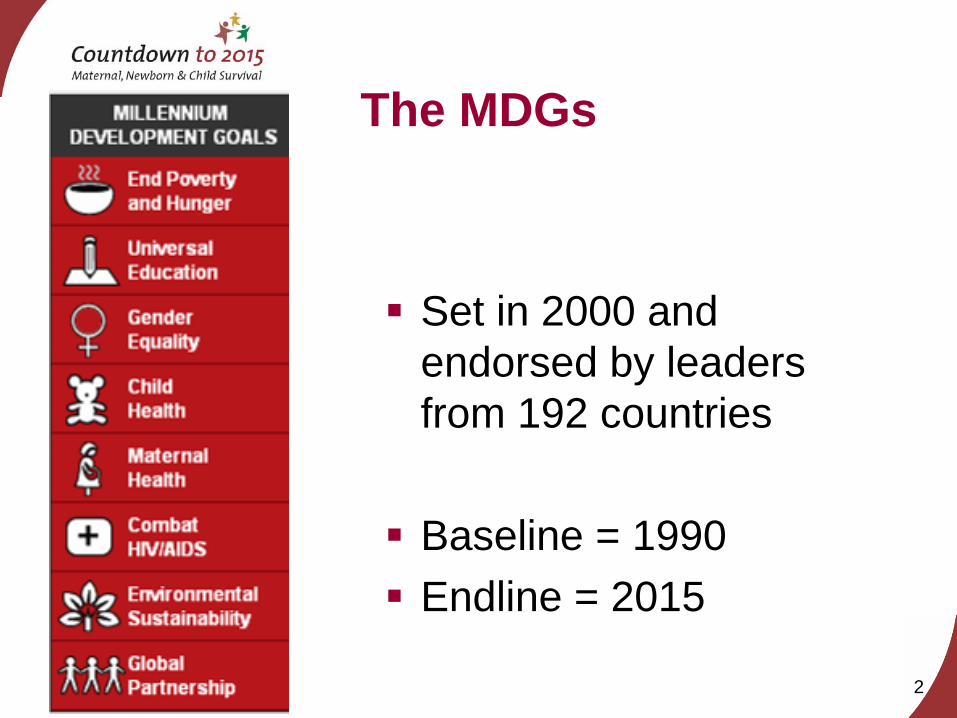
The MDGs
Set in 2000 and endorsed by leaders from 192 countries
Baseline = 1990Endline = 2015
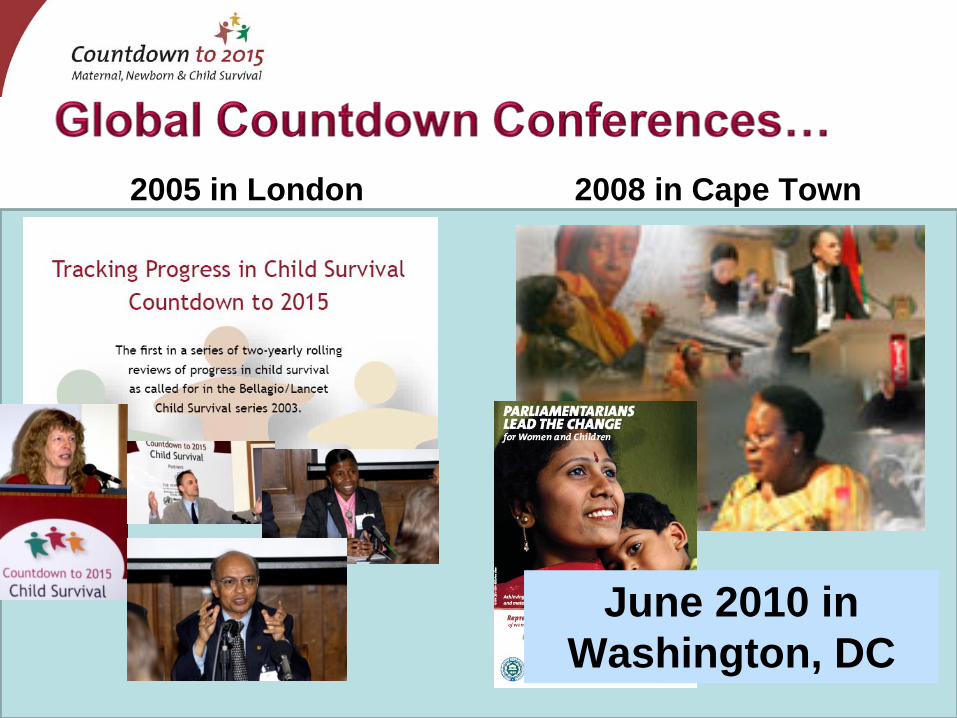
2005 in London 2008 in Cape Town
June 2010 in Washington, DC
Country Profiles
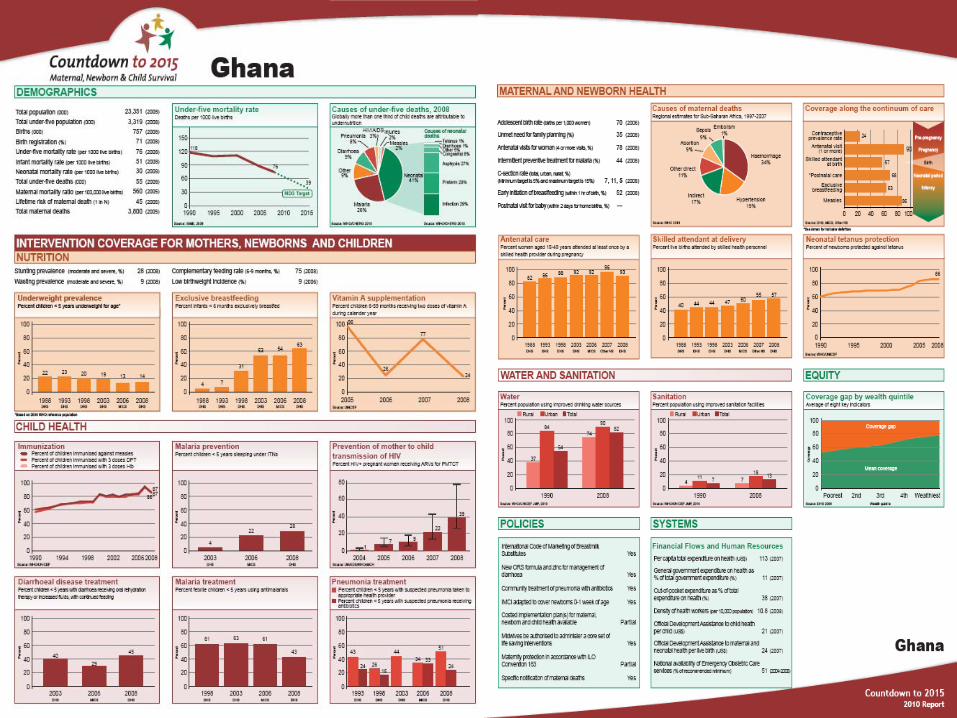
Equity in the Countdown
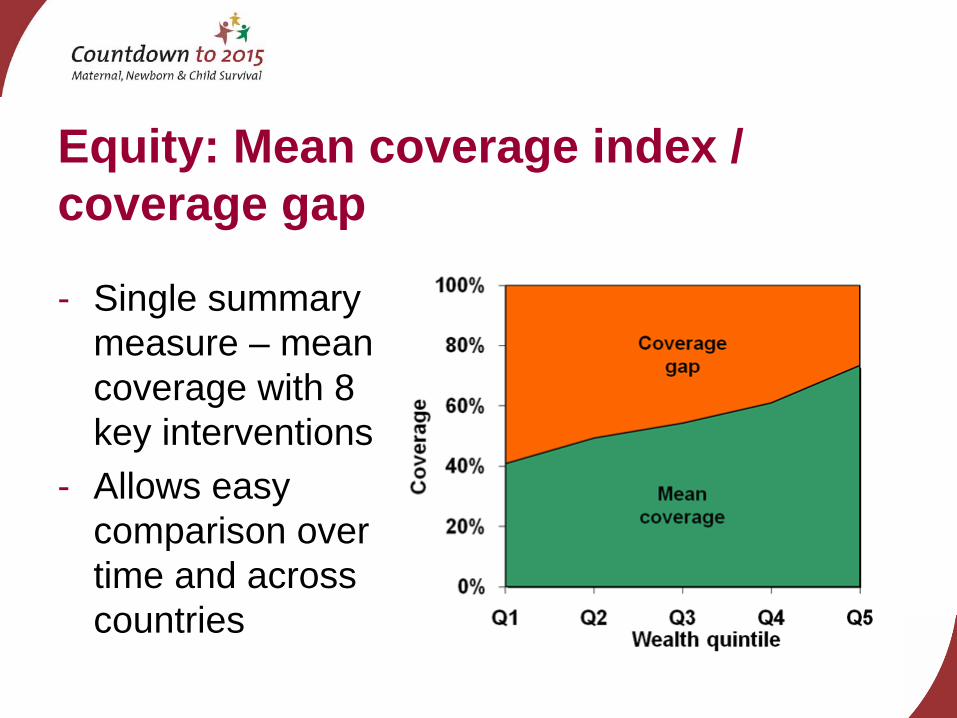
Equity: Mean coverage index / coverage gap
- Single summary measure – mean coverage with 8 key interventions
- Allows easy comparison over time and across countries
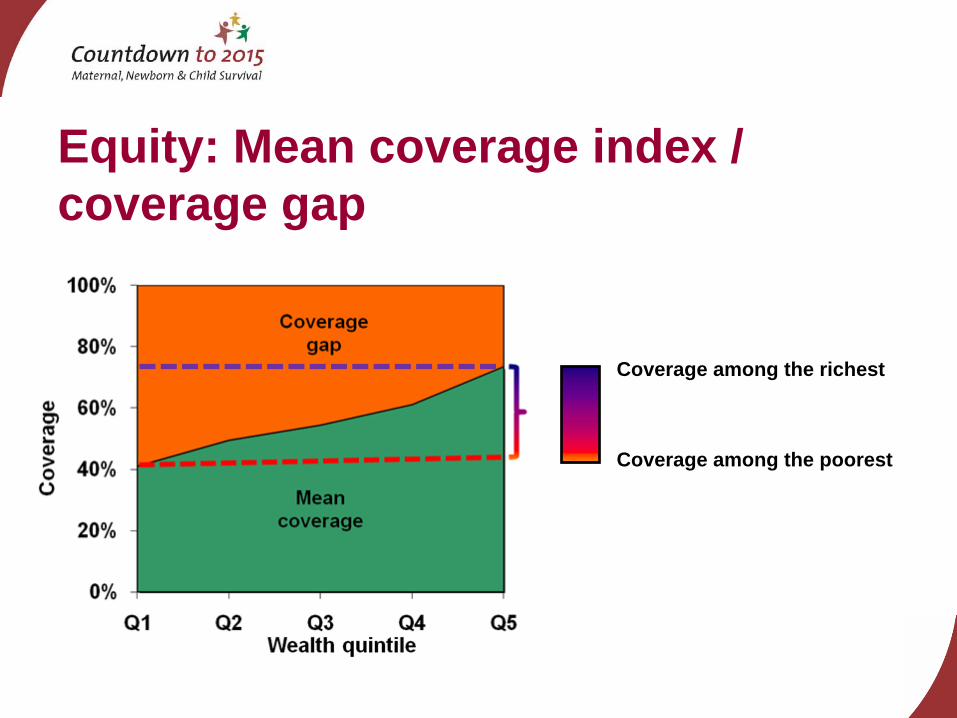
Equity: Mean coverage index / coverage gap
Coverage among the richest
Coverage among the poorest

Magnitude of inequity ranges:
mean coverage index(Q5-Q1),
38 countries
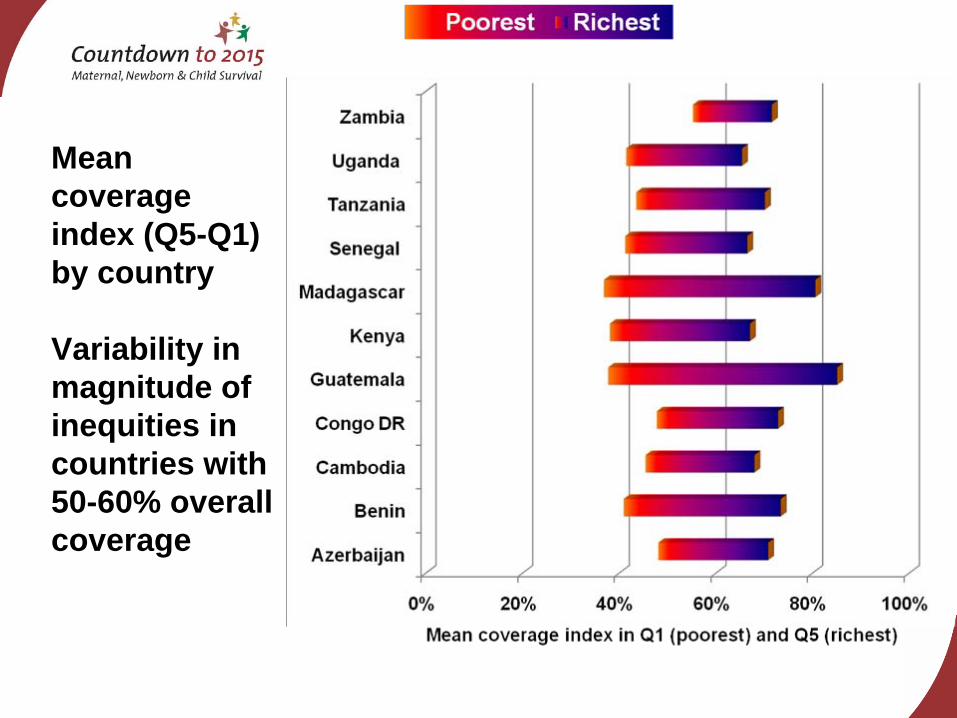
Mean coverage index (Q5-Q1) by country
Variability in magnitude of inequities in countries with 50-60% overall coverage
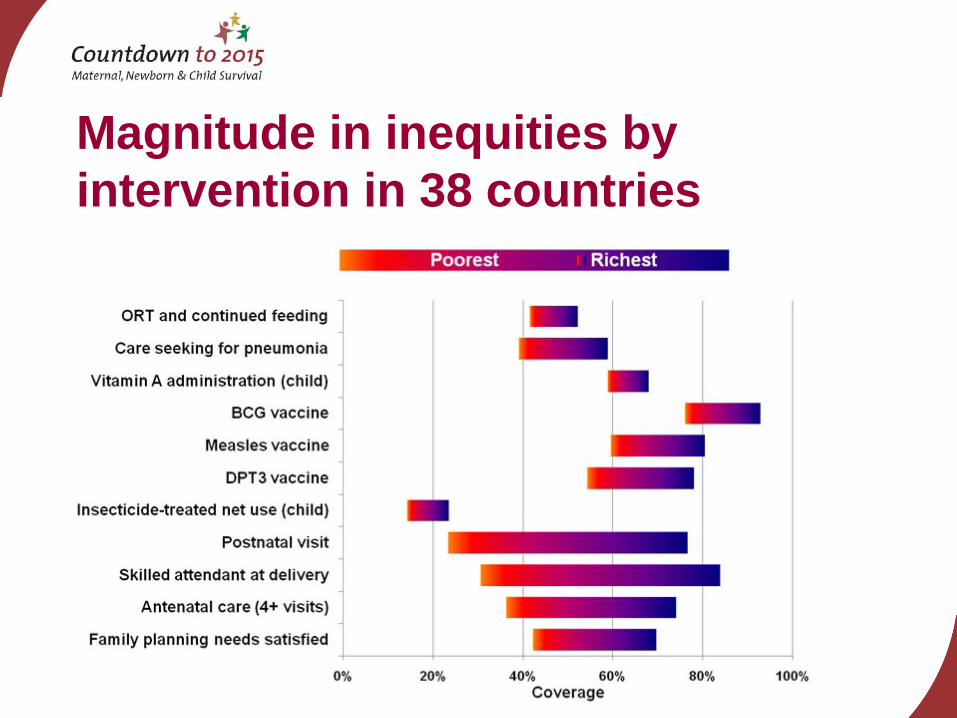
Magnitude in inequities by intervention in 38 countries

Poorest 2 3 4 Leastpoor
987654321
Co-coverage
How many interventions does each child receive?
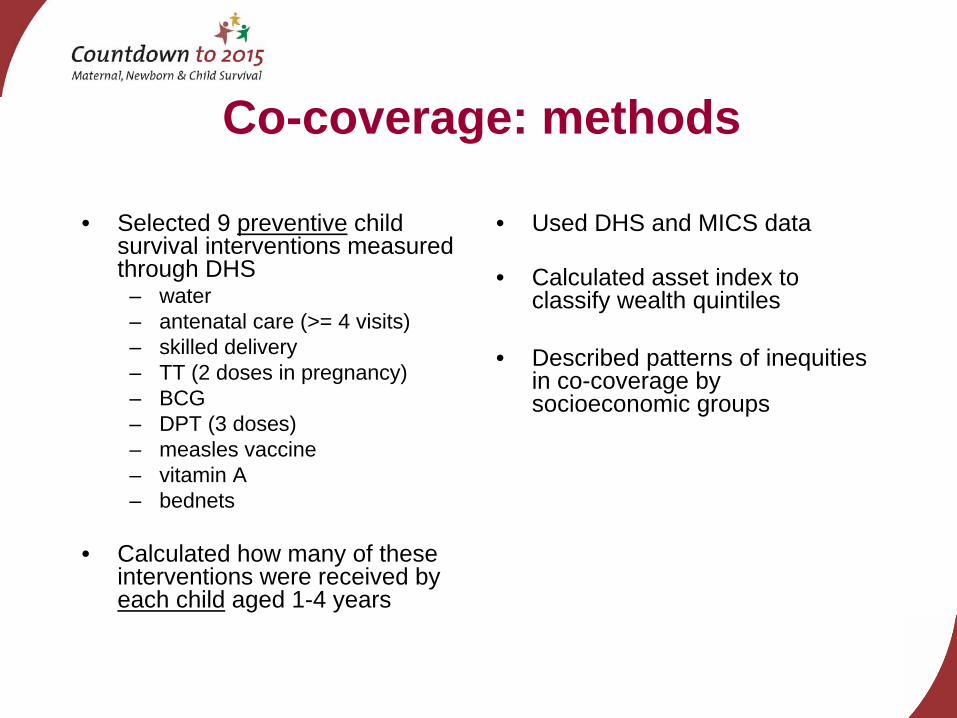
Co-coverage: methods
• Selected 9 preventive child survival interventions measured through DHS
– water – antenatal care (>= 4 visits)– skilled delivery– TT (2 doses in pregnancy)– BCG – DPT (3 doses) – measles vaccine– vitamin A– bednets
• Calculated how many of these interventions were received by each child aged 1-4 years
• Used DHS and MICS data
• Calculated asset index to classify wealth quintiles
• Described patterns of inequities in co-coverage by socioeconomic groups
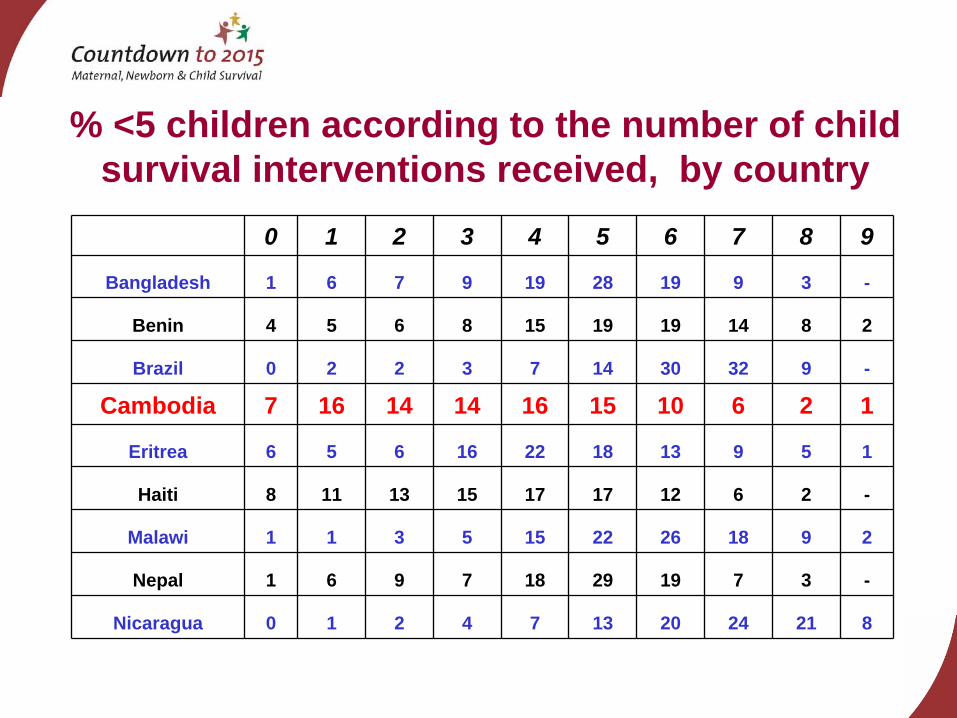
% <5 children according to the number of child survival interventions received, by country
0 1 2 3 4 5 6 7 8 9
Bangladesh 1 6 7 9 19 28 19 9 3 -
Benin 4 5 6 8 15 19 19 14 8 2
Brazil 0 2 2 3 7 14 30 32 9 -
Cambodia 7 16 14 14 16 15 10 6 2 1
Eritrea 6 5 6 16 22 18 13 9 5 1
Haiti 8 11 13 15 17 17 12 6 2 -
Malawi 1 1 3 5 15 22 26 18 9 2
Nepal 1 6 9 7 18 29 19 7 3 -
Nicaragua 0 1 2 4 7 13 20 24 21 8
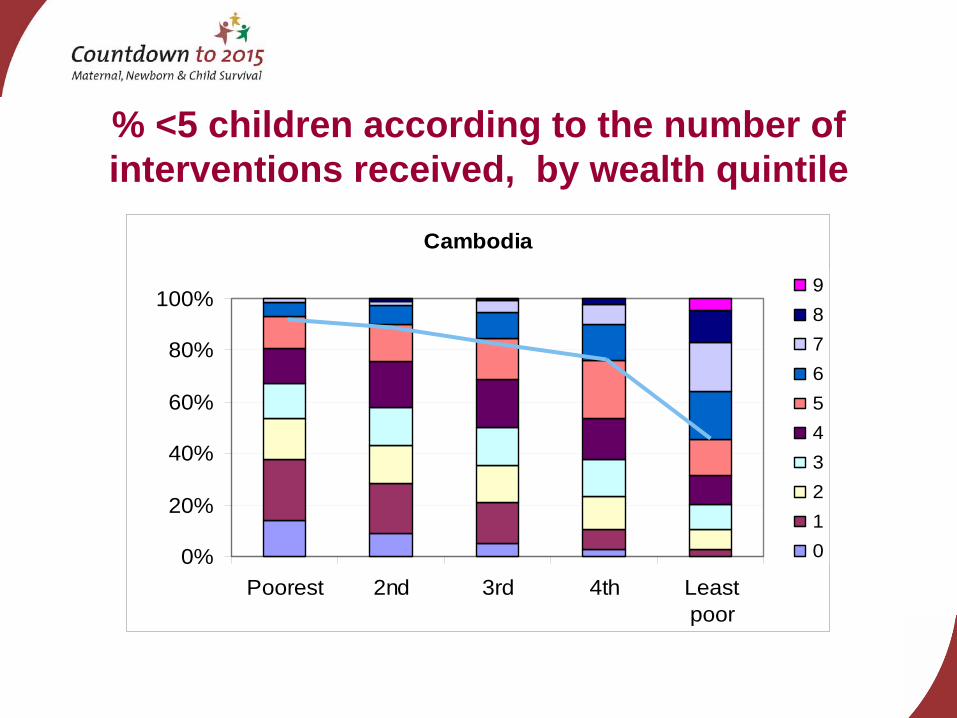
% <5 children according to the number of interventions received, by wealth quintile
Cambodia
0%
20%
40%
60%
80%
100%
Poorest 2nd 3rd 4th Leastpoor
9876543210
0%
20%
40%
60%
80%
100%
Poorest 2nd 3rd 4th Least poor
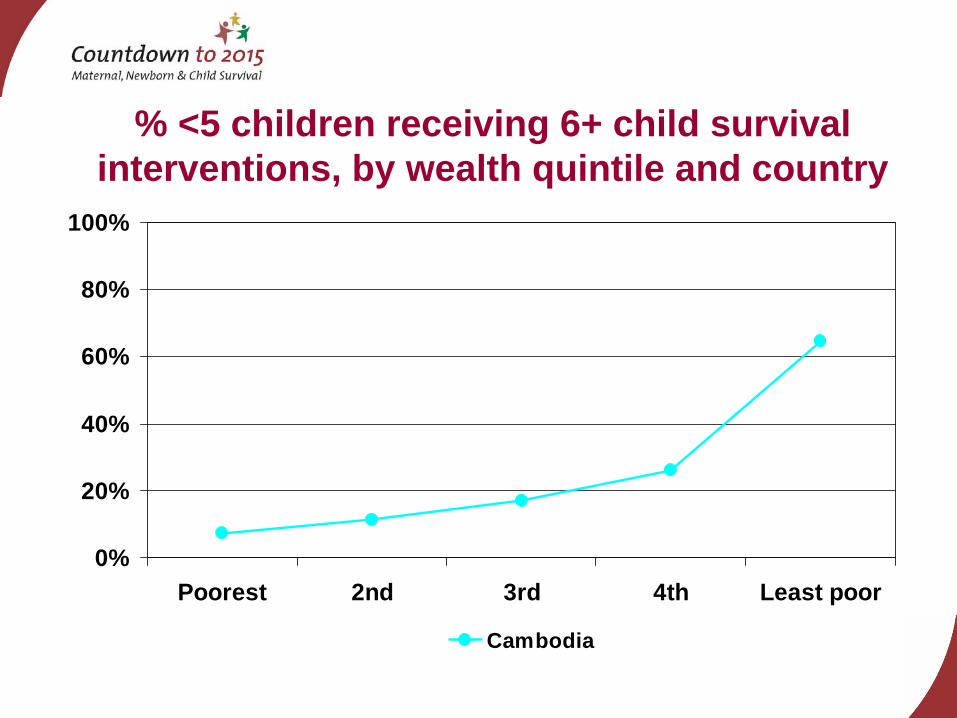
Cambodia
% <5 children receiving 6+ child survival interventions, by wealth quintile and country

0%
20%
40%
60%
80%
100%
Poorest 2nd 3rd 4th Least poor
Bangladesh Benin Brazil CambodiaEritrea Haiti Malawi NepalNicaragua Philippines
Bottom inequity
Top inequity
Victora et al, Lancet 2006
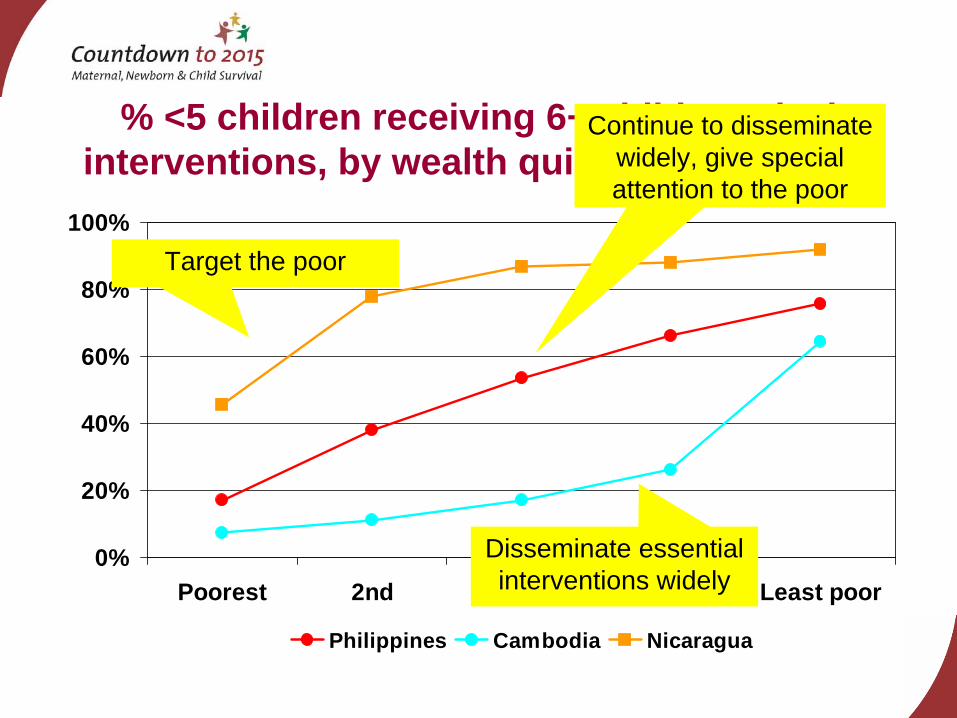
% <5 children receiving 6+ child survival interventions, by wealth quintile and country
0%
20%
40%
60%
80%
100%
Poorest 2nd 3rd 4th Least poor
Philippines Cambodia Nicaragua
% <5 children receiving 6+ child survival interventions, by wealth quintile and country
Disseminate essential interventions widely
Target the poor
Continue to disseminate widely, give special attention to the poor
Victora et al, Lancet 2006
Incorporating equity in monitoring, research and evaluation
Is always possible – and usefulMust be planned ahead of timeDoes not necessarily require large sample sizesMay reveal issues that are not evident in the whole-sample analysesCan lead to practical strategies for maximizing the impact of interventions