CERTIFIED PUBLIC ACCOUNTANT ADVANCED LEVEL 2 …
17
Page 1 of 17 CERTIFIED PUBLIC ACCOUNTANT ADVANCED LEVEL 2 EXAMINATIONS A2.1: STRATEGIC CORPORATE FINANCE DATE: FRIDAY, 27 AUGUST 2021 MODEL ANSWER AND MARKING GUIDE
Transcript of CERTIFIED PUBLIC ACCOUNTANT ADVANCED LEVEL 2 …
Page 1 of 17
CERTIFIED PUBLIC ACCOUNTANT
ADVANCED LEVEL 2 EXAMINATIONS
A2.1: STRATEGIC CORPORATE FINANCE
DATE: FRIDAY, 27 AUGUST 2021
MODEL ANSWER AND MARKING GUIDE
Page 2 of 17
SECTION A
Question 1: LMN Ltd
Marking guide Marks
a) Calculation of ratios
Liquidity ratios (Current Ratio, Quick Ratio 2 marks each, maximum of 4) 4
Profitability ratios (Net income to net worth, Net profit margin 2 marks @, max of 4) 4
Turnover ratios (Inventory turnover, Fixed asset turnover, Total assets turnover, Average Collection Period, 2 marks each, max of 8) 8
Price – Earnings (P/E) ratio (formula & computation) 2
Debt/Equity ratio (formula & computation)
Maximum marks 2
Maximum marks 20
b) Analysis of the summary i. Trend (Liquidity, Profitability and Activity/Turnover ratios, 2 marks each) 6
ii. Comparison with industry (Liquidity, Profitability and Activity/Turnover ratios, 1 marks each) 3
Maximum marks 9
c) i. MCM Ltd Calculation of Internal Rate of Return (IRR) (12 Marks maximum)
Computation of initial outlay 3
Computation of incremental depreciation per year 1
Computation of incremental salvage value 1
Computation of incremental operating cash flows for each 2
Computation of Net Present Value 1
Computation of Internal Rate of Return 4
Maximum marks 12
ii. Advice to the management on the proposal based on the answer in (c) (i) Accept the proposal since IRR ((18.55%) is greater than the cost of capital (10 %) 1
Maximum marks 1
d) i. Hedging MC Ltd against risk using money market hedge Changing Frw 412,000 into Bif 653,638 at 1Frw =Bif 1.5865 1
Borrow Bif 653,638 at Bif rate of 9% p.a. (Bif 639,255) 1
Sell the Bif and buy Frw at the spot rate of 1 Frw = Bif 1.5905 (Frw 401, 921) 1
Invest the Frw at @ 5 % for 4 months (Frw 406,945) 1
Settle the Bif 639,255 borrowed after 4 months and pay Bif 653,638 1
Page 3 of 17
Maximum marks 5
ii. Forward Cover instead of money market Exchanging Bif into Frw 1
Decision (Money market is better than forward cover based on computations) 2
Maximum marks 3
Total marks 50
Detailed Answer
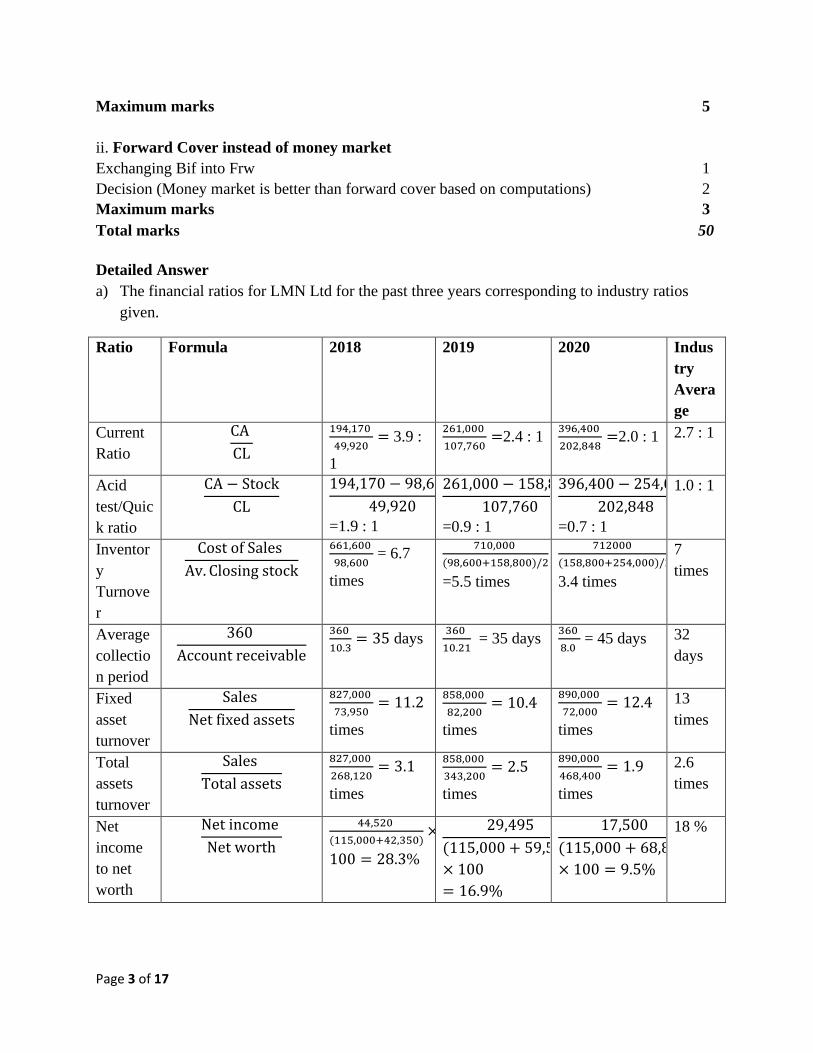
a) The financial ratios for LMN Ltd for the past three years corresponding to industry ratios
given.
Ratio Formula 2018 2019 2020 Indus
try
Avera
ge
Current
Ratio
CA
CL
194,170
49,920= 3.9 :
1
261,000
107,760=2.4 : 1
396,400
202,848=2.0 : 1 2.7 : 1
Acid
test/Quic
k ratio
CA − Stock
CL
194,170 − 98,600
49,920
=1.9 : 1
261,000 − 158,800
107,760
=0.9 : 1
396,400 − 254,000
202,848
=0.7 : 1
1.0 : 1
Inventor
y
Turnove
r
Cost of Sales
Av. Closing stock
661,600
98,600 = 6.7
times
710,000
(98,600+158,800)/2
=5.5 times
712000
(158,800+254,000)/2=
3.4 times
7
times
Average
collectio
n period
360
Account receivable
360
10.3= 35 days
360
10.21 = 35 days
360
8.0 = 45 days 32
days
Fixed
asset
turnover
Sales
Net fixed assets
827,000
73,950= 11.2
times
858,000
82,200= 10.4
times
890,000
72,000= 12.4
times
13
times
Total
assets
turnover
Sales
Total assets
827,000
268,120= 3.1
times
858,000
343,200= 2.5
times
890,000
468,400= 1.9
times
2.6
times
Net
income
to net
worth
Net income
Net worth
44,520
(115,000+42,350)×
100 = 28.3%
29,495
(115,000 + 59,582)
× 100
= 16.9%
17,500
(115,000 + 68,832)
× 100 = 9.5%
18 %
Page 4 of 17
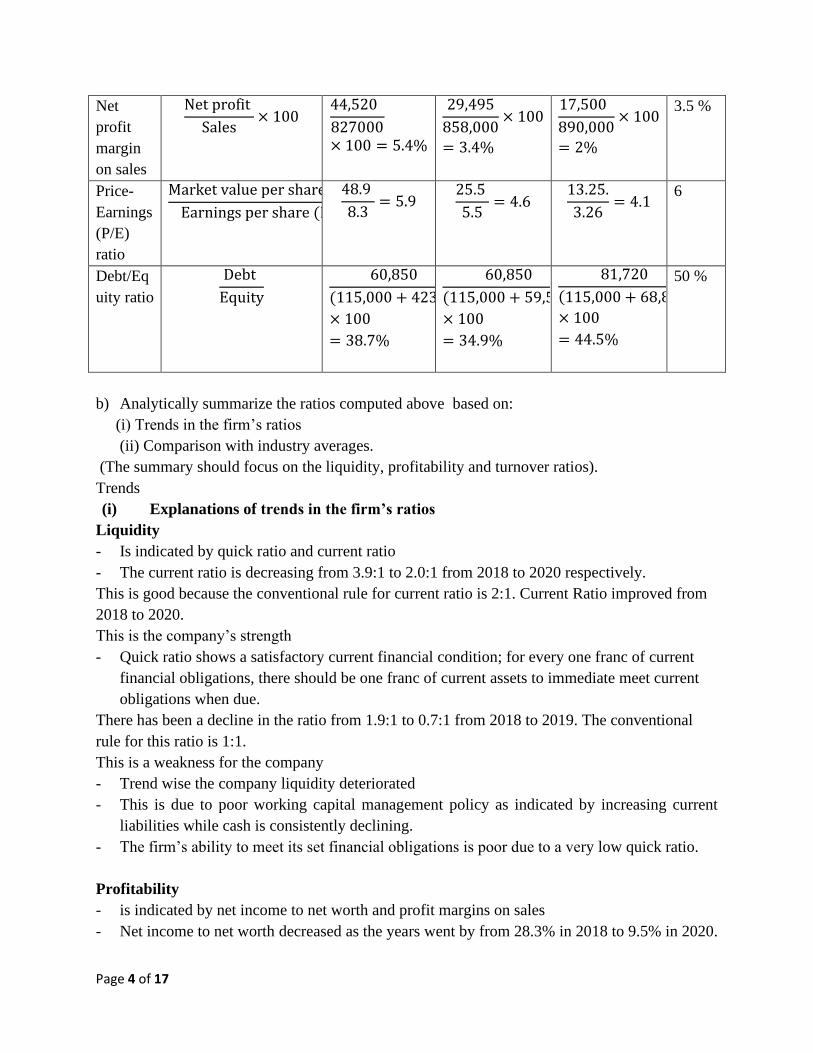
Net
profit
margin
on sales
Net profit
Sales× 100
44,520
827000× 100 = 5.4%
29,495
858,000× 100
= 3.4%
17,500
890,000× 100
= 2%
3.5 %
Price-
Earnings
(P/E)
ratio
Market value per share (MV)
Earnings per share (EPS)
48.9
8.3= 5.9
25.5
5.5= 4.6
13.25.
3.26= 4.1
6
Debt/Eq
uity ratio
Debt
Equity
60,850
(115,000 + 42350)
× 100
= 38.7%
60,850
(115,000 + 59,582)
× 100
= 34.9%
81,720
(115,000 + 68,832)
× 100
= 44.5%
50 %
b) Analytically summarize the ratios computed above based on:
(i) Trends in the firm’s ratios
(ii) Comparison with industry averages.
(The summary should focus on the liquidity, profitability and turnover ratios).
Trends
(i) Explanations of trends in the firm’s ratios
Liquidity
- Is indicated by quick ratio and current ratio
- The current ratio is decreasing from 3.9:1 to 2.0:1 from 2018 to 2020 respectively.
This is good because the conventional rule for current ratio is 2:1. Current Ratio improved from
2018 to 2020.
This is the company’s strength
- Quick ratio shows a satisfactory current financial condition; for every one franc of current
financial obligations, there should be one franc of current assets to immediate meet current
obligations when due.
There has been a decline in the ratio from 1.9:1 to 0.7:1 from 2018 to 2019. The conventional
rule for this ratio is 1:1.
This is a weakness for the company
- Trend wise the company liquidity deteriorated
- This is due to poor working capital management policy as indicated by increasing current
liabilities while cash is consistently declining.
- The firm’s ability to meet its set financial obligations is poor due to a very low quick ratio.
Profitability
- is indicated by net income to net worth and profit margins on sales
- Net income to net worth decreased as the years went by from 28.3% in 2018 to 9.5% in 2020.
Page 5 of 17
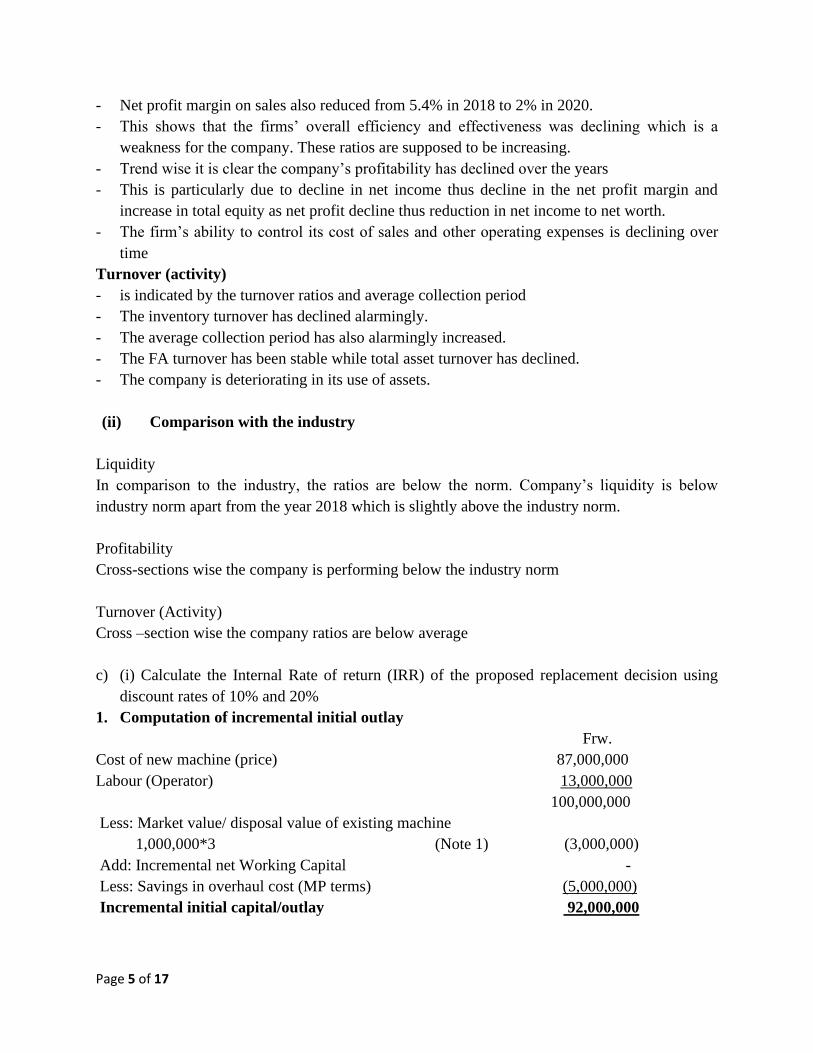
- Net profit margin on sales also reduced from 5.4% in 2018 to 2% in 2020.
- This shows that the firms’ overall efficiency and effectiveness was declining which is a
weakness for the company. These ratios are supposed to be increasing.
- Trend wise it is clear the company’s profitability has declined over the years
- This is particularly due to decline in net income thus decline in the net profit margin and
increase in total equity as net profit decline thus reduction in net income to net worth.
- The firm’s ability to control its cost of sales and other operating expenses is declining over
time
Turnover (activity)
- is indicated by the turnover ratios and average collection period
- The inventory turnover has declined alarmingly.
- The average collection period has also alarmingly increased.
- The FA turnover has been stable while total asset turnover has declined.
- The company is deteriorating in its use of assets.
(ii) Comparison with the industry
Liquidity
In comparison to the industry, the ratios are below the norm. Company’s liquidity is below
industry norm apart from the year 2018 which is slightly above the industry norm.
Profitability
Cross-sections wise the company is performing below the industry norm
Turnover (Activity)
Cross –section wise the company ratios are below average
c) (i) Calculate the Internal Rate of return (IRR) of the proposed replacement decision using
discount rates of 10% and 20%
1. Computation of incremental initial outlay
Frw.
Cost of new machine (price) 87,000,000
Labour (Operator) 13,000,000
100,000,000
Less: Market value/ disposal value of existing machine
1,000,000*3 (Note 1) (3,000,000)
Add: Incremental net Working Capital -
Less: Savings in overhaul cost (MP terms) (5,000,000)
Incremental initial capital/outlay 92,000,000
Page 6 of 17
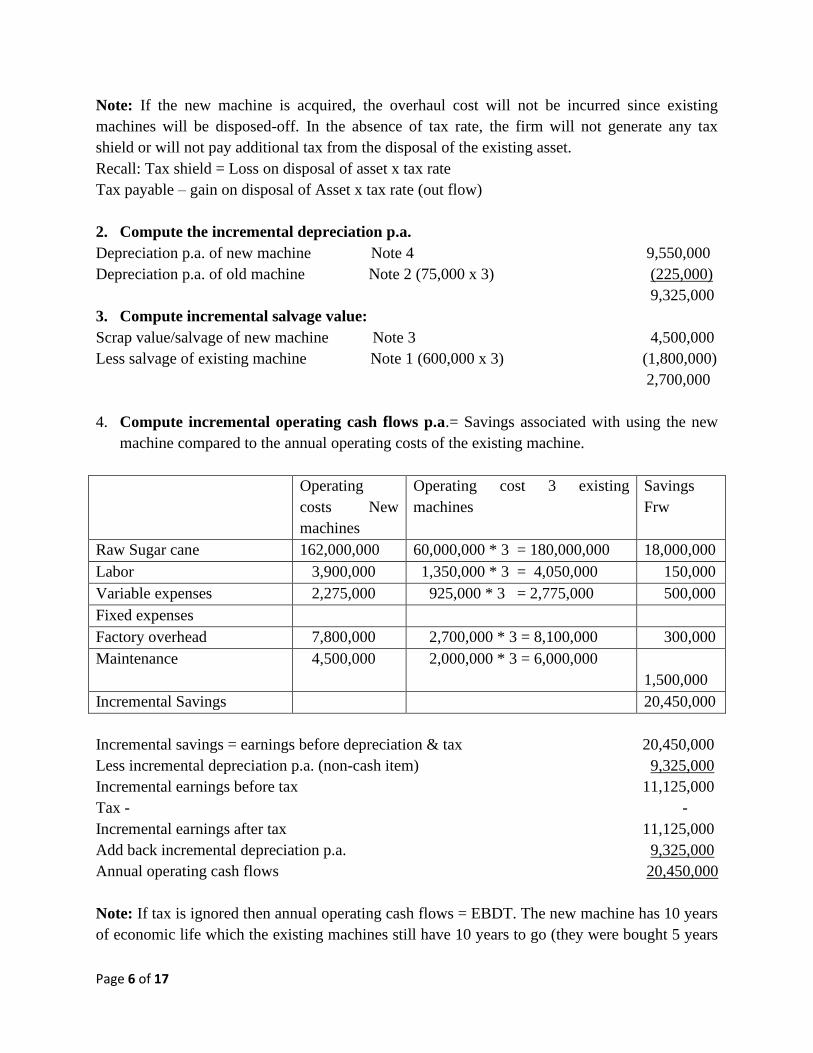
Note: If the new machine is acquired, the overhaul cost will not be incurred since existing
machines will be disposed-off. In the absence of tax rate, the firm will not generate any tax
shield or will not pay additional tax from the disposal of the existing asset.
Recall: Tax shield = Loss on disposal of asset x tax rate
Tax payable – gain on disposal of Asset x tax rate (out flow)
2. Compute the incremental depreciation p.a.
Depreciation p.a. of new machine Note 4 9,550,000
Depreciation p.a. of old machine Note 2 (75,000 x 3) (225,000)
9,325,000
3. Compute incremental salvage value:
Scrap value/salvage of new machine Note 3 4,500,000
Less salvage of existing machine Note 1 (600,000 x 3) (1,800,000)
2,700,000
4. Compute incremental operating cash flows p.a.= Savings associated with using the new
machine compared to the annual operating costs of the existing machine.
Operating
costs New
machines
Operating cost 3 existing
machines
Savings
Frw
Raw Sugar cane 162,000,000 60,000,000 * 3 = 180,000,000 18,000,000
Labor 3,900,000 1,350,000 * 3 = 4,050,000 150,000
Variable expenses 2,275,000 925,000 * 3 = 2,775,000 500,000
Fixed expenses
Factory overhead 7,800,000 2,700,000 * 3 = 8,100,000 300,000
Maintenance 4,500,000 2,000,000 * 3 = 6,000,000
1,500,000
Incremental Savings 20,450,000
Incremental savings = earnings before depreciation & tax 20,450,000
Less incremental depreciation p.a. (non-cash item) 9,325,000
Incremental earnings before tax 11,125,000
Tax - -
Incremental earnings after tax 11,125,000
Add back incremental depreciation p.a. 9,325,000
Annual operating cash flows 20,450,000
Note: If tax is ignored then annual operating cash flows = EBDT. The new machine has 10 years
of economic life which the existing machines still have 10 years to go (they were bought 5 years
Page 7 of 17
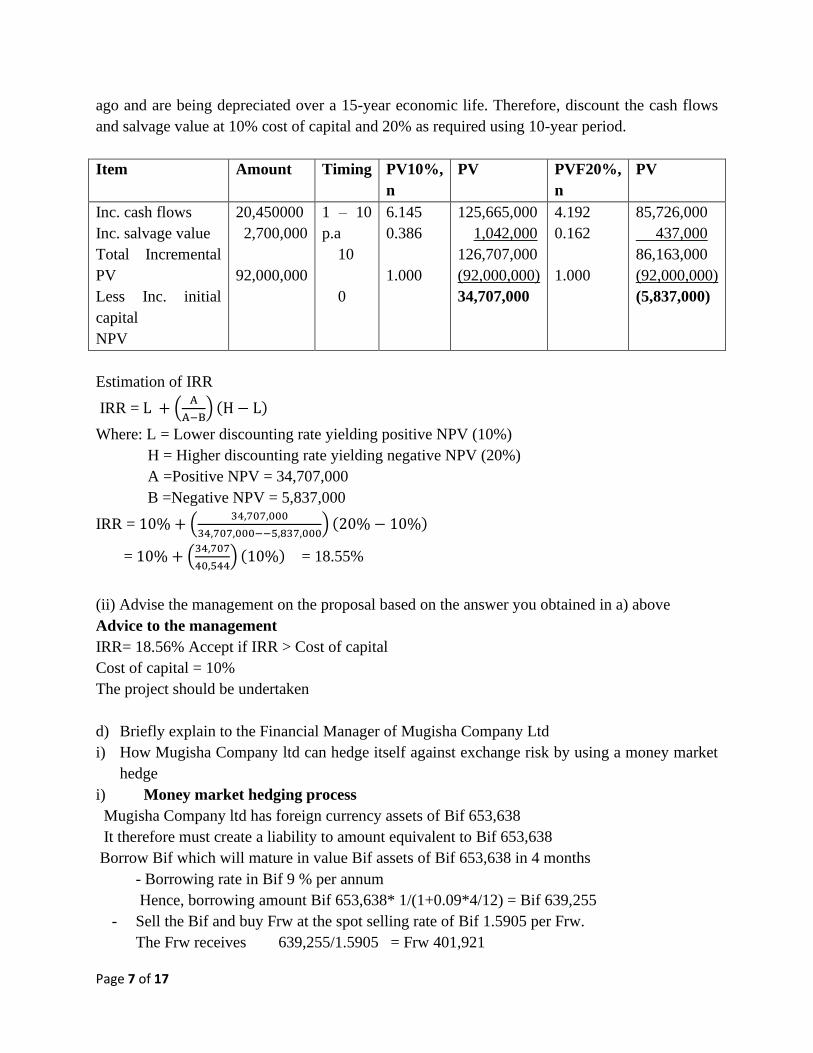
ago and are being depreciated over a 15-year economic life. Therefore, discount the cash flows
and salvage value at 10% cost of capital and 20% as required using 10-year period.
Item Amount Timing PV10%,
n
PV PVF20%,
n
PV
Inc. cash flows
Inc. salvage value
Total Incremental
PV
Less Inc. initial
capital
NPV
20,450000
2,700,000
92,000,000
1 – 10
p.a
10
0
6.145
0.386
1.000
125,665,000
1,042,000
126,707,000
(92,000,000)
34,707,000
4.192
0.162
1.000
85,726,000
437,000
86,163,000
(92,000,000)
(5,837,000)
Estimation of IRR
IRR = L + (A
A−B) (H − L)
Where: L = Lower discounting rate yielding positive NPV (10%)
H = Higher discounting rate yielding negative NPV (20%)
A =Positive NPV = 34,707,000
B =Negative NPV = 5,837,000
IRR = 10% + (34,707,000
34,707,000−−5,837,000) (20% − 10%)
= 10% + (34,707
40,544) (10%) = 18.55%
(ii) Advise the management on the proposal based on the answer you obtained in a) above
Advice to the management
IRR= 18.56% Accept if IRR > Cost of capital
Cost of capital = 10%
The project should be undertaken
d) Briefly explain to the Financial Manager of Mugisha Company Ltd
i) How Mugisha Company ltd can hedge itself against exchange risk by using a money market
hedge
i) Money market hedging process
Mugisha Company ltd has foreign currency assets of Bif 653,638
It therefore must create a liability to amount equivalent to Bif 653,638
Borrow Bif which will mature in value Bif assets of Bif 653,638 in 4 months
- Borrowing rate in Bif 9 % per annum
Hence, borrowing amount Bif 653,638* 1/(1+0.09*4/12) = Bif 639,255
- Sell the Bif and buy Frw at the spot selling rate of Bif 1.5905 per Frw.
The Frw receives 639,255/1.5905 = Frw 401,921
Page 8 of 17
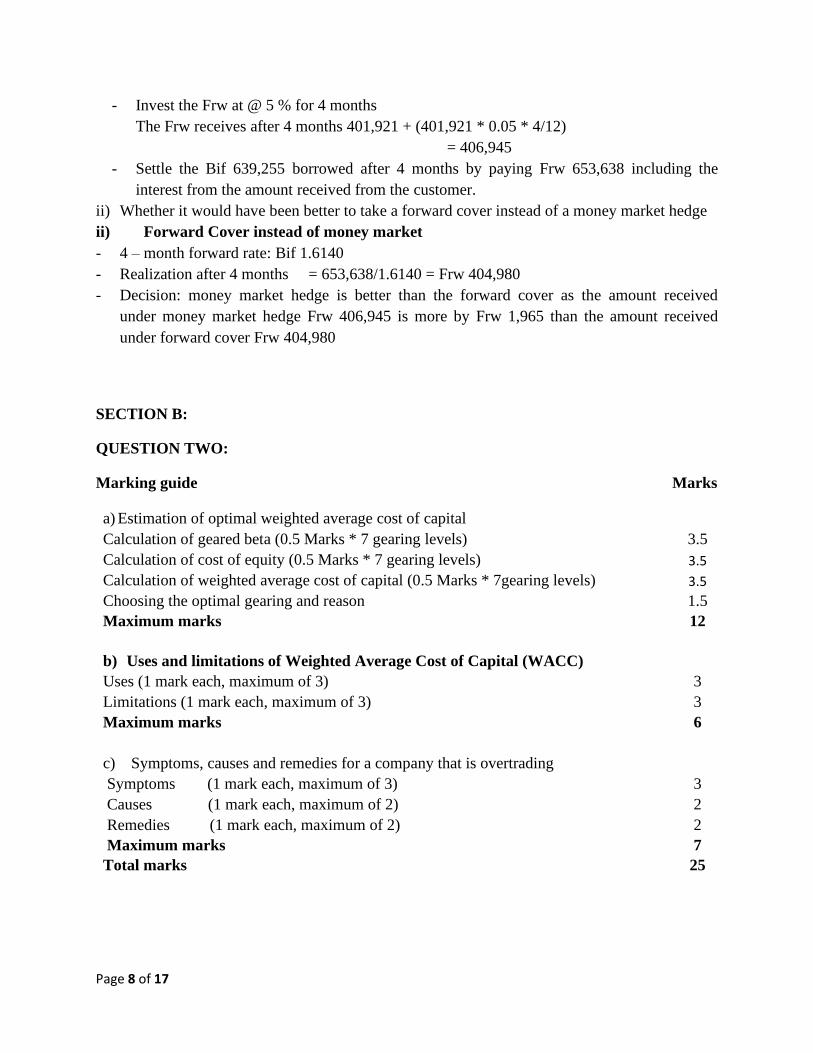
- Invest the Frw at @ 5 % for 4 months
The Frw receives after 4 months 401,921 + (401,921 * 0.05 * 4/12)
= 406,945
- Settle the Bif 639,255 borrowed after 4 months by paying Frw 653,638 including the
interest from the amount received from the customer.
ii) Whether it would have been better to take a forward cover instead of a money market hedge
ii) Forward Cover instead of money market
- 4 – month forward rate: Bif 1.6140
- Realization after 4 months = 653,638/1.6140 = Frw 404,980
- Decision: money market hedge is better than the forward cover as the amount received
under money market hedge Frw 406,945 is more by Frw 1,965 than the amount received
under forward cover Frw 404,980
SECTION B:
QUESTION TWO:
Marking guide Marks
a) Estimation of optimal weighted average cost of capital Calculation of geared beta (0.5 Marks * 7 gearing levels) 3.5
Calculation of cost of equity (0.5 Marks * 7 gearing levels) 3.5
Calculation of weighted average cost of capital (0.5 Marks * 7gearing levels) 3.5
Choosing the optimal gearing and reason 1.5
Maximum marks 12
b) Uses and limitations of Weighted Average Cost of Capital (WACC) Uses (1 mark each, maximum of 3) 3
Limitations (1 mark each, maximum of 3) 3
Maximum marks 6
c) Symptoms, causes and remedies for a company that is overtrading Symptoms (1 mark each, maximum of 3) 3
Causes (1 mark each, maximum of 2) 2
Remedies (1 mark each, maximum of 2) 2
Maximum marks 7
Total marks 25
Page 9 of 17
Detailed Answer
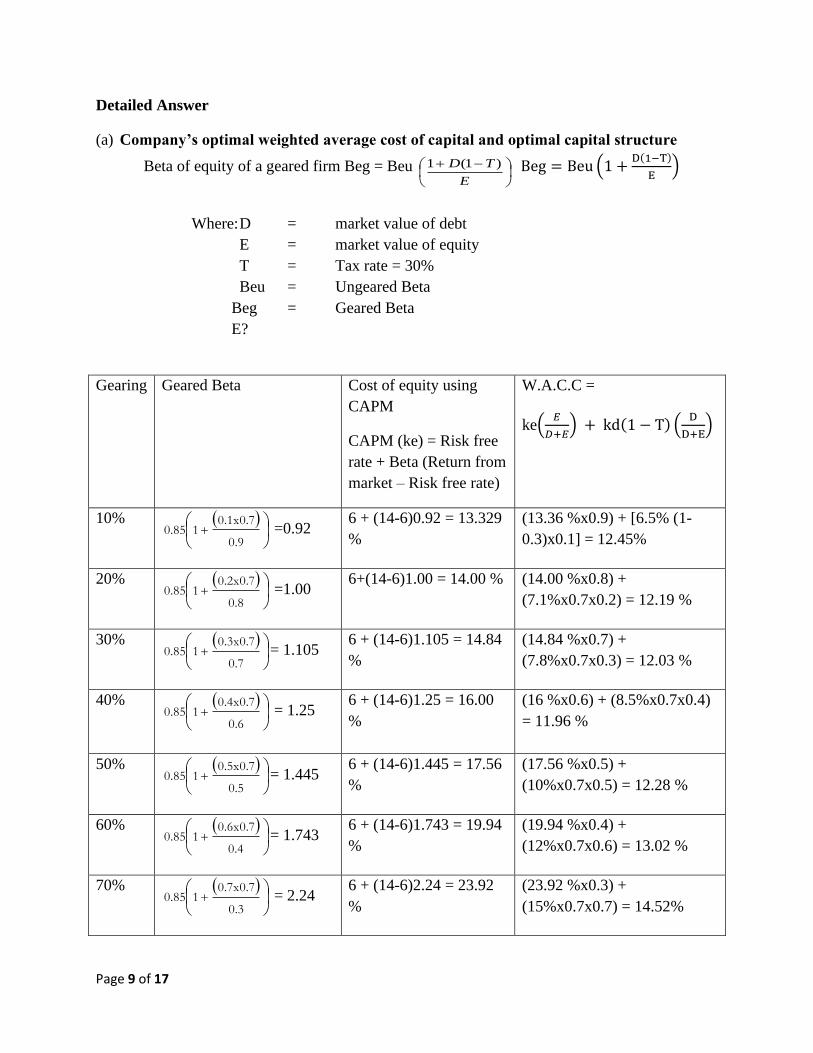
(a) Company’s optimal weighted average cost of capital and optimal capital structure
Beta of equity of a geared firm Beg = Beu
−+
E
TD )1(1 Beg = Beu (1 +D(1−T)
E)
Where: D = market value of debt
E = market value of equity
T = Tax rate = 30%
Beu = Ungeared Beta
Beg = Geared Beta
E?
Gearing Geared Beta Cost of equity using
CAPM
CAPM (ke) = Risk free
rate + Beta (Return from
market – Risk free rate)
W.A.C.C =
ke(𝐸
𝐷+𝐸) + kd(1 − T) (
D
D+E)
10% ( )
+
0.9
0.1x0.710.85 =0.92
6 + (14-6)0.92 = 13.329
%
(13.36 %x0.9) + [6.5% (1-
0.3)x0.1] = 12.45%
20% ( )
+
0.8
0.2x0.710.85 =1.00
6+(14-6)1.00 = 14.00 % (14.00 %x0.8) +
(7.1%x0.7x0.2) = 12.19 %
30% ( )
+
0.7
0.3x0.710.85 = 1.105
6 + (14-6)1.105 = 14.84
%
(14.84 %x0.7) +
(7.8%x0.7x0.3) = 12.03 %
40% ( )
+
0.6
0.4x0.710.85 = 1.25
6 + (14-6)1.25 = 16.00
%
(16 %x0.6) + (8.5%x0.7x0.4)
= 11.96 %
50% ( )
+
0.5
0.5x0.710.85 = 1.445
6 + (14-6)1.445 = 17.56
%
(17.56 %x0.5) +
(10%x0.7x0.5) = 12.28 %
60% ( )
+
0.4
0.6x0.710.85 = 1.743
6 + (14-6)1.743 = 19.94
%
(19.94 %x0.4) +
(12%x0.7x0.6) = 13.02 %
70% ( )
+
0.3
0.7x0.710.85 = 2.24
6 + (14-6)2.24 = 23.92
%
(23.92 %x0.3) +
(15%x0.7x0.7) = 14.52%
Page 10 of 17
The optimal gearing is 40% debt, 60% equity at which WACC is lowest and value of the firm is
maximized.
(b) Uses of Weighted Average Cost of Capital (WACC)
-WACC is used for making investment decisions of a company. WACC is widely used for
making investment decisions in companies by evaluating their projects and various options.
-WACC can be used to calculate Economic Value Added (EVA). EVA can be calculated by
deducting the cost of capital from the profits of the company
-It is used for evaluation of projects with same risk. When the new projects have a similar risk
level or the risk level is the same as the existing projects of the company
-It is used for evaluation of projects with different risks.
-It is used for valuation of the company
-It is used as a discount rate in net present value calculations. WACC is used as discount rate or
the hurdle rate for NPV calculations. All the free cash flows and terminal values are discounted
using the WACC.
Limitations of Weighted Average Cost of Capital (WACC)
-It can only be used as a discounting rate assuming that the risk of the project is equal to the
business risk of the firm. If the project has higher risk of then a percentage premium will be
added to WACC to determine the appropriate discounting rate.
-It assumes that capital structure is optimal which is not achievable in the real world.
-It is based on market values of capital which keeps on changing thus WACC will change
overtime but is assumed to remain constant throughout the economic life of the project.
-It is based on past information especially when determining the cost of each component e.g. in
determining the cost of equity (Ke) the past year’s DPS is used while the growth rate is estimated
from the past stream of dividends.
(c) Briefly explain the symptoms, causes, and remedies for a company that is overtrading.
Symptoms
Turnover increases rapidly
- The volume of current assets increases faster than sales (fixed assets may also increase)
Page 11 of 17
- Increase in the stock days and debtor days
- The increase in assets is financed by increases in short – term funds such as creditors and bank
overdrafts
- The current and quick ratios decline dramatically and current assets will be far lower than
current liabilities
- The cash flow position is heading in a disastrous direction
Causes
- Turnover is increased too rapidly without an adequate capital base (management may be overly
ambitious)
- The long-term sources of finance are reduced
- A period of high inflation may lead to an erosion of the capital base in real terms and
management may be unaware of this erosion
- Management may be completely unaware of the absolute importance of cash flow planning and
so may be carried away with profitability to the detriment of this aspect of their financial
planning
Remedies
- Postponing expansion plans
- New injections of long –term finance either in terms of debt/equity or some combination
- Better stock/debtor control
- Maintaining/ increasing proportion of long –term finance
Page 12 of 17
QUESTION THREE
Marking guide Marks
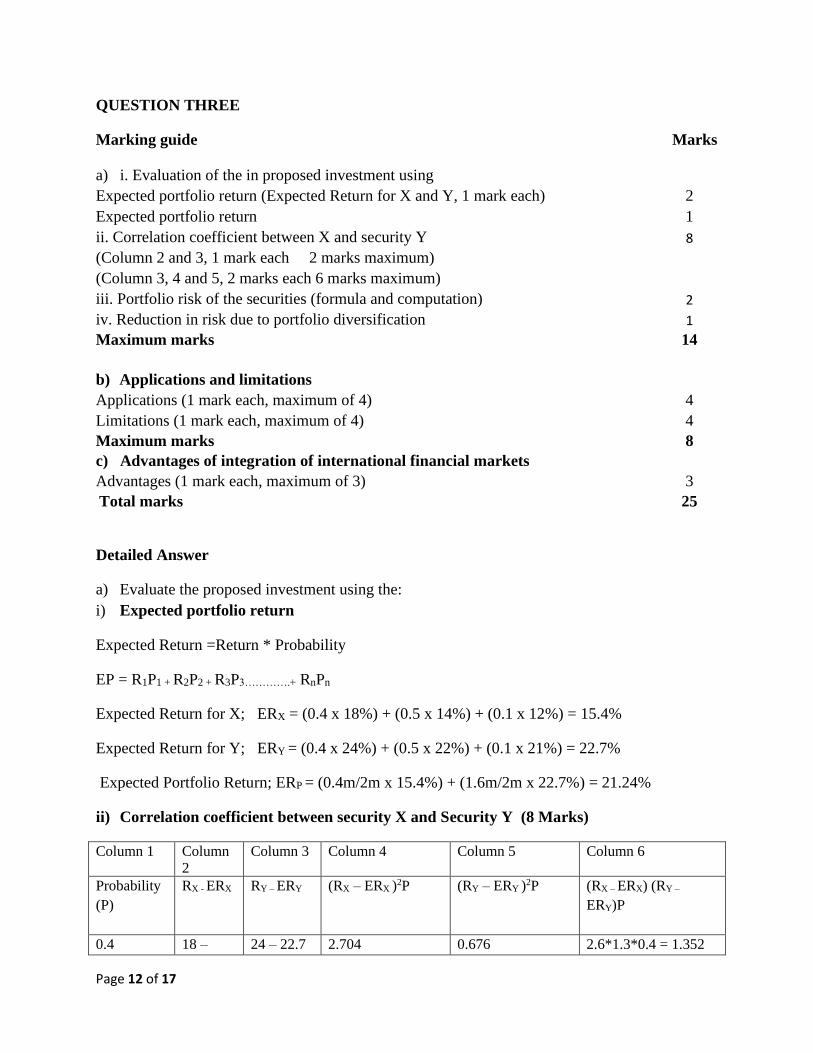
a) i. Evaluation of the in proposed investment using Expected portfolio return (Expected Return for X and Y, 1 mark each) 2
Expected portfolio return 1
ii. Correlation coefficient between X and security Y 8
(Column 2 and 3, 1 mark each 2 marks maximum) (Column 3, 4 and 5, 2 marks each 6 marks maximum) iii. Portfolio risk of the securities (formula and computation) 2
iv. Reduction in risk due to portfolio diversification 1
Maximum marks 14
b) Applications and limitations Applications (1 mark each, maximum of 4) 4
Limitations (1 mark each, maximum of 4) 4
Maximum marks 8
c) Advantages of integration of international financial markets Advantages (1 mark each, maximum of 3) 3
Total marks 25
Detailed Answer
a) Evaluate the proposed investment using the:
i) Expected portfolio return
Expected Return =Return * Probability
EP = R1P1 + R2P2 + R3P3………….+ RnPn
Expected Return for X; ERX = (0.4 x 18%) + (0.5 x 14%) + (0.1 x 12%) = 15.4%
Expected Return for Y; ERY = (0.4 x 24%) + (0.5 x 22%) + (0.1 x 21%) = 22.7%
Expected Portfolio Return; ERP = (0.4m/2m x 15.4%) + (1.6m/2m x 22.7%) = 21.24%
ii) Correlation coefficient between security X and Security Y (8 Marks)
Column 1 Column
2
Column 3 Column 4 Column 5 Column 6
Probability
(P)
RX - ERX RY – ERY (RX – ERX )2P (RY – ERY )2P (RX – ERX) (RY –
ERY)P
0.4 18 – 24 – 22.7 2.704 0.676 2.6*1.3*0.4 = 1.352
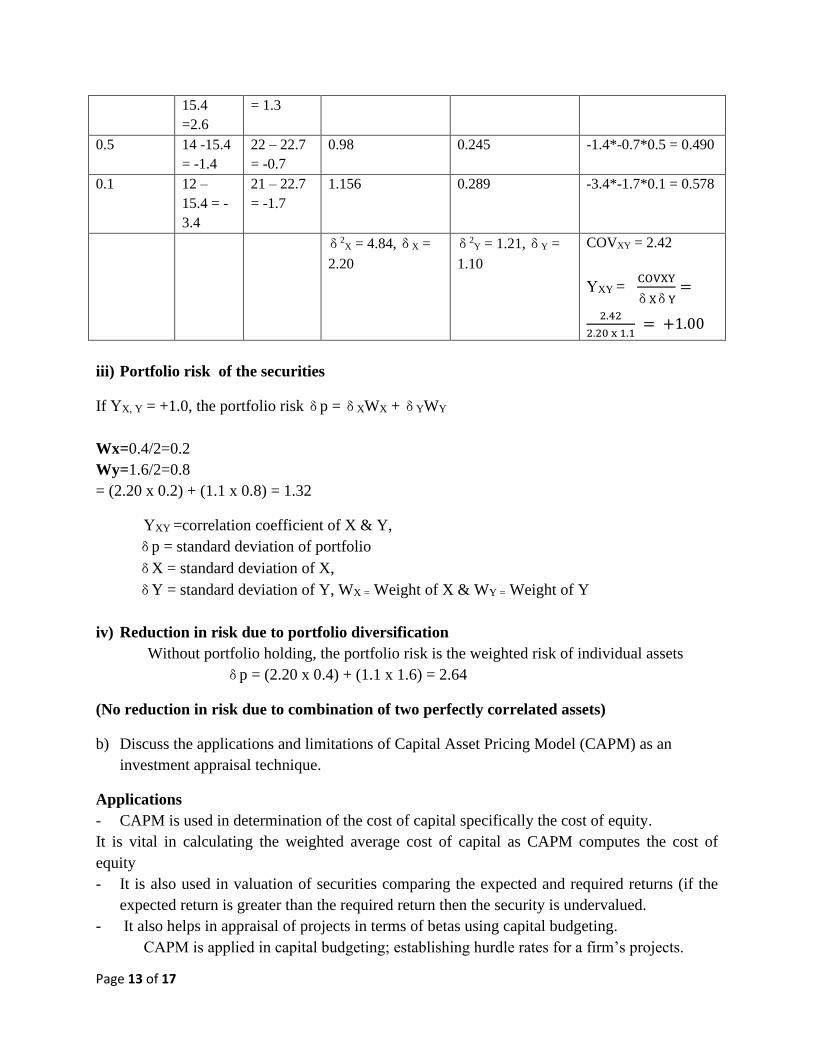
Page 13 of 17
15.4
=2.6
= 1.3
0.5 14 -15.4
= -1.4
22 – 22.7
= -0.7
0.98 0.245 -1.4*-0.7*0.5 = 0.490
0.1 12 –
15.4 = -
3.4
21 – 22.7
= -1.7
1.156 0.289 -3.4*-1.7*0.1 = 0.578
δ 2X = 4.84, δ X =
2.20
δ 2Y = 1.21, δ Y =
1.10
COVXY = 2.42
ΥXY = COVXY
δ Xδ Y=
2.42
2.20 x 1.1 = +1.00
iii) Portfolio risk of the securities
If ΥX, Y = +1.0, the portfolio risk δ p = δ XWX + δ YWY
Wx=0.4/2=0.2
Wy=1.6/2=0.8
= (2.20 x 0.2) + (1.1 x 0.8) = 1.32
ΥXY =correlation coefficient of X & Y,
δ p = standard deviation of portfolio
δX = standard deviation of X,
δY = standard deviation of Y, WX = Weight of X & WY = Weight of Y
iv) Reduction in risk due to portfolio diversification
Without portfolio holding, the portfolio risk is the weighted risk of individual assets
δ p = (2.20 x 0.4) + (1.1 x 1.6) = 2.64
(No reduction in risk due to combination of two perfectly correlated assets)
b) Discuss the applications and limitations of Capital Asset Pricing Model (CAPM) as an
investment appraisal technique.
Applications
- CAPM is used in determination of the cost of capital specifically the cost of equity.
It is vital in calculating the weighted average cost of capital as CAPM computes the cost of
equity
- It is also used in valuation of securities comparing the expected and required returns (if the
expected return is greater than the required return then the security is undervalued.
- It also helps in appraisal of projects in terms of betas using capital budgeting.
CAPM is applied in capital budgeting; establishing hurdle rates for a firm’s projects.
Page 14 of 17
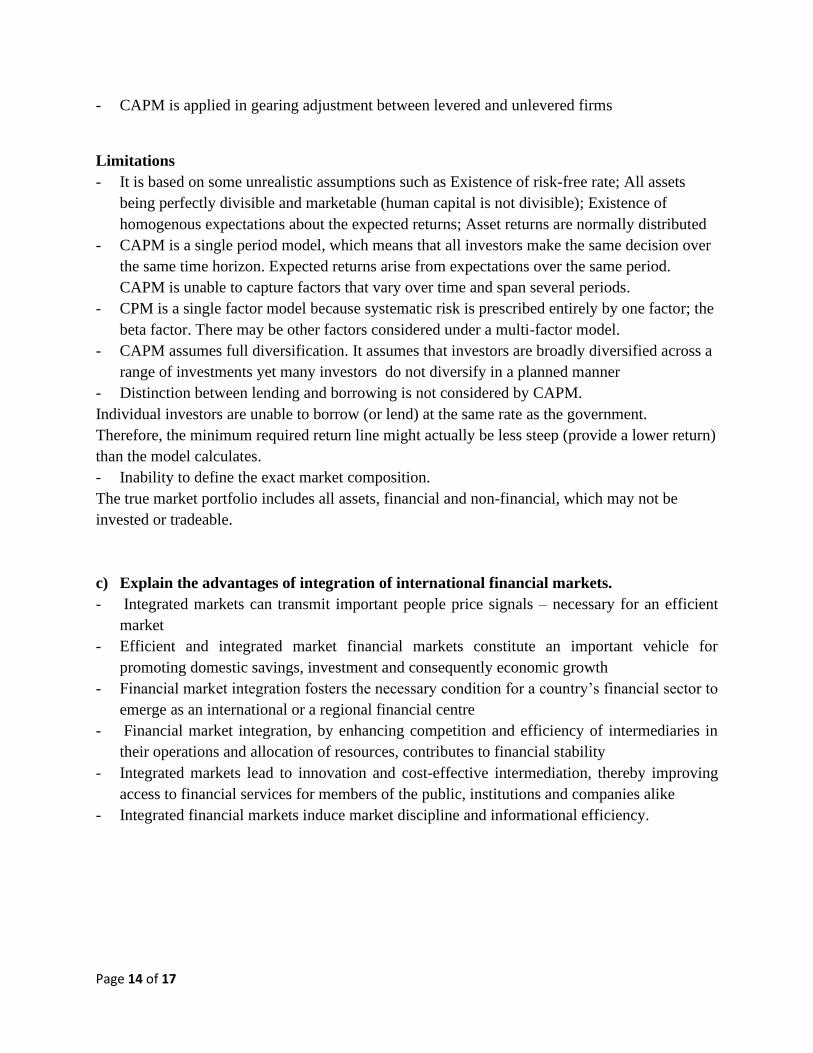
- CAPM is applied in gearing adjustment between levered and unlevered firms
Limitations
- It is based on some unrealistic assumptions such as Existence of risk-free rate; All assets
being perfectly divisible and marketable (human capital is not divisible); Existence of
homogenous expectations about the expected returns; Asset returns are normally distributed
- CAPM is a single period model, which means that all investors make the same decision over
the same time horizon. Expected returns arise from expectations over the same period.
CAPM is unable to capture factors that vary over time and span several periods.
- CPM is a single factor model because systematic risk is prescribed entirely by one factor; the
beta factor. There may be other factors considered under a multi-factor model.
- CAPM assumes full diversification. It assumes that investors are broadly diversified across a
range of investments yet many investors do not diversify in a planned manner
- Distinction between lending and borrowing is not considered by CAPM.
Individual investors are unable to borrow (or lend) at the same rate as the government.
Therefore, the minimum required return line might actually be less steep (provide a lower return)
than the model calculates.
- Inability to define the exact market composition.
The true market portfolio includes all assets, financial and non-financial, which may not be
invested or tradeable.
c) Explain the advantages of integration of international financial markets.
- Integrated markets can transmit important people price signals – necessary for an efficient
market
- Efficient and integrated market financial markets constitute an important vehicle for
promoting domestic savings, investment and consequently economic growth
- Financial market integration fosters the necessary condition for a country’s financial sector to
emerge as an international or a regional financial centre
- Financial market integration, by enhancing competition and efficiency of intermediaries in
their operations and allocation of resources, contributes to financial stability
- Integrated markets lead to innovation and cost-effective intermediation, thereby improving
access to financial services for members of the public, institutions and companies alike
- Integrated financial markets induce market discipline and informational efficiency.
Page 15 of 17
QUESTION FOUR
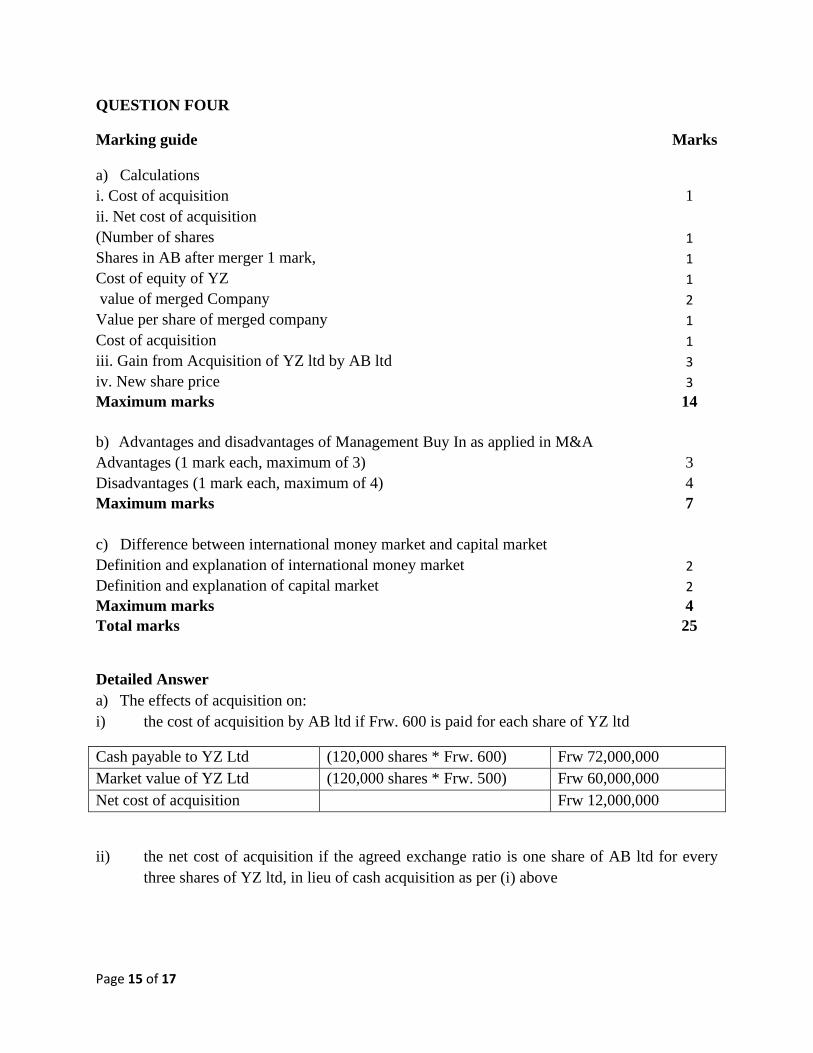
Marking guide Marks
a) Calculations i. Cost of acquisition 1
ii. Net cost of acquisition (Number of shares 1
Shares in AB after merger 1 mark, 1
Cost of equity of YZ 1
value of merged Company 2
Value per share of merged company 1
Cost of acquisition 1
iii. Gain from Acquisition of YZ ltd by AB ltd 3
iv. New share price 3
Maximum marks 14
b) Advantages and disadvantages of Management Buy In as applied in M&A Advantages (1 mark each, maximum of 3) 3
Disadvantages (1 mark each, maximum of 4) 4
Maximum marks 7
c) Difference between international money market and capital market Definition and explanation of international money market 2
Definition and explanation of capital market 2
Maximum marks 4
Total marks 25
Detailed Answer
a) The effects of acquisition on:
i) the cost of acquisition by AB ltd if Frw. 600 is paid for each share of YZ ltd
Cash payable to YZ Ltd (120,000 shares * Frw. 600) Frw 72,000,000
Market value of YZ Ltd (120,000 shares * Frw. 500) Frw 60,000,000
Net cost of acquisition Frw 12,000,000
ii) the net cost of acquisition if the agreed exchange ratio is one share of AB ltd for every
three shares of YZ ltd, in lieu of cash acquisition as per (i) above
Page 16 of 17
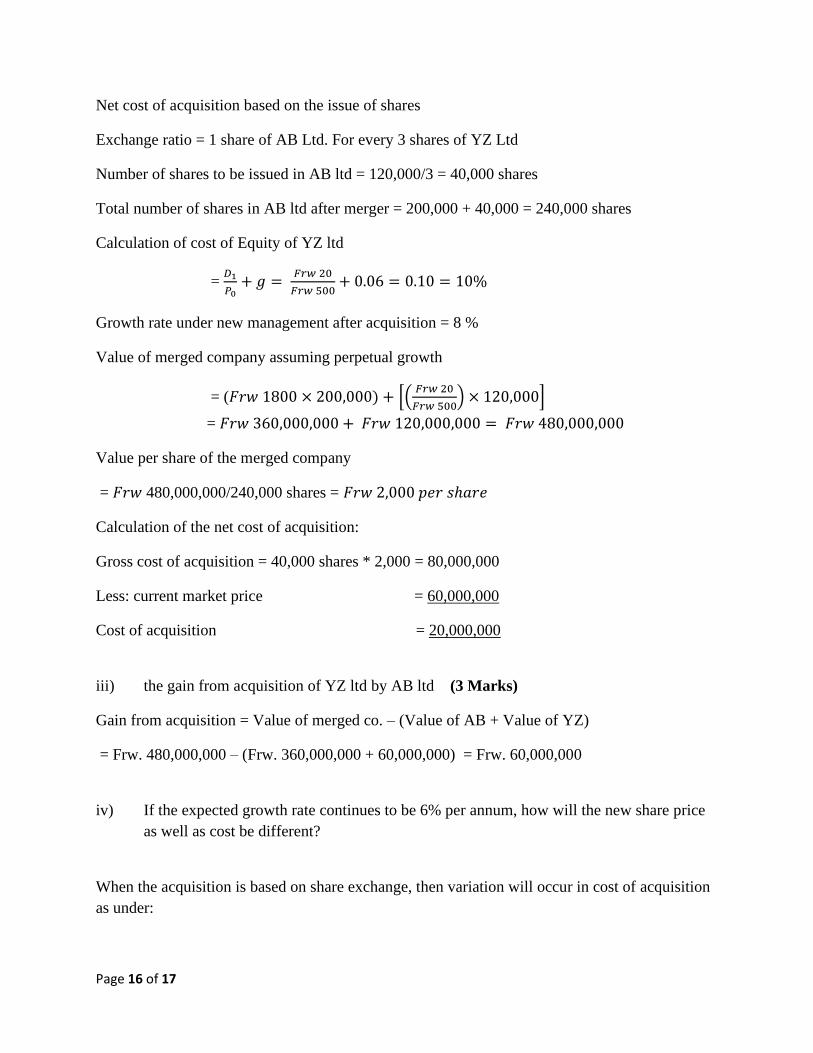
Net cost of acquisition based on the issue of shares
Exchange ratio = 1 share of AB Ltd. For every 3 shares of YZ Ltd
Number of shares to be issued in AB ltd = 120,000/3 = 40,000 shares
Total number of shares in AB ltd after merger = 200,000 + 40,000 = 240,000 shares
Calculation of cost of Equity of YZ ltd
= 𝐷1
𝑃0+ 𝑔 =
𝐹𝑟𝑤 20
𝐹𝑟𝑤 500+ 0.06 = 0.10 = 10%
Growth rate under new management after acquisition = 8 %
Value of merged company assuming perpetual growth
= (𝐹𝑟𝑤 1800 × 200,000) + [(𝐹𝑟𝑤 20
𝐹𝑟𝑤 500) × 120,000]
= 𝐹𝑟𝑤 360,000,000 + 𝐹𝑟𝑤 120,000,000 = 𝐹𝑟𝑤 480,000,000
Value per share of the merged company
= 𝐹𝑟𝑤 480,000,000/240,000 shares = 𝐹𝑟𝑤 2,000 𝑝𝑒𝑟 𝑠ℎ𝑎𝑟𝑒
Calculation of the net cost of acquisition:
Gross cost of acquisition = 40,000 shares * 2,000 = 80,000,000
Less: current market price = 60,000,000
Cost of acquisition = 20,000,000
iii) the gain from acquisition of YZ ltd by AB ltd (3 Marks)
Gain from acquisition = Value of merged co. – (Value of AB + Value of YZ)
= Frw. 480,000,000 – (Frw. 360,000,000 + 60,000,000) = Frw. 60,000,000
iv) If the expected growth rate continues to be 6% per annum, how will the new share price
as well as cost be different?
When the acquisition is based on share exchange, then variation will occur in cost of acquisition
as under:
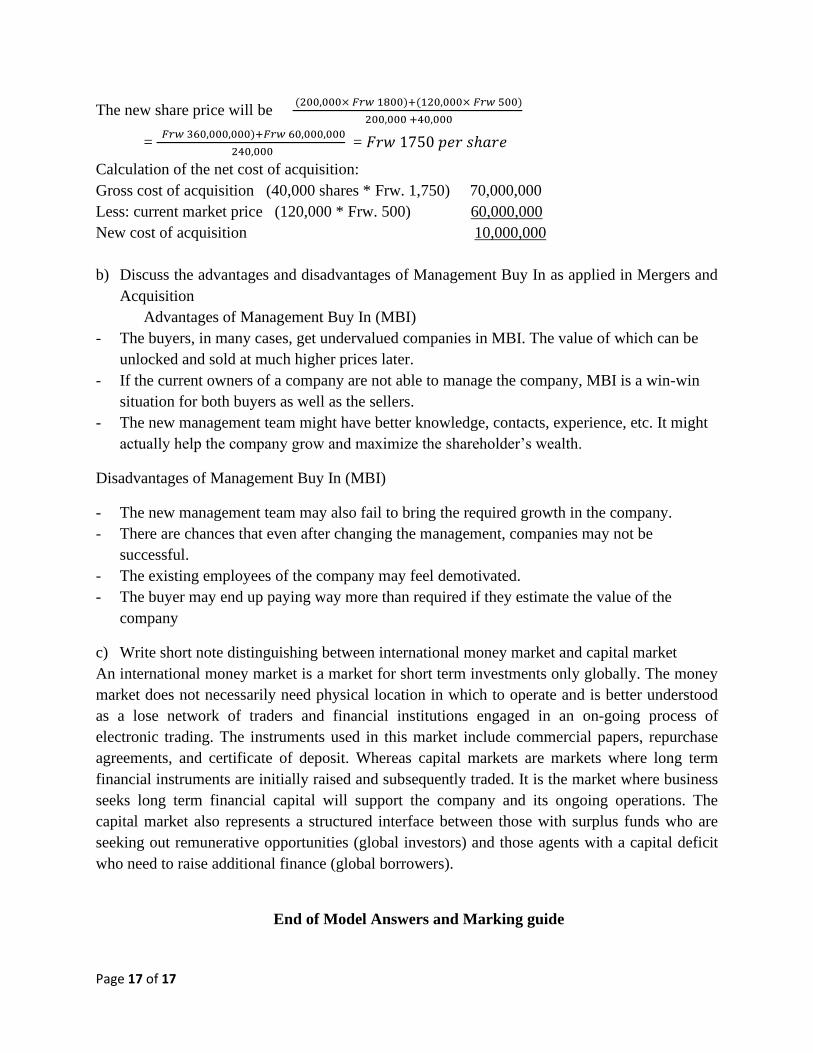
Page 17 of 17
The new share price will be (200,000× 𝐹𝑟𝑤 1800)+(120,000× 𝐹𝑟𝑤 500)
200,000 +40,000
= 𝐹𝑟𝑤 360,000,000)+𝐹𝑟𝑤 60,000,000
240,000 = 𝐹𝑟𝑤 1750 𝑝𝑒𝑟 𝑠ℎ𝑎𝑟𝑒
Calculation of the net cost of acquisition:
Gross cost of acquisition (40,000 shares * Frw. 1,750) 70,000,000
Less: current market price (120,000 * Frw. 500) 60,000,000
New cost of acquisition 10,000,000
b) Discuss the advantages and disadvantages of Management Buy In as applied in Mergers and
Acquisition
Advantages of Management Buy In (MBI)
- The buyers, in many cases, get undervalued companies in MBI. The value of which can be
unlocked and sold at much higher prices later.
- If the current owners of a company are not able to manage the company, MBI is a win-win
situation for both buyers as well as the sellers.
- The new management team might have better knowledge, contacts, experience, etc. It might
actually help the company grow and maximize the shareholder’s wealth.
Disadvantages of Management Buy In (MBI)
- The new management team may also fail to bring the required growth in the company.
- There are chances that even after changing the management, companies may not be
successful.
- The existing employees of the company may feel demotivated.
- The buyer may end up paying way more than required if they estimate the value of the
company
c) Write short note distinguishing between international money market and capital market
An international money market is a market for short term investments only globally. The money
market does not necessarily need physical location in which to operate and is better understood
as a lose network of traders and financial institutions engaged in an on-going process of
electronic trading. The instruments used in this market include commercial papers, repurchase
agreements, and certificate of deposit. Whereas capital markets are markets where long term
financial instruments are initially raised and subsequently traded. It is the market where business
seeks long term financial capital will support the company and its ongoing operations. The
capital market also represents a structured interface between those with surplus funds who are
seeking out remunerative opportunities (global investors) and those agents with a capital deficit
who need to raise additional finance (global borrowers).
End of Model Answers and Marking guide