CERTIFICATION TEST REPORT FCC CFR 47, PART … test report for fcc cfr 47, part 15, subpart c...
84
CERTIFICATION TEST REPORT FOR FCC CFR 47, PART 15, SUBPART C INDUSTRY CANADA RSS-210, ISSUE 8 PRODUCT NAME Ford SYNC Gen 2 PRODUCT MODEL NUMBER KMHSYNCG2-L FCC ID KMHSYNCG2-L IC ID 1422A-SYNCG2L MANUFACTURER Ford Motor Company TEST REPORT NUMBER GND1038AUT219-A TEST REPORT DATE 16 th Mar 2011 TEST REPORT VERSION 1.7 ISSUED TO David Orris Ford Motor Company Building 5, 20300 Rotunda Dr., Dearborn, MI 48124, United States Phone: 313-805-5627 ISSUED BY TARANG Wipro Technologies, SJP2, Survey#70,77,78/8A, Dodda Kanelli, Sarjapur road, Bangalore-560 035. Karnataka. India. Tel: +91-80-30292929 Fax: +91-80-30298200 Email: [email protected] Web: www.wipro.com
Transcript of CERTIFICATION TEST REPORT FCC CFR 47, PART … test report for fcc cfr 47, part 15, subpart c...
CERTIFICATION TEST REPORT FOR
FCC CFR 47, PART 15, SUBPART C INDUSTRY CANADA RSS-210, ISSUE 8
PRODUCT NAME Ford SYNC Gen 2 PRODUCT MODEL NUMBER KMHSYNCG2-L FCC ID KMHSYNCG2-L IC ID 1422A-SYNCG2L MANUFACTURER Ford Motor Company TEST REPORT NUMBER GND1038AUT219-A TEST REPORT DATE 16th Mar 2011 TEST REPORT VERSION 1.7 ISSUED TO David Orris
Ford Motor Company Building 5, 20300 Rotunda Dr., Dearborn, MI 48124, United States Phone: 313-805-5627
ISSUED BY TARANG Wipro Technologies, SJP2, Survey#70,77,78/8A, Dodda Kanelli, Sarjapur road, Bangalore-560 035. Karnataka. India. Tel: +91-80-30292929 Fax: +91-80-30298200 Email: [email protected] Web: www.wipro.com
Date 16th Mar 2011 FCC ID KMHSYNCG2-L Report Number GND1038AUT219-A IC ID 1422A-SYNCG2L
Tarang Wipro Technologies, SJP2, Survey#70,77,78/8A, Dodda Kanelli, Sarjapur road, Bangalore-560 035. Karnataka. India. Tel: +91-80-30298772 Fax: 91-80-28440054 E-mail: [email protected] This report must not be reproduced, except in full, without prior written permission from Tarang lab.
Page 2 of 84
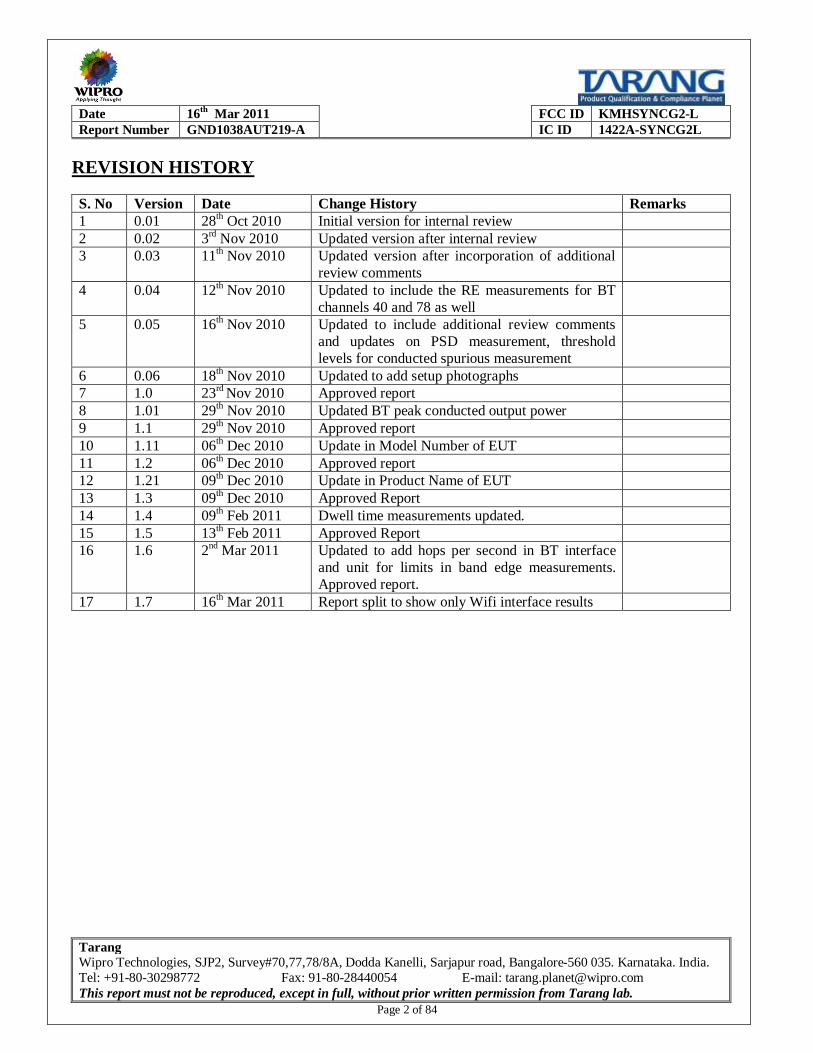
REVISION HISTORY S. No Version Date Change History Remarks 1 0.01 28th Oct 2010 Initial version for internal review 2 0.02 3rd Nov 2010 Updated version after internal review 3 0.03 11th Nov 2010 Updated version after incorporation of additional
review comments
4 0.04 12th Nov 2010 Updated to include the RE measurements for BT channels 40 and 78 as well
5 0.05 16th Nov 2010 Updated to include additional review comments and updates on PSD measurement, threshold levels for conducted spurious measurement
6 0.06 18th Nov 2010 Updated to add setup photographs 7 1.0 23rd Nov 2010 Approved report 8 1.01 29th Nov 2010 Updated BT peak conducted output power 9 1.1 29th Nov 2010 Approved report 10 1.11 06th Dec 2010 Update in Model Number of EUT 11 1.2 06th Dec 2010 Approved report 12 1.21 09th Dec 2010 Update in Product Name of EUT 13 1.3 09th Dec 2010 Approved Report 14 1.4 09th Feb 2011 Dwell time measurements updated. 15 1.5 13th Feb 2011 Approved Report 16 1.6 2nd Mar 2011 Updated to add hops per second in BT interface
and unit for limits in band edge measurements. Approved report.
17 1.7 16th Mar 2011 Report split to show only Wifi interface results

Date 16th Mar 2011 FCC ID KMHSYNCG2-L Report Number GND1038AUT219-A IC ID 1422A-SYNCG2L
Tarang Wipro Technologies, SJP2, Survey#70,77,78/8A, Dodda Kanelli, Sarjapur road, Bangalore-560 035. Karnataka. India. Tel: +91-80-30298772 Fax: 91-80-28440054 E-mail: [email protected] This report must not be reproduced, except in full, without prior written permission from Tarang lab.
Page 3 of 84
TABLE OF CONTENTS 1 TEST DESCRIPTION & RESULT ...................................................................................................................................... 9
2 SUMMARY OF TESTS, FACILITY AND ACCREDITATION ................................................................................................10
2.1 TEST DETAILS .........................................................................................................................................................10 2.2 TEST FACILITY DETAILS ..............................................................................................................................................10 2.3 CALIBRATION .........................................................................................................................................................10 2.4 MEASUREMENT UNCERTAINTY ...................................................................................................................................10
3 EQUIPMENT UNDER TEST (EUT) .................................................................................................................................11
3.1 DESCRIPTION OF THE EUT ..........................................................................................................................................11 3.2 SOFTWARE AND FIRMWARE DETAILS ............................................................................................................................11 3.3 PRODUCT CONFIGURATION DETAILS (WORST CASE) ..........................................................................................................11 3.4 TRANSMIT POWER DETAILS ........................................................................................................................................12 3.5 TEST SETUP DETAILS .................................................................................................................................................12
3.5.1 Supporting equipment ...................................................................................................................................12 3.5.2 I/O Cables and connectors..............................................................................................................................12 3.5.3 Test setup details ...........................................................................................................................................13
3.5.3.1 Radiated emission test setup details ...................................................................................................................... 13 3.5.3.2 Antenna conducted measurement test setup details .............................................................................................. 13
4 INSTRUMENTATION AND CALIBRATION ....................................................................................................................14
4.1 TEST AND MEASURING EQUIPMENT ...................................................................................................................14 4.2 EQUIPMENTS USED ............................................................................................................................................14
5 APPLICABILITY OF TESTS ............................................................................................................................................15
5.1 APPLICABLE TESTS FOR 802.11B AND 802.11G PORT .....................................................................................................15
6 TEST RESULTS FOR WI-FI PORT ..................................................................................................................................16
6.1 WI-FI 801.11B MODE ............................................................................................................................................16 6.1.1 Restricted band of operation ..........................................................................................................................16
6.1.1.1 Reference section & Limits .................................................................................................................................... 16 6.1.1.2 Test procedure ...................................................................................................................................................... 16 6.1.1.3 Result ................................................................................................................................................................... 16 6.1.1.4 Result (Supporting graphs / Data) .......................................................................................................................... 17
6.1.2 Radiated emission ..........................................................................................................................................18 6.1.2.1 Reference section & Limits .................................................................................................................................... 18 6.1.2.2 Test procedure ...................................................................................................................................................... 18 6.1.2.3 Result ................................................................................................................................................................... 18 6.1.2.4 Result (Supporting graphs / Data) – Channel 1 ....................................................................................................... 19 6.1.2.5 Result (Supporting graphs / Data) – Channel 6 ....................................................................................................... 24 6.1.2.6 Result (Supporting graphs / Data) – Channel 11...................................................................................................... 29
6.1.3 6dB Bandwidth ..............................................................................................................................................34 6.1.3.1 Reference section & Limits .................................................................................................................................... 34 6.1.3.2 Test procedure ...................................................................................................................................................... 34 6.1.3.3 Result ................................................................................................................................................................... 34 6.1.3.4 Result (Supporting graphs / Data) .......................................................................................................................... 35
6.1.4 Peak conducted output power ........................................................................................................................36 6.1.4.1 Reference section & Limits .................................................................................................................................... 36

Date 16th Mar 2011 FCC ID KMHSYNCG2-L Report Number GND1038AUT219-A IC ID 1422A-SYNCG2L
Tarang Wipro Technologies, SJP2, Survey#70,77,78/8A, Dodda Kanelli, Sarjapur road, Bangalore-560 035. Karnataka. India. Tel: +91-80-30298772 Fax: 91-80-28440054 E-mail: [email protected] This report must not be reproduced, except in full, without prior written permission from Tarang lab.
Page 4 of 84
6.1.4.2 Test procedure ...................................................................................................................................................... 36 6.1.4.3 Result ................................................................................................................................................................... 37 6.1.4.4 Result (Supporting graphs / Data) .......................................................................................................................... 37
6.1.5 Conducted spurious emission .........................................................................................................................39 6.1.5.1 Reference section & Limits .................................................................................................................................... 39 6.1.5.2 Test procedure ...................................................................................................................................................... 39 6.1.5.3 Result ................................................................................................................................................................... 39 6.1.5.4 Result (Supporting graphs / Data) .......................................................................................................................... 40
6.1.6 Power spectral density ...................................................................................................................................41 6.1.6.1 Reference section & Limits .................................................................................................................................... 41 6.1.6.2 Test procedure ...................................................................................................................................................... 41 6.1.6.3 Result ................................................................................................................................................................... 42 6.1.6.4 Result (Supporting graphs / Data) .......................................................................................................................... 42
6.1.7 Band edge Measurements – Radiated ............................................................................................................44 6.1.7.1 Reference section & Limits .................................................................................................................................... 44 6.1.7.2 Test procedure ...................................................................................................................................................... 44 6.1.7.3 Result ................................................................................................................................................................... 44
6.1.8 Band edge Measurements – Conducted..........................................................................................................45 6.1.8.1 Reference section & Limits .................................................................................................................................... 45 6.1.8.2 Test procedure ...................................................................................................................................................... 46 6.1.8.3 Result (Supporting graphs / Data) .......................................................................................................................... 46
6.2 WI-FI 801.11G MODE ...........................................................................................................................................48 6.2.1 Restricted band of operation ..........................................................................................................................48
6.2.1.1 Reference section & Limits .................................................................................................................................... 48 6.2.1.2 Test procedure ...................................................................................................................................................... 48 6.2.1.3 Result ................................................................................................................................................................... 48 6.2.1.4 Result (Supporting graphs / Data) .......................................................................................................................... 49
6.2.2 Radiated emission ..........................................................................................................................................50 6.2.2.1 Reference section & Limits .................................................................................................................................... 50 6.2.2.2 Test procedure ...................................................................................................................................................... 50 6.2.2.3 Result ................................................................................................................................................................... 50 6.2.2.4 Result (Supporting graphs / Data) – Channel 1 ....................................................................................................... 51 6.2.2.5 Result (Supporting graphs / Data) – Channel 6 ....................................................................................................... 56 6.2.2.6 Result (Supporting graphs / Data) – Channel 11...................................................................................................... 61
6.2.3 6dB Bandwidth ..............................................................................................................................................67 6.2.3.1 Reference section & Limits .................................................................................................................................... 67 6.2.3.2 Test procedure ...................................................................................................................................................... 67 6.2.3.3 Result ................................................................................................................................................................... 67 6.2.3.4 Result (Supporting graphs / Data) .......................................................................................................................... 68
6.2.4 Peak conducted output power ........................................................................................................................69 6.2.4.1 Reference section & Limits .................................................................................................................................... 69 6.2.4.2 Test procedure ...................................................................................................................................................... 69 6.2.4.3 Result ................................................................................................................................................................... 70 6.2.4.4 Result (Supporting graphs / Data) .......................................................................................................................... 70
6.2.5 Conducted spurious emission .........................................................................................................................72 6.2.5.1 Reference section & Limits .................................................................................................................................... 72 6.2.5.2 Test procedure ...................................................................................................................................................... 72 6.2.5.3 Result ................................................................................................................................................................... 72 6.2.5.4 Result (Supporting graphs / Data) .......................................................................................................................... 73
6.2.6 Power spectral density ...................................................................................................................................74 6.2.6.1 Reference section & Limits .................................................................................................................................... 74 6.2.6.2 Test procedure ...................................................................................................................................................... 74
Date 16th Mar 2011 FCC ID KMHSYNCG2-L Report Number GND1038AUT219-A IC ID 1422A-SYNCG2L
Tarang Wipro Technologies, SJP2, Survey#70,77,78/8A, Dodda Kanelli, Sarjapur road, Bangalore-560 035. Karnataka. India. Tel: +91-80-30298772 Fax: 91-80-28440054 E-mail: [email protected] This report must not be reproduced, except in full, without prior written permission from Tarang lab.
Page 5 of 84
6.2.6.3 Result ................................................................................................................................................................... 75 6.2.6.4 Result (Supporting graphs / Data) .......................................................................................................................... 75
6.2.7 Band edge Measurements – Radiated ............................................................................................................77 6.2.7.1 Reference section & Limits .................................................................................................................................... 77 6.2.7.2 Test procedure ...................................................................................................................................................... 77 6.2.7.3 Result ................................................................................................................................................................... 77
6.2.8 Band edge Measurements – Conducted..........................................................................................................79 6.2.8.1 Reference section & Limits .................................................................................................................................... 79 6.2.8.2 Test procedure ...................................................................................................................................................... 79 6.2.8.3 Result (Supporting graphs / Data) .......................................................................................................................... 79
7 APPENDIX 1 – ACRONYMS .........................................................................................................................................81
8 APPENDIX 2 – PHOTOGRAPH OF TEST SETUPS ...........................................................................................................82
Date 16th Mar 2011 FCC ID KMHSYNCG2-L Report Number GND1038AUT219-A IC ID 1422A-SYNCG2L
Tarang Wipro Technologies, SJP2, Survey#70,77,78/8A, Dodda Kanelli, Sarjapur road, Bangalore-560 035. Karnataka. India. Tel: +91-80-30298772 Fax: 91-80-28440054 E-mail: [email protected] This report must not be reproduced, except in full, without prior written permission from Tarang lab.
Page 6 of 84
LIST OF FIGURES FIGURE 1: TEST SETUP FOR RADIATED EMISSION TEST .......................................................................................................................13 FIGURE 2: TEST SETUP FOR CONDUCTED MEASUREMENTS ON THE WIRELESS PORTS ..................................................................................13 FIGURE 3: MEASURED FL AT CHANNEL 1 – 802.11B ........................................................................................................................17 FIGURE 4: MEASURED FH AT CHANNEL 13 – 802.11B .....................................................................................................................17 FIGURE 5: RADIATED EMISSION RESULTS (PEAK) – HORIZONTAL POLARIZATION – 30 MHZ TO 1 GHZ – 802.11B, CHANNEL 1 ..........................19 FIGURE 6: RADIATED EMISSION RESULTS (PEAK) – VERTICAL POLARIZATION – 30 MHZ TO 1 GHZ – 802.11B, CHANNEL 1 ...............................19 FIGURE 7: RADIATED EMISSION RESULTS – QUASI-PEAK TABLE - 30 MHZ TO 1 GHZ – 802.11B, CHANNEL 1 ................................................20 FIGURE 8: RADIATED EMISSION RESULTS (AVERAGE) – HORIZONTAL POLARIZATION – 1 GHZ TO 2 GHZ – 802.11B, CHANNEL 1........................20 FIGURE 9: RADIATED EMISSION RESULTS (AVERAGE) – HORIZONTAL POLARIZATION –2 GHZ TO 8GHZ – 802.11B, CHANNEL 1 .........................20 FIGURE 10: RADIATED EMISSION RESULTS (AVERAGE) – HORIZONTAL POLARIZATION –8 GHZ TO 18GHZ – 802.11B, CHANNEL 1 .....................21 FIGURE 11: RADIATED EMISSION RESULTS (AVERAGE) – HORIZONTAL POLARIZATION – 18 GHZ TO 25 GHZ – 802.11B, CHANNEL 1 ..................21 FIGURE 12: RADIATED EMISSION RESULTS (AVERAGE) – VERTICAL POLARIZATION – 1 GHZ TO 2 GHZ – 802.11B, CHANNEL 1 ..........................22 FIGURE 13: RADIATED EMISSION RESULTS (AVERAGE) – VERTICAL POLARIZATION –2 GHZ TO 8 GHZ – 802.11B, CHANNEL 1 ...........................22 FIGURE 14: RADIATED EMISSION RESULTS (AVERAGE) – VERTICAL POLARIZATION –8 GHZ TO 18 GHZ – 802.11B, CHANNEL 1 .........................23 FIGURE 15: RADIATED EMISSION RESULTS (AVERAGE) – VERTICAL POLARIZATION – 18 GHZ TO 25 GHZ – 802.11B, CHANNEL 1 ......................23 FIGURE 16: RADIATED EMISSION RESULTS (PEAK) – HORIZONTAL POLARIZATION – 30 MHZ TO 1 GHZ – 802.11B, CHANNEL 6 ........................24 FIGURE 17: RADIATED EMISSION RESULTS (PEAK) – VERTICAL POLARIZATION – 30 MHZ TO 1 GHZ – 802.11B, CHANNEL 6 .............................24 FIGURE 18: RADIATED EMISSION RESULTS – QUASI-PEAK TABLE - 30 MHZ TO 1 GHZ – 802.11B, CHANNEL 6 ..............................................24 FIGURE 19: RADIATED EMISSION RESULTS (AVERAGE) – HORIZONTAL POLARIZATION – 1 GHZ TO 2 GHZ – 802.11B, CHANNEL 6 ......................25 FIGURE 20: RADIATED EMISSION RESULTS (AVERAGE) – HORIZONTAL POLARIZATION –2 GHZ TO 8GHZ – 802.11B, CHANNEL 6 .......................25 FIGURE 21: RADIATED EMISSION RESULTS (AVERAGE) – HORIZONTAL POLARIZATION –8 GHZ TO 18GHZ – 802.11B, CHANNEL 6 .....................26 FIGURE 22: RADIATED EMISSION RESULTS (AVERAGE) – HORIZONTAL POLARIZATION – 18 GHZ TO 25 GHZ – 802.11B, CHANNEL 6 ..................26 FIGURE 23: RADIATED EMISSION RESULTS (AVERAGE) – VERTICAL POLARIZATION – 1 GHZ TO 2 GHZ – 802.11B, CHANNEL 6 ..........................27 FIGURE 24: RADIATED EMISSION RESULTS (AVERAGE) – VERTICAL POLARIZATION –2 GHZ TO 8 GHZ – 802.11B, CHANNEL 6 ...........................27 FIGURE 25: RADIATED EMISSION RESULTS (AVERAGE) – VERTICAL POLARIZATION –8 GHZ TO 18 GHZ – 802.11B, CHANNEL 6 .........................28 FIGURE 26: RADIATED EMISSION RESULTS (AVERAGE) – VERTICAL POLARIZATION – 18 GHZ TO 25 GHZ – 802.11B, CHANNEL 6 ......................28 FIGURE 27: RADIATED EMISSION RESULTS (PEAK) – HORIZONTAL POLARIZATION – 30 MHZ TO 1 GHZ – 802.11B, CHANNEL 11 ......................29 FIGURE 28: RADIATED EMISSION RESULTS (PEAK) – VERTICAL POLARIZATION – 30 MHZ TO 1 GHZ – 802.11B, CHANNEL 11 ...........................29 FIGURE 29: RADIATED EMISSION RESULTS – QUASI-PEAK TABLE - 30 MHZ TO 1 GHZ – 802.11B, CHANNEL 11 ............................................30 FIGURE 30: RADIATED EMISSION RESULTS (AVERAGE) – HORIZONTAL POLARIZATION – 1 GHZ TO 2 GHZ – 802.11B, CHANNEL 11 ....................30 FIGURE 31: RADIATED EMISSION RESULTS (AVERAGE) – HORIZONTAL POLARIZATION –2 GHZ TO 8GHZ – 802.11B, CHANNEL 11 .....................30 FIGURE 32: RADIATED EMISSION RESULTS (AVERAGE) – HORIZONTAL POLARIZATION –8 GHZ TO 18GHZ – 802.11B, CHANNEL 11 ...................31 FIGURE 33: RADIATED EMISSION RESULTS (AVERAGE) – HORIZONTAL POLARIZATION 18 GHZ TO 25 GHZ – 802.11B, CHANNEL 11 ..................31 FIGURE 34: RADIATED EMISSION RESULTS (AVERAGE) – VERTICAL POLARIZATION – 1 GHZ TO 2 GHZ – 802.11B, CHANNEL 11 ........................32 FIGURE 35: RADIATED EMISSION RESULTS (AVERAGE) – VERTICAL POLARIZATION –2 GHZ TO 8 GHZ – 802.11B, CHANNEL 11 .........................32 FIGURE 36: RADIATED EMISSION RESULTS (AVERAGE) – VERTICAL POLARIZATION –8 GHZ TO 18 GHZ – 802.11B, CHANNEL 11 .......................33 FIGURE 37: RADIATED EMISSION RESULTS (AVERAGE) – VERTICAL POLARIZATION – 18 GHZ TO 25 GHZ – 802.11B, CHANNEL 11 ....................33 FIGURE 38: 6DB BANDWIDTH – 802.11B, LOW CHANNEL (1) ...........................................................................................................35 FIGURE 39: 6DB BANDWIDTH – 802.11B, MID CHANNEL (6) ............................................................................................................35 FIGURE 40: 6DB BANDWIDTH – 802.11B, HIGH CHANNEL (11) .........................................................................................................36 FIGURE 41: PEAK CONDUCTED OUTPUT POWER – 802.11B, LOW CHANNEL (1) .....................................................................................37 FIGURE 42: PEAK CONDUCTED OUTPUT POWER – 802.11B, MID CHANNEL (6) ......................................................................................38 FIGURE 43: PEAK CONDUCTED OUTPUT POWER – 802.11B, HIGH CHANNEL (11) ...................................................................................38 FIGURE 44: CONDUCTED SPURIOUS EMISSION – 802.11B, LOW CHANNEL (1).......................................................................................40 FIGURE 45: CONDUCTED SPURIOUS EMISSION – 802.11B, MID CHANNEL (6) .......................................................................................40 FIGURE 46: CONDUCTED SPURIOUS EMISSION – 802.11B, HIGH CHANNEL (11) ....................................................................................41
Date 16th Mar 2011 FCC ID KMHSYNCG2-L Report Number GND1038AUT219-A IC ID 1422A-SYNCG2L
Tarang Wipro Technologies, SJP2, Survey#70,77,78/8A, Dodda Kanelli, Sarjapur road, Bangalore-560 035. Karnataka. India. Tel: +91-80-30298772 Fax: 91-80-28440054 E-mail: [email protected] This report must not be reproduced, except in full, without prior written permission from Tarang lab.
Page 7 of 84
FIGURE 47: POWER SPECTRAL DENSITY – 802.11B, LOW CHANNEL (1) ...............................................................................................42 FIGURE 48: POWER SPECTRAL DENSITY – 802.11B, MID CHANNEL (6) ................................................................................................43 FIGURE 49: POWER SPECTRAL DENSITY – 802.11B, HIGH CHANNEL (11) .............................................................................................43 FIGURE 50: LOW BAND EDGE – 802.11B, LOW CHANNEL (1) ...........................................................................................................46 FIGURE 51: HIGH BAND EDGE – 802.11B, HIGH CHANNEL (13) ........................................................................................................47 FIGURE 52: MEASURED FL AT CHANNEL 1 – 802.11G ......................................................................................................................49 FIGURE 53: MEASURED FH AT CHANNEL 13 – 802.11G ...................................................................................................................49 FIGURE 54: RADIATED EMISSION RESULTS (PEAK) – HORIZONTAL POLARIZATION – 30 MHZ TO 1 GHZ – 802.11G, CHANNEL 1 ........................51 FIGURE 55: RADIATED EMISSION RESULTS (PEAK) – VERTICAL POLARIZATION – 30 MHZ TO 1 GHZ – 802.11G, CHANNEL 1 ............................51 FIGURE 56: RADIATED EMISSION RESULTS – QUASI-PEAK TABLE - 30 MHZ TO 1 GHZ – 802.11G, CHANNEL 1 ..............................................52 FIGURE 57: RADIATED EMISSION RESULTS (AVERAGE) – HORIZONTAL POLARIZATION – 1 GHZ TO 2 GHZ – 802.11G, CHANNEL 1 .....................52 FIGURE 58: RADIATED EMISSION RESULTS (AVERAGE) – HORIZONTAL POLARIZATION –2 GHZ TO 8GHZ – 802.11G, CHANNEL 1 .......................52 FIGURE 59: RADIATED EMISSION RESULTS (AVERAGE) – HORIZONTAL POLARIZATION –8 GHZ TO 18GHZ – 802.11G, CHANNEL 1 .....................53 FIGURE 60: RADIATED EMISSION RESULTS (AVERAGE) – HORIZONTAL POLARIZATION – 18 GHZ TO 25 GHZ – 802.11G, CHANNEL 1..................53 FIGURE 61: RADIATED EMISSION RESULTS (AVERAGE) – VERTICAL POLARIZATION – 1 GHZ TO 2 GHZ – 802.11G, CHANNEL 1 ..........................54 FIGURE 62: RADIATED EMISSION RESULTS (AVERAGE) – VERTICAL POLARIZATION –2 GHZ TO 8 GHZ – 802.11G, CHANNEL 1...........................54 FIGURE 63: RADIATED EMISSION RESULTS (AVERAGE) – VERTICAL POLARIZATION –8 GHZ TO 18 GHZ – 802.11G, CHANNEL 1 .........................55 FIGURE 64: RADIATED EMISSION RESULTS (AVERAGE) – VERTICAL POLARIZATION – 18 GHZ TO 25 GHZ – 802.11G, CHANNEL 1 ......................55 FIGURE 65: RADIATED EMISSION RESULTS (PEAK) – HORIZONTAL POLARIZATION – 30 MHZ TO 1 GHZ – 802.11G, CHANNEL 6 ........................56 FIGURE 66: RADIATED EMISSION RESULTS (PEAK) – VERTICAL POLARIZATION – 30 MHZ TO 1 GHZ – 802.11G, CHANNEL 6 ............................56 FIGURE 67: RADIATED EMISSION RESULTS – QUASI-PEAK TABLE - 30 MHZ TO 1 GHZ – 802.11G, CHANNEL 6 ..............................................57 FIGURE 68: RADIATED EMISSION RESULTS (AVERAGE) – HORIZONTAL POLARIZATION – 1 GHZ TO 2 GHZ – 802.11G, CHANNEL 6 .....................57 FIGURE 69: RADIATED EMISSION RESULTS (AVERAGE) – HORIZONTAL POLARIZATION –2 GHZ TO 8GHZ – 802.11G, CHANNEL 6 .......................58 FIGURE 70: RADIATED EMISSION RESULTS (AVERAGE) – HORIZONTAL POLARIZATION –8 GHZ TO 18GHZ – 802.11G, CHANNEL 6 .....................58 FIGURE 71: RADIATED EMISSION RESULTS (AVERAGE) – HORIZONTAL POLARIZATION – 18 GHZ TO 25 GHZ – 802.11G, CHANNEL 6..................59 FIGURE 72: RADIATED EMISSION RESULTS (AVERAGE) – VERTICAL POLARIZATION – 1 GHZ TO 2 GHZ – 802.11G, CHANNEL 6 ..........................59 FIGURE 73: RADIATED EMISSION RESULTS (AVERAGE) – VERTICAL POLARIZATION –2 GHZ TO 8 GHZ – 802.11G, CHANNEL 6...........................60 FIGURE 74: RADIATED EMISSION RESULTS (AVERAGE) – VERTICAL POLARIZATION –8 GHZ TO 18 GHZ – 802.11G, CHANNEL 6 .........................60 FIGURE 75: RADIATED EMISSION RESULTS (AVERAGE) – VERTICAL POLARIZATION – 18 GHZ TO 25 GHZ – 802.11G, CHANNEL 6 ......................61 FIGURE 76: RADIATED EMISSION RESULTS (PEAK) – HORIZONTAL POLARIZATION – 30 MHZ TO 1 GHZ – 802.11G, CHANNEL 11 ......................61 FIGURE 77: RADIATED EMISSION RESULTS (PEAK) – VERTICAL POLARIZATION – 30 MHZ TO 1 GHZ – 802.11G, CHANNEL 11...........................62 FIGURE 78: RADIATED EMISSION RESULTS – QUASI-PEAK TABLE - 30 MHZ TO 1 GHZ – 802.11G, CHANNEL 11 ............................................62 FIGURE 79: RADIATED EMISSION RESULTS (AVERAGE) – HORIZONTAL POLARIZATION – 1 GHZ TO 2 GHZ – 802.11G, CHANNEL 11 ...................63 FIGURE 80: RADIATED EMISSION RESULTS (AVERAGE) – HORIZONTAL POLARIZATION –2 GHZ TO 8GHZ – 802.11G, CHANNEL 11 .....................63 FIGURE 81: RADIATED EMISSION RESULTS (AVERAGE) – HORIZONTAL POLARIZATION –8 GHZ TO 18GHZ – 802.11G, CHANNEL 11 ...................64 FIGURE 82: RADIATED EMISSION RESULTS (AVERAGE) – HORIZONTAL POLARIZATION – 18 GHZ TO 25 GHZ – 802.11G, CHANNEL 11................64 FIGURE 83: RADIATED EMISSION RESULTS (AVERAGE) – VERTICAL POLARIZATION – 1 GHZ TO 2 GHZ – 802.11G, CHANNEL 11 ........................65 FIGURE 84: RADIATED EMISSION RESULTS (AVERAGE) – VERTICAL POLARIZATION –2 GHZ TO 8 GHZ – 802.11G, CHANNEL 11 .........................65 FIGURE 85: RADIATED EMISSION RESULTS (AVERAGE) – VERTICAL POLARIZATION –8 GHZ TO 18 GHZ – 802.11G, CHANNEL 11 .......................66 FIGURE 86: RADIATED EMISSION RESULTS (AVERAGE) – VERTICAL POLARIZATION – 18 GHZ TO 25 GHZ – 802.11G, CHANNEL 11 ....................66 FIGURE 87: 6DB BANDWIDTH – 802.11G, LOW CHANNEL (1) ...........................................................................................................68 FIGURE 88: 6DB BANDWIDTH – 802.11G, MID CHANNEL (6)............................................................................................................68 FIGURE 89: 6DB BANDWIDTH – 802.11G, HIGH CHANNEL (11) .........................................................................................................69 FIGURE 90: PEAK CONDUCTED OUTPUT POWER – 802.11G, LOW CHANNEL (1) .....................................................................................70 FIGURE 91: PEAK CONDUCTED OUTPUT POWER – 802.11G, MID CHANNEL (6)......................................................................................71 FIGURE 92: PEAK CONDUCTED OUTPUT POWER – 802.11G, HIGH CHANNEL (11)...................................................................................71 FIGURE 93: CONDUCTED SPURIOUS EMISSION – 802.11G, LOW CHANNEL (1) ......................................................................................73 FIGURE 94: CONDUCTED SPURIOUS EMISSION – 802.11G, MID CHANNEL (6) .......................................................................................73

Date 16th Mar 2011 FCC ID KMHSYNCG2-L Report Number GND1038AUT219-A IC ID 1422A-SYNCG2L
Tarang Wipro Technologies, SJP2, Survey#70,77,78/8A, Dodda Kanelli, Sarjapur road, Bangalore-560 035. Karnataka. India. Tel: +91-80-30298772 Fax: 91-80-28440054 E-mail: [email protected] This report must not be reproduced, except in full, without prior written permission from Tarang lab.
Page 8 of 84
FIGURE 95: CONDUCTED SPURIOUS EMISSION – 802.11G, HIGH CHANNEL (11) ....................................................................................74 FIGURE 96: POWER SPECTRAL DENSITY – 802.11G, LOW CHANNEL (1) ...............................................................................................75 FIGURE 97: POWER SPECTRAL DENSITY – 802.11G, MID CHANNEL (6) ...............................................................................................76 FIGURE 98: POWER SPECTRAL DENSITY – 802.11G, HIGH CHANNEL (11) ............................................................................................76 FIGURE 99: LOW BAND EDGE – 802.11G, LOW CHANNEL (1) ...........................................................................................................79 FIGURE 100: HIGH BAND EDGE – 802.11G, HIGH CHANNEL (13) ......................................................................................................80 FIGURE 101: TEST SETUP FOR RADIATED EMISSION (VERTICAL POLARIZATION) – 30MHZ TO 1GHZ ............................................................82 FIGURE 102: TEST SETUP FOR RADIATED EMISSION (HORIZONTAL POLARIZATION) – 30MHZ TO 1GHZ .......................................................82 FIGURE 103: TEST SETUP FOR RADIATED EMISSION (HORIZONTAL POLARIZATION) – ABOVE 1GHZ .............................................................83 FIGURE 104: TEST SETUP FOR RADIATED EMISSION (VERTICAL POLARIZATION) – ABOVE 1GHZ ..................................................................83 FIGURE 105: TEST SETUP FOR CONDUCTED MEASUREMENTS ..............................................................................................................84

Date 16th Mar 2011 FCC ID KMHSYNCG2-L Report Number GND1038AUT219-A IC ID 1422A-SYNCG2L
Tarang Wipro Technologies, SJP2, Survey#70,77,78/8A, Dodda Kanelli, Sarjapur road, Bangalore-560 035. Karnataka. India. Tel: +91-80-30298772 Fax: 91-80-28440054 E-mail: [email protected] This report must not be reproduced, except in full, without prior written permission from Tarang lab.
Page 9 of 84
1 TEST DESCRIPTION & RESULT Applicant David Orris
Ford Motor Company, Building 5, 20300 Rotunda Dr., Dearborn, MI 48124, United States. Phone: 313-805-5627; E-Mail: [email protected]
Manufacturer Ford Motor Company Equipment Under Test Ford SYNC Gen 2 Model KMHSYNCG2-L Serial Number XM2J000H No. of samples tested One Date of Test 18th Sep 2010 Date of Submission 14th Mar 2011 Venue of Test Tarang
Wipro Technologies, SJP2, Survey#70,77,78/8A, Dodda Kanelli, Sarjapur road, Bangalore-560 035. Karnataka. India.
Applicable Standard Description Criteria / Class Results FCC CFR 47, Part 15, Subpart C NA Pass Industry Canada RSS-210, Issue 8 NA Pass
Tarang lab tested Ford SYNC Gen 2 as per the standards that are listed in the table above. Based on the observations during the test and interpretations by Tarang lab, results have been indicated. Any measurement uncertainties listed in this report are for information only and have not been taken into account in the results. The overall test results show that Ford SYNC Gen 2 is capable of demonstrating the compliance requirements of the standards listed above. The results documented in this report apply only to the product / system tested. The results shall stand invalid, in case there are any modifications / additions / removals to the hardware or software or end use atmosphere to the product tested. Particulars on Manufacturer / Supplier / EUT configuration / Performance criteria, etc given in this report are based on the information given by the customer, along with test request. Tarang does not assume any responsibility for the correctness of that information for the above mentioned equipment under test. Any change to this document that is not carried out by Tarang is unauthorized and this document shall stand invalid. This report must not be used by the client to claim product certification or approval or endorsement by any agency of the Federal Government or any Government.
Prepared by Reviewed by Approved by Sathesh Kumar L Satheesh I Nagaraj C S
Test Engineer Technical Manager Technical Manager
Date 16th Mar 2011 FCC ID KMHSYNCG2-L Report Number GND1038AUT219-A IC ID 1422A-SYNCG2L
Tarang Wipro Technologies, SJP2, Survey#70,77,78/8A, Dodda Kanelli, Sarjapur road, Bangalore-560 035. Karnataka. India. Tel: +91-80-30298772 Fax: 91-80-28440054 E-mail: [email protected] This report must not be reproduced, except in full, without prior written permission from Tarang lab.
Page 10 of 84
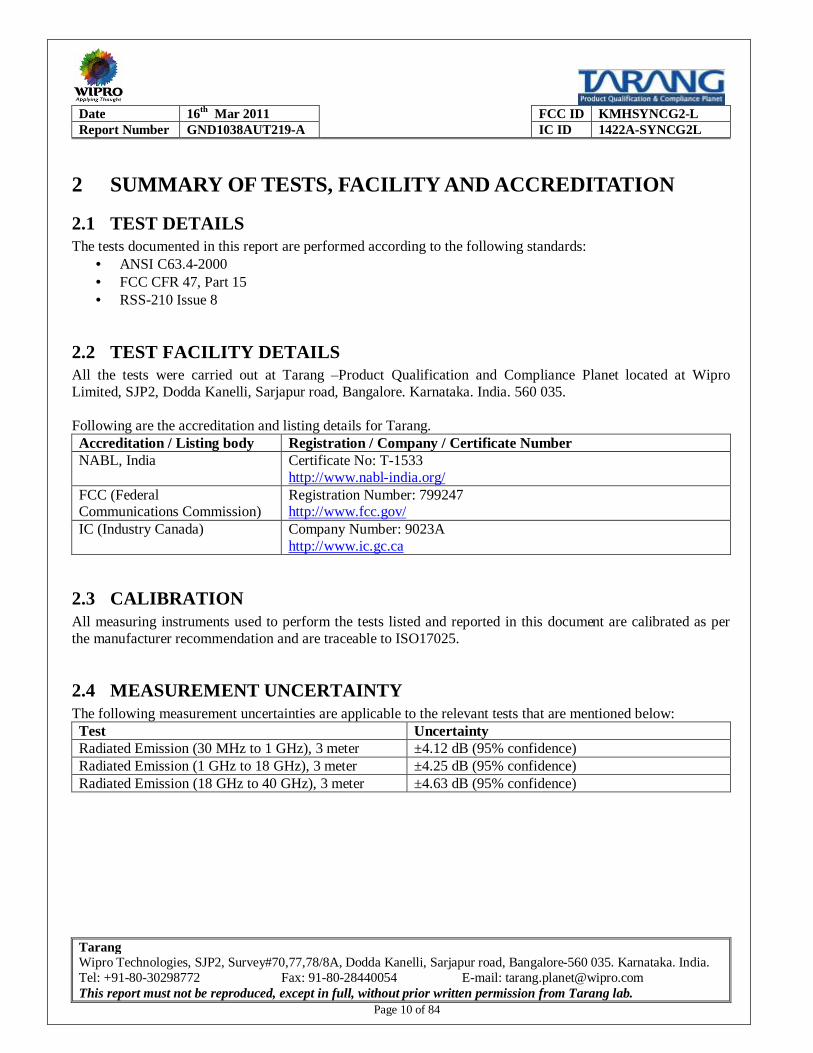
2 SUMMARY OF TESTS, FACILITY AND ACCREDITATION
2.1 TEST DETAILS The tests documented in this report are performed according to the following standards:
• ANSI C63.4-2000 • FCC CFR 47, Part 15 • RSS-210 Issue 8
2.2 TEST FACILITY DETAILS All the tests were carried out at Tarang –Product Qualification and Compliance Planet located at Wipro Limited, SJP2, Dodda Kanelli, Sarjapur road, Bangalore. Karnataka. India. 560 035. Following are the accreditation and listing details for Tarang. Accreditation / Listing body Registration / Company / Certificate Number NABL, India Certificate No: T-1533
http://www.nabl-india.org/ FCC (Federal Communications Commission)
Registration Number: 799247 http://www.fcc.gov/
IC (Industry Canada) Company Number: 9023A http://www.ic.gc.ca
2.3 CALIBRATION All measuring instruments used to perform the tests listed and reported in this document are calibrated as per the manufacturer recommendation and are traceable to ISO17025.
2.4 MEASUREMENT UNCERTAINTY The following measurement uncertainties are applicable to the relevant tests that are mentioned below: Test Uncertainty Radiated Emission (30 MHz to 1 GHz), 3 meter ±4.12 dB (95% confidence) Radiated Emission (1 GHz to 18 GHz), 3 meter ±4.25 dB (95% confidence) Radiated Emission (18 GHz to 40 GHz), 3 meter ±4.63 dB (95% confidence)
Date 16th Mar 2011 FCC ID KMHSYNCG2-L Report Number GND1038AUT219-A IC ID 1422A-SYNCG2L
Tarang Wipro Technologies, SJP2, Survey#70,77,78/8A, Dodda Kanelli, Sarjapur road, Bangalore-560 035. Karnataka. India. Tel: +91-80-30298772 Fax: 91-80-28440054 E-mail: [email protected] This report must not be reproduced, except in full, without prior written permission from Tarang lab.
Page 11 of 84
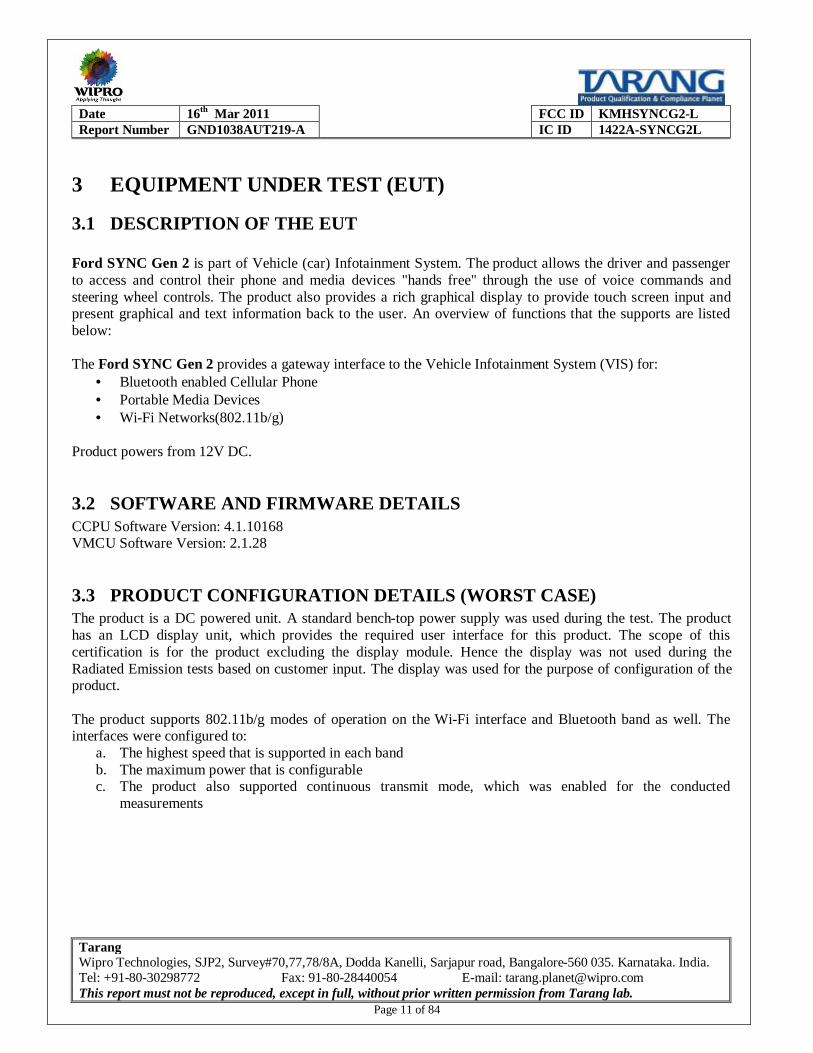
3 EQUIPMENT UNDER TEST (EUT)
3.1 DESCRIPTION OF THE EUT Ford SYNC Gen 2 is part of Vehicle (car) Infotainment System. The product allows the driver and passenger to access and control their phone and media devices "hands free" through the use of voice commands and steering wheel controls. The product also provides a rich graphical display to provide touch screen input and present graphical and text information back to the user. An overview of functions that the supports are listed below: The Ford SYNC Gen 2 provides a gateway interface to the Vehicle Infotainment System (VIS) for:
• Bluetooth enabled Cellular Phone • Portable Media Devices • Wi-Fi Networks(802.11b/g)
Product powers from 12V DC.
3.2 SOFTWARE AND FIRMWARE DETAILS CCPU Software Version: 4.1.10168 VMCU Software Version: 2.1.28
3.3 PRODUCT CONFIGURATION DETAILS (WORST CASE) The product is a DC powered unit. A standard bench-top power supply was used during the test. The product has an LCD display unit, which provides the required user interface for this product. The scope of this certification is for the product excluding the display module. Hence the display was not used during the Radiated Emission tests based on customer input. The display was used for the purpose of configuration of the product. The product supports 802.11b/g modes of operation on the Wi-Fi interface and Bluetooth band as well. The interfaces were configured to:
a. The highest speed that is supported in each band b. The maximum power that is configurable c. The product also supported continuous transmit mode, which was enabled for the conducted
measurements
Date 16th Mar 2011 FCC ID KMHSYNCG2-L Report Number GND1038AUT219-A IC ID 1422A-SYNCG2L
Tarang Wipro Technologies, SJP2, Survey#70,77,78/8A, Dodda Kanelli, Sarjapur road, Bangalore-560 035. Karnataka. India. Tel: +91-80-30298772 Fax: 91-80-28440054 E-mail: [email protected] This report must not be reproduced, except in full, without prior written permission from Tarang lab.
Page 12 of 84
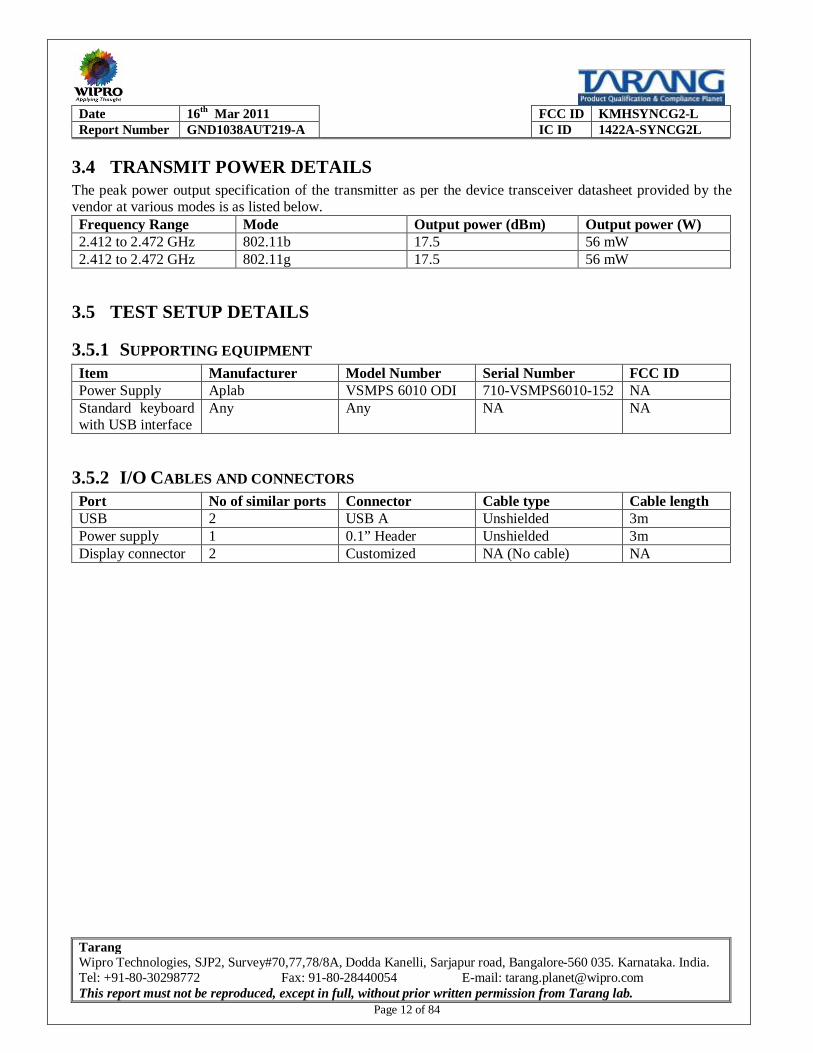
3.4 TRANSMIT POWER DETAILS The peak power output specification of the transmitter as per the device transceiver datasheet provided by the vendor at various modes is as listed below. Frequency Range Mode Output power (dBm) Output power (W) 2.412 to 2.472 GHz 802.11b 17.5 56 mW 2.412 to 2.472 GHz 802.11g 17.5 56 mW
3.5 TEST SETUP DETAILS
3.5.1 SUPPORTING EQUIPMENT Item Manufacturer Model Number Serial Number FCC ID Power Supply Aplab VSMPS 6010 ODI 710-VSMPS6010-152 NA Standard keyboard with USB interface
Any Any NA NA
3.5.2 I/O CABLES AND CONNECTORS Port No of similar ports Connector Cable type Cable length USB 2 USB A Unshielded 3m Power supply 1 0.1” Header Unshielded 3m Display connector 2 Customized NA (No cable) NA

Date 16th Mar 2011 FCC ID KMHSYNCG2-L Report Number GND1038AUT219-A IC ID 1422A-SYNCG2L
Tarang Wipro Technologies, SJP2, Survey#70,77,78/8A, Dodda Kanelli, Sarjapur road, Bangalore-560 035. Karnataka. India. Tel: +91-80-30298772 Fax: 91-80-28440054 E-mail: [email protected] This report must not be reproduced, except in full, without prior written permission from Tarang lab.
Page 13 of 84
3.5.3 TEST SETUP DETAILS
3.5.3.1 RADIATED EMISSION TEST SETUP DETAILS
Figure 1: Test setup for Radiated Emission test
3.5.3.2 ANTENNA CONDUCTED MEASUREMENT TEST SETUP DETAILS
Figure 2: Test setup for Conducted measurements on the wireless ports
EUT Spectrum
Analyzer or Oscilloscope
Power supply
Keyboard
Turn Table
EUT
Antenna Mast
Antenna
Support room
Accessories (Power Supply, Keyboard, etc)
Control room
EMI Receiver 3m
Semi-Anechoic Chamber
Date 16th Mar 2011 FCC ID KMHSYNCG2-L Report Number GND1038AUT219-A IC ID 1422A-SYNCG2L
Tarang Wipro Technologies, SJP2, Survey#70,77,78/8A, Dodda Kanelli, Sarjapur road, Bangalore-560 035. Karnataka. India. Tel: +91-80-30298772 Fax: 91-80-28440054 E-mail: [email protected] This report must not be reproduced, except in full, without prior written permission from Tarang lab.
Page 14 of 84
4 INSTRUMENTATION AND CALIBRATION
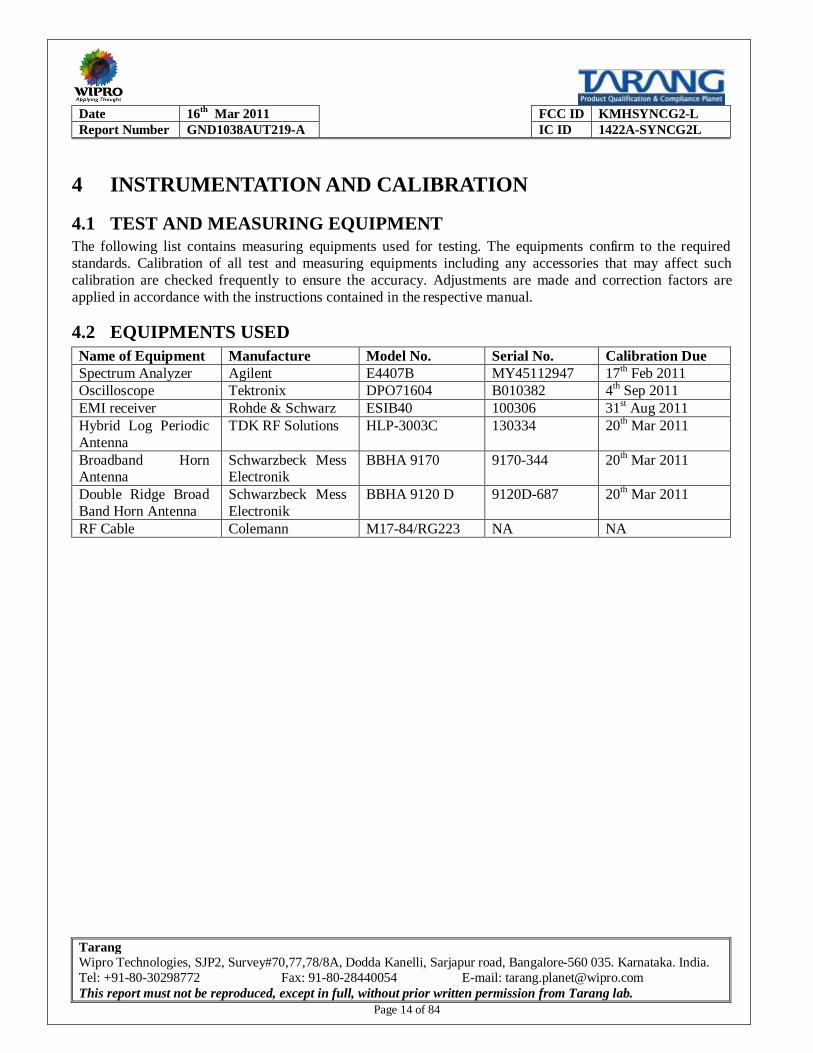
4.1 TEST AND MEASURING EQUIPMENT The following list contains measuring equipments used for testing. The equipments confirm to the required standards. Calibration of all test and measuring equipments including any accessories that may affect such calibration are checked frequently to ensure the accuracy. Adjustments are made and correction factors are applied in accordance with the instructions contained in the respective manual.
4.2 EQUIPMENTS USED Name of Equipment Manufacture Model No. Serial No. Calibration Due Spectrum Analyzer Agilent E4407B MY45112947 17th Feb 2011 Oscilloscope Tektronix DPO71604 B010382 4th Sep 2011 EMI receiver Rohde & Schwarz ESIB40 100306 31st Aug 2011 Hybrid Log Periodic Antenna
TDK RF Solutions HLP-3003C 130334 20th Mar 2011
Broadband Horn Antenna
Schwarzbeck Mess Electronik
BBHA 9170 9170-344 20th Mar 2011
Double Ridge Broad Band Horn Antenna
Schwarzbeck Mess Electronik
BBHA 9120 D 9120D-687 20th Mar 2011
RF Cable Colemann M17-84/RG223 NA NA
Date 16th Mar 2011 FCC ID KMHSYNCG2-L Report Number GND1038AUT219-A IC ID 1422A-SYNCG2L
Tarang Wipro Technologies, SJP2, Survey#70,77,78/8A, Dodda Kanelli, Sarjapur road, Bangalore-560 035. Karnataka. India. Tel: +91-80-30298772 Fax: 91-80-28440054 E-mail: [email protected] This report must not be reproduced, except in full, without prior written permission from Tarang lab.
Page 15 of 84
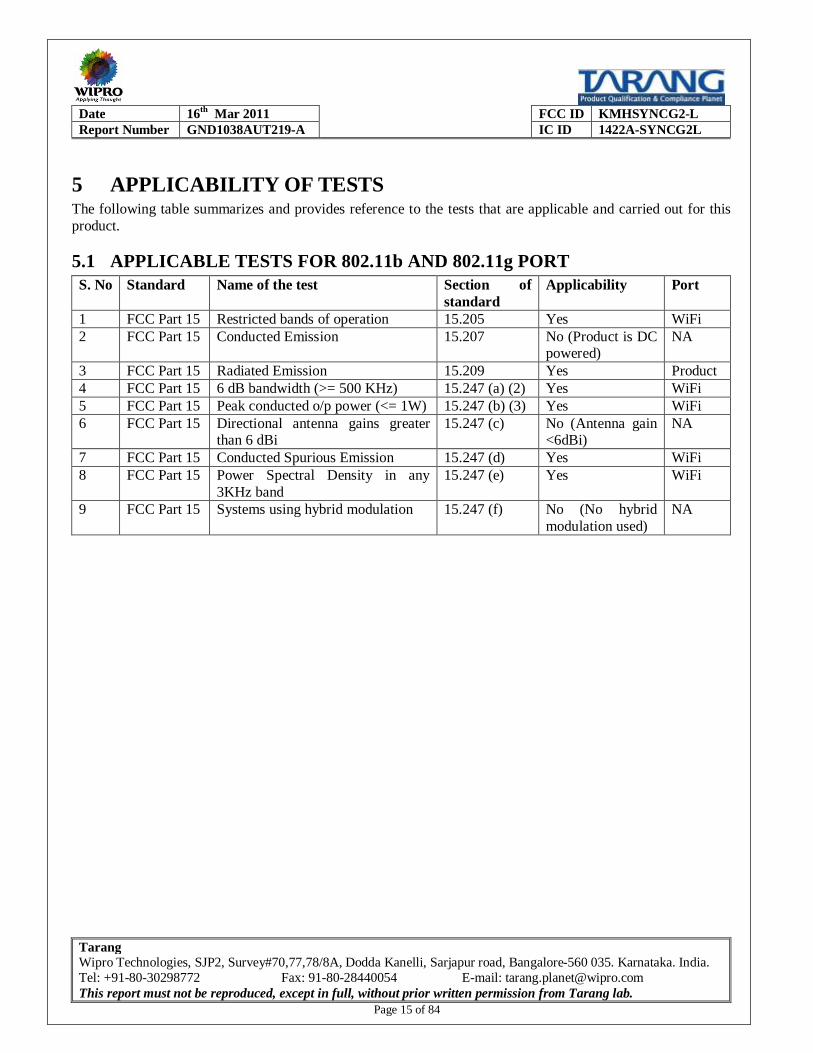
5 APPLICABILITY OF TESTS The following table summarizes and provides reference to the tests that are applicable and carried out for this product.
5.1 APPLICABLE TESTS FOR 802.11b AND 802.11g PORT S. No Standard Name of the test Section of
standard Applicability Port
1 FCC Part 15 Restricted bands of operation 15.205 Yes WiFi 2 FCC Part 15 Conducted Emission 15.207 No (Product is DC
powered) NA
3 FCC Part 15 Radiated Emission 15.209 Yes Product 4 FCC Part 15 6 dB bandwidth (>= 500 KHz) 15.247 (a) (2) Yes WiFi 5 FCC Part 15 Peak conducted o/p power (<= 1W) 15.247 (b) (3) Yes WiFi 6 FCC Part 15 Directional antenna gains greater
than 6 dBi 15.247 (c) No (Antenna gain
<6dBi) NA
7 FCC Part 15 Conducted Spurious Emission 15.247 (d) Yes WiFi 8 FCC Part 15 Power Spectral Density in any
3KHz band 15.247 (e) Yes WiFi
9 FCC Part 15 Systems using hybrid modulation 15.247 (f) No (No hybrid modulation used)
NA
Date 16th Mar 2011 FCC ID KMHSYNCG2-L Report Number GND1038AUT219-A IC ID 1422A-SYNCG2L
Tarang Wipro Technologies, SJP2, Survey#70,77,78/8A, Dodda Kanelli, Sarjapur road, Bangalore-560 035. Karnataka. India. Tel: +91-80-30298772 Fax: 91-80-28440054 E-mail: [email protected] This report must not be reproduced, except in full, without prior written permission from Tarang lab.
Page 16 of 84
6 TEST RESULTS FOR WI-FI PORT
6.1 WI-FI 801.11b MODE
6.1.1 RESTRICTED BAND OF OPERATION
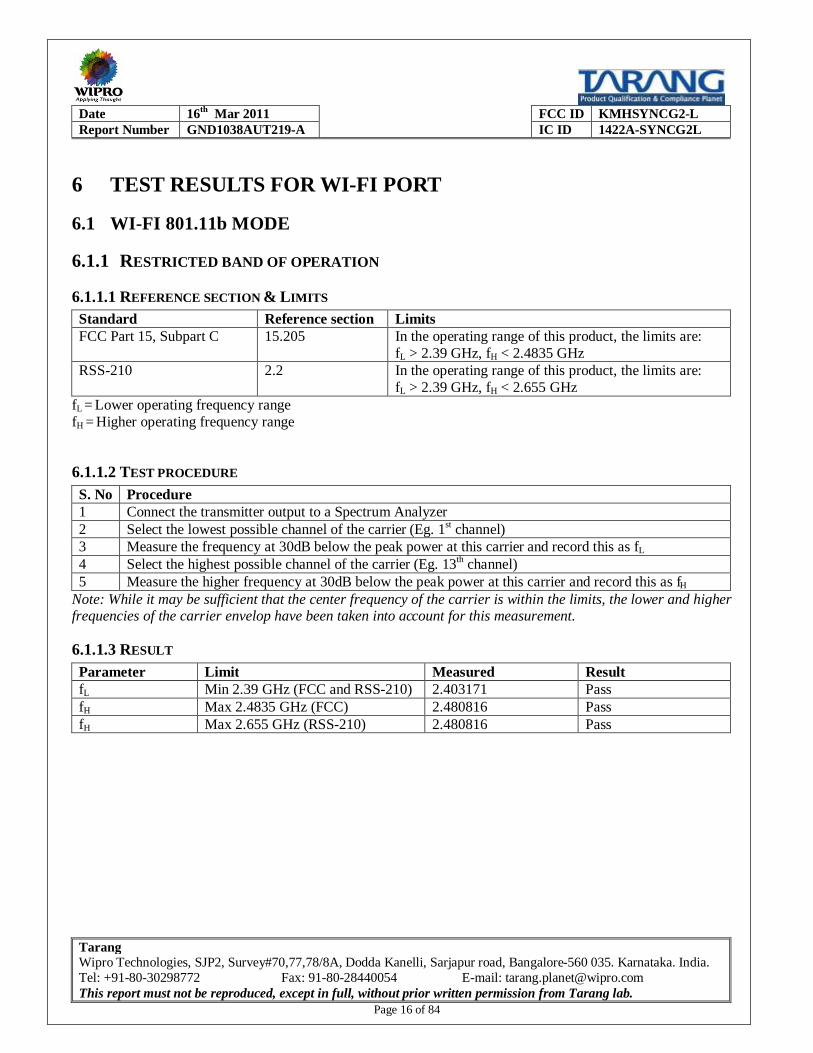
6.1.1.1 REFERENCE SECTION & LIMITS Standard Reference section Limits FCC Part 15, Subpart C 15.205 In the operating range of this product, the limits are:
fL > 2.39 GHz, fH < 2.4835 GHz RSS-210 2.2 In the operating range of this product, the limits are:
fL > 2.39 GHz, fH < 2.655 GHz fL = Lower operating frequency range fH = Higher operating frequency range
6.1.1.2 TEST PROCEDURE S. No Procedure 1 Connect the transmitter output to a Spectrum Analyzer 2 Select the lowest possible channel of the carrier (Eg. 1st channel) 3 Measure the frequency at 30dB below the peak power at this carrier and record this as fL 4 Select the highest possible channel of the carrier (Eg. 13th channel) 5 Measure the higher frequency at 30dB below the peak power at this carrier and record this as fH
Note: While it may be sufficient that the center frequency of the carrier is within the limits, the lower and higher frequencies of the carrier envelop have been taken into account for this measurement.
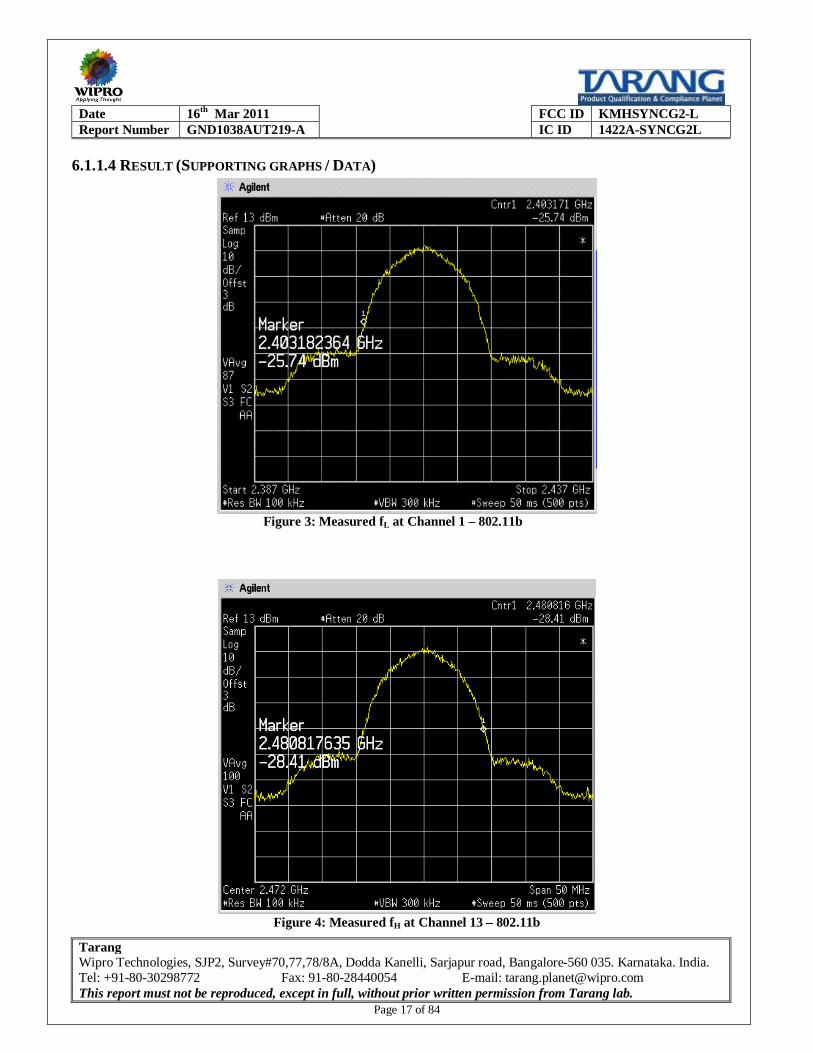
6.1.1.3 RESULT Parameter Limit Measured Result fL Min 2.39 GHz (FCC and RSS-210) 2.403171 Pass fH Max 2.4835 GHz (FCC) 2.480816 Pass fH Max 2.655 GHz (RSS-210) 2.480816 Pass
Date 16th Mar 2011 FCC ID KMHSYNCG2-L Report Number GND1038AUT219-A IC ID 1422A-SYNCG2L
Tarang Wipro Technologies, SJP2, Survey#70,77,78/8A, Dodda Kanelli, Sarjapur road, Bangalore-560 035. Karnataka. India. Tel: +91-80-30298772 Fax: 91-80-28440054 E-mail: [email protected] This report must not be reproduced, except in full, without prior written permission from Tarang lab.
Page 17 of 84
6.1.1.4 RESULT (SUPPORTING GRAPHS / DATA)
Figure 3: Measured fL at Channel 1 – 802.11b
Figure 4: Measured fH at Channel 13 – 802.11b

Date 16th Mar 2011 FCC ID KMHSYNCG2-L Report Number GND1038AUT219-A IC ID 1422A-SYNCG2L
Tarang Wipro Technologies, SJP2, Survey#70,77,78/8A, Dodda Kanelli, Sarjapur road, Bangalore-560 035. Karnataka. India. Tel: +91-80-30298772 Fax: 91-80-28440054 E-mail: [email protected] This report must not be reproduced, except in full, without prior written permission from Tarang lab.
Page 18 of 84
6.1.2 RADIATED EMISSION
6.1.2.1 REFERENCE SECTION & LIMITS Standard Reference section Frequency range Max Limit (dBµV/m) at 3 meter FCC Part 15, Subpart C
15.209 30 MHz to 88 MHz 88 MHz to 216 MHz 216 MHz to 960 MHz 960 MHz to 1 GHz Above 1 GHz
40.0 43.5 46.0 54.0 54.0
RSS-210 2.6 30 MHz to 88 MHz 88 MHz to 216 MHz 216 MHz to 960 MHz 960 MHz to 1 GHz Above 1 GHz
40.0 43.5 46.0 54.0 54.0
6.1.2.2 TEST PROCEDURE S. No Procedure 1 Test procedure is as per ANSI C63.4: 2000 2 EUT is placed on a 0.8m non-conductive table. This table is positioned on an automated turn table. 3 Antennas are positioned 3m away from the EUT 4 EUT is configured to function with the default channel in the selected band 5 A peak scan was carried out at various azimuth angles and antenna heights ranging from 1m to 4m. 6 The highest level of Radiated Emission was recorded 7 Quasi-peak measurements were carried out at the identified peaks for <1GHz and Average
measurements were carried out above 1GHz 8 These values are compared against the limit specified by the standard
6.1.2.3 RESULT Parameter Limit Measured Result Radiated Emission Refer 6.1.2.1 Refer 6.1.2.4 Pass

Date 16th Mar 2011 FCC ID KMHSYNCG2-L Report Number GND1038AUT219-A IC ID 1422A-SYNCG2L
Tarang Wipro Technologies, SJP2, Survey#70,77,78/8A, Dodda Kanelli, Sarjapur road, Bangalore-560 035. Karnataka. India. Tel: +91-80-30298772 Fax: 91-80-28440054 E-mail: [email protected] This report must not be reproduced, except in full, without prior written permission from Tarang lab.
Page 19 of 84
6.1.2.4 RESULT (SUPPORTING GRAPHS / DATA) – CHANNEL 1
Figure 5: Radiated emission results (Peak) – Horizontal polarization – 30 MHz to 1 GHz – 802.11b, Channel 1
Figure 6: Radiated emission results (Peak) – Vertical polarization – 30 MHz to 1 GHz – 802.11b, Channel 1

Date 16th Mar 2011 FCC ID KMHSYNCG2-L Report Number GND1038AUT219-A IC ID 1422A-SYNCG2L
Tarang Wipro Technologies, SJP2, Survey#70,77,78/8A, Dodda Kanelli, Sarjapur road, Bangalore-560 035. Karnataka. India. Tel: +91-80-30298772 Fax: 91-80-28440054 E-mail: [email protected] This report must not be reproduced, except in full, without prior written permission from Tarang lab.
Page 20 of 84
Figure 7: Radiated emission results – Quasi-peak table - 30 MHz to 1 GHz – 802.11b, Channel 1
Figure 8: Radiated emission results (Average) – Horizontal polarization – 1 GHz to 2 GHz – 802.11b, Channel 1
Figure 9: Radiated emission results (Average) – Horizontal polarization –2 GHz to 8GHz – 802.11b, Channel 1
Date 16th Mar 2011 FCC ID KMHSYNCG2-L Report Number GND1038AUT219-A IC ID 1422A-SYNCG2L
Tarang Wipro Technologies, SJP2, Survey#70,77,78/8A, Dodda Kanelli, Sarjapur road, Bangalore-560 035. Karnataka. India. Tel: +91-80-30298772 Fax: 91-80-28440054 E-mail: [email protected] This report must not be reproduced, except in full, without prior written permission from Tarang lab.
Page 21 of 84
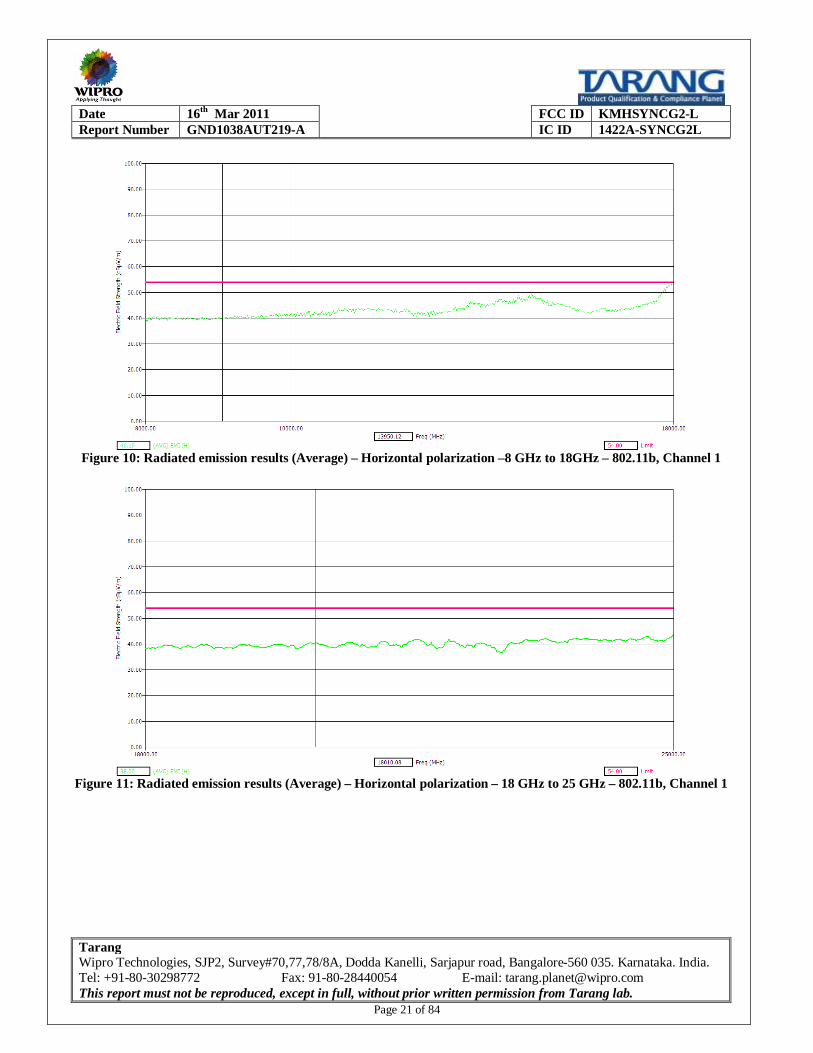
Figure 10: Radiated emission results (Average) – Horizontal polarization –8 GHz to 18GHz – 802.11b, Channel 1
Figure 11: Radiated emission results (Average) – Horizontal polarization – 18 GHz to 25 GHz – 802.11b, Channel 1

Date 16th Mar 2011 FCC ID KMHSYNCG2-L Report Number GND1038AUT219-A IC ID 1422A-SYNCG2L
Tarang Wipro Technologies, SJP2, Survey#70,77,78/8A, Dodda Kanelli, Sarjapur road, Bangalore-560 035. Karnataka. India. Tel: +91-80-30298772 Fax: 91-80-28440054 E-mail: [email protected] This report must not be reproduced, except in full, without prior written permission from Tarang lab.
Page 22 of 84
Figure 12: Radiated emission results (Average) – Vertical polarization – 1 GHz to 2 GHz – 802.11b, Channel 1
Figure 13: Radiated emission results (Average) – Vertical polarization –2 GHz to 8 GHz – 802.11b, Channel 1
Date 16th Mar 2011 FCC ID KMHSYNCG2-L Report Number GND1038AUT219-A IC ID 1422A-SYNCG2L
Tarang Wipro Technologies, SJP2, Survey#70,77,78/8A, Dodda Kanelli, Sarjapur road, Bangalore-560 035. Karnataka. India. Tel: +91-80-30298772 Fax: 91-80-28440054 E-mail: [email protected] This report must not be reproduced, except in full, without prior written permission from Tarang lab.
Page 23 of 84
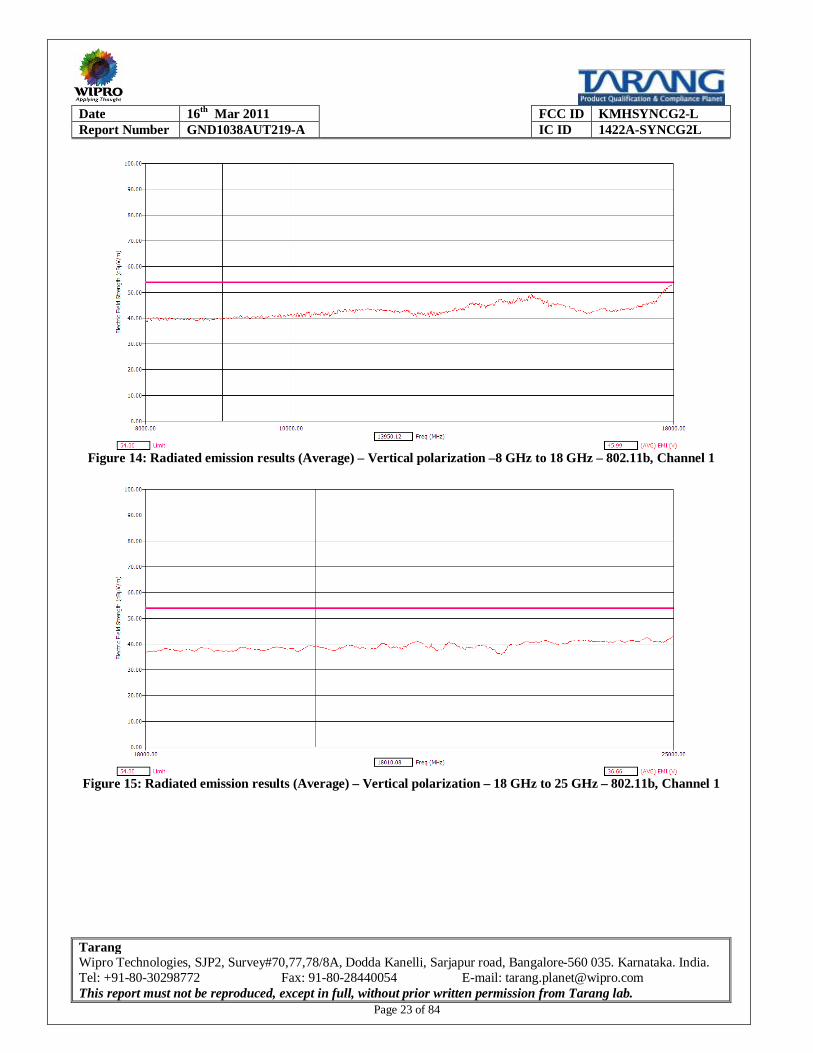
Figure 14: Radiated emission results (Average) – Vertical polarization –8 GHz to 18 GHz – 802.11b, Channel 1
Figure 15: Radiated emission results (Average) – Vertical polarization – 18 GHz to 25 GHz – 802.11b, Channel 1
Date 16th Mar 2011 FCC ID KMHSYNCG2-L Report Number GND1038AUT219-A IC ID 1422A-SYNCG2L
Tarang Wipro Technologies, SJP2, Survey#70,77,78/8A, Dodda Kanelli, Sarjapur road, Bangalore-560 035. Karnataka. India. Tel: +91-80-30298772 Fax: 91-80-28440054 E-mail: [email protected] This report must not be reproduced, except in full, without prior written permission from Tarang lab.
Page 24 of 84
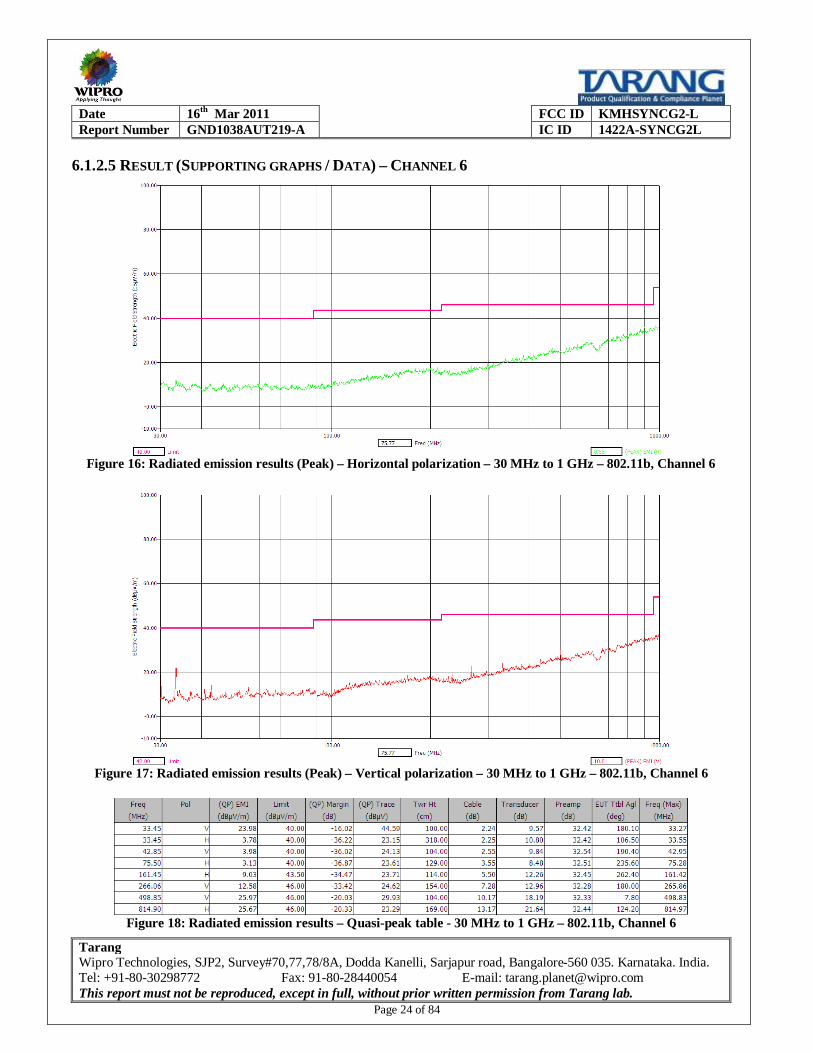
6.1.2.5 RESULT (SUPPORTING GRAPHS / DATA) – CHANNEL 6
Figure 16: Radiated emission results (Peak) – Horizontal polarization – 30 MHz to 1 GHz – 802.11b, Channel 6
Figure 17: Radiated emission results (Peak) – Vertical polarization – 30 MHz to 1 GHz – 802.11b, Channel 6
Figure 18: Radiated emission results – Quasi-peak table - 30 MHz to 1 GHz – 802.11b, Channel 6
Date 16th Mar 2011 FCC ID KMHSYNCG2-L Report Number GND1038AUT219-A IC ID 1422A-SYNCG2L
Tarang Wipro Technologies, SJP2, Survey#70,77,78/8A, Dodda Kanelli, Sarjapur road, Bangalore-560 035. Karnataka. India. Tel: +91-80-30298772 Fax: 91-80-28440054 E-mail: [email protected] This report must not be reproduced, except in full, without prior written permission from Tarang lab.
Page 25 of 84
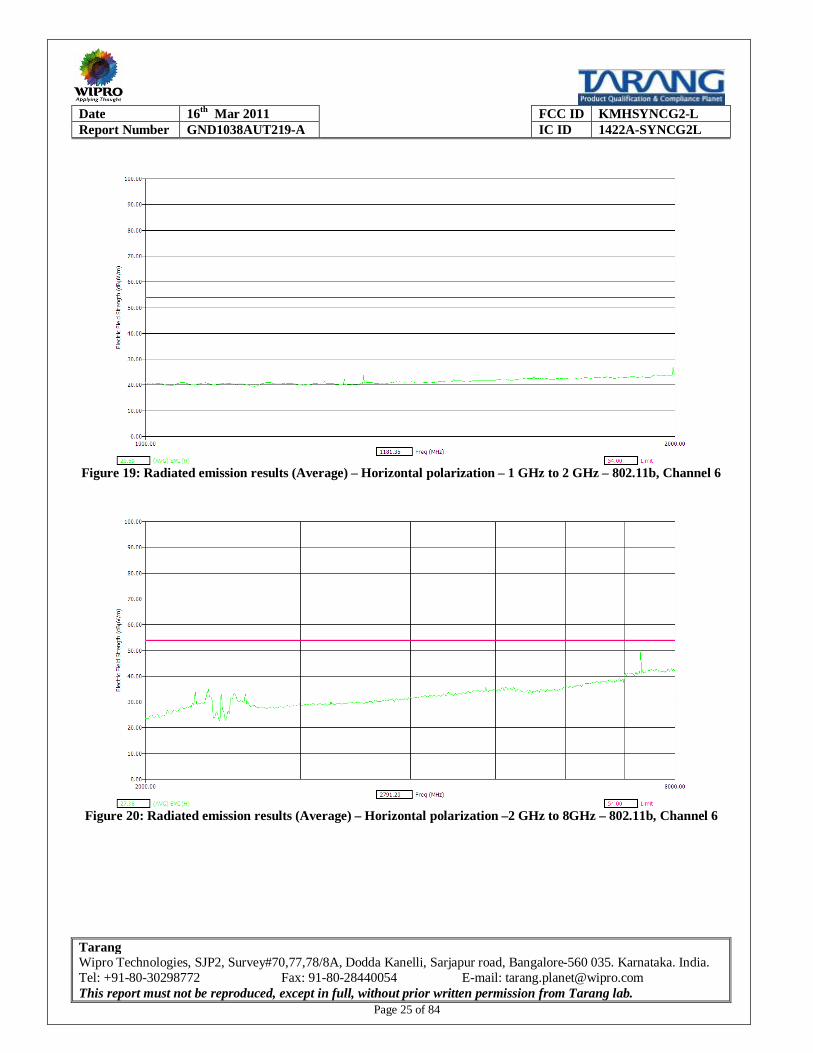
Figure 19: Radiated emission results (Average) – Horizontal polarization – 1 GHz to 2 GHz – 802.11b, Channel 6
Figure 20: Radiated emission results (Average) – Horizontal polarization –2 GHz to 8GHz – 802.11b, Channel 6
Date 16th Mar 2011 FCC ID KMHSYNCG2-L Report Number GND1038AUT219-A IC ID 1422A-SYNCG2L
Tarang Wipro Technologies, SJP2, Survey#70,77,78/8A, Dodda Kanelli, Sarjapur road, Bangalore-560 035. Karnataka. India. Tel: +91-80-30298772 Fax: 91-80-28440054 E-mail: [email protected] This report must not be reproduced, except in full, without prior written permission from Tarang lab.
Page 26 of 84
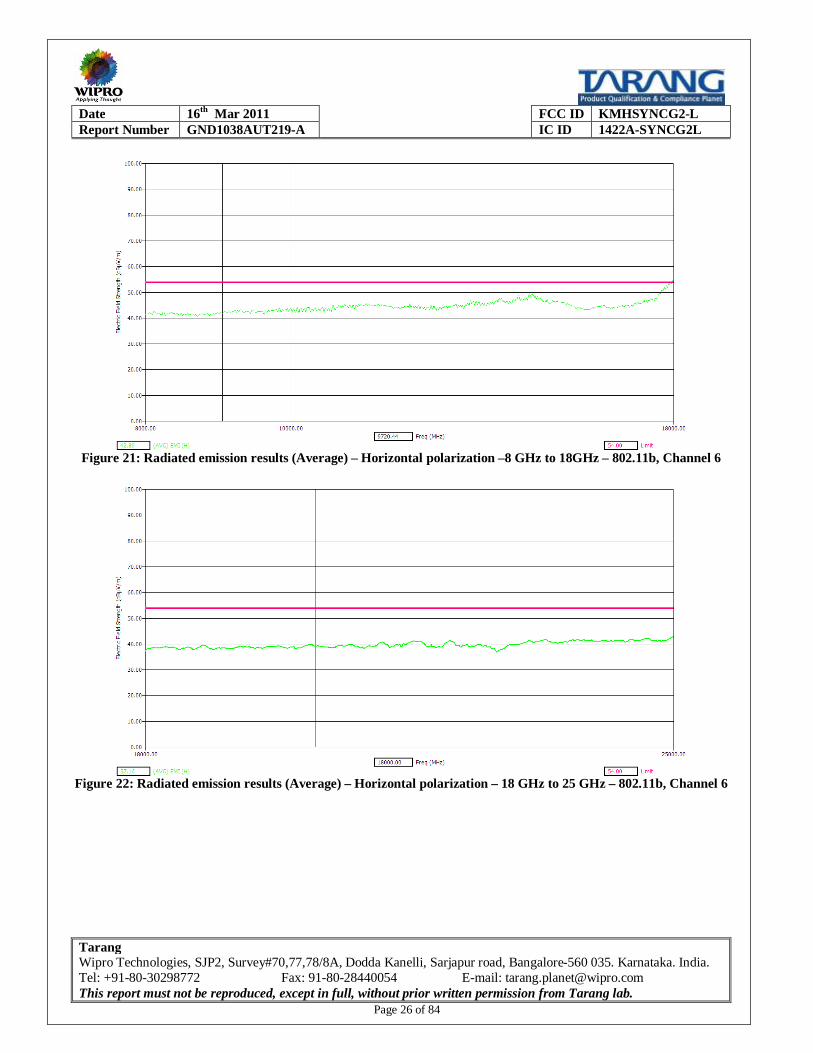
Figure 21: Radiated emission results (Average) – Horizontal polarization –8 GHz to 18GHz – 802.11b, Channel 6
Figure 22: Radiated emission results (Average) – Horizontal polarization – 18 GHz to 25 GHz – 802.11b, Channel 6
Date 16th Mar 2011 FCC ID KMHSYNCG2-L Report Number GND1038AUT219-A IC ID 1422A-SYNCG2L
Tarang Wipro Technologies, SJP2, Survey#70,77,78/8A, Dodda Kanelli, Sarjapur road, Bangalore-560 035. Karnataka. India. Tel: +91-80-30298772 Fax: 91-80-28440054 E-mail: [email protected] This report must not be reproduced, except in full, without prior written permission from Tarang lab.
Page 27 of 84
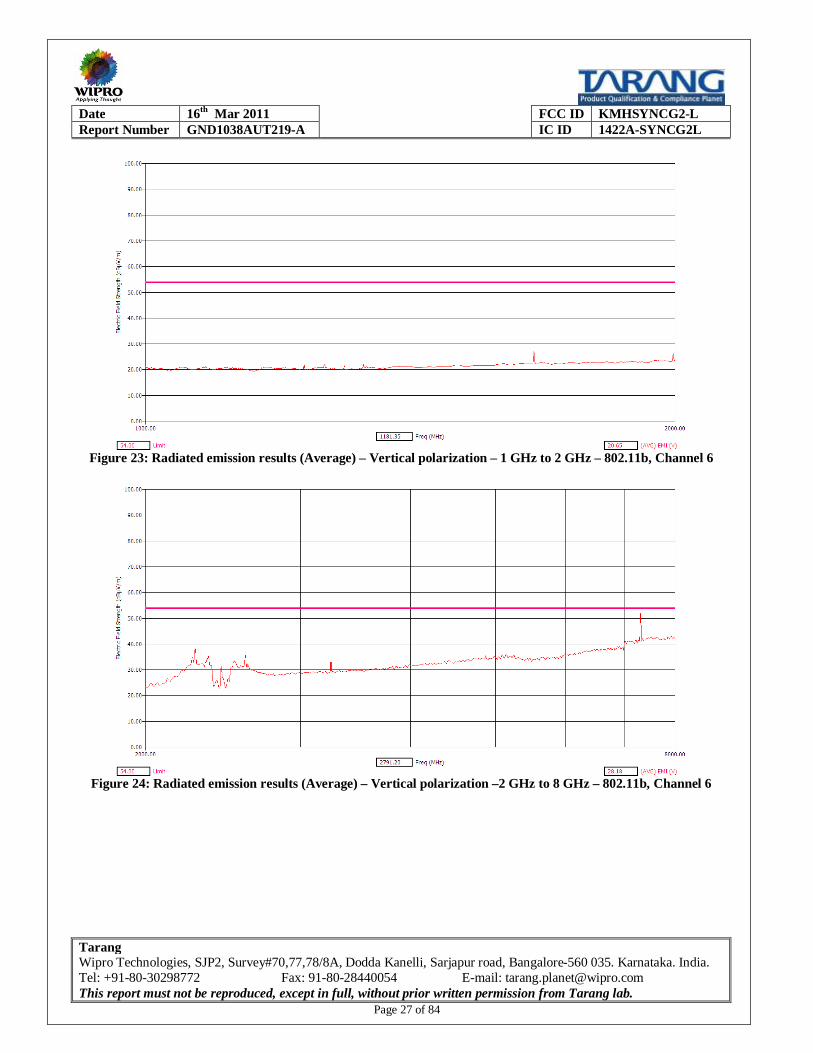
Figure 23: Radiated emission results (Average) – Vertical polarization – 1 GHz to 2 GHz – 802.11b, Channel 6
Figure 24: Radiated emission results (Average) – Vertical polarization –2 GHz to 8 GHz – 802.11b, Channel 6

Date 16th Mar 2011 FCC ID KMHSYNCG2-L Report Number GND1038AUT219-A IC ID 1422A-SYNCG2L
Tarang Wipro Technologies, SJP2, Survey#70,77,78/8A, Dodda Kanelli, Sarjapur road, Bangalore-560 035. Karnataka. India. Tel: +91-80-30298772 Fax: 91-80-28440054 E-mail: [email protected] This report must not be reproduced, except in full, without prior written permission from Tarang lab.
Page 28 of 84
Figure 25: Radiated emission results (Average) – Vertical polarization –8 GHz to 18 GHz – 802.11b, Channel 6
Figure 26: Radiated emission results (Average) – Vertical polarization – 18 GHz to 25 GHz – 802.11b, Channel 6
Date 16th Mar 2011 FCC ID KMHSYNCG2-L Report Number GND1038AUT219-A IC ID 1422A-SYNCG2L
Tarang Wipro Technologies, SJP2, Survey#70,77,78/8A, Dodda Kanelli, Sarjapur road, Bangalore-560 035. Karnataka. India. Tel: +91-80-30298772 Fax: 91-80-28440054 E-mail: [email protected] This report must not be reproduced, except in full, without prior written permission from Tarang lab.
Page 29 of 84
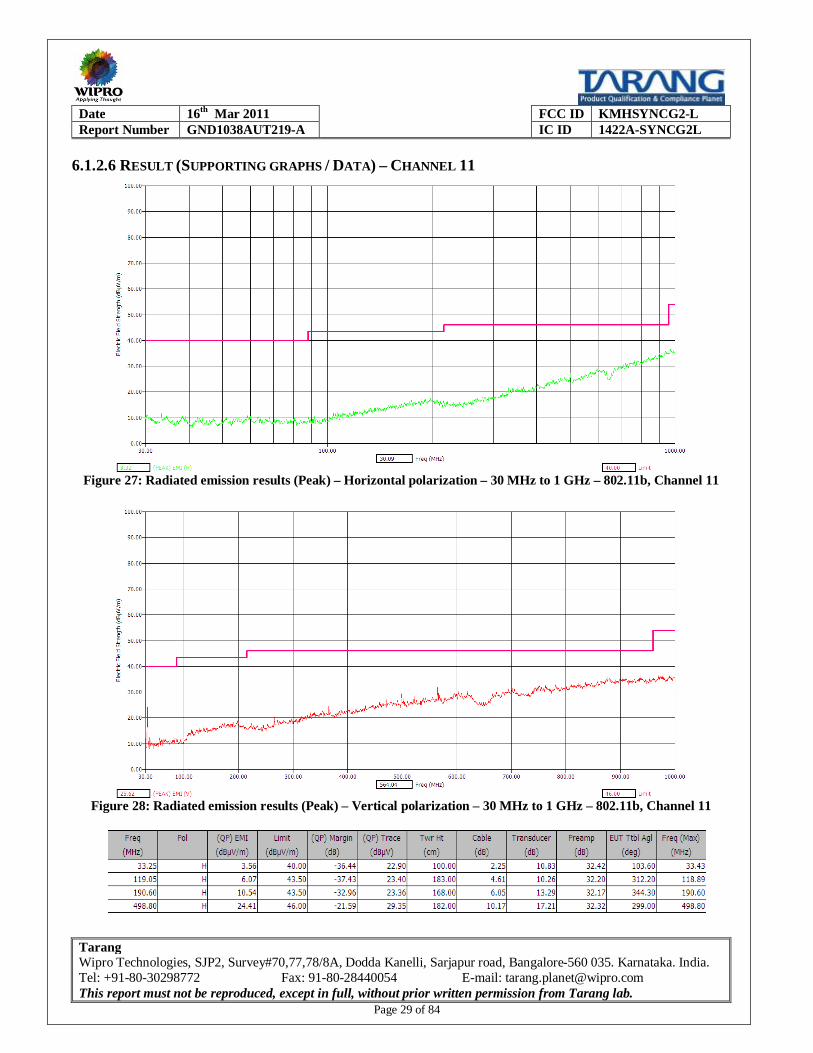
6.1.2.6 RESULT (SUPPORTING GRAPHS / DATA) – CHANNEL 11
Figure 27: Radiated emission results (Peak) – Horizontal polarization – 30 MHz to 1 GHz – 802.11b, Channel 11
Figure 28: Radiated emission results (Peak) – Vertical polarization – 30 MHz to 1 GHz – 802.11b, Channel 11

Date 16th Mar 2011 FCC ID KMHSYNCG2-L Report Number GND1038AUT219-A IC ID 1422A-SYNCG2L
Tarang Wipro Technologies, SJP2, Survey#70,77,78/8A, Dodda Kanelli, Sarjapur road, Bangalore-560 035. Karnataka. India. Tel: +91-80-30298772 Fax: 91-80-28440054 E-mail: [email protected] This report must not be reproduced, except in full, without prior written permission from Tarang lab.
Page 30 of 84
Figure 29: Radiated emission results – Quasi-peak table - 30 MHz to 1 GHz – 802.11b, Channel 11
Figure 30: Radiated emission results (Average) – Horizontal polarization – 1 GHz to 2 GHz – 802.11b, Channel 11
Figure 31: Radiated emission results (Average) – Horizontal polarization –2 GHz to 8GHz – 802.11b, Channel 11
Date 16th Mar 2011 FCC ID KMHSYNCG2-L Report Number GND1038AUT219-A IC ID 1422A-SYNCG2L
Tarang Wipro Technologies, SJP2, Survey#70,77,78/8A, Dodda Kanelli, Sarjapur road, Bangalore-560 035. Karnataka. India. Tel: +91-80-30298772 Fax: 91-80-28440054 E-mail: [email protected] This report must not be reproduced, except in full, without prior written permission from Tarang lab.
Page 31 of 84
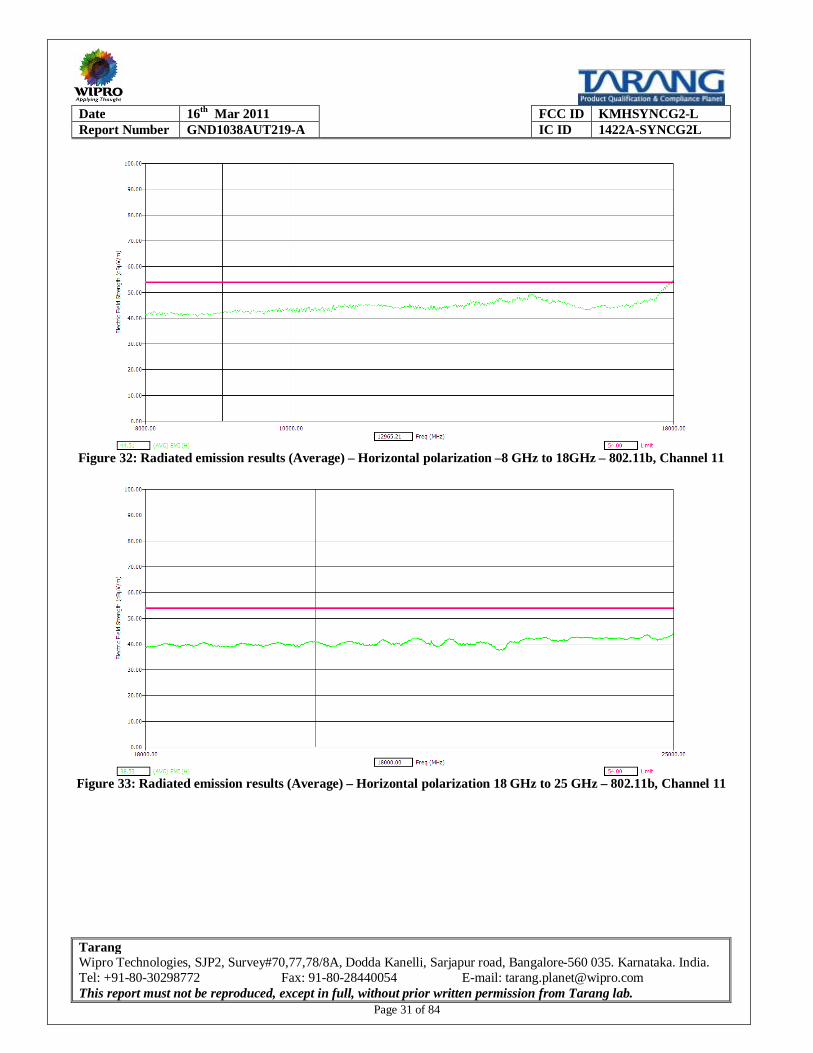
Figure 32: Radiated emission results (Average) – Horizontal polarization –8 GHz to 18GHz – 802.11b, Channel 11
Figure 33: Radiated emission results (Average) – Horizontal polarization 18 GHz to 25 GHz – 802.11b, Channel 11

Date 16th Mar 2011 FCC ID KMHSYNCG2-L Report Number GND1038AUT219-A IC ID 1422A-SYNCG2L
Tarang Wipro Technologies, SJP2, Survey#70,77,78/8A, Dodda Kanelli, Sarjapur road, Bangalore-560 035. Karnataka. India. Tel: +91-80-30298772 Fax: 91-80-28440054 E-mail: [email protected] This report must not be reproduced, except in full, without prior written permission from Tarang lab.
Page 32 of 84
Figure 34: Radiated emission results (Average) – Vertical polarization – 1 GHz to 2 GHz – 802.11b, Channel 11
Figure 35: Radiated emission results (Average) – Vertical polarization –2 GHz to 8 GHz – 802.11b, Channel 11

Date 16th Mar 2011 FCC ID KMHSYNCG2-L Report Number GND1038AUT219-A IC ID 1422A-SYNCG2L
Tarang Wipro Technologies, SJP2, Survey#70,77,78/8A, Dodda Kanelli, Sarjapur road, Bangalore-560 035. Karnataka. India. Tel: +91-80-30298772 Fax: 91-80-28440054 E-mail: [email protected] This report must not be reproduced, except in full, without prior written permission from Tarang lab.
Page 33 of 84
Figure 36: Radiated emission results (Average) – Vertical polarization –8 GHz to 18 GHz – 802.11b, Channel 11
Figure 37: Radiated emission results (Average) – Vertical polarization – 18 GHz to 25 GHz – 802.11b, Channel 11

Date 16th Mar 2011 FCC ID KMHSYNCG2-L Report Number GND1038AUT219-A IC ID 1422A-SYNCG2L
Tarang Wipro Technologies, SJP2, Survey#70,77,78/8A, Dodda Kanelli, Sarjapur road, Bangalore-560 035. Karnataka. India. Tel: +91-80-30298772 Fax: 91-80-28440054 E-mail: [email protected] This report must not be reproduced, except in full, without prior written permission from Tarang lab.
Page 34 of 84
6.1.3 6dB BANDWIDTH
6.1.3.1 REFERENCE SECTION & LIMITS Standard Reference section Limit FCC Part 15, Subpart C 15.247 (a) (2) The 6dB bandwidth > 500 KHz RSS-210 A8.2 The 6dB bandwidth > 500 KHz
6.1.3.2 TEST PROCEDURE S. No Procedure 1 This test was carried out for Low(1), Mid(6) and High(11) channels of the 802.11b band 2 Connect the transmitter output to a Spectrum Analyzer. Select an appropriate channel on the EUT. 3 Detect the carrier envelop in the Spectrum Analyzer 4 The 6dB bandwidth below the peak power was calculated on the envelop 5 This measured bandwidth is compared against the limit and the result declared
6.1.3.3 RESULT Band, Channel Frequency (GHz) Limit Measured Result 802.11b, 1 (Low) 2.412 500 KHz or more 8 MHz PASS 802.11b, 6 (Mid) 2.437 500 KHz or more 9 MHz PASS 802.11b, 11 (High) 2.462 500 KHz or more 9.875 MHz PASS

Date 16th Mar 2011 FCC ID KMHSYNCG2-L Report Number GND1038AUT219-A IC ID 1422A-SYNCG2L
Tarang Wipro Technologies, SJP2, Survey#70,77,78/8A, Dodda Kanelli, Sarjapur road, Bangalore-560 035. Karnataka. India. Tel: +91-80-30298772 Fax: 91-80-28440054 E-mail: [email protected] This report must not be reproduced, except in full, without prior written permission from Tarang lab.
Page 35 of 84
6.1.3.4 RESULT (SUPPORTING GRAPHS / DATA)
Figure 38: 6dB bandwidth – 802.11b, Low channel (1)
Figure 39: 6dB bandwidth – 802.11b, Mid channel (6)

Date 16th Mar 2011 FCC ID KMHSYNCG2-L Report Number GND1038AUT219-A IC ID 1422A-SYNCG2L
Tarang Wipro Technologies, SJP2, Survey#70,77,78/8A, Dodda Kanelli, Sarjapur road, Bangalore-560 035. Karnataka. India. Tel: +91-80-30298772 Fax: 91-80-28440054 E-mail: [email protected] This report must not be reproduced, except in full, without prior written permission from Tarang lab.
Page 36 of 84
Figure 40: 6dB bandwidth – 802.11b, High channel (11)
6.1.4 PEAK CONDUCTED OUTPUT POWER
6.1.4.1 REFERENCE SECTION & LIMITS Standard Reference section Limit FCC Part 15, Subpart C 15.247 (b) (3) Peak conducted output power < 1 Watt RSS-210 A8.4 (2) Peak conducted output power < 1 Watt
6.1.4.2 TEST PROCEDURE S. No Procedure 1 This test was carried out for Low(1), Mid(6) and High(11) channels of the 802.11b band 2 Connect the transmitter output to a Spectrum Analyzer. Select an appropriate channel on the EUT. 3 Appropriate Digital Transmission System test procedure is followed as per FCC recommendation. In
this case, Option 2, Method 3 was selected based on the bandwidth of the carrier. 4 Add the measured cable loss of the cable that was used for the measurement (1.8dB) 5 This measured value is compared against the limit and the result declared
Date 16th Mar 2011 FCC ID KMHSYNCG2-L Report Number GND1038AUT219-A IC ID 1422A-SYNCG2L
Tarang Wipro Technologies, SJP2, Survey#70,77,78/8A, Dodda Kanelli, Sarjapur road, Bangalore-560 035. Karnataka. India. Tel: +91-80-30298772 Fax: 91-80-28440054 E-mail: [email protected] This report must not be reproduced, except in full, without prior written permission from Tarang lab.
Page 37 of 84
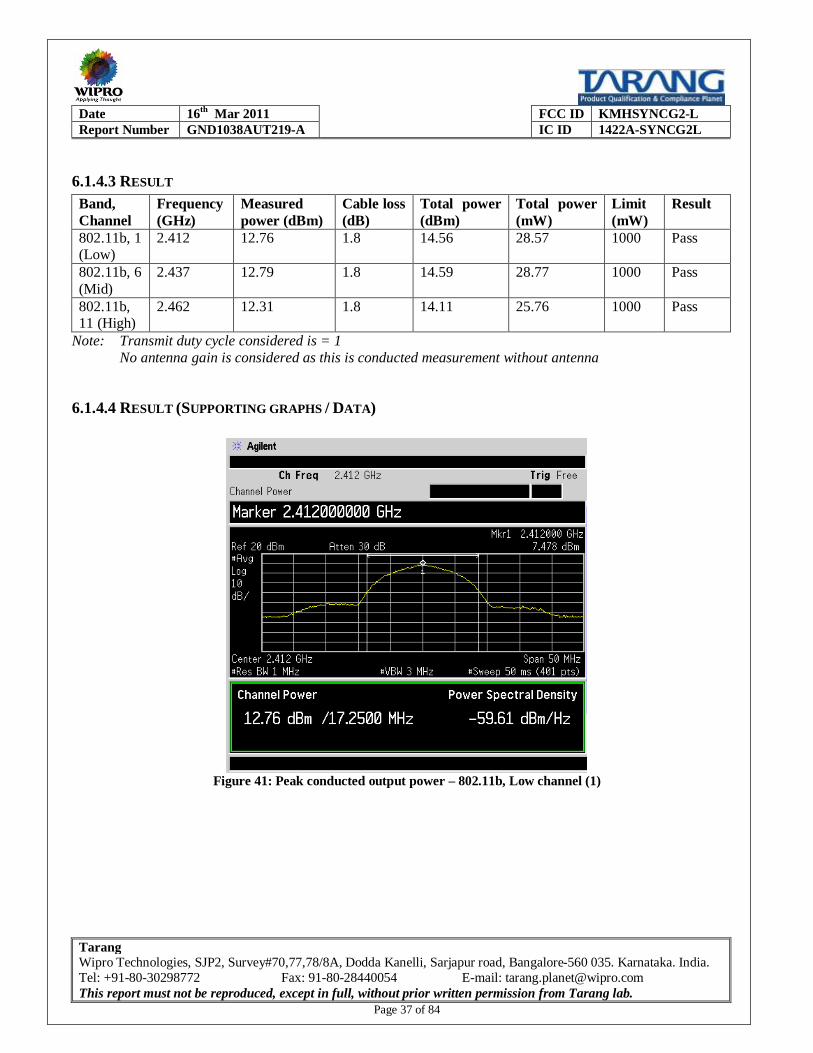
6.1.4.3 RESULT Band, Channel
Frequency (GHz)
Measured power (dBm)
Cable loss (dB)
Total power (dBm)
Total power (mW)
Limit (mW)
Result
802.11b, 1 (Low)
2.412 12.76 1.8 14.56 28.57 1000 Pass
802.11b, 6 (Mid)
2.437 12.79 1.8 14.59 28.77 1000 Pass
802.11b, 11 (High)
2.462 12.31 1.8 14.11 25.76 1000 Pass
Note: Transmit duty cycle considered is = 1 No antenna gain is considered as this is conducted measurement without antenna
6.1.4.4 RESULT (SUPPORTING GRAPHS / DATA)
Figure 41: Peak conducted output power – 802.11b, Low channel (1)

Date 16th Mar 2011 FCC ID KMHSYNCG2-L Report Number GND1038AUT219-A IC ID 1422A-SYNCG2L
Tarang Wipro Technologies, SJP2, Survey#70,77,78/8A, Dodda Kanelli, Sarjapur road, Bangalore-560 035. Karnataka. India. Tel: +91-80-30298772 Fax: 91-80-28440054 E-mail: [email protected] This report must not be reproduced, except in full, without prior written permission from Tarang lab.
Page 38 of 84
Figure 42: Peak conducted output power – 802.11b, Mid channel (6)
Figure 43: Peak conducted output power – 802.11b, High channel (11)

Date 16th Mar 2011 FCC ID KMHSYNCG2-L Report Number GND1038AUT219-A IC ID 1422A-SYNCG2L
Tarang Wipro Technologies, SJP2, Survey#70,77,78/8A, Dodda Kanelli, Sarjapur road, Bangalore-560 035. Karnataka. India. Tel: +91-80-30298772 Fax: 91-80-28440054 E-mail: [email protected] This report must not be reproduced, except in full, without prior written permission from Tarang lab.
Page 39 of 84
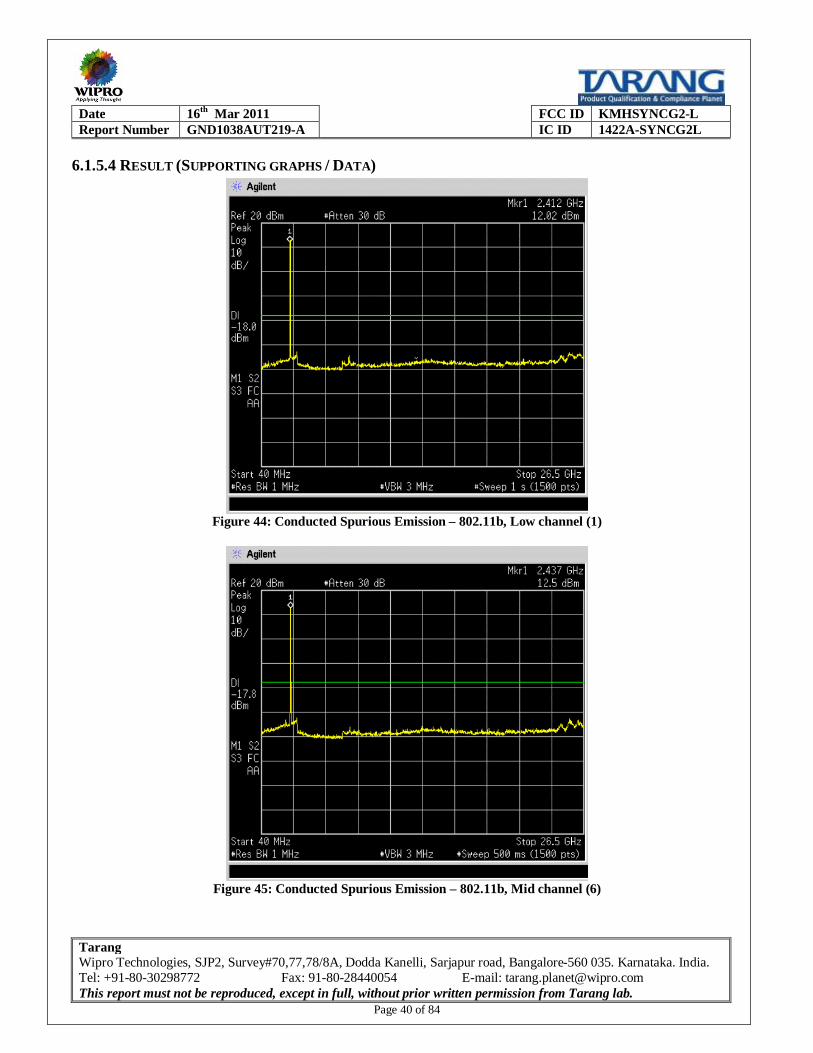
6.1.5 CONDUCTED SPURIOUS EMISSION
6.1.5.1 REFERENCE SECTION & LIMITS Standard Reference section Limit FCC Part 15, Subpart C 15.247 (d) In any 100KHz band outside the intentional band,
emissions shall be 30dB below the peak power RSS-210 A8.5 In any 100KHz band outside the intentional band,
emissions shall be 30dB below the peak power
6.1.5.2 TEST PROCEDURE S. No Procedure 1 This test was carried out for Low(1), Mid(6) and High(11) channels of the 802.11b band 2 Connect the transmitter output to a Spectrum Analyzer. Select an appropriate channel on the EUT. 3 Set the start frequency on the Spectrum Analyzer as 40 MHz 4 Set the start frequency on the Spectrum Analyzer as 26.5 GHz 5 Examine the complete band for any spurious emissions that exceed the value that is 30dB below the
peak power in the intentional band 6 Based on the measured spurious emissions outside the intentional band, the result is declared
6.1.5.3 RESULT Band, Channel Limit Measured Result 802.11b, 1 (Low) 30db below the peak power
measured Refer 6.1.5.4 Pass
802.11b, 6 (Mid) 802.11b, 11 (High)
Date 16th Mar 2011 FCC ID KMHSYNCG2-L Report Number GND1038AUT219-A IC ID 1422A-SYNCG2L
Tarang Wipro Technologies, SJP2, Survey#70,77,78/8A, Dodda Kanelli, Sarjapur road, Bangalore-560 035. Karnataka. India. Tel: +91-80-30298772 Fax: 91-80-28440054 E-mail: [email protected] This report must not be reproduced, except in full, without prior written permission from Tarang lab.
Page 40 of 84
6.1.5.4 RESULT (SUPPORTING GRAPHS / DATA)
Figure 44: Conducted Spurious Emission – 802.11b, Low channel (1)
Figure 45: Conducted Spurious Emission – 802.11b, Mid channel (6)
Date 16th Mar 2011 FCC ID KMHSYNCG2-L Report Number GND1038AUT219-A IC ID 1422A-SYNCG2L
Tarang Wipro Technologies, SJP2, Survey#70,77,78/8A, Dodda Kanelli, Sarjapur road, Bangalore-560 035. Karnataka. India. Tel: +91-80-30298772 Fax: 91-80-28440054 E-mail: [email protected] This report must not be reproduced, except in full, without prior written permission from Tarang lab.
Page 41 of 84
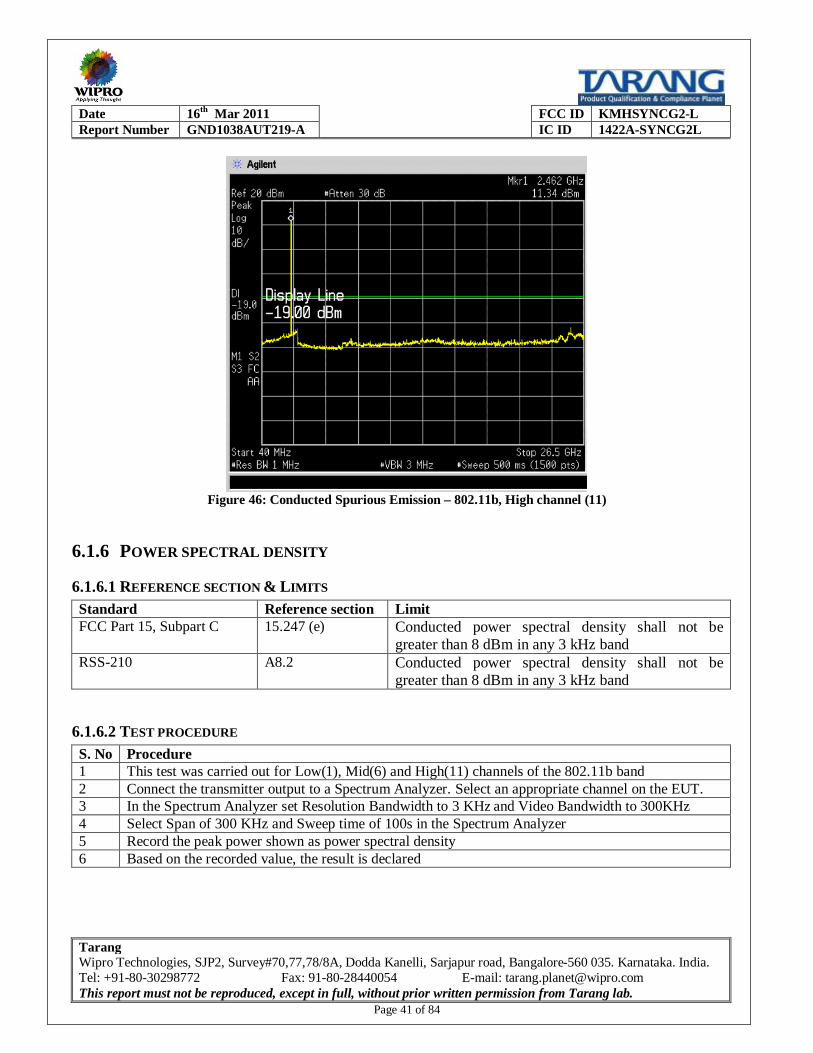
Figure 46: Conducted Spurious Emission – 802.11b, High channel (11)
6.1.6 POWER SPECTRAL DENSITY
6.1.6.1 REFERENCE SECTION & LIMITS Standard Reference section Limit FCC Part 15, Subpart C 15.247 (e) Conducted power spectral density shall not be
greater than 8 dBm in any 3 kHz band RSS-210 A8.2 Conducted power spectral density shall not be
greater than 8 dBm in any 3 kHz band
6.1.6.2 TEST PROCEDURE S. No Procedure 1 This test was carried out for Low(1), Mid(6) and High(11) channels of the 802.11b band 2 Connect the transmitter output to a Spectrum Analyzer. Select an appropriate channel on the EUT. 3 In the Spectrum Analyzer set Resolution Bandwidth to 3 KHz and Video Bandwidth to 300KHz 4 Select Span of 300 KHz and Sweep time of 100s in the Spectrum Analyzer 5 Record the peak power shown as power spectral density 6 Based on the recorded value, the result is declared
Date 16th Mar 2011 FCC ID KMHSYNCG2-L Report Number GND1038AUT219-A IC ID 1422A-SYNCG2L
Tarang Wipro Technologies, SJP2, Survey#70,77,78/8A, Dodda Kanelli, Sarjapur road, Bangalore-560 035. Karnataka. India. Tel: +91-80-30298772 Fax: 91-80-28440054 E-mail: [email protected] This report must not be reproduced, except in full, without prior written permission from Tarang lab.
Page 42 of 84
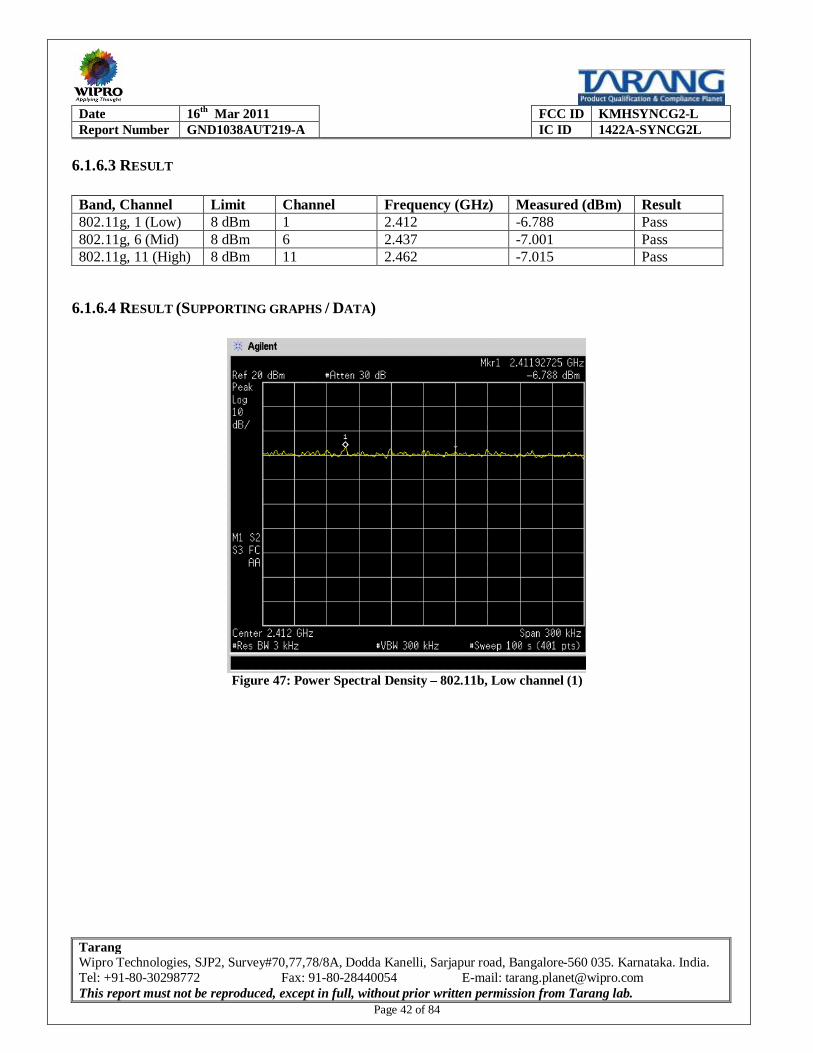
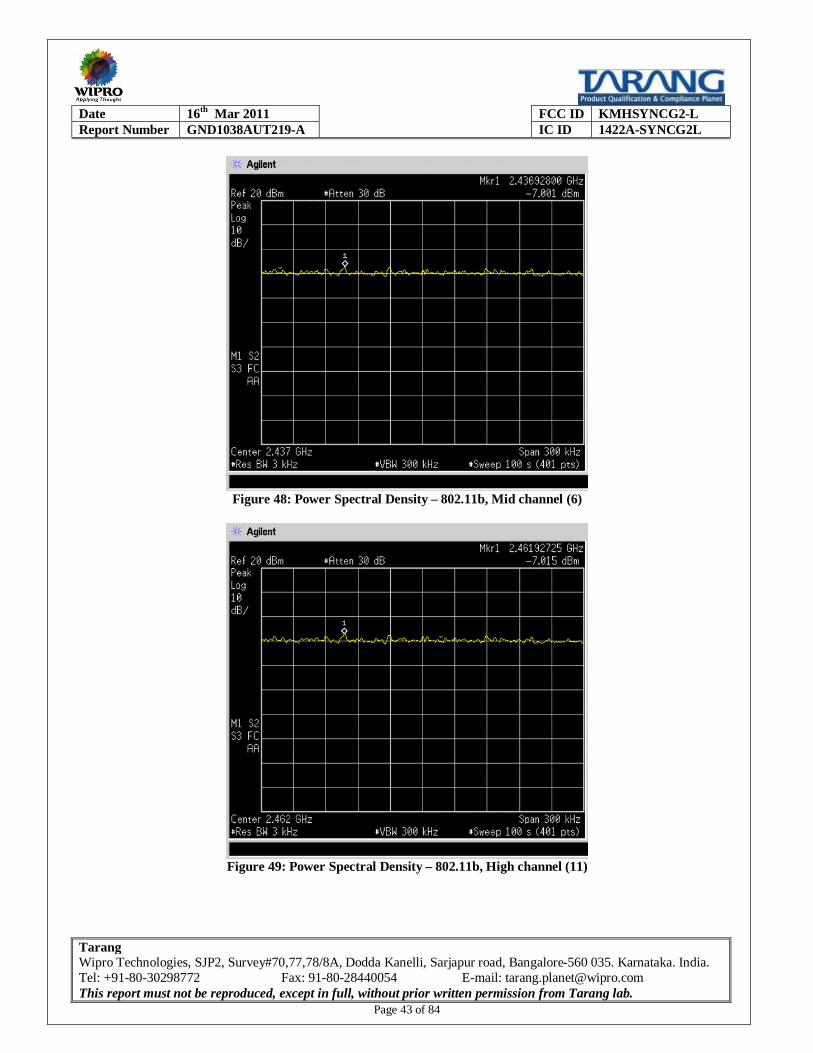
6.1.6.3 RESULT Band, Channel Limit Channel Frequency (GHz) Measured (dBm) Result 802.11g, 1 (Low) 8 dBm 1 2.412 -6.788 Pass 802.11g, 6 (Mid) 8 dBm 6 2.437 -7.001 Pass 802.11g, 11 (High) 8 dBm 11 2.462 -7.015 Pass
6.1.6.4 RESULT (SUPPORTING GRAPHS / DATA)
Figure 47: Power Spectral Density – 802.11b, Low channel (1)
Date 16th Mar 2011 FCC ID KMHSYNCG2-L Report Number GND1038AUT219-A IC ID 1422A-SYNCG2L
Tarang Wipro Technologies, SJP2, Survey#70,77,78/8A, Dodda Kanelli, Sarjapur road, Bangalore-560 035. Karnataka. India. Tel: +91-80-30298772 Fax: 91-80-28440054 E-mail: [email protected] This report must not be reproduced, except in full, without prior written permission from Tarang lab.
Page 43 of 84
Figure 48: Power Spectral Density – 802.11b, Mid channel (6)
Figure 49: Power Spectral Density – 802.11b, High channel (11)

Date 16th Mar 2011 FCC ID KMHSYNCG2-L Report Number GND1038AUT219-A IC ID 1422A-SYNCG2L
Tarang Wipro Technologies, SJP2, Survey#70,77,78/8A, Dodda Kanelli, Sarjapur road, Bangalore-560 035. Karnataka. India. Tel: +91-80-30298772 Fax: 91-80-28440054 E-mail: [email protected] This report must not be reproduced, except in full, without prior written permission from Tarang lab.
Page 44 of 84
6.1.7 BAND EDGE MEASUREMENTS – RADIATED
6.1.7.1 REFERENCE SECTION & LIMITS Standard Reference
section Frequency range Max Average Limit
(dBµV/m) at 3 meter Max Peak Limit (dBµV/m) at 3 meter
FCC Part 15, Subpart C
15.209 30 MHz to 88 MHz 88 MHz to 216 MHz 216 MHz to 960 MHz 960 MHz to 1 GHz Above 1 GHz
40.0 43.5 46.0 54.0 54.0
60.0 63.5 66.0 74.0 74.0
RSS-210 2.6 30 MHz to 88 MHz 88 MHz to 216 MHz 216 MHz to 960 MHz 960 MHz to 1 GHz Above 1 GHz
40.0 43.5 46.0 54.0 54.0
60.0 63.5 66.0 74.0 74.0
6.1.7.2 TEST PROCEDURE S. No Procedure 1 Test procedure is as per ANSI C63.4: 2000 2 EUT is placed on a 0.8m non-conductive table. This table is positioned on an automated turn table. 3 Antennas are positioned 3m away from the EUT 4 EUT is configured to function with the default channel in the selected band 5 A peak scan was carried out at various azimuth angles and antenna heights fixed to 1m. 6 The highest level of Radiated Emission was recorded 7 Peak and Average measurements were carried out above 1GHz 8 These values are compared against the limit specified by the standard
6.1.7.3 RESULT Frequency (MHz) Measured Value
Horizontal (dBµV/m) Limit (dBµV/m) Margin
(dB) Result Detector
2398.5 27.06 54 26.94 Pass Average 2395 25.02 54 28.98 Pass Average 2393 22.57 54 31.43 Pass Average 2483.5 29.82 54 24.18 Pass Average 2486 29.58 54 24.42 Pass Average 2489 27.85 54 26.15 Pass Average

Date 16th Mar 2011 FCC ID KMHSYNCG2-L Report Number GND1038AUT219-A IC ID 1422A-SYNCG2L
Tarang Wipro Technologies, SJP2, Survey#70,77,78/8A, Dodda Kanelli, Sarjapur road, Bangalore-560 035. Karnataka. India. Tel: +91-80-30298772 Fax: 91-80-28440054 E-mail: [email protected] This report must not be reproduced, except in full, without prior written permission from Tarang lab.
Page 45 of 84
Frequency (MHz) Measured Value
Vertical (dBµV/m) Limit (dBµV/m) Margin
(dB) Result Detector
2398.5 26.06 54 27.94 Pass Average 2395 24.02 54 29.98 Pass Average 2393 22.57 54 31.43 Pass Average 2483.5 28.31 54 25.69 Pass Average 2486 28.01 54 25.99 Pass Average 2489 26.52 54 27.48 Pass Average
Frequency (MHz) Measured Value
Horizontal (dBµV/m) Limit (dBµV/m) Margin
(dB) Result Detector
2399.5 44.8 74 29.20 Pass Peak 2395.5 45.27 74 28.73 Pass Peak 2393 38.44 74 35.56 Pass Peak 2484 38.96 74 35.04 Pass Peak 2486 37.83 74 36.17 Pass Peak 2488.5 39.17 74 34.83 Pass Peak
Frequency (MHz) Measured Value
Vertical (dBµV/m) Limit (dBµV/m) Margin
(dB) Result Detector
2399.5 43.69 74 30.31 Pass Peak 2395.5 41.01 74 32.99 Pass Peak 2393 37.53 74 36.47 Pass Peak 2484 38.06 74 35.94 Pass Peak 2486 37.3 74 36.70 Pass Peak 2488.5 36.87 74 37.13 Pass Peak
6.1.8 BAND EDGE MEASUREMENTS – CONDUCTED
6.1.8.1 REFERENCE SECTION & LIMITS Standard Reference section Limit FCC Part 15, Subpart C 15.247 (d) Band edge emissions must be at least 20 dB down from
the highest emission level within the authorized band as measured with a 100 kHz RBW.
Date 16th Mar 2011 FCC ID KMHSYNCG2-L Report Number GND1038AUT219-A IC ID 1422A-SYNCG2L
Tarang Wipro Technologies, SJP2, Survey#70,77,78/8A, Dodda Kanelli, Sarjapur road, Bangalore-560 035. Karnataka. India. Tel: +91-80-30298772 Fax: 91-80-28440054 E-mail: [email protected] This report must not be reproduced, except in full, without prior written permission from Tarang lab.
Page 46 of 84
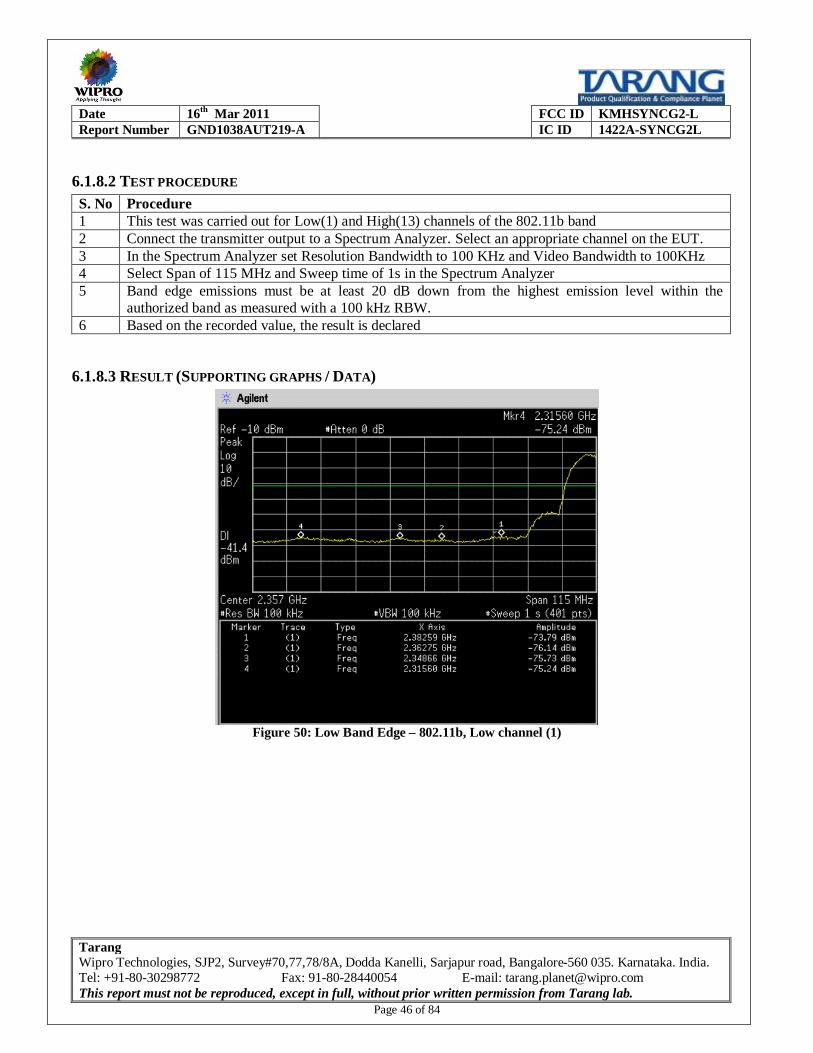
6.1.8.2 TEST PROCEDURE S. No Procedure 1 This test was carried out for Low(1) and High(13) channels of the 802.11b band 2 Connect the transmitter output to a Spectrum Analyzer. Select an appropriate channel on the EUT. 3 In the Spectrum Analyzer set Resolution Bandwidth to 100 KHz and Video Bandwidth to 100KHz 4 Select Span of 115 MHz and Sweep time of 1s in the Spectrum Analyzer 5 Band edge emissions must be at least 20 dB down from the highest emission level within the
authorized band as measured with a 100 kHz RBW. 6 Based on the recorded value, the result is declared
6.1.8.3 RESULT (SUPPORTING GRAPHS / DATA)
Figure 50: Low Band Edge – 802.11b, Low channel (1)

Date 16th Mar 2011 FCC ID KMHSYNCG2-L Report Number GND1038AUT219-A IC ID 1422A-SYNCG2L
Tarang Wipro Technologies, SJP2, Survey#70,77,78/8A, Dodda Kanelli, Sarjapur road, Bangalore-560 035. Karnataka. India. Tel: +91-80-30298772 Fax: 91-80-28440054 E-mail: [email protected] This report must not be reproduced, except in full, without prior written permission from Tarang lab.
Page 47 of 84
Figure 51: High Band Edge – 802.11b, High channel (13)
Date 16th Mar 2011 FCC ID KMHSYNCG2-L Report Number GND1038AUT219-A IC ID 1422A-SYNCG2L
Tarang Wipro Technologies, SJP2, Survey#70,77,78/8A, Dodda Kanelli, Sarjapur road, Bangalore-560 035. Karnataka. India. Tel: +91-80-30298772 Fax: 91-80-28440054 E-mail: [email protected] This report must not be reproduced, except in full, without prior written permission from Tarang lab.
Page 48 of 84
6.2 WI-FI 801.11g MODE
6.2.1 RESTRICTED BAND OF OPERATION
6.2.1.1 REFERENCE SECTION & LIMITS Standard Reference section Limits FCC Part 15, Subpart C 15.205 In the operating range of this product, the limits are:
fL > 2.39 GHz, fH < 2.4835 GHz RSS-210 2.2 In the operating range of this product, the limits are:
fL > 2.39 GHz, fH < 2.655 GHz fL = Lower operating frequency range fH = Higher operating frequency range
6.2.1.2 TEST PROCEDURE S. No Procedure 1 Connect the transmitter output to a Spectrum Analyzer 2 Select the lowest possible channel of the carrier (Eg. 1st channel) 3 Measure the frequency at 30dBm below the peak power at this carrier and record this as fL 4 Select the highest possible channel of the carrier (Eg. 13th channel) 5 Measure the higher frequency at 30dBm below the peak power at this carrier and record this as fH
Note: While it may be sufficient that the center frequency of the carrier is within the limits, the lower and higher frequencies of the carrier envelop have been taken into account for this measurement.
6.2.1.3 RESULT Parameter Limit Measured Result fL Min 2.39 GHz (FCC and RSS-210) 2.401578 Pass fH Max 2.4835 GHz (FCC) 2.481516 Pass fH Max 2.655 GHz (RSS-210) 2.481516 Pass
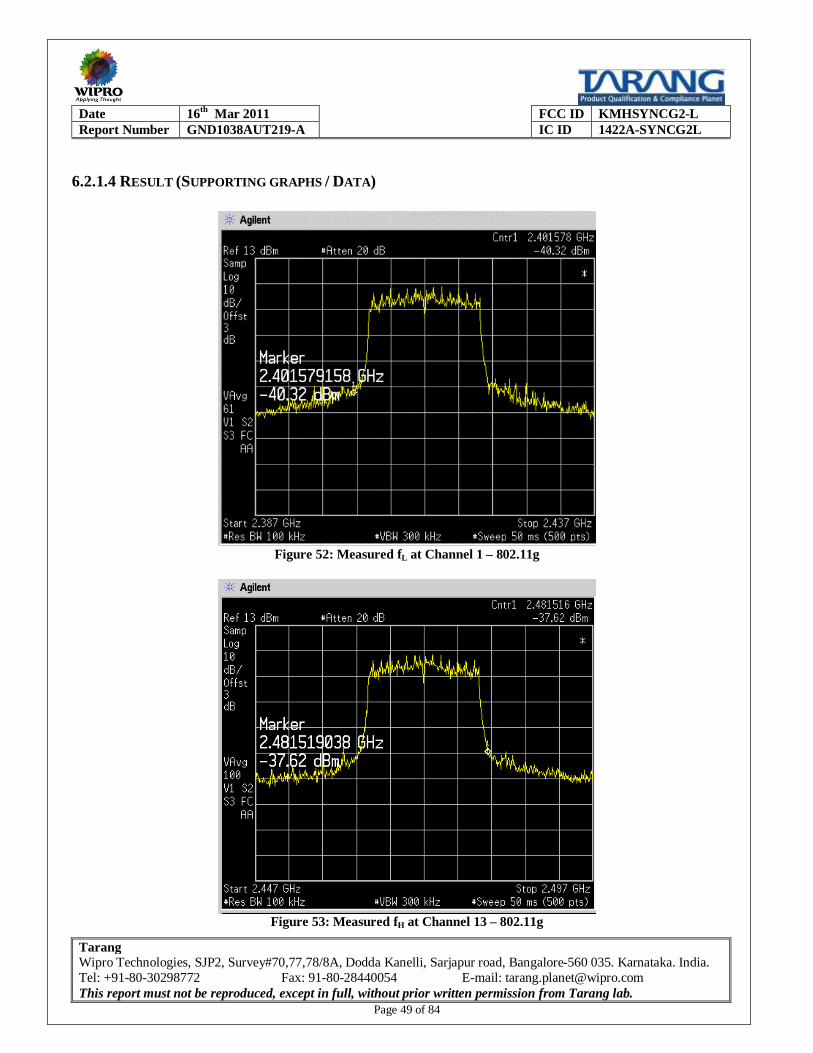
Date 16th Mar 2011 FCC ID KMHSYNCG2-L Report Number GND1038AUT219-A IC ID 1422A-SYNCG2L
Tarang Wipro Technologies, SJP2, Survey#70,77,78/8A, Dodda Kanelli, Sarjapur road, Bangalore-560 035. Karnataka. India. Tel: +91-80-30298772 Fax: 91-80-28440054 E-mail: [email protected] This report must not be reproduced, except in full, without prior written permission from Tarang lab.
Page 49 of 84
6.2.1.4 RESULT (SUPPORTING GRAPHS / DATA)
Figure 52: Measured fL at Channel 1 – 802.11g
Figure 53: Measured fH at Channel 13 – 802.11g
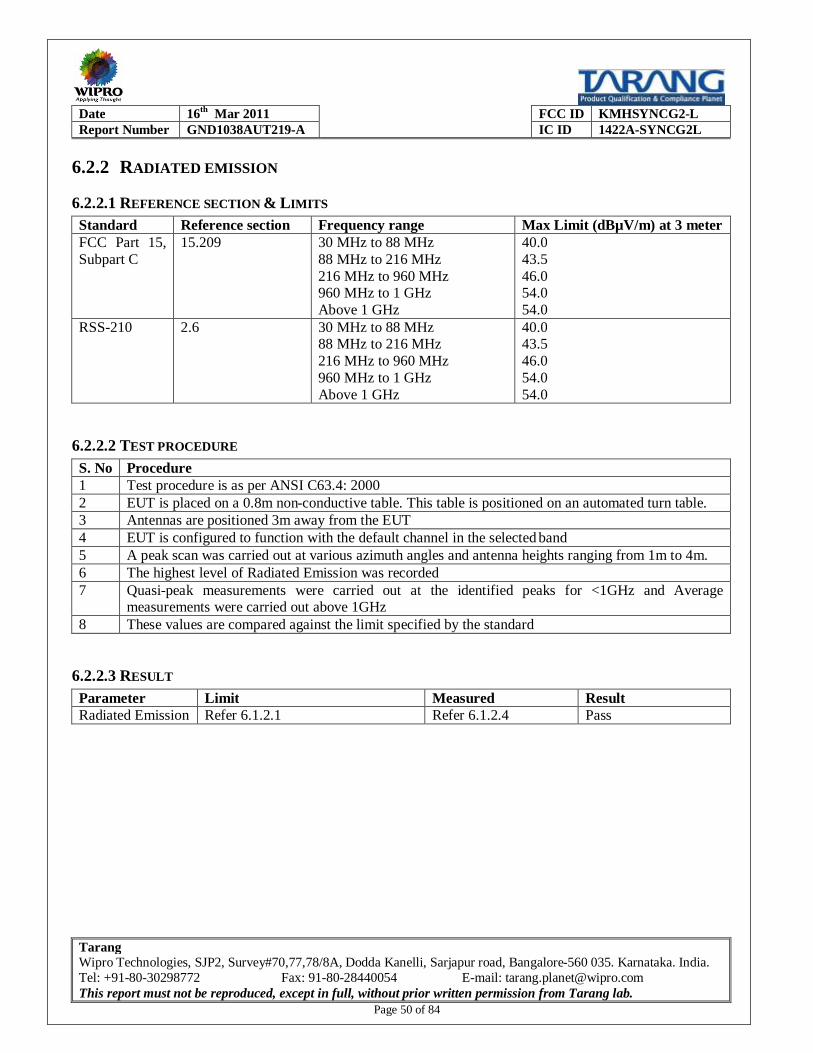
Date 16th Mar 2011 FCC ID KMHSYNCG2-L Report Number GND1038AUT219-A IC ID 1422A-SYNCG2L
Tarang Wipro Technologies, SJP2, Survey#70,77,78/8A, Dodda Kanelli, Sarjapur road, Bangalore-560 035. Karnataka. India. Tel: +91-80-30298772 Fax: 91-80-28440054 E-mail: [email protected] This report must not be reproduced, except in full, without prior written permission from Tarang lab.
Page 50 of 84
6.2.2 RADIATED EMISSION
6.2.2.1 REFERENCE SECTION & LIMITS Standard Reference section Frequency range Max Limit (dBµV/m) at 3 meter FCC Part 15, Subpart C
15.209 30 MHz to 88 MHz 88 MHz to 216 MHz 216 MHz to 960 MHz 960 MHz to 1 GHz Above 1 GHz
40.0 43.5 46.0 54.0 54.0
RSS-210 2.6 30 MHz to 88 MHz 88 MHz to 216 MHz 216 MHz to 960 MHz 960 MHz to 1 GHz Above 1 GHz
40.0 43.5 46.0 54.0 54.0
6.2.2.2 TEST PROCEDURE S. No Procedure 1 Test procedure is as per ANSI C63.4: 2000 2 EUT is placed on a 0.8m non-conductive table. This table is positioned on an automated turn table. 3 Antennas are positioned 3m away from the EUT 4 EUT is configured to function with the default channel in the selected band 5 A peak scan was carried out at various azimuth angles and antenna heights ranging from 1m to 4m. 6 The highest level of Radiated Emission was recorded 7 Quasi-peak measurements were carried out at the identified peaks for <1GHz and Average
measurements were carried out above 1GHz 8 These values are compared against the limit specified by the standard
6.2.2.3 RESULT Parameter Limit Measured Result Radiated Emission Refer 6.1.2.1 Refer 6.1.2.4 Pass

Date 16th Mar 2011 FCC ID KMHSYNCG2-L Report Number GND1038AUT219-A IC ID 1422A-SYNCG2L
Tarang Wipro Technologies, SJP2, Survey#70,77,78/8A, Dodda Kanelli, Sarjapur road, Bangalore-560 035. Karnataka. India. Tel: +91-80-30298772 Fax: 91-80-28440054 E-mail: [email protected] This report must not be reproduced, except in full, without prior written permission from Tarang lab.
Page 51 of 84
6.2.2.4 RESULT (SUPPORTING GRAPHS / DATA) – CHANNEL 1
Figure 54: Radiated emission results (Peak) – Horizontal polarization – 30 MHz to 1 GHz – 802.11g, Channel 1
Figure 55: Radiated emission results (Peak) – Vertical polarization – 30 MHz to 1 GHz – 802.11g, Channel 1

Date 16th Mar 2011 FCC ID KMHSYNCG2-L Report Number GND1038AUT219-A IC ID 1422A-SYNCG2L
Tarang Wipro Technologies, SJP2, Survey#70,77,78/8A, Dodda Kanelli, Sarjapur road, Bangalore-560 035. Karnataka. India. Tel: +91-80-30298772 Fax: 91-80-28440054 E-mail: [email protected] This report must not be reproduced, except in full, without prior written permission from Tarang lab.
Page 52 of 84
Figure 56: Radiated emission results – Quasi-peak table - 30 MHz to 1 GHz – 802.11g, Channel 1
Figure 57: Radiated emission results (Average) – Horizontal polarization – 1 GHz to 2 GHz – 802.11g, Channel 1
Figure 58: Radiated emission results (Average) – Horizontal polarization –2 GHz to 8GHz – 802.11g, Channel 1

Date 16th Mar 2011 FCC ID KMHSYNCG2-L Report Number GND1038AUT219-A IC ID 1422A-SYNCG2L
Tarang Wipro Technologies, SJP2, Survey#70,77,78/8A, Dodda Kanelli, Sarjapur road, Bangalore-560 035. Karnataka. India. Tel: +91-80-30298772 Fax: 91-80-28440054 E-mail: [email protected] This report must not be reproduced, except in full, without prior written permission from Tarang lab.
Page 53 of 84
Figure 59: Radiated emission results (Average) – Horizontal polarization –8 GHz to 18GHz – 802.11g, Channel 1
Figure 60: Radiated emission results (Average) – Horizontal polarization – 18 GHz to 25 GHz – 802.11g, Channel 1
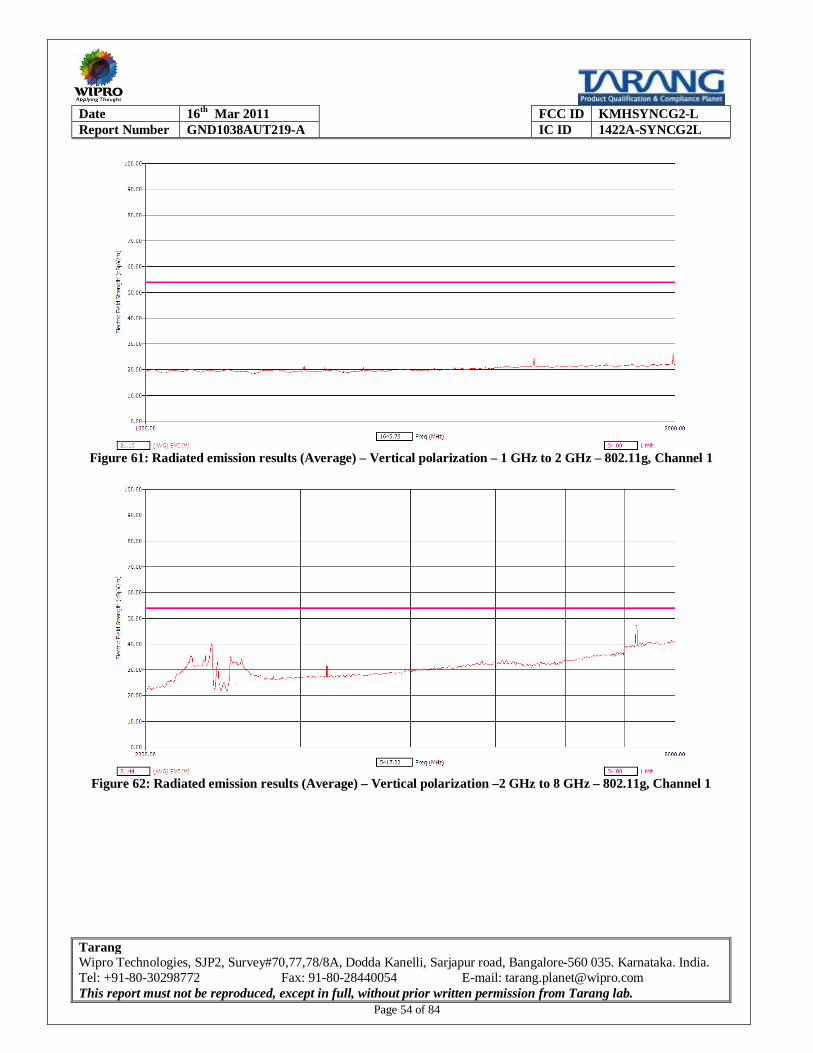
Date 16th Mar 2011 FCC ID KMHSYNCG2-L Report Number GND1038AUT219-A IC ID 1422A-SYNCG2L
Tarang Wipro Technologies, SJP2, Survey#70,77,78/8A, Dodda Kanelli, Sarjapur road, Bangalore-560 035. Karnataka. India. Tel: +91-80-30298772 Fax: 91-80-28440054 E-mail: [email protected] This report must not be reproduced, except in full, without prior written permission from Tarang lab.
Page 54 of 84
Figure 61: Radiated emission results (Average) – Vertical polarization – 1 GHz to 2 GHz – 802.11g, Channel 1
Figure 62: Radiated emission results (Average) – Vertical polarization –2 GHz to 8 GHz – 802.11g, Channel 1
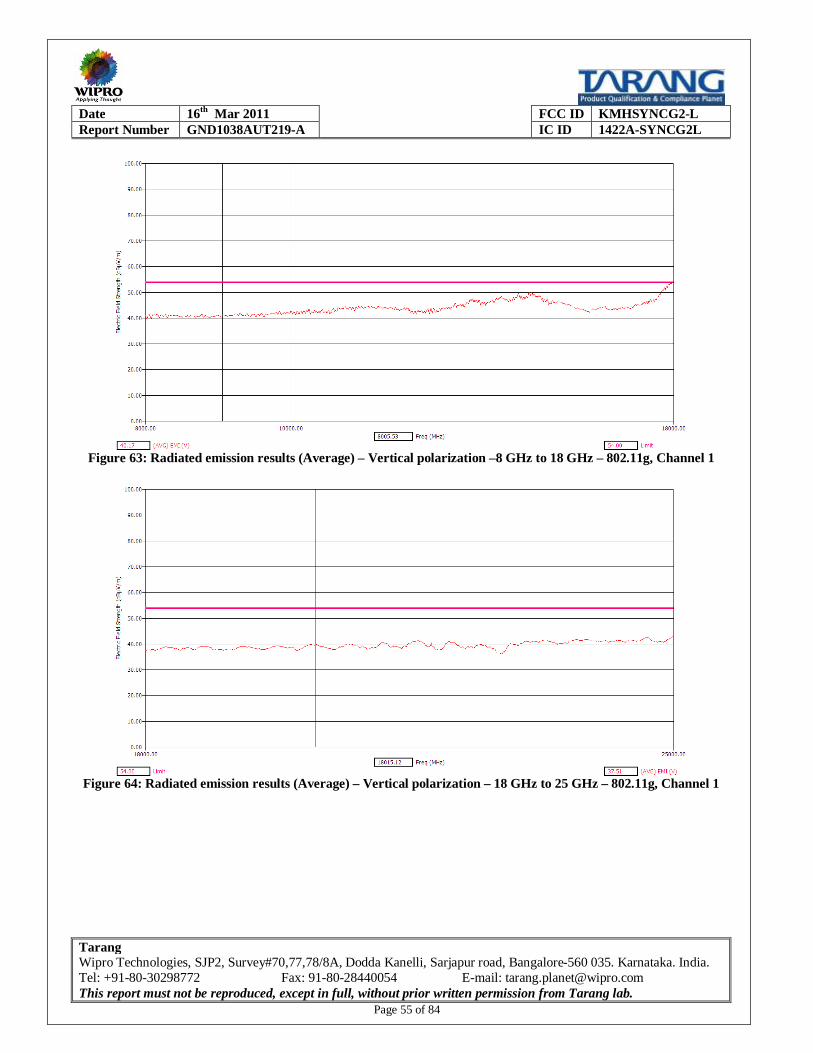
Date 16th Mar 2011 FCC ID KMHSYNCG2-L Report Number GND1038AUT219-A IC ID 1422A-SYNCG2L
Tarang Wipro Technologies, SJP2, Survey#70,77,78/8A, Dodda Kanelli, Sarjapur road, Bangalore-560 035. Karnataka. India. Tel: +91-80-30298772 Fax: 91-80-28440054 E-mail: [email protected] This report must not be reproduced, except in full, without prior written permission from Tarang lab.
Page 55 of 84
Figure 63: Radiated emission results (Average) – Vertical polarization –8 GHz to 18 GHz – 802.11g, Channel 1
Figure 64: Radiated emission results (Average) – Vertical polarization – 18 GHz to 25 GHz – 802.11g, Channel 1

Date 16th Mar 2011 FCC ID KMHSYNCG2-L Report Number GND1038AUT219-A IC ID 1422A-SYNCG2L
Tarang Wipro Technologies, SJP2, Survey#70,77,78/8A, Dodda Kanelli, Sarjapur road, Bangalore-560 035. Karnataka. India. Tel: +91-80-30298772 Fax: 91-80-28440054 E-mail: [email protected] This report must not be reproduced, except in full, without prior written permission from Tarang lab.
Page 56 of 84
6.2.2.5 RESULT (SUPPORTING GRAPHS / DATA) – CHANNEL 6
Figure 65: Radiated emission results (Peak) – Horizontal polarization – 30 MHz to 1 GHz – 802.11g, Channel 6
Figure 66: Radiated emission results (Peak) – Vertical polarization – 30 MHz to 1 GHz – 802.11g, Channel 6

Date 16th Mar 2011 FCC ID KMHSYNCG2-L Report Number GND1038AUT219-A IC ID 1422A-SYNCG2L
Tarang Wipro Technologies, SJP2, Survey#70,77,78/8A, Dodda Kanelli, Sarjapur road, Bangalore-560 035. Karnataka. India. Tel: +91-80-30298772 Fax: 91-80-28440054 E-mail: [email protected] This report must not be reproduced, except in full, without prior written permission from Tarang lab.
Page 57 of 84
Figure 67: Radiated emission results – Quasi-peak table - 30 MHz to 1 GHz – 802.11g, Channel 6
Figure 68: Radiated emission results (Average) – Horizontal polarization – 1 GHz to 2 GHz – 802.11g, Channel 6
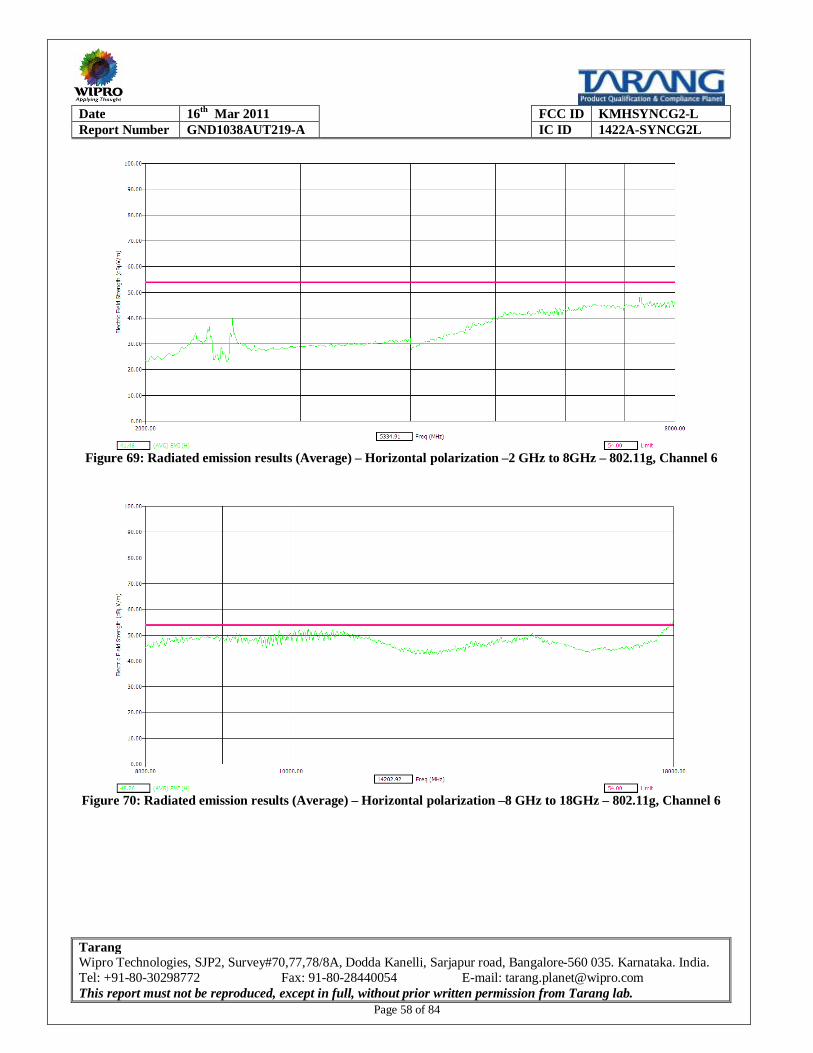
Date 16th Mar 2011 FCC ID KMHSYNCG2-L Report Number GND1038AUT219-A IC ID 1422A-SYNCG2L
Tarang Wipro Technologies, SJP2, Survey#70,77,78/8A, Dodda Kanelli, Sarjapur road, Bangalore-560 035. Karnataka. India. Tel: +91-80-30298772 Fax: 91-80-28440054 E-mail: [email protected] This report must not be reproduced, except in full, without prior written permission from Tarang lab.
Page 58 of 84
Figure 69: Radiated emission results (Average) – Horizontal polarization –2 GHz to 8GHz – 802.11g, Channel 6
Figure 70: Radiated emission results (Average) – Horizontal polarization –8 GHz to 18GHz – 802.11g, Channel 6

Date 16th Mar 2011 FCC ID KMHSYNCG2-L Report Number GND1038AUT219-A IC ID 1422A-SYNCG2L
Tarang Wipro Technologies, SJP2, Survey#70,77,78/8A, Dodda Kanelli, Sarjapur road, Bangalore-560 035. Karnataka. India. Tel: +91-80-30298772 Fax: 91-80-28440054 E-mail: [email protected] This report must not be reproduced, except in full, without prior written permission from Tarang lab.
Page 59 of 84
Figure 71: Radiated emission results (Average) – Horizontal polarization – 18 GHz to 25 GHz – 802.11g, Channel 6
Figure 72: Radiated emission results (Average) – Vertical polarization – 1 GHz to 2 GHz – 802.11g, Channel 6

Date 16th Mar 2011 FCC ID KMHSYNCG2-L Report Number GND1038AUT219-A IC ID 1422A-SYNCG2L
Tarang Wipro Technologies, SJP2, Survey#70,77,78/8A, Dodda Kanelli, Sarjapur road, Bangalore-560 035. Karnataka. India. Tel: +91-80-30298772 Fax: 91-80-28440054 E-mail: [email protected] This report must not be reproduced, except in full, without prior written permission from Tarang lab.
Page 60 of 84
Figure 73: Radiated emission results (Average) – Vertical polarization –2 GHz to 8 GHz – 802.11g, Channel 6
Figure 74: Radiated emission results (Average) – Vertical polarization –8 GHz to 18 GHz – 802.11g, Channel 6

Date 16th Mar 2011 FCC ID KMHSYNCG2-L Report Number GND1038AUT219-A IC ID 1422A-SYNCG2L
Tarang Wipro Technologies, SJP2, Survey#70,77,78/8A, Dodda Kanelli, Sarjapur road, Bangalore-560 035. Karnataka. India. Tel: +91-80-30298772 Fax: 91-80-28440054 E-mail: [email protected] This report must not be reproduced, except in full, without prior written permission from Tarang lab.
Page 61 of 84
Figure 75: Radiated emission results (Average) – Vertical polarization – 18 GHz to 25 GHz – 802.11g, Channel 6
6.2.2.6 RESULT (SUPPORTING GRAPHS / DATA) – CHANNEL 11
Figure 76: Radiated emission results (Peak) – Horizontal polarization – 30 MHz to 1 GHz – 802.11g, Channel 11

Date 16th Mar 2011 FCC ID KMHSYNCG2-L Report Number GND1038AUT219-A IC ID 1422A-SYNCG2L
Tarang Wipro Technologies, SJP2, Survey#70,77,78/8A, Dodda Kanelli, Sarjapur road, Bangalore-560 035. Karnataka. India. Tel: +91-80-30298772 Fax: 91-80-28440054 E-mail: [email protected] This report must not be reproduced, except in full, without prior written permission from Tarang lab.
Page 62 of 84
Figure 77: Radiated emission results (Peak) – Vertical polarization – 30 MHz to 1 GHz – 802.11g, Channel 11
Figure 78: Radiated emission results – Quasi-peak table - 30 MHz to 1 GHz – 802.11g, Channel 11

Date 16th Mar 2011 FCC ID KMHSYNCG2-L Report Number GND1038AUT219-A IC ID 1422A-SYNCG2L
Tarang Wipro Technologies, SJP2, Survey#70,77,78/8A, Dodda Kanelli, Sarjapur road, Bangalore-560 035. Karnataka. India. Tel: +91-80-30298772 Fax: 91-80-28440054 E-mail: [email protected] This report must not be reproduced, except in full, without prior written permission from Tarang lab.
Page 63 of 84
Figure 79: Radiated emission results (Average) – Horizontal polarization – 1 GHz to 2 GHz – 802.11g, Channel 11
Figure 80: Radiated emission results (Average) – Horizontal polarization –2 GHz to 8GHz – 802.11g, Channel 11

Date 16th Mar 2011 FCC ID KMHSYNCG2-L Report Number GND1038AUT219-A IC ID 1422A-SYNCG2L
Tarang Wipro Technologies, SJP2, Survey#70,77,78/8A, Dodda Kanelli, Sarjapur road, Bangalore-560 035. Karnataka. India. Tel: +91-80-30298772 Fax: 91-80-28440054 E-mail: [email protected] This report must not be reproduced, except in full, without prior written permission from Tarang lab.
Page 64 of 84
Figure 81: Radiated emission results (Average) – Horizontal polarization –8 GHz to 18GHz – 802.11g, Channel 11
Figure 82: Radiated emission results (Average) – Horizontal polarization – 18 GHz to 25 GHz – 802.11g, Channel 11

Date 16th Mar 2011 FCC ID KMHSYNCG2-L Report Number GND1038AUT219-A IC ID 1422A-SYNCG2L
Tarang Wipro Technologies, SJP2, Survey#70,77,78/8A, Dodda Kanelli, Sarjapur road, Bangalore-560 035. Karnataka. India. Tel: +91-80-30298772 Fax: 91-80-28440054 E-mail: [email protected] This report must not be reproduced, except in full, without prior written permission from Tarang lab.
Page 65 of 84
Figure 83: Radiated emission results (Average) – Vertical polarization – 1 GHz to 2 GHz – 802.11g, Channel 11
Figure 84: Radiated emission results (Average) – Vertical polarization –2 GHz to 8 GHz – 802.11g, Channel 11
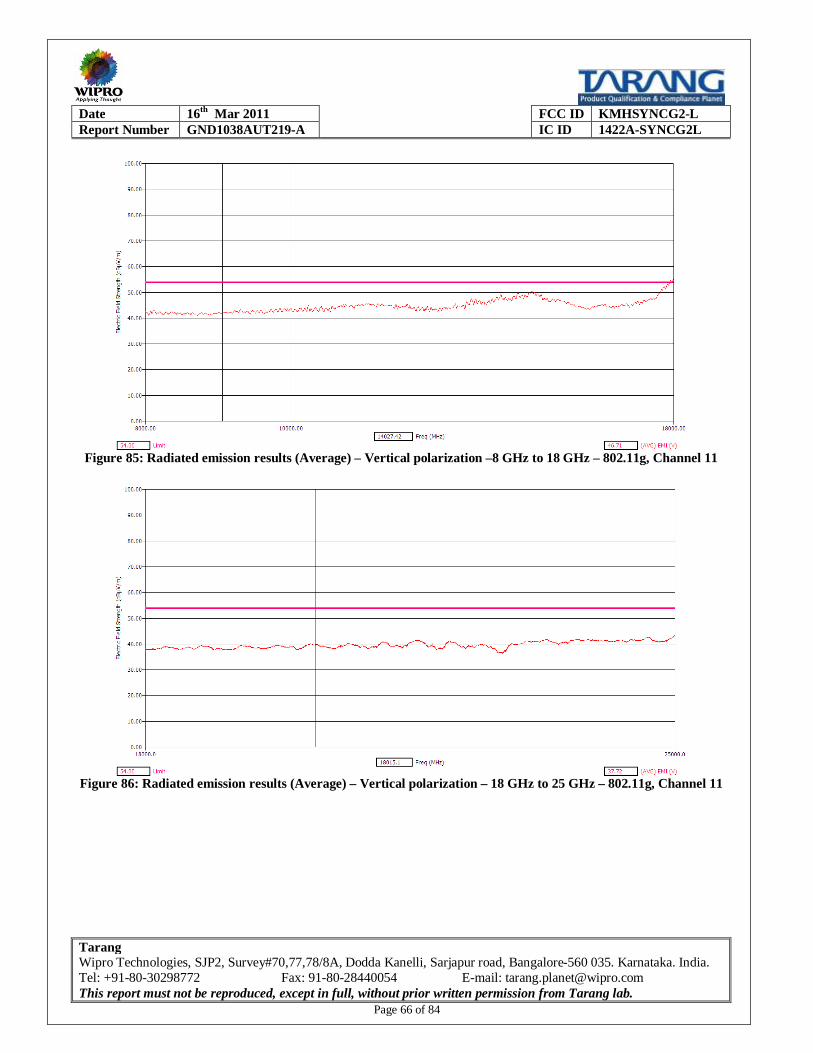
Date 16th Mar 2011 FCC ID KMHSYNCG2-L Report Number GND1038AUT219-A IC ID 1422A-SYNCG2L
Tarang Wipro Technologies, SJP2, Survey#70,77,78/8A, Dodda Kanelli, Sarjapur road, Bangalore-560 035. Karnataka. India. Tel: +91-80-30298772 Fax: 91-80-28440054 E-mail: [email protected] This report must not be reproduced, except in full, without prior written permission from Tarang lab.
Page 66 of 84
Figure 85: Radiated emission results (Average) – Vertical polarization –8 GHz to 18 GHz – 802.11g, Channel 11
Figure 86: Radiated emission results (Average) – Vertical polarization – 18 GHz to 25 GHz – 802.11g, Channel 11

Date 16th Mar 2011 FCC ID KMHSYNCG2-L Report Number GND1038AUT219-A IC ID 1422A-SYNCG2L
Tarang Wipro Technologies, SJP2, Survey#70,77,78/8A, Dodda Kanelli, Sarjapur road, Bangalore-560 035. Karnataka. India. Tel: +91-80-30298772 Fax: 91-80-28440054 E-mail: [email protected] This report must not be reproduced, except in full, without prior written permission from Tarang lab.
Page 67 of 84
6.2.3 6dB BANDWIDTH
6.2.3.1 REFERENCE SECTION & LIMITS Standard Reference section Limit FCC Part 15, Subpart C 15.247 (a) (2) The 6dB bandwidth > 500 KHz RSS-210 A8.2 The 6dB bandwidth > 500 KHz
6.2.3.2 TEST PROCEDURE S. No Procedure 1 This test was carried out for Low(1), Mid(6) and High(11) channels of the 802.11g band 2 Connect the transmitter output to a Spectrum Analyzer. Select an appropriate channel on the EUT. 3 Detect the carrier envelop in the Spectrum Analyzer 4 The 6dB bandwidth below the peak power was calculated on the envelop 5 This measured bandwidth is compared against the limit and the result declared
6.2.3.3 RESULT Band, Channel Frequency (GHz) Limit Measured Result 802.11g, 1 (Low) 2.412 500 KHz or more 15.875 MHz Pass 802.11g, 6 (Mid) 2.437 500 KHz or more 16.000 MHz Pass 802.11g, 11 (High) 2.462 500 KHz or more 15.500 MHz Pass
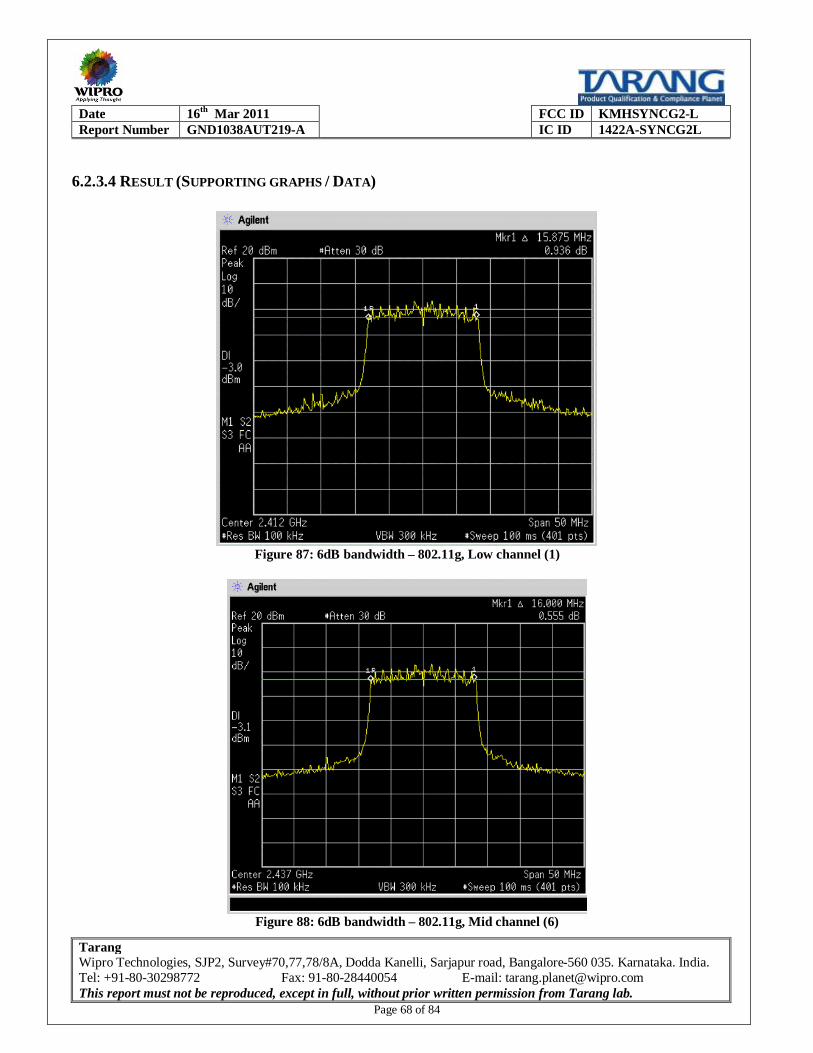
Date 16th Mar 2011 FCC ID KMHSYNCG2-L Report Number GND1038AUT219-A IC ID 1422A-SYNCG2L
Tarang Wipro Technologies, SJP2, Survey#70,77,78/8A, Dodda Kanelli, Sarjapur road, Bangalore-560 035. Karnataka. India. Tel: +91-80-30298772 Fax: 91-80-28440054 E-mail: [email protected] This report must not be reproduced, except in full, without prior written permission from Tarang lab.
Page 68 of 84
6.2.3.4 RESULT (SUPPORTING GRAPHS / DATA)
Figure 87: 6dB bandwidth – 802.11g, Low channel (1)
Figure 88: 6dB bandwidth – 802.11g, Mid channel (6)
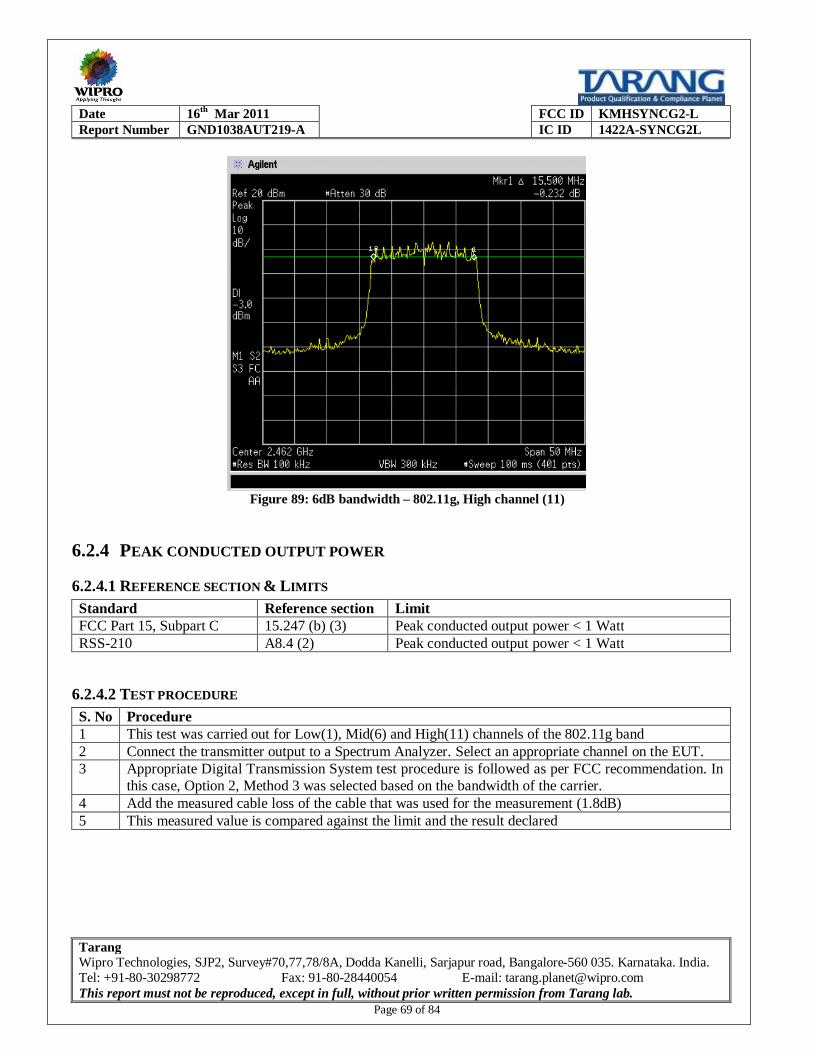
Date 16th Mar 2011 FCC ID KMHSYNCG2-L Report Number GND1038AUT219-A IC ID 1422A-SYNCG2L
Tarang Wipro Technologies, SJP2, Survey#70,77,78/8A, Dodda Kanelli, Sarjapur road, Bangalore-560 035. Karnataka. India. Tel: +91-80-30298772 Fax: 91-80-28440054 E-mail: [email protected] This report must not be reproduced, except in full, without prior written permission from Tarang lab.
Page 69 of 84
Figure 89: 6dB bandwidth – 802.11g, High channel (11)
6.2.4 PEAK CONDUCTED OUTPUT POWER
6.2.4.1 REFERENCE SECTION & LIMITS Standard Reference section Limit FCC Part 15, Subpart C 15.247 (b) (3) Peak conducted output power < 1 Watt RSS-210 A8.4 (2) Peak conducted output power < 1 Watt
6.2.4.2 TEST PROCEDURE S. No Procedure 1 This test was carried out for Low(1), Mid(6) and High(11) channels of the 802.11g band 2 Connect the transmitter output to a Spectrum Analyzer. Select an appropriate channel on the EUT. 3 Appropriate Digital Transmission System test procedure is followed as per FCC recommendation. In
this case, Option 2, Method 3 was selected based on the bandwidth of the carrier. 4 Add the measured cable loss of the cable that was used for the measurement (1.8dB) 5 This measured value is compared against the limit and the result declared

Date 16th Mar 2011 FCC ID KMHSYNCG2-L Report Number GND1038AUT219-A IC ID 1422A-SYNCG2L
Tarang Wipro Technologies, SJP2, Survey#70,77,78/8A, Dodda Kanelli, Sarjapur road, Bangalore-560 035. Karnataka. India. Tel: +91-80-30298772 Fax: 91-80-28440054 E-mail: [email protected] This report must not be reproduced, except in full, without prior written permission from Tarang lab.
Page 70 of 84
6.2.4.3 RESULT Band, Channel
Frequency (GHz)
Measured power (dBm)
Cable loss (dB)
Total power (dBm)
Total power (mW)
Limit (mW)
Result
802.11g, 1 (Low)
2.412 10.94 1.8 12.74 18.79 1000 Pass
802.11g, 6 (Mid)
2.437 11.02 1.8 12.82 19.14 1000 Pass
802.11g, 11 (High)
2.462 10.84 1.8 12.64 18.36 1000 Pass
Note: Transmit duty cycle considered is = 1 No antenna gain is considered as this is conducted measurement without antenna
6.2.4.4 RESULT (SUPPORTING GRAPHS / DATA)
Figure 90: Peak conducted output power – 802.11g, Low channel (1)
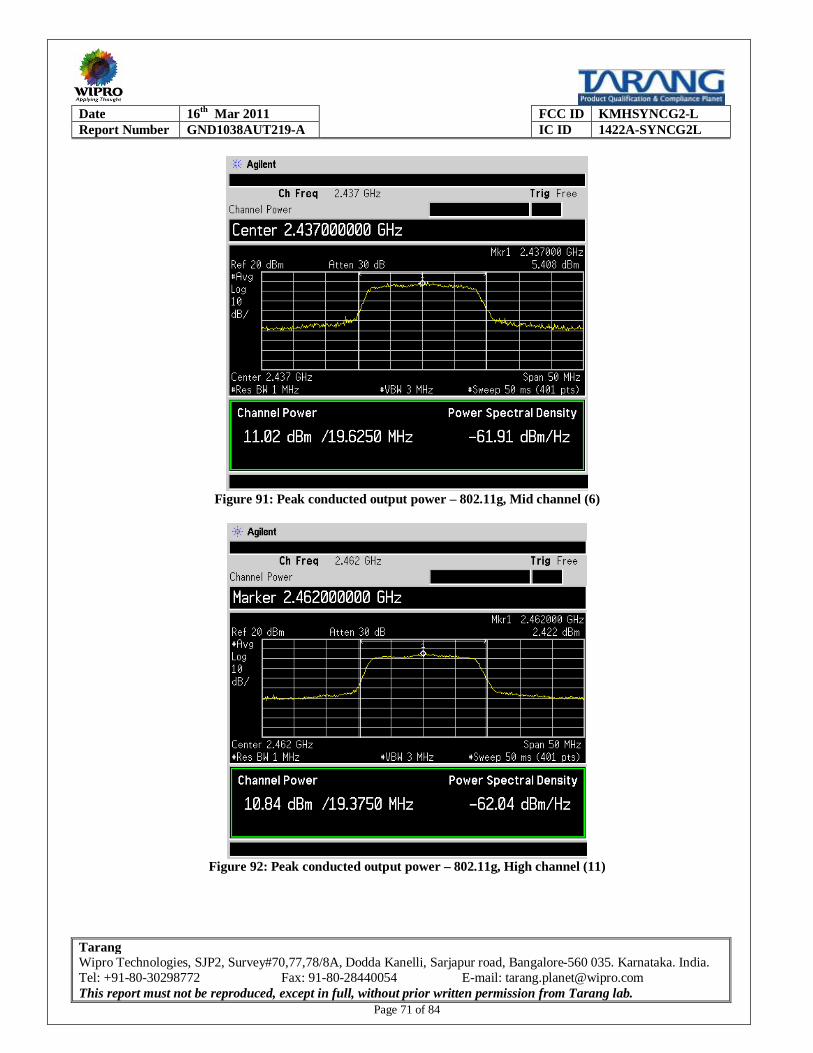
Date 16th Mar 2011 FCC ID KMHSYNCG2-L Report Number GND1038AUT219-A IC ID 1422A-SYNCG2L
Tarang Wipro Technologies, SJP2, Survey#70,77,78/8A, Dodda Kanelli, Sarjapur road, Bangalore-560 035. Karnataka. India. Tel: +91-80-30298772 Fax: 91-80-28440054 E-mail: [email protected] This report must not be reproduced, except in full, without prior written permission from Tarang lab.
Page 71 of 84
Figure 91: Peak conducted output power – 802.11g, Mid channel (6)
Figure 92: Peak conducted output power – 802.11g, High channel (11)
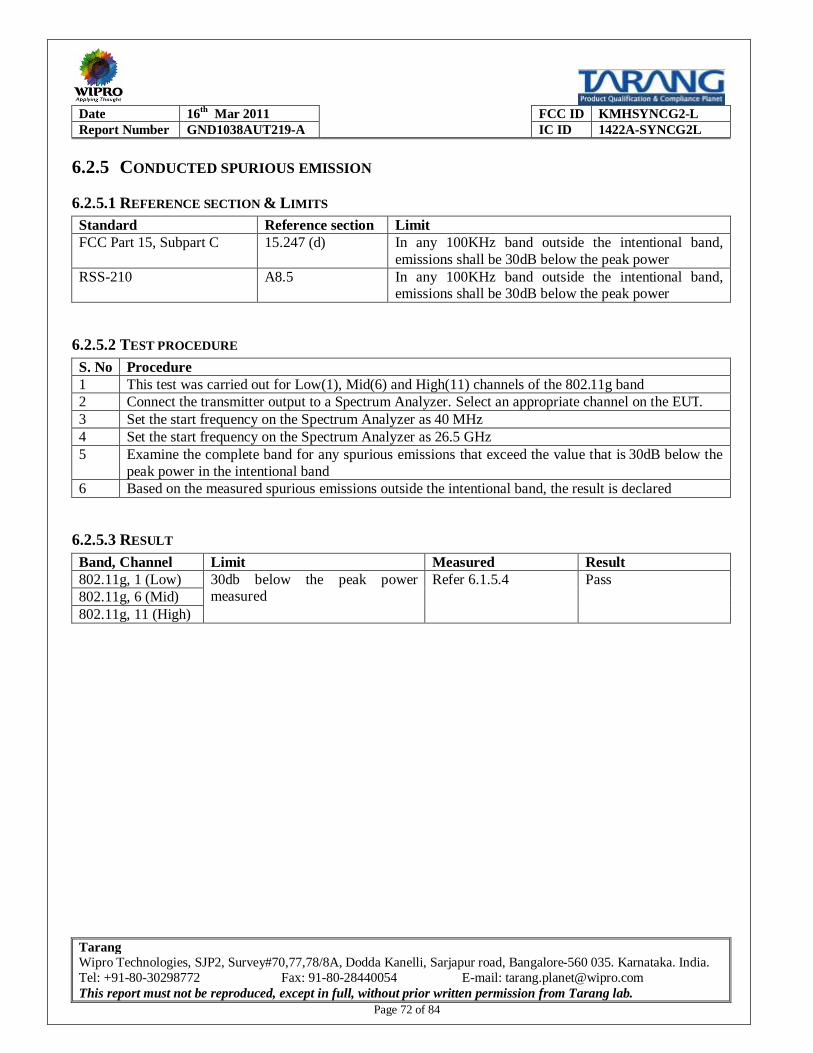
Date 16th Mar 2011 FCC ID KMHSYNCG2-L Report Number GND1038AUT219-A IC ID 1422A-SYNCG2L
Tarang Wipro Technologies, SJP2, Survey#70,77,78/8A, Dodda Kanelli, Sarjapur road, Bangalore-560 035. Karnataka. India. Tel: +91-80-30298772 Fax: 91-80-28440054 E-mail: [email protected] This report must not be reproduced, except in full, without prior written permission from Tarang lab.
Page 72 of 84
6.2.5 CONDUCTED SPURIOUS EMISSION
6.2.5.1 REFERENCE SECTION & LIMITS Standard Reference section Limit FCC Part 15, Subpart C 15.247 (d) In any 100KHz band outside the intentional band,
emissions shall be 30dB below the peak power RSS-210 A8.5 In any 100KHz band outside the intentional band,
emissions shall be 30dB below the peak power
6.2.5.2 TEST PROCEDURE S. No Procedure 1 This test was carried out for Low(1), Mid(6) and High(11) channels of the 802.11g band 2 Connect the transmitter output to a Spectrum Analyzer. Select an appropriate channel on the EUT. 3 Set the start frequency on the Spectrum Analyzer as 40 MHz 4 Set the start frequency on the Spectrum Analyzer as 26.5 GHz 5 Examine the complete band for any spurious emissions that exceed the value that is 30dB below the
peak power in the intentional band 6 Based on the measured spurious emissions outside the intentional band, the result is declared
6.2.5.3 RESULT Band, Channel Limit Measured Result 802.11g, 1 (Low) 30db below the peak power
measured Refer 6.1.5.4 Pass
802.11g, 6 (Mid) 802.11g, 11 (High)
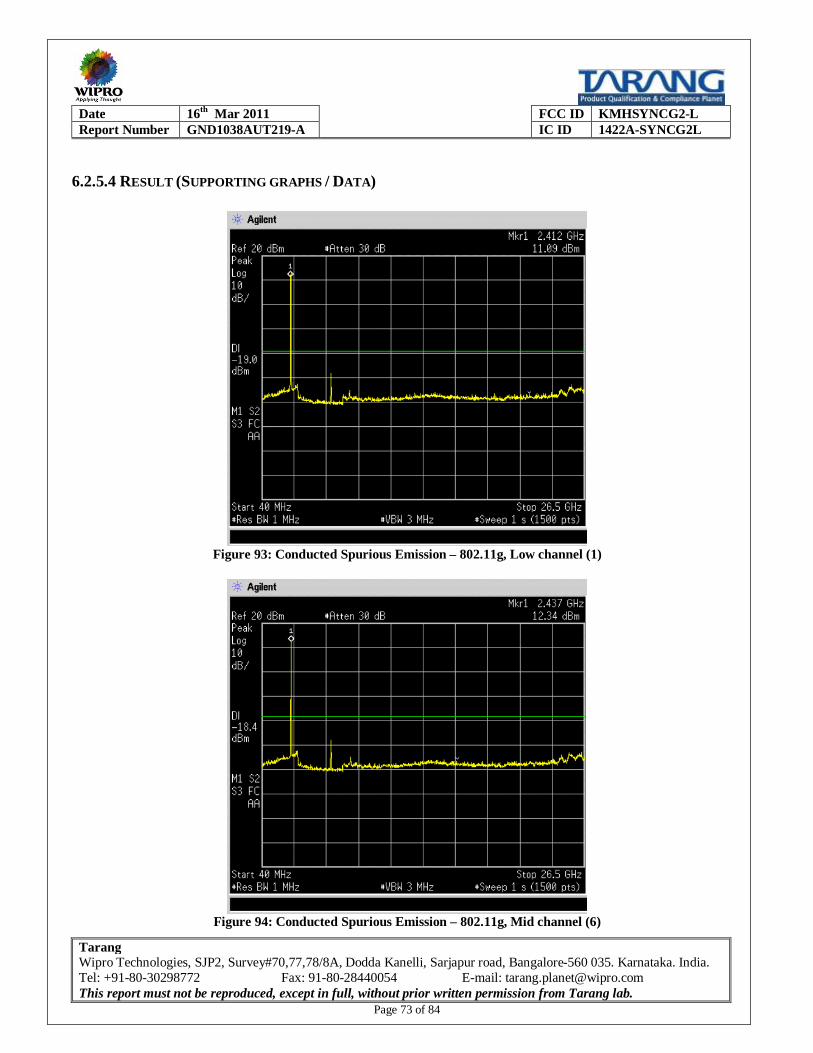
Date 16th Mar 2011 FCC ID KMHSYNCG2-L Report Number GND1038AUT219-A IC ID 1422A-SYNCG2L
Tarang Wipro Technologies, SJP2, Survey#70,77,78/8A, Dodda Kanelli, Sarjapur road, Bangalore-560 035. Karnataka. India. Tel: +91-80-30298772 Fax: 91-80-28440054 E-mail: [email protected] This report must not be reproduced, except in full, without prior written permission from Tarang lab.
Page 73 of 84
6.2.5.4 RESULT (SUPPORTING GRAPHS / DATA)
Figure 93: Conducted Spurious Emission – 802.11g, Low channel (1)
Figure 94: Conducted Spurious Emission – 802.11g, Mid channel (6)

Date 16th Mar 2011 FCC ID KMHSYNCG2-L Report Number GND1038AUT219-A IC ID 1422A-SYNCG2L
Tarang Wipro Technologies, SJP2, Survey#70,77,78/8A, Dodda Kanelli, Sarjapur road, Bangalore-560 035. Karnataka. India. Tel: +91-80-30298772 Fax: 91-80-28440054 E-mail: [email protected] This report must not be reproduced, except in full, without prior written permission from Tarang lab.
Page 74 of 84
Figure 95: Conducted Spurious Emission – 802.11g, High channel (11)
6.2.6 POWER SPECTRAL DENSITY
6.2.6.1 REFERENCE SECTION & LIMITS Standard Reference section Limit FCC Part 15, Subpart C 15.247 (e) Conducted power spectral density shall not be
greater than 8 dBm in any 3 kHz band RSS-210 A8.2 Conducted power spectral density shall not be
greater than 8 dBm in any 3 kHz band
6.2.6.2 TEST PROCEDURE S. No Procedure 1 This test was carried out for Low(1), Mid(6) and High(11) channels of the 802.11g band 2 Connect the transmitter output to a Spectrum Analyzer. Select an appropriate channel on the EUT 3 In the Spectrum Analyzer set Resolution Bandwidth to 3 KHz and Video Bandwidth to 300KHz 4 Select Span of 300 KHz and Sweep time of 100s in the Spectrum Analyzer 5 Record the peak power shown as power spectral density 6 Based on the recorded value, the result is declared
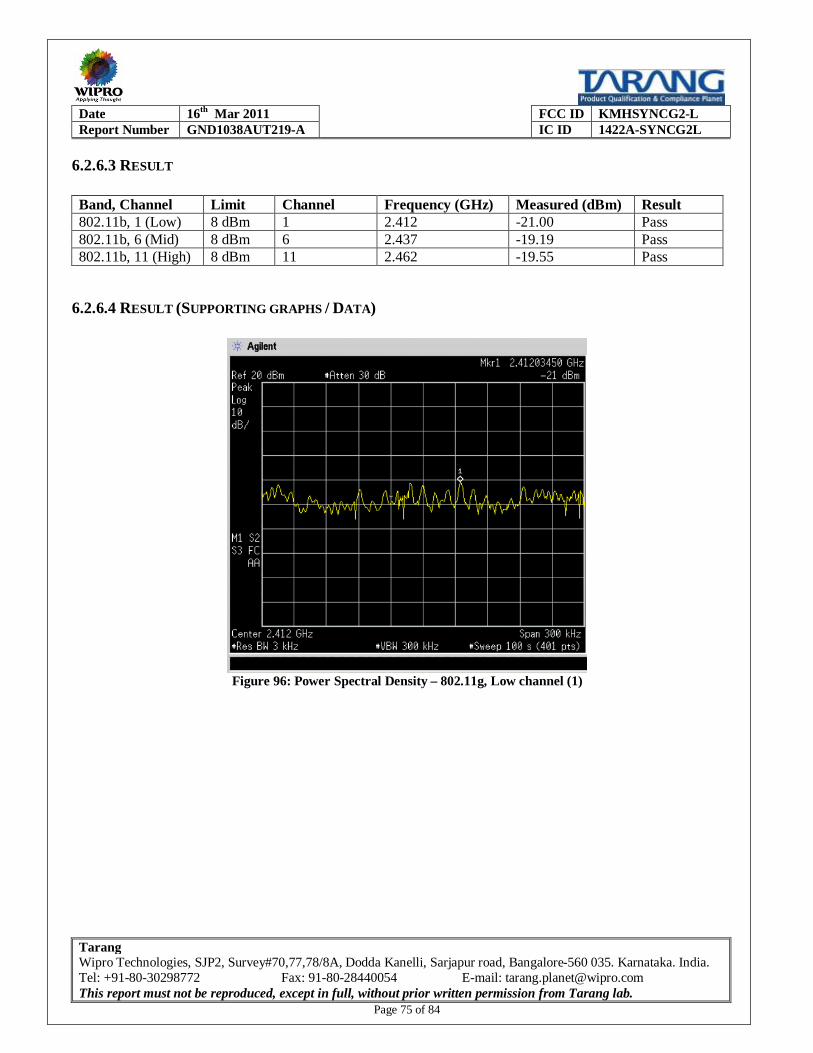
Date 16th Mar 2011 FCC ID KMHSYNCG2-L Report Number GND1038AUT219-A IC ID 1422A-SYNCG2L
Tarang Wipro Technologies, SJP2, Survey#70,77,78/8A, Dodda Kanelli, Sarjapur road, Bangalore-560 035. Karnataka. India. Tel: +91-80-30298772 Fax: 91-80-28440054 E-mail: [email protected] This report must not be reproduced, except in full, without prior written permission from Tarang lab.
Page 75 of 84
6.2.6.3 RESULT Band, Channel Limit Channel Frequency (GHz) Measured (dBm) Result 802.11b, 1 (Low) 8 dBm 1 2.412 -21.00 Pass 802.11b, 6 (Mid) 8 dBm 6 2.437 -19.19 Pass 802.11b, 11 (High) 8 dBm 11 2.462 -19.55 Pass
6.2.6.4 RESULT (SUPPORTING GRAPHS / DATA)
Figure 96: Power Spectral Density – 802.11g, Low channel (1)

Date 16th Mar 2011 FCC ID KMHSYNCG2-L Report Number GND1038AUT219-A IC ID 1422A-SYNCG2L
Tarang Wipro Technologies, SJP2, Survey#70,77,78/8A, Dodda Kanelli, Sarjapur road, Bangalore-560 035. Karnataka. India. Tel: +91-80-30298772 Fax: 91-80-28440054 E-mail: [email protected] This report must not be reproduced, except in full, without prior written permission from Tarang lab.
Page 76 of 84
Figure 97: Power Spectral Density – 802.11g, Mid channel (6)
Figure 98: Power Spectral Density – 802.11g, High channel (11)
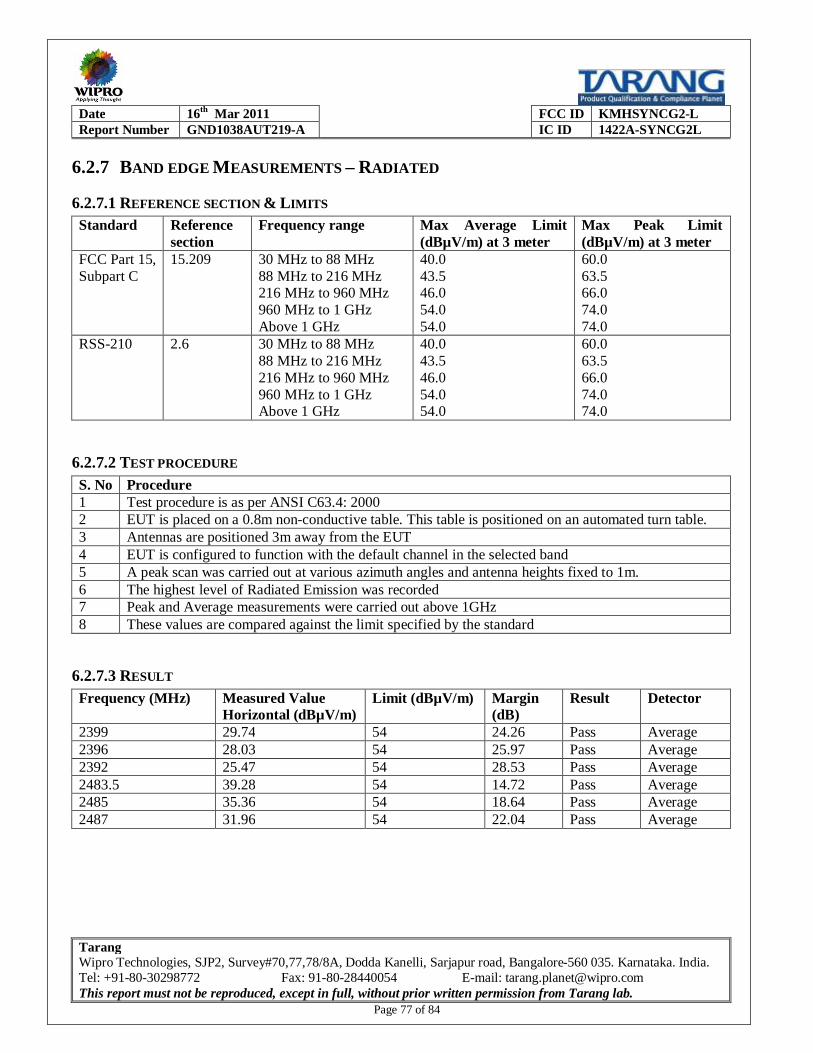
Date 16th Mar 2011 FCC ID KMHSYNCG2-L Report Number GND1038AUT219-A IC ID 1422A-SYNCG2L
Tarang Wipro Technologies, SJP2, Survey#70,77,78/8A, Dodda Kanelli, Sarjapur road, Bangalore-560 035. Karnataka. India. Tel: +91-80-30298772 Fax: 91-80-28440054 E-mail: [email protected] This report must not be reproduced, except in full, without prior written permission from Tarang lab.
Page 77 of 84
6.2.7 BAND EDGE MEASUREMENTS – RADIATED
6.2.7.1 REFERENCE SECTION & LIMITS Standard Reference
section Frequency range Max Average Limit
(dBµV/m) at 3 meter Max Peak Limit (dBµV/m) at 3 meter
FCC Part 15, Subpart C
15.209 30 MHz to 88 MHz 88 MHz to 216 MHz 216 MHz to 960 MHz 960 MHz to 1 GHz Above 1 GHz
40.0 43.5 46.0 54.0 54.0
60.0 63.5 66.0 74.0 74.0
RSS-210 2.6 30 MHz to 88 MHz 88 MHz to 216 MHz 216 MHz to 960 MHz 960 MHz to 1 GHz Above 1 GHz
40.0 43.5 46.0 54.0 54.0
60.0 63.5 66.0 74.0 74.0
6.2.7.2 TEST PROCEDURE S. No Procedure 1 Test procedure is as per ANSI C63.4: 2000 2 EUT is placed on a 0.8m non-conductive table. This table is positioned on an automated turn table. 3 Antennas are positioned 3m away from the EUT 4 EUT is configured to function with the default channel in the selected band 5 A peak scan was carried out at various azimuth angles and antenna heights fixed to 1m. 6 The highest level of Radiated Emission was recorded 7 Peak and Average measurements were carried out above 1GHz 8 These values are compared against the limit specified by the standard
6.2.7.3 RESULT Frequency (MHz) Measured Value
Horizontal (dBµV/m) Limit (dBµV/m) Margin
(dB) Result Detector
2399 29.74 54 24.26 Pass Average 2396 28.03 54 25.97 Pass Average 2392 25.47 54 28.53 Pass Average 2483.5 39.28 54 14.72 Pass Average 2485 35.36 54 18.64 Pass Average 2487 31.96 54 22.04 Pass Average
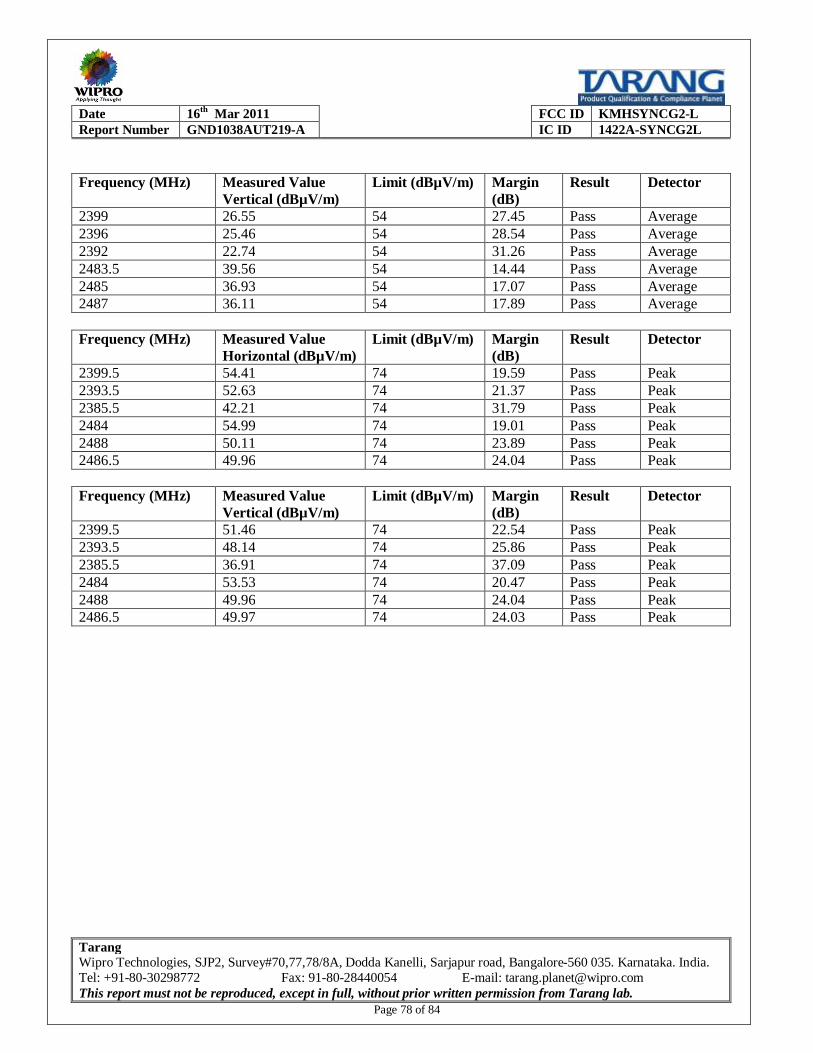
Date 16th Mar 2011 FCC ID KMHSYNCG2-L Report Number GND1038AUT219-A IC ID 1422A-SYNCG2L
Tarang Wipro Technologies, SJP2, Survey#70,77,78/8A, Dodda Kanelli, Sarjapur road, Bangalore-560 035. Karnataka. India. Tel: +91-80-30298772 Fax: 91-80-28440054 E-mail: [email protected] This report must not be reproduced, except in full, without prior written permission from Tarang lab.
Page 78 of 84
Frequency (MHz) Measured Value
Vertical (dBµV/m) Limit (dBµV/m) Margin
(dB) Result Detector
2399 26.55 54 27.45 Pass Average 2396 25.46 54 28.54 Pass Average 2392 22.74 54 31.26 Pass Average 2483.5 39.56 54 14.44 Pass Average 2485 36.93 54 17.07 Pass Average 2487 36.11 54 17.89 Pass Average
Frequency (MHz) Measured Value
Horizontal (dBµV/m) Limit (dBµV/m) Margin
(dB) Result Detector
2399.5 54.41 74 19.59 Pass Peak 2393.5 52.63 74 21.37 Pass Peak 2385.5 42.21 74 31.79 Pass Peak 2484 54.99 74 19.01 Pass Peak 2488 50.11 74 23.89 Pass Peak 2486.5 49.96 74 24.04 Pass Peak
Frequency (MHz) Measured Value
Vertical (dBµV/m) Limit (dBµV/m) Margin
(dB) Result Detector
2399.5 51.46 74 22.54 Pass Peak 2393.5 48.14 74 25.86 Pass Peak 2385.5 36.91 74 37.09 Pass Peak 2484 53.53 74 20.47 Pass Peak 2488 49.96 74 24.04 Pass Peak 2486.5 49.97 74 24.03 Pass Peak

Date 16th Mar 2011 FCC ID KMHSYNCG2-L Report Number GND1038AUT219-A IC ID 1422A-SYNCG2L
Tarang Wipro Technologies, SJP2, Survey#70,77,78/8A, Dodda Kanelli, Sarjapur road, Bangalore-560 035. Karnataka. India. Tel: +91-80-30298772 Fax: 91-80-28440054 E-mail: [email protected] This report must not be reproduced, except in full, without prior written permission from Tarang lab.
Page 79 of 84
6.2.8 BAND EDGE MEASUREMENTS – CONDUCTED
6.2.8.1 REFERENCE SECTION & LIMITS Standard Reference section Limit FCC Part 15, Subpart C 15.247 (d) Band edge emissions must be at least 20 dB down from
the highest emission level within the authorized band as measured with a 100 kHz RBW.
6.2.8.2 TEST PROCEDURE S. No Procedure 1 This test was carried out for Low(1) and High(13) channels of the 802.11g band 2 Connect the transmitter output to a Spectrum Analyzer. Select an appropriate channel on the EUT. 3 In the Spectrum Analyzer set Resolution Bandwidth to 100 KHz and Video Bandwidth to 100KHz 4 Select Span of 115 MHz and Sweep time of 1s in the Spectrum Analyzer 5 Band edge emissions must be at least 20 dB down from the highest emission level within the
authorized band as measured with a 100 kHz RBW. 6 Based on the recorded value, the result is declared
6.2.8.3 RESULT (SUPPORTING GRAPHS / DATA)
Figure 99: Low Band Edge – 802.11g, Low channel (1)

Date 16th Mar 2011 FCC ID KMHSYNCG2-L Report Number GND1038AUT219-A IC ID 1422A-SYNCG2L
Tarang Wipro Technologies, SJP2, Survey#70,77,78/8A, Dodda Kanelli, Sarjapur road, Bangalore-560 035. Karnataka. India. Tel: +91-80-30298772 Fax: 91-80-28440054 E-mail: [email protected] This report must not be reproduced, except in full, without prior written permission from Tarang lab.
Page 80 of 84
Figure 100: High Band Edge – 802.11g, High channel (13)
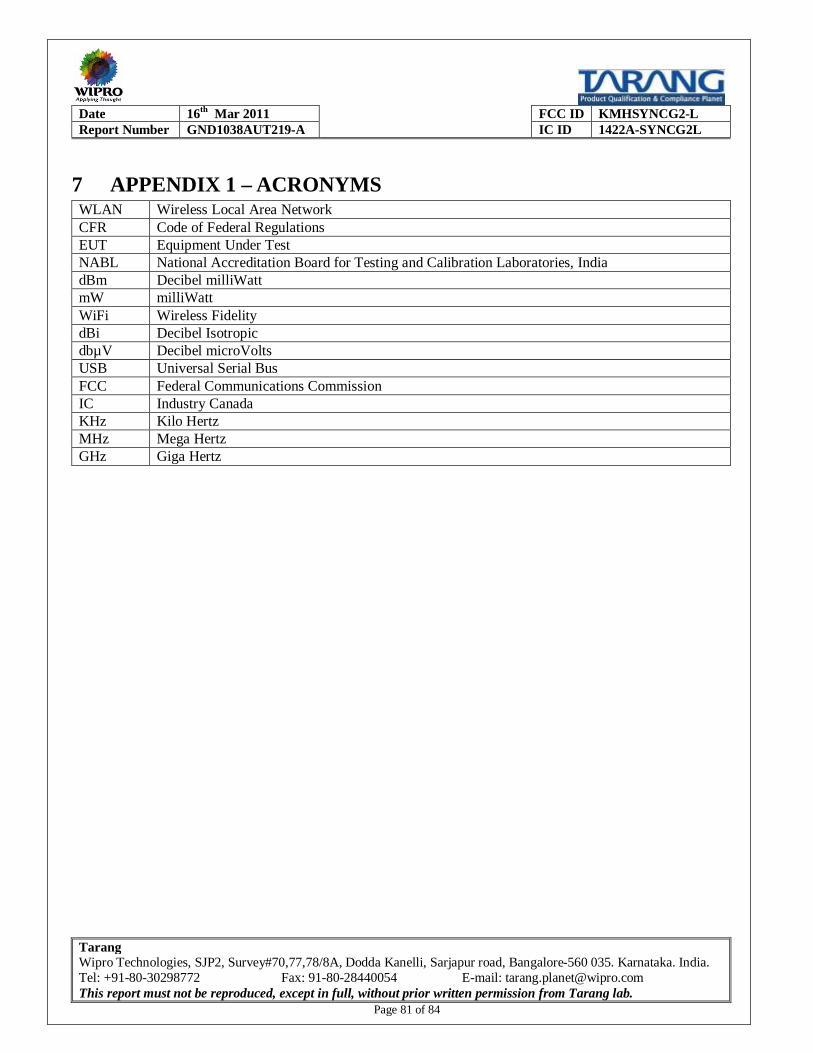
Date 16th Mar 2011 FCC ID KMHSYNCG2-L Report Number GND1038AUT219-A IC ID 1422A-SYNCG2L
Tarang Wipro Technologies, SJP2, Survey#70,77,78/8A, Dodda Kanelli, Sarjapur road, Bangalore-560 035. Karnataka. India. Tel: +91-80-30298772 Fax: 91-80-28440054 E-mail: [email protected] This report must not be reproduced, except in full, without prior written permission from Tarang lab.
Page 81 of 84
7 APPENDIX 1 – ACRONYMS WLAN Wireless Local Area Network CFR Code of Federal Regulations EUT Equipment Under Test NABL National Accreditation Board for Testing and Calibration Laboratories, India dBm Decibel milliWatt mW milliWatt WiFi Wireless Fidelity dBi Decibel Isotropic dbµV Decibel microVolts USB Universal Serial Bus FCC Federal Communications Commission IC Industry Canada KHz Kilo Hertz MHz Mega Hertz GHz Giga Hertz

Date 16th Mar 2011 FCC ID KMHSYNCG2-L Report Number GND1038AUT219-A IC ID 1422A-SYNCG2L
Tarang Wipro Technologies, SJP2, Survey#70,77,78/8A, Dodda Kanelli, Sarjapur road, Bangalore-560 035. Karnataka. India. Tel: +91-80-30298772 Fax: 91-80-28440054 E-mail: [email protected] This report must not be reproduced, except in full, without prior written permission from Tarang lab.
Page 82 of 84
8 APPENDIX 2 – PHOTOGRAPH OF TEST SETUPS
Figure 101: Test setup for Radiated Emission (Vertical polarization) – 30MHz to 1GHz
Figure 102: Test setup for Radiated Emission (Horizontal polarization) – 30MHz to 1GHz
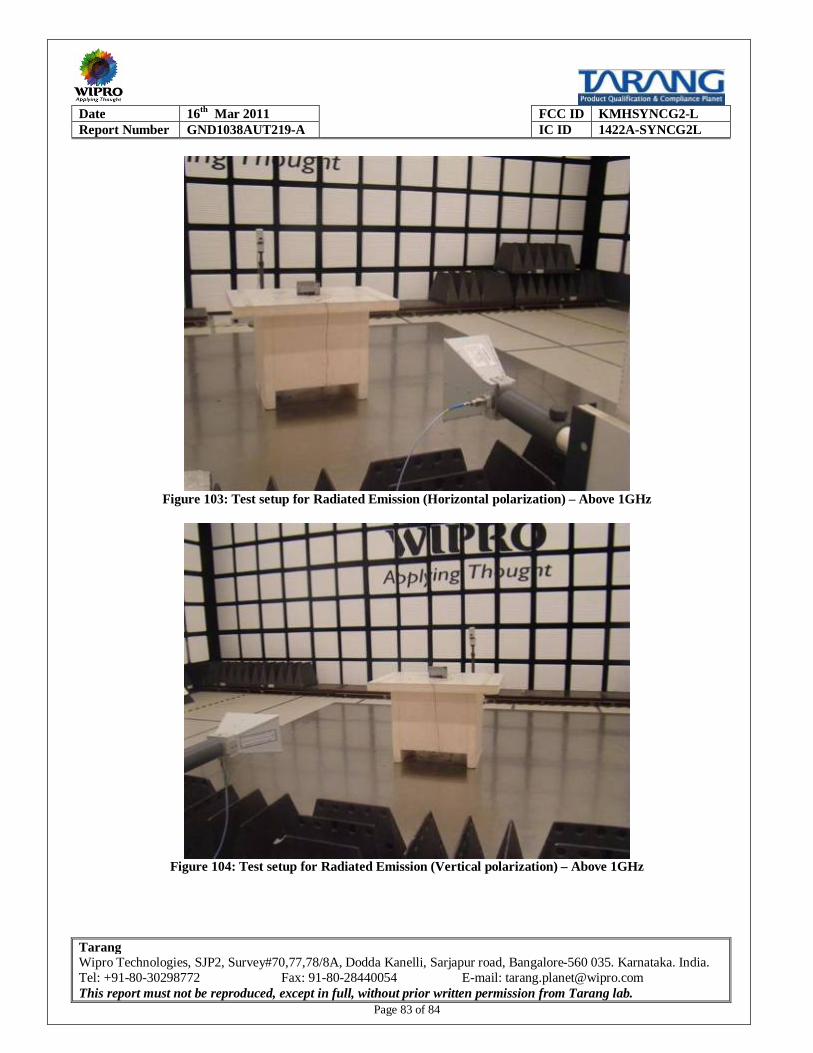
Date 16th Mar 2011 FCC ID KMHSYNCG2-L Report Number GND1038AUT219-A IC ID 1422A-SYNCG2L
Tarang Wipro Technologies, SJP2, Survey#70,77,78/8A, Dodda Kanelli, Sarjapur road, Bangalore-560 035. Karnataka. India. Tel: +91-80-30298772 Fax: 91-80-28440054 E-mail: [email protected] This report must not be reproduced, except in full, without prior written permission from Tarang lab.
Page 83 of 84
Figure 103: Test setup for Radiated Emission (Horizontal polarization) – Above 1GHz
Figure 104: Test setup for Radiated Emission (Vertical polarization) – Above 1GHz
Date 16th Mar 2011 FCC ID KMHSYNCG2-L Report Number GND1038AUT219-A IC ID 1422A-SYNCG2L
Tarang Wipro Technologies, SJP2, Survey#70,77,78/8A, Dodda Kanelli, Sarjapur road, Bangalore-560 035. Karnataka. India. Tel: +91-80-30298772 Fax: 91-80-28440054 E-mail: [email protected] This report must not be reproduced, except in full, without prior written permission from Tarang lab.
Page 84 of 84
Figure 105: Test setup for Conducted measurements