Certification of the specific micropore volume and the...
43
Certification of the specific micropore volume and the median micropore width of two microporous reference materials according to Draft-DIN 66135-4 BCR-704 BCR-705 B. Röhl-Kuhn, P. Klobes, K. Meyer, P. Lorenz, B.M. Gawlik, A. Lamberty, H. Muntau Report EUR 21065
Transcript of Certification of the specific micropore volume and the...
Certification of the specific microporevolume and the median micropore widthof two microporous reference materials
according to Draft-DIN 66135-4
BCR-704BCR-705
B. Röhl-Kuhn, P. Klobes, K. Meyer, P. Lorenz,B.M. Gawlik, A. Lamberty, H. Muntau
Report EUR 21065

The mission of IRMM is to promote a common European measurement system in support of EUpolicies, especially health and consumer protection, environment, agriculture, internal market and
industrial standards.
European CommissionDirectorate-General Joint Research CentreInstitute for Reference Materials and Measurements
Contact informationEuropean CommissionDirectorate-General Joint Research CentreInstitute for Reference Materials and MeasurementsRetieseweg 111B-2440 Geel • Belgium
Tel.: +32 (0)14 571211Fax: +32 (0)14 590406
http://www.irmm.jrc.behttp://www.jrc.cec.eu.int
Legal NoticeNeither the European Commission nor any person acting on behalf of the Commission isresponsible for the use which might be made of the following information.
A great deal of additional information on the European Union is available on the Internet.It can be accessed through the Europa serverhttp://europa.eu.int
EUR Report 21065Luxembourg: Office for Official Publications of the European Communities
ISBN 92-894-7111-5
© European Communities, 2004
Reproduction is authorised provided the source is acknowledged
Printed in Belgium

European Commission
BCR informationREFERENCE MATERIALS
Certification of the specific microporevolume and the median micropore widthof two microporous reference materials
according to Draft-DIN 66135-4
B. Röhl-Kuhn, P. Klobes, K. Meyer, P. Lorenz
Federal Institute for Materials Research and Testing (BAM)D-12200 BERLIN (Germany
B.M. Gawlik, A. Lamberty
European Commission, DG Joint Research CentreInstitute for Reference Materials and Measurements (IRMM)
B-2440 GEEL (Belgium)
H. Muntau
Università degli Studi di Sassari, Sede Gemmata di NuoroI-08100 NUORO (Italy)
Re
po
rt E
UR
21
06
5 E
N

I
ABSTRACT
This report describes the certification of the specific micropore volume and the median
micropore width of two microporous reference materials (zeolites with 1-2 % clay as binder)according to Draft-DIN 66135-4 [1]. The adsorptive used for both materials was argon at the
temperature of liquid argon. The report contains all the results of the 10 participatinglaboratories using 12 instruments. Furthermore, the data concerning the homogeneity and thestability studies are summarised. The Langmuir specific surface area and the density
measured by helium gas pycnometry are given as indicative values.
Certified values were accompanied by an expanded uncertainty according to the requirements
laid down in the Guide for the Expression of Uncertainty in Measurement (GUM) [2].
BCR-704 (adsorption of argon at 87 K)(1)
Certified property Certified value(2)
Uncertainty(3)
Unit No. of data sets
Micropore volume 0.205 0.006 cm3 g
-112
Median micropore width 0.668 0.019 nm 12
BCR-705 (adsorption of argon at 87 K) (1)
Certified property Certifiedvalue(2)
Uncertainty(3)
Unit No. of data sets
Micropore volume 0.181 0.006 cm3 g
-112
Median micropore width 0.592 0.020 nm 12
(1) The results are specific to Draft DIN 66135-4
(2) This values are the unweighted mean of accepted means obtained independently by seven different laboratories
(3) Expanded uncertainty with a coverage factor of k=2 according to the GUM [2].
II
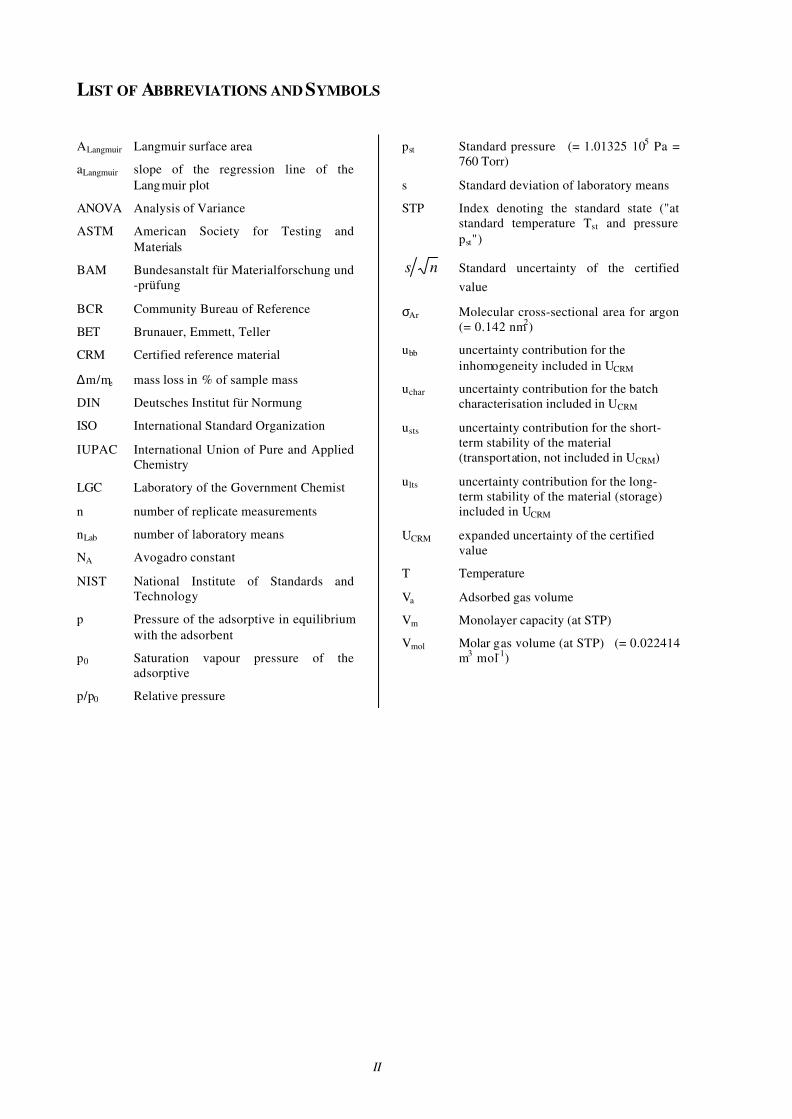
LIST OF ABBREVIATIONS AND SYMBOLS
ALangmuir Langmuir surface area
aLangmuir slope of the regression line of the
Langmuir plot
ANOVA Analysis of Variance
ASTM American Society for Testing and
Materials
BAM Bundesanstalt für Materialforschung und
-prüfung
BCR Community Bureau of Reference
BET Brunauer, Emmett, Teller
CRM Certified reference material
∆m/me mass loss in % of sample mass
DIN Deutsches Institut für Normung
ISO International Standard Organization
IUPAC International Union of Pure and Applied
Chemistry
LGC Laboratory of the Government Chemist
n number of replicate measurements
nLab number of laboratory means
NA Avogadro constant
NIST National Institute of Standards and
Technology
p Pressure of the adsorptive in equilibrium
with the adsorbent
p0 Saturation vapour pressure of the
adsorptive
p/p0 Relative pressure
pst Standard pressure (= 1.01325 105 Pa =
760 Torr)
s Standard deviation of laboratory means
STP Index denoting the standard state ("at
standard temperature Tst and pressure
pst")
ns Standard uncertainty of the certified
value
σAr Molecular cross-sectional area for argon
(= 0.142 nm2)
ubb uncertainty contribution for the
inhomogeneity included in UCRM
uchar uncertainty contribution for the batch
characterisation included in UCRM
usts uncertainty contribution for the short-
term stability of the material
(transportation, not included in UCRM)
ults uncertainty contribution for the long-
term stability of the material (storage)
included in UCRM
UCRM expanded uncertainty of the certified
value
T Temperature
Va Adsorbed gas volume
Vm Monolayer capacity (at STP)
Vmol Molar gas volume (at STP) (= 0.022414
m3 mol
-1)

III
TABLE OF CONTENTS
1. INTRODUCTION _________________________________________________________________5
2. PARTICIPATING LABORATORIES _________________________________________________8
3. SELECTION AND CHARACTERISATION OF THE CANDIDATE MATERIALS ____________9
3.1 THE NATURE OF THE STARTING MATERIALS _____________________________________________ 9
3.2 PHYSICAL AND CHEMICAL CHARACTERISATION OF THE MATERIALS____________________________ 9
3.2.1 Density ___________________________________________________________________9
3.2.2 Si/Al ratio of the zeolites BCR-704 and BCR-705 ____________________________________9
3.2.3 Thermogravimetric investigations _______________________________________________9
3.3 POROSITY CHARACTERISATION _____________________________________________________ 10
3.3.1 Methods used for the certification measurements ___________________________________10
3.3.2 Micropore measurements: Adsorption of argon at 87 K ______________________________11
4. OUTGASSING PROCEDURE ______________________________________________________13
5. HOMOGENISATION AND HOMOGENEITY TESTING________________________________14
6. STABILITY TESTING____________________________________________________________17
7. CERTIFICATION PROCEDURE ___________________________________________________19
7.1 SELECTION OF THE PARTICIPATING LABORATORIES_______________________________________ 19
7.2 RESULTS OF THE INTERLABORATORY TESTING __________________________________________ 19
7.2.1 Statistical analysis __________________________________________________________19
7.3 CERTIFIED VALUES AND UNCERTAINTIES ______________________________________________ 22
7.3.1 Uncertainty evaluation_______________________________________________________22
7.3.2 Uncertainty source “homogeneity” _____________________________________________22
7.3.3 Uncertainty source “stability” _________________________________________________23
7.3.4 Uncertainty source “batch characterisation”______________________________________23
7.3.5 Uncertainty budget _________________________________________________________23
7.3.6 Certified values ____________________________________________________________23
7.3.7 Indicative values ___________________________________________________________24
8. INSTRUCTIONS FOR USE ________________________________________________________25
9. REFERENCES __________________________________________________________________26
10. ANNEX I - DATA RECORDS FOR HOMOGENEITY AND STABILITY ___________________28
10.1 BCR-704 ___________________________________________________________________ 28
10.2 BCR-705 ___________________________________________________________________ 29
10.3 F-TEST FOR THE HOMOGENEITY TESTING____________________________________________ 31
10.3.1 Reference substance_________________________________________________________31
10.3.2 Calculation for BCR-704 _____________________________________________________32
10.3.3 Calculation for BCR-705 _____________________________________________________32
11. ANNEX II - DATA RECORDS FOR THE PROFICIENCY TESTING _____________________34
12. ANNEX III - DATA SETS FOR THE CERTIFICATION ________________________________36
12.1 MATERIAL BCR-704 ___________________________________________________________ 36
12.2 MATERIAL BCR-705 ___________________________________________________________ 37
13. ANNEX IV - INSTRUMENTS AND PRODUCERS _____________________________________39


5
1. INTRODUCTION
Porous and highly dispersed materials represent a specific state of solids and have
numerous applications in research and industry. Examples of applications are catalysts,pigments, building materials, and pharmaceutical products. Porous materials are of great
importance for the development and optimisation of such processes like sintering,chromatographic separation, and catalysed chemical reactions [3]. The development and
provision of porous certified reference materials (CRMs) according to the BCR guidelinesmake an important contribution to the comparability of experimental outcomes. CRMs arenecessary for the calibration of measurement instruments and the trueness of analytical
results. In contrast to the certification of the element contents of RMs in which the procedureinvolves mostly different independent methods to determine the true value, the certification of
the values of the specific surface area, pore size, and specific pore volume is methoddependent. The porous CRMs to be developed in the project described here are intended forthe method of gas adsorption which is based on the evaluation of measured adsorption
isotherms (primary data) [4] as depicted in Fig. 1.
Primary data:
Isotherms
Certified properties:
Micropore volume
Micropore width
Saito-Foley model
parameter values
Saito-Foley model
DIN 66135
Figure 1 - Adherence to standardised procedures for assuring traceability
p/p0
Figure 2 - Classification of isotherm types according to the IUPAC

6
Argon at its boiling point (87 K) is the adsorptive mostly used in connection with themicropore size analysis by means of the gas adsorption method. The method of gas adsorption
takes advantage of the fact that the interactions between inert gases and surfaces of solids areweak (physisorption). However, even with the most elaborate ab-initio methods of quantum
chemistry available today it is impossible to predict the adsorption behaviour of gases on realsolids. For the evaluation of the measured isotherms, it is necessary to chose among thevariety of evaluation procedures that procedure which is based on a theoretical model giving
the best description of the isotherm. Figure 2 shows the classification of the isothermsaccording to the IUPAC [5]. The following types may be distinguished:
- Type I: These isotherms are given by microporous solids having relatively small externalsurfaces (e.g. activated carbons, molecular sieve zeolites and certain porous oxides), the
limiting uptake being governed by the accessible micropore volume rather than by theinternal surface area.
- Type II: In general, this type is the normal form of isotherm obtained with a non-porous or
macroporous adsorbent. The Type II isotherm represents unrestricted monolayer-multilayer adsorption.
- Type III: Isotherms of this type are convex to the p/p0 axis over its entire range. They arenot common, but there are a number of systems (e.g. nitrogen on polyethylene) which giveisotherms with gradual curvature. In such cases, the adsorbate-adsorbate interactions play
an important role.
- Type IV: Characteristic features of these isotherms are its hysteresis loop, which is
associated with capillary condensation taking place in mesopores, and the limiting uptakeover a range of high p/p0. The initial part of the Type IV isotherm is attributed tomonolayer-multilayer adsorption since it follows the same path as the corresponding part
of a Type II isotherm obtained with the given adsorptive on the same surface area of theadsorbent in a non-porous form. Type IV isotherms are given by many mesoporous
industrial adsorbents.
- Type V: Such isotherms are uncommon; they are related to the Type III isotherm in thatthe adsorbent-adsorbate interaction is weak.
- Type VI: This type, in which the sharpness of the steps depends on the system and thetemperature, represents stepwise multilayer adsorption on a uniform non-porous surface.
The step-height now represents the monolayer capacity for each adsorbed layer and, in thesimplest case, remains nearly constant for two or three adsorbed layers. Amongst the bestexamples of Type VI isotherms are those obtained with argon or krypton on graphitised
carbon blacks at liquid nitrogen temperature.
Subdivisions of the types I, II, III, and IV have been developed by Roquerol et al. [6].
When developing certified reference materials for the pore analysis by the gas adsorption, twoimportant restrictive conditions must be taken into account. First, a general theory ofphysisorption for the entire p/p0 range does not exist. Furthermore, standardised evaluation
methods are available only for the isotherm types I, II, and IV of the IUPAC classification.Disperse and porous solids show fractal behaviour with respect to important pore properties
[7].
It follows from a) that the material to be certified must strictly be selected according to aisotherm type of the IUPAC classification.
From b) one concludes for example that the experimentally determined value of the specificsurface area for porous or highly dispersed solids depends on the size of the probe molecule
[8]. Therefore, a true or absolute value of the specific surface area does not exist forfundamental reasons. Hence, the traceability for certified porosity properties can only be
7
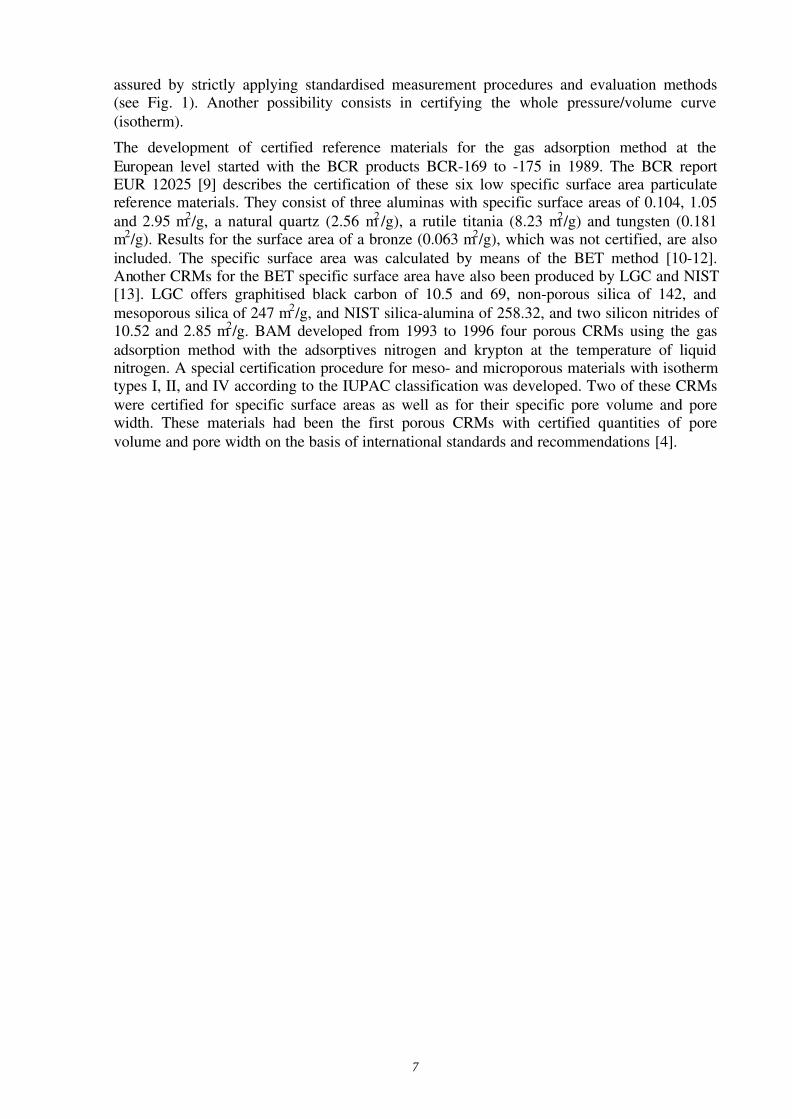
assured by strictly applying standardised measurement procedures and evaluation methods(see Fig. 1). Another possibility consists in certifying the whole pressure/volume curve
(isotherm).
The development of certified reference materials for the gas adsorption method at the
European level started with the BCR products BCR-169 to -175 in 1989. The BCR reportEUR 12025 [9] describes the certification of these six low specific surface area particulatereference materials. They consist of three aluminas with specific surface areas of 0.104, 1.05
and 2.95 m2/g, a natural quartz (2.56 m2 /g), a rutile titania (8.23 m2/g) and tungsten (0.181m2/g). Results for the surface area of a bronze (0.063 m2/g), which was not certified, are also
included. The specific surface area was calculated by means of the BET method [10-12].Another CRMs for the BET specific surface area have also been produced by LGC and NIST[13]. LGC offers graphitised black carbon of 10.5 and 69, non-porous silica of 142, and
mesoporous silica of 247 m2/g, and NIST silica-alumina of 258.32, and two silicon nitrides of10.52 and 2.85 m2/g. BAM developed from 1993 to 1996 four porous CRMs using the gas
adsorption method with the adsorptives nitrogen and krypton at the temperature of liquidnitrogen. A special certification procedure for meso- and microporous materials with isothermtypes I, II, and IV according to the IUPAC classification was developed. Two of these CRMs
were certified for specific surface areas as well as for their specific pore volume and porewidth. These materials had been the first porous CRMs with certified quantities of pore
volume and pore width on the basis of international standards and recommendations [4].

8
2. PARTICIPATING LABORATORIES
A total number of 10 laboratories from 6 European countries using 12 instruments (7
different types of instruments produced by 4 different companies, see Table A-15 in theAnnex) took part in the interlaboratory comparison. The Bundesanstalt für Materialforschung
und -prüfung (BAM) participated with 3 instruments (counted as 3 laboratories for thestatistical data evaluation).
Co-ordination
Bundesanstalt für Materialforschung und -prüfung (BAM), Berlin DE
Preparation of the materials
Merck KGaA, Darmstadt DE
Analyses
BP Chemicals Limited, Middlesex UK
Bundesanstalt für Materialforschung und -prüfung (BAM), Berlin DE
Centre de Thermodynamique et de Microcalorimétrie du C.N.R.S, Marseille FR
Delft University of Technology, Delft NL
Friedrich-Schiller-Universität Jena, Jena DE
Micromeritics Belgium, Diegem BE
Quantachrome GmbH, Odelzhausen DE
Universidad de Alicante, Alicante ES
Universität Erlangen-Nürnberg, Erlangen DE
Universiteit van Amsterdam, Amsterdam NL

9
3. SELECTION AND CHARACTERISATION OF THE CANDIDATE MATERIALS
3.1 The nature of the starting materials
The following substances manufactured by the company Merck KGaA were selected ascandidate materials:
1. for BCR-704: Faujasite type zeolite (FAU), a calcium aluminium silicate
2. for BCR-705: CaA-zeolite / Linde type A (LTA), a calcium exchanged sodium aluminium
silicate
These microporous materials are pelletised substances with a diameter of about 2 mm (bindercontent: 1 - 2 % clay). The pellets were not crushed.
The substances were homogenised by means of a tumbling drum mixer. The procedures forthe production including a special stabilisation of the materials and the homogenisation are
documented at Merck KGaA.
3.2 Physical and chemical characterisation of the materials
3.2.1 Density
The "apparent " density was determined by helium pycnometry at room-temperature (296 K =23 °C) after a drying at 393 K (= 120 °C) for 24 hours:
- BCR-704: 2.34 g/cm3
- BCR-705 :2.36 g/cm3
The term "apparent" density means the density of the material including closed and therefore
inaccessible pores. The gas used was dry helium with a purity not less than 99.99 %.
3.2.2 Si/Al ratio of the zeolites BCR-704 and BCR-705
The zeolites BCR-704 and BCR-705 were characterised by the Si/Al ratio. As a result of 29SiMAS NMR investigations, for the material BCR-705 a ratio of Si/Al = 1.0 was determined.
This is in accordance with the cell content of {Na12[Al12Si12O48] ? 27 H2O}8 for Linde type A(LTA) zeolites [14]. The Si/Al ratio for the material BCR-704, a faujasite type zeolite (FAU),was found to be Si/Al = 1.6 indicating a FAU specification type Y. The channels in these two
zeolite materials (crystallographic free diameters determined by X-ray diffraction) are forBCR-704 (FAU) about 0.74 nm and for BCR-705 (Ca-exchanged LTA) about 0.5 nm [14].
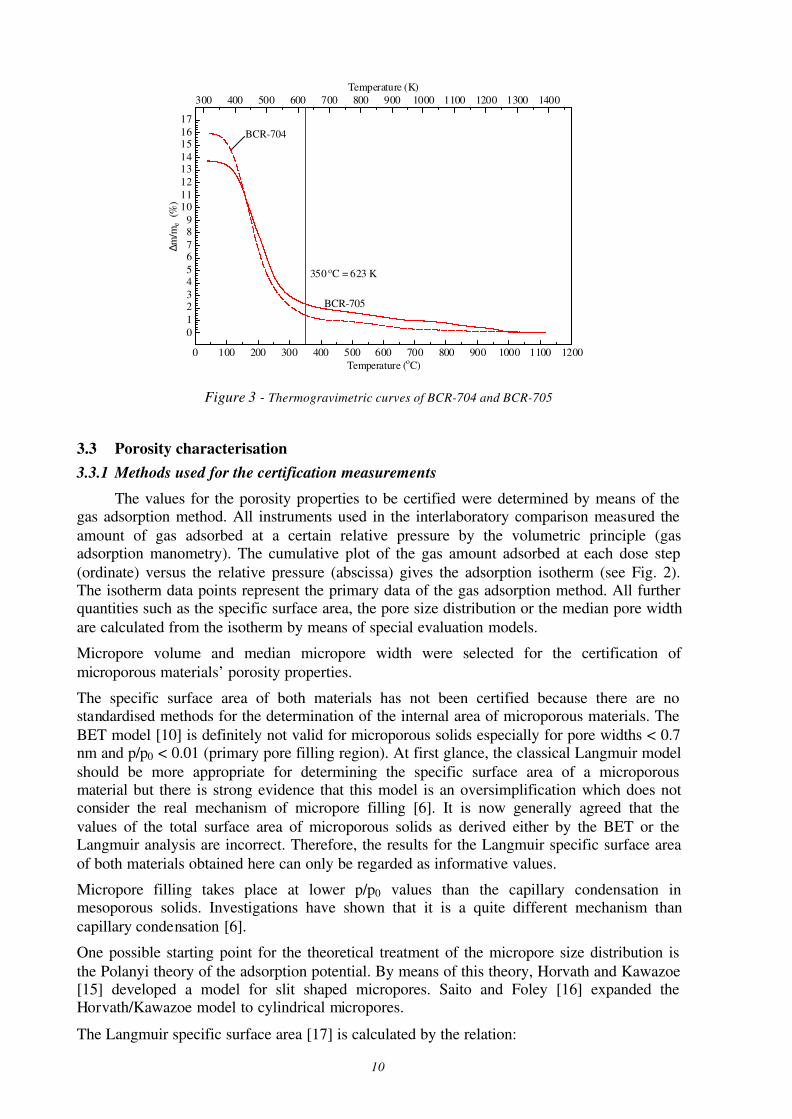
3.2.3 Thermogravimetric investigations
Thermogravimetric investigations of the candidate materials are necessary to develop an
optimum outgassing procedure for the products. Figure 3 contains the thermogravimetriccurves of the two zeolites BCR-704 and BCR-705.
10
0 100 200 300 400 500 600 700 800 900 1000 1100 1200
Temperature (oC)
300 400 500 600 700 800 900 1000 1100 1200 1300 1400
Temperature (K)
0
1
23
45
67
89
1011
12
1314
1516
17
∆m/m
e (%
)Molecular Sieve 0.5Molecular Sieve 0.5
Molecular Sieve 1.0Molecular Sieve 1.0
350 oC = 623 K350 oC = 623 K
BCR-704
Figure 3 - Thermogravimetric curves of BCR-704 and BCR-705
3.3 Porosity characterisation
3.3.1 Methods used for the certification measurements
The values for the porosity properties to be certified were determined by means of thegas adsorption method. All instruments used in the interlaboratory comparison measured the
amount of gas adsorbed at a certain relative pressure by the volumetric principle (gasadsorption manometry). The cumulative plot of the gas amount adsorbed at each dose step
(ordinate) versus the relative pressure (abscissa) gives the adsorption isotherm (see Fig. 2).The isotherm data points represent the primary data of the gas adsorption method. All furtherquantities such as the specific surface area, the pore size distribution or the median pore width
are calculated from the isotherm by means of special evaluation models.
Micropore volume and median micropore width were selected for the certification of
microporous materials’ porosity properties.
The specific surface area of both materials has not been certified because there are nostandardised methods for the determination of the internal area of microporous materials. The
BET model [10] is definitely not valid for microporous solids especially for pore widths < 0.7nm and p/p0 < 0.01 (primary pore filling region). At first glance, the classical Langmuir model
should be more appropriate for determining the specific surface area of a microporousmaterial but there is strong evidence that this model is an oversimplification which does notconsider the real mechanism of micropore filling [6]. It is now generally agreed that the
values of the total surface area of microporous solids as derived either by the BET or theLangmuir analysis are incorrect. Therefore, the results for the Langmuir specific surface area
of both materials obtained here can only be regarded as informative values.
Micropore filling takes place at lower p/p0 values than the capillary condensation inmesoporous solids. Investigations have shown that it is a quite different mechanism than
capillary condensation [6].
One possible starting point for the theoretical treatment of the micropore size distribution is
the Polanyi theory of the adsorption potential. By means of this theory, Horvath and Kawazoe[15] developed a model for slit shaped micropores. Saito and Foley [16] expanded theHorvath/Kawazoe model to cylindrical micropores.
The Langmuir specific surface area [17] is calculated by the relation:
BCR-705

11
ALangmuir = σAr ?NA?Vm / Vmol (1)
The monolayer capacity Vm (in cm3 g-1 STP) is obtainable from the slope aLangmuir of the linearregression plot of the transformed isotherm points (the so called Langmuir plot) in which the
values (p/p0)/Va are plotted as a function of the relative pressure p/p0 in the range from 1?10-6
to 0.030 (valid for argon).
Vm = 1/aLangmuir (2)
The molecular cross sectional area used for argon is σAr = 0.142 nm2.
The micropore volume and the median micropore width were calculated using the model of
Saito and Foley as described in the standard DIN 66135-4 [1]. For the calculation, thefollowing values for the model parameters given in Table 1 were used:
Table 1 - Values for the Saito-Foley model parameters [16]
Parameter Adsorbent (oxide ion) Adsorptive (argon) Unit
Temperature T – 87.3 K
Diameter d 0.276 0.336 nm
Polarisability α 2.5?10-24 1.63 10-24 cm3
Magnetic susceptibility χ 1.3?10-29 3.25 10-29 cm3
Density per unit area N 1.31?1015 8.52 1014 (molecules/cm2)
3.3.2 Micropore measurements: Adsorption of argon at 87 K
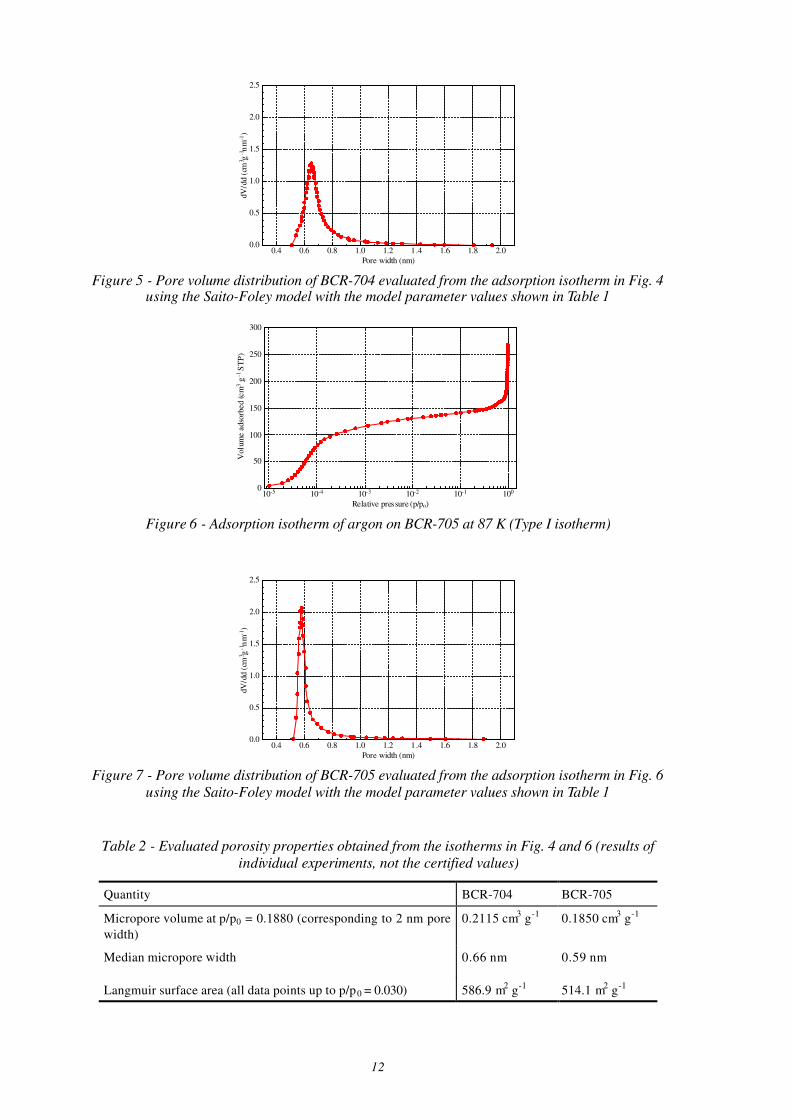
The isotherms and the micropore volume distributions of single measurements on BCR-704and BCR-705 are shown in Figs. 4 to 7 and in Table 2. The porosity data evaluated from theseindividual measurements are summarised in Table 2. Note that the data in Table 2 are not the
certified values. Dry argon (not less than 99.99 % purity) was used as adsorptive and for thecooling bath (liquid argon not less than 99 % purity).
10-5 10-4 10-3 10-2 10-1 100
Relative pressure (p/po)
0
50
100
150
200
250
300
Volu
me a
dso
rbed (cm
3 g
-1 S
TP
)
Figure 4 - Adsorption isotherm of argon on BCR-704 at 87 K (Type I isotherm)
12
0.4 0.6 0.8 1.0 1.2 1.4 1.6 1.8 2.0
Pore width (nm)
0.0
0.5
1.0
1.5
2.0
2.5
dV
/dd (
cm3 g
-1n
m-1
)
Figure 5 - Pore volume distribution of BCR-704 evaluated from the adsorption isotherm in Fig. 4using the Saito-Foley model with the model parameter values shown in Table 1
10-5 10-4 10-3 10-2 10-1 100
Relative pressure (p/po)
0
50
100
150
200
250
300
Volu
me a
dso
rbed (cm
3 g
-1 S
TP
)
Figure 6 - Adsorption isotherm of argon on BCR-705 at 87 K (Type I isotherm)
0.4 0.6 0.8 1.0 1.2 1.4 1.6 1.8 2.0
Pore width (nm)
0.0
0.5
1.0
1.5
2.0
2.5
dV
/dd (
cm3 g
-1n
m-1
)
Figure 7 - Pore volume distribution of BCR-705 evaluated from the adsorption isotherm in Fig. 6
using the Saito-Foley model with the model parameter values shown in Table 1
Table 2 - Evaluated porosity properties obtained from the isotherms in Fig. 4 and 6 (results of
individual experiments, not the certified values)
Quantity BCR-704 BCR-705
Micropore volume at p/p0 = 0.1880 (corresponding to 2 nm pore
width)
0.2115 cm3 g
-10.1850 cm
3 g
-1
Median micropore width 0.66 nm 0.59 nm
Langmuir surface area (all data points up to p/p0 = 0.030) 586.9 m2 g
-1514.1 m
2 g
-1

13
4. OUTGASING PROCEDURE
Before measuring physisorption isotherms it is very important to remove adsorbed gases
and humidity from the surface area of the materials, in order to receive a clean and "free"surface area without adsorbed layers. On the basis of the thermogravimetric investigations
(see Fig. 3), the following outgasing procedure for the selected candidate materials has beenapplied.
Starting at room temperature, the zeolites are to be heated up to about 350 K (≈ 80 °C) under
vacuum. When a residual pressure of 10-2 Pa or lower has been achieved at 350 K (≈ 80 °C),
carefully increase the temperature up to 390 K (≈ 120 °C) at about one Kelvin per minute. In
this temperature interval the main portion of water is expelled. When a residual pressure of
10-2 Pa or lower has been achieved, heat in vacuum up to 620 K (≈ 350 °C) in steps of 50 K
per 30 minutes. After a residual pressure of 10-2 Pa or lower has been reached at 620 K (≈350 °C), continue evacuating at 620 K (≈ 350 °C) for between 5 and 16 hours (overnight).
Because it is not desirable to contaminate the analysis manifold with water vapour, it is
preferable to outgas in a separate manifold. However, if outgasing has been carried outseparately, a re-outgasing of the sample on the analysis port may be required (620 K) after the
sample has been transferred from the degas port (see Fig. 8).
0 1 2 3 4 5 6 7 8 9 10Time (hours)
300
350
400
450
500
550
600
650
Tem
pera
ture
(K
)
Figure 8 - Heating curve for the pretreatment of BCR-704 and BCR-705 samples
14
5. HOMOGENISATION AND HOMOGENEITY TESTING
Reference materials (RMs) of any type must be sufficiently uniform (homogeneous)
regarding the certified properties when subsampled. In other words, the between-samplevariation in properties of the samples should be as low as possible. The minimisation of the
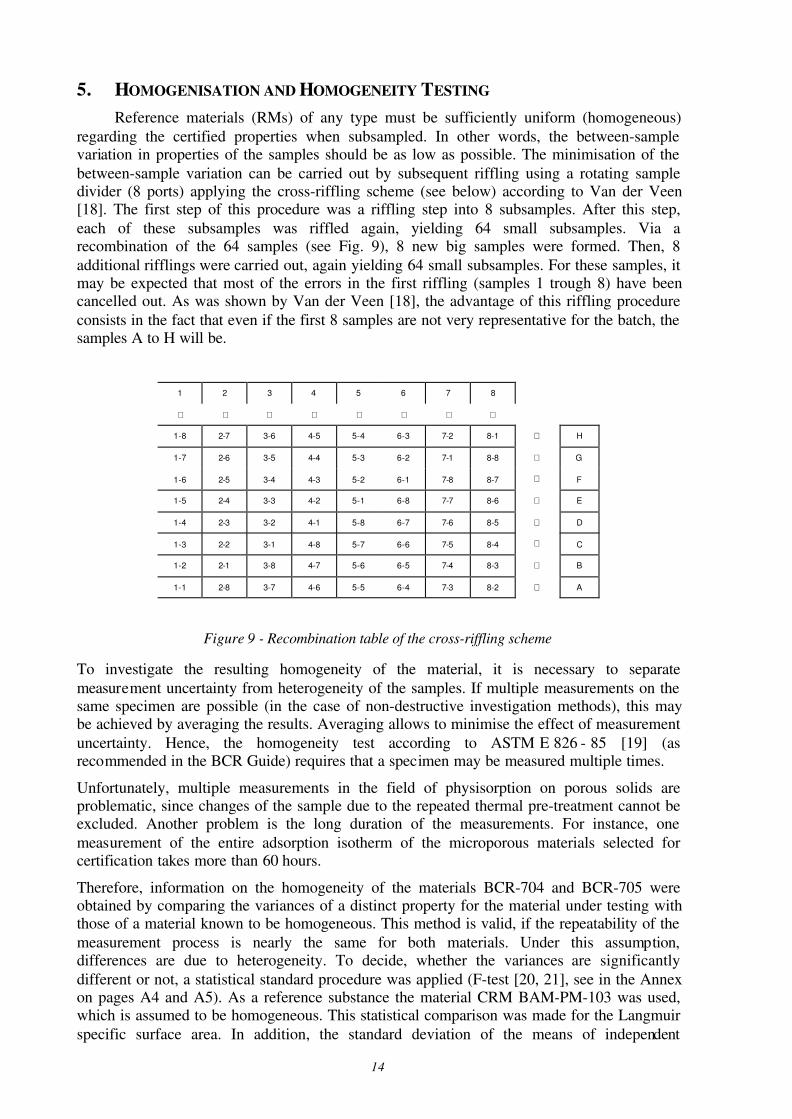
between-sample variation can be carried out by subsequent riffling using a rotating sampledivider (8 ports) applying the cross-riffling scheme (see below) according to Van der Veen[18]. The first step of this procedure was a riffling step into 8 subsamples. After this step,
each of these subsamples was riffled again, yielding 64 small subsamples. Via arecombination of the 64 samples (see Fig. 9), 8 new big samples were formed. Then, 8
additional rifflings were carried out, again yielding 64 small subsamples. For these samples, itmay be expected that most of the errors in the first riffling (samples 1 trough 8) have beencancelled out. As was shown by Van der Veen [18], the advantage of this riffling procedure
consists in the fact that even if the first 8 samples are not very representative for the batch, thesamples A to H will be.
1 2 3 4 5 6 7 8
⇓ ⇓ ⇓ ⇓ ⇓ ⇓ ⇓ ⇓
1-8 2-7 3-6 4-5 5-4 6-3 7-2 8-1 ⇒ H
1-7 2-6 3-5 4-4 5-3 6-2 7-1 8-8 ⇒ G
1-6 2-5 3-4 4-3 5-2 6-1 7-8 8-7 ⇒ F
1-5 2-4 3-3 4-2 5-1 6-8 7-7 8-6 ⇒ E
1-4 2-3 3-2 4-1 5-8 6-7 7-6 8-5 ⇒ D
1-3 2-2 3-1 4-8 5-7 6-6 7-5 8-4 ⇒ C
1-2 2-1 3-8 4-7 5-6 6-5 7-4 8-3 ⇒ B
1-1 2-8 3-7 4-6 5-5 6-4 7-3 8-2 ⇒ A
Figure 9 - Recombination table of the cross-riffling scheme
To investigate the resulting homogeneity of the material, it is necessary to separate
measurement uncertainty from heterogeneity of the samples. If multiple measurements on thesame specimen are possible (in the case of non-destructive investigation methods), this maybe achieved by averaging the results. Averaging allows to minimise the effect of measurement
uncertainty. Hence, the homogeneity test according to ASTM E 826 - 85 [19] (asrecommended in the BCR Guide) requires that a specimen may be measured multiple times.
Unfortunately, multiple measurements in the field of physisorption on porous solids areproblematic, since changes of the sample due to the repeated thermal pre-treatment cannot beexcluded. Another problem is the long duration of the measurements. For instance, one
measurement of the entire adsorption isotherm of the microporous materials selected forcertification takes more than 60 hours.
Therefore, information on the homogeneity of the materials BCR-704 and BCR-705 wereobtained by comparing the variances of a distinct property for the material under testing withthose of a material known to be homogeneous. This method is valid, if the repeatability of the
measurement process is nearly the same for both materials. Under this assumption,differences are due to heterogeneity. To decide, whether the variances are significantly
different or not, a statistical standard procedure was applied (F-test [20, 21], see in the Annexon pages A4 and A5). As a reference substance the material CRM BAM-PM-103 was used,which is assumed to be homogeneous. This statistical comparison was made for the Langmuir
specific surface area. In addition, the standard deviation of the means of independent

15
determinations of a distinct property carried out with the same instrument was compared withthe standard deviation for the same property resulting from the interlaboratory testing. The
values of the standard deviation of various measuring series for the Langmuir specific surfacearea, the micropore volume, and the median micropore width are shown in Tables 3-5.
The comparison between the variation coefficients of the Langmuir surface area of the bothmaterials and that of the reference substance by the F-test method (see pages A4 and A5 in theAnnex) indicates that BCR-704 is at least as homogeneous as the reference substance,
whereas BCR-705 is less homogeneous than the reference substance. But it can be concludedfrom Tables 3-5 that the standard deviation due to heterogeneity is small compared to s of the
interlaboratory testing. This is true for all three of the porosity properties under test. Hence,both candidate materials can be regarded as sufficiently homogeneous for the certification. Inorder to comply with the latest requirements in the field of Certification of Reference
Materials, the data in Annex I were used to derive an uncertainty contribution accounting forhomogeneity related variations. For further details refer to Chapter 7.
Table 3 - Standard deviation of test measurements of the Micropore volume in relation to s (standard
deviation of means) from the interlaboratory testing
Substance Data record s of data record
(cm3 g
-1)
s from interlaboratory
testing (cm3 g
-1)
BCR-704 BCR-704-1 0.001066
BCR-704-2 0.000922
BCR-704-3 0.00247
0.0088
BCR-705 BCR-705-1 0.001057
BCR-705-2 0.002179
BCR-705-3 0.001760
0.0065
Table 4 - Standard deviation of test measurements of the Median micropore width
in relation to s (standard deviation of means) from the interlaboratory testing
Substance Data record s of data record
(nm)
s from interlaboratory
testing (nm)
BCR-704 BCR-704-1 0.001216
BCR-704-2 0.000453
BCR-704-3 0.000610
0.0087
BCR-705 BCR-705-1 0.019526
BCR-705-2 0.001457
BCR-705-3 0.000346
0.0113
16
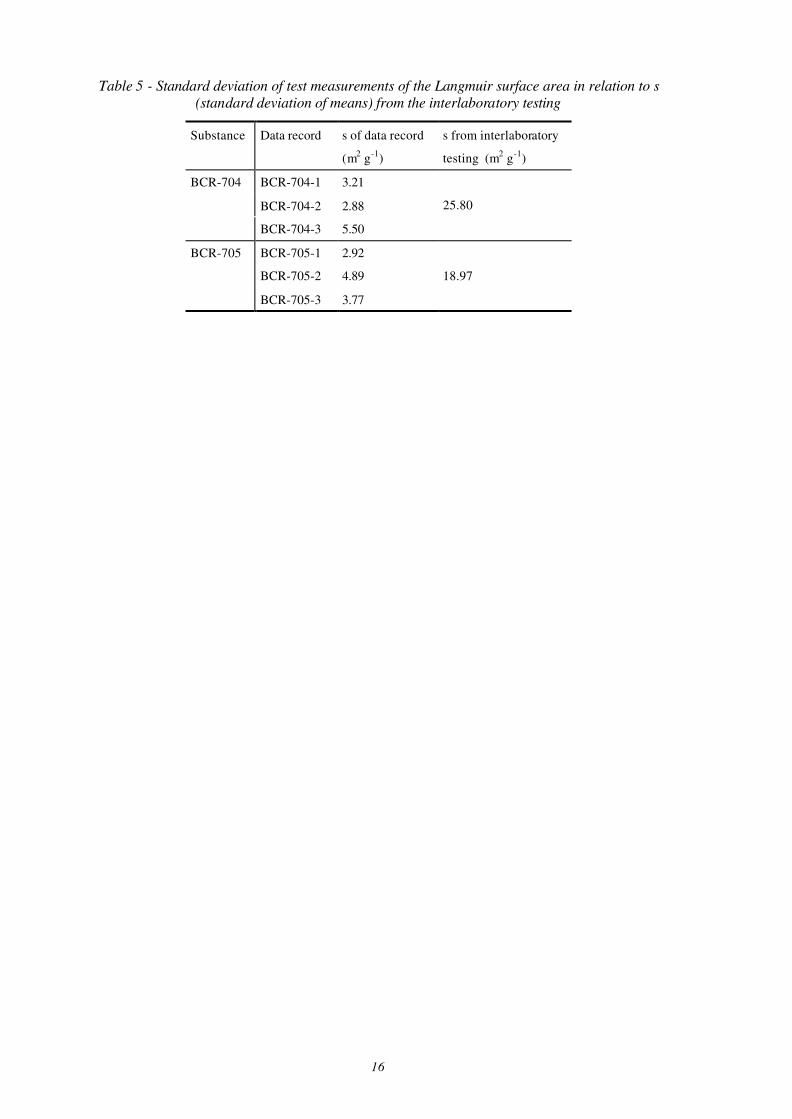
Table 5 - Standard deviation of test measurements of the Langmuir surface area in relation to s
(standard deviation of means) from the interlaboratory testing
Substance Data record s of data record
(m2 g
-1)
s from interlaboratory
testing (m2 g
-1)
BCR-704 BCR-704-1 3.21
BCR-704-2 2.88
BCR-704-3 5.50
25.80
BCR-705 BCR-705-1 2.92
BCR-705-2 4.89
BCR-705-3 3.77
18.97

17
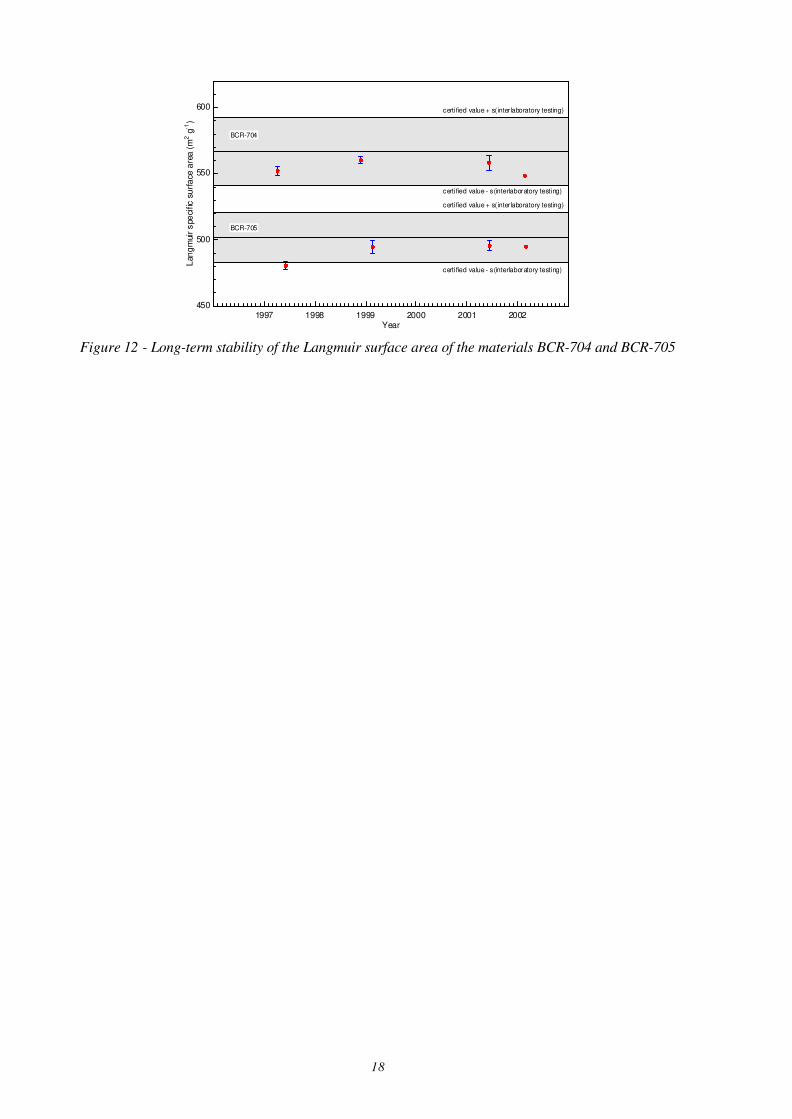
6. STABILITY TESTING
For monitoring the stability of the materials regarding their porosity properties, the
results of the test measurements were plotted in graphs with the time as abscissa (see Figs. 10-12). For comparison, in these graphs the certified values and the standard deviations from the
interlaboratory testing are also presented. As it can be seen from the diagrams, all means ofthe test measurements (except that for the median pore width of the 1997 test series1) are lying
within the ± s boundaries (standard deviation of means) from the interlaboratory testing.
Furthermore, there is no clear drift. Therefore, the materials BCR-704 and BCR-705 can beregarded as sufficiently stable. In order to comply with the latest requirements in the field of
Certification of Reference Materials, the data in Annex I were used to derive an uncertaintycontribution accounting for stability-related variations. For further details refer to Chapter 7.
1997 1998 1999 2000 2001 2002Year
0.15
0.16
0.17
0.19
0.20
0.21
0.23
Mic
ro p
ore
vo
lum
e (
cm3/g
) BCR-704BCR-704
BCR-705BCR-705
certified value + s(interlaboratory testing)certified value + s(interlaboratory testing)
certified value - s(interlaboratory testing)certified value - s(interlaboratory testing)
certified value + s(interlaboratory testing)certified value + s(interlaboratory testing)
certified value - s(interlaboratory testing)certified value - s(interlaboratory testing)
Figure 10 - Long- term stability of the micropore volume of the materials BCR-704 and BCR-705
1997 1998 1999 2000 2001 2002Year
0.55
0.60
0.65
0.70
Me
dia
n p
ore
wid
th (
nm)
BCR-704BCR-704
BCR-705BCR-705
certified value + s(interlaboratory testing)certified value + s(interlaboratory testing)
certified value - s(interlaboratory testing)certified value - s(interlaboratory testing)
certified value + s(interlaboratory testing)certified value + s(interlaboratory testing)
certified value - s(interlaboratory testing)certified value - s(interlaboratory testing)
Figure 11 - Long-term stability of the median micropore widths of the materials BCR-704 and BCR-
705. Note that due to the insufficient measuring range of the isotherms (only up to p/p0 = 0.015
instead of 0.030) the value of the BCR-705 standard deviation for the 1997 measurements is not
comparable with the other standard deviations in this graph.
1 The BCR-705 standard deviation for the 1997 measurements is too big due to the insufficient measuring range
of the isotherms (only up to p/p0 = 0.015 instead of 0.030). Therefore, it is not comparable with the other
standard deviations in Fig. 11.
18
1997 1998 1999 2000 2001 2002Year
450
500
550
600
Lan
gm
uir
spe
cific
su
rfa
ce a
rea
(m
2 g
-1)
certified value + s( inter laboratory testing)certified value + s( inter laboratory testing)
certified value - s(interlaboratory testing)certified value - s(interlaboratory testing)
certified value + s( inter laboratory testing)certified value + s( inter laboratory testing)
certified value - s(interlaboratory testing)certified value - s(interlaboratory testing)
BCR-704BCR-704
BCR-705BCR-705
Figure 12 - Long-term stability of the Langmuir surface area of the materials BCR-704 and BCR-705

19
7. CERTIFICATION PROCEDURE
The certification was carried out according to the BCR guidelines [22] and the relevant
ISO guides [23 - 28].
7.1 Selection of the participating laboratories
For testing the measurement capability of the participating laboratories in the field ofmicropore analysis a proficiency test [29] was arranged. For micropores, no certified
reference materials were available. Therefore, an internal test substance (Zeolite 13X)provided by Micromeritics was used as microporous test substance B. As a reference value forsubstance B, the Langmuir specific surface area was determined from physisorption isotherms
(argon/liquid argon at 87 K) by measurements at BAM and Micromeritics using 6 differentinstruments. The data sets are given in Table A-7 in the Annex.
Laboratory500
550
600
650
700
Langm
uir s
urf
ace a
rea (
m2 g
-1)
reference valuereference value
tolerance intervaltolerance interval
tolerance intervaltolerance interval
0101 0303 0505 0707 0909 1212 1717 2121 2222 303019190606
Figure 13 - Results of the proficiency test
Each of the 12 laboratories passed the proficiency test for microporous materials. All of thelaboratory means of the Langmuir specific surface area were within the tolerance interval (seeFig. 13). The Langmuir surface area values were calculated from the isotherm data points
measured by the participants using a software package developed by the co-ordinator.
7.2 Results of the interlaboratory testing
The values of the porosity properties micropore volume, median micropore width, andLangmuir surface area were calculated by means of a software package of the co-ordinator.The data records for the statistical analysis are given in the Tables A-9 to A-14 in the Annex.
7.2.1 Statistical analysis
Because of using different instruments by the laboratories, very heterogeneous standarddeviations were observed. Hence, the "no pooling" option of the BCR recommendations wasapplied.

20
The procedure was:
- No outlier test for the standard deviations and no ANOVA, since, as mentioned above,
various instruments were used, and heteroscedastic data were assumed a priori.
- The laboratories with only one result value per property to be certified were eliminated
because a laboratory mean value was needed.
- Determination of the standard deviation, and a 95 % content tolerance interval at 95 %certainty for the laboratory means.
- Calculation of the certified value (average of laboratory averages).
- Determination of the uncertainty of the certified value (expanded uncertainty according to
the GUM including contributions from batch characterisation, homogeneity and stability;coverage factor k=2).
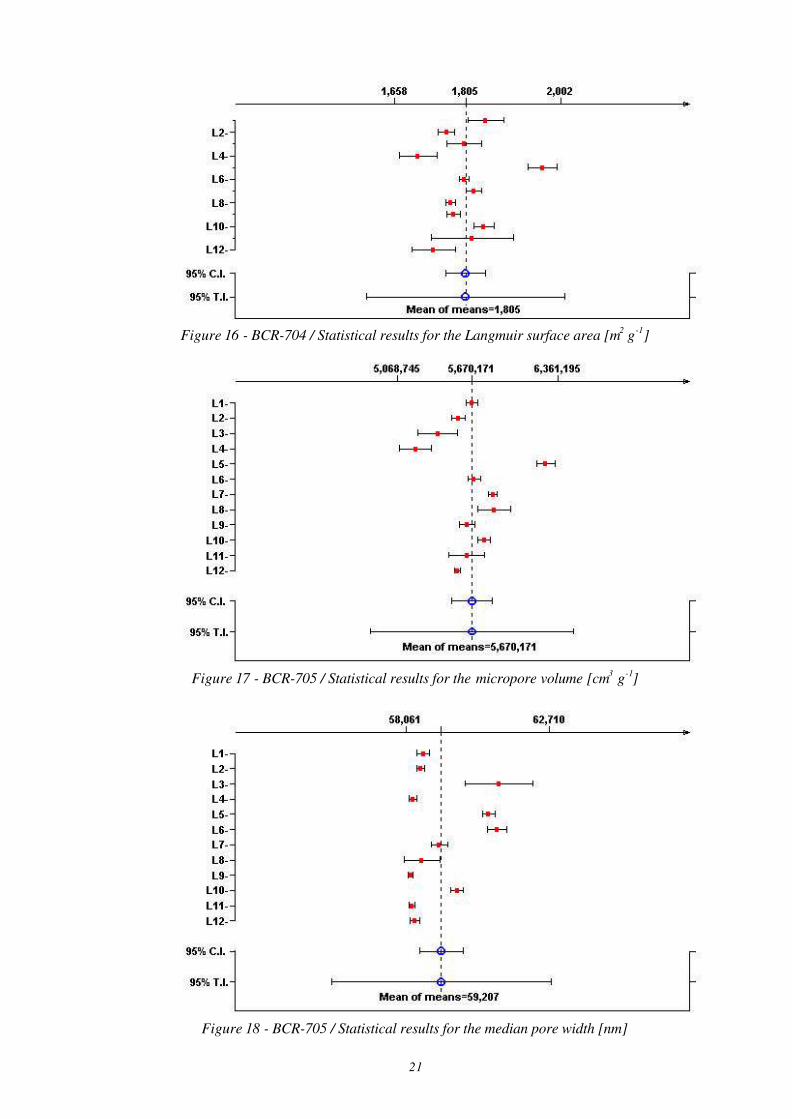
The results of the statistical data analysis are represented in Figs. 14 to 19. The standardgraphics output created using the BCR programme SoftCRM 1.0.2 displays the laboratory
means with error bars specifying the 95 % confidence interval for each laboratory.
Additionally, the certified value x , its 95 % confidence interval (95 % C.I.) and its 95 %tolerance interval (95 % T.I.) are drawn. The numbers in the graphs are in SoftCRM 1.0.2
notation. For the key to the laboratory numbers see the first column in each of thecorresponding Tables A-9 to A-14 in the Annex.
Figure 14 - BCR-704 / Statistical results for the micropore volume [cm3 g
-1]
Figure 15 - BCR-704 / Statistical results for the median pore width [nm]
21
Figure 16 - BCR-704 / Statistical results for the Langmuir surface area [m2 g
-1]
Figure 17 - BCR-705 / Statistical results for the micropore volume [cm3 g
-1]
Figure 18 - BCR-705 / Statistical results for the median pore width [nm]

22
Figure 19 - BCR-705 / Statistical results for the Langmuir surface area [m2 g
-1]
7.3 Certified values and uncertainties
The uncertainty evaluation described hereafter is based on a concept described by
Pauwels et al. [30 and literature cited] and uses available data discussed in the previouschapters.
7.3.1 Uncertainty evaluation
Based on the data obtained in the stability and homogeneity studies as well as the results
in the batch characterisation estimates for ubb (homogeneity), ults (long-term-stability) anduchar (batch characterisation) were obtained and combined according the fo llowing equation:
2222 charltsbbCRM uuuU ++⋅=
Due to the transport conditions selected for dispatch, the uncertainty constituent for short-termstabililty (usts) is negligible and consequently not included in the overall uncertainty. The
estimation of the other uncertainty sources is described below.
7.3.2 Uncertainty source “homogeneity”
The homogeneity study is described in chapter 5. From these data (Annex I), anestimation of ubb was derived from the homogeneity study as described by Linsinger et al.
[31]. An one-way ANOVA was performed on the data of Annex I. According to thisapproach, sbb (being the standard deviation between units) or u*bb (being the upper limit of
inhomogeneity that can be hidden by the method repeatability) are used as estimates of ubb.Values for sbb and u*
bb were calculated accordingly:
n
MSMSs withinbetween
bb
−=
and

23
4* 2
MSwithin
within
bbn
MSu
ν⋅= ,
where n is the number of replicates per unit, MSwithin and MSbetween the respective mean-of-squares from the ANOVA and νMSwithin the degrees of freedom of MSwithin. If the value of sbb is
below the minimum value as determined by the repeatability of the method and the number ofreplicates performed, u*
bb is used to estimate ubb.
7.3.3 Uncertainty source “stability”
Similarly, a quantitative estimate of the uncertainty related to stability, ults, was obtained
plotting the shelf-life as described elsewhere [31]. The uncertainty was estimated for a shelf-life of 60 months. Appropriate isochronous stability studies have been started while this reportis being printed. These studies will allow a confirmation of the forecasted shelf-life.
The estimated uncertainty contribution, ults, which is included in the combined and expandeduncertainties of the certified values, will be used to establish an expiry date of the certificate.
Please refer to the certificate for further details.
7.3.4 Uncertainty source “batch characterisation”
An estimate for uchar was derived from the standard error obtained on the mean oflaboratories means.
7.3.5 Uncertainty budget
Based on these uncertainty contributions the following uncertainty budget is
established:
Table 6 – Uncertainty budgets for BCR-704 and BCR-705. As a rule higher values of sbb and u*
bb were
included in the uncertainty budget
BCR-704 BCR-705
Property value Micropore
Volume cm3/g
Median
micropore width nm
Micropore
Volume cm3/g
Median
micropore width nm
Mean value 0.2054 0.6677 0.1805 0.5921
uchar (%) 1.34 0.92 1.04 0.55
sbb (%) 6.36 0.93 6.13 Not calculable
u*bb (%) 0.11 0.02 0.24 0.52
ults (%), 60 months 0.45 0.46 0.90 1.49
UCRM (%) 2.95 2.77 3.37 3.34
UCRM 0.006058 0.018518 0.006076 0.019791
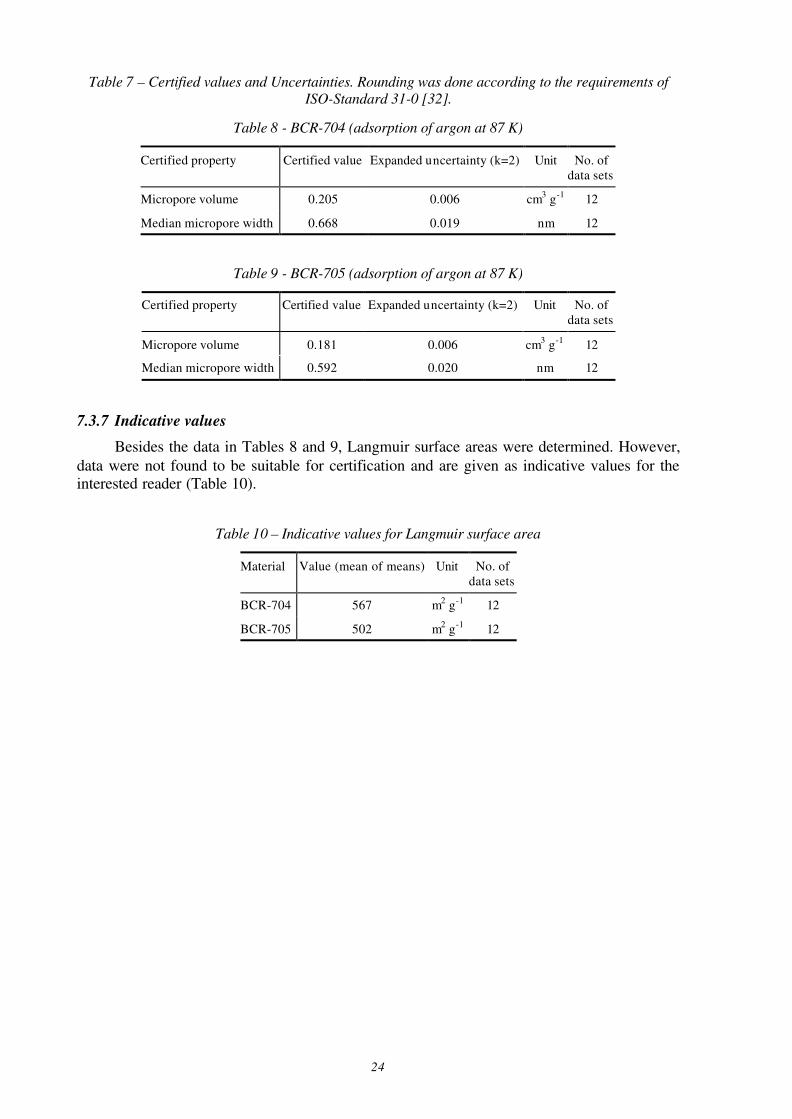
7.3.6 Certified values
The certified values and their associated uncertainties are given in the tables below.
Expanded uncertainties (coverage factor k=2) were expressed according to the Guide for theExpression of Uncertainties in Measurement (GUM) [2].
24
Table 7 – Certified values and Uncertainties. Rounding was done according to the requirements of
ISO-Standard 31-0 [32].
Table 8 - BCR-704 (adsorption of argon at 87 K)
Certified property Certified value Expanded uncertainty (k=2) Unit No. of
data sets
Micropore volume 0.205 0.006 cm3 g
-112
Median micropore width 0.668 0.019 nm 12
Table 9 - BCR-705 (adsorption of argon at 87 K)
Certified property Certified value Expanded uncertainty (k=2) Unit No. of
data sets
Micropore volume 0.181 0.006 cm3 g
-112
Median micropore width 0.592 0.020 nm 12
7.3.7 Indicative values
Besides the data in Tables 8 and 9, Langmuir surface areas were determined. However,
data were not found to be suitable for certification and are given as indicative values for theinterested reader (Table 10).
Table 10 – Indicative values for Langmuir surface area
Material Value (mean of means) Unit No. of
data sets
BCR-704 567 m2 g
-112
BCR-705 502 m2 g
-112

25
8. INSTRUCTIONS FOR USE
The sample mass to be analysed should be about 0.2 g, depending on the instrument
used (see instructions of instrument producer). Before using BCR-704 and BCR-705, anoutgasing procedure is necessary:
Starting at room temperature, the zeolites are to be heated up to about 350 K (≈ 80 °C) under
vacuum. When a residual pressure of 10-2 Pa or lower has been achieved at 350 K (≈ 80 °C),
carefully increase the temperature up to 390 K (≈ 120 °C) with a rate of about one Kelvin per
minute. In this temperature range the main portion of water is expelled. When a residual
pressure of 10-2 Pa or lower has been achieved, heat in vacuum up to 620 K (≈ 350 °C) in
steps of 50 K per half an hour. After a residual pressure of 10-2 Pa or lower has been reached
at 620 K (≈ 350 °C), continue evacuating at 620 K (≈ 350 °C) for at least 5 hours.
Before starting the adsorption measurement, the samples have to be sufficiently degased. To
avoid contamining the analysis manifold with water vapour, it is preferable to outgas on aseparate manifold. However, if outgassing has been carried out separately, a re-outgasing of
the sample on the analysis port may be required (620 K) after the sample has been transferredacross.
Attention: Do not use helium to determine the system volume (dead space / free space) until
the adsorption measurement is complete.
The material should be stored at normal temperature (20 - 25 °C).

26
9. REFERENCES
[1] DIN (2002). DIN 66135-4 (Norm-Entwurf). Partikelmesstechnik –
Mikroporenanalyse mittels Gasadsorption – Teil 4: Bestimmung der Porenverteilung
nach Horvath-Kawazoe and Saito-Foley. Ausgabe 2002-08.
[2] ISO-IEC-BIPM-IFCC-IUPAC-IUPAP-OIML. Guide to the Expression of
Uncertainties in Measurement (GUM), Geneva, Switzerland (ISBN 92-67-10188-9).
[3] Meyer, K.; Lorenz, P.; Röhl-Kuhn, B.; Klobes, P.: Porous Solids and theirCharacterization. Methods of Investigation and Application. Cryst. Res. Technol. 29
(1994) 903-930.
[4] Röhl-Kuhn, B.; Meyer, K.; Klobes, P.; Fritz, Th.: Development of Porous andDispersed CRM. Fresenius J. Anal. Chem. 360 (1998) 393-397.
[5] Sing, K. S. W.; Everett, D. H.; Haul, R. A. W.; Moscou, L.; Pierotti, R. A.;Rouquérol, J.; Siemieniewska, T.: Reporting Physisorption Data for Gas/SolidSystems with Special Reference to the Determination of Surface Area and Porosity
(Recommendations 1984). Pure & Appl. Chem. 57 (1985) 603-619.
[6] F. Roquerol, J. Roquerol, K.S.W. Sing. Adsorption by Powder and Porous Solids,
Academic Press 1999.
[7] Avnir, D.: The fractal approach to Heterogenous Chemistry. John Wiley & Sons,Chichester 1989.
[8] Mc Clellan, A. L.; Harnsberger, H. F.: J. Coll. Interf. Science 23 (1967) 577-599.
[9] Wilson, R.; Havard, D. C.; Gould, D.: The certification of the nitrogen bet specific
surface areas of six materials in the range of 0.1 to 8 m2g-1, CRM 169, 170, 171, 172,
173 and 175. European Commission. EUR 12025 EN, 1989.
[10] Brunauer, S.; Emmett, P. H.; Teller, E.: Adsorption of Gases in Multimolecular
Layers. J. Amer. Chem. Soc. 60 (1938) 309-319.
[11] DIN 66131: 1993 Determination of specific surface area of solids by gas adsorption
using method of Brunauer, Emmett and Teller (BET)
[12] ISO 9277: 1995 Determination of the specific area of solids by gas adsorption using
BET method.
[13] Meyer, K.; Röhl-Kuhn, B.; Minor, D.; Klobes, P.: Special features regarding thecertification of highly particulated and/or porous reference materials, Proceedings of
the EUROLAB-EURACHEM-BAM Symposium 'Reference Materials for
Technologies in the New Millennium', Berlin, 22 - 23 May 2000.
[14] Meier, W. W.; Olson, D. H.; Baerlocher, Ch.: Atlas of Zeolite Structure Types, 4th
revised edition, London: Elsevier, 1996.
[15] Horvath, G.; Kawazoe, K.: Method for the calculation of effective pore size
distribution in molecular sieve carbon. J. chem. Engin. Japan 16 (1983) 470-475.
[16] Saito, A.; Foley, H.C.: Curvature and Parametric Sensivity in Models for Adsorptionin Micropores. AIChE Journal 37 (1991) 429-436.
[17] Gregg, S. J.; Sing, K. S. W.: Adsorption, Surface Area and Porosity. AcademicPress, London 1982.
[18] Van der Veen, A. M. H.; Nater, D. A. G.: Sample Preparation from Bulk Samples:An Overview, Fuel Processing Technology 36 (1993) 1-7.
[19] ASTM E 826-85 Standard practice for testing homogeneity of materials for the
27
development of reference materials.
[20] Snedecor, G. W.; Cochran, W. G.: Statistical Methods, 8th ed., 7th printing, Ames,
Iowa: Iowa State University Press, 1996.
[21] Dixon, W. J.; Massey, F. J., Jr.: Introduction to Statistical Analysis, 4th ed. New
York, N. Y.: McGraw-Hill, 1983.
[22] BCR/01/97 Guidelines for the production and certification of BCR reference
materials.
[23] ISO Guide 30 Terms and definitions used in connection with reference materials,1992.
[24] ISO Guide 31 Contents of certificates of reference materials, 1996.
[25] ISO Guide 32 Calibration of chemical analysis and use of certified reference
materials, 1997.
[26] ISO Guide 33 Uses of certified reference materials, 1989.
[27] ISO Guide 34 Quality systems guidelines for the production of reference materials,
1996.
[28] ISO Guide 35 Certification of reference materials - General and statistical
principles, 1989.
[29] ISO Guide 43-1 Proficiency testing by interlaboratory comparisons - Part 1:
Development and operation of proficiency testing scheme, 1997.
[30] A.M.H. Van der Veen, T.P.J. Linsinger, H. Schimmel, A. Lamberty, J. Pauwels
(2001). Uncertainty calculations in the certification of reference materials. 4.
Characterisation and certification. Accred. Qual. Assur. 6, 290-294.
[31] T.P.J Linsinger, J. Pauwels, A.M.H. van der Veen, H. Schimmel, A. Lamberty
(2001). Homogeneity and stability of reference materials. Accred. Qual. Assur. 6, 20-25.
[32] ISO-Standard 31 (1992). Quantities – part 0: General principles. International
Organization for Standardization, Geneva, Switzerland.

28
10. ANNEX I - DATA RECORDS FOR HOMOGENEITY AND STABILITY
10.1 BCR-704
Table A-1: Data record BCR-704-1 (03.03. - 04.04.1997 / ASAP #815)
Micropore volume
(cm3 g
-1)
Median micropore width
(nm)
Langmuir surface area (m2 g
-1)
0.198460 0.6602 544.4784
0.200966 0.6602 551.2242
0.201329 0.6613 553.0095
0.202200 0.6615 554.9343
0.202419 0.6592 555.1323
0.201813 0.6620 554.1927
0.201351 0.6626 553.3805
0.202033 0.6618 554.5314
0.199974 0.6618 549.9953
0.201199 0.6591 551.9393
n 10 10 10
x 0.201174 0.660970 552.281790
s 0.01186 0.001216 3.213980
s2
0.000001 0.000001 10.329666
Table A-2: Data record BCR-704-2 (07.10. - 25.11.1998 / ASAP #853)
Micropore volume
(cm3 g
-1)
Median micropore width (nm) Langmuir surface area (m2 g
-1)
0.202688 0.6709 557.9644
0.201345 0.6715 556.6678
0.202072 0.6718 559.2774
0.202254 0.6722 561.2093
0.202565 0.6716 561.7474
0.201412 0.6717 558.7094
0.201630 0.6725 558.8228
0.202974 0.6721 562.8657
0.202656 0.6716 561.5552
0.203963 0.6715 565.6711
0.201864 0.6718 559.4338
0.204242 0.6714 566.2114
0.201536 0.6716 558.3233
0.201356 0.6723 557.1036
0.201182 0.6717 557.5765
0.202855 0.6708 562.0741

29
Micropore volume
(cm3 g
-1)
Median micropore width (nm) Langmuir surface area (m2 g
-1)
n 16 16 16
x 0.202287 0.671688 560.325825
s 0.000922 0.000453 2.883379
s2
0.000001 0.000000 8.313872
Table A-3: Data record BCR-704-3 (09.05.- 11.06.2001 / ASAP #853)
Micropore volume
(cm3 g
-1)
Median micropore width (nm) Langmuir surface area (m2 g
-1)
0.202585 0.6724 555.8048
0.205766 0.6723 561.4463
0.204493 0.6729 558.9895
0.205000 0.6715 564.8360
0.199601 0.6715 550.4357
n 5 5 5
x 0.203489 0.672120 558.302460
s 0.002470 0.000610 5.503797
s2
0.000006 0.000000 30.291779
10.2 BCR-705
Table A-4: Data record BCR-705-1 (10.3. - 01.06.1997 / ASAP #853, Isotherm only up to p/p0=0.015)
Micropore volume
(cm3 g
-1)
Median micropore width (nm) Langmuir surface area (m2 g
-1)
0.175980 0.5787 481.3136
0.175825 0.5798 481.5000
0.176144 0.6208 481.8913
0.176239 0.6218 481.9779
0.176401 0.5810 483.1205
0.172958 0.5808 473.9459
0.174825 0.5795 478.7643
0.176029 0.5758 481.5535
n 8 8 8
x 0.175550 0.589775 480.508375
s 0.001152 0.019526 2.921033
s2
0.000001 0.000381 8.532436

30
Table A-5: Data record BCR-705-2 (30.11.1998 - 17.02.1999 / ASAP #853)
Micropore volume
(cm3 g
-1)
Median micropore width (nm) Langmuir surface area (m2 g
-1)
0.175787 0.5859 489.9702
0.177481 0.5824 493.4049
0.181535 0.5842 503.9100
0.177592 0.5850 492.3848
0.180819 0.5831 499.7814
0.175411 0.5828 489.5507
0.177526 0.5864 494.2493
0.1788 0.5846 493.7285
n 8 8 8
x 0.178119 0.584300 494.622475
s 0.002179 0.001457 4.894127
s2
0.000005 0.000002 23.952474
Table A-6: Data record BCR-705-3 (21.05.-13.06.2001 / ASAP #853)
Micropore volume
(cm3 g
-1)
Median micropore width (nm) Langmuir surface area (m2 g
-1)
0.181344 0.5849 499.5290
0.177891 0.5849 492.0439
0.179027 0.5843 495.0466
n 3 3 3
x 0.179421 0.584700 495.539833
s 0.001760 0.000346 3.766847
s2
0.000003 0.000000 14.189140
10.3 F-Test for the homogeneity testing
10.3.1 Reference substance
Material CRM BAM-PM-103 (alumina type 60)
sample size: nRef = 9
average: fRe
x = 158.55
std: sRef = 0.70222
fRefRefRexscv = = 0.004443
10.3.2 Calculation for BCR-704
Data record BCR-704-1 (03.03. - 04.04.1997 / ASAP #815)
Hypothesis H0: σ1 / µ1 = σRef / µRef
Alternative: σ1 / µ1 > σRef / µRef

31
Langmuir surface area (m2 g
-1 )
sample size: n1 = 10
average: 1
x = 552.281790
std: s1 = 3.213980
111xscv = = 0.005819
F = cv12/cvRef
2 = 1.73 < 2.56 = F9,8;0.90
Hypothesis H0 cannot be rejected with 90 % certainty.
(The coefficients of variation are not significantly different.)
Data record BCR-704-2 (07.10. - 25.11.1998 / ASAP #853)
Hypothesis H0: σ2 / µ2 = σRef / µRef
Alternative: σ2 / µ2 > σRef / µRef
Langmuir surface area (m2 g
-1 )
sample size: n2 = 16
average: 2
x = 560.325825
std: s2 = 2.883379
222xscv = = 0.005146
F = cv22/cvRef
2 = 1.35 < 2.46 = F15,8;0.90
Hypothesis H0 cannot be rejected with 90 % certainty.
(The coefficients of variation are not significantly different.)
10.3.3 Calculation for BCR-705
Data record BCR-705-1 (10.3. - 01.06.1997 / ASAP #853)
Hypothesis H0: σ1 / µ1 = σRef / µRef
Alternative: σ1 / µ1 > σRef / µRef
Langmuir surface area (m2 g
-1 )
sample size: n1 = 8
average:1
x = 480.508375
std: s1 = 2.921033
111xscv = = 0.006079
F = cv12/cvRef
2 = 1.88 < 3.50 = F7,8;0.95
Hypothesis H0 cannot be rejected with 90 % certainty.
(The coefficients of variation are not significantly different.)
Data record BCR-705-2 (30.11.1998 - 17.02.1999 / ASAP #853)
Hypothesis H0: σ2 / µ2 = σRef / µRef
Alternative: σ2 / µ2 > σRef / µRef

32
Langmuir surface area (m2 g
-1 )
sample size: n2 = 8
average:2
x = 494.622475
std: s2 = 4.894127
222xscv = = 0.009895
F = cv22/cvRef
2 = 4.99 > 3.50 = F7,8;0.95
< 6.18 = F7,8;0.99
Hypothesis H0 is rejected with 95 % certainty, but cannot be rejected with 99 % certainty.
(The coefficients of variation are significantly different at the 5 % level.)

33
11. ANNEX II - DATA RECORDS FOR THE PROFICIENCY TESTING
Table A-7: Measurements for the determination of the reference value Substance B (zeolite 13X)
No. Instrument Langmuir
specific
surface area
(m2 g
-1)
Mean
(m2 g
-1)
Standard
deviation
(m2 g
-1)
AASAP 2010 #
340 602.341 – –
(BAM)
BASAP 2010 #
815
593.497579.8 8.865
(BAM) 579.162
585.351
574.759
587.389
572.340
580.162
565.926
CASAP 2010 #
853
582.402582.7 2.505
(BAM) 585.313
580.326
D Autosorb-1 625.395 623.3 3.901
(BAM) 627.585
621.507
618.863
ESorptomatic
1990
614.223605.3 14.982
(BAM) 613.712
588.022
F ASAP 2010 595.977 600.1 9.635
(Micromeritics) 611.140
593.261
Evaluation of the Langmuir specific surface area as a reference value
number of laboratories: n = 6 (A to F)
Reference value : x = 598.9 m2 g
-1
standard deviation s = 15.978 m2 g
-1
uncertainty s n/ = 6.5 m2 g
-1
95 % confidence interval 598.9 ± 16.8 m2 g
-1
95 % tolerance interval 598.9 ± 70.5 m2 g
-1

34
Table A-8: Results of the proficiency testing (measurements of substance B)
Laboratory No. Instrument Langmuir
specific
surface area
(m2 g
-1)
Mean
(m2 g
-1)
Standard
deviation
(m2 g
-1)
01 Autosorb-1MP 675.8048
672.6616
656.5260
668.3308 10.3433
03 ASAP 2010 592.0296
574.0173
598.9797
588.3422 12.8833
05 Autosorb-3MP 657.2050
611.3999
616.1757
628.2602 25.1804
06 ASAP 2010 590.3626
568.5778
578.6253
579.1886 10.9034
07 Omnisorb (TM)
100
657.9908
667.3860
662.6884 6.6434
09 Omnisorb 360 578.0760
577.9310
596.8932
584.3001 10.9062
12 ASAP 2010 539.3736
534.2392
537.1153
536.9094 2.5734
17 Sorptomatic 1990 622.7558
622.3324
610.9269
618.6717 6.7105
19 ASAP 2010 569.2300
575.4859
575.4363
573.3841 3.5976
20 ASAP 2010 585.2054
574.6162
587.2423
572.1978
542.0170
580.0176
579.0182
593.3494
576.7080 15.6049
21 Sorptomatic 1990 613.9671
613.4674
587.7802
605.0716 14.9768
22 Autosorb-1C 625.2391
627.4286
621.3520
618.7086
623.1821 582.5352
30 ASAP 2010 582.2567
585.1672
580.1816
582.5352 2.5044
35
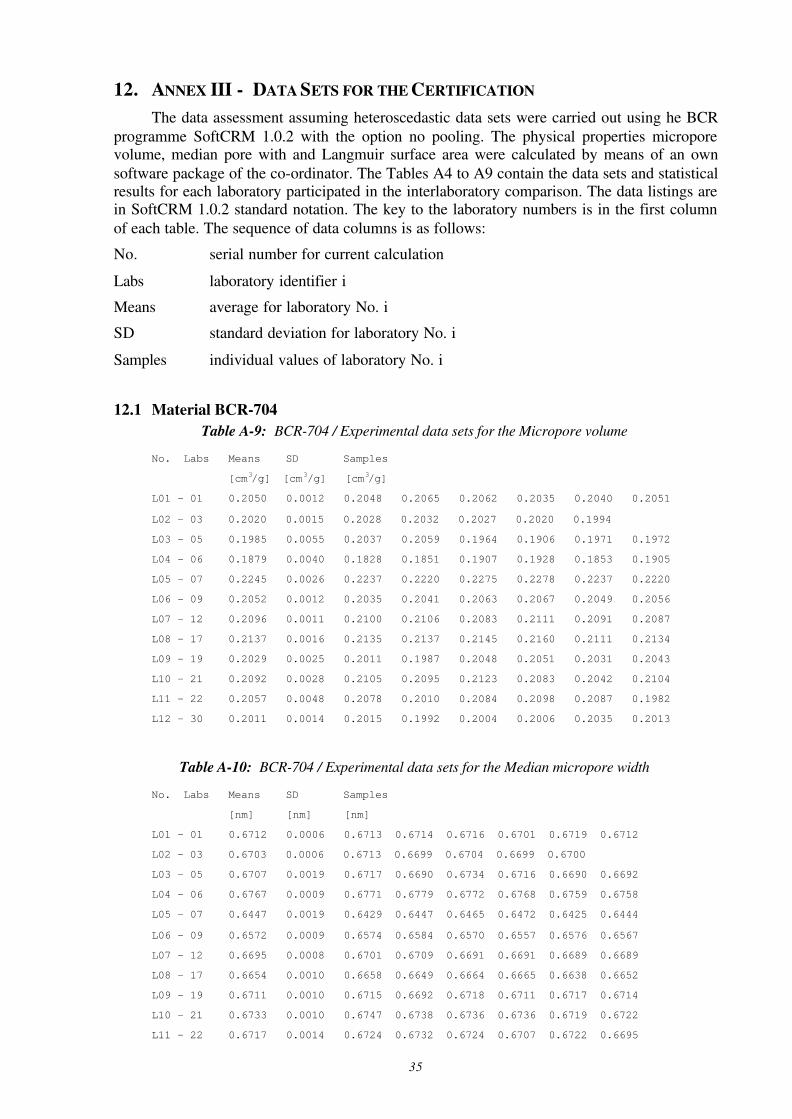
12. ANNEX III - DATA SETS FOR THE CERTIFICATION
The data assessment assuming heteroscedastic data sets were carried out using he BCR
programme SoftCRM 1.0.2 with the option no pooling. The physical properties microporevolume, median pore with and Langmuir surface area were calculated by means of an own
software package of the co-ordinator. The Tables A4 to A9 contain the data sets and statisticalresults for each laboratory participated in the interlaboratory comparison. The data listings arein SoftCRM 1.0.2 standard notation. The key to the laboratory numbers is in the first column
of each table. The sequence of data columns is as follows:
No. serial number for current calculation
Labs laboratory identifier i
Means average for laboratory No. i
SD standard deviation for laboratory No. i
Samples individual values of laboratory No. i
12.1 Material BCR-704
Table A-9: BCR-704 / Experimental data sets for the Micropore volume
No. Labs Means SD Samples
[cm3/g] [cm3/g] [cm3/g]
L01 - 01 0.2050 0.0012 0.2048 0.2065 0.2062 0.2035 0.2040 0.2051
L02 - 03 0.2020 0.0015 0.2028 0.2032 0.2027 0.2020 0.1994
L03 - 05 0.1985 0.0055 0.2037 0.2059 0.1964 0.1906 0.1971 0.1972
L04 - 06 0.1879 0.0040 0.1828 0.1851 0.1907 0.1928 0.1853 0.1905
L05 - 07 0.2245 0.0026 0.2237 0.2220 0.2275 0.2278 0.2237 0.2220
L06 - 09 0.2052 0.0012 0.2035 0.2041 0.2063 0.2067 0.2049 0.2056
L07 - 12 0.2096 0.0011 0.2100 0.2106 0.2083 0.2111 0.2091 0.2087
L08 - 17 0.2137 0.0016 0.2135 0.2137 0.2145 0.2160 0.2111 0.2134
L09 - 19 0.2029 0.0025 0.2011 0.1987 0.2048 0.2051 0.2031 0.2043
L10 - 21 0.2092 0.0028 0.2105 0.2095 0.2123 0.2083 0.2042 0.2104
L11 - 22 0.2057 0.0048 0.2078 0.2010 0.2084 0.2098 0.2087 0.1982
L12 - 30 0.2011 0.0014 0.2015 0.1992 0.2004 0.2006 0.2035 0.2013
Table A-10: BCR-704 / Experimental data sets for the Median micropore width
No. Labs Means SD Samples
[nm] [nm] [nm]
L01 - 01 0.6712 0.0006 0.6713 0.6714 0.6716 0.6701 0.6719 0.6712
L02 - 03 0.6703 0.0006 0.6713 0.6699 0.6704 0.6699 0.6700
L03 - 05 0.6707 0.0019 0.6717 0.6690 0.6734 0.6716 0.6690 0.6692
L04 - 06 0.6767 0.0009 0.6771 0.6779 0.6772 0.6768 0.6759 0.6758
L05 - 07 0.6447 0.0019 0.6429 0.6447 0.6465 0.6472 0.6425 0.6444
L06 - 09 0.6572 0.0009 0.6574 0.6584 0.6570 0.6557 0.6576 0.6567
L07 - 12 0.6695 0.0008 0.6701 0.6709 0.6691 0.6691 0.6689 0.6689
L08 - 17 0.6654 0.0010 0.6658 0.6649 0.6664 0.6665 0.6638 0.6652
L09 - 19 0.6711 0.0010 0.6715 0.6692 0.6718 0.6711 0.6717 0.6714
L10 - 21 0.6733 0.0010 0.6747 0.6738 0.6736 0.6736 0.6719 0.6722
L11 - 22 0.6717 0.0014 0.6724 0.6732 0.6724 0.6707 0.6722 0.6695
36
L12 - 30 0.6706 0.0009 0.6716 0.6694 0.6703 0.6699 0.6710 0.6713
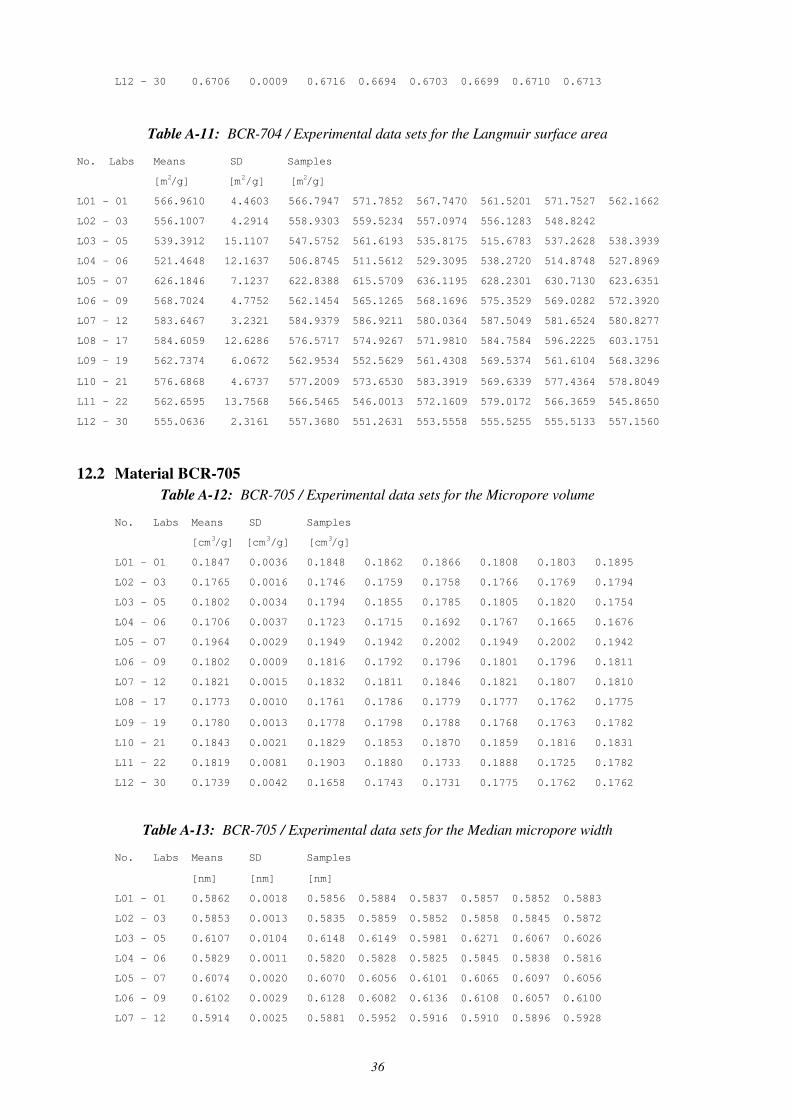
Table A-11: BCR-704 / Experimental data sets for the Langmuir surface area
No. Labs Means SD Samples
[m2/g] [m2/g] [m2/g]
L01 - 01 566.9610 4.4603 566.7947 571.7852 567.7470 561.5201 571.7527 562.1662
L02 - 03 556.1007 4.2914 558.9303 559.5234 557.0974 556.1283 548.8242
L03 - 05 539.3912 15.1107 547.5752 561.6193 535.8175 515.6783 537.2628 538.3939
L04 - 06 521.4648 12.1637 506.8745 511.5612 529.3095 538.2720 514.8748 527.8969
L05 - 07 626.1846 7.1237 622.8388 615.5709 636.1195 628.2301 630.7130 623.6351
L06 - 09 568.7024 4.7752 562.1454 565.1265 568.1696 575.3529 569.0282 572.3920
L07 - 12 583.6467 3.2321 584.9379 586.9211 580.0364 587.5049 581.6524 580.8277
L08 - 17 584.6059 12.6286 576.5717 574.9267 571.9810 584.7584 596.2225 603.1751
L09 - 19 562.7374 6.0672 562.9534 552.5629 561.4308 569.5374 561.6104 568.3296
L10 - 21 576.6868 4.6737 577.2009 573.6530 583.3919 569.6339 577.4364 578.8049
L11 - 22 562.6595 13.7568 566.5465 546.0013 572.1609 579.0172 566.3659 545.8650
L12 - 30 555.0636 2.3161 557.3680 551.2631 553.5558 555.5255 555.5133 557.1560
12.2 Material BCR-705
Table A-12: BCR-705 / Experimental data sets for the Micropore volume
No. Labs Means SD Samples
[cm3/g] [cm3/g] [cm3/g]
L01 - 01 0.1847 0.0036 0.1848 0.1862 0.1866 0.1808 0.1803 0.1895
L02 - 03 0.1765 0.0016 0.1746 0.1759 0.1758 0.1766 0.1769 0.1794
L03 - 05 0.1802 0.0034 0.1794 0.1855 0.1785 0.1805 0.1820 0.1754
L04 - 06 0.1706 0.0037 0.1723 0.1715 0.1692 0.1767 0.1665 0.1676
L05 - 07 0.1964 0.0029 0.1949 0.1942 0.2002 0.1949 0.2002 0.1942
L06 - 09 0.1802 0.0009 0.1816 0.1792 0.1796 0.1801 0.1796 0.1811
L07 - 12 0.1821 0.0015 0.1832 0.1811 0.1846 0.1821 0.1807 0.1810
L08 - 17 0.1773 0.0010 0.1761 0.1786 0.1779 0.1777 0.1762 0.1775
L09 - 19 0.1780 0.0013 0.1778 0.1798 0.1788 0.1768 0.1763 0.1782
L10 - 21 0.1843 0.0021 0.1829 0.1853 0.1870 0.1859 0.1816 0.1831
L11 - 22 0.1819 0.0081 0.1903 0.1880 0.1733 0.1888 0.1725 0.1782
L12 - 30 0.1739 0.0042 0.1658 0.1743 0.1731 0.1775 0.1762 0.1762
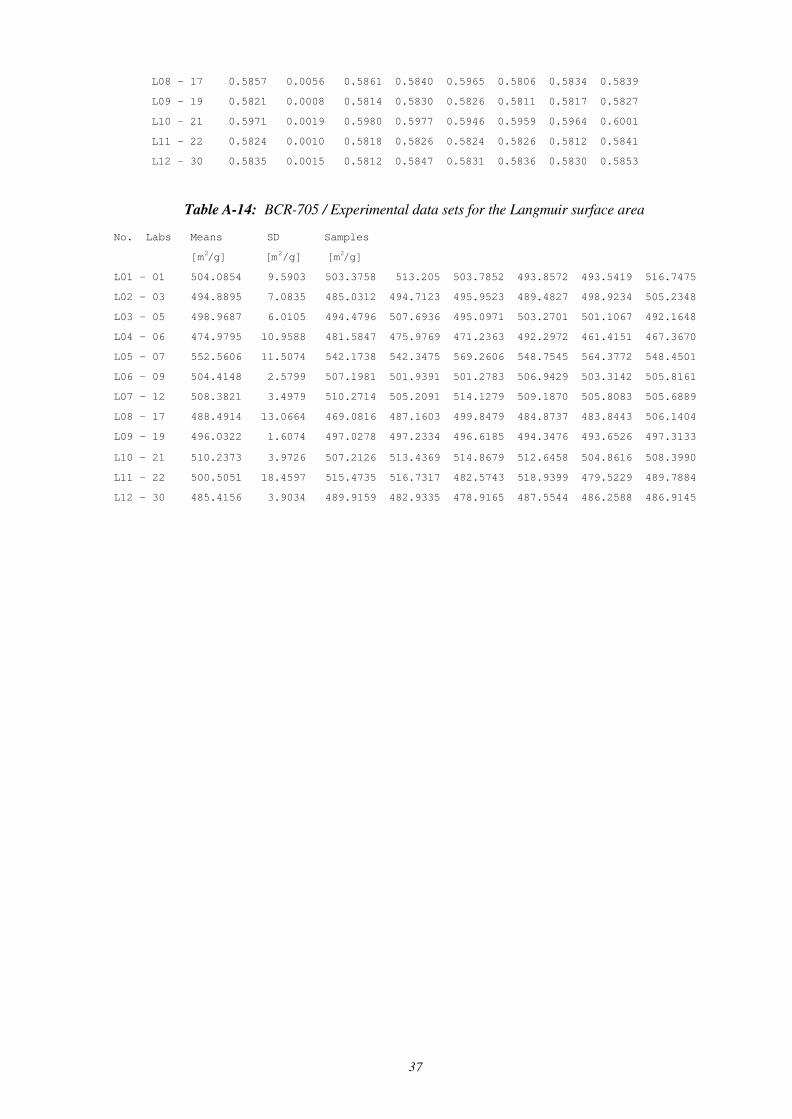
Table A-13: BCR-705 / Experimental data sets for the Median micropore width
No. Labs Means SD Samples
[nm] [nm] [nm]
L01 - 01 0.5862 0.0018 0.5856 0.5884 0.5837 0.5857 0.5852 0.5883
L02 - 03 0.5853 0.0013 0.5835 0.5859 0.5852 0.5858 0.5845 0.5872
L03 - 05 0.6107 0.0104 0.6148 0.6149 0.5981 0.6271 0.6067 0.6026
L04 - 06 0.5829 0.0011 0.5820 0.5828 0.5825 0.5845 0.5838 0.5816
L05 - 07 0.6074 0.0020 0.6070 0.6056 0.6101 0.6065 0.6097 0.6056
L06 - 09 0.6102 0.0029 0.6128 0.6082 0.6136 0.6108 0.6057 0.6100
L07 - 12 0.5914 0.0025 0.5881 0.5952 0.5916 0.5910 0.5896 0.5928
37
L08 - 17 0.5857 0.0056 0.5861 0.5840 0.5965 0.5806 0.5834 0.5839
L09 - 19 0.5821 0.0008 0.5814 0.5830 0.5826 0.5811 0.5817 0.5827
L10 - 21 0.5971 0.0019 0.5980 0.5977 0.5946 0.5959 0.5964 0.6001
L11 - 22 0.5824 0.0010 0.5818 0.5826 0.5824 0.5826 0.5812 0.5841
L12 - 30 0.5835 0.0015 0.5812 0.5847 0.5831 0.5836 0.5830 0.5853
Table A-14: BCR-705 / Experimental data sets for the Langmuir surface area
No. Labs Means SD Samples
[m2/g] [m2/g] [m2/g]
L01 - 01 504.0854 9.5903 503.3758 513.205 503.7852 493.8572 493.5419 516.7475
L02 - 03 494.8895 7.0835 485.0312 494.7123 495.9523 489.4827 498.9234 505.2348
L03 - 05 498.9687 6.0105 494.4796 507.6936 495.0971 503.2701 501.1067 492.1648
L04 - 06 474.9795 10.9588 481.5847 475.9769 471.2363 492.2972 461.4151 467.3670
L05 - 07 552.5606 11.5074 542.1738 542.3475 569.2606 548.7545 564.3772 548.4501
L06 - 09 504.4148 2.5799 507.1981 501.9391 501.2783 506.9429 503.3142 505.8161
L07 - 12 508.3821 3.4979 510.2714 505.2091 514.1279 509.1870 505.8083 505.6889
L08 - 17 488.4914 13.0664 469.0816 487.1603 499.8479 484.8737 483.8443 506.1404
L09 - 19 496.0322 1.6074 497.0278 497.2334 496.6185 494.3476 493.6526 497.3133
L10 - 21 510.2373 3.9726 507.2126 513.4369 514.8679 512.6458 504.8616 508.3990
L11 - 22 500.5051 18.4597 515.4735 516.7317 482.5743 518.9399 479.5229 489.7884
L12 - 30 485.4156 3.9034 489.9159 482.9335 478.9165 487.5544 486.2588 486.9145

38
13. ANNEX IV - INSTRUMENTS AND PRODUCERS
Table A-15: Instruments used by the participants in the interlaboratory comparison
Type of Instrument Producer ∑
ASAP 2010 Micromeritics 5
Sorptomatic 1990 Carlo Erba 2
Autosorb-1/MP Quantachrome 1
Autosorb-3/MP Quantachrome 1
Autosorb-1/C Quantachrome 1
Omnisorb 360 Coulter 1
Omnisorb (TM) 100 CX Coulter 1

European Commission
EUR 21065 – DG Joint Research Centre, Institute for Reference Materials and Measurements –
Certification of the specific micropore volume and the median micropore width of two microporousreference materials according to Draft-DIN 66135-4, BCR-704, BCR-705Authors: B. Röhl-Kuhn, P. Klobes, K. Meyer, P. Lorenz, B.M. Gawlik, A. Lamberty, H. Muntau
Luxembourg: Office for Official Publications of the European Communities2004 – 38 pp. –21.0 x 29.7 cmScientific and Technical Research series
ISBN 92-894-7111-5
Abstract
This report describes the certification of the specific micropore volume and the median micropore widthof two microporous reference materials (zeolites with 1-2 % clay as binder) according to Draft-DIN 66135-4[1]. The adsorptive used for both materials was argon at the temperature of liquid argon. The report
contains all the results of the 10 participating laboratories using 12 instruments. Furthermore, the dataconcerning the homogeneity and the stability studies are summarised. The Langmuir specific surface areaand the density measured by helium gas pycnometry are given as indicative values.
Certified values were accompanied by an expanded uncertainty according to the requirements laid down inthe Guide for the Expression of Uncertainty in Measurement (GUM) [2].

The mission of the Joint Research Centre is to provide customer-driven scientific and technicalsupport for the conception, development, implementation and monitoring of European Union
policies. As a service of the European Commission, the JRC functions as a reference centre ofscience and technology for the Community. Close to the policy-making process, it serves thecommon interest of the Member States, while being independent of commercial and national
interests.
15
LA
-NA
-21065-E
N-C