
Certain Oil Country Tubular Goods from India, Korea, The ... · The industry in the Philippines ......
226
U.S. International Trade Commission Publication 4422 August 2013 Washington, DC 20436 Certain Oil Country Tubular Goods from India, Korea, The Philippines, Saudi Arabia, Taiwan, Thailand, Turkey, Ukraine, and Vietnam Investigation Nos. 701-TA-499-500 and 731-TA-1215-1223 (Preliminary)
Transcript of Certain Oil Country Tubular Goods from India, Korea, The ... · The industry in the Philippines ......

U.S. International Trade CommissionPublication 4422 August 2013
Washington, DC 20436
Certain Oil Country Tubular Goods from India, Korea, The Philippines,
Saudi Arabia, Taiwan, Thailand, Turkey, Ukraine, and Vietnam
Investigation Nos. 701-TA-499-500 and 731-TA-1215-1223 (Preliminary)

U.S. International Trade Commission
COMMISSIONERS
Irving A. Williamson, Chairman Daniel R. Pearson Shara L. Aranoff Dean A. Pinkert
David S. Johanson Meredith M. Broadbent
Robert B. Koopman
Staff assigned
Address all communications to Secretary to the Commission
United States International Trade Commission Washington, DC 20436
Director, Office of Operations
Michael Szustakowski, Investigator Alan Treat, Industry Analyst
Mahnaz Khan, Industry Analyst Craig Thomsen, Economist Charles Yost, Accountant
Jennifer Brinckhaus, Statistician Carolyn Holmes, Statistical Assistant
Peter Sultan, Attorney Nataline Viray-Fung, Attorney
Andrew Warner, Intern Douglas Corkran, Supervisory Investigator
U.S. International Trade CommissionWashington, DC 20436
www.usitc.gov
Publication 4422 August 2013
Certain Oil Country Tubular Goods from India, Korea, The Philippines,
Saudi Arabia, Taiwan, Thailand, Turkey, Ukraine, and Vietnam
Investigation Nos. 701-TA-499-500 and 731-TA-1215-1223 (Preliminary)

CONTENTS Page
i
Determination ......................................................................................................................... 1
Views of the Commission ......................................................................................................... 3
Part I: Introduction ................................................................................................................ I‐1
Background ................................................................................................................................ I‐1
Statutory criteria and organization of the report ..................................................................... I‐2
Statutory criteria ................................................................................................................... I‐2
Organization of report ........................................................................................................... I‐3
Market summary ....................................................................................................................... I‐3
Summary data and data sources ............................................................................................... I‐4
Previous and related investigations .......................................................................................... I‐4
Antidumping and countervailing duty investigations ........................................................... I‐4
Safeguard investigations ....................................................................................................... I‐6
Nature and extent of alleged subsidies and sales at LTFV ........................................................ I‐7
Alleged subsidies ................................................................................................................... I‐7
Alleged sales at LTFV ........................................................................................................... I‐10
The subject merchandise ........................................................................................................ I‐11
Commerce’s scope .............................................................................................................. I‐11
Tariff treatment ................................................................................................................... I‐11
The product ............................................................................................................................. I‐12
Overview .............................................................................................................................. I‐12
Description and applications ............................................................................................... I‐13
Manufacturing processes .................................................................................................... I‐18
Domestic like product issues ................................................................................................... I‐23
Physical characteristics and uses ......................................................................................... I‐23
Manufacturing facilities and production employees .......................................................... I‐24
Interchangeability and customer and producer perceptions ............................................. I‐25
Channels of distribution ...................................................................................................... I‐25
Price ..................................................................................................................................... I‐26
CONTENTS Page
ii
Part I: Introduction‐‐Continued
Intermediate products ............................................................................................................ I‐26
Uses ..................................................................................................................................... I‐26
Markets ................................................................................................................................ I‐27
Characteristics and functions .............................................................................................. I‐27
Value .................................................................................................................................... I‐28
Transformation process ....................................................................................................... I‐28
Part II: Supply and demand information ............................................................................... II‐1
U.S. market characteristics ....................................................................................................... II‐1
Channels of distribution ....................................................................................................... II‐1
Geographic distribution ........................................................................................................ II‐3
Supply and demand considerations ......................................................................................... II‐4
Supply ................................................................................................................................... II‐4
Demand .............................................................................................................................. II‐10
Substitutability issues ............................................................................................................. II‐18
Factors affecting purchasing decisions............................................................................... II‐18
Comparisons of domestic products, subject imports, and nonsubject imports ................ II‐19
Part III: U.S. producers’ production, shipments, and employment ....................................... III‐1
U.S. producers ......................................................................................................................... III‐1
U.S. production, capacity, and capacity utilization ................................................................. III‐5
U.S. producers’ U.S. shipments and exports ........................................................................... III‐7
Order books ............................................................................................................................. III‐7
U.S. producers’ inventories ..................................................................................................... III‐8
U.S. producers’ imports and purchases .................................................................................. III‐8
U.S. employment, wages, and productivity ............................................................................ III‐9

CONTENTS Page
iii
Part IV: U.S. imports, apparent U.S. consumption, and market shares ................................ IV‐1
U.S. importers.......................................................................................................................... IV‐1
U.S. imports ............................................................................................................................. IV‐3
Negligibility .............................................................................................................................. IV‐6
Cumulation considerations.................................................................................................. IV‐8
Fungibility ............................................................................................................................ IV‐8
Presence in the market ....................................................................................................... IV‐9
Geographical markets ....................................................................................................... IV‐10
Apparent U.S. consumption .................................................................................................. IV‐11
U.S. market shares ................................................................................................................ IV‐12
Ratio of imports to U.S. production ...................................................................................... IV‐13
Part V: Pricing data ............................................................................................................... V‐1
Factors affecting prices ............................................................................................................ V‐1
Raw material costs ............................................................................................................... V‐1
U.S. inland transportation costs ........................................................................................... V‐3
Pricing practices ....................................................................................................................... V‐3
Pricing methods .................................................................................................................... V‐3
Sales terms and discounts .................................................................................................... V‐5
Price data .................................................................................................................................. V‐6
Price trends ......................................................................................................................... V‐14
Price comparisons .............................................................................................................. V‐17
Lost sales and lost revenues ................................................................................................... V‐20
Part VI: Financial experience of U.S. producers .................................................................... VI‐1
Background .............................................................................................................................. VI‐1
Operations on OCTG ............................................................................................................ VI‐1
Variance analysis ................................................................................................................. VI‐6
Capital expenditures and research and development expenses ........................................ VI‐7
Assets and return on investment ........................................................................................ VI‐9

CONTENTS Page
iv
Part VI: Financial experience of U.S. producers‐‐Continued
Capital and investment ...................................................................................................... VI‐10
Actual negative effects ...................................................................................................... VI‐11
Anticipated negative effects .............................................................................................. VI‐12
Part VII: Threat considerations and information on nonsubject countries .......................... VII‐1
The industry in India ............................................................................................................... VII‐3
Operations on OCTG ........................................................................................................... VII‐4
Alternative products ........................................................................................................... VII‐5
The industry in Korea ............................................................................................................. VII‐6
Operations on OCTG ........................................................................................................... VII‐6
Alternative products ........................................................................................................... VII‐8
The industry in the Philippines ............................................................................................... VII‐8
Operations on OCTG ........................................................................................................... VII‐9
Alternative products ........................................................................................................... VII‐9
The industry in Saudi Arabia ................................................................................................ VII‐10
Operations on OCTG ......................................................................................................... VII‐10
Alternative products ......................................................................................................... VII‐11
The industry in Taiwan ......................................................................................................... VII‐11
Operations on OCTG ......................................................................................................... VII‐12
Alternative products ......................................................................................................... VII‐13
The industry in Thailand ....................................................................................................... VII‐13
Operations on OCTG ......................................................................................................... VII‐14
Alternative products ......................................................................................................... VII‐14
The industry in Turkey .......................................................................................................... VII‐14
Operations on OCTG ......................................................................................................... VII‐15
Alternative products ......................................................................................................... VII‐16

CONTENTS Page
v
Part VII: Threat considerations and information on nonsubject countries‐‐Continued
The industry in Ukraine ........................................................................................................ VII‐16
Operations on OCTG ......................................................................................................... VII‐17
Alternative products ......................................................................................................... VII‐18
The industry in Vietnam ....................................................................................................... VII‐18
Operations on OCTG ......................................................................................................... VII‐19
Alternative products ......................................................................................................... VII‐20
Subject countries combined ................................................................................................. VII‐21
U.S. inventories of imported merchandise .......................................................................... VII‐22
U.S. importers’ outstanding orders ...................................................................................... VII‐23
Antidumping or countervailing duty orders in third‐country markets ................................ VII‐24
Information on nonsubject countries .................................................................................. VII‐24
Argentina .......................................................................................................................... VII‐31
Canada .............................................................................................................................. VII‐33
Germany ........................................................................................................................... VII‐35
Japan ................................................................................................................................. VII‐36
Mexico .............................................................................................................................. VII‐38
Appendixes
A. Federal Register notices .................................................................................................... A‐1
B. Calendar of the public conference .................................................................................... B‐1
C. Summary data ................................................................................................................... C‐1
D. Quarterly nonsubject‐country price data ......................................................................... D‐1
Note.—Information that would reveal confidential operations of individual concerns may not
be published and therefore has been deleted. Such deletions are indicated by asterisks.


UNITED STATES INTERNATIONAL TRADE COMMISSION
Investigation Nos. 701‐TA‐499‐500 and 731‐TA‐1215‐1223 (Preliminary)
Certain Oil Country Tubular Goods from India, Korea, the Philippines, Saudi Arabia, Taiwan, Thailand, Turkey, and Vietnam
DETERMINATIONS
On the basis of the record1 developed in the subject investigations, the United States International Trade Commission (Commission) determines, pursuant to sections 703(a) and 733(a) of the Tariff Act of 1930 (19 U.S.C. '' 1671b(a) and 1673b(a)) (the Act), that there is a reasonable indication that an industry in the United States is materially injured by reason of imports from India, Korea, the Philippines, Saudi Arabia, Taiwan, Thailand, Turkey, Ukraine, and Vietnam of certain oil country tubular goods, provided for primarily in subheadings 7304.29, 7305.20, and 7306.29 of the Harmonized Tariff Schedule of the United States, that are alleged to be sold in the United States at less than fair value (LTFV), and by imports of certain oil country tubular goods that are allegedly subsidized by the Governments of India and Turkey.
COMMENCEMENT OF FINAL PHASE INVESTIGATIONS
Pursuant to section 207.18 of the Commission=s rules, the Commission also gives notice of the commencement of the final phase of its investigations. The Commission will issue a final phase notice of scheduling, which will be published in the Federal Register as provided in section 207.21 of the Commission=s rules, upon notice from the Department of Commerce (Commerce) of affirmative preliminary determinations in the investigations under sections 703(b) or 733(b) of the Act, or, if the preliminary determinations are negative, upon notice of affirmative final determinations in those investigations under sections 705(a) or 735(a) of the Act. Parties that filed entries of appearance in the preliminary phase of the investigations need not enter a separate appearance for the final phase of the investigations. Industrial users, and, if the merchandise under investigation is sold at the retail level, representative consumer organizations have the right to appear as parties in Commission antidumping and countervailing duty investigations. The Secretary will prepare a public service list containing the names and addresses of all persons, or their representatives, who are parties to the investigations.
BACKGROUND
On July 2, 2013, a petition was filed with the Commission and Commerce by United States Steel Corporation, Pittsburgh, PA; Maverick Tube Corporation, Houston, TX; Boomerang Tube LLC, Chesterfield, MO; EnergeX, a division of JMC Steel Group, Chicago, IL; Northwest Pipe Company, Vancouver, WA; Tejas Tubular Products Inc., Houston, TX; TMK IPSCO, Houston, TX; Vallourec Star, L.P., Houston, TX; and Welded Tube USA, Inc., Lackawanna, NY, alleging that an
1 The record is defined in sec. 207.2(f) of the Commission=s Rules of Practice and Procedure (19 CFR ' 207.2(f)).

industry in the United States is materially injured or threatened with material injury by reason of subsidized imports of certain oil country tubular goods from India and Turkey and LTFV imports of certain oil country tubular goods from India, Korea, the Philippines, Saudi Arabia, Taiwan, Thailand, Turkey, Ukraine, and Vietnam. Accordingly, effective July 2, 2013, the Commission instituted countervailing duty investigation Nos. 701‐TA‐499‐500 (Preliminary) and antidumping duty investigation Nos. 731‐TA‐1215‐1223 (Preliminary).
Notice of the institution of the Commission=s investigations and of a public conference to be held in connection therewith was given by posting copies of the notice in the Office of the Secretary, U.S. International Trade Commission, Washington, DC, and by publishing the notice in the Federal Register of July 10, 2013 (78 FR 41421). The conference was held in Washington, DC, on July 23, 2013, and all persons who requested the opportunity were permitted to appear in person or by counsel.
3
Views of the Commission
Based on the record in the preliminary phase of these investigations, we find that there is a reasonable indication that an industry in the United States is materially injured by reason of imports of certain oil country tubular goods (“OCTG”) from India, Korea, the Philippines, Saudi Arabia, Taiwan, Thailand, Turkey, Ukraine, and Vietnam that are allegedly sold in the United States at less than fair value and imports of the subject merchandise from India and Turkey that are allegedly subsidized by the Governments of India and Turkey.
I. The Legal Standard for Preliminary Determinations
The legal standard for preliminary antidumping and countervailing duty determinations requires the Commission to determine, based upon the information available at the time of the preliminary determinations, whether there is a reasonable indication that a domestic industry is materially injured or threatened with material injury, or that the establishment of an industry is materially retarded, by reason of the allegedly unfairly traded imports.1 In applying this standard, the Commission weighs the evidence before it and determines whether “(1) the record as a whole contains clear and convincing evidence that there is no material injury or threat of such injury; and (2) no likelihood exists that contrary evidence will arise in a final investigation.”2
II. Background
The petitions in these investigations were filed on July 2, 2013, by the United States Steel Corporation (“U.S. Steel”); Maverick Tube Corporation (“Maverick”); and Boomerang Tube LLC; EnergeX, a division of JMC Steel Group; Northwest Pipe Company; Tejas Tubular Products Inc.; TMK IPSCO; Vallourec Star, L.P.; and Welded Tube USA, Inc. (collectively “Joint Petitioners”) (U.S. Steel, Maverick, and Joint Petitioners are collectively the “Petitioners”). Petitioners are domestic producers of certain OCTG and accounted for approximately *** percent of reported domestic OCTG production in 2012.3 Petitioners appeared at the staff conference and submitted postconference briefs.
The following respondents and groups of respondents appeared at the staff conference and submitted postconference briefs:
1 19 U.S.C. §§ 1671b(a), 1673b(a) (2000); see also American Lamb Co. v. United States, 785 F.2d 994,
1001‐04 (Fed. Cir. 1986); Aristech Chem. Corp. v. United States, 20 CIT 353, 354‐55 (1996). No party argues that the establishment of an industry in the United States is materially retarded by the allegedly unfairly traded imports.
2 American Lamb Co., 785 F.2d at 1001; see also Texas Crushed Stone Co. v. United States, 35 F.3d 1535, 1543 (Fed. Cir. 1994).
3 See Confidential Staff Report, Memorandum INV‐LL‐059 (Aug. 9, 2013), as amended by Memorandum INV‐LL‐061 (“CR”) at Table III‐1, Public Report, Certain Oil Country Tubular Goods from India, Korea, Philippines, Saudi Arabia, Taiwan, Thailand, Turkey, Ukraine, and Vietnam, Inv. Nos. 701‐TA‐499‐500 and 731‐TA‐1215‐1223 (Preliminary), USITC Pub. 4422 (Aug. 2013) (“PR”) at Table III‐1.
4
(1) Jindal India Ltd., Surya Global Steel Tubes Ltd., Maharashtra Seamless Ltd., Jindal Pipes Ltd., GVN Fuels Ltd., Jindal Saw Ltd., ISMT Ltd., producers and/or exporters of subject merchandise from India, and Jindal Saw Ltd. (US) and Indian Seamless Inc., U.S. importers (“the Jindal Group”);
(2) United Seamless Tubulaar Pvt. Ltd., a producer and exporter of subject merchandise, and Oil Country Tubular Ltd., an exporter of subject merchandise from India (collectively “USTPL/OCTL”);
(3) AJU Besteel Co., Ltd., Husteel Co., Ltd., Hyundai HYSCO, Nexteel Co., Ltd., SeAH Steel Corp., producers of subject merchandise; and Husteel USA, Inc., Hyundai USA, Inc., Hyundai HYSCO USA, Inc., SeAH Steel America, Inc., U.S. importers of subject merchandise (“Korean Respondent Group”)4;
(4) ILJIN Steel Corporation, a producer and exporter of subject merchandise from Korea (“ILJIN”);
(5) HLD Clark Steel Pipe Co., Ltd., a producer and exporter of subject merchandise from the Philippines (“Philippine Respondent”);
(6) Jubail Energy Services Company, a producer and exporter of subject merchandise from Saudi Arabia, and Duferco Steel Inc., a U.S. importer of subject merchandise (“Saudi Respondents”);
(7) Chung Hung Steel Corporation, Far East Machinery Co., Ltd., Kao Hsing Chang Iron and Steel Corp., Shin Yang Steel Co., Ltd., and Tension Steel Industries Co., Ltd., producers and exporters of subject merchandise from Taiwan (collectively “Taiwan Respondents”);
(8) WSP Pipe Co., Ltd. (“WSP”), a producer and exporter of subject merchandise from Thailand (“Thai Respondent”);
(9) Çayirova Boru Sanayi ve Ticaret A.S., Yücel Boru Ithalat‐Ihracat ve Pazarlama A.S. and Tosçelik Profil ve Sac Endustrisi A.S., Tosyali Dis Ticaret A.S., producers and exporters of subject merchandise from Turkey (collectively “Çayirova/Tosçelik”);
(10) Borusan Mannesmann Boru Sanayi ve Ticaret Anonim Sirketi, a producer and exporter of subject merchandise from Turkey ("Borusan");
(11) Interpipe, a producer and exporter of subject merchandise from Ukraine and North American Interpipe, Inc., a U.S. importer of subject merchandise (“Ukraine Respondents”);
(12) Hot Rolling Pipe Co., Ltd. Vietnam (“HRP”), a producer and exporter of subject merchandise from Vietnam; and
(13) SeAH Steel VINA Corporation (“SeAH”), a producer and exporter of subject merchandise from Vietnam.
U.S. industry data are based on the questionnaire responses of 13 producers, believed to account for the vast majority of U.S. production of OCTG.5 U.S. import data are based on official U.S. Department of Commerce (“Commerce”) import statistics and questionnaire responses from 46 U.S. importers.6 More specifically, import data consisted of the sum of: (i)
4 The Korean Respondent Group, Taiwan Respondents, and Borusan filed a joint postconference
brief. In connection with that brief, we refer to these respondents as the “Joint Respondents Group.” 5 CR at I‐5, PR at I‐4. 6 CR at IV‐1, PR at IV‐1; CR/PR at Table IV‐2.

5
official Commerce import statistics for casing and tubing (for which there are specific HTS statistical reporting numbers); (ii) data for coupling stock (for which there are not specific HTS statistical reporting numbers) obtained from importers; and (iii) imports of casing and tubing from the ***.7
The Commission received responses to its questionnaires from 32 foreign producers/exporters of subject merchandise, as follows:
• ten producers/exporters in India, accounting for virtually all U.S. imports of OCTG from India in 2012;8
• seven producers/exporters in Korea, accounting for virtually all U.S. imports of OCTG from Korea over the POI;9
• one producer/exporter in the Philippines, accounting for *** imports of OCTG from the Philippines in 2012;10
• two producers/exporters in Saudi Arabia, accounting for *** percent of imports of OCTG from Saudi Arabia in 2012;11
• four producers/exporters in Taiwan, accounting for virtually all imports of OCTG from Taiwan in 2012;12
• one producer/exporter in Thailand, accounting for *** imports of OCTG from Thailand in 2012;13
• three producers/exporters in Turkey, accounting for *** percent of imports of OCTG from Turkey in 2012;14
• two producers/exporters in Ukraine, accounting for *** imports of OCTG from Ukraine in 2012;15 and
• two producers/exporters in Vietnam, accounting for *** of all imports of OCTG from Vietnam in 2012.16
III. Domestic Like Product
A. In General
In determining whether there is a reasonable indication that an industry in the United States is materially injured or threatened with material injury by reason of imports of the subject merchandise, the Commission first defines the “domestic like product” and the
7 CR at IV‐1 n.2, PR at IV‐1 n.2; CR/PR at Table IV‐3; EDIS Doc. No. 516328. 8 CR at VII‐4, PR at VII‐3. 9 CR at VII‐9, PR at VII‐7. 10 CR at VII‐13, PR at VII‐9. 11 CR at VII‐17, PR at VII‐11. 12 CR at VII‐22, PR at VII‐13. 13 CR at VII‐26, PR at VII‐14. 14 CR at VII‐30, PR at VII‐16. 15 CR at VII‐34, PR at VII‐17. 16 CR at VII‐38, PR at VII‐19.
6
“industry.”17 Section 771(4)(A) of the Tariff Act of 1930, as amended (“the Tariff Act”), defines the relevant domestic industry as the “producers as a whole of a domestic like product, or those producers whose collective output of a domestic like product constitutes a major proportion of the total domestic production of the product.”18 In turn, the Tariff Act defines “domestic like product” as “a product which is like, or in the absence of like, most similar in characteristics and uses with, the article subject to an investigation.”19
The decision regarding the appropriate domestic like product(s) in an investigation is a factual determination, and the Commission has applied the statutory standard of “like” or “most similar in characteristics and uses” on a case‐by‐case basis.20 21 No single factor is dispositive, and the Commission may consider other factors it deems relevant based on the facts of a particular investigation.22 The Commission looks for clear dividing lines among possible like products and disregards minor variations.23 Although the Commission must accept Commerce’s determination as to the scope of the imported merchandise that is subsidized
17 19 U.S.C. § 1677(4)(A). 18 19 U.S.C. § 1677(4)(A). 19 19 U.S.C. § 1677(10). 20 See, e.g., Cleo Inc. v. United States, 501 F.3d 1291, 1299 (Fed. Cir. 2007); NEC Corp. v. Department
of Commerce, 36 F. Supp. 2d 380, 383 (Ct. Int’l Trade 1998); Nippon Steel Corp. v. United States, 19 CIT 450, 455 (1995); Torrington Co. v. United States, 747 F. Supp. 744, 749 n.3 (Ct. Int’l Trade 1990), aff’d, 938 F.2d 1278 (Fed. Cir. 1991) (“every like product determination ‘must be made on the particular record at issue’ and the ‘unique facts of each case’”). The Commission generally considers a number of factors including the following: (1) physical characteristics and uses; (2) interchangeability; (3) channels of distribution; (4) customer and producer perceptions of the products; (5) common manufacturing facilities, production processes, and production employees; and, where appropriate, (6) price. See Nippon, 19 CIT at 455 n.4; Timken Co. v. United States, 913 F. Supp. 580, 584 (Ct. Int’l Trade 1996).
21 In a semi‐finished products analysis, the Commission examines the following: (1) the significance and extent of the processes used to transform the upstream into the downstream articles; (2) whether the upstream article is dedicated to the production of the downstream article or has independent uses; (3) differences in the physical characteristics and functions of the upstream and downstream articles; (4) whether there are perceived to be separate markets for the upstream and downstream articles; and (5) differences in the costs or value of the vertically differentiated articles. See, e.g., Glycine from India, Japan, and Korea, Inv. Nos. 731‐TA‐1111‐1113 (Preliminary), USITC Pub. No. 3921 at 7 (May 2007); Artists' Canvas from China, Inv. No. 731‐TA‐1091 (Final), USITC Pub. No. 3853 at 6 (May 2006); Live Swine from Canada, Inv. No. 731‐TA‐1076 (Final), US1TC Pub. 3766 at 8 n.40 (Apr. 2005); Certain Frozen Fish Fillets from Vietnam, Inv. No. 731‐TA‐1012 (Preliminary), USITC Pub. No. 3533 at 7 (Aug. 2002).
22 See, e.g., S. Rep. No. 96‐249 at 90‐91 (1979). 23 See, e.g., Nippon, 19 CIT at 455; Torrington, 747 F. Supp. at 748‐49; see also S. Rep. No. 96‐249 at
90‐91 (Congress has indicated that the like product standard should not be interpreted in “such a narrow fashion as to permit minor differences in physical characteristics or uses to lead to the conclusion that the product and article are not ‘like’ each other, nor should the definition of ‘like product’ be interpreted in such a fashion as to prevent consideration of an industry adversely affected by the imports under consideration.”).

7
and/or sold at less than fair value,24 the Commission determines what domestic product is like the imported articles Commerce has identified.25 The Commission may, where appropriate, include domestic articles in the domestic like product in addition to those described in the scope.26
B. Product Description
In its notices of initiation, Commerce defined the imported merchandise within the scope of these investigations as follows:
The merchandise covered by the investigations is certain oil country
tubular goods (“OCTG”), which are hollow steel products of circular cross‐section, including oil well casing and tubing, of iron (other than cast iron) or steel (both carbon and alloy), whether seamless or welded, regardless of end finish (e.g., whether or not plain‐end, threaded, or threaded and coupled) whether or not conforming to American Petroleum Institute (“API”) or non‐API specifications, whether finished (including limited service OCTG products) or unfinished (including green tubes and limited service OCTG products), whether or not thread protectors are attached. The scope of the investigations also covers OCTG coupling stock.
Excluded from the scope of the investigations are: casing or tubing containing 10.5 percent or more by weight of chromium; drill pipe; unattached couplings; and unattached thread protectors.
The merchandise subject to the investigations is currently classified in the Harmonized Tariff Schedule of the United States (“HTSUS”) under item numbers: 7304.29.10.10, 7304.29.10.20, 7304.29.10.30, 7304.29.10.40, 7304.29.10.50, 7304.29.10.60, 7304.29.10.80, 7304.29.20.10, 7304.29.20.20, 7304.29.20.30, 7304.29.20.40, 7304.29.20.50, 7304.29.20.60, 7304.29.20.80, 7304.29.31.10, 7304.29.31.20, 7304.29.31.30, 7304.29.31.40, 7304.29.31.50, 7304.29.31.60, 7304.29.31.80, 7304.29.41.10, 7304.29.41.20, 7304.29.41.30, 7304.29.41.40,
24 See, e.g., USEC, Inc. v. United States, 34 Fed. Appx. 725, 730 (Fed. Cir. 2002) (“The ITC may not
modify the class or kind of imported merchandise examined by Commerce.”); Algoma Steel Corp. v. United States, 688 F. Supp. 639, 644 (Ct. Int’l Trade 1988), aff’d, 865 F.3d 240 (Fed. Cir.), cert. denied, 492 U.S. 919 (1989).
25 Hosiden Corp. v. Advanced Display Mfrs., 85 F.3d 1561, 1568 (Fed. Cir. 1996) (the Commission may find a single like product corresponding to several different classes or kinds defined by Commerce); Cleo, 501 F.3d at 1298 n.1 (“Commerce’s {scope} finding does not control the Commission’s {like product} determination.”); Torrington, 747 F. Supp. at 748‐52 (affirming the Commission’s determination defining six like products in investigations where Commerce found five classes or kinds).
26 See, e.g., Pure Magnesium from China and Israel, Inv. Nos. 701‐TA‐403 and 731‐TA‐895‐96 (Final), USITC Pub. 3467 at 8 n.34 (Nov. 2001); Torrington, 747 F. Supp at 748‐49 (holding that the Commission is not legally required to limit the domestic like product to the product advocated by the petitioner, co‐extensive with the scope).

8
7304.29.41.50, 7304.29.41.60, 7304.29.41.80, 7304.29.50.15, 7304.29.50.30, 7304.29.50.45, 7304.29.50.60, 7304.29.50.75, 7304.29.61.15, 7304.29.61.30, 7304.29.61.45, 7304.29.61.60, 7304.29.61.75, 7305.20.20.00, 7305.20.40.00, 7305.20.60.00, 7305.20.80.00, 7306.29.10.30, 7306.29.10.90, 7306.29.20.00, 7306.29.31.00, 7306.29.41.00, 7306.29.60.10, 7306.29.60.50, 7306.29.81.10, and 7306.29.81.50.
The merchandise subject to the investigations may also enter under the following HTSUS item numbers: 7304.39.00.24, 7304.39.00.28, 7304.39.00.32, 7304.39.00.36, 7304.39.00.40, 7304.39.00.44, 7304.39.00.48, 7304.39.00.52, 7304.39.00.56, 7304.39.00.62, 7304.39.00.68, 7304.39.00.72, 7304.39.00.76, 7304.39.00.80, 7304.59.60.00, 7304.59.80.15, 7304.59.80.20, 7304.59.80.25, 7304.59.80.30, 7304.59.80.35, 7304.59.80.40, 7304.59.80.45, 7304.59.80.50, 7304.59.80.55, 7304.59.80.60, 7304.59.80.65, 7304.59.80.70, 7304.59.80.80, 7305.31.40.00, 7305.31.60.90, 7306.30.50.55, 7306.30.50.90, 7306.50.50.50, and 7306.50.50.70.27
OCTG includes casing, tubing, and coupling stock of carbon and alloy steel used in oil
and gas wells.28 Casing is a circular pipe that serves as a structural retainer for the walls of the well. It typically has an outside diameter (“O.D.”) ranging from 4.5 inches to 20 inches and a length typically ranging from 34 feet to 48 feet. Casing provides a firm foundation for the drill string by supporting the walls of the hole to prevent caving in or wall collapse both during drilling and after the well is completed.29 Casing also serves as a surface pipe designed to prevent contamination of the recoverable oil and gas by surface water, gas, sand, or limestone.30 Tubing is a smaller‐diameter pipe (between 1.050–4.5 inches O.D.) installed inside the larger‐diameter casing that is used to conduct the oil or gas to the surface, either through natural flow or through pumping.31 Coupling stock is a thick‐walled, seamless tubular product used to manufacture coupling blanks. Coupling blanks, in turn, are unthreaded tube blanks used to make individual couplings. Couplings are thick‐walled and internally threaded seamless cylinders that are used to join two lengths of threaded OCTG.32 Casing and tubing are usually produced in accordance with specifications promulgated by the API.33
27 Certain Oil Country Tubular Goods from India, the Republic of Korea, the Republic of the Philippines, Saudi Arabia, Taiwan, Thailand, the Republic of Turkey, Ukraine, and the Socialist Republic of Vietnam: Initiation of Antidumping Duty Investigations, 78 Fed. Reg. 45505, 45512 (July
29, 2013); Certain Oil Country Tubular Goods from India and Turkey: Initiation of Countervailing Duty Investigations, 78 Fed. Reg. 45502, 45505 (July 29, 2013).
28 CR at I‐15, PR at I‐13. 29 CR at I‐18, PR at I‐15. 30 CR at I‐20, PR at I‐15. 31 CR at I‐20, PR at I‐17. 32 CR at I‐21, PR at I‐17. 33 CR at I‐20, PR at I‐17.

9
C. Arguments and Analysis
Petitioners argue that the Commission should find one like product that is coextensive with the scope of these investigations.34 The Joint Respondents Group agrees with the domestic like product definition proposed by Petitioners.35 ILJIN argues that the Commission should find that the following four products are separate domestic like products (rather than proposing alternative like product definitions): (i) finished seamless OCTG, (ii) finished welded OCTG, (iii) seamless green tubes, and (iv) welded green tubes.36 37
1. Whether a Clear Line Divides Seamless OCTG and Welded OCTG
Physical Characteristics and Uses. Seamless and welded OCTG both are generally produced in accordance with specifications promulgated by the API and are used in drilling for oil or natural gas.38 The weld line in welded OCTG represents a distinct physical characteristic not present in seamless OCTG.39 Both welded and seamless OCTG are used for the same purpose, for oil and gas wells. Seamless OCTG is either required or preferred in certain drilling conditions.40
Manufacturing Facilities, Production Processes and Employees. U.S. mills produce welded and seamless OCTG on separate production lines.41 While some domestic producers make both products, most make only one.42 Seamless OCTG is produced from a billet that is either pierced or extruded to form a hollow shell that is subsequently rolled. Welded OCTG is produced from steel sheet in coil form that is rolled and whose edges are heated and welded together to form a hollow shell.43 Seamless OCTG production facilities are considerably more expensive to build than welded OCTG production lines.44 Although the initial production processes are different for welded and seamless OCTG, the processes for heat treating (to the extent that the pipes are heat treated) and finishing are the same.
34 U.S. Steel Postconference Brief at Exh. 1, pp. 25‐27, Maverick Postconference Brief at 2‐3, and Joint
Petitioners’ Postconference Brief at 2‐3. 35 Joint Postconference Brief on Behalf of Respondents from Korea, Taiwan, and Turkey at 7 and
Response to Staff Questions at 14, and Conference Transcript (“Tr.”) at 241‐243 (Cameron). 36 ILJIN defines “green tubes” as “semifinished OCTG that is . . . processed by heat treating as well as
by other processes . . . before being sold in the U.S. merchant OCTG market.” ILJIN Postconference Brief at 11. ILJIN expresses doubt as to whether U.S. Steel uses a similar definition of “green tubes.” Id. at 12, n.32.
37 ILJIN Postconference Brief at 16‐27. 38 CR at I‐20, PR at I‐17. 39 CR at I‐30, PR at I‐23‐24 . 40 CR at II‐26, PR at II‐21‐22. 41 CR at I‐31, PR at I‐24. 42 CR at I‐31, PR at I‐24. 43 CR at I‐22‐23, PR at I‐18. 44 Tr. at 14 (Schagrin), 244 (Khandelwal), and 244‐245 (Blomberg).

10
Channels of Distribution. Almost all finished welded OCTG and finished seamless OCTG are sold to distributors.45
Interchangeability. Welded and seamless OCTG are interchangeable to a large extent, but not completely. Although seamless OCTG can be used in any welded OCTG application, the reverse is not true. Certain high‐stress applications, such as higher‐sulfur “sour service” applications, require seamless OCTG, and the seamless product may also be preferred in some applications to reduce risk.46 A witness for petitioners estimated that welded OCTG could be used for 70 percent of seamless applications, and a witness for respondents noted that they are interchangeable “a high percentage of the time.”47 Moreover, counsel for the Joint Respondent Group testified that the degree of overlap between seamless and welded OCTG that exists today is greater than when the Commission first decided to treat the two as a single like product almost 20 years ago.48
Producer and Customer Perceptions. As noted above, welded and seamless OCTG are produced on separate production lines, using different processes, and, as noted below, seamless OCTG sells at a substantial premium to the welded product. Seamless OCTG is required in some high‐stress applications and is regarded as being safer to use in others.49
Price. Average annual unit values of U.S. producers’ U.S. shipments show that finished seamless OCTG was selling at a substantial premium to finished welded OCTG between January 2010 and March 2013, the period of investigation (“POI”). For example, in 2012 the average unit value for seamless OCTG was $2,017, while the average unit value for welded OCTG was $1,512.50
Conclusion. Welded OCTG and seamless OCTG share basic physical characteristics. Their general uses in oil and gas wells are the same. They are made in different manufacturing facilities, using different processes, but they are subject to the same heat treatment and finishing. They share identical channels of distribution. There is a large degree of interchangeability between the two products, although welded OCTG cannot be used in certain demanding applications. Distinctions in the ways in which these products are made and priced will influence customer and producer perceptions of these products. Finally, the price premium for seamless OCTG is substantial.
On balance, in light of the identical channels of distribution, common basic physical characteristics and uses, and the large degree of interchangeability between the products, we do not find that seamless and welded OCTG are separate like products.
45 CR at I‐33, PR at I‐25. 46 CR at I‐30 and II‐26‐27, PR at I‐23‐24 and II‐21‐22. 47 Tr. at 109 (Matthews) and 261 (Brewer). 48 Tr. at 241 (Cameron). 49 CR at II‐26, PR at II‐21‐22. 50 CR/PR at Table I‐2.

11
2. Whether a Clear Line Divides Green Tubes from Finished OCTG
Based on the record of these preliminary phase investigations, our current understanding of the definition of “green tubes” is that these are unfinished tubular goods that may require heat treatment or further processing to meet the API specifications for casing and tubing. Green tubes need not always be heat treated before final use. In some cases, upgradeable green tubes that meet the minimum specifications for lower‐grade API 5CT casing and tubing (i.e., H40 and J55) can be certified to those grades and used in applications not requiring additional heat treatment, once they have been finished (i.e., if required, threaded and coupled). However, heat treatment will sometimes allow such tubes to meet minimum specifications for higher‐grade casing and tubing.51
Because the question of whether green tubes should be treated as a separate like product from finished OCTG involves a comparison of articles at different stages of processing, it is appropriate to analyze this like product issue using the semi‐finished product analysis.52
Dedication for Use. The record indicates that all green tubes are dedicated to the production of finished OCTG. In some cases, this will require heat treatment; in other cases, it will require only end‐finishing. Green tubes are unusable without being at least end finished.53
Separate Markets. ILJIN’s assertion that there are completely separate markets for green tubes and finished OCTG – with the former being sold to processors and the latter sold to distributors – is not fully supported by the current record. Some green tubes are sold to distributors who then arrange for the green tubes to be heat treated and/or finished.54 Moreover, green tubes sold to processors are frequently sold to distributors after heat treatment.55
Differences in Physical Characteristics and Functions of the Upstream and Downstream Articles. Green tubes intended for a specific OCTG application are typically produced to meet the specifications for that application (involving, for example, specific chemistries, tensile strength, wall thickness, and length).56 Thus, the specific characteristics of the green tube impart essential characteristics to the finished OCTG. Heat treatment does not change the physical appearance of the tubes, but it does change the microstructure and mechanical properties of pipes.57 The finishing process (upsetting pipe ends58 and threading them) does change the physical characteristics of the pipes to some extent, but renders them usable in
51 CR at I‐20‐21, PR at I‐17. 52 See, e.g., Drill Pipe and Drill Collars from China, Inv. Nos. 701‐TA‐474 and 731‐TA‐1176
(Preliminary), USITC Pub. 4127 at 7 (Mar. 2010). 53 CR at I‐32‐33, PR at I‐15. End finishing refers to the process of threading the end of a tube or casing
and adding a coupling. See CR at I‐28, PR at I‐22. 54 CR at I‐33 and I‐36, PR at I‐25 and I‐27. 55 CR at I‐36, PR at I‐27. 56 CR at I‐31, PR at I‐24. 57 CR at I‐27, PR at I‐21‐22. 58 “Upsetting” refers to a process in which the end of a pipe is heated to forging temperature, and
then inserted endwise into an upsetting machine. The machine pushes the hot metal back, creating a thicker wall at the end of the pipe. CR at I‐28, PR at I‐22.
12
their intended end use application.59 In sum, green tubes and finished OCTG share some physical characteristics, but are different in other respects.
Green tubes are an intermediate product that cannot be used in a well. However, green tubes have no function other than being processed into finished OCTG.60
Differences in Value. The current record shows that prices for green tubes are substantially lower than prices for finished OCTG. For example, U.S. mill shipments of green tube intended for OCTG applications to one processor had an average unit value of *** in 2012, in comparison to an average unit value of *** for U.S. shipments of finished OCTG.61 However, green tubes account for a not insubstantial part of the final cost of finished OCTG.62
Extent of Processes Used to Transform Upstream Product into Downstream Product. To the extent that green tubes are heat treated and finished, the processes used to transform the green tubes are substantial.63 As discussed below, the Commission has in past investigations involving OCTG found that processors that perform heat treatment engage in sufficient production‐related activity to qualify as domestic producers of OCTG. To the extent that green tubes are only end‐finished, the process used to transform green tubes into the downstream product is not as substantial.64 The Commission has in past investigations involving OCTG found that threaders do not engage in sufficient production‐related activity to qualify as domestic producers of OCTG.
Conclusion. While the available record information on this issue at the preliminary phase of these investigations is mixed, all green tubes are dedicated to the production of finished OCTG. Although the two products appear largely to be sold in different markets, there is some overlap in that some green tubes may be sold to distributors. Green tubes and finished OCTG share some basic physical characteristics, but not others. Their functions are different. There is a significant difference in the value of green tubes and finished OCTG. The extent of the processes involved in transforming green tube into finished OCTG varies depending on whether heat treatment is involved. On balance, for purposes of these preliminary determinations, there does not appear to be a clear dividing line between green tubes and finished OCTG, and we do not find that they are separate like products.65
59 CR at I‐28, PR at I‐22. 60 CR at I‐37, PR at I‐27‐28. 61 CR at I‐37, PR at I‐28. 62 See CR/PR at Table I‐3 (showing unit values for purchases of unfinished OCTG and U.S. shipments of
finished OCTG). 63 CR at I‐26‐28, PR at I‐21‐22. 64 CR at I‐28‐29, PR at I‐22‐23. 65 We note that some of the parties to the preliminary phase of these investigations may have been
using the term “green tube” to mean different things. Tr. at 266 (Treat). In some cases, they referred to a product that requires heat treatment before it can be used. Tr. at 222 (Cameron). In other cases, they used the term to encompass not only pipe that requires heat treatment, but also product that can be used without heat treatment once it is end‐finished. Tr. at 266‐67 (Cameron, Cunningham). The Commission intends to reconsider this issue in any final phase of these investigations, and examine the extent to which green tubes and finished OCTG are sold in separate markets. Parties are reminded that (Continued…)

13
IV. Domestic Industry
The domestic industry is defined as the domestic “producers as a whole of a domestic like product, or those producers whose collective output of a domestic like product constitutes a major proportion of the total domestic production of the product.”66 In defining the domestic industry, the Commission’s general practice has been to include in the industry producers of all domestic production of the like product, whether toll‐produced, captively consumed, or sold in the domestic merchant market.
A. Sufficient Production‐Related Activities
In deciding whether a firm qualifies as a domestic producer of the domestic like product, the Commission generally analyzes the overall nature of a firm’s U.S. production‐related activities, although production‐related activity at minimum levels could be insufficient to constitute domestic production.67
In prior OCTG investigations, the Commission found that the domestic industries (producing casing, tubing, and drill pipe)68 included processors, but did not include firms that perform basic threading and coupling operations (“threaders”). The Commission found that the heat treatment performed at processing facilities alters the microstructure or mechanical properties of the pipe. Moreover, processing operations, particularly concerning drill pipe, require dedicated equipment and significant levels of metallurgical and engineering expertise. Processors’ employment was substantial in relation to that of mills. Additionally, processing
(…Continued) if they want the Commission to collect additional data in any final phase investigations, they should so indicate in written comments to draft questionnaires, pursuant to 19 C.F.R. section 207.20(b), and state with precision the like product definitions that they propose.
66 19 U.S.C. § 1677(4)(A). 67 The Commission generally considers six factors: (1) source and extent of the firm’s capital
investment; (2) technical expertise involved in U.S. production activities; (3) value added to the product in the United States; (4) employment levels; (5) quantity and type of parts sourced in the United States; and (6) any other costs and activities in the United States directly leading to production of the like product. No single factor is determinative and the Commission may consider any other factors it deems relevant in light of the specific facts of any investigation. Diamond Sawblades and Parts Thereof from China and Korea, Inv. Nos. 731‐TA‐1092‐93 (Final), USITC Pub. 3862 at 8‐11 (July 2006).
68 The scope of these investigations is essentially the same as the scope of the investigation in the Commission’s recent 2010 investigation of certain oil country tubular goods from China. See Certain Oil Country Tubular Goods from China, Inv. No. 701‐TA‐463 (Final), USITC Pub. 4124 at 5 (Jan. 2010) (“2010 OCTG”). The scope of these investigations (and the 2010 China investigations) differs from prior investigations in that these investigations do not include drill pipe, but do include coupling stock. See Certain Oil Country Tubular Goods from Argentina, Italy, Japan, Korea, and Mexico, Inv. Nos. 731‐TA‐711 and 713‐TA‐716 (Second Review), USITC Pub. 3923 at 7 (June 2007); and Certain Oil Country Tubular Goods from Austria, Brazil, China, France, Germany, India, Indonesia, Romania, South Africa, Spain, Turkey, Ukraine, and Venezuela, Inv. Nos. 701‐TA‐428, 731‐TA‐992‐994 and 996‐1005 (Preliminary), USITC Pub. 3511 at 5 (May 2002).
14
operations were capital intensive. By contrast, the capital investments, technical expertise, and employment associated with threading and coupling operations were more limited.69
The record in these preliminary phase investigations does not indicate any changes in the nature of the activities performed by processors and threaders since the prior OCTG investigations.70 Thus, it provides no basis for treating processors and threaders differently than in prior OCTG investigations. We include processors but do not include threaders in the domestic industry.71
B. Related Parties
We must determine whether any producer of the domestic like product should be excluded from the domestic industry pursuant to Section 771(4)(B) of the Tariff Act. This provision allows the Commission, if appropriate circumstances exist, to exclude from the domestic industry producers that are related to an exporter or importer of subject merchandise or which are themselves importers.72 Exclusion of such a producer is within the Commission’s discretion based upon the facts presented in each investigation.73
69 E.g., Oil Country Tubular Goods from Argentina, Austria, Italy, Japan, Korea, Mexico, and Spain, Inv.
Nos. 701‐TA‐363‐364, 731‐TA‐711‐717 (Final), USITC Pub. 2911 at I‐3‐4 (Aug. 1995). 70 None of the parties to the preliminary phase of these investigations advocated treating processors
and threaders differently than in prior OCTG investigations, except that Maverick suggested that the Commission might reconsider its prior practice of treating processors that heat treat unfinished OCTG as domestic producers, in light of a May 2013 preliminary scope determination in which Commerce ruled that “green” tubes that are produced in China and heat treated, threaded, and coupled in a third country before being shipped to the United States remain a product of China. Maverick Postconference Brief at Exh. 1, pp. 14‐15. Commerce’s May 2013 preliminary scope determination, cited by Maverick, does not concern U.S. production operations and hence is not dispositive for the Commission’s analysis of whether U.S. processors engage in sufficient production‐related activity to be considered domestic producers. If any party wants to raise this issue in any final phase investigations, it should make appropriate comments at the questionnaire drafting stage to ensure appropriate data collection.
71 To properly analyze this issue, in any final phase of these investigations we will seek, inter alia, segregated data on OCTG imported into the United States (from subject and nonsubject sources), for heat treatment in the United States.
72 See Torrington Co. v. United States, 790 F. Supp. 1161, 1168 (Ct. Int’l Trade 1992), aff’d mem., 991 F.2d 809 (Fed. Cir. 1993); Sandvik AB v. United States, 721 F. Supp. 1322, 1331‐32 (Ct. Int’l Trade 1989), aff’d mem., 904 F.2d 46 (Fed. Cir. 1990); Empire Plow Co. v. United States, 675 F. Supp. 1348, 1352 (Ct. Int’l Trade 1987).
73 The primary factors the Commission has examined in deciding whether appropriate circumstances exist to exclude a related party include the following:
(1) the percentage of domestic production attributable to the importing producer; (2) the reason the U.S. producer has decided to import the product subject to investigation, i.e.,
whether the firm benefits from the LTFV sales or subsidies or whether the firm must import in order to enable it to continue production and compete in the U.S. market; and (Continued…)
15
One domestic producer, ***, imported OCTG directly from one of the subject countries during the POI.74 It is therefore a related party as defined by the statute.75 We find that appropriate circumstances do not exist to exclude *** from the domestic industry.
*** imported ***.76 The company ***.77 Its imports accounted for *** percent of its domestic production in that period,78 suggesting its primary interest is not in domestic production, as opposed to importation of the subject merchandise. ***, and *** with respect to other subject countries.79 The company’s operating income ratio was *** than that of any other domestic producer in interim 2013.80 81 82 We do not find it appropriate to exclude *** from the domestic industry, as it is a ***.83
(…Continued)
(3) the position of the related producer vis‐a‐vis the rest of the industry, i.e., whether inclusion or exclusion of the related party will skew the data for the rest of the industry. See, e.g., Torrington Co. v. United States, 790 F. Supp. at 1168.
74 CR/PR at Table III‐8. 75 Another domestic producer, ***, purchased subject merchandise. CR/PR at Table III‐8. The
Commission has previously concluded that a purchaser may be treated as a related party if it controls large volumes of subject imports. The Commission has found such control to exist when the domestic producer was responsible for a predominant proportion of an importer’s purchases and these purchases were substantial. See, e.g., Foundry Coke from China, Inv. No. 731‐TA‐891 (Final), USITC Pub. 3449 at 8‐9 (Sept. 2001). *** purchases of OCTG from ***. Its purchases of OCTG from ***. The purchases of the importers from which *** were not substantial. In the year in which its purchases of imports from ***. Accordingly, we do not treat *** as a related party.
76 CR/PR at Table III‐8. 77 CR/PR at Table III‐1 Note. 78 CR/PR at Table III‐8. 79 CR/PR at Table III‐1. 80 CR/PR at Table VI‐2. 81 Consistent with her practice in past investigations and reviews, Commissioner Aranoff does not rely
on individual‐company operating income margins, which reflect a domestic producer’s financial operations related to production of the domestic like product, in assessing whether a related party has benefitted from importation of subject merchandise. Rather, she determines whether to exclude a related party based principally on its ratio of subject imports to domestic production and whether its primary interests lie in domestic production or importation. ***.
82 For purposes of the preliminary phase of these investigations, Commissioner Pinkert does not rely upon *** financial performance in determining whether there are appropriate circumstances to exclude it from the domestic industry. In his view, the present record is not sufficient to link the producer’s financial performance with respect to its U.S. operations to any specific benefit it derives from its related party status.
83 For example, it produced *** of the 1,018,330 short tons produced by the domestic industry in interim 2013. CR/PR at Table III‐3.

16
V. Negligible Imports
Pursuant to Section 771(24) of the Tariff Act, imports from a subject country of merchandise corresponding to a domestic like product that account for less than 3 percent of all such merchandise imported into the United States during the most recent 12 months for which data are available preceding the filing of the petition shall be deemed negligible.84 The statute further provides that subject imports from a single country that account for less than 3 percent of such total imports of the product may not be considered negligible if there are several countries subject to investigation with negligible imports and the sum of such imports from all such countries accounts for more than 7 percent of all such merchandise imported into the United States.85
The Commission has found in prior investigations that the 12‐month period preceding the filing of the petition ends “with the last full month prior to the month in which the petition is filed, if those data are available.”86 As the petitions in these investigations were filed on July 2, 2013, and data are available for June 2013, the most recent 12 months for which data are available preceding the filing of the petition are July 2012 through June 2013. As discussed above, the Commission calculated the import data for this period using official import statistics for casing and tubing, data for coupling stock obtained from importers, and specific import data for ***.
There are four countries whose imports were below the applicable 3 percent statutory threshold:87 Taiwan (2.9 percent), the Philippines (2.2 percent), Saudi Arabia (*** percent), and Thailand (0.8 percent).88 The aggregate volume of imports from these countries is ***
84 19 U.S.C. §§ 1671b(a), 1673b(a), 1677(24)(A)(i), 1677(24)(B); see also 15 C.F.R. § 2013.1
(identifying certain developing countries for purposes of 19 U.S.C. § 1677(36) for which the relevant negligibility threshold is different in countervailing duty investigations).
85 19 U.S.C. § 1677(24)(A)(ii). The threshold is 9 percent for designated developing countries. 19 U.S.C. § 1677(24)(B).
86 Carbon and Certain Alloy Steel Wire Rod from Brazil, Canada, Egypt, Germany, Indonesia, Mexico, Moldova, South Africa, Trinidad and Tobago, Turkey, Ukraine, and Venezuela, Inv. Nos. 701‐TA‐417‐421 (Preliminary) and 731‐TA‐953‐963 (Preliminary), USITC Pub. 3456 at 8, n.37 (Oct. 2001. See also, e.g., Polyethylene Terephthalate Film, Sheet and Strip from Brazil, China, Thailand, and the United Arab Emirates, Inv. Nos. 731‐TA‐1131‐1134 (Preliminary), USITC Pub. 3962 at 12 n.68 (Nov. 2007) at 12, n. 68; Hydraulic Magnetic Circuit Breakers from South Africa, Inv. No. 731‐TA‐1033 (Preliminary), USITC Pub. 3600 at 9, n.43 (June 2003); Urea Ammonium Nitrate Solution from Belarus, Lithuania, Russia and Ukraine, Inv. Nos. 731‐TA‐1006‐1009 (Preliminary), USITC Pub. 3517 at 9, n.51 (June 2002). This practice was affirmed in Co‐Steel Raritan, Inc. v. United States, 244 F. Supp. 2d 1349 (Ct. Int’l Trade 2002), vacated on other grounds, Co‐Steel Raritan, Inc. v. United States, 357 F.3d. 1294 (Fed. Cir. 2004).
87 For purposes of countervailing duty investigations, India is among the countries classified as “developing countries” under 15 C.F.R . §2013.1, so the negligibility threshold for the countervailing duty investigation of subject imports from India is 4 percent. 19 U.S.C. § 1677(24)(B). Subject imports from India (at *** percent) are above that threshold. CR/PR at Table IV‐4.
88 CR/PR at Table IV‐4.

17
percent.89 Because this exceeds the statutory threshold of 7 percent, we do not find that imports from any of the subject countries are negligible.
VI. Cumulation
For purposes of evaluating the volume and price effects for a determination of reasonable indication of material injury by reason of subject imports, section 771(7)(G)(i) of the Tariff Act requires the Commission to cumulate subject imports from all countries as to which petitions were filed and/or investigations self‐initiated by Commerce on the same day, if such imports compete with each other and with the domestic like product in the U.S. market. In assessing whether subject imports compete with each other and with the domestic like product, the Commission generally has considered four factors:
(1) the degree of fungibility between subject imports from different
countries and between subject imports and the domestic like product, including consideration of specific customer requirements and other quality‐related questions;
(2) the presence of sales or offers to sell in the same geographic markets of subject imports from different countries and the domestic like product;
(3) the existence of common or similar channels of distribution for subject imports from different countries and the domestic like product; and
(4) whether the subject imports are simultaneously present in the market.90
While no single factor is necessarily determinative, and the list of factors is not exclusive, these factors are intended to provide the Commission with a framework for determining whether the subject imports compete with each other and with the domestic like product.91 Only a “reasonable overlap” of competition is required.92
Petitioners argue that all subject imports should be cumulated.93 USTPL/OCTL argues that imports from India should not be cumulated with those from other subject countries, or at
89 CR at IV‐8, PR at IV‐7. 90 See Certain Cast‐Iron Pipe Fittings from Brazil, the Republic of Korea, and Taiwan, Inv. Nos. 731‐TA‐
278‐80 (Final), USITC Pub. 1845 (May 1986), aff’d, Fundicao Tupy, S.A. v. United States, 678 F. Supp. 898 (Ct. Int’l Trade), aff’d, 859 F.2d 915 (Fed. Cir. 1988).
91 See, e.g., Wieland Werke, AG v. United States, 718 F. Supp. 50 (Ct. Int’l Trade 1989). 92 The Statement of Administrative Action (“SAA”) to the Uruguay Round Agreements Act (URAA),
expressly states that “the new section will not affect current Commission practice under which the statutory requirement is satisfied if there is a reasonable overlap of competition.” H.R. Rep. No. 103‐316, Vol. I at 848 (1994) (citing Fundicao Tupy, 678 F. Supp. at 902); see Goss Graphic Sys., Inc. v. United States, 33 F. Supp. 2d 1082, 1087 (Ct. Int’l Trade 1998) (“cumulation does not require two products to be highly fungible”); Wieland Werke, AG, 718 F. Supp. at 52 (“Completely overlapping markets are not required.”).
93 U.S. Steel Postconference Brief at 12‐14.

18
least not with imports from countries that export mostly semifinished OCTG to the United States.94 ILJIN argues that imports from countries that ship mostly semifinished OCTG should not be cumulated with those from countries that ship mostly finished OCTG.95 The Saudi Respondents argue that imports from Saudi Arabia should not be cumulated with those from other subject countries because competition is attenuated among imports from Saudi Arabia, other subject countries, and the domestic like product because the product from Saudi Arabia is high‐end seamless OCTG.96 The Ukraine Respondents requested that imports from Ukraine not be cumulated with those from other subject countries but did not specify a basis for their argument.97 HRP argues that imports from Vietnam should not be cumulated because such imports are an insignificant factor in the U.S. market and are not likely to grow significantly.98
The threshold requirement for cumulation is satisfied because Petitioners filed the antidumping duty and countervailing duty petitions with respect to the nine subject countries on the same day, July 2, 2013. In addition, none of the statutory exceptions to cumulation applies. As discussed below, we find a reasonable overlap of competition among subject imports from all nine countries and between subject imports from each source and the domestic like product.
Fungibility. Casing and tubing products, regardless of source, are generally produced in accordance with API standards.99 Most responding domestic producers and a majority of importers reported that subject imports from the subject countries are “always” or “frequently” used interchangeably with each other and with the domestic like product. The remaining domestic producers and importers indicated that OCTG from the subject countries are “sometimes” used interchangeably with each other and with the domestic like product.100 No domestic producers or importers reported that subject imports are “never” used interchangeably with each other and with the domestic like product.101
When asked whether differences other than price are ever significant in their sales in choosing between OCTG from different sources, the great majority of domestic producers responded “sometimes” or “never.”102 Importers were more divided on this question. A plurality of importers reported there were “sometimes” differences other than price between domestic and subject imports and between subject countries, but other responses were split between “always,” “frequently,” and “never.” 103
We recognize that there are several factors that limit the fungibility between and among subject imports from each source and the domestic like product. First, welded and seamless OCTG are not completely interchangeable. Imports from the subject countries tended to be
94 USTPL/OCTL Postconference Brief at 2‐7. 95 ILJIN Postconference Brief at 28‐29. 96 Saudi Respondents Postconference Brief at 27‐28. 97 Ukraine Respondents Postconference Brief at 8. 98 HRP Postconference Brief at 4‐7. 99 CR at II‐26, PR at II‐22. 100 CR/PR at Table II‐6. 101 CR/PR at Table II‐6. 102 CR/PR at Table II‐7. 103 CR/PR at Table II‐7.

19
concentrated in one product or the other: imports from Korea, the Philippines, Taiwan, Turkey, and Vietnam were almost exclusively welded OCTG; imports from Saudi Arabia, Thailand, and Ukraine were exclusively seamless OCTG; and imports from India were predominantly seamless OCTG.104 Although seamless OCTG can be used in any welded OCTG application, the reverse is not true. Certain high‐stress applications require seamless OCTG, and the seamless product may also be preferred in some applications to reduce risk.105 A witness for petitioners estimated that welded OCTG could be used for 70 percent of seamless applications and a witness for respondents noted that they are interchangeable in many cases from an engineering perspective.106 Fungibility may also be somewhat limited by requirements for premium connections or for alloy OCTG grades.107 Another factor that may limit fungibility somewhat is the extent to which subject countries and the domestic industry ship unfinished or finished OCTG. USTPL/OCTL contends that “the majority” of imports from India and some other subject countries are finished OCTG, while almost all imports from other subject countries consist of unfinished OCTG such as green tubes that have not been heat treated or threaded, and plain‐end pipe that generally has been heat treated but not threaded.108 We note, however, that USTPL/OCTL has not provided any data to support its claim that imports from particular countries are predominantly finished or unfinished OCTG. We intend to gather shipment data on finished OCTG, unfinished OCTG, and green tubes in any final phase of these investigations.109 We note however, that to the extent that any subject country exports an appreciable amount of both types of OCTG, this supports a finding of a reasonable overlap of competition.110 The domestic industry sells both unfinished and finished OCTG.111 As for the undocumented contentions of USTPL/OCTL and ILJIN that unfinished and finished OCTG do not compete with each other, the record suggests otherwise. For example, a distributor may weigh whether to buy plain‐end pipe (an unfinished product) and have it threaded and/or coupled by a finisher rather than buying a finished OCTG product.112
104 CR/PR at Table IV‐5. 105 CR at II‐26, PR at II‐21‐22. 106 CR at II‐26, PR at II‐21. 107 CR at II‐27‐28, PR at II‐22‐23. 108 USTPL/OCTL Postconference Brief at 2‐3. 109 Parties are encouraged to specify definitions for “unfinished OCTG,” “finished OCTG,” and “green
tubes” so that accurate shipment data can be gathered for these products. 110 The facts here are clearly distinguishable from those in the Lightweight Thermal Paper
investigation, on which USTPL/OCTL and ILJIN rely. In that case, all imports from one subject country were jumbo rolls, and all imports from the other subject country were slit rolls. The two forms could not be used interchangeably, and the Commission found no reasonable overlap of competition based on lack of fungibility. Certain Lightweight Thermal Paper from China and Germany, Inv. Nos. 701‐TA‐451 and 731‐TA‐1126‐1127 (Final), USITC Pub. 4043 at 12 (Nov. 2008). Contrary to ILJIN’s contention, the Commission did not purport to create any “rule” concerning cumulation of unfinished and finished articles.
111 Tr. at 87‐88 (Thompson) and U.S. Steel Postconference Brief at Exh. 1, p. 19. 112 See U.S. Steel Postconference Brief at Exh. 1, pp. 19‐20.

20
On balance, the record indicates a substantial degree of substitutability between and among subject imports from each source and the domestic like product, notwithstanding the factors that limit fungibility.
Channels of Distribution. Subject imports and the domestic like product shared the same channels of distribution. During the POI, the great majority of domestically produced and imported OCTG from each subject source were shipped to distributors.113
Geographic Overlap. The majority of imports from each subject source are concentrated in the Central Southwest.114 The Pacific Coast received the second greatest share of subject imports, with subject imports from *** that region.115 All responding U.S. producers reported making sales to the Central Southwest, and nine of 14 reported making sales to the Pacific Coast region.
Simultaneous Presence in Market. Subject imports from each subject source were present in the United States in each year of the POI and in interim 2013, except that there were no imports from the Philippines or Thailand in 2010.116 Subject imports from each subject source were present in the majority of the 39 months of the POI, except for imports from the Philippines (which were present in 17 months) and imports from Thailand (which were present in 19 months).117
Conclusion. In sum, because the relevant antidumping and countervailing duty petitions were filed on the same day, and the record indicates that there is a reasonable overlap of competition between and among subject imports and the domestic like product, we cumulate subject imports from India, Korea, the Philippines, Saudi Arabia, Taiwan, Thailand, Turkey, Ukraine, and Vietnam for purposes of our analysis of whether there is a reasonable indication of material injury.
VII. Reasonable Indication of Material Injury by Reason of Subject Imports
A. Legal Standard
In the preliminary phase of antidumping and countervailing duty investigations, the Commission determines whether there is a reasonable indication that an industry in the United States is materially injured or threatened with material injury by reason of the imports under investigation.118 In making this determination, the Commission must consider the volume of subject imports, their effect on prices for the domestic like product, and their impact on domestic producers of the domestic like product, but only in the context of U.S. production
113 CR at II‐1, PR at II‐1. 114 CR at II‐3, PR at II‐3, and CR/PR at Table II‐2. 115 CR at II‐3, PR at II‐3, and CR/PR at Table II‐2. 116 CR/PR at Table IV‐2. 117 CR/PR at Table IV‐6. 118 19 U.S.C. §§ 1671b(a), 1673b(a).

21
operations.119 The statute defines “material injury” as “harm which is not inconsequential, immaterial, or unimportant.”120 In assessing whether there is a reasonable indication that the domestic industry is materially injured by reason of subject imports, we consider all relevant economic factors that bear on the state of the industry in the United States.121 No single factor is dispositive, and all relevant factors are considered “within the context of the business cycle and conditions of competition that are distinctive to the affected industry.”122
Although the statute requires the Commission to determine whether there is a reasonable indication that the domestic industry is “materially injured by reason of” unfairly traded imports,123 it does not define the phrase “by reason of,” indicating that this aspect of the injury analysis is left to the Commission’s reasonable exercise of its discretion.124 In identifying a causal link, if any, between subject imports and material injury to the domestic industry, the Commission examines the facts of record that relate to the significance of the volume and price effects of the subject imports and any impact of those imports on the condition of the domestic industry. This evaluation under the “by reason of” standard must ensure that subject imports are more than a minimal or tangential cause of injury and that there is a sufficient causal, not merely a temporal, nexus between subject imports and material injury.125
In many investigations, there are other economic factors at work, some or all of which may also be having adverse effects on the domestic industry. Such economic factors might include nonsubject imports; changes in technology, demand, or consumer tastes; competition among domestic producers; or management decisions by domestic producers. The legislative history explains that the Commission must examine factors other than subject imports to ensure that it is not attributing injury from other factors to the subject imports, thereby inflating an otherwise tangential cause of injury into one that satisfies the statutory material
119 19 U.S.C. § 1677(7)(B). The Commission “may consider such other economic factors as are
relevant to the determination” but shall “identify each {such} factor ... {a}nd explain in full its relevance to the determination.” 19 U.S.C. § 1677(7)(B).
120 19 U.S.C. § 1677(7)(A). 121 19 U.S.C. § 1677(7)(C)(iii). 122 19 U.S.C. § 1677(7)(C)(iii). 123 19 U.S.C. §§ 1671b(a), 1673b(a). 124 Angus Chemical Co. v. United States, 140 F.3d 1478, 1484‐85 (Fed. Cir. 1998) (“{T}he statute does
not ‘compel the commissioners’ to employ {a particular methodology}.”), aff’g 944 F. Supp. 943, 951 (Ct. Int’l Trade 1996).
125 The Federal Circuit, in addressing the causation standard of the statute, has observed that “{a}s long as its effects are not merely incidental, tangential, or trivial, the foreign product sold at less than fair value meets the causation requirement.” Nippon Steel Corp. v. USITC, 345 F.3d 1379, 1384 (Fed. Cir. 2003). This was re‐affirmed in Mittal Steel Point Lisas Ltd. v. United States, 542 F.3d 867, 873 (Fed. Cir. 2008), in which the Federal Circuit, quoting Gerald Metals, Inc. v. United States, 132 F.3d 716, 722 (Fed. Cir. 1997), stated that “this court requires evidence in the record ‘to show that the harm occurred “by reason of” the LTFV imports, not by reason of a minimal or tangential contribution to material harm caused by LTFV goods.’” See also Nippon Steel Corp. v. United States, 458 F.3d 1345, 1357 (Fed. Cir. 2006); Taiwan Semiconductor Industry Ass’n v. USITC, 266 F.3d 1339, 1345 (Fed. Cir. 2001).

22
injury threshold.126 In performing its examination, however, the Commission need not isolate the injury caused by other factors from injury caused by unfairly traded imports.127 Nor does the “by reason of” standard require that unfairly traded imports be the “principal” cause of injury or contemplate that injury from unfairly traded imports be weighed against other factors, such as nonsubject imports, which may be contributing to overall injury to an industry.128 It is clear that the existence of injury caused by other factors does not compel a negative determination.129
Assessment of whether material injury to the domestic industry is “by reason of” subject imports “does not require the Commission to address the causation issue in any particular way” as long as “the injury to the domestic industry can reasonably be attributed to the subject imports” and the Commission “ensure{s} that it is not attributing injury from other sources to
126 SAA, H.R. Rep. 103‐316, Vol. I at 851‐52 (1994) (“{T}he Commission must examine other factors to
ensure that it is not attributing injury from other sources to the subject imports.”); S. Rep. 96‐249 at 75 (1979) (the Commission “will consider information which indicates that harm is caused by factors other than less‐than‐fair‐value imports.”); H.R. Rep. 96‐317 at 47 (1979) (“in examining the overall injury being experienced by a domestic industry, the ITC will take into account evidence presented to it which demonstrates that the harm attributed by the petitioner to the subsidized or dumped imports is attributable to such other factors;” those factors include “the volume and prices of nonsubsidized imports or imports sold at fair value, contraction in demand or changes in patterns of consumption, trade restrictive practices of and competition between the foreign and domestic producers, developments in technology and the export performance and productivity of the domestic industry”); accord Mittal Steel, 542 F.3d at 877.
127 SAA at 851‐52 (“{T}he Commission need not isolate the injury caused by other factors from injury caused by unfair imports.”); Taiwan Semiconductor Industry Ass’n, 266 F.3d at 1345. (“{T}he Commission need not isolate the injury caused by other factors from injury caused by unfair imports ... . Rather, the Commission must examine other factors to ensure that it is not attributing injury from other sources to the subject imports.” (emphasis in original)); Asociacion de Productores de Salmon y Trucha de Chile AG v. United States, 180 F. Supp. 2d 1360, 1375 (Ct. Int’l Trade 2002) (“{t}he Commission is not required to isolate the effects of subject imports from other factors contributing to injury” or make “bright‐line distinctions” between the effects of subject imports and other causes.); see also Softwood Lumber from Canada, Inv. Nos. 701‐TA‐414 and 731‐TA‐928 (Remand), USITC Pub. 3658 at 100‐01 (Dec. 2003) (Commission recognized that “{i}f an alleged other factor is found not to have or threaten to have injurious effects to the domestic industry, i.e., it is not an ‘other causal factor,’ then there is nothing to further examine regarding attribution to injury”), citing Gerald Metals, 132 F.3d at 722 (the statute “does not suggest that an importer of LTFV goods can escape countervailing duties by finding some tangential or minor cause unrelated to the LTFV goods that contributed to the harmful effects on domestic market prices.”).
128 S. Rep. 96‐249 at 74‐75; H.R. Rep. 96‐317 at 47. 129 See Nippon, 345 F.3d at 1381 (“an affirmative material‐injury determination under the statute
requires no more than a substantial‐factor showing. That is, the ‘dumping’ need not be the sole or principal cause of injury.”).

23
the subject imports.”130 131 Indeed, the Federal Circuit has examined and affirmed various Commission methodologies and has disavowed “rigid adherence to a specific formula.”132
The Federal Circuit’s decisions in Gerald Metals, Bratsk, and Mittal Steel all involved cases in which the relevant “other factor” was the presence in the market of significant volumes of price‐competitive nonsubject imports. The Commission interpreted the Federal Circuit’s guidance in Bratsk as requiring it to apply a particular additional methodology following its finding of material injury in cases involving commodity products and a significant market presence of price‐competitive nonsubject imports.133 The additional “replacement/benefit” test looked at whether nonsubject imports might have replaced subject imports without any benefit to the U.S. industry. The Commission applied that specific additional test in subsequent cases, including the Carbon and Certain Alloy Steel Wire Rod from Trinidad and Tobago determination that underlies the Mittal Steel litigation.
Mittal Steel clarifies that the Commission’s interpretation of Bratsk was too rigid and makes clear that the Federal Circuit does not require the Commission to apply an additional test nor any one specific methodology; instead, the court requires the Commission to have “evidence in the record ‘to show that the harm occurred ‘by reason of’ the LTFV imports,’” and requires that the Commission not attribute injury from nonsubject imports or other factors to
130 Mittal Steel, 542 F.3d at 877‐78; see also id. at 873 (“While the Commission may not enter an
affirmative determination unless it finds that a domestic industry is materially injured ‘by reason of’ subject imports, the Commission is not required to follow a single methodology for making that determination ... {and has} broad discretion with respect to its choice of methodology.”) citing United States Steel Group v. United States, 96 F.3d 1352, 1362 (Fed. Cir. 1996) and S. Rep. 96‐249 at 75.
131 Commissioner Pinkert does not join this paragraph or the following three paragraphs. He points out that the Federal Circuit, in Bratsk, 444 F.3d 1369, and Mittal Steel, held that the Commission is required, in certain circumstances when considering present material injury, to undertake a particular kind of analysis of nonsubject imports, albeit without reliance upon presumptions or rigid formulas. Mittal Steel explains as follows:
What Bratsk held is that “where commodity products are at issue and fairly traded,
price‐competitive, non‐subject imports are in the market,” the Commission would not fulfill its obligation to consider an important aspect of the problem if it failed to consider whether nonsubject or non‐LTFV imports would have replaced LTFV subject imports during the period of investigation without a continuing benefit to the domestic industry. 444 F.3d at 1369. Under those circumstances, Bratsk requires the Commission to consider whether replacement of the LTFV subject imports might have occurred during the period of investigation, and it requires the Commission to provide an explanation of its conclusion with respect to that factor.
542 F.3d at 878.
132 Nucor Corp. v. United States, 414 F.3d 1331, 1336, 1341 (Fed. Cir. 2005); see also Mittal Steel, 542 F.3d at 879 (“Bratsk did not read into the antidumping statute a Procrustean formula for determining whether a domestic injury was ‘by reason’ of subject imports.”).
133 Mittal Steel, 542 F.3d at 875‐79.
24
subject imports.134 Accordingly, we do not consider ourselves required to apply the replacement/benefit test that was included in Commission opinions subsequent to Bratsk.
The progression of Gerald Metals, Bratsk, and Mittal Steel clarifies that, in cases involving commodity products where price‐competitive nonsubject imports are a significant factor in the U.S. market, the Court will require the Commission to give full consideration, with adequate explanation, to non‐attribution issues when it performs its causation analysis.135
The question of whether the material injury threshold for subject imports is satisfied notwithstanding any injury from other factors is factual, subject to review under the substantial evidence standard.136 Congress has delegated this factual finding to the Commission because of the agency’s institutional expertise in resolving injury issues.137
B. Conditions of Competition and the Business Cycle
The following conditions of competition inform our analysis of whether there is a reasonable indication of material injury by reason of cumulated subject imports.
1. Demand Conditions
As the Commission has found in prior OCTG investigations and reviews, demand for OCTG is cyclical and largely driven by the level of activity in the U.S. economy, specifically in the oil and gas exploration and production sectors.138 Because oil and natural gas prices partly influence drilling activity, these prices also drive the demand for OCTG.139 The demand for OCTG is closely associated with the number of rigs and total footage of wells drilled in the United States.140
134 Mittal Steel, 542 F.3d at 873 (quoting from Gerald Metals, 132 F.3d at 722), 875‐79 & n.2
(recognizing the Commission’s alternative interpretation of Bratsk as a reminder to conduct a non‐attribution analysis).
135 To that end, after the Federal Circuit issued its decision in Bratsk, the Commission began to present published information or send out information requests in final phase investigations to producers in nonsubject countries that accounted for substantial shares of U.S. imports of subject merchandise (if, in fact, there were large nonsubject import suppliers). In order to provide a more complete record for the Commission’s causation analysis, these requests typically seek information on capacity, production, and shipments of the product under investigation in the major source countries that export to the United States. The Commission plans to continue utilizing published or requested information in final phase investigations in which there are substantial levels of nonsubject imports.
136 We provide in our respective discussions of volume, price effects, and impact a full analysis of other factors alleged to have caused any material injury experienced by the domestic industry.
137 Mittal Steel, 542 F.3d at 873; Nippon Steel Corp., 458 F.3d at 1350, citing U.S. Steel Group, 96 F.3d at 1357; S. Rep. 96‐249 at 75 (“The determination of the ITC with respect to causation is ... complex and difficult, and is a matter for the judgment of the ITC.”).
138 2010 OCTG, USITC Pub. 4124 at 12; CR at II‐12, PR at II‐11. 139 CR at II‐12, PR at II‐11. 140 CR at II‐1, PR at II‐1.

25
OCTG demand rose considerably during the POI. Apparent U.S. consumption of OCTG increased from 5.0 million short tons in 2010 to 6.1 million short tons in 2011 and 7.2 million short tons in 2012.141 Measures of OCTG demand increased sharply between January 2010 and November 2011 before beginning a small and irregular decline.142 Specifically, rig count and total footage drilled increased between 2010 and 2011, then declined slightly in 2012.143 Operator consumption figures, which track OCTG used by well operators, increased steadily from 2010 to 2012 before declining in the first half of 2013.144 Some responding producers and importers noted that demand has not increased in recent months.145
U.S. producers and respondents generally agree that demand for OCTG has risen sharply since January 2010.146 This is largely due to increased use of hydraulic fracturing (also known as “fracking”) and horizontal drilling and increased drilling spurred by higher oil prices.147 Since January 2010, horizontal drilling and fracking have played an increasing role in oil and gas exploration.148 Because both techniques allow wells to reach further, the footage of OCTG used when fracking and/or horizontal drilling is greater on a per well basis than the footage used in traditional vertical wells.149 This increase has also led to greater demand for premium and semi‐premium connections and threads for these high‐stress applications.150
2. Supply Conditions
The three sources of OCTG supply in the U.S. market are domestic shipments, imports of subject merchandise and imports from nonsubject countries. OCTG imports from China have all but disappeared from the U.S. market after antidumping and countervailing duty orders were imposed on OCTG from China in 2010.151
141 CR/PR at Table IV‐7. Apparent consumption for interim 2013 was 1.7 million short tons, slightly
lower than the 1.9 million short tons in interim 2012. 142 CR/PR at Figures II‐3, II‐4, and II‐5. 143 CR/PR at Figures II‐4 and II‐5. The number of rigs in the United States was around 1,200 at the
beginning of 2010, rose to around 1,700 in early 2011, and peaked at slightly greater than 2,000 in late 2011 before beginning to decline slowly through the first half of 2012 and more rapidly in the second half of that year. Rig count has hovered around 1,750 throughout the interim 2013 period. Total footage drilled was around 240 million feet in 2010, rose above 300 million feet in 2011, and dropped slightly, but remained over 300 million feet in 2012.
144 CR/PR at Figure II‐3. 145 CR at II‐19, PR at II‐16. 146 CR at II‐18, PR at II‐16; Korean Respondent Group Postconference Brief at 16 (incorporated by
reference by Taiwan and the Philippine Respondents, Borusan, USTPL/OCTL, the Jindal Group, Çayirova/Tosçelik, and HRP).
147 CR at II‐19, PR at II‐16. 148 CR at II‐1, PR at II‐1. 149 CR at I‐17‐18 and II‐1, PR at I‐14‐15 and II‐1. 150 CR at II‐27, PR at II‐22. 151 Exhibits to Testimony of Mr. Hecht, Skadden, Arps, Slate, Meagher and Flom LLC, Tr. Appendix at
2.

26
The 13 domestic producers that responded to the Commission’s U.S. producers’ questionnaire accounted for the vast majority of OCTG produced in the United States.152 The domestic industry’s capacity increased from 5.5 million short tons in 2010 to 5.7 million short tons in 2011 and 6.0 million short tons in 2012.153 Capacity utilization increased from 52.5 percent in 2010 to 60.7 percent in 2011 and 63.0 percent in 2012.154 U.S. producers have planned further expansions and additional plant openings in the current and following years.155 The 32 subject producers/exporters of OCTG that responded to the Commission’s questionnaires accounted for all or virtually all imports of OCTG in 2012 in eight of the nine subject countries in these investigations.156 Subject capacity rose from 2.2 million short tons in 2010 to 3.0 million short tons in 2011 and 3.2 million short tons in 2012.157 Subject capacity utilization also rose, from 58.6 percent in 2010 to 66.0 percent in 2011 and 69.8 percent in 2012.158 Contributing to this increased subject capacity are new production facilities in the Philippines and Thailand that petitioners allege were established by firms affiliated with producers in China now subject to U.S. antidumping and countervailing duty orders.159
152 CR at III‐1, PR at III‐1. 153 CR/PR at Table III‐3. The domestic industry’s capacity was 1.5 million short tons in interim 2012
and 1.6 million short tons in interim 2013. 154 CR/PR at Table II‐3. Capacity utilization was 69.7 percent in interim 2012 and 65.4 percent in
interim 2013. 155 CR/PR at Table III‐2. Table III‐2 lists the various investments, changes in production capacity,
acquisitions/mergers, and shutdowns in the domestic industry since 2010. The table lists 20 instances where producers have announced construction of additional facilities, upgraded equipment, added production lines, and/or commissioned new mills. Several producers also reported having to shutdown facilities temporarily due to lack of orders, curtail production, and/or curtail employment. CR at III‐5‐6, PR at III‐4.
For 2013 and beyond, Tenaris announced its intention to build a new seamless mill in Texas by 2016, Borusan and Mannesman broke ground on a mill in Texas that is expected to begin production of OCTG in 2015; Vallourec expects to begin heat treatment and finishing operations in a new mill in Ohio; Welded Tube has begun construction of a mill in New York that is expected to begin production in 2013; OMK commissioned a mill in Texas that is expected to reach full capacity by mid‐2013; Big River Steel announced a proposed mill with an annual capacity of 1.7 million short tons; and Texas Steel Conversion has ***. CR/PR at Table III‐2. See also CR/PR Table VI‐4, showing capital expenditures increasing from $269.0 million in 2010 to $711.1 million in 2011 and decreasing to $616.9 million in 2012.
156 CR at VII‐4, 9, 13, 17, 22, 26, 30, 34, and 38; PR at VII‐3, 7, 9, 11, 13, 14, 16, 17, and 19. Responding producers/exporters from Vietnam accounted for only *** percent of imports of OCTG from Vietnam in 2012. CR at VII‐38, PR at VII‐19.
157 CR/PR at Table VII‐19. Subject capacity was 802,900 short tons in interim 2012 and 817,800 short tons in interim 2013.
158 CR/PR at Table VII‐19. Subject capacity utilization was 70.5 percent in interim 2012 and 67.7 percent in interim 2013.
159 See CR at VII‐13, PR at VII‐9; CR at VII‐26, PR at VII‐14. The Philippine Respondent’s capacity increased from none in 2010 to *** short tons in 2011, and increased *** percent in 2012. Capacity utilization in the Philippines increased from *** percent in 2011 to *** percent in 2012. In Thailand, (Continued…)

27
Imports from nonsubject countries were present in the U.S. market throughout the POI.160 They originated from a variety of countries, including Canada, Japan, Germany, Mexico, Argentina, Austria, Russia, Romania, Colombia, Brazil, and Spain. The largest sources of nonsubject imports during the POI were Canada, Japan, Germany, Mexico, and Argentina.161 Several domestic producers have affiliates that produce OCTG in nonsubject countries such as ***.162
A sizeable portion of imports from subject and, to some degree, nonsubject sources consists of OCTG products that are further processed in the United States, such as green tubes that may not have been heat treated or threaded, as well as plain‐end pipe that may have been heat treated but not threaded. We will seek more information in any final phase of these investigations regarding the nature and extent of competition among OCTG products at the various stages of processing, including how the imported products compete with products manufactured domestically.
Inventories of U.S.‐produced OCTG and OCTG from subject countries both in the United States and in the subject countries are also a source of current supply. U.S. inventories of domestic product were at their lowest in 2010 and peaked in absolute terms in March 2012.163 Petitioners assert that the current inventories of OCTG from all sources represent approximately a 5 month supply and that this “inventory overhang” is too high.164 Cumulated inventories of subject imports in the United States have increased from 143,927 short tons in 2010, to 190,730 short tons in 2011, and reached 323,088 short tons in 2012.165 We will seek further information in any final phase investigations regarding factors which might affect inventory levels and seek parties’ comments on typical inventory levels in this industry.
3. Substitutability
OCTG is produced according to standards and specifications published by a number of organizations, including the API.166 Once a mill passes inspection and obtains API certification, it may begin marketing its OCTG as API grade.167 OCTG is usually produced in accordance with
(…Continued) capacity increased from none in 2010 to *** short tons in 2011, and *** short tons in 2012. Capacity utilization was *** percent in the first year of production and increased to *** percent in 2012.
160 CR/PR at Table IV‐2. 161 CR/PR at Table IV‐3. 162 CR/PR at Table III‐1. 163 CR at III‐14, PR at III‐ 8. Inventories as a percent of U.S. shipments, however, declined from 14.0
percent in 2010 to 12.4 percent in 2011 and 10.7 percent in 2012. They were 11.8 percent in interim 2012 and 12.0 percent in interim 2013.
164 U.S. Steel Postconference Brief at 49 (citing Petition Vol. I, Exhibit I‐53). 165 CR/PR at Table C‐1. 166 CR at I‐15, PR at I‐ 12. While other organizations and standards exist, for the purposes of these
investigations, we will identify different grades of OCTG using API standards and specifications. 167 Tr. at 120 (Miller).
28
API specification 5CT, which encompasses 22 separate grades of casing and tubing.168 OCTG is also produced in two forms: seamless or welded.
There is a high degree of substitutability between U.S.‐produced OCTG and imported OCTG that is of the same API grade and type.169 Most producers and importers indicated that subject imports and domestically produced OCTG are “always” or “frequently” interchangeable.170 A few importers indicated that domestic and subject country OCTG are only “sometimes” interchangeable, as discussed above. Petitioners assert that the POI was characterized by an increasing presence of “commodity grade” OCTG, as opposed to premium or proprietary OCTG.171 However, there is a lack of clarity in the record in these investigations as to the definitions of commodity, standard, semi‐premium, and premium OCTG.172 Nor does the record provide any clear explanation of how proprietary grades of OCTG fit into and/or overlap these categories and whether these designations apply to just pipe, the nature of the threading or end finishing, and/or also apply to coupling stock. We will seek further information in any final phase investigations, including but not limited to, the definition of premium OCTG, how specific API grades might correlate with commodity or premium grade OCTG, whether coupling stock can be manufactured in premium standards, and what percent of the market is occupied by proprietary, premium, semi‐premium, standard, and commodity OCTG. We invite party comments on the appropriate definitions in the comments on the draft questionnaires for the final phase of these investigations. We also intend to explore the extent to which such designations affect prices of the various OCTG products.
4. Other Conditions of Competition
OCTG in the United States is virtually always sold through a distributor. Approximately 99 percent of OCTG produced in the United States and at least *** percent of OCTG imported from seven of the nine subject countries was sold to a distributor during the POI.173 The remaining two subject countries, Saudi Arabia and Ukraine, sold *** percent, respectively, of their OCTG to distributors.174
U.S. distributors all reported selling a portion of their OCTG stock to end users through program sales. Program sales, which reportedly represent a sizeable portion of the U.S. market, are non‐contractual obligations among mills, distributors, and end users.175 Program sales arrangements lay out which type of OCTG is to be supplied, when it will be delivered, and
168 CR at I‐20 n.22, PR at I‐17, n.22. 169 CR at II‐22, PR at II‐18. 170 CR at II‐25, PR at II‐19. 171 See, e.g., Tr. at 29 (Matthews), 119 (Schagrin), and 120 (Thompson). 172 Tr. at 135‐36 (Thompson) (“{The difference between commodity, standard, semi‐premium and
premium OCTG} is a little bit confusing . . . . I think if you ask all of us, we’ll give you a different answer.”) 173 CR at II‐1, PR at II‐1. 174 CR at II‐1, PR at II‐1; CR/PR at Table II‐1. 175 CR at II‐28, PR at II‐23.
29
at what price.176 The majority of the respondents argued that they are locked out of program sales; due to geographic boundaries, they are unable to meet short deadlines or guarantee timely delivery.177 Only Korean Respondents and USTPL/OCTL reported participating in program sales, USTPL/OCTL to a “limited degree” and Korean Respondents as a “supplemental supplier.”178 It is unclear whether existing inventories in the U.S. market enable a supplier to participate in program sales. We will seek further information in any final phase investigations regarding program sales, specifically what share of the U.S. market they cover, how they operate, including to what extent other products can be substituted within a program sale agreement, and how prices for OCTG not sold in program sales affect program sale prices.
C. Volume of Subject Imports
Section 771(7)(C)(i) of the Tariff Act provides that the “Commission shall consider whether the volume of imports of the merchandise, or any increase in that volume, either in absolute terms or relative to production or consumption in the United States, is significant.”179
Cumulated subject imports have held a substantial presence in the U.S. market throughout the POI. Cumulated subject imports increased from 850,000 short tons in 2010 to 1.3 million short tons in 2011, and reached 1.8 million short tons in 2012.180 The absolute volume of cumulated subject imports increased sharply since 2010, when Commerce issued antidumping and countervailing duty orders on OCTG from China.181 As explained above, apparent U.S. consumption rose during 2010‐2012, increasing by 22.3 percent between 2010 and 2011 and by 16.8 percent between 2011 and 2012 for an overall increase of 42.8 percent between 2010 and 2012.182 The volume of cumulated subject imports rose faster, increasing by
176 CR at II‐28, PR at II‐23. 177 Saudi Arabia Postconference Brief at 21; Korea Respondents at 10‐11; Cayirova Postconference
Brief at 7; Ukraine Postconference Brief at 21; HRP Postconference Brief at 5; and Philippine Respondent Postconference Brief at 13. While ILJIN, SeAH, and Thai Respondents did not brief this issue, witnesses at the conference reported that all subject imports except for those from Korea were excluded from program sales. Tr. at 253‐259 (Brewer, Cameron, Echevaria, Fowler, Khandelwal, McConnell, and Simon).
178 USTPL/OCTL Postconference Brief at 10, citing Tr. at 194 (“In general, Indian producers participate only to a limited degree in program sales and high‐volume procurement bids with U.S. end users”); Joint Respondent Group Postconference Brief at 15.
179 19 U.S.C. § 1677(7)(C)(i). 180 CR/PR at Table IV‐2. Cumulated subject imports were 476,800 short tons in interim 2012 and
440,000 short tons in interim 2013. 181 Certain Oil Country Tubular Goods From the People’s Republic of China: Amended Final Affirmative
Countervailing Duty Determination and Countervailing Duty Order, 75 Fed. Reg. 3203 (Jan. 20, 2010); Certain Oil Country Tubular Goods From the People’s Republic of China: Amended Final Determination of Sales at Less Than Fair Value and Antidumping Duty Order, 75 Fed. Reg. 28551 (May 21, 2010).
182 CR/PR at Table C‐1. Apparent U.S. consumption in interim 2013 was 11.2 percent lower than in interim 2012. Id.

30
55.1 percent between 2010 and 2011 and by 37.2 percent between 2011 and 2012, for an overall increase of 112.8 percent between 2010 and 2012.183
The market share (by quantity) of cumulated subject imports increased from 17.0 percent in 2010 to 21.5 percent in 2011 and 25.3 percent in 2012.184 This gain in market share came at the expense of both the domestic industry and nonsubject imports. The domestic industry’s market share decreased from 53.7 percent in 2010 to 53.6 percent in 2011 and 50.0 percent in 2012.185 Nonsubject imports’ market share decreased by 4.6 percentage points from 29.3 percent in 2010 to 24.9 percent in 2011 and 24.7 percent in 2012.186
Cumulated subject imports of OCTG were also significant relative to domestic production. The ratio of cumulated subject imports to domestic production increased from 29.5 percent in 2010 to 37.8 percent in 2011 and to 47.9 percent in 2012.187
For purposes of these preliminary determinations, we find that the cumulated volume of subject imports, and the increase in that volume, is significant both in absolute terms and relative to consumption and production in the United States.
D. Price Effects of the Subject Imports
Section 771(7)(C)(ii) of the Tariff Act provides that, in evaluating the price effects of subject imports, the Commission shall consider whether –
(I) there has been significant price underselling by the imported merchandise as compared with the price of domestic like products of the United States, and
(II) the effect of imports of such merchandise otherwise depresses prices to a significant degree or prevents price increases, which otherwise would have occurred, to a significant degree.188
The record in these preliminary phase investigations indicates that subject imports and domestically produced OCTG made to the same specifications are highly substitutable and that price is an important factor in purchasing decisions.189
183 CR/PR at Table C‐1. The volume of cumulated subject imports in interim 2013 was 7.7 percent
lower than in interim 2012. Id. 184 CR/PR at Table IV‐8. Cumulated subject imports held 25.4 percent of U.S. market share in interim
2012 and 26.4 percent of market share in interim 2013. Id. 185 CR/PR at Table IV‐8. The domestic industry’s market share was 50.5 percent in interim 2012 and
55.1 percent in interim 2013. Id. 186 CR/PR at Tables IV‐8 and C‐1. U.S. imports from nonsubject countries were 5.6 percentage points
lower by quantity, and 4.3 percentage points lower by value, in interim 2013 than in interim 2012. Id. 187 CR/PR at Table IV‐9. The ratio was 45.3 percent in interim 2012 and 43.2 percent in interim 2013.
Id. 188 19 U.S.C. § 1677(7)(C)(ii). 189 CR/PR at Tables II‐6 and II‐7.

31
The Commission collected quarterly pricing data on six OCTG products.190 Eleven U.S. producers and 19 importers provided usable pricing data for sales of the requested products, although not all firms reported pricing for all products and all quarters.191 192
The pricing data show that the subject imports undersold the domestic like product in 153 of 192 possible comparisons, and oversold the domestic like product in the remaining 39 instances.193 The margins of underselling ranged up to 45.0 percent, and the average margin of underselling was 9.5 percent.194 Given the high frequency of underselling and the fact that price is an important consideration in purchasing decisions, we find the underselling to be significant.195
Overall, prices for the domestic like product between the first and the last quarter of the POI increased by between 0.1 and 6.7 percent. The increase in prices was not steady. In general, prices increased during 2010 and 2011, and decreased during 2012 and in the first quarter of 2013. Domestic prices were lowest for each of the 6 products in the first quarter of 2010 and highest in the second half of 2011 or first half of 2012. Pricing data for importers was more varied, both in terms of price changes between the first and last year of the period, and with respect to when the highest or lowest values were observed.196
There is evidence that subject imports had price suppressing effects on the domestic like product during the POI. Over the POI, the domestic industry’s ratio of cost of goods sold
190 The pricing products were: Product 1 ‐‐ Tubing, Grade L‐80, 2 7/8" O.D., 6.5 lbs./ft., threaded and
coupled, range 2, seamless; Product 2 ‐‐ Tubing, Grade J‐55, 2 3/8" O.D., 4.7 lbs./ft., threaded and coupled, range 2, welded; Product 3 ‐‐ Casing, Grade J‐55, 5 ½" O.D., 17.0 lbs./ft., threaded and coupled, range 3, welded; Product 4 ‐‐ Casing, Grade P‐110, 5 ½" O.D., 17.0 lbs./ft., threaded and coupled, range 3,seamless; Product 5 ‐‐ Casing, Grade J‐55, 8 5/8" O.D., 32.0 lbs./ft., threaded and coupled, range 3, welded; and Product 6 ‐‐ Casing, Grade J‐55, 9 5/8" O.D., 36.0 lbs./ft., threaded and coupled, range 3, welded. CR at V‐9‐10, PR at V‐6.
191 CR at V‐10, PR at V‐6. Reported pricing products represented 10.5 percent of U.S. shipments of U.S.‐produced products, and 2.8 percent of shipments of imported product from India, 3.8 percent of shipments of imported product from Korea, 3.2 percent of shipments of imported product from the Philippines, 3.2 percent of shipments of imported product from Saudi Arabia, 0.8 percent of shipments of imported product from Taiwan, 2.6 percent of shipments of imported product from Thailand, 10.1 percent of shipments of imported product from Turkey, 5.3 percent of shipments of imported product from Ukraine, and 6.9 percent of shipments of imported product from Vietnam. CR at V‐10, PR at V‐6‐7. We invite the parties in their comments on the draft questionnaires for the final phase of these investigations to comment on the proposed pricing products.
192 CR at V‐10, PR at V‐7. 193 CR at V‐27, PR at V‐17. 194 CR at V‐27, PR at V‐17. 195 Respondents argue that there is a strong preference among purchasers for the domestic product
due to shorter lead times, greater flexibility, and also for liability reasons, and that, for these reasons, customers require a discount when purchasing from import sources. E.g., Joint Respondents Brief at 14 and 25. There is not enough information on the record of the preliminary phase of these investigations for us to assess whether the domestic product commands a price premium, and if, so, the magnitude of that premium. We will explore this issue further in any final phase of these investigations.
196 CR at V‐23, PR at V‐ 14; CR/PR at Tables V‐4 to V‐9.

32
(“COGS”) to net sales increased each year.197 Despite an overall increase in apparent U.S. consumption, increases in annual net sales revenue were not enough to cover increases in costs, suggesting that the domestic industry was experiencing a cost/price squeeze.198
There is further support for our finding of evidence of price suppression in the record information on the lost sales and lost revenue experienced by the domestic industry. Petitioners made 74 lost sales allegations totaling $267 million and involving 155,408 short tons and 13 lost revenue allegations totaling $1.1 million and involving 12,372 short tons. In total, purchasers agreed with allegations totaling 32,940 short tons of lost sales, accounting for $53.8 million, as well as 9,905 short tons of lost revenue accounting for $935,287.199 Additionally, six of 15 responding producers reported switching to subject imports, with each reporting doing so for price reasons, and 11 of 14 responding importers reported U.S. producers had to reduce their prices to compete with OCTG from the subject countries.200
Accordingly, based on the record in the preliminary phase of these investigations, we find the price underselling by the subject imports to be significant and evidence that the price of subject imports prevented domestic price increases which otherwise would have occurred to a significant degree. We thus find for the purposes of these preliminary determinations evidence that subject imports had an adverse effect on prices of the domestic like product.
E. Impact of the Subject Imports201
Section 771(7)(C)(iii) of the Tariff Act provides that the Commission, in examining the impact of the subject imports on the domestic industry, “shall evaluate all relevant economic factors which have a bearing on the state of the industry.” These factors include output, sales, inventories, capacity utilization, market share, employment, wages, productivity, profits, cash flow, return on investment, ability to raise capital, research and development, and factors affecting domestic prices. No single factor is dispositive and all relevant factors are considered
197 The ratio of COGS to net sales increased from 77.3 percent in 2010 to 81.6 percent in 2011 and 82.8 percent in 2012. The ratio of COGS to net sales was 77.6 percent in interim 2012 and 86.2 percent in interim 2013. CR/PR at Table C‐1. The Joint Respondent Group argues that any increase in this ratio is due to an increase in the domestic industry’s factory costs associated with new entrants in the market. Joint Respondent Group Postconference Brief at 29‐30. We intend to explore this issue in any final phase of these investigations.
198 Unit net sales values were $1,615 in 2010, $1,696 in 2011, $1,729 in 2012. Unit COGS were $1,247 in 2010, $1,384 in 2011, $1,432 in 2012, $1,356.79 in interim 2012, and $1,351.82 in interim 2013. CR/PR at Table C‐1.
199 CR at V‐30‐31, PR at V‐20. 200 CR at V‐36, PR at V‐21. 201 In the notice initiating its antidumping duty investigations, Commerce estimated antidumping duty
margins of 12.67 percent to 239.64 for imports from India, 66.19 percent to 158.53 percent for imports from Korea, 46.04 percent to 56.38 percent for imports from the Philippines, 53.34 percent for imports from Saudi Arabia, 68.44 percent to 70.98 percent for imports from Taiwan, 118.32 percent for imports from Thailand, 44.52 percent to 47.20 percent for imports from Turkey, 25.75 percent to 30.76 percent for imports from Ukraine, and 103.43 percent to 111.47 percent for imports from Vietnam. CR at I‐12‐13, PR at I‐11.

33
“within the context of the business cycle and conditions of competition that are distinctive to the affected industry.”
The domestic industry’s production increased from 2.9 million short tons in 2010 to 3.5 million short tons in 2011 and 3.8 million short tons in 2012.202 The domestic industry’s production capacity was 5.5 million short tons in 2010, 5.7 million short tons in 2011, and 6.0 million short tons in 2012.203 Capacity utilization improved from 52.5 percent in 2010 to 60.7 percent in 2011 and 63.0 percent in 2012.204 The domestic industry’s U.S. shipments increased from 2.7 million short tons in 2010 to 3.3 million short tons in 2011 and 3.6 million short tons in 2012.205 Ending inventory quantities were 376,911 short tons in 2010, 406,604 short tons in 2011, and 382,718 short tons in 2012.206
The industry’s employment indicators improved throughout 2010‐2012.207 The number of production workers was 6,002 in 2010, 6,731 in 2011, and 7,453 in 2012.208 Hours worked totaled 12.7 million in 2010, 14.3 million in 2011, and 16.1 million in 2012.209 Wages paid were $345.5 million in 2010, $392.4 million in 2011, and $469.4 million in 2012.210
The domestic industry’s total net sales rose in the 2010‐2012 period.211 Total net sales were $4.6 billion in 2010, $5.9 billion in 2011, and $6.5 billion in 2012.212 Operating income increased from $620.5 million in 2010 to $645.1 million 2011, but then declined to $639.0 million in 2012. Of the $639.0 million in operating income recorded in 2012, $281.0 million was
202 CR/PR at Table III‐3. Production of 1.0 million short tons in interim 2013 was lower than 1.1
million short tons in interim 2012. Id. 203 CR/PR at Table III‐3. Capacity was higher, at 1.6 million short tons in interim 2013, than in interim
2012, when it was 1.5 million short tons. Id. 204 CR/PR at Table III‐3. Capacity utilization was 69.7 percent in interim 2012 and 65.4 percent in
interim 2013. Id. 205 CR/PR at Table III‐5. The industry’s U.S. shipments were 947,215 short tons in interim 2012 and
918,164 short tons in interim 2013. Id. 206 CR/PR at Table III‐7. Ending inventories were lower in interim 2013, at 439,450 short tons, than in
interim 2012, when they were 448,792 short tons. Id. 207 CR/PR at Table III‐9. Wages paid and productivity, however, were slightly lower in interim 2013
than in interim 2012. Id. 208 CR/PR at Table III‐9. There were 7,314 production workers in interim 2012 and 7,460 production
workers in interim 2013. Id. 209 CR/PR at Table III‐9. Hours worked were 4.1 million in both interim 2012 and interim 2013. Id. 210 CR/PR at Table III‐9. Wages paid were $120.8 million in interim 2012 and $120.1 in interim 2013.
Productivity (in short tons per 1,000 hours) was 227.8 in 2010, 243.9 in 2011, 234.1 in 2012, 259.7 in interim 2012, and 248.5 in interim 2013. Id.
211 CR/PR at Table VI‐1. 212 CR/PR at Table VI‐1. The domestic industry’s total net sales were $1.8 billion in interim 2012 and
$1.5 billion in interim 2013. Id.

34
recorded in the first quarter of that year.213 Operating income margins declined throughout the POI. They were 13.6 percent in 2010, 11.0 percent in 2011, and 9.8 in 2012.214
The domestic industry made significant capital expenditures during the POI‐‐ $269.0 million in 2010, $711.1 million in 2011, and $616.9 million in 2012.215 The parties were divided as to the significance of these expenditures. Petitioners contend that these investments in new plant and equipment make the domestic industry especially vulnerable to the effects of subject imports, because of the need to earn a reasonable return on these investments.216 Respondents argue that these investments are a sign of the domestic industry’s health.217 We invite further comment on this issue in any final phase of these investigations.
As discussed above, we have found the cumulated volume of subject imports and the market share of those imports to have been significant over the POI, that these imports undersold the domestic like product to a significant degree, and that there is evidence of price suppression by the subject imports. The domestic industry’s operating income and market share declined from 2011 to 2012, despite a robust increase in demand and available capacity over that period.218 A number of the domestic industry’s economic indicators were lower in interim 2013 than in interim 2012. Consequently, we find, for purposes of the preliminary phase of these investigations, that there is a reasonable indication that the large and increasing volume of subject imports had a material adverse impact on the domestic industry.
In conducting our impact analysis, we have also considered the role of nonsubject imports so as not to attribute injury from them to subject imports.219 The volume of nonsubject
213 CR/PR at Table VI‐1. 214 CR/PR at Table VI‐1. The operating margin was 5.8 percent in interim 2013, sharply lower than the
16.0 percent level in interim 2012. Operating income of $89.1 million in interim 2013 was sharply lower than the $281.0 million operating income in interim 2012. Id.
215 CR/PR at Table VI‐5. Capital expenditures were $130.7 million in interim 2012 and $88.4 million in interim 2013. The domestic industry’s research and development expenses were $2.1 million in 2010, $3.5 million in 2011, $6.4 million in 2012, $1.1 million in interim 2012, and $1.8 million in interim 2013. Id.
216 E.g., U.S. Steel Postconference Brief at 1‐2. 217 E.g., Joint Respondents’ Postconference Brief at 33‐34. 218 The domestic industry’s operating income fell from $645.1 million in 2011 to $639.0 million in
2012, and its market share fell from 53.6 percent to 50.0 percent, while U.S. consumption rose from 6.1 million short tons in 2011 to 7.2 million short tons in 2012. CR/PR at Table C‐1.
219 Based on the available evidence in these preliminary investigations, Commissioner Pinkert finds that price‐competitive nonsubject imports were a significant factor in the U.S. market for oil country tubular goods during the period of investigation. He also finds, however, that regardless of whether oil country tubular goods constitute a commodity product, nonsubject imports would not have replaced the subject imports without benefit to the domestic industry had the subject imports exited the market during the period. The average unit values of the nonsubject imports were consistently higher than those of the subject imports. CR/PR at Table IV‐2. Moreover, prices for nonsubject imports from Canada, the largest source of nonsubject imports, were higher than the prices for subject imports in 70 out of 109 possible instances and lower in 39 out of 109. CR/PR at Table IV‐3, D‐3. Thus, any replacement of the subject imports by nonsubject imports would generally have been at higher prices, which would have benefited the domestic industry.
35
imports increased in the 2010‐2012 period, but their market share declined, at the same time as the market share of subject imports increased. The volume of nonsubject imports was 1.47 million short tons in 2010, 1.53 million short tons in 2011, and 1.77 million short tons in 2012. The market share of these imports, measured by quantity, was 29.3 percent in 2010, 24.9 percent in 2011, and 24.7 percent in 2012.220 The average unit value of nonsubject imports was substantially higher than the average unit value of subject imports throughout the POI.221
VIII. Conclusion
For the reasons stated above, we determine that there is a reasonable indication that an industry in the United States is materially injured by reason of subject imports of OCTG from India, Korea, the Philippines, Saudi Arabia, Taiwan, Thailand, Turkey, Ukraine, and Vietnam that are allegedly sold in the United States at less than fair value and that are allegedly subsidized by the Governments of India and Turkey.
220 CR/PR at Tables IV‐2 and IV‐8. Both the volume and market share of nonsubject imports were
lower in interim 2013, at 307,457 short tons and 18.5 percent, than in interim 2012, when they were 451,279 short tons and 24.1 percent. Id.
221 CR/PR at Table IV‐2. We recognize that average unit values are of limited value because they may reflect differences in product mix rather than differences in price.


I‐1
PART I: INTRODUCTION
BACKGROUND
These investigations result from a petition filed with the U.S. Department of Commerce (“Commerce”) and the U.S. International Trade Commission (“USITC” or “Commission”) by United States Steel Corporation (“U.S. Steel”), Pittsburgh, PA; Maverick Tube Corporation (“Maverick”), Houston, TX; Boomerang Tube LLC (“Boomerang”), Chesterfield, MO; EnergeX, a division of JMC Steel Group (“EnergeX”), Chicago, IL; Northwest Pipe Company (“Northwest”), Vancouver, WA; Tejas Tubular Products Inc. (“Tejas”), Houston, TX; TMK IPSCO, Houston, TX; Vallourec Star (“Vallourec”), L.P., Houston, TX; and Welded Tube USA (“Welded”), Inc.; Lackawanna, NY, on July 2, 2013, alleging that an industry in the United States is materially injured and threatened with material injury by reason of subsidized imports of certain oil country tubular goods (“OCTG”)1 from India and Turkey, and less‐than‐fair‐value (“LTFV”) imports of OCTG from India, Korea, Philippines, Saudi Arabia, Taiwan, Thailand, Turkey, Ukraine, and Vietnam.2 The following tabulation provides information relating to the background of these investigations.3 4
Effective date Action
July 2, 2013 Petition filed with Commerce and the Commission; institution of Commission investigation (78 FR 41421, July 10, 2013)
July 23, 2013 Commission’s conference July 29, 2013 Commerce’s notice of initiation of countervailing duty and
antidumping duty investigations (78 FR 45502 and 45505, July 29, 2013)
August 16, 2013 Commission’s vote August 16, 2013 Commission’s determination August 23, 2013 Commission’s views
1 See the section entitled “The Subject Merchandise” in Part I of this report for a complete description of the merchandise subject to these investigations.
2 Maverick and Vallourec take no position with regard to the petition of the imposition of antidumping duties on OCTG from Saudi Arabia.
3 Pertinent Federal Register notices are referenced in app. A, and may be found at the Commission’s website (www.usitc.gov).
4 A list of witnesses appearing at the conference is presented in app. B of this report.

I‐2
STATUTORY CRITERIA AND ORGANIZATION OF THE REPORT
Statutory criteria
Section 771(7)(B) of the Tariff Act of 1930 (the “Act”) (19 U.S.C. § 1677(7)(B)) provides that in making its determinations of injury to an industry in the United States, the Commission‐‐
shall consider (I) the volume of imports of the subject merchandise, (II) the effect of imports of that merchandise on prices in the United States for domestic like products, and (III) the impact of imports of such merchandise on domestic producers of domestic like products, but only in the context of production operations within the United States; and. . . may consider such other economic factors as are relevant to the determination regarding whether there is material injury by reason of imports.
Section 771(7)(C) of the Act (19 U.S.C. § 1677(7)(C)) further provides that‐‐
In evaluating the volume of imports of merchandise, the Commission shall consider whether the volume of imports of the merchandise, or any increase in that volume, either in absolute terms or relative to production or consumption in the United States is significant. . . . In evaluating the effect of imports of such merchandise on prices, the Commission shall consider whether. . .(I) there has been significant price underselling by the imported merchandise as compared with the price of domestic like products of the United States, and (II) the effect of imports of such merchandise otherwise depresses prices to a significant degree or prevents price increases, which otherwise would have occurred, to a significant degree. . . . In examining the impact required to be considered under subparagraph (B)(i)(III), the Commission shall evaluate (within the context of the business cycle and conditions of competition that are distinctive to the affected industry) all relevant economic factors which have a bearing on the state of the industry in the United States, including, but not limited to . . . (I) actual and potential decline in output, sales, market share, profits, productivity, return on investments, and utilization of capacity, (II) factors affecting domestic prices, (III) actual and potential negative effects on cash flow, inventories, employment, wages, growth, ability to raise capital, and investment, (IV) actual and potential negative effects on the existing development and production efforts of the domestic industry, including efforts to develop a derivative or more advanced version of the

I‐3
domestic like product, and (V) in {an antidumping investigation}, the magnitude of the margin of dumping.
Organization of report
Part I of this report presents information on the subject merchandise, alleged dumping margins and subsidies, and domestic like product. Part II of this report presents information on conditions of competition and other relevant economic factors. Part III presents information on the condition of the U.S. industry, including data on capacity, production, shipments, inventories, and employment. Parts IV and V present the volume of subject imports and pricing of domestic and imported products, respectively. Part VI presents information on the financial experience of U.S. producers. Part VII presents the statutory requirements and information obtained for use in the Commission’s consideration of the question of threat of material injury as well as information regarding nonsubject countries.
MARKET SUMMARY
OCTG generally is used in oil and gas wells, and consists primarily of casing and tubing. The leading U.S. producers of OCTG are U.S. Steel and TMK IPSCO, both of which produce OCTG in multiple U.S. facilities and manufacture both seamless and welded OCTG. The leading producers of OCTG in subject countries include Maharashtra of India (“Maharashtra”), Hyundai HYSCO and AJU Besteel of Korea, HLD Clark of Philippines, Jaubail Energy Services Company (“JESCO”) of Saudi Arabia, Tension Steel Industries (“Tension Steel”) of Taiwan, WSP Pipe (“WSP”) of Thailand, Borusan of Turkey, Interpipe of Ukraine, and SeAH Steel Vina of Vietnam. Leading producers of OCTG in nonsubject countries include the following: Tenaris in Argentina; Tenaris, Evraz, and Vallourec in Canada; Vallourec and Benteler Steel/Tube in Germany; Nippon Steel Sumitomo Metals (NSSM), JFE Steel, Tenaris NKKTubes, and Maruichi Steel Tube in Japan; and Tenaris TAMSA in Mexico. The leading U.S. importers of OCTG from subject countries are ***. No other single U.S. importer of OCTG from subject countries accounted for more than six percent of the quantity of imported subject OCTG in 2012.5 Leading importers of OCTG from nonsubject countries (primarily Argentina, Canada, Germany, Japan, and Mexico) include ***. U.S. purchasers of OCTG include distributors ‐ which typically purchase directly from U.S. mills and U.S. importers ‐ as well as production and exploration companies that purchase from the distributors.
Apparent U.S. consumption of OCTG totaled approximately 7.2 million short tons ($11 billion) in 2012. Thirteen firms accounting for the large majority of U.S. production responded to the Commission’s request for data. U.S. producers’ U.S. shipments of OCTG totaled 3.6
5 Duferco is the sole importer of OCTG from Saudi Arabia and Interpipe imports virtually all OCTG from Ukraine.

I‐4
million short tons ($6.2 billion) in 2012, and accounted for 50.0 percent of apparent U.S. consumption by quantity and 54.9 percent by value. U.S. imports from subject sources totaled 1.8 million short tons ($2.0 billion) in 2012 and accounted for 25.3 percent of apparent U.S. consumption by quantity and 17.5 percent by value. U.S. imports from nonsubject sources totaled 1.8 million short tons ($3.1 billion) in 2012 and accounted for 24.7 percent of apparent U.S. consumption by quantity and 27.6 percent by value.
SUMMARY DATA AND DATA SOURCES
A summary of data collected in these investigations is presented in appendix C, tables C‐1 through C‐4. Except as noted, U.S. industry data are based on questionnaire responses of 13 firms that accounted for the vast majority of U.S. production of OCTG during 2012. Partial data submitted by a toll processor appears separately in appendix C. U.S. imports are based on official Commerce statistics except as noted. Additional information regarding nonbsubject price data appears in appendix D.
PREVIOUS AND RELATED INVESTIGATIONS
Antidumping and countervailing duty investigations
OCTG has been the subject of several Commission investigations. A listing of these investigations is presented in table I‐1.
Table I-1 OCTG: Previous and related investigations, 1984-2010
Original investigation Commission reviews Current status
Date Number Country Outcome Dates1 Outcomes
1984 701-TA-215 Brazil Affirmative - - ITA revoked 8/21/85
1984 701-TA-216 Korea Negative - - -
1984 701-TA-217 Spain Affirmative - - ITA revoked 7/31/85
1984 731-TA-191 Argentina Negative - - -
1984 731-TA-192 Brazil Affirmative2 - - Petition withdrawn
1984 731-TA-193 Korea Affirmative2 - - Petition withdrawn
1984 731-TA-194 Mexico Affirmative2 - - Petition withdrawn
1984 731-TA-195 Spain Affirmative - - ITA revoked 6/30/85 Table continued on next page.

I‐5
Table I-1--Continued OCTG: Previous and related investigations, 1984-2010
Original investigation Commission reviews Current status
Date Number Country Outcome Dates1 Outcomes
1985 701-TA-240 Austria Affirmative2 - - Petition withdrawn
1985 701-TA-241 Venezuela Affirmative2 - - Petition withdrawn
1985 701-TA-255 Canada Affirmative - - ITA revoked 7/10/91
1985 701-TA-256 Taiwan Negative - - -
1985 731-TA-249 Austria Affirmative2 - - Petition withdrawn
1985 731-TA-251 Venezuela Affirmative2 - - Petition withdrawn
1985 731-TA-275 Argentina Affirmative2 - - Terminated
1985 731-TA-276 Canada Affirmative 1999 / - Negative / - Revoked
1985 731-TA-277 Taiwan Affirmative 1999 / - Negative / - Revoked
1986 701-TA-271 Israel Affirmative - - ITA revoked 3/1/93
1986 731-TA-318 Israel Affirmative - - ITA revoked 7/27/99
1995 701-TA-363 Austria Negative - - -
1995 701-TA-364 Italy Affirmative 2001 / - Affirmative / - ITA revoked 12/26/06
1995 731-TA-711 Argentina Affirmative 2001 / 2006 Affirmative/Negative Revoked
1995 731-TA-712 Austria Negative - - -
1995 731-TA-713 Italy Affirmative 2001 / 2006 Affirmative/Negative Revoked
1995 731-TA-714 Japan Affirmative 2001 / 2006 Affirmative/Negative Revoked
1995 731-TA-715 Korea Affirmative 2001 / 2006 Affirmative/Negative Revoked
1995 731-TA-716 Mexico Affirmative 2001 / 2006 Affirmative/Negative Revoked
1995 731-TA-717 Spain Negative - - - Table continued on next page.

I‐6
Table I-1--Continued OCTG: Previous and related investigations, 1984-2010
Original investigation Commission reviews Current status
Date Number Country Outcome Dates1 Outcomes
2002 701-TA-428 Austria Negative2 - - -
2002 731-TA-992 Austria Negative2 - - -
2002 731-TA-993 Brazil Negative2 - - -
2002 731-TA-994 China Negative2 - - -
2002 731-TA-995 Colombia (3) - - -
2002 731-TA-996 France Negative2 - - -
2002 731-TA-997 Germany Negative2 - - -
2002 731-TA-998 India Negative2 - - -
2002 731-TA-999 Indonesia Negative2 - - -
2002 731-TA-1000 Romania Negative2 - - -
2002 731-TA-1001 South Africa Negative2 - - -
2002 731-TA-1002 Spain Negative2 - - -
2002 731-TA-1003 Turkey Negative2 - - -
2002 731-TA-1004 Ukraine Negative2 - - -
2002 731-TA-1005 Venezuela Negative2 - - -
2010 701-TA-463 China Affirmative - - Order in place
2010 731-TA-1159 China Affirmative - - Order in place
1 “Date” or “Dates” refers to the year in which the investigation, first review, or second review was instituted by the Commission. 2 Preliminary determination. 3 Following the withdrawal of the petition on Colombia and Commerce’s decision not to institute an investigation on OCTG from that country, the Commission discontinued its investigation No. 731-TA-995 (OCTG from Colombia). Source: Compiled from Commission determinations published in the Federal Register.
Safeguard investigations
Following receipt of a request from the Office of the United States Trade Representative (“USTR”) on June 22, 2001, the Commission instituted investigation No. TA‐201‐73, Steel, under section 202 of the Trade Act of 19746 to determine whether certain steel products, including seamless and welded OCTG,7 were being imported into the United States in such increased
6 19 U.S.C. § 2252. 7 Seamless and welded casing and tubing, as well as seamless drill pipe, were found to be a single
“like or directly competitive” product by Chairman Stephen Koplan, Vice Chairman Deanna Tanner Okun, and Commissioners Marcia E. Miller and Jennifer A. Hillman, while Commissioners Lynn M. Bragg and
(continued...)

I‐7
quantities as to be a substantial cause of serious injury, or the threat thereof, to the domestic industries producing articles like or directly competitive with the imported article.8 On July 26, 2001, the Commission received a resolution adopted by the Committee on Finance of the U.S. Senate (“Senate Finance Committee” or “Committee”) requesting that the Commission investigate certain steel imports under section 201 of the Trade Act of 1974.9 Consistent with the Senate Finance Committee’s resolution, the Commission consolidated the investigation requested by the Committee with the Commission’s previously instituted investigation No. TA‐201‐73.10 On December 20, 2001, the Commission issued its determinations and remedy recommendations. The Commission made a negative determination with respect to OCTG.11 The Commission also made a negative determination with respect to seamless tubular products other than OCTG.12
NATURE AND EXTENT OF ALLEGED SUBSIDIES AND SALES AT LTFV
Alleged subsidies
On July 29, 2013, Commerce published a notice in the Federal Register of the initiation of its countervailing duty investigation on OCTG from India and Turkey.13 The following programs in India are included:
I. Duty Exemption/Remission Schemes 1. Advance License Program (ALP) 2. Advance Authorization Program (AAP) 3. Duty Free Import Authorization Scheme (DFIA Scheme)
(…continued) Dennis M. Devaney found seamless and welded OCTG to be part of broader product groupings including all seamless carbon and alloy steel tubular products and all welded carbon and alloy steel tubular products, respectively. See, e.g., Steel, Inv. No. TA‐ 201‐73, Volume I: Determinations and Views of Commissioners, USITC Publication 3479, December 2001, pp. 17‐18; 152‐154; 274‐275; and 318‐319.
8 Institution and Scheduling of an Investigation under Section 202 of the Trade Act of 1974 (19 U.S.C. 2252) (the Act), 66 FR 35267, July 3, 2001.
9 19 U.S.C. § 2251. 10 Consolidation of Senate Finance Committee Resolution Requesting a Section 201 Investigation with
the Investigation Requested by the United States Trade Representative on June 22, 2001, 66 FR 44158, August 22, 2001.
11 Steel; Import Investigations, 66 FR 67304, December 28, 2001. Specifically, Chairman Koplan, Vice Chairman Okun, and Commissioners Miller and Hillman found seamless and welded casing and tubing, as well as seamless drill pipe, to be a single “like or directly competitive product,” and made a negative determination with respect to OCTG, while Commissioners Bragg and Devaney dissented, having made affirmative determinations with respect all seamless carbon and alloy steel tubular products and all welded carbon and alloy steel tubular products.
12 Ibid. This product includes coupling stock. See USITC Publication 3479, Vol. I, p. 13. 13 Certain Oil Country Tubular Goods From India and Turkey: Initiation of Countervailing Duty
Investigations, 78 FR 45502, July 29, 2013.

I‐8
4. Duty Entitlement Passbook Scheme (DEPS) and Successor Programs II. Subsidies for Export Oriented Units
1. Duty‐Free Import of Goods, Including Capital Goods and Raw Materials 2. Reimbursement of Central Sales Tax (CST) Paid on Goods Manufactured
in India 3. Duty Drawback on Fuel Procured from Domestic Oil Companies 4. Exemption from Payment of Central Excise Duty on Goods Manufactured
in India and Procured from a Domestic Tariff Area (DTA) III. Other Countervailable Subsidies Provided by the GOI
1. Export Promotion Capital Goods Scheme 2. Pre‐Shipment and Post‐Shipment Export Financing 3. Market Development Assistance (MDA) Scheme 4. Market Access Initiative 5. Focus Product Scheme 6. Government of India Loan Guarantees 7. Status Certificate Program 8. Income Tax Exemption Program Under Section 80‐IB of the Income Tax
Act 9. Target Plus Scheme
IV. Subsidies for Producers and Exporters Located in Special Economic Zones 1. Duty‐Free Importation of Capital Goods and Raw Materials, Components
Consumables, Intermediates, Spare Parts and Packing Material 2. Exemption from Payment of CST on Purchases of Capital Goods and Raw
Materials, Components Consumables, Intermediates, Spare Parts and Packing Material
3. Exemption from Electricity Duty and Cess on Electricity Supplied to a SEZ Unit
4. SEZ Income Tax Exemption 5. SEZ Service Tax Exemption 6. Steel Development Fund 7. Provision of Hot‐Rolled Steel by the Steel Authority of India for Less Than
Adequate Remuneration 8. Provision of Captive Mining Rights for Iron Ore 9. Provision of Captive Mining Rights for Coal 10. Provision of High‐Grade Iron Ore for Less Than Adequate Remuneration
V. Subsidies Under the SGAP Industrial Investment Promotion Policy 1. Grant Under the SGAP IIPP: 25 Percent Reimbursement of the Cost of
Land in Industrial Estates and Development Areas 2. Grant Under the SGAP IIPP: Reimbursement of Power at the Rate of Rs.
0.75 per Unit 3. Grant Under the SGAP IIPP: 50 Percent Subsidy for Expense Incurred for
Quality Certification 4. Grant Under the SGAP IIPP: 50 Percent Subsidy on Expenses Incurred in
Patent Registration

I‐9
5. Grant Under the SGAP IIPP: 25 Percent Subsidy on Cleaner Production Measures
6. Tax Incentives Under the SGAP IIPP: 100 Percent Reimbursement of Stamp Duty and Transfer Duty Paid for the Purchase of Land and Buildings and the Obtaining of Financial Deeds and Mortgages
7. Tax Incentives Under the SGAP IIPP: 25 Percent Reimbursement on Value Added Tax, CST, and State Goods and Services Tax
8. Tax Incentives Under the SGAP IIPP: Exemption from the SGAP Nonagricultural Land Assessment
9. Provision of Goods and Services for Less than Adequate Remuneration Under the SGAP IIPP: Provision of Infrastructure for Industries Located More than 10 Kilometers from Existing Industrial Estates or Development Areas
10. Provision of Goods and Services for Less than Adequate Remuneration Under the SGAP IIPP: Guaranteed Stable Prices and Reservation of Municipal Water
11. The APIIC’s Allotment of Land for Less than Adequate Remuneration 12. The APIIC’s Provision of Infrastructure 13. The SGOG’s Exemptions and Deferrals on Sales Tax for Purchases of
Goods 14. The SGOG’s VAT Remission Scheme Established on April 1, 2006 15. Provision of Land Use Rights for Less than Adequate Remuneration under
the Gujarat Industrial Development Corporation Estate Scheme 16. The SGOG’s Critical Infrastructure Project Scheme 17. The SGOG’s Scheme for Assistance to Industrial Parks/Industrial Estates
Set Up by Private Institutions 18. Gujarat Industrial Investment Corporation Financing 19. SGOG SEZ Act: Exemptions from Payment of Sales Tax, Stamp Duty and
Registration Fees 20. SGOM Sales Tax Program 21. VAT Refunds Under the SGOM Package Scheme of Incentives 22. Electricity Duty Exemptions Under the Package Scheme Incentives 1993 23. Refunds of Octroi Under the Package Scheme of Incentives 1993 (Octroi
Refund Scheme) 24. Octroi Loan Guarantees 25. Waiving of Loan Interest by SICOM 26. Investment Subsidies 27. Infrastructure Mega Projects Under the Maharashtra Industrial Policy
2006 28. Provision of Land for Less Than Adequate Remuneration
VI. Alleged Subsidies Under the Package Scheme of Incentives 2007 1. Subsidies for Mega Projects Under the Package Scheme of Incentives
2007 2. Exemption from Electricity Duty for Up to 15 Years

I‐10
3. Exemption from Stamp Duty 4. Reduced VAT Rates for Inputs and Raw Materials 5. Land and Infrastructure Provided in HSIIDC Industrial Estates for Less than
Adequate Remuneration The following programs in Turkey are included:
I. Provision of Hot‐Rolled Steel for Less than Adequate Remuneration II. Pre‐Shipment Export Credits from Turk Eximbank III. Turk Eximbank's Foreign Trade Company (“FTC”) Export Loans IV. Turk Eximbank’s Pre‐Export Credits Program V. Short‐term Export Credit Discount Program VI. Export Insurance Provided by Turk Eximbank VII. Large Scale Investment Incentives
1. Value Added Tax (“VAT”) and Customs Duty Exemptions 2. Large Scale Investment Incentives – Tax Reductions 3. Income Tax Withholding 4. Social Security and Interest Support 5. Land Allocation
VIII. Strategic Investment Incentives 1. VAT and Customs Duty Exemptions 2. Tax Reductions 3. Income Tax Withholding 4. Social Security and Interest Support 5. Land Allocation
IX. Deductions from Taxable Income for Export Revenue X. Incentives for Research & Development (“R&D”) Activities
1. Tax Breaks 2. Product Development R&D Support‐UFT
XI. Provision of Land for Less than Adequate Remuneration XII. Provision of Electricity for Less Than Adequate Remuneration XIII. Withholding of Income Tax on Wages and Salaries XIV. Exemption from Property Tax XV. Employers’ Share in Insurance Premiums Program XVI. Preferential Tax Benefits for Turkish OCTG Producers Located in Free Zones
Alleged sales at LTFV
On July 29, 2013, Commerce published a notice in the Federal Register of the initiation of its antidumping duty investigations on OCTG from India, Korea, Philippines, Saudi Arabia,

I‐11
Taiwan, Thailand, Turkey, Ukraine, and Vietnam.14 Commerce has initiated antidumping duty investigations based on estimated dumping margins of 12.67 percent to 239.64 percent for OCTG from India, 66.19 percent to 158.53 percent for OCTG from Korea, 46.04 percent to 56.38 percent for OCTG from Philippines, 53.34 percent for OCTG from Saudi Arabia, 68.44 percent to 70.98 percent for OCTG from Taiwan, 118.32 percent for OCTG from Thailand, 25.75 percent to 30.76 percent for OCTG from Ukraine, and 103.43 percent to 111.47 percent for OCTG from Vietnam.
THE SUBJECT MERCHANDISE
Commerce’s scope
Commerce has defined the scope of these investigations as follows:
OCTG, which are hollow steel products of circular cross‐section, including oil well casing and tubing, of iron (other than cast iron) or steel (both carbon and alloy), whether seamless or welded, regardless of end finish (e.g., whether or not plain end, threaded, or threaded and coupled) whether or not conforming to American Petroleum Institute (‘‘API’’) or non‐API specifications, whether finished (including limited service OCTG products) or unfinished (including green tubes and limited service OCTG products), whether or not thread protectors are attached. The scope of the investigations also covers OCTG coupling stock. Excluded from the scope of the investigations are: casing or tubing containing 10.5 percent or more by weight of chromium; drill pipe; unattached couplings; and unattached thread protectors.15
Tariff treatment
The imported OCTG subject to these investigations are classified in the 2013 Harmonized Tariff Schedule of the United States (“HTSUS”) in subheadings 7304.29, 7305.20, and 7306.29, casing and tubing of a kind used in drilling for oil and gas.16 The HTSUS statistical
14 Certain Oil Country Tubular Goods From India, the Republic of Korea, the Republic of the Philippines, Saudi Arabia, Taiwan, Thailand, the Republic of Turkey, Ukraine, and the Socialist Republic of Vietnam: Initiation of Antidumping Duty Investigations, 78 FR 45505, July 29, 2013.
15 Ibid and Certain Oil Country Tubular Goods From India and Turkey: Initiation of Countervailing Duty Investigations, 78 FR 45502, July 29, 2013.
16 The merchandise subject to the investigations is currently classified in the HTSUS under the following statistical reporting numbers: 7304.29.10.10, 7304.29.10.20, 7304.29.10.30, 7304.29.10.40, 7304.29.10.50, 7304.29.10.60, 7304.29.10.80, 7304.29.20.10, 7304.29.20.20, 7304.29.20.30, 7304.29.20.40, 7304.29.20.50, 7304.29.20.60, 7304.29.20.80, 7304.29.31.10, 7304.29.31.20, 7304.29.31.30, 7304.29.31.40, 7304.29.31.50, 7304.29.31.60, 7304.29.31.80, 7304.29.41.10,
(continued...)

I‐12
reporting numbers are provided for convenience and customs purposes only; the written description of the scope of these investigations is dispositive. The column 1‐general (most‐favored‐nation) rate of duty for these statistical reporting numbers, applicable to products subject to the investigations, is free.
THE PRODUCT17
Overview
Steel pipe and tubes are made in circular, rectangular, or other cross sections, and are generally manufactured by either the welded or seamless process. Steel pipe and tube manufactured by either process can be categorized by the carbon and alloy grades used in steel production. In addition, steel pipe and tube can be further categorized by end‐use. The American Iron and Steel Institute (AISI) has defined six such end‐use categories: standard pipe, line pipe, structural pipe and tubing, mechanical tubing, pressure tubing, and oil country tubular goods (OCTG).18
Steel pipes and tubes are generally produced according to standards and specifications published by a number of organizations, including the American Society for Testing and Materials (ASTM), the American Society of Mechanical Engineers (ASME), and the American Petroleum Institute (API). Comparable organizations in the United Kingdom, Japan, and Russia, and other countries also have developed standard specifications for steel pipes and tubes.
(…continued) 7304.29.41.20, 7304.29.41.30, 7304.29.41.40, 7304.29.41.50, 7304.29.41.60, 7304.29.41.80, 7304.29.50.15, 7304.29.50.30, 7304.29.50.45, 7304.29.50.60, 7304.29.50.75, 7304.29.61.15, 7304.29.61.30, 7304.29.61.45, 7304.29.61.60, 7304.29.61.75, 7305.20.20.00, 7305.20.40.00, 7305.20.60.00, 7305.20.80.00, 7306.29.10.30, 7306.29.10.90, 7306.29.20.00, 7306.29.31.00, 7306.29.41.00, 7306.29.60.10, 7306.29.60.50, 7306.29.81.10, and 7306.29.81.50.
The merchandise subject to the investigations may also enter under the following HTSUS statistical reporting numbers: 7304.39.00.24, 7304.39.00.28, 7304.39.00.32, 7304.39.00.36, 7304.39.00.40, 7304.39.00.44, 7304.39.00.48, 7304.39.00.52, 7304.39.00.56, 7304.39.00.62, 7304.39.00.68, 7304.39.00.72, 7304.39.00.76, 7304.39.00.80, 7304.59.60.00, 7304.59.80.15, 7304.59.80.20, 7304.59.80.25, 7304.59.80.30, 7304.59.80.35, 7304.59.80.40, 7304.59.80.45, 7304.59.80.50, 7304.59.80.55, 7304.59.80.60, 7304.59.80.65, 7304.59.80.70, 7304.59.80.80, 7305.31.40.00, 7305.31.60.90, 7306.30.50.55, 7306.30.50.90, 7306.50.50.50, and 7306.50.50.70.
17 Except as noted, information presented in the “Description and Applications” and “Manufacturing Processes” is drawn from Certain Oil Country Tubular Goods from China, Investigation No. 701‐TA‐463 (Final), USITC Publication 4124, January 2010.
18 Standard, line, and pressure pipe is generally intended to convey liquids and is typically tested and rated for its ability to withstand hydrostatic pressure. Structural pipe and tubing is used for load‐bearing purposes and construction, although only small amounts of seamless pipe are used in structural applications. Seamless mechanical tubing is typically a custom‐designed product employed within the automotive industry and by equipment manufacturers. OCTG are steel pipes and tubes used in the drilling of oil and gas wells and in the conveying of oil and gas from within the well to ground level.
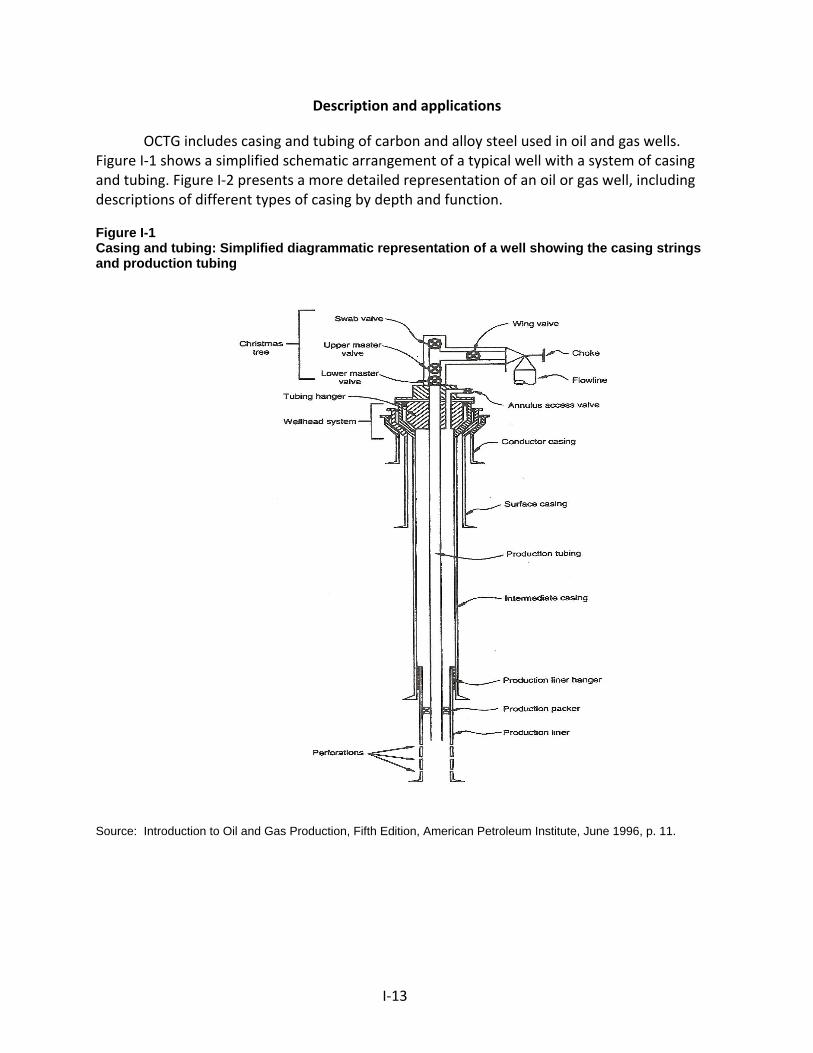
I‐13
Description and applications
OCTG includes casing and tubing of carbon and alloy steel used in oil and gas wells. Figure I‐1 shows a simplified schematic arrangement of a typical well with a system of casing and tubing. Figure I‐2 presents a more detailed representation of an oil or gas well, including descriptions of different types of casing by depth and function.
Figure I-1 Casing and tubing: Simplified diagrammatic representation of a well showing the casing strings and production tubing
Source: Introduction to Oil and Gas Production, Fifth Edition, American Petroleum Institute, June 1996, p. 11.

I‐14
Figure I-2 Casing and tubing: Subsurface components of an oil or gas well, including descriptions of different types of casing by depth and function
Source: La Plata County Energy Council, Inc. (Durango, CO), “Gas Facts: Gas Well Life Cycle,” found at http://www.energycouncil.org/gas-well-life-cycle, retrieved July 30, 2013.

I‐15
Recent advancements in oil and gas exploration technologies, including advanced horizontal drilling19 and hydraulic fracturing (figure I‐3),20 have enabled oil and gas wells to reach locations that were previously deemed cost‐prohibitive. In addition, the application of new technologies also permits more wells per acre, thus increasing oil and gas production and recoverable reserves.
Casing is a circular pipe that serves as a structural retainer for the walls of the well. Casing typically has an outside diameter (OD) ranging from 4.5 inches to 20 inches and a length typically ranging from 34 feet to 48 feet. Casing provides a firm foundation for the drill string21 by supporting the walls of the hole to prevent caving in or wall collapse both during drilling and after the well is completed. After the casing is set in the well hole, concrete is usually pumped down through the casing to the bottom of the well and then up the annulus (the space between the well wall and the casing) until the annulus is filled.
Casing also serves as a surface pipe designed to prevent contamination of the recoverable oil and gas by surface water, gas, sand, or limestone. Casing must be sufficiently strong to carry its own weight, as well as to resist both external pressure and pressure within the well. Casing can be threaded at both ends and connected with other casing pieces with couplings or connectors. Because the amount of open hole that can be drilled at any one time is limited, larger wells require a string of concentric layers of casing rather than a single casing. Several sizes of casing may be set inside the well after it has been drilled, with the larger sizes set at the top of the well, and the smaller sizes set toward the bottom.
19 Horizontal drilling is a variant of directional drilling in which vertical drilling within a well turns horizontal with the reservoir rock to expose more of the wellbore to the oil or natural gas. More oil and natural gas can be produced from fewer wells with less surface disturbance. American Petroleum Institute (API), “Advanced Drilling Techniques,” found at http://www.api.org/oil‐and‐natural‐gas‐overview/exploration‐and‐production/natural‐gas/advanced‐drilling, retrieved July 29, 2013. As of July 26, 2013, 60 percent of active rotary rigs (1,067 rigs) in the United States employed horizontal drilling, while 16 percent (287 rigs) employed directional drilling. Baker Hughes International Inc., “North American Rotary Rig Count,” July 26, 2013.
20 Hydraulic fracturing (commonly referred to as “fracking”) requires the high‐pressure injection of a mixture of water, sand, and chemicals through the well and into the surrounding shale rock formations, creating a network of narrow fractures in the rock. The fractures allow more oil and natural gas to enter through perforations made in the casing and tubing.
21 The drill string consists of three different nonsubject products: drill pipe, drill collars, and the drill bit.

I‐16
Figure I-3 Casing and tubing: Horizontal drilling and hydraulic fracturing
Source: American Petroleum Institute (API), “The Facts About Hydraulic Fracturing and Seismic Activity,” 2013.

I‐17
Tubing is a smaller‐diameter pipe (between 1.050–4.5 inches OD) installed inside the larger‐diameter casing that is used to conduct the oil or gas to the surface, either through natural flow or through pumping. Substances such as lubricants are also pumped into the well through the tubing for well treatment. Tubing must be strong enough to support its own weight, that of the oil or gas, and that of any pumping equipment suspended on the string. Tubing, like casing, usually is produced in accordance with API specification 5CT.22
Green tube refers to unfinished tubular goods that may require heat treatment or further processing to meet the API 5CT specifications for casing and tubing. In some cases, “upgradeable” green tube that meets the minimum specifications for lower‐grade API 5CT casing and tubing (i.e., H40 and J55) can be certified to those grades and used in applications not requiring additional heat treatment.23 In other instances, depending on its steel composition and wall thickness, green tube that meets certain non‐heat treatable grades of the API specification for casing and tubing (e.g., H40 and J55) can be subsequently heat treated to increase yield and tensile strengths in order to meet the minimum specifications for higher‐grade API 5CT casing and tubing (e.g., P110).24 25 Finished casing and tubing typically refers to product that has been heat treated, tested, threaded, and coupled.
Coupling stock is a thick‐walled, seamless tubular product used to manufacture coupling blanks. Coupling blanks, in turn, are unthreaded tube blanks used to make individual couplings. Couplings are thick‐walled and internally threaded seamless cylinders that are used for joining two lengths of threaded OCTG. Couplings are produced and certified to the same API grade and type as the OCTG to which the couplings are joined. Coupling typically accounts for 2‐3 percent of the weight of end‐finished tubing or casing.
22 The API specification 5CT designates 22 separate grades of casing and tubing. Grades are generally classified and ranked by their minimum yield strength, and are identified by a letter (i.e., H, J, K, N, M, L, C, T, P, and Q; with “H” being the weakest and “Q” being the strongest) and a number (minimum yield strength in thousands of pounds per square inch, or “ksi”). Thus, grade J55 or K55 stipulates that the pipe have minimum yield strengths of 55,000 ksi (J55 and K55 differ with respect to minimum tensile strengths). In addition, an API grade may be further delineated by chemical composition, method of production (i.e., seamless or welded), dimension, heat treatment, testing procedures, and other engineering specifications, depending on customers’ requirements. For example, Grade L80, type 9Cr must contain 8‐10 percent chromium by weight, produced by the seamless manufacturing process, and be tempered and quenched. Certain OCTG must be heat treated to achieve particular physical characteristics.
23 Green tube certified to these grades undergo further finishing operations, including threading. Finishing operations are described in the Manufacturing Processes section of Part I.
24 Conference transcript, pp. 222–223 (Fowler); U.S. Steel postconference brief, exh. 1, pp. 18–19. 25 API 5CT grades H40, J55, K55, and certain N80 grades do not require heat treatment. According to
industry representatives, these grades are generally considered the carbon grades. Other API grades such as certain N80 grades, L80, and P110 do require heat treatment, followed by threading and coupling, to finish the pipe. These pipes are generally considered alloy grades. Maverick postconference brief, exh. 1, p. 10.

I‐18
Manufacturing processes
The manufacturing process for casing and tubing includes forming and finishing phases. The forming phase takes place entirely at the manufacturing facility or mill. Finishing, by contrast, may take place at the mill or at a processing or threading facility.
Forming phase
OCTG mills manufacture casing and tubing either by the seamless process or by the electric‐resistance‐welding (“ERW”) process, a lower‐cost method than the seamless process, depending on the service requirements. By contrast, mills manufacture coupling stock for OCTG couplings exclusively through the seamless process.
Seamless OCTG is manufactured by either of two high‐temperature methods to form a central cavity in a solid steel billet; namely, the rotary piercing method and the hot extrusion method. Round or square billets serve as the input for seamless tubing (figure I‐4). If a square billet is used, it is first forced through a circular roll pass, which transformed the billet from square to round for the piercing operation. In the rotary piercing method, the heating billet is gripped by angled rolls, which cause the billet to rotate and advance over a piercer point, forming a hole though the length of the billet. In the extrusion method, the billet is hot punch‐pierced and then extruded axially through a die and over a mandrel, forming a hollow shell. The hollow shell produced by either method is then rolled with a fixed plug or with a continuous mandrel inside the shell to reduce the wall thickness and increase the shell’s length. Finally, the shell is rolled in a sizing mill or a stretch‐reducing mill where it is formed to size.
Welded OCTG is manufactured from steel sheet in coil form (figure I‐5). The steel sheet is slit to the width that corresponds to the desired diameter of tube. The slit sheet passes through a series of rollers while at ambient temperature and forms a tubular shape. The edges are then heated by electric resistance and welded together by heat and pressure, without the addition of filler metal. The welding pressure causes some of the metal to be squeezed from the welding joint, forming a bead of metal on the inside and outside of the tube. This bead, or welding flash, is usually trimmed from both the outside and the inside surfaces.

I‐19
Figure I-4 Casing and tubing: Seamless manufacturing process
Source: JFE Steel Corporation, OCTG (Product Catalog).

I‐20
Figure I-5 Casing and tubing: ERW manufacturing process
Source: JFE Steel Corporation, OCTG (Product Catalog).

I‐21
Finishing phase After the forming phase, the pipe is heat‐treated, upset, and threaded. U.S. pipe mills
typically are equipped with the facilities necessary to perform these processes. However, there are various non‐pipe producers, known as processors or threaders, which can perform certain aspects of the finishing operations. Independent processors operate facilities that are capable of full‐body heat treatment, as well as upsetting pipe ends.26 Threaders are capable of threading and coupling, hydrostatic testing, and measuring the length of OCTG products. Some processors and threaders may also manufacturing couplings that become part of finished OCTG. According to an industry source in a prior Commission investigation, processors and threaders mainly serve imports since OCTG are often imported as plain ends, and are heat treated, upset, and threaded in the United States. This approach provides distributors with the flexibility to process and thread the product in compliance with a variety of specifications, thus allowing them to serve a variety of consumer needs.27
Heat treatment
In the steel manufacturing process, specific engineering characteristics and mechanical
properties of the steel can be achieved through the application of different heat treatments. Heat treating may involve one or more heating cycles in either a continuous or batch furnace, with controlled rates of cooling. Specific heat treating requirements depend on the grade of steel being processed. For welded pipe, the heat treatment may cover the welded seam only, or the full cross‐section of the pipe. API standards specify a documented procedure for every particular grade and type of pipe. API‐specific heat treatment processes in the production of casing and tubing including annealing, normalizing, and quench and tempering.
Annealing is a single heat treatment process that prepares the steel for fabrication or service. The steel is heated to a temperature in or near a specific range, and cooled at a predetermined rate or cycle. Annealing relieves internal residual stresses or hardness induced by welding, by cold working, or by machining.
In the normalizing process, the pipe is heated above a specific temperature, held at this temperature for a specified time, and then air‐cooled. Normalizing refines the steel grain size
26 Most processors typically perform threading operations, although many threaders do not perform processing operations like heat treatment. For this reason, the term “processor” in this and other sections of this report is meant to include processors who are also threaders. Discussion of independent threaders is limited in this report, as the Commission in recent OCTG investigations has not deemed threaders to be part of the domestic industry producing casing and tubing. Oil Country Tubular Goods from Argentina, Italy, Japan, Korea, and Mexico, Investigation Nos. 731‐TA‐711 and 713‐716 (Second Review), USITC Publication 3923, June 2007, p. 9. Certain Oil Country Tubular Goods from China, Investigation No. 701‐TA‐463 (Final), USITC Publication 4124, January 2010, p. I‐18.
27 Certain Oil Country Tubular Goods from China, Investigation No. 701‐TA‐463 (Final), USITC Publication 4124, January 2010, p. I‐18.

I‐22
and obtains a carbide size and distribution that is more suitable for future heat treatment than the as‐rolled structure.
Quenching and tempering is a sequential process in which the pipe is heated to a specific temperature for a specified time period to modify the steel’s microstructure, and then “quenched” in a cooling medium such as water, oil, or air, depending on the thickness of the pipe. After quenching, the steel is very brittle and must be reheated and then cooled under specific conditions. This process is called “tempering.” The pipe must undergo a specified process of quenching and tempering in order to qualify for certain API grades. Depending on the pipe design, API standards may specify a single heat treatment process or combination of processes for the pipe, such as normalizing and tempering, or quenching and tempering. After heat treatment, sizing rolls shape the tube to accurate diameter tolerances. The product is cooled and then cut to length at the end of the tube mill.
Coupling stock is made to the same grade and type specifications as casing and tubing. It must also be subject to the same heat treatment as pipe, except where specified by the purchaser.
Upsetting and threading
Casing and tubing are finished by threading and the attachment of a suitable coupling to
one end of each length. For some casing or tubing that is subject to severe or sour service,28 it is necessary to provide additional strength in the joint, and for this reason, the ends of the pipe are upset before threads are cut. In the upsetting process, the end of the pipe is heated to forging temperature, and then inserted endwise into an upsetting machine. The machine pushes the hot metal back, creating a thicker wall at the end of the pipe. The upsetting may be controlled to displace the extra thickness to the inside or the outside of the pipe.
Casing and tubing can be joined directly using male (outer) and female (inner) threading, or by using couplings with female threads on each end. Typically, the pipe is mounted on a lathe and threads are cut by using sharp steel cutting tools (called chasers), which are mounted on a threading die surrounding the pipe. As the pipe is turned on the lathe, the threading die moved along the pipe’s axis, producing the required spiral cut on the inner or outer surface of the pipe. Threading can be made to meet API standards, or made to proprietary standards that are designed, registered, and protected by patents or other intellectual property rights mechanism and that are not specified by API standards. For instance, OCTG producers may market proprietary “semi‐premium” or “premium” threaded connections that provide higher torsional loads, bending resistance, or greater sealability for casing in challenging drilling
28 Sour crude oil or sour gas is defined as an oil/gas containing common impurities such as water, carbon dioxide, hydrogen sulfide, and oxygen, which are mixed in with the oil/gas during extraction. These impurities corrode or cause cracking in steel; albeit, without any observable change in appearance prior to failure.

I‐23
environments.29 After threading, a thread protector is applied to the threaded pipe ends during handling, transportation, or storage.30
DOMESTIC LIKE PRODUCT ISSUES
The Commission’s decision regarding the appropriate domestic products that are “like” the subject imported product is based on a number of factors including: (1) physical characteristics and uses; (2) common manufacturing facilities and production employees; (3) interchangeability; (4) customer and producer perceptions; (5) channels of distribution; and (6) price. Information regarding these factors is discussed below, followed by a discussion of intermediate products in the following section.
The petition in these investigations explicitly includes seamless and welded OCTG regardless of end finish, as well as unfinished OCTG, including green tubes that require further processing such as heat treatment. Petitioners contend that the Commission should find one domestic like product coextensive with Commerce’s scope.31 Petitioners argue that the Commission should continue its practice of including green tubes and semifinished products in the like product.32 Moreover, Petitioners contend that seamless and welded OCTG should not be regarded as separate like products because the Commission has concluded that seamless and welded OCTG are part of the same like product in past investigations.33
Respondent ILJIN Steel Corporation (Korea) (“ILJIN”) argues that semifinished seamless and welded green tube intended for OCTG should each constitute a separate like product. ILJIN also argues the Commission should reconsider the issue of whether finished seamless and welded OCTG belong in the same like product.34
Physical characteristics and uses
As discussed earlier in this chapter, OCTG primarily consists of casing and tubing of carbon and alloy steel used in oil and gas wells. Casing provides structural support for wells while tubing conducts liquids and gases up and down the wells. Seamless and welded casing and tubing are generally produced in accordance with API specification 5CT and, as discussed previously, are used in drilling for oil or natural gas. The weld line formed by the ERW
29 For instance, U.S. Steel and Tenaris both produce and market various semi‐premium and premium threaded connections.
30 Threading can be performed after transportation to avoid damage caused by movement, water, or weather. Damaged threads can cause expensive ruptures of the pipe string in casing and tubing applications where pipes are connected to one another by threaded joints.
31 Petition, p. 20. 32 Petitioner U.S. Steel’s postconference brief, p. 9‐10. 33 Petitioner U.S. Steel’s postconference brief, p. 9. 34 ILJIN Steel Corporation (Korea) (“ILJIN”)’s postconference brief, pp. 16 and 19.

I‐24
production process represents a distinct physical characteristic not present in seamless OCTG. As a result, welded OCTG is not acceptable in certain drilling conditions.35
Green tube intended for OCTG refers to unfinished tubular goods that require heat treatment or further processing to meet the API 5CT specifications for casing and tubing. Green tubing intended for an OCTG application is typically produced to meet the specifications for that particular application, and not for other applications, such as drill pipe. As such, a green tube produced for an OCTG application generally cannot be further processed to become alternative products such as drill pipe.36
Manufacturing facilities and production employees
OCTG casing and tubing is produced either by the seamless process or by the ERW process, depending on the service requirements. The API specification 5CT designates 19 separate grades of casing and tubing by manufacturing process and heat treatment, 13 of which can be produced by either the seamless or ERW process. Seamless OCTG is produced from a billet that is either pierced or extruded to form a hollow shell that is subsequently rolled. Welded OCTG is produced from steel sheet in coil form that is rolled and whose edges are heated and welded together to form a hollow shell. Green tubing is also produced by either process.
U.S. mills produce welded and seamless OCTG on separate production lines. U.S. producers such as U.S. Steel and TMK IPSCO, however, manufacture both seamless and welded pipe. These two mills alone accounted for more than *** of U.S. OCTG production in 2012. U.S. processors also heat treat both unfinished welded OCTG and unfinished seamless OCTG.37
Respondent ILJIN does not dispute the fact that most API grades specify that casing and tubing can be made by either the seamless or welded process.38 However, this Respondent argues that within a given API grade, there will be some applications for which either seamless or welded OCTG suffice, and other applications where the greater reliability of seamless OCTG is necessary.39
35 One witness for U.S. Steel indicated that seamless OCTG could be supplied for all welded OCTG application, and that welded OCTG could be supplied for approximately 70 percent of seamless applications, but not for such applications as sour service. Conference transcript, p. 109 (Matthews).
36 ***, staff telephone interview, July 31, 2013. See also conference transcript, p. 88 (Clark). Mr. Clark specified that Vallourec’s small amount of green tubes is specific to casing to tubing, rather than drill pipe.
37 Questionnaire responses of U.S. Steel, TMK IPSCO, and Tejas. 38 ILJIN’s postconference brief, July 26, 2013, p. 25. 39 ILJIN’s postconference brief, July 26, 2013, p. 25.

I‐25
Interchangeability and customer and producer perceptions
Respondent ILJIN argues that seamless OCTG is more suitable than welded OCTG for applications requiring greater strength and reliability, and therefore the two products are not completely interchangeable.40 As discussed above, U.S. producers also identify certain conditions or applications for which welded casing and tubing are not interchangeable for seamless casing and tubing. Nonetheless, U.S. producers generally considered the two forms of OCTG to be “interchangeable” (U.S. Steel), “almost interchangeable” for the “vast majority of the market” (Maverick), or in competition with the exception of “the very high end sour service market” (Vallourec).41
Green tube for casing and tubing requires heat treatment to achieve the final grade. Thus, green tube, like all unfinished forms of OCTG, requires additional processing steps to be considered ready for downhole applications. The U.S. industry is not believed to focus on “upgradeable” OCTG (carbon‐grade casing and tubing that, after heat treatment, certified to higher API grades). Nonetheless, some U.S. mills are believed to produce such products.42
Channels of distribution
Although the Commission did not collect separate data specific to U.S. producers’ shipments of welded OCTG and seamless OCTG, U.S. producers sell virtually all of their U.S.‐produced casing and tubing to distributors. As discussed in Part II of this report, more than 98 percent of all such shipments are to distributors.
Because most mills maintain their own heat‐treatment operations, U.S.‐produced green tube is believed to be sold in very limited quantities.43 U.S. Steel, believed to be one of the larger mills selling green tube, reported shipping *** percent of its green tube to processors in 2010, *** percent in 2011, and *** percent in 2012. Conversely, U.S. Steel shipped *** percent of its green tube to distributors in 2012, *** percent in 2011, and *** percent in 2012.44
40 ILJIN’s postconference brief, July 26, 2013, p. 24. 41 Conference transcript, pp. 99–100 (Matthews, Lowe, Clark). 42 See, e.g., press release from Northwest Pipe announcing the expansion into tubing “with physical
properties for heat treating.” Northwest Pipe Company’s Tubular Products Group to Upgrade Mill in Houston, Texas, February 8, 2011. See also conference transcript, pp. 222 (Fowler). Mr. Fowler testified that upgrading was a relatively recent development that permitted suppliers to serve multiple market sectors. Mr. Fowler further indicated that the practice was “popular” with importers, but noted also that “some domestic mills” were “taking advantage” of the process.
43 Conference transcript, p. 88 (Clark, Mahoney, and Thompson), with further elaboration on behalf of U.S. Steel regarding shipments of green tube in recent years. U.S. Steel’s postconference brief, exh. 1, p. 19.
44 Correspondence from ***, August 6, 2013. U.S. Steel ***.

I‐26
Price
Respondent ILJIN argues that seamless OCTG sells at a premium over welded OCTG.45 This Respondent argues that seamless OCTG commands a premium of $200–$400 per short ton more than welded OCTG within the same size and the same industrial specification. This Respondent further argues that such a large price differential calls into question the proposition that seamless and welded OCTG are interchangeable in almost all applications.46
Table I-2 OCTG: Unit values of U.S. producers’ U.S. shipments of welded OCTG and seamless OCTG, 2010-12, January-March 2012, and January-March 2013 Calendar year January‐March
Item 2010 2011 2012 2012 2013
Unit value (dollars per short ton)
Welded 1,382 1,500 1,512 1,558 1,389
Seamless 1,852 1,926 2,017 1,997 1,821
All OCTG 1,607 1,690 1,727 1,744 1,569 Source: Compiled from data submitted in response to Commission questionnaires.
Because of the limited volume of sales of U.S.‐produced green tubes, direct comparisons to finished OCTG are limited. Table I‐3 presents a comparison of *** purchases of unfinished OCTG and its sales of finished OCTG.
Table I-3 OCTG: Unit values of U.S. producer *** purchases of unfinished OCTG and U.S. shipments of finished OCTG, 2010-12, January-March 2012, and January-March 2013
* * * * * * *
INTERMEDIATE PRODUCTS
As discussed above, unfinished (or “green” if not heat‐treated) OCTG is a precursor to finished OCTG. Therefore, in addressing whether unfinished OCTG and finished OCTG constitute a single domestic like product, the Commission may apply its semifinished product analysis.
Uses
“Green tube” is a term that can apply to unfinished, non‐heat‐treated tube bodies intended for casing and tubing or for drill pipe. The scope of these investigations, however,
45 ILJIN’s postconference brief, July 26, 2013, p. 17. 46 ILJIN’s postconference brief, July 26, 2013, p. 25.

I‐27
focuses on the former form of green tube. According to Respondents, green tubes refer to semifinished seamless and welded OCTG that is processed by heat treating, as well as by other processes (such as threading and coupling, upsetting, and quality testing) before being sold in the U.S. merchant OCTG market.47 The heat‐treatment imparts the necessary mechanical and structural properties that enable the seamless green tube to be used in an OCTG application.48
As previously noted in this section, green tube intended for an OCTG application is typically produced to meet the specifications for that particular application, and not for other applications, such as drill pipe. According to ***, green tube is produced to customer specifications in terms of chemistry, outside diameter, length, and tolerances.49
Markets
Respondent ILJIN argues that the channels of distribution differ between seamless green tube and finished seamless OCTG. ILJIN argues that the need for heat treatment determines into what types of markets seamless green tubes are sold and to the type of customers that purchase seamless green tubes. This Respondent contends that customers for imported seamless green tubes would be processors with available facilities to heat‐treat and otherwise finish the imported product. Moreover, ILJIN argues that simple distributors that purchase finished OCTG lack heat‐ treating capabilities. As such, imported seamless green tube and finished seamless OCTG are sold into different channels of distribution.50
With respect to domestically produced green tube, as previously noted, U.S. Steel reported selling green tube to processors and to distributors ***.51 Green tube sold to processors, however, frequently is sold to distributors after heat treatment. Independent processors known to purchase U.S.‐produced green tube include ***. This processor ***.52
Characteristics and functions
As discussed above, green tube intended for OCTG applications is produced to the chemistry and dimensional specifications that permit processors to undertake finishing operations such as heat‐treatment, upsetting, threading, and coupling. Prior to heat‐treatment, however, green tube cannot be connected to other finished OCTG to form a casing or tubing string, and thus cannot function as a component of either a casing or tubing string for use in oil and gas drilling. However, in some cases green tubing that meets the minimum specifications
47 ILJIN’s postconference brief, July 26, 2013, p. 11. 48 ILJIN’s postconference brief, July 26, 2013, p. 17. 49 Staff telephone interview with ***, July 31, 2013. 50 ILJIN’s postconference brief, July 26, 2013, p. 17. 51 Importers also sell green tube to distributors. See questionnaire response of ***, which sells green
tube from *** to distributors. ***’s customer is ***. Staff telephone interview with ***, August 8, 2013.
52 Questionnaire response of ***.

I‐28
for lower‐grade API 5CT casing and tubing (i.e., H40 and J55) can be certified to those grades and used in applications not requiring additional heat‐treatment (following threading and coupling).
Value
Unfinished OCTG in its green stage is produced by both seamless and welded pipe mills. As shown in table I‐3, purchases by processor *** of green tube intended for OCTG applications had an average unit value of *** in 2012. In comparison, U.S. mill shipments of finished OCTG had an average unit value of $*** in 2012. The differential is narrower, however, for certain finished, non‐heat‐treated OCTG products. U.S.‐produced welded threaded and coupled J55 tubing reported as product 2 in the Commission’s price data had an average price of $*** in 2012. U.S.‐produced welded threaded and coupled J55 casing reported as product 6 in the Commission’s price data had an average price of $*** in 2012.
Transformation process
Respondent ILJIN argues that because of the necessity of heat‐treatment, seamless green tubes that have not undergone heat treatment as imported are not interchangeable with other finished OCTG products.53 ILJIN argues that seamless green tubes that have not undergone heat‐treatment as imported differ in their physical and structure properties from finished seamless OCTG, thereby preventing them from being interchangeable for any use.54
As discussed previously, green tube intended for OCTG applications is produced by either the seamless or welded process. Green tubes typically undergo a heat‐treatment process to impart the necessary physical characteristics of finished OCTG. Depending on its steel composition and wall thickness, green tube that meets certain non‐heat treatable grades of the API specification for casing and tubing such as J55 can be subsequently heat‐treated to improve its yield and tensile strengths in order to meet the minimum specifications for higher‐grade API 5CT casing and tubing such as P110. However, these green tubes can also be sold as J55 tubing or casing. One industry representative at the Commission’s staff conference noted that green tube that is “upgradable” to various higher‐strength API 5CT grades could therefore serve two to three different sectors of the market.55
53 ILJIN’s postconference brief, July 26, 2013, p. 17. 54 Ibid, p. 17. 55 Conference transcript, p. 222–223 (Fowler).

II‐1
PART II: SUPPLY AND DEMAND INFORMATION
U.S. MARKET CHARACTERISTICS
OCTG includes casing and tubing for use in oil and natural gas exploration and production. Both traditional vertical drilling and horizontal drilling such as hydrauling fracturing employ casing for structural integrity and tubing for liquid and gas flow. Since January 2010, the use of fracking has increased, as has the number of rigs and total footage of wells drilled. The amount of OCTG used in fracking can be greater than that used in traditional vertical wells.1 As a result, the demand for OCTG is closely associated with the amount of acitivity in these sectors. OCTG can be manufactured using either seamless or welded techniques.
Channels of distribution
Domestically produced and imported OCTG are sold mainly through distributors (table II‐1). During January 2010‐March 2013, U.S. producers shipped approximately 99 percent of their OCTG to distributors. U.S. importers shipped at least *** percent of their subject imported OCTG from seven of the nine subject countries to distributors in each of the years under investigation. For OCTG imported from the other two countries, Saudi Arabia and Ukraine, *** percent of their sales, respectively, were made to distributors during the period of investigation. U.S. importers shipped 92.8 percent of OCTG imported from nonsubject sources to distributors between January 2010 and March 2013.
1 Conference transcript, p. 185 (Brewer).

II‐2
Table II-1 OCTG: U.S. producers’ and U.S. importers’ U.S. shipments by sources and channels of distribution, 2010-12, and January-March 2013
Item
Period
2010 2011 2012 Jan.-March
2013Share of U.S. shipments (percent)
U.S. producers’ U.S. shipments of OCTG to:Distributors 98.4 99.1 98.6 98.9End users 1.6 0.9 1.4 1.1
U.S. importers’ U.S. shipments of OCTG from India to:Distributors 99.2 96.8 98.1 96.6End users 0.8 3.2 1.9 3.4
U.S. importers’ U.S. shipments of OCTG from Korea to:Distributors 97.6 98.4 98.6 98.9End users 2.4 1.6 1.4 1.1
U.S. importers’ U.S. shipments of OCTG from the Philippines to:Distributors *** *** *** ***End users *** *** *** ***
U.S. importers’ U.S. shipments of OCTG from Saudi Arabia to:Distributors *** *** *** ***End users *** *** *** ***
U.S. importers’ U.S. shipments of OCTG from Taiwan to:Distributors 92.7 94.0 96.7 96.3End users 7.3 6.0 3.3 3.7
U.S. importers’ U.S. shipments of OCTG from Thailand to:Distributors -- *** *** ***End users -- *** *** ***
U.S. importers’ U.S. shipments of OCTG fromTurkey to:Distributors *** *** *** ***End users *** *** *** ***
U.S. importers’ U.S. shipments of OCTG from Ukraine to:Distributors *** *** *** ***End users *** *** *** ***
U.S. importers’ U.S. shipments of OCTG from Vietnam to:Distributors *** *** *** ***End users *** *** *** ***
U.S. importers’ U.S. shipments of OCTG from all other countries to:
Distributors 92.0 92.8 93.3 91.9End users 8.0 7.2 6.7 8.1
Note.--Numbers may not add to 100.0 because of rounding. Source: Compiled from data submitted in response to Commission questionnaires.

II‐3
Geographic distribution
OCTG is sold throughout the United States to distributors and, ultimately, to oil and natural gas exploration and production firms. Consequently, sales are concentrated in major oil‐ and gas‐producing regions. Table II‐2 presents geographic market areas served by producers and importers. Seven U.S. producers supply OCTG nationally. In total, 14 U.S. producers reported sales of OCTG in the Central Southwest; 11 in the Midwest; 12 reported sales in the Mountain region; 11 in the Northeast; 9 in the Pacific Coast; and 9 in the Southeast. Also, two producers (***) reported making sales in Alaska. The majority of subject imports are concentrated in the Central Southwest, and imports from each subject country were shipped to that region by at least *** importers. The Pacific Coast received that second‐greatest coverage by subject imports, with imports from *** serving that region. Only importers of OCTG from Ukraine reported serving the entire United States.
Table II-2 OCTG: Geographic market areas in the United States served by U.S. producers and importers, by number of responding firms
Region Central
Southwest Midwest Mountains NortheastPacific Coast Southeast Other1
U.S. producers 14 11 12 11 9 9 2India 10 1 1 0 4 1 0Korea 14 4 4 2 2 0 0Philippines 9 1 2 0 1 0 0Saudi Arabia *** *** *** *** *** *** ***Taiwan 8 0 0 0 2 0 0Thailand 5 0 0 0 2 0 0Turkey 4 1 1 0 1 0 1Ukraine 4 1 1 1 1 1 1Vietnam 13 2 2 1 3 0 01 All other U.S. markets, including AK, HI, PR, VI, among others. Source: Compiled from data submitted in response to Commission questionnaires.
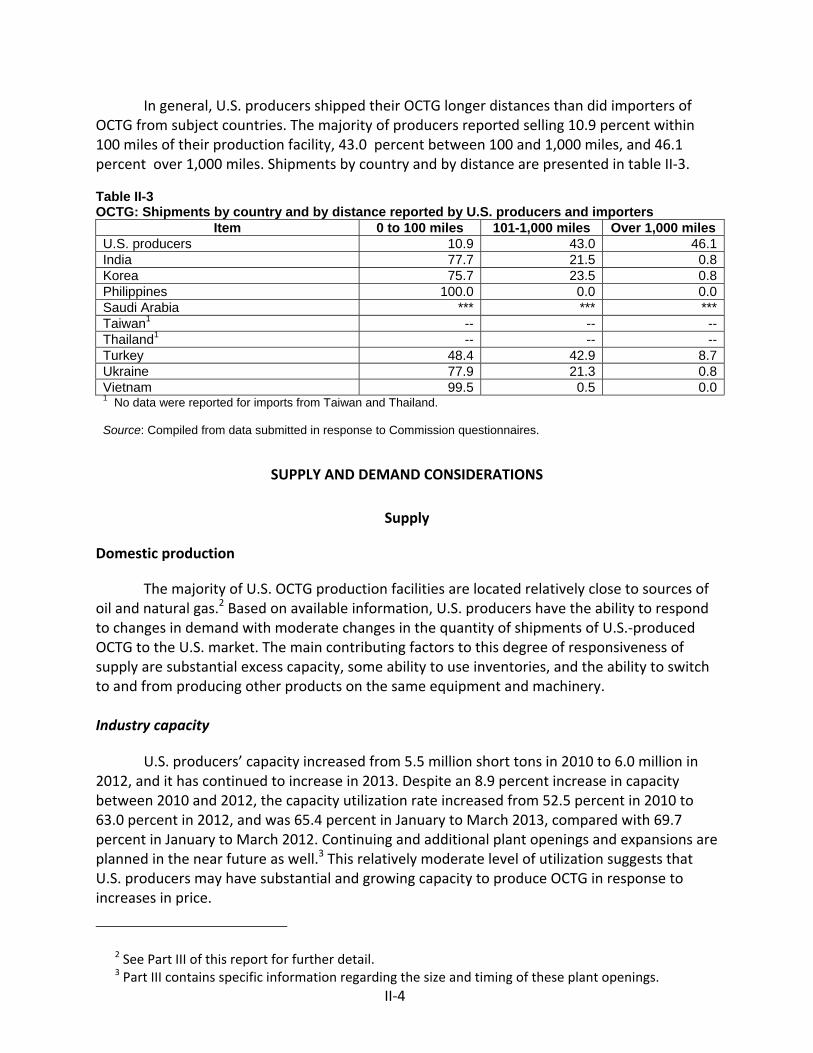
II‐4
In general, U.S. producers shipped their OCTG longer distances than did importers of OCTG from subject countries. The majority of producers reported selling 10.9 percent within 100 miles of their production facility, 43.0 percent between 100 and 1,000 miles, and 46.1 percent over 1,000 miles. Shipments by country and by distance are presented in table II‐3. Table II-3 OCTG: Shipments by country and by distance reported by U.S. producers and importers
Item 0 to 100 miles 101-1,000 miles Over 1,000 miles U.S. producers 10.9 43.0 46.1India 77.7 21.5 0.8Korea 75.7 23.5 0.8Philippines 100.0 0.0 0.0Saudi Arabia *** *** ***Taiwan1 -- -- --Thailand1 -- -- --Turkey 48.4 42.9 8.7Ukraine 77.9 21.3 0.8Vietnam 99.5 0.5 0.01 No data were reported for imports from Taiwan and Thailand. Source: Compiled from data submitted in response to Commission questionnaires.
SUPPLY AND DEMAND CONSIDERATIONS
Supply
Domestic production
The majority of U.S. OCTG production facilities are located relatively close to sources of oil and natural gas.2 Based on available information, U.S. producers have the ability to respond to changes in demand with moderate changes in the quantity of shipments of U.S.‐produced OCTG to the U.S. market. The main contributing factors to this degree of responsiveness of supply are substantial excess capacity, some ability to use inventories, and the ability to switch to and from producing other products on the same equipment and machinery. Industry capacity
U.S. producers’ capacity increased from 5.5 million short tons in 2010 to 6.0 million in 2012, and it has continued to increase in 2013. Despite an 8.9 percent increase in capacity between 2010 and 2012, the capacity utilization rate increased from 52.5 percent in 2010 to 63.0 percent in 2012, and was 65.4 percent in January to March 2013, compared with 69.7 percent in January to March 2012. Continuing and additional plant openings and expansions are planned in the near future as well.3 This relatively moderate level of utilization suggests that U.S. producers may have substantial and growing capacity to produce OCTG in response to increases in price.
2 See Part III of this report for further detail. 3 Part III contains specific information regarding the size and timing of these plant openings.
II‐5
Producer inventory levels
Inventories are typically moderate in this industry since OCTG is usually produced‐to‐order for specific end users but shipped to and inventoried by distributors to meet delivery schedule needs. U.S. producers’ ratio of inventories to total shipments decreased from 13.3 percent at the end of 2010 to 10.1 percent by the end of 2012, and was 11.4 percent of annualized shipments in March 2013, compared with 11.1 percent in March 2012. These levels of inventories suggest that U.S. producers may have some ability to use inventories to respond to price changes. Larger inventories are more typically held by distributors of OCTG. More information regarding market inventory levels is presented later in Part II.
Alternative markets
U.S. producers’ exports, as a share of total shipments, increased from 4.9 percent in 2010 to 5.5 percent in 2012, but were 4.4 percent in January‐March 2013, compared with 5.9 percent in January‐March 2012. Based upon relatively low export volumes and small variations in relative levels, U.S. producers likely have little ability to shift shipments between the U.S. market and other markets in response to price changes.
Production alternatives
U.S. producers produce welded and seamless oil/gas well casing and tubing, mechanical tubing, and standard/line/pressure pipe on the same equipment used to produce OCTG. According to questionnaire responses, 76.8 percent of shared welded production in 2010 was used to manufacture OCTG and 23.1 percent was used to produce other (non‐OCTG) welded products. The non‐OCTG share decreased to 20.0 percent in 2012, and was 16.1 percent in January‐March 2013, compared with 24.1 percent one year earlier, indicating that a greater proportion of shared welded production resources is being used to manufacture OCTG.
With respect to shared seamless pipe and tube production, 18.2 percent was used for non‐OCTG production in 2010. This increased to 21.8 percent in 2011, but decreased to 19.6 percent in 2012. The proportion remained the same in interim 2012 and 2013 at 17.9 percent.
Supply constraints
U.S. producers were asked if they refused, declined, or were unable to supply OCTG since January 1, 2010.4 Three of 14 responding producers reported that they were unable to supply product at some time since 2010. Producer *** stated that it was cautious in bringing in new customers ***. ***. ***.
4 This includes placing customers on allocation or “controlled order entry,” declining to accept customers or renew existing customers, delivering less than the quantity promised, or failing to meet timely shipment commitments.

II‐6
Subject imports
Subject imports of OCTG have increased since 2010. At the beginning of 2010, countervailing duties on OCTG imported from China entered into effect, and antidumping duties followed in April 2010.5 After the placement of AD and CVD duties on Chinese product, subject imports increased from 851,000 short tons in 2010 to 1.8 million short tons in 2012. However, subject imports were lower in interim 2013 (440,000 short tons) than in interim 2012 (478,000 short tons).6
Subject imports increased from 17.0 percent of the quantity of apparent U.S. consumption in 2010 to 25.3 percent in 2012, and represented 26.4 percent of apparent U.S. consumption in the first three months of 2013. The largest source of OCTG imports from subject countries throughout this period was Korea, which represented *** percent of apparent U.S. consumption in 2012. Thailand was the smallest subject source (0.4 percent) in 2012. The quantity of the exports varied by country. Country‐by‐country data were available for product imported into the U.S. markets for all subject countries (table II‐4).
5 Certain Oil Country Tubular Goods from China, Investigation No. 701‐TA‐463 (Final), USITC Publication 4124, January 2010.
6 Imports from subject countries tended to be largely or exclusively welded or exclusively seamless OCTG, as are arranged imports for between April and December 2013. The industries in Korea, the Philippines, Taiwan, and Turkey arranged imports of only welded OCTG to the United States, whereas the industries in Saudi Arabia, Thailand, and Ukraine arranged imports of only seamless OCTG. The industries in India and Vietnam arranged imports of both types in April through December of 2013. Korean and Vietnamese producers had welded OCTG capacity in 2010, but added capacity to manufacture seamless OCTG beginning in 2012. Conversely, the industry in Saudi Arabia added capacity to manufacture welded OCTG in 2012, whereas it had previously only had seamless capacity.

II‐7
Table II-4 OCTG: Capacity, total shipments to the U.S. market, capacity utilization, inventories, sales to its home market and the U.S., and overall capability to shift sales to the United States
Year
Total capacity
U.S. imports1 Capacity
utilization
Inventories to
shipments
Sales to markets
Factors influencing supply responsiveness to changes in the U.S. market Short tons
Home U.S.Percent
India:
2010 555,217 *** 37.6 9.4 28.5 60.3India was the third-largest source of subject imports in 2012. In interim 2013, Indian production and capacity utilization was just greater than half of what it was in interim 2012. India’s home market accounts for about half of its sales. Indian producers’ moderate shipments to the United States, increasing capacity, low capacity utilization, and inventory level increase their ability to increase shipments to the U.S. market.
2011 748,850 *** 49.1 5.1 44.0 47.5
2012 771,354 *** 49.6 5.7 47.7 45.6
Jan.-Mar. 2013 194,376 *** 34.2 8.2 42.2 54.7Korea:
2010 955,761 *** 62.0 3.7 0.8 98.0Korea has been the largest source of imports of OCTG since 2010. Its low inventories and limited alternative markets reduce its ability to increase its supply the U.S. market in the event of a price change. However, it has the largest capacity to produce welded OCTG andKorean producers recently added seamless capacity, which may increase the ability to supply the U.S. market.
2011 1,089,878 *** 66.7 2.7 0.7 96.3
2012 1,157,437 *** 77.0 4.9 1.0 96.9
Jan.-Mar. 2013 294,273 *** 74.9 4.6 1.8 94.4Philippines:
2010 0 0 -- -- -- --The producer in the Philippines had the smallest capacity among subject producers and the highest capacity utilization in 2012 and interim 2013. The *** of sales are exports to the United States. *** inventories were reported. These factors indicate a relatively low ability to increase shipments to the United States.
2011 *** 23,933 *** n/a *** ***
2012 *** 70,166 *** n/a *** ***Jan.-Mar. 2013 *** 11,399 *** n/a *** ***Saudi Arabia:
2010 *** *** *** *** *** ***Saudi Arabia has a relatively large home market, but *** of it its output was shipped to the United States in 2011-12. Producers in Saudi Arabia have been adding capacity and project this to continue, thus increasing the ability to ship to the United States; however, high capacity utilization moderates this ability. Ending inventories have been declining and were lowest in interim 2013, but are still moderately-sized.
2011 *** *** *** *** *** ***
2012 *** *** *** *** *** ***
Jan.-Mar. 2013 *** *** *** *** *** ***Taiwan:
2010 *** 56,594 *** *** *** ***Based on foreign producers’ data covering 95.5 percent of U.S. imports from Taiwan, capacity remained constant, but capacity utilization peaked in 2011. Inventories held by Taiwan producers are relatively low, the home market is small, and most production is shipped to the U.S. market. These factors indicate that Taiwan producers may have some ability to increase shipments to the U.S. market.
2011 *** 96,403 *** *** *** ***
2012 *** 106,576 *** *** *** ***
Jan.-Mar. 2013 *** 25,973 *** *** *** ***Table continued on the next page.
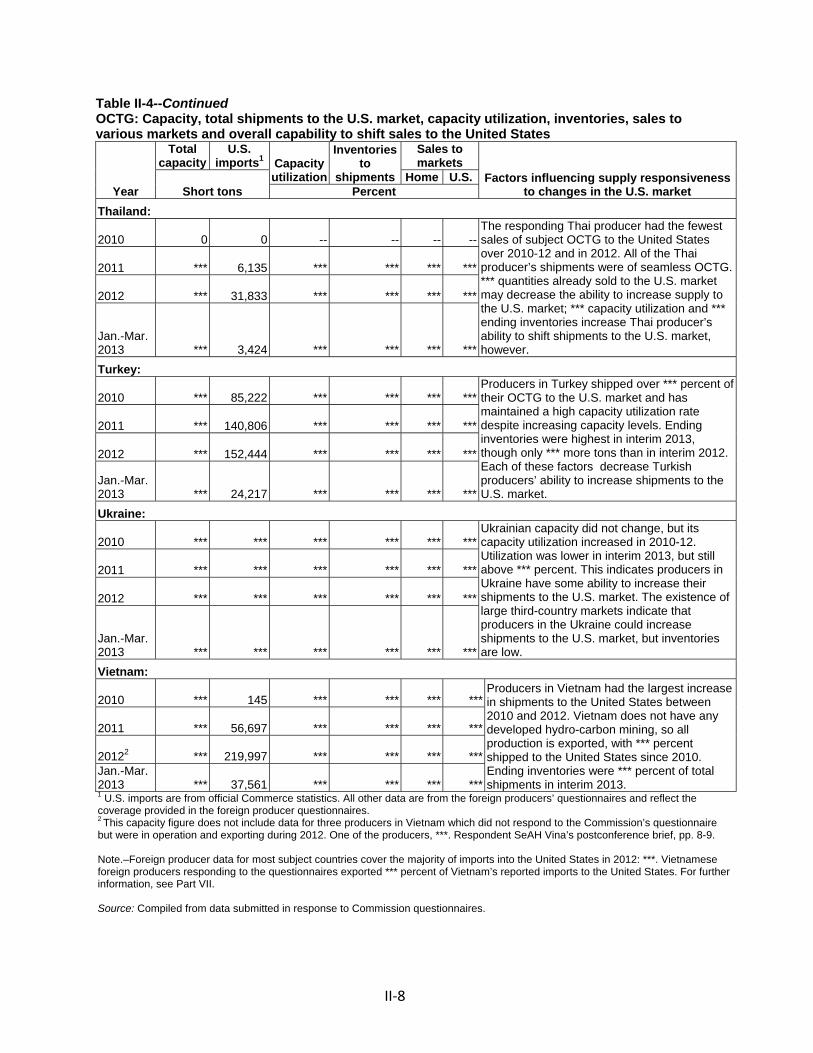
II‐8
Table II-4--Continued OCTG: Capacity, total shipments to the U.S. market, capacity utilization, inventories, sales to various markets and overall capability to shift sales to the United States
Year
Total capacity
U.S. imports1 Capacity
utilization
Inventories to
shipments
Sales to markets
Factors influencing supply responsiveness to changes in the U.S. market Short tons
Home U.S.Percent
Thailand:
2010 0 0 -- -- -- --The responding Thai producer had the fewest sales of subject OCTG to the United States over 2010-12 and in 2012. All of the Thai producer’s shipments were of seamless OCTG. *** quantities already sold to the U.S. market may decrease the ability to increase supply to the U.S. market; *** capacity utilization and *** ending inventories increase Thai producer’s ability to shift shipments to the U.S. market, however.
2011 *** 6,135 *** *** *** ***
2012 *** 31,833 *** *** *** ***
Jan.-Mar. 2013 *** 3,424 *** *** *** ***Turkey:
2010 *** 85,222 *** *** *** ***Producers in Turkey shipped over *** percent of their OCTG to the U.S. market and has maintained a high capacity utilization rate despite increasing capacity levels. Ending inventories were highest in interim 2013, though only *** more tons than in interim 2012. Each of these factors decrease Turkish producers’ ability to increase shipments to the U.S. market.
2011 *** 140,806 *** *** *** ***
2012 *** 152,444 *** *** *** ***
Jan.-Mar. 2013 *** 24,217 *** *** *** ***Ukraine:
2010 *** *** *** *** *** ***Ukrainian capacity did not change, but its capacity utilization increased in 2010-12. Utilization was lower in interim 2013, but still above *** percent. This indicates producers in Ukraine have some ability to increase their shipments to the U.S. market. The existence of large third-country markets indicate that producers in the Ukraine could increase shipments to the U.S. market, but inventories are low.
2011 *** *** *** *** *** ***
2012 *** *** *** *** *** ***
Jan.-Mar. 2013 *** *** *** *** *** ***Vietnam:
2010 *** 145 *** *** *** ***Producers in Vietnam had the largest increase in shipments to the United States between 2010 and 2012. Vietnam does not have any developed hydro-carbon mining, so all production is exported, with *** percent shipped to the United States since 2010. Ending inventories were *** percent of total shipments in interim 2013.
2011 *** 56,697 *** *** *** ***
20122 *** 219,997 *** *** *** ***Jan.-Mar. 2013 *** 37,561 *** *** *** ***1 U.S. imports are from official Commerce statistics. All other data are from the foreign producers’ questionnaires and reflect the coverage provided in the foreign producer questionnaires. 2 This capacity figure does not include data for three producers in Vietnam which did not respond to the Commission’s questionnaire but were in operation and exporting during 2012. One of the producers, ***. Respondent SeAH Vina’s postconference brief, pp. 8-9. Note.–Foreign producer data for most subject countries cover the majority of imports into the United States in 2012: ***. Vietnamese foreign producers responding to the questionnaires exported *** percent of Vietnam’s reported imports to the United States. For further information, see Part VII. Source: Compiled from data submitted in response to Commission questionnaires.

II‐9
Supply constraints
Thirty‐one of 44 responding importers stated that they had not had any constraints on their supply. The other 13 importers attributed supply constraints to issues including: an allocated share of production capacity limiting the number of customers that one importer is able to serve; a fire in the production plant; canceled orders due to delayed shipments and declining prices; an inability to source “P110 regular and HC pipe;” lack of heat treating facilities in the United States; the availability/inability to supply of premium and semi‐premium threads; logistical issues; an exclusive contract; being on allocation from the mill; and the need for the mill to order blooms specifically for OCTG orders.
Nonsubject imports
Nonsubject imports accounted for 29.3 percent of apparent U.S. consumption in 2010, and decreased to 24.7 percent in 2012. In January‐March 2013, nonsubject imports accounted for 18.5 percent of apparent U.S. consumption. The leading nonsubject sources for U.S. imports of OCTG are Canada, Japan, Germany, Mexico, and Argentina. Each of these countries is related to at least one domestic producer or distributor of OCTG. Overall, Canada and Japan were the second‐ and third‐ largest sources of imports of OCTG into the United States in 2012, although Canada and Argentina were the second‐ and third‐largest sources of imports of OCTG into the United States in January 2010‐March 2013 behind Korea.
Inventories
Inventories are held domestically by producers, distributors, importers, and end users in the United States. Distributors will typically stock OCTG from producers and importers, and try to maintain inventory levels that are neither too small (risking missed delivery time frames or lost sales) or too large (risking price fluctuations that affect the valuation of any held stock). When inventories are perceived to get too large, less OCTG will be required from producers and importers, so it influences both supply and demand of OCTG.
Figure II‐1 presents the inventory on hand, in millions of tons and the number of months of inventory on hand (based on operator consumption). The number of months of inventory on hand had reached a peak prior to 2010, reaching over 3.8 million tons (16 months) in early 2009,7 and was continuing to decrease at the start of 2010. Inventory levels both in terms of tonnage and months on hand reached a trough in January 2012, but then increased until October 2012. Inventories increased irregularly between December 2012 and March 2013.
7 Certain Oil Country Tubular Goods from China, Investigation No. 701‐TA‐463 (Final), USITC Publication 4124, January 2010, Figure II‐1 and Table II‐2.
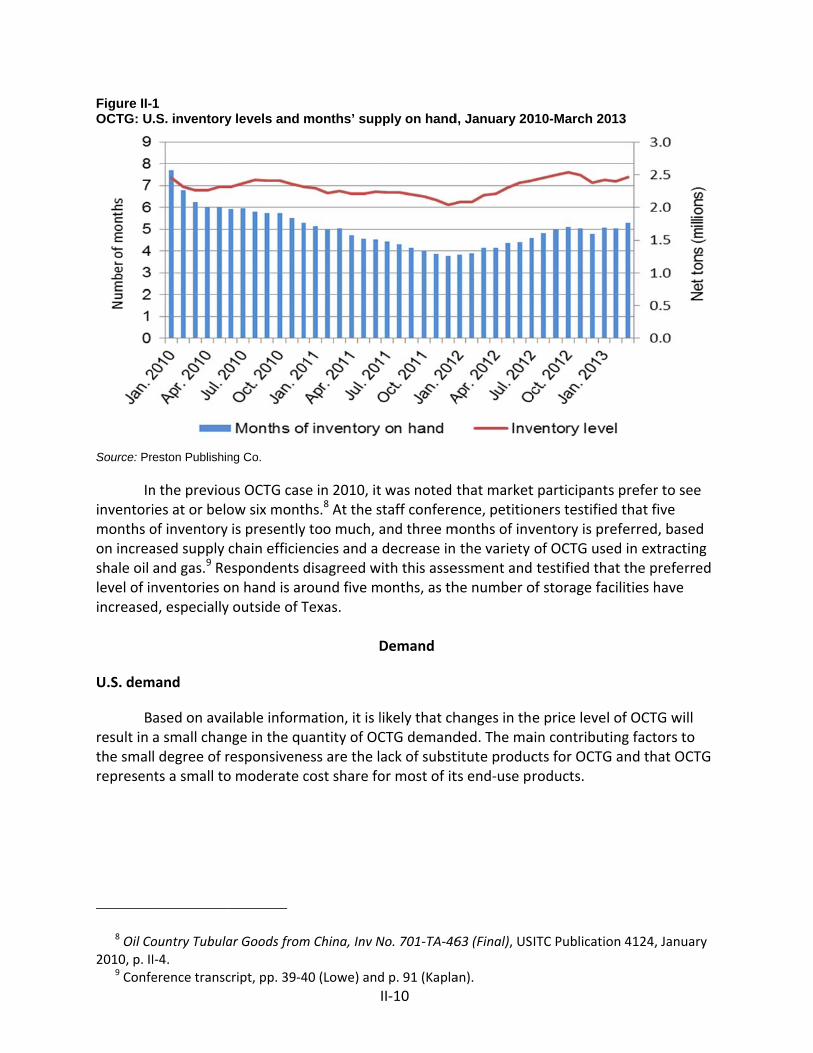
Figure II-OCTG: U
Source: Pr
Ininventorimonths oon increashale oil level of inincreased
U.S. dem
Bresult in the smalrepresen
8 Oil Co2010, p. II
9 Confe
1 .S. inventory
reston Publishin
n the previouies at or beloof inventory ased supply and gas.9 Renventories od, especially
mand
ased on avaa small chanl degree of rnts a small to
ountry TubulaI‐4. erence transc
y levels and m
ng Co.
us OCTG casow six montis presentlychain efficieespondents don hand is ary outside of T
ilable informnge in the quresponsiveneo moderate c
ar Goods from
cript, pp. 39‐4
months’ sup
se in 2010, itths.8 At the sy too much, aencies and a disagreed wround five mTexas.
D
mation, it is luantity of OCess are the lcost share fo
m China, Inv N
40 (Lowe) and
II‐10
pply on hand
t was noted tstaff confereand three mdecrease in
with this assemonths, as th
Demand
likely that chCTG demandack of substor most of it
No. 701‐TA‐46
d p. 91 (Kapla
d, January 20
that marketence, petitiomonths of inv the varietyessment andhe number o
hanges in thded. The matitute products end‐use p
63 (Final), US
an).
010-March 20
t participantners testifieventory is prof OCTG use testified thaof storage fa
e price levelain contributcts for OCTGroducts.
ITC Publicatio
013
s prefer to sed that five referred, based in extractat the prefecilities have
l of OCTG witing factors tG and that O
on 4124, Janu
see
sed ting rred
ill to CTG
uary

Demand
Dfrom thedrilling is
Athe recenSeptembIndicatorpercent i Figure II-OCTG: PeMarch 20
Source: Bu
Atonnage Since thadecreasea similar but declinatural g
10 Blue11 Shad12 “Jun
Intelligenc13 Base
‐6
‐4
‐2
0
2
4
6
Percentage change
determinan
Demand for O demand fors influenced,At the beginnnt recession ber 2009, by rs forecasts tin the third q
2 ercent chang
013
ureau of Econo
According to of OCTG useat time, opered approximpattern (figuned in 2012 gas and oil ha
e Chip Economding in the figne OCTG Pricece, June 27, 2ed on data fro
6
4
2
0
2
4
6
2009
nts
OCTG is driver hydrocarbo, at least parning of the p(figure II‐1)rates betwethat real GDquarter and
ges in real gr
omic Analysis, U
data from Ped, increasedrator consumately 14 perure II‐4). Sim(figure II‐5)as increased
mic Indicatorsgures identifiees Post Surpri2013. om the Energ
2010
en by the levon (oil and nrtially, by theeriod of inve. U.S. GDP ineen 0.1 and 4P will grow b*** percent
ross domest
U.S. Departme
Preston Publd between Jmption has brcent in the fmilarly, the fo.13 As the nud as well (figu
s, July 10, 201es periods ousing Uptick; F
y Information
0
II‐11
vel of activitnatural gas) ee price of oilestigation, tncreased in e4.1 percent by *** percet in the fourt
tic product (G
ent of Commerc
ishing, OCTGanuary 2010been decreafirst half of 2ootage drilleumber of rigsure II‐6).
13. tside the JanFurther Upwa
n Administrat
2011
GDP
ty in the U.Sexploration l and naturahe United Steach quarte(figure II‐2).ent for full‐yth quarter) a
GDP) growth
ce.
G operator c0 and Novemsing irregula2013.12 The ned increaseds increased,
uary 2010‐Mard Momentu
tion and estim
2012
. economy, aand drilling.l gas. tates was rer beginning . Blue Chip Eyear 2013 (inand *** per
h, by quarter
consumptionmber 2011 (farly. OCTG cnumber of rd between 2the total pr
arch 2013 timum Limited,” S
mates from O
and is derive. The amoun
ecovering froin July‐Economic ncluding ***cent in 2014
rs, January 2
n, a measurefigure II‐3).1
onsumptionrigs has follo010 and 201roduction of
me frame. Steel Market
Oil and Gas Jo
2013
ed nt of
om
* 4.10
2009-
e of 1 n has wed 11,
urnal.

Figure II-OCTG: O
Source: Pr Figure II-OCTG: B
Source: Ba
3 Operator cons
reston Publishin
4 aker-Hughes
aker-Hughes N
sumption, m
ng Co., various
s rig count, w
orth America R
onthly, Janu
s issues, 2011-
weekly, Janu
Rotary Rig Cou
II‐12
uary 2009-Ma
-2013.
uary 5, 2007-J
unt.
arch 2013
July 12, 20133
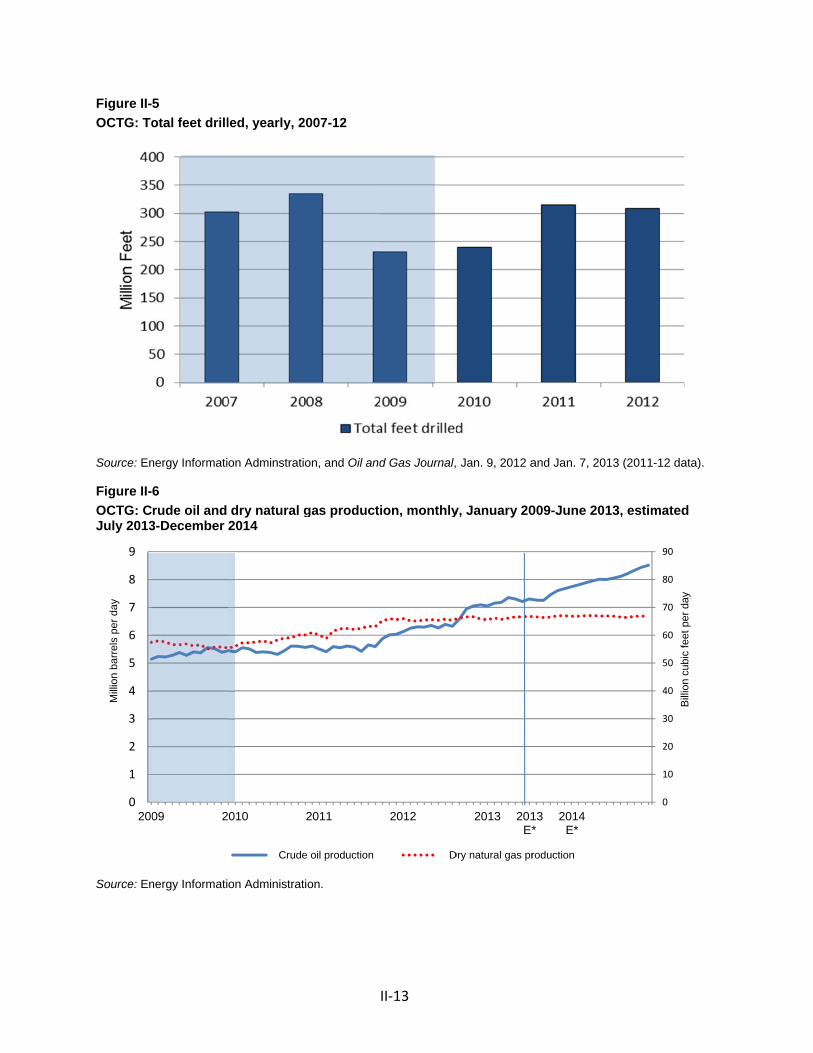
Figure II-OCTG: To
Source: En Figure II-OCTG: CJuly 2013
Source: En
0
1
2
3
4
5
6
7
8
9
200
Mill
ion
barre
ls p
er d
ay5 otal feet drill
nergy Informati
6 rude oil and 3-December
nergy Informati
09 2
led, yearly, 2
on Adminstrati
dry natural g2014
on Administrat
010
Crude
2007-12
on, and Oil and
gas product
tion.
2011
e oil production
II‐13
d Gas Journal,
ion, monthly
2012
D
Jan. 9, 2012 a
y, January 20
2013 201E*
Dry natural gas pr
and Jan. 7, 201
009-June 201
13*
2014E*
roduction
13 (2011-12 da
13, estimated
0
10
20
30
40
50
60
70
80
90
Bill
ion
cubi
cfe
etpe
rday
ata).
d
Bill
ion
cubi
c fe
et p
er d
ay

Toil increaincreasedStates weapproxim
Figure II-OCTG: Cestimated
Source: En
Apointed trespondehalf of 20prices exlikely be
Aextractiodepth of increasedsome lenby drillinof rigs th
14 Conf15 “Jun
Intelligenc16 Conf
he number oased beginnid (figure II‐7ere gas rigs. mately 80 pe
7 rude oil (WTd July 2013-D
nergy Informati
Although opeto increasedents testified013, and by xperienced thlimited as m
As noted earlon is determithe wells bed use of horngths of horig type (i.e., at employ h
ference transne OCTG Pricece, June 27, 2ference trans
of rigs typicang in 2009, 7). Between This changercent oil rigs
TI) and naturaDecember 20
on Administrat
erator consud consumptiod that the rig2.8 percent heir first incmore capacitylier, the quained by the eing drilled. izontal drillinzontal wellshorizontal, vhorizontal dr
script, p. 176 es Post Surpri2013. script, p. 263
ally respondthe number2002 and 20e is seen stars and 20 per
al gas (Henry014
tion.
umption has on in the secg count is exin 2014.14 Orease since y comes on ntity of OCTnumber of rMarket partng on shale can reach 2vertical, or drilling has inc
(Dougan). sing Uptick; F
(Fowler).
II‐14
s to the pricr and propor009, more thrting in 2009rcent natura
y Hub spot) p
been fallingcond half of xpected to inOne industryMarch 2012line in NorthTG used in oiigs that are ticipants at tplays has led2 miles.16 Fidirectional). Acreased subs
Further Upwa
ce of naturalrtion of rigs dhan 80 perce9, and the prl gas rigs (fig
prices, mont
g since late 22013. At thencrease by 4y publication2, although ch America.15
il and naturaoperating asthe staff cond to an increigure II‐9 disAs shown instantially, fro
ard Momentu
gas and oil.devoted to oent of rigs inroportion is gure II‐8).
thly, January
2011, some se staff confe4.3 percent in noted thatcontinued pr5 al gas explors well as thenference noteased need fsplays the prn this figure, om 20 perce
um Limited,” S
As the priceoil production the Unitednow
y 2009-June 2
signs have erence, n the second June OCTGrice increase
ration and e length and ted that the for OCTG, asroportion of the proportent of total r
Steel Market
e of on
2013,
d
es will
s rigs tion rigs
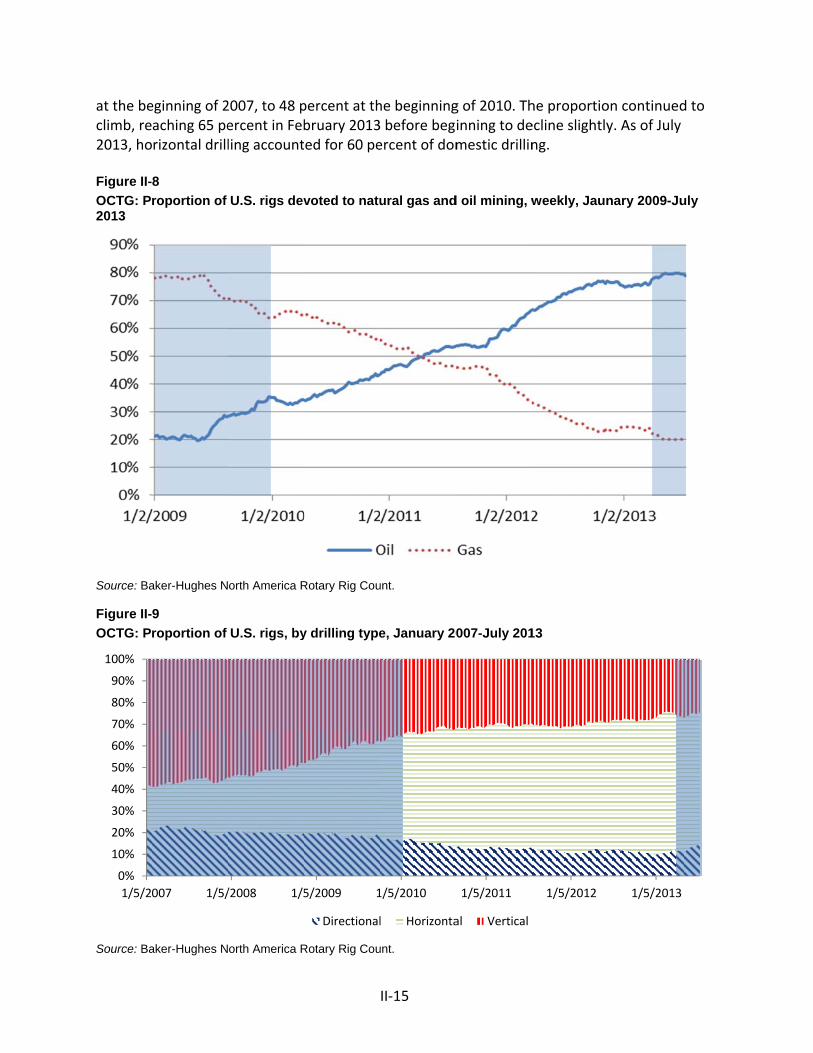
at the beclimb, re2013, ho
Figure II-OCTG: P2013
Source: Ba Figure II-OCTG: P
Source: Ba
0%
10%
20%
30%
40%
50%
60%
70%
80%
90%
100%
1/5/2
eginning of 2aching 65 perizontal drill
8 roportion of
aker-Hughes N
9 roportion of
aker-Hughes N
007 1/5/
2007, to 48 percent in Febling account
U.S. rigs dev
orth America R
U.S. rigs, by
orth America R
/2008 1/5
percent at thbruary 2013ed for 60 pe
voted to natu
Rotary Rig Cou
y drilling type
Rotary Rig Cou
5/2009 1
Directional
II‐15
he beginning before begercent of dom
ural gas and
unt.
e, January 20
unt.
1/5/2010
l Horizonta
g of 2010. Thinning to demestic drillin
d oil mining, w
007-July 201
1/5/2011
al Vertical
he proportioecline slightlyng.
weekly, Jaun
13
1/5/2012
on continuedy. As of July
nary 2009-Ju
1/5/2013
d to
uly

II‐16
Apparent consumption
Similar to the trends in construction, apparent U.S. consumption of OCTG increased from 5.0 million short tons in 2010 to 7.2 million short tons in 2012. Apparent U.S. consumption was lower in January‐March 2013 than in January‐March 2012 (1.7 million short tons, compared with 1.9 million short tons).
Demand perceptions
When asked how demand for OCTG has changed within the United States since January 2010, the majority of responding producers (9 of 11) and importers (26 of 45) reported that demand for OCTG has increased (table II‐5). Producer *** described 2010 to 2012 as “probably the best three‐year period for OCTG demand in this country since the 1980s.”17 Reasons provided by producers and importers mostly focused on increased hydraulic fracturing and increased drilling due to increased oil prices. Some producers and importers noted that demand has not increased in recent months. *** reported that it estimates that demand in the United States will increase by 2 percent in 2012‐14. Among those firms that reported that demand had fluctuated, reasons cited included changing rig counts, fluctuating raw material costs, and increased oil/decreased gas exploration. Table II-5 OCTG: U.S. producer and importer responses regarding the demand for OCTG in and outside the United States since 2010
Item Number of firms reporting
Increase No Change Decrease Fluctuate Demand in the United States: U.S. producers 9 0 2 3
Importers 26 3 3 12
Demand outside the United States: U.S. producers 8 0 1 4
Importers 16 6 1 8
Source: Compiled from data submitted in response to Commission questionnaires. Seasonality and business cycles
Market participants at the staff conference were asked whether U.S. demand for OCTG was higher or lower during any particular season. Most U.S. producers (11 of 14) and importers (26 of 44) reported that there are business cycles or seasonality in OCTG demand. Some seasonality was noted in the United States. In particular, there is a decrease in OCTG demand at the end of the year, when exploration budgets have been exhausted and firms seek to reduce tax exposure on inventories located in Houston. In contrast, there may be some seasonality
17 *** producer questionnaire response.

II‐17
with respect to increased drilling in the winter in Canada when ice allows transit to more remote locations.18
The majority of firms noting the existence of seasonality or business cycles referred to the energy cycle and demand factors cited earlier such as oil and gas prices and rig counts. Producer *** reported that the degree of wet weather in the spring can decrease demand in the northern United States. Importers *** noted that there is increased activity during the summer and less during the winter. Importer *** stated that November and December are typically slow, while January and February are typically busy. Importer *** also indicated a slowdown at the end of the year.
Substitute products
Thirteen of 14 U.S. producers and 38 of 40 importers reported that there are no substitutes for OCTG. One possible substitute for OCTG is coiled tubing, which could be used in well interventions, completions, and workovers of both new and old wells, as noted by ***.19 Importer *** stated that line pipe could be used as surface casing in shallow wells with little pressure and importer *** stated that expandable casing could be used in liner and casing.
Cost share
OCTG accounts for a small share of the cost of the end‐use products in which it is used. Industry firms gave highly varying answers.20 Producers *** noted that OCTG accounts for 7 to 8 percent of the cost of oil and gas drilling/extraction. Producer *** stated that OCTG accounts for 15 percent of the cost, and *** stated that OCTG accounts for 85 percent of the cost of oil and gas drilling. Importers *** reported that OCTG accounts for 10 percent of the cost of oil/gas wells. Importer *** stated that OCTG accounts for 25 percent of the cost of oil and gas exploration.
Demand outside the United States
Most U.S. producers (8 of 13) and most importers (16 of 31) reported that demand outside the U.S. market has increased since January 2010. Reasons for increasing demand reported by producers and importers included: more efficient drilling techniques; increased horizontal well drilling; additional demand in Australia, Brazil, Iraq, Saudi Arabia, and the Gulf Cooperation Council countries; increased Canadian, Chinese, and Russian wells drilled; increased global oil and gas drilling; and increased oil and gas exploration activity. Importer *** stated, “Demand has generally increased in certain markets and it has decreased in others. Overall, however, global demand is projected to increase slightly from 2012 to 2014. ***
18 Conference transcript, p.247 (Brewer) and *** producer questionnaire responses. 19 *** stated, however, that this was very limited and would not likely have any effect on the OCTG
market. 20 In addition, five producers and 21 importers reported that OCTG accounts for 100 percent of the
end‐use product in which it is used.
II‐18
estimates that OCTG demand will increase by about less than 10 percent. Much of this increase, however, will be in markets the subject imports cannot serve.”
SUBSTITUTABILITY ISSUES
The degree of substitution between domestic and imported OCTG depends upon such factors as relative prices, quality (e.g., physical characteristics, consistency, tubing and casing type and grade, etc.), and conditions of sale (e.g., price discounts/rebates, availability, payment terms, product services, reliability of supply, etc.). Based on available data, staff believes that there is a high degree of substitutability between U.S.‐produced OCTG and that imported from subject countries.
Factors affecting purchasing decisions
A number of factors influence purchasers’ decisions regarding the source of the OCTG they buy. OCTG must meet the required API specification for the project, and must be of an acceptable quality to the purchaser. Some projects require the OCTG be produced by a certain process (i.e., seamless). Lead times and availability were also noted as important factors determining puchasers’ sourcing decisions.
Lead times
The majority of domestic production of OCTG (88.3 percent) is made on a produced‐to‐order basis. In fact, all sales of OCTG by *** are produced‐to‐order. Domestic lead times for produced‐to‐order OCTG ranged between 1 and 4 months, with an average of almost 2 months. For sales from inventory, lead times ranged between 1 and 30 days, averaging 12 days.
A majority of importers’ shipments of OCTG (61.8 percent across all subject countries) were also made on a produced‐to‐order basis. Only imports from *** were sold from importers’ inventories a majority of the time (*** percent). Imports from *** were also the only imports that had a portion ***. Imported OCTG from *** were less often sold on a produced‐to‐order basis (*** percent) than those from *** (*** percent). Across all subject countries, lead times for produced‐to‐order OCTG ranged from 2 to 6 months and averaged 4 months. For those shipped from importers’ inventories, lead time ranged between 2 days and 1 month, and averaged 13½ days across 10 responding importers.21
Supplier certification
Domestic producers noted at the staff conference that suppliers do not need to get certified by individual purchasers.22 Rather, the casing and tubing under consideration must meet the grade standards. As long as a mill’s or processor’s facility meets the API’s specifications, it can be certified to use the API stamp on its products. Receiving API
21 Data for *** are not included in these data. It reported lead times from its inventories of ***. With these data included, the average lead time increases to nearly *** days.
22 Conference transcript, p. 120 (Miller and Schagrin).

II‐19
certification typically requires four to nine months, depending on the process for which certification is sought (e.g., threading, heat treatment, or manufacturing).23
Comparisons of domestic products, subject imports, and nonsubject imports
Interchangeability
To determine whether U.S.‐produced OCTG can generally be used in the same applications as imports from the nine subject countries as well as other countries, U.S. producers and importers were asked whether the products can “always,” “frequently,” “sometimes,” or “never” be used interchangeably. As shown in table II‐6, most producers reported that product from all country pairs was “always” or “frequently” interchangeable. A plurality of importers, also reported that U.S. and imported product was “always” interchangeable with domestic OCTG, but between five and nine importers also indicated that subject imports and domestic production were “sometimes” or “frequently” interchangeable. Factors cited by importers as limiting interchangeability included: issues with respect to welded vs. seamless OCTG (noted by 8 importers); quality issues (7 importers); grades, sizes and connections (3 importers); purchaser approval and imports less accepted at large companies (2 importers each); and program sales (1 importer). In addition, one importer (***) stated that a producer’s continued maintainance of an API certification is an indication that products should be of similar quality.
23 Conference transcript, p. 248 (Brewer).
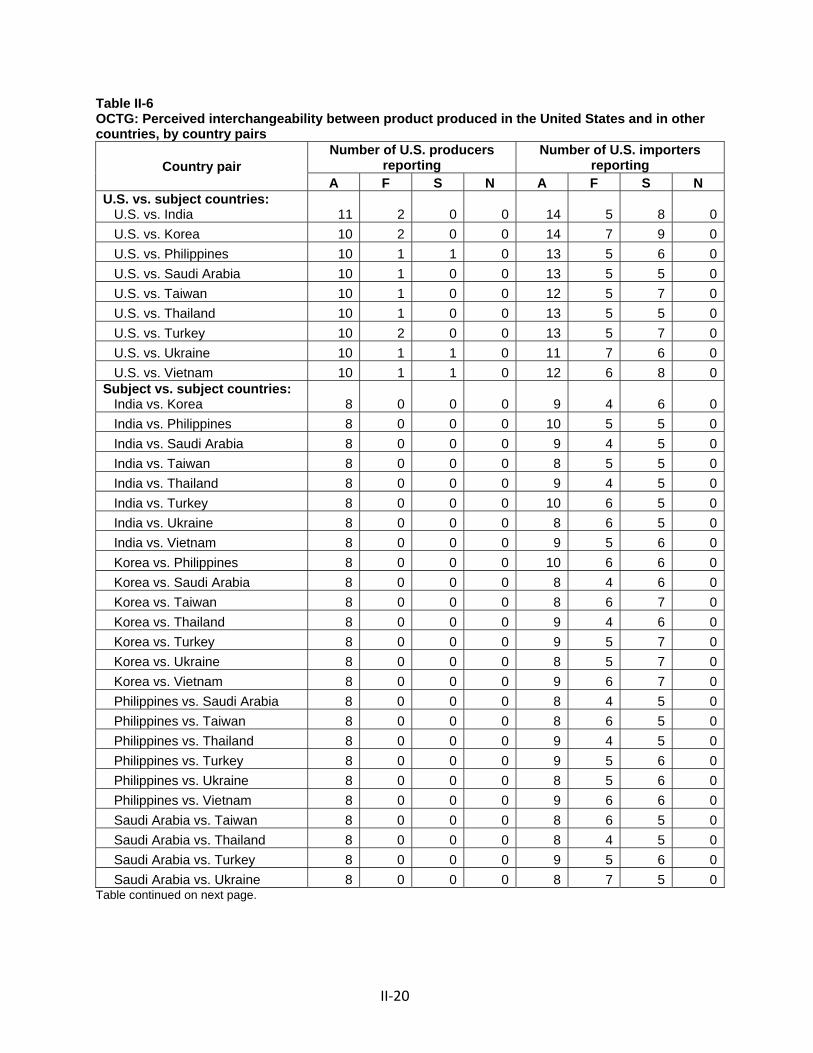
II‐20
Table II-6 OCTG: Perceived interchangeability between product produced in the United States and in other countries, by country pairs
Country pair Number of U.S. producers
reporting Number of U.S. importers
reporting A F S N A F S N
U.S. vs. subject countries: U.S. vs. India 11 2 0 0 14 5 8 0 U.S. vs. Korea 10 2 0 0 14 7 9 0 U.S. vs. Philippines 10 1 1 0 13 5 6 0 U.S. vs. Saudi Arabia 10 1 0 0 13 5 5 0 U.S. vs. Taiwan 10 1 0 0 12 5 7 0 U.S. vs. Thailand 10 1 0 0 13 5 5 0 U.S. vs. Turkey 10 2 0 0 13 5 7 0 U.S. vs. Ukraine 10 1 1 0 11 7 6 0 U.S. vs. Vietnam 10 1 1 0 12 6 8 0Subject vs. subject countries: India vs. Korea 8 0 0 0 9 4 6 0 India vs. Philippines 8 0 0 0 10 5 5 0 India vs. Saudi Arabia 8 0 0 0 9 4 5 0 India vs. Taiwan 8 0 0 0 8 5 5 0 India vs. Thailand 8 0 0 0 9 4 5 0 India vs. Turkey 8 0 0 0 10 6 5 0 India vs. Ukraine 8 0 0 0 8 6 5 0 India vs. Vietnam 8 0 0 0 9 5 6 0 Korea vs. Philippines 8 0 0 0 10 6 6 0 Korea vs. Saudi Arabia 8 0 0 0 8 4 6 0 Korea vs. Taiwan 8 0 0 0 8 6 7 0 Korea vs. Thailand 8 0 0 0 9 4 6 0 Korea vs. Turkey 8 0 0 0 9 5 7 0 Korea vs. Ukraine 8 0 0 0 8 5 7 0 Korea vs. Vietnam 8 0 0 0 9 6 7 0 Philippines vs. Saudi Arabia 8 0 0 0 8 4 5 0 Philippines vs. Taiwan 8 0 0 0 8 6 5 0 Philippines vs. Thailand 8 0 0 0 9 4 5 0 Philippines vs. Turkey 8 0 0 0 9 5 6 0 Philippines vs. Ukraine 8 0 0 0 8 5 6 0 Philippines vs. Vietnam 8 0 0 0 9 6 6 0 Saudi Arabia vs. Taiwan 8 0 0 0 8 6 5 0 Saudi Arabia vs. Thailand 8 0 0 0 8 4 5 0 Saudi Arabia vs. Turkey 8 0 0 0 9 5 6 0 Saudi Arabia vs. Ukraine 8 0 0 0 8 7 5 0
Table continued on next page.

II‐21
Table II-6--Continued OCTG: Perceived interchangeability between product produced in the United States and in other countries, by country pairs
Country pair Number of U.S. producers
reporting Number of U.S. importers
reporting A F S N A F S N
Subject vs. subject countries: Saudi Arabia vs. Vietnam 8 0 0 0 8 5 6 0 Taiwan vs. Thailand 8 0 0 0 8 4 6 0 Taiwan vs. Turkey 8 0 0 0 8 5 7 0 Taiwan vs. Ukraine 8 0 0 0 8 5 7 0 Taiwan vs. Vietnam 8 0 0 0 8 7 5 0 Thailand vs. Turkey 8 0 0 0 9 5 6 0 Thailand vs. Ukraine 8 0 0 0 8 5 6 0 Thailand vs. Vietnam 8 0 0 0 9 5 6 0 Turkey vs. Ukraine 8 0 0 0 8 5 7 0 Turkey vs. Vietnam 8 0 0 0 9 5 7 0 Ukraine vs.Vietnam 8 0 0 0 8 6 6 0Subject vs. nonsubject countries: Combined 8 2 0 0 10 9 8 0 India vs. nonsubject 6 1 0 0 7 7 5 0 Korea vs. nonsubject 6 1 0 0 7 7 6 0 Philippines vs. nonsubject 6 1 0 0 7 7 5 0 Saudi Arabia vs. nonsubject 6 1 0 0 7 8 5 0 Taiwan vs. nonsubject 6 1 0 0 7 7 5 0 Thailand vs. nonsubject 6 1 0 0 7 6 5 0 Turkey vs. nonsubject 6 1 0 0 7 7 5 0 Ukraine vs. nonsubject 6 1 0 0 7 7 5 0 Vietnam vs. nonsubject 6 1 0 0 7 8 6 0Note.—A=Always, F=Frequently, S=Sometimes, N=Never. Source: Compiled from data submitted in response to Commission questionnaires.
Welded vs. seamless OCTG
There are certain applications in which welded and seamless OCTG cannot be used interchangeably. Seamless OCTG could be used in any application which required welded OCTG.24 The same is not true in reverse. At a minimum, high stress applications such as sour service, which could account for an estimated 10 percent of the market, require seamless OCTG. A witness for petitioners estimated that welded OCTG could be used for 70 percent of seamless applications and a witness for respondents noted that they are interchangeable in many cases from an engineering perspective.25 Petitioners further stated that beyond that, the project engineers’ preference can be a deciding factor. Witnesses for respondents noted that
24 Conference transcript, p. 109 (Matthews). 25 Conference transcript, pp. 109 (Matthews) and 261 (Brewer).

II‐22
engineers’ preference for a higher‐priced seamless product may be due to a preference to reduce risk.26 There has been an increased preference for seamless OCTG since incidents such as the BP Macondo oil spill in 2010.27
As noted earlier, subject countries have typically imported either one type of OCTG or the other, which may limit substitutability among subject countries.28
Quality
OCTG is typically produced to meet, if not exceed, API specifications. Petitioners contend that if a pipe meets the API specification then it is interchangeable, except for those at the top end of the product range.29 A witness for petitioners estimated that 90 to 95 percent of OCTG is of a “commodity type” grade from a pipe body standpoint.30 A witness for respondents stated that, in contrast, API certification confirms that the pipe meets specifications, but does not imply a level of quality of the OCTG.31 One producer and seven importers indicated that quality issues are a significant factor in their sales of OCTG. Quality can vary by mill, as noted by firm such as importer ***.
Premium connections and alloy grades
An increasing proportion of demand in the United States reportedly requires premium or semi‐premium connections or threads. Semi‐premium and premium threads are used in high‐stress applications such as offshore and in horizontal drilling and need to withstand high torque, high compression, and bending. A witness for petitioners estimated that 80 percent of threads are “commodity type,” and that semi‐premium or premium threads can be added to welded or seamless pipe from any source, including that from subject countries.32 Another witness testified that his firm had lost a sale of OCTG with semi‐premium threading to OCTG imported from Korea.33
Witnesses for respondents testified that premium and semi‐premium threads and alloy grades are being emphasized by domestic producers, and they have virtually no competition in for these products, since “none of the suppliers in the countries listed in the petition imported proprietary premium connections to the U.S. marketplace.”34 In its questionnaire response, importer *** indicated that premium connections are not available from Korea.
An increasing focus of domestic OCTG demand has been higher alloy grades of OCTG such as P110.35 A witness for respondents noted that alloy grades are not imported to the
26 Conference transcript, pp. 263‐264 (Blomberg and Fowler). 27 Conference transcript, p. 263 (Fowler). 28 For more information regarding welded vs. seamless production, see Part III. 29 Conference transcript, pp. 119‐120 (Schagrin). 30 Conference transcript, pp. 136‐137 (Thompson). 31 Conference transcript, p. 249 (Brewer and Cameron). 32 Conference transcript, p. 137 (Thompson). 33 Conference transcript, p. 137 (Snyder). 34 Conference transcript, pp. 165‐166 (Fowler). 35 Conference transcript, pp. 165 (Fowler) and 188 (Sumer), and “The Five Year Outlook for the Global OCTG Industry,” Metal Bulletin Research, 2013.
II‐23
United States by the subject countries. Instead, more basic upgradeable J55 pipe or green tubes are imported and then heat treated to increase the grade to an alloy grade.36
Program sales
Program sales are non‐contractual obligations between mills, distributors, and end users which encompass what type of OCTG is to be supplied, when it will be supplied, and at what price it will be supplied. Program sales can help minimize supply chain disruption. At the staff conference, domestic producer witnesses testified that a large proportion of sales is made subject to program sales.37 Respondents indicated that, with the exception of suppliers from Korea, the majority do not participate in program sales due to difficulties with being able to ensure on‐time delivery in an industry that is increasingly needing just‐in‐time delivery.38
Differences other than price
Producers and importers were asked to assess how often differences other than price were significant in sales of OCTG from the United States, subject, and nonsubject countries. As seen in table II‐7, nearly all producers reported that there were either “sometimes” or “never” differences other than price for product from each of the country pairs, with a larger incidence of “never” when comparing subject countries with each other. Importers’ responses were considerably more varied. A plurality of importers reported there were “sometimes” differences other than price between domestic and subject imports and between subject countries, but other responses were split between “always,” “frequently,” and “never.” Importers provided similar responses when comparing subject to nonsubject countries’ OCTG.
36 Conference transcript, pp. 155‐156 (Schagrin and Thompson). 37 Conference transcript, p. 133 (DuBois). 38 Conference transcript, pp. 253‐259 (Brewer, Cameron, Echavaria, Fowler, Khandelwal, McConnell,
and Simon).

II‐24
Table II-7 OCTG: Significance of differences other than price between OCTG produced in the United States and in other countries, by country pair
Country pair Number of U.S. producers
reporting Number of U.S. importers
reporting A F S N A F S N
U.S. vs. subject countries: U.S. vs. India 1 0 6 6 5 7 9 4 U.S. vs. Korea 0 0 5 7 6 8 11 4 U.S. vs. Philippines 0 0 6 6 3 5 8 5 U.S. vs. Saudi Arabia 0 0 5 6 3 5 8 4 U.S. vs. Taiwan 0 0 5 6 3 3 9 5 U.S. vs. Thailand 0 0 5 6 3 4 9 4 U.S. vs. Turkey 0 0 6 6 3 4 12 4 U.S. vs. Ukraine 0 0 6 6 3 5 9 4 U.S. vs. Vietnam 0 0 6 6 3 5 10 5 Subject vs. subject countries: India vs. Korea 0 0 1 6 1 5 6 5 India vs. Philippines 0 0 1 6 1 3 6 5 India vs. Saudi Arabia 0 0 1 6 2 2 5 4 India vs. Taiwan 0 0 1 6 1 2 6 5 India vs. Thailand 0 0 1 6 1 3 6 4 India vs. Turkey 0 0 1 6 2 3 6 5 India vs. Ukraine 0 0 1 6 1 3 5 5 India vs. Vietnam 0 0 1 6 1 3 6 5 Korea vs. Philippines 0 0 1 6 3 3 6 6 Korea vs. Saudi Arabia 0 0 1 6 2 3 5 4 Korea vs. Taiwan 0 0 1 6 2 3 6 6 Korea vs. Thailand 0 0 1 6 2 4 6 4 Korea vs. Turkey 0 0 1 6 1 4 8 5 Korea vs. Ukraine 0 0 1 6 3 3 6 4 Korea vs. Vietnam 0 0 1 6 2 3 6 6 Philippines vs. Saudi Arabia 0 0 1 6 1 2 5 4 Philippines vs. Taiwan 0 0 1 6 1 2 5 7 Philippines vs. Thailand 0 0 1 6 1 3 5 5 Philippines vs. Turkey 0 0 1 6 2 3 5 6 Philippines vs. Ukraine 0 0 1 6 1 3 6 4 Philippines vs. Vietnam 0 0 1 6 1 3 5 7 Saudi Arabia vs. Taiwan 0 0 1 6 1 2 6 4 Saudi Arabia vs. Thailand 0 0 1 6 1 3 6 4 Saudi Arabia vs. Turkey 0 0 1 6 2 3 6 4 Saudi Arabia vs. Ukraine 0 0 1 6 1 4 5 5
Table continued on next page.
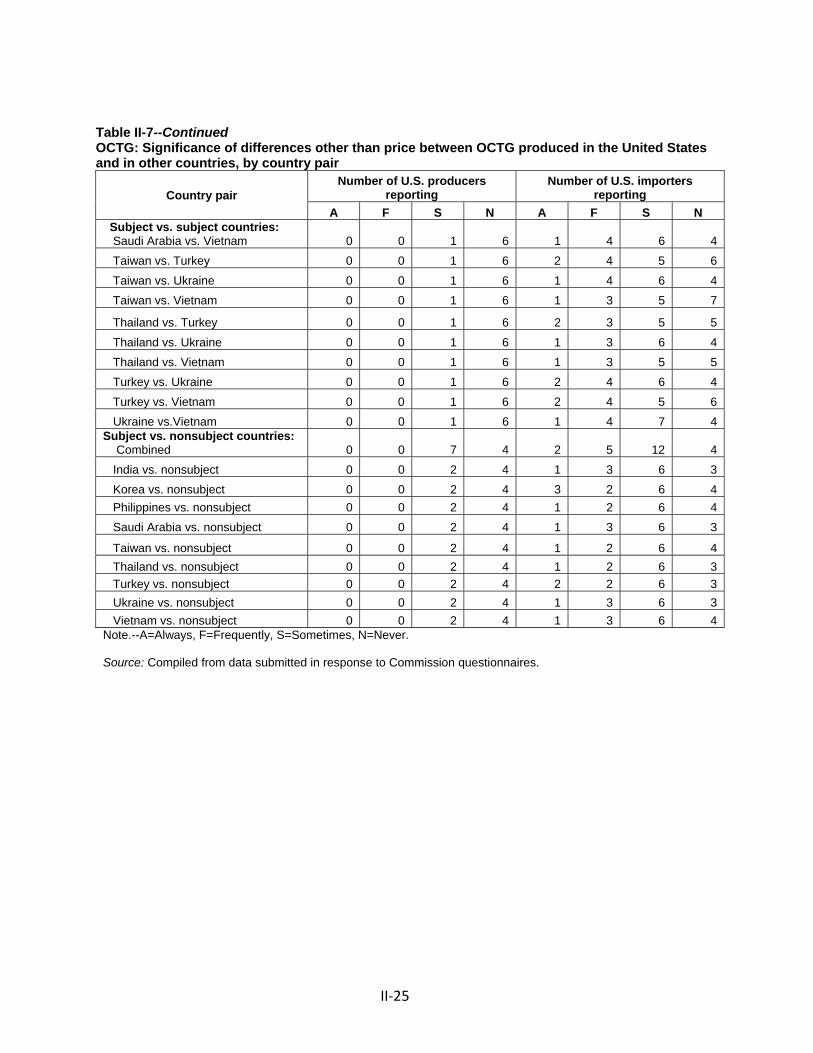
II‐25
Table II-7--Continued OCTG: Significance of differences other than price between OCTG produced in the United States and in other countries, by country pair
Country pair Number of U.S. producers
reporting Number of U.S. importers
reporting A F S N A F S N
Subject vs. subject countries: Saudi Arabia vs. Vietnam 0 0 1 6 1 4 6 4 Taiwan vs. Turkey 0 0 1 6 2 4 5 6 Taiwan vs. Ukraine 0 0 1 6 1 4 6 4 Taiwan vs. Vietnam 0 0 1 6 1 3 5 7
Thailand vs. Turkey 0 0 1 6 2 3 5 5 Thailand vs. Ukraine 0 0 1 6 1 3 6 4 Thailand vs. Vietnam 0 0 1 6 1 3 5 5 Turkey vs. Ukraine 0 0 1 6 2 4 6 4 Turkey vs. Vietnam 0 0 1 6 2 4 5 6 Ukraine vs.Vietnam 0 0 1 6 1 4 7 4 Subject vs. nonsubject countries: Combined 0 0 7 4 2 5 12 4 India vs. nonsubject 0 0 2 4 1 3 6 3 Korea vs. nonsubject 0 0 2 4 3 2 6 4 Philippines vs. nonsubject 0 0 2 4 1 2 6 4 Saudi Arabia vs. nonsubject 0 0 2 4 1 3 6 3
Taiwan vs. nonsubject 0 0 2 4 1 2 6 4 Thailand vs. nonsubject 0 0 2 4 1 2 6 3 Turkey vs. nonsubject 0 0 2 4 2 2 6 3 Ukraine vs. nonsubject 0 0 2 4 1 3 6 3 Vietnam vs. nonsubject 0 0 2 4 1 3 6 4 Note.--A=Always, F=Frequently, S=Sometimes, N=Never. Source: Compiled from data submitted in response to Commission questionnaires.


III‐1
PART III: U.S. PRODUCERS’ PRODUCTION, SHIPMENTS, AND EMPLOYMENT
The Commission analyzes a number of factors in making injury determinations (see 19 U.S.C. §§ 1677(7)(B) and 1677(7)(C)). Information on alleged subsidies was presented in Part I of this report and information on the volume and pricing of imports of the subject merchandise is presented in Part IV and Part V. Information on the other factors specified is presented in this section and/or Part VI and (except as noted) is based on the questionnaire responses of 13 firms that accounted for the vast majority of U.S. production of OCTG during 2012.
U.S. PRODUCERS
The Commission sent U.S. producer questionnaires to the 13 firms identified in the petition and additional 22 U.S. firms that maintain API certification to manufacture or process products in accordance with specification 5CT.1 Thirteen firms provided useable, complete data on their productive operations.2 Staff believes that these responses represent the vast majority of U.S. production of OCTG.
Table III‐1 lists U.S. producers of OCTG, type and location of production, positions on the petition, related firms, and shares of total production.
Table III-1 OCTG: U.S. producers of OCTG, their positions on the petition, type and location of production, related and/or affiliated firms and shares of reported production, 2012
Firm Position on
orders Mill locations Processing locations
Share of production (percent)
Boomerang Tube, LLC Support Petitioner Liberty, TX N/A ***
Drill Pipe International LLC *** New Hope, MN New Hope, MN ***
EnergeX Tube1 Support Petitioner
Sharon, PA; Warren, OH; Thomasville, AL Thomasville, AL ***
EVRAZ Rocky Mountain Steel2 *** Pueblo, CO N/A ***Table continued on next page.
1 Six firms responded that they did not produce OCTG. 2 In addition, *** provided partial data. *** are presented separately at table C‐2. The company,
however, ***. *** did not provide usable data. ***. Finally, petitioner Welded Tube did not produce OCTG during the period for which data were
requested; the firm anticipates commencing production in August 2013.

III‐2
Table III-1--Continued OCTG: U.S. producers of OCTG, their positions on the petition, type and location of production, related and/or affiliated firms and shares of reported production, 2012
Firm Position on
orders Mill locations Processing locations
Share of production (percent)
Laguna Tubular Products Corp.3 *** N/A Houston, TX ***
Maverick Tube Corporation4
Support all, excluding Saudi Arabia (no position) Petitioner
Hickman, AR; Conroe, TX
Hickman, AR; Conroe, TX; Houston, TX ***
Northwest Pipe Company Support Petitioner
Bossier City, LA; Houston, TX N/A ***
OMK *** Houston, TX Houston, TX 5
Paragon Industries, Inc. *** Sapulpa, OK Muskogee, OK ***
Tejas Tubular Products, Inc. Support Petitioner Stephenville, TX Houston, TX ***
Texas Steel Conversion, Inc. *** N/A Houston, TX; Bryan, TX 6
Texas Tubular Products *** Lone Star, TX N/A ***
TMK IPSCO7 Support Petitioner
Blytheville, AR; Camanche, IA; Ambridge, PA; Wilder, KY
Blytheville, AR; Koppel, PA; Baytown, TX; Catoosa, OK ***
United States Steel Corporation8 Support Petitioner
Fairfield, AL; Lorain, OH; Lone Star, TX; Bellville, TX Houston, TX ***
Vallourec Star, LP9
Support all, excluding Saudi Arabia (no position) Petitioner Youngstown, OH
Youngstown, OH; Houston, TX ; Port Place, Muskogee, OK ***
Welded Tube USA, Inc.10 Support Petitioner Lackawanna, NY N/A ***
Total 100.01***. 2***. 3***. 4***. 5***. 6***. 7***. 8***. 9***. 10***. Note.-- ***. Source: Compiled from data submitted in response to Commission questionnaires.

III‐3
As indicated in table III‐1, one U.S. producer (***) is related to a foreign producer of the subject merchandise and no U.S. producer is related to a U.S. importer of the subject merchandise. In addition, as discussed in greater detail below, *** subject merchandise and *** the subject merchandise from U.S. importers.
In the Commission’s questionnaire, U.S. producers were asked if they experienced any plant openings, plant closings, relocations, expansions, acquisitions, consolidations, prolonged shutdowns or production curtailments, or revised labor agreements since January 1, 2010.3 Table III‐2 summarizes industry events regarding changes in production capability and investments, acquisitions/mergers, and shutdowns since 2010. Descriptions of other events follow.
Table III-2 OCTG: Important industry events, since 2010
Year Company Description of event (merger, shutdown, bankruptcy, change in production or capacity level, etc.)
2010 Northwest Pipe Co.
Capacity increase: Northwest Pipe begins producing OCTG at its Houston, TX, facility.
Laguna Capacity increase: ***.2011 U.S. Steel Capacity increase: U.S. Steel completes the construction of an additional quench
and temper line, as well as threading and coupling stations, at its Lorain, OH, rolling mill. The $*** investment added *** short tons of new heat treating capacity to the facility.
Boomerang Tube (Chesterfield, MO)
Capacity increase: Boomerang Tube begins commercial production of OCTG at its new 400,000 short tons-per-year (tpy) welded tubular products mill in Liberty, TX ($*** investment). The mill also produces limited quantities of welded line pipe.
Northwest Pipe Co.
Capacity increase: Northwest Pipe ramps up production of OCTG and line pipe at its 150,000 tpy rolling mill located in Bossier City, LA.
TMK IPSCO (Houston, TX)
Capacity increase: TMK IPSCO commissions a second 40,000 tpy OCTG threading line at its Brookfield, OH, facility. The second line allows the Brookfield facility to thread OCTG up to 13 inches in outside diameter (OD), up from 4-7 inches OD.
TMP IPSCO (Houston, TX)
Capacity increase: TMK IPSCO announces plans to build an OCTG threading facility at its 570,000 tpy welded rolling mill in Wilder, KY. The facility produces OCTG, line pipe, and standard pipe.
Tianjin Pipe Corp (China)
Capacity increase: Tianjin Pipe Group Corp (TPCA) breaks ground on a 500,000 tpy seamless OCTG mill in Gregory, TX ($1 billion investment). Finishing and threading operations are expected to be completed by 2013, followed by the construction of a rolling mill and electric arc furnace (EAF) steel-making facility.
Tejas Tubular Capacity increase: Tejas Tubular commissions a new welded OCTG rolling mill in Stephenville, TX.
Maverick
Capacity increase: ***. ***.
OMK Acquisition: OMK acquires Tubular Solutions, a processing and finishing facility. Table continued on next page.
3 Certain capacity expansions are not reflected in the trade data reported in this section of the report because they have not yet occurred as of the latest period for which data were collected, January‐March 2013.

III‐4
Table III-2--Continued OCTG: Important industry events, since 2010 Year Company Description of event (merger, shutdown, bankruptcy, change in production or
capacity level, etc.) 2012 U.S. Steel Joint venture: U.S. Steel and Buth Gilliam Enterprises form a new joint venture,
Patriot Premium Threading Services (Midland, TX,) to provide OCTG threading and repair services.
JMC Steel Group (parent company of Wheatland)
Acquisition/merger: JMC Steel Group acquires and merges Canadian OCTG producer Lakeside Steel (Welland, Ontario, Canada) with its own tubular assets to form a new division called EnergeX Tube. Lakeside’s U.S.-based facilities are located in Thomasville, AL, and Corpus Christi, TX. EnergeX casing and tubing is produced in Thomasville, AL; Warren, OH; and Welland, Ontario, Canada.
JMC Steel Group Shutdown: JMC Steel Group ***. TMK IPSCO Capacity increase: TMK IPSCO breaks ground on a new threading facility at is
operations in Odessa, TX. The $17 million investment will expand threading capacity for premium connections on OCTG with 2–13 inches OD.
Benteler Steel/Tube (Germany)
Capacity increase: Benteler Steel/Tube announces plans to build a seamless OCTG facility, including a hot-rolling mill and finishing lines, in Caddo, LA ($900 million investment). A second phase of the mill will include the completion of an EAF mill. Groundbreaking at the facility is expected in 2013, with completion of the seamless OCTG facility slated for 2015.
TMK IPSCO Consolidation: TMK IPSCO ***. Tejas Tubular Capacity increase: Tejas Tubular ***.
2013 Tenaris (Luxembourg)
Capacity increase: Tenaris announces its intention to build a new seamless OCTG mill in Bay City, TX, expected to be completed by mid-2016. The plant will have an OCTG capacity of 600,000 tpy with heat treatment and premium threading facilities, but no melting capacity.
Borusan and Mannesmann (Turkey)
Capacity increase: Borusan and Mannesmann breaks ground on a 300,000 tpy welded OCTG mill in Baytown, TX ($150 million investment). The mill, which will employ 250 workers, is expected to begin production of OCTG in 2015.
Vallourec Capacity increase: Vallourec starts commercial production of seamless OCTG at its new 350,000 tpy seamless rolling mill in Youngstown, OH. Heat treatment and finishing operations begin in 2013.
Welded Tube USA Capacity increase: Welded Tube USA, a subsidiary of Canada-based pipe and tube producer Welded Tube of Canada, begins construction of a *** tpy welded OCTG rolling mill in Lackawanna, NY ($50 million investment). Production of OCTG is expected to begin in mid-2013.
OMK (Russia)
Capacity increase: United Metallurgical Company (OMK) commissions a 200,000 tpy ERW OCTG mill in Houston, TX ($100 million investment). The rolling mill will produce OCTG in outside diameters ranging from 2.75–7 inches, and will source hot-rolled coil feedstock primarily from local producers. The plant is expected to reach full capacity by mid-2013.
Big River Steel (Arkansas)
Capacity increase: Big River Steel announces a proposed $1.1 billion project to produce OCTG, coiled products, and electrical steels in Osceola, AK. The proposed mill would have an annual capacity of 1.7 million short tons for all products.
Texas Steel Conversion (Houston)
Capacity increase: Texas Steel Conversion ***.
Source: Metal Bulletin, various articles; responses to the Commission questionnaire.
Several firms reported changes to their operations related to shutdowns, production curtailments, or employment. ***. ***. ***. ***. ***. ***. ***. ***.

III‐5
U.S. PRODUCTION, CAPACITY, AND CAPACITY UTILIZATION
Table III‐3 presents data regarding U.S. producers’ production, capacity, and capacity utilization. Total U.S. capacity of OCTG increased, by approximately 246,000 tons from 2010 to 2011, and by approximately 243,000 tons from 2011 to 2012; total capacity increased from 2010 to 2012 by approximately 489,000 tons (8.9 percent). Capacity was approximately 47,000 tons greater in January‐March 2013 than in January‐March 2012. Four U.S. producers accounted for the increase in industry capacity from 2010 to 2012.4 Boomerang’s capacity increased by ***. EnergeX’s capacity increased by ***. Maverick’s capacity ***. Northwest’s capacity increased ***. Five U.S. producers accounted for the net increase in capacity in January‐March 2013 relative to January‐March 2012. In January‐March 2013, compared to January‐March 2012, ***.5 ***, reported a reduction of *** short tons.
Table III-3 OCTG: U.S. producers’ production, capacity, and capacity utilization, 2010-12, January-March 2012, and January-March 2013 Calendar year January-March
Item 2010 2011 2012 2012 2013 Capacity 5,498,058 5,744,456 5,987,827 1,510,530 1,557,600Production 2,885,247 3,484,953 3,772,030 1,052,237 1,018,330Capacity utilization (percent) 52.5 60.7 63.0 69.7 65.4 Source: Compiled from data submitted in response to Commission questionnaires.
Total OCTG production increased from 2010 to 2012 by 30.7 percent, but was 3.2 percent lower in January‐March 2013 than in January‐March 2012. Most of the increase in production was due to increased welded OCTG production.6 From 2010 to 2012, production of welded OCTG increased by 634,120 tons (41.8 percent) and production of seamless OCTG increased by 253,373 tons (18.5 percent). Production of welded OCTG in January‐March 2013 was 11,994 short tons (2.0 percent) lower than in January‐March 2012. Likewise, production of seamless OCTG in January‐March 2013 was 21,022 tons (4.6 percent) lower than in January‐March 2012.
The rate of capacity utilization increased alongside the year‐to‐year increases in capacity and production during 2010‐12. Capacity utilization was lower in January‐March 2013 than in January‐March 2012, reflecting both higher levels of capacity and lower levels of production volume.
4 ***. 5 ***. 6 Table III‐4 presents U.S. producers’ production, capacity, and capacity utilization of welded and
seamless tubular products. Production of welded and seamless OCTG are provided separately in this table. Capacity data includes capacity for ***.
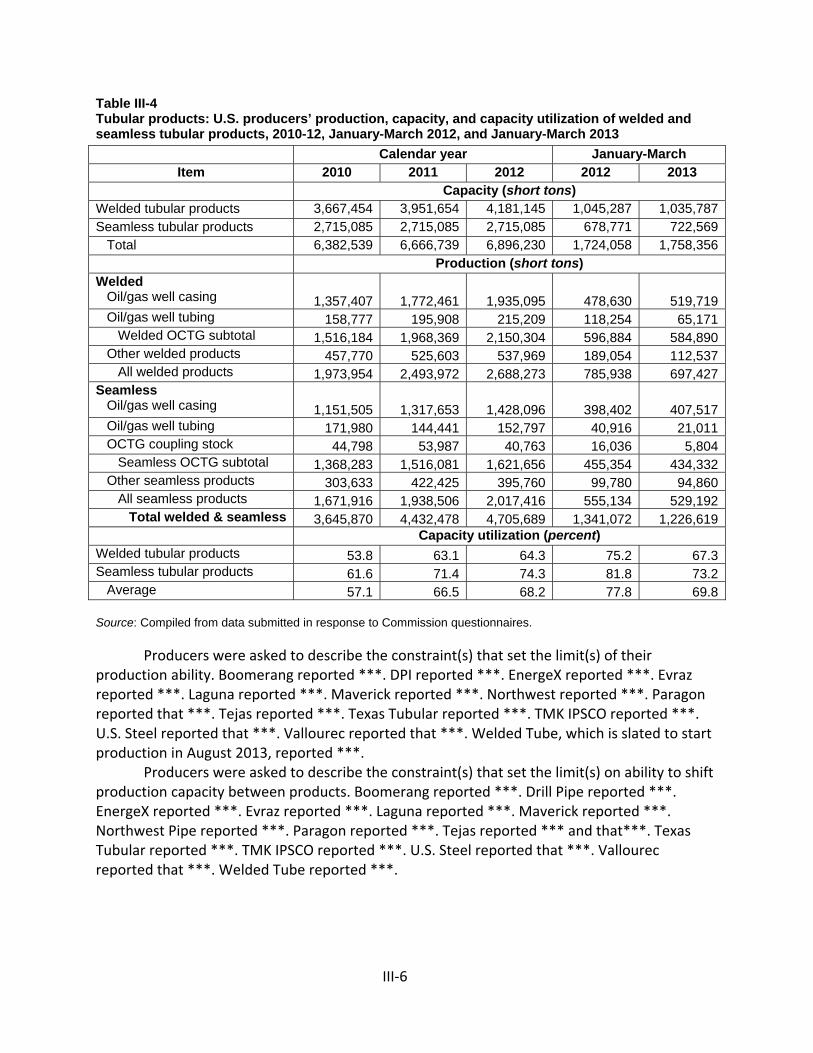
III‐6
Table III-4 Tubular products: U.S. producers’ production, capacity, and capacity utilization of welded and seamless tubular products, 2010-12, January-March 2012, and January-March 2013 Calendar year January-March
Item 2010 2011 2012 2012 2013 Capacity (short tons) Welded tubular products 3,667,454 3,951,654 4,181,145 1,045,287 1,035,787Seamless tubular products 2,715,085 2,715,085 2,715,085 678,771 722,569 Total 6,382,539 6,666,739 6,896,230 1,724,058 1,758,356 Production (short tons) Welded Oil/gas well casing 1,357,407 1,772,461 1,935,095 478,630 519,719 Oil/gas well tubing 158,777 195,908 215,209 118,254 65,171 Welded OCTG subtotal 1,516,184 1,968,369 2,150,304 596,884 584,890 Other welded products 457,770 525,603 537,969 189,054 112,537 All welded products 1,973,954 2,493,972 2,688,273 785,938 697,427Seamless Oil/gas well casing 1,151,505 1,317,653 1,428,096 398,402 407,517 Oil/gas well tubing 171,980 144,441 152,797 40,916 21,011 OCTG coupling stock 44,798 53,987 40,763 16,036 5,804 Seamless OCTG subtotal 1,368,283 1,516,081 1,621,656 455,354 434,332 Other seamless products 303,633 422,425 395,760 99,780 94,860 All seamless products 1,671,916 1,938,506 2,017,416 555,134 529,192 Total welded & seamless 3,645,870 4,432,478 4,705,689 1,341,072 1,226,619 Capacity utilization (percent) Welded tubular products 53.8 63.1 64.3 75.2 67.3Seamless tubular products 61.6 71.4 74.3 81.8 73.2 Average 57.1 66.5 68.2 77.8 69.8 Source: Compiled from data submitted in response to Commission questionnaires.
Producers were asked to describe the constraint(s) that set the limit(s) of their production ability. Boomerang reported ***. DPI reported ***. EnergeX reported ***. Evraz reported ***. Laguna reported ***. Maverick reported ***. Northwest reported ***. Paragon reported that ***. Tejas reported ***. Texas Tubular reported ***. TMK IPSCO reported ***. U.S. Steel reported that ***. Vallourec reported that ***. Welded Tube, which is slated to start production in August 2013, reported ***.
Producers were asked to describe the constraint(s) that set the limit(s) on ability to shift production capacity between products. Boomerang reported ***. Drill Pipe reported ***. EnergeX reported ***. Evraz reported ***. Laguna reported ***. Maverick reported ***. Northwest Pipe reported ***. Paragon reported ***. Tejas reported *** and that***. Texas Tubular reported ***. TMK IPSCO reported ***. U.S. Steel reported that ***. Vallourec reported that ***. Welded Tube reported ***.
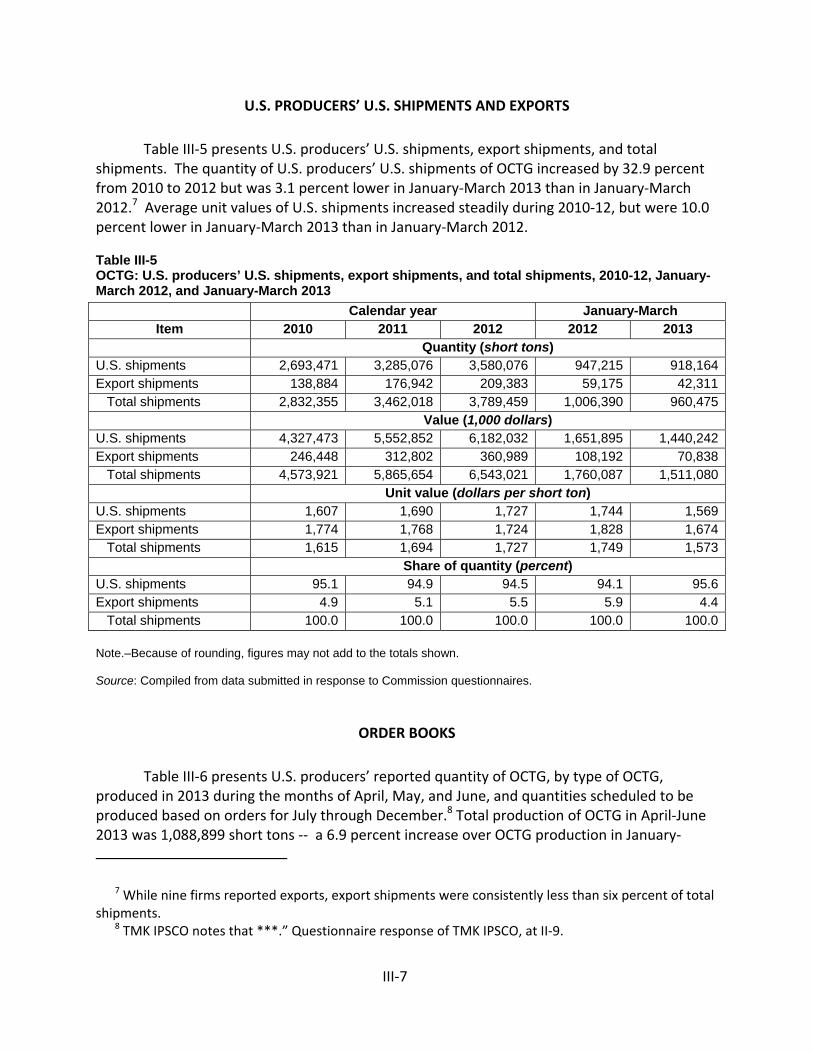
III‐7
U.S. PRODUCERS’ U.S. SHIPMENTS AND EXPORTS
Table III‐5 presents U.S. producers’ U.S. shipments, export shipments, and total shipments. The quantity of U.S. producers’ U.S. shipments of OCTG increased by 32.9 percent from 2010 to 2012 but was 3.1 percent lower in January‐March 2013 than in January‐March 2012.7 Average unit values of U.S. shipments increased steadily during 2010‐12, but were 10.0 percent lower in January‐March 2013 than in January‐March 2012.
Table III-5 OCTG: U.S. producers’ U.S. shipments, export shipments, and total shipments, 2010-12, January-March 2012, and January-March 2013 Calendar year January-March
Item 2010 2011 2012 2012 2013 Quantity (short tons) U.S. shipments 2,693,471 3,285,076 3,580,076 947,215 918,164Export shipments 138,884 176,942 209,383 59,175 42,311 Total shipments 2,832,355 3,462,018 3,789,459 1,006,390 960,475 Value (1,000 dollars) U.S. shipments 4,327,473 5,552,852 6,182,032 1,651,895 1,440,242Export shipments 246,448 312,802 360,989 108,192 70,838 Total shipments 4,573,921 5,865,654 6,543,021 1,760,087 1,511,080 Unit value (dollars per short ton) U.S. shipments 1,607 1,690 1,727 1,744 1,569Export shipments 1,774 1,768 1,724 1,828 1,674 Total shipments 1,615 1,694 1,727 1,749 1,573 Share of quantity (percent) U.S. shipments 95.1 94.9 94.5 94.1 95.6Export shipments 4.9 5.1 5.5 5.9 4.4 Total shipments 100.0 100.0 100.0 100.0 100.0 Note.–Because of rounding, figures may not add to the totals shown. Source: Compiled from data submitted in response to Commission questionnaires.
ORDER BOOKS
Table III‐6 presents U.S. producers’ reported quantity of OCTG, by type of OCTG, produced in 2013 during the months of April, May, and June, and quantities scheduled to be produced based on orders for July through December.8 Total production of OCTG in April‐June 2013 was 1,088,899 short tons ‐‐ a 6.9 percent increase over OCTG production in January‐
7 While nine firms reported exports, export shipments were consistently less than six percent of total shipments.
8 TMK IPSCO notes that ***.” Questionnaire response of TMK IPSCO, at II‐9.

III‐8
March 2013. Orders for July‐September were 819,668 short tons and for October‐December were 520,940 short tons.
Table III-6 OCTG: Production and orders for OCTG, April-December 2013 2013 Production Orders
Item April May June July August September October-
December Quantity (short tons) Welded 206,714 195,987 206,926 182,626 171,850 119,552 264,675Seamless 150,492 165,017 163,763 141,808 113,970 89,862 256,265 Total 357,206 361,004 370,689 324,434 285,820 209,414 520,940 Source: Compiled from data submitted in response to Commission questionnaires
U.S. PRODUCERS’ INVENTORIES
Table III‐7 presents U.S. producers’ end‐of‐period inventories and the ratio of these inventories to U.S. producers’ production, U.S. shipments, and total shipments over the period for which data were collected. Producers’ inventories peaked in absolute terms in March 2012 and were at their lowest levels in 2010. Producers’ inventories in 2010, however, coincide with the highest level of ratios of inventories to production, U.S. shipments, and total shipments.
Table III-7 OCTG: U.S. producers’ end-of-period inventories, 2010-12, January-March 2012, and January-March 2013 Calendar year January-March
Item 2010 2011 2012 2012 2013 Inventories (short tons) 376,911 406,604 382,718 448,792 439,450Ratio to production (percent) 13.1 11.7 10.1 10.7 10.8Ratio to U.S. shipments (percent) 14.0 12.4 10.7 11.8 12.0Ratio to total shipments (percent) 13.3 11.7 10.1 11.1 11.4 Source: Compiled from data submitted in response to Commission questionnaires.
U.S. PRODUCERS’ IMPORTS AND PURCHASES
U.S. producers’ imports and purchases of OCTG are presented in table III‐8.
Table III-8 OCTG: U.S. producers’ U.S. production, imports and purchases, 2010-12, January-March 2012, and January-March 2013
* * * * * * *
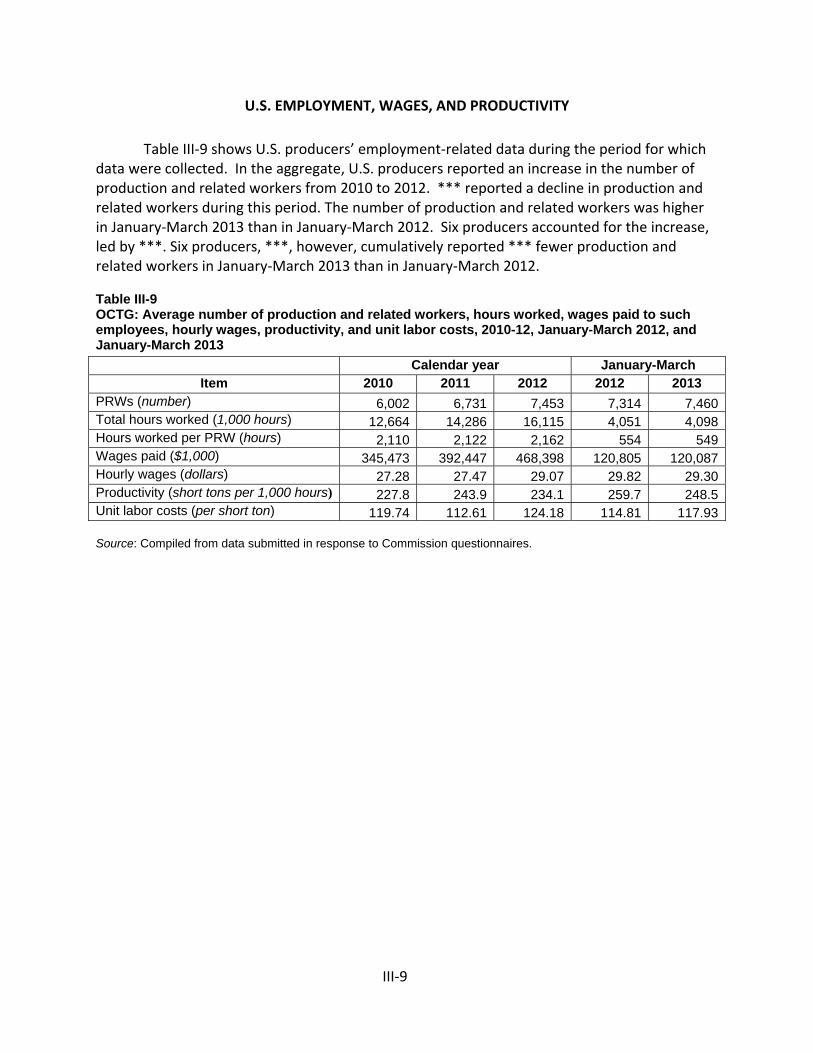
III‐9
U.S. EMPLOYMENT, WAGES, AND PRODUCTIVITY
Table III‐9 shows U.S. producers’ employment‐related data during the period for which data were collected. In the aggregate, U.S. producers reported an increase in the number of production and related workers from 2010 to 2012. *** reported a decline in production and related workers during this period. The number of production and related workers was higher in January‐March 2013 than in January‐March 2012. Six producers accounted for the increase, led by ***. Six producers, ***, however, cumulatively reported *** fewer production and related workers in January‐March 2013 than in January‐March 2012.
Table III-9 OCTG: Average number of production and related workers, hours worked, wages paid to such employees, hourly wages, productivity, and unit labor costs, 2010-12, January-March 2012, and January-March 2013 Calendar year January-March
Item 2010 2011 2012 2012 2013 PRWs (number) 6,002 6,731 7,453 7,314 7,460Total hours worked (1,000 hours) 12,664 14,286 16,115 4,051 4,098Hours worked per PRW (hours) 2,110 2,122 2,162 554 549Wages paid ($1,000) 345,473 392,447 468,398 120,805 120,087Hourly wages (dollars) 27.28 27.47 29.07 29.82 29.30Productivity (short tons per 1,000 hours) 227.8 243.9 234.1 259.7 248.5Unit labor costs (per short ton) 119.74 112.61 124.18 114.81 117.93 Source: Compiled from data submitted in response to Commission questionnaires.

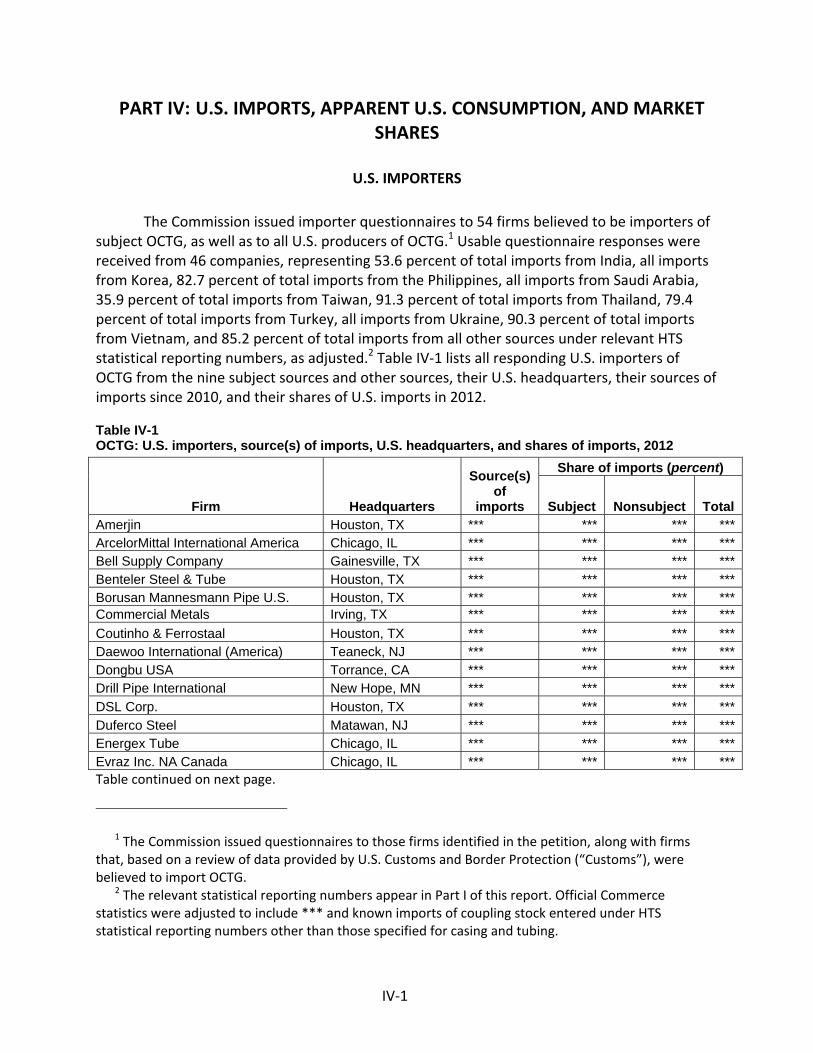
IV‐1
PART IV: U.S. IMPORTS, APPARENT U.S. CONSUMPTION, AND MARKET SHARES
U.S. IMPORTERS
The Commission issued importer questionnaires to 54 firms believed to be importers of subject OCTG, as well as to all U.S. producers of OCTG.1 Usable questionnaire responses were received from 46 companies, representing 53.6 percent of total imports from India, all imports from Korea, 82.7 percent of total imports from the Philippines, all imports from Saudi Arabia, 35.9 percent of total imports from Taiwan, 91.3 percent of total imports from Thailand, 79.4 percent of total imports from Turkey, all imports from Ukraine, 90.3 percent of total imports from Vietnam, and 85.2 percent of total imports from all other sources under relevant HTS statistical reporting numbers, as adjusted.2 Table IV‐1 lists all responding U.S. importers of OCTG from the nine subject sources and other sources, their U.S. headquarters, their sources of imports since 2010, and their shares of U.S. imports in 2012.
Table IV-1 OCTG: U.S. importers, source(s) of imports, U.S. headquarters, and shares of imports, 2012
Firm Headquarters
Source(s) of
imports
Share of imports (percent)
Subject Nonsubject Total Amerjin Houston, TX *** *** *** ***ArcelorMittal International America Chicago, IL *** *** *** ***Bell Supply Company Gainesville, TX *** *** *** ***Benteler Steel & Tube Houston, TX *** *** *** ***Borusan Mannesmann Pipe U.S. Houston, TX *** *** *** ***Commercial Metals Irving, TX *** *** *** ***Coutinho & Ferrostaal Houston, TX *** *** *** ***Daewoo International (America) Teaneck, NJ *** *** *** ***Dongbu USA Torrance, CA *** *** *** ***Drill Pipe International New Hope, MN *** *** *** ***DSL Corp. Houston, TX *** *** *** ***Duferco Steel Matawan, NJ *** *** *** ***Energex Tube Chicago, IL *** *** *** ***Evraz Inc. NA Canada Chicago, IL *** *** *** ***Table continued on next page.
1 The Commission issued questionnaires to those firms identified in the petition, along with firms that, based on a review of data provided by U.S. Customs and Border Protection (“Customs”), were believed to import OCTG.
2 The relevant statistical reporting numbers appear in Part I of this report. Official Commerce statistics were adjusted to include *** and known imports of coupling stock entered under HTS statistical reporting numbers other than those specified for casing and tubing.

IV‐2
Table IV-1--Continued OCTG: U.S. importers, source(s) of imports, U.S. headquarters, and shares of imports, 2012
Firm Headquarters
Source(s) of
imports
Share of imports (percent)
Subject Nonsubject Total Fremark Industries New York, NY *** *** *** ***Houston Steel & Pipe International Missouri City, TX *** *** *** ***Husteel U.S.A. Houston, TX *** *** *** ***Hyundai Hysco U.S.A. Houston, TX *** *** *** ***
IMCO International Burlington, ON, Canada *** *** *** ***
Indian Seamless Houston, TX *** *** *** ***International Pipe Trading Company Corona del Mar, CA *** *** *** ***Jindal Saw Limited (Seamless Tubes Division) Nashik, MH, India *** *** *** ***Kumkang Kind U.S.A. Orange, CA *** *** *** ***Laguna Tubular Products Houston, TX *** *** *** ***Marubeni-Itochu Tubulars America Houston, TX *** *** *** ***Nexteel America Houston, TX *** *** *** ***North American Interpipe Houston, TX *** *** *** ***Okaya (U.S.A.) Houston, TX *** *** *** ***Oxbow Steel International Pleasant Hill, CA *** *** *** ***Salzgitter Mannesmann International (U.S.A.) Houston, TX *** *** *** ***Samsung C&T America Ridgefield Park, NJ *** *** *** ***SDB Trade International Pasadena, TX *** *** *** ***Seah Steel America Santa Fe Spring, CA *** *** *** ***Standard Tube Company Houston, TX *** *** *** ***Stemcor U.S.A. New York, NY *** *** *** ***Sumitomo Corporation Of America Houston, TX *** *** *** ***Tata Steel International (Americas) Schaumburg, IL *** *** *** ***Tata Steel International (North America) Schaumburg, IL *** *** *** ***Tenaris Global/Maverick Houston, TX *** *** *** ***Thyssenkrupp Material Southfield, MI *** *** *** ***TMK IPSCO Houston, TX *** *** *** ***Toyota Tsusho America Georgetown, KY *** *** *** ***Vallourec Houston, TX *** *** *** ***Voest-Alpine Tubular Houston, TX *** *** *** ***
Welded Tube Of Canada Concord, ON, Canada *** *** *** ***
WSP Houston OCTG Inc. Houston, TX *** *** *** ***Total 100.0 100.0 100.0 Source: Compiled from data submitted in response to Commission questionnaires.
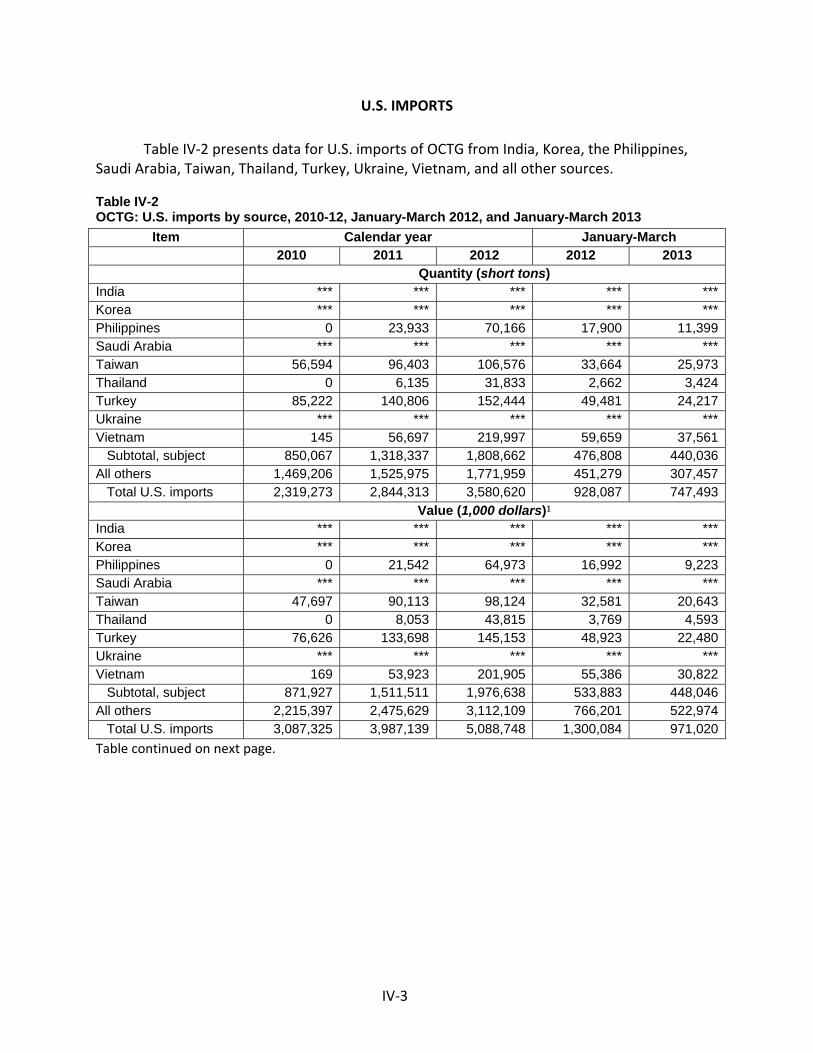
IV‐3
U.S. IMPORTS
Table IV‐2 presents data for U.S. imports of OCTG from India, Korea, the Philippines, Saudi Arabia, Taiwan, Thailand, Turkey, Ukraine, Vietnam, and all other sources.
Table IV-2 OCTG: U.S. imports by source, 2010-12, January-March 2012, and January-March 2013
Item Calendar year January-March 2010 2011 2012 2012 2013 Quantity (short tons) India *** *** *** *** ***Korea *** *** *** *** ***Philippines 0 23,933 70,166 17,900 11,399Saudi Arabia *** *** *** *** ***Taiwan 56,594 96,403 106,576 33,664 25,973Thailand 0 6,135 31,833 2,662 3,424Turkey 85,222 140,806 152,444 49,481 24,217Ukraine *** *** *** *** ***Vietnam 145 56,697 219,997 59,659 37,561 Subtotal, subject 850,067 1,318,337 1,808,662 476,808 440,036All others 1,469,206 1,525,975 1,771,959 451,279 307,457 Total U.S. imports 2,319,273 2,844,313 3,580,620 928,087 747,493 Value (1,000 dollars)1 India *** *** *** *** ***Korea *** *** *** *** ***Philippines 0 21,542 64,973 16,992 9,223Saudi Arabia *** *** *** *** ***Taiwan 47,697 90,113 98,124 32,581 20,643Thailand 0 8,053 43,815 3,769 4,593Turkey 76,626 133,698 145,153 48,923 22,480Ukraine *** *** *** *** ***Vietnam 169 53,923 201,905 55,386 30,822 Subtotal, subject 871,927 1,511,511 1,976,638 533,883 448,046All others 2,215,397 2,475,629 3,112,109 766,201 522,974 Total U.S. imports 3,087,325 3,987,139 5,088,748 1,300,084 971,020Table continued on next page.
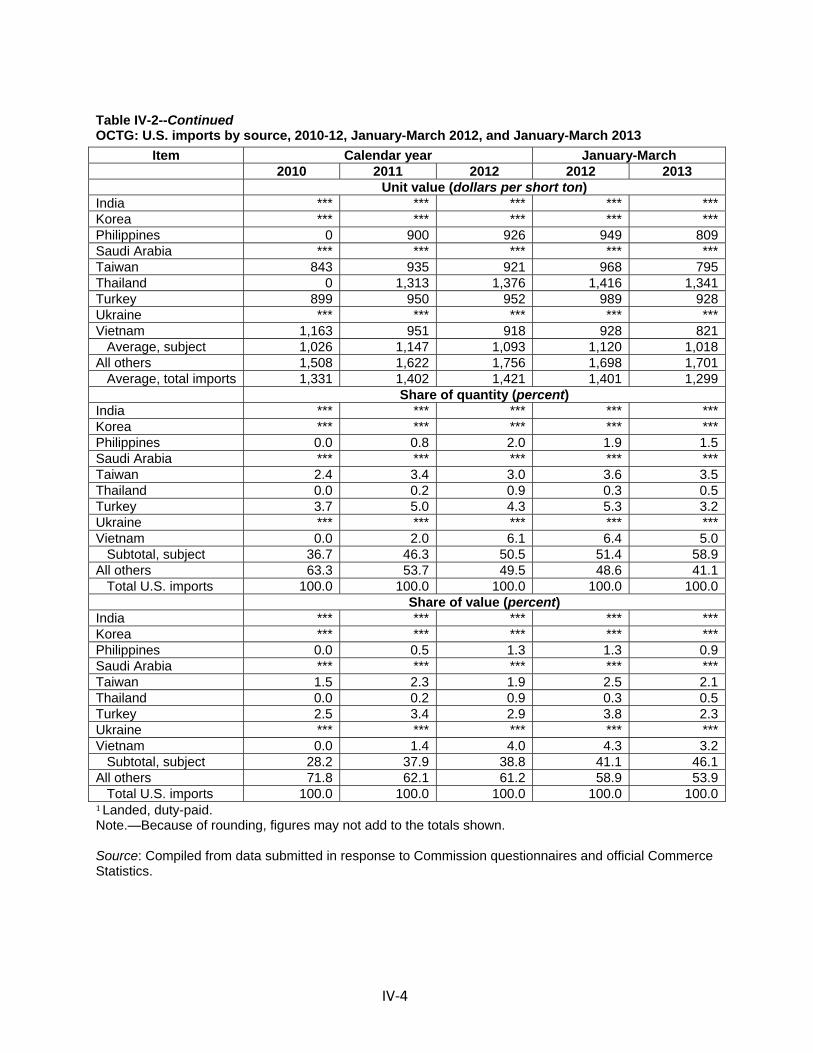
IV‐4
Table IV-2--Continued OCTG: U.S. imports by source, 2010-12, January-March 2012, and January-March 2013
Item Calendar year January-March 2010 2011 2012 2012 2013 Unit value (dollars per short ton) India *** *** *** *** ***Korea *** *** *** *** ***Philippines 0 900 926 949 809Saudi Arabia *** *** *** *** ***Taiwan 843 935 921 968 795Thailand 0 1,313 1,376 1,416 1,341Turkey 899 950 952 989 928Ukraine *** *** *** *** ***Vietnam 1,163 951 918 928 821 Average, subject 1,026 1,147 1,093 1,120 1,018All others 1,508 1,622 1,756 1,698 1,701 Average, total imports 1,331 1,402 1,421 1,401 1,299 Share of quantity (percent) India *** *** *** *** ***Korea *** *** *** *** ***Philippines 0.0 0.8 2.0 1.9 1.5Saudi Arabia *** *** *** *** ***Taiwan 2.4 3.4 3.0 3.6 3.5Thailand 0.0 0.2 0.9 0.3 0.5Turkey 3.7 5.0 4.3 5.3 3.2Ukraine *** *** *** *** ***Vietnam 0.0 2.0 6.1 6.4 5.0 Subtotal, subject 36.7 46.3 50.5 51.4 58.9All others 63.3 53.7 49.5 48.6 41.1 Total U.S. imports 100.0 100.0 100.0 100.0 100.0 Share of value (percent) India *** *** *** *** ***Korea *** *** *** *** ***Philippines 0.0 0.5 1.3 1.3 0.9Saudi Arabia *** *** *** *** ***Taiwan 1.5 2.3 1.9 2.5 2.1Thailand 0.0 0.2 0.9 0.3 0.5Turkey 2.5 3.4 2.9 3.8 2.3Ukraine *** *** *** *** ***Vietnam 0.0 1.4 4.0 4.3 3.2 Subtotal, subject 28.2 37.9 38.8 41.1 46.1All others 71.8 62.1 61.2 58.9 53.9 Total U.S. imports 100.0 100.0 100.0 100.0 100.01Landed, duty-paid. Note.—Because of rounding, figures may not add to the totals shown. Source: Compiled from data submitted in response to Commission questionnaires and official Commerce Statistics.

IV‐5
Table IV‐3 presents data for U.S. imports of OCTG from major nonsubject sources.
Table IV-3 OCTG: U.S. imports from leading nonsubject sources, 2010-12, January-March 2012, and January-March 2013
Item Calendar year January-March 2010 2011 2012 2012 2013 Quantity (short tons) Canada 414,522 409,964 409,669 110,220 84,713Japan 160,059 148,812 227,791 46,399 39,824Germany 120,944 107,632 163,797 24,000 32,597Mexico 148,863 197,508 153,524 59,523 24,800Argentina 81,808 119,362 138,985 42,429 45,692Austria 94,260 118,572 108,933 36,847 25,088Russia 78,202 55,192 88,343 30,325 849Romania 56,374 39,281 57,552 9,839 12,000Colombia 39,344 54,956 47,612 12,123 4,426Brazil 37,387 30,037 44,413 6,632 5,309Spain 32,254 35,857 40,992 11,508 4,052All others (nonsubject) 165,180 152,557 179,199 39,591 21,714Coupling stock adjustment 40,007 56,247 111,147 21,844 6,392 Total (nonsubject) 1,469,206 1,525,975 1,771,959 451,279 307,457 Value (1,000 dollars)1 Canada 573,560 551,479 630,176 165,381 122,815Japan 289,775 333,561 494,067 102,693 69,554Germany 205,512 192,056 299,394 43,897 50,958Mexico 250,100 354,772 317,450 108,349 52,570Argentina 130,938 212,609 271,164 83,632 87,646Austria 157,291 212,155 203,222 68,967 44,914Russia 83,182 57,702 102,218 35,319 1,140Romania 77,073 60,236 93,241 17,214 19,350Colombia 57,010 83,981 76,777 19,554 6,714Brazil 65,591 49,729 72,615 11,597 8,381Spain 50,968 63,889 66,966 18,978 6,205All others (nonsubject) 217,048 221,368 296,009 57,582 42,901Coupling stock adjustment 57,349 82,092 188,811 33,040 9,827 Total (nonsubject) 2,215,397 2,475,629 3,112,109 766,201 522,974Table continued on next page.

IV‐6
Table IV-3--Continued OCTG: U.S. imports from leading nonsubject sources, 2010-12, January-March 2012, and January-March 2013
Item Calendar year January-March 2010 2011 2012 2012 2013 Unit value (dollars per short ton) Canada 1,384 1,345 1,538 1,500 1,450Japan 1,810 2,241 2,169 2,213 1,747Germany 1,699 1,784 1,828 1,829 1,563Mexico 1,680 1,796 2,068 1,820 2,120Argentina 1,601 1,781 1,951 1,971 1,918Austria 1,669 1,789 1,866 1,872 1,790Russia 1,064 1,045 1,157 1,165 1,343Romania 1,367 1,533 1,620 1,750 1,612Colombia 1,449 1,528 1,613 1,613 1,517Brazil 1,754 1,656 1,635 1,749 1,579Spain 1,580 1,782 1,634 1,649 1,531All others (nonsubject) 1,314 1,451 1,652 1,454 1,976Coupling stock adjustment 1,433 1,459 1,699 1,513 1,537 Total (nonsubject) 1,508 1,622 1,756 1,698 1,7011 Landed, duty-paid. Source: Compiled from data submitted in response to Commission questionnaires and official Commerce Statistics.
NEGLIGIBILITY
The statute requires that an investigation be terminated without an injury determination if imports of the subject merchandise are found to be negligible.3 Negligible imports are generally defined in the Tariff Act of 1930, as amended, as imports from a country of merchandise corresponding to a domestic like product where such imports account for less than 3 percent of the volume of all such merchandise imported into the United States in the most recent 12‐month period for which data are available that precedes the filing of the petition or the initiation of the investigation. However, if there are imports of such merchandise from a number of countries subject to investigations initiated on the same day that individually account for less than 3 percent of the total volume of the subject merchandise, and if the imports from those countries collectively account for more than 7 percent of the volume of all such merchandise imported into the United States during the applicable 12‐month period, then imports from such countries are deemed not to be negligible.4 Table IV‐4 presents data for
3 Sections 703(a)(1), 705(b)(1), 733(a)(1), and 735(b)(1) of the Act (19 U.S.C. §§ 1671b(a)(1), 1671d(b)(1), 1673b(a)(1), and 1673d(b)(1)).
4 Section 771 (24) of the Act (19 U.S.C § 1677(24)).

IV‐7
imports during July 2012‐June 2013 for each subject country and its share of total imports. Data are presented for official Commerce data for U.S. imports of OCTG and the same Commerce data adjusted to account for subject imports *** and known imports of coupling stock entered under HTS statistical reporting numbers other than those specified for casing and tubing. Official Commerce data alone show that shares of imports from three subject countries individually account for less than 3 percent of the volume of total imports of OCTG – Philippines (2.3 percent), Saudi Arabia (2.1 percent), and Thailand (0.9 percent) – and combined less than 7 percent of the volume of total imports of OCTG – (5.1 percent).5 Adjusted official Commerce data show that shares of imports from four subject countries individually account for less than 3 percent of the volume of total imports of OCTG – Philippines (2.2 percent), Saudi Arabia (*** percent), Taiwan (2.9 percent), and Thailand (0.8 percent) – and combined more than 7 percent of the volume of total imports of OCTG – (*** percent).
Table IV-4 OCTG: U.S. imports by source and share of imports, July 2012-June 2013
July 2012 - June 2013 Country
Official Commerce data Adjusted
official Commerce data Quantity (short tons) India 132,136 ***Korea 868,098 ***Philippines 68,532 68,532Saudi Arabia 59,141 ***Taiwan 92,900 92,900Thailand 26,137 26,137Turkey 130,422 130,422Ukraine 96,200 ***Vietnam 173,298 173,298 Subject, subtotal 1,646,864 1,702,831All other sources 1,383,694 1,470,411 Total 3,030,557 3,173,242Table continued on next page.
5 Because of rounding, the combined share is not the same as the sum of individually reported shares.
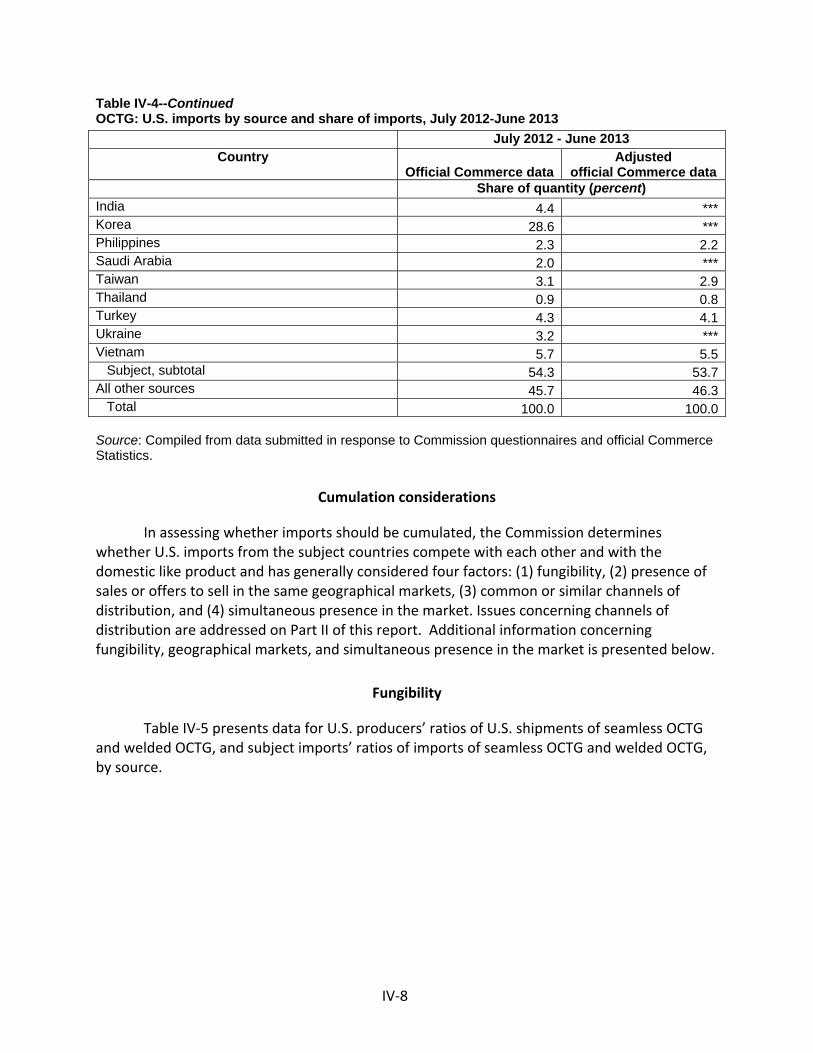
IV‐8
Table IV-4--Continued OCTG: U.S. imports by source and share of imports, July 2012-June 2013 July 2012 - June 2013
Country Official Commerce data
Adjusted official Commerce data
Share of quantity (percent) India 4.4 ***Korea 28.6 ***Philippines 2.3 2.2Saudi Arabia 2.0 ***Taiwan 3.1 2.9Thailand 0.9 0.8Turkey 4.3 4.1Ukraine 3.2 ***Vietnam 5.7 5.5 Subject, subtotal 54.3 53.7All other sources 45.7 46.3 Total 100.0 100.0 Source: Compiled from data submitted in response to Commission questionnaires and official Commerce Statistics.
Cumulation considerations
In assessing whether imports should be cumulated, the Commission determines whether U.S. imports from the subject countries compete with each other and with the domestic like product and has generally considered four factors: (1) fungibility, (2) presence of sales or offers to sell in the same geographical markets, (3) common or similar channels of distribution, and (4) simultaneous presence in the market. Issues concerning channels of distribution are addressed on Part II of this report. Additional information concerning fungibility, geographical markets, and simultaneous presence in the market is presented below.
Fungibility
Table IV‐5 presents data for U.S. producers’ ratios of U.S. shipments of seamless OCTG and welded OCTG, and subject imports’ ratios of imports of seamless OCTG and welded OCTG, by source.

IV‐9
Table IV-5 OCTG: Shares of seamless OCTG and welded OCTG, by source, 2012
Item Seamless OCTG Welded OCTG Share (percent) U.S. producers' shipments 42.6 57.4U.S. imports from-- India *** ***Korea *** ***Philippines 0.0 100.0Saudi Arabia 100.0 0.0Taiwan 3.0 97.0Thailand 100.0 0.0Turkey 0.0 100.0Ukraine 100.0 0.0Vietnam 1.6 98.4 Source: Compiled from data submitted in response to Commission questionnaires and official Commerce Statistics.
Presence in the market
Official Commerce data for U.S. imports were used to evaluate subject import presence in the market. Table IV‐6 summarizes the number of months in which imports were present from each subject source. Imports from India and Korea were present in every month during January 2010‐March 2013. Imports from the Philippines were not present in 2010, present for five months in 2011, 10 months in 2012, and two months during January‐March 2013. Imports from Saudi Arabia were present for three months in 2010, eight months in 2011, eight months in 2012, and two months during January‐March 2013. Imports from Taiwan were present for nine months in 2010, ten months in 2011, and all months during January 2012‐March 2013. Imports from Thailand were not present in 2010, present for five months in 2011 (all during the second half of the year), and all but one month during January 2012‐March 2013. Imports from Turkey were present for ten months in 2010 and all but two months during January 2011‐March 2013. Imports from Ukraine were present for eight months in 2010 and all but four months during January 2011‐March 2013. Imports from Vietnam were present for two months during in 2010 (during the fourth quarter of the year), seven months for 2011, and for all months during January 2012‐March 2013.

IV‐10
Table IV-6 OCTG: Number of months of presence of imports, 2010-12 and January-March 2013 Calendar year January-March
Source 2010 2011 2012 2013 Total Number of months of import entries India 12 12 12 3 39Korea 12 12 12 3 39Philippines 0 5 10 2 17Saudi Arabia 3 8 8 2 21Taiwan 9 10 12 3 34Thailand 0 5 11 3 19Turkey 10 11 12 2 35Ukraine 8 10 11 2 31Vietnam 2 7 12 3 24 Source: Compiled from official Commerce statistics.
Geographical markets
Official Commerce statistics show that in 2012, approximately 97 percent of U.S. imports of casing and tubing from subject countries entered the United States through the Houston‐Galveston, TX customs district. For eight of the nine subject sources ‐‐ India, Korea, Philippines, Saudi Arabia, Taiwan, Ukraine, and Vietnam – the vast majority of such imports entered through the Houston‐Galveston, TX customs district. Imports of casing and tubing from Thailand entered through both the Houston‐Galveston, TX customs district (63 percent) and the Los Angeles, CA customs district (37 percent).

IV‐11
APPARENT U.S. CONSUMPTION
Table IV‐7 presents data on apparent U.S. consumption and U.S. market shares for OCTG over the period for which data were collected.
Table IV-7 OCTG: U.S. shipments of domestic product, U.S. imports, and apparent U.S. consumption, 2010-12, January-March 2012, and January-March 2013 Calendar year January-March
Item 2010 2011 2012 2012 2013 Quantity (short tons) U.S. producers' shipments 2,693,471 3,285,076 3,580,076 947,215 918,164U.S. imports from-- India *** *** *** *** ***Korea *** *** *** *** ***Philippines 0 23,933 70,166 17,900 11,399Saudi Arabia *** *** *** *** ***Taiwan 56,594 96,403 106,576 33,664 25,973Thailand 0 6,135 31,833 2,662 3,424Turkey 85,222 140,806 152,444 49,481 24,217Ukraine *** *** *** *** ***Vietnam 145 56,697 219,997 59,659 37,561 Subtotal, subject 850,067 1,318,337 1,808,662 476,808 440,036All other sources 1,469,206 1,525,975 1,771,959 451,279 307,457 Total imports 2,319,273 2,844,313 3,580,620 928,087 747,493Apparent consumption 5,012,744 6,129,389 7,160,696 1,875,302 1,665,657 Value ($1,000) U.S. producers' shipments 4,327,473 5,552,852 6,182,032 1,651,895 1,440,242U.S. imports from-- India *** *** *** *** ***Korea *** *** *** *** ***Philippines 0 21,542 64,973 16,992 9,223Saudi Arabia *** *** *** *** ***Taiwan 47,697 90,113 98,124 32,581 20,643Thailand 0 8,053 43,815 3,769 4,593Turkey 76,626 133,698 145,153 48,923 22,480Ukraine *** *** *** *** ***Vietnam 169 53,923 201,905 55,386 30,822 Subtotal, subject 871,927 1,511,511 1,976,638 533,883 448,046All other sources 2,215,397 2,475,629 3,112,109 766,201 522,974 Total imports 3,087,325 3,987,139 5,088,748 1,300,084 971,020Apparent consumption 7,414,798 9,539,991 11,270,780 2,951,979 2,411,262 Source: Compiled from data submitted in response to Commission questionnaires and official Commerce Statistics.
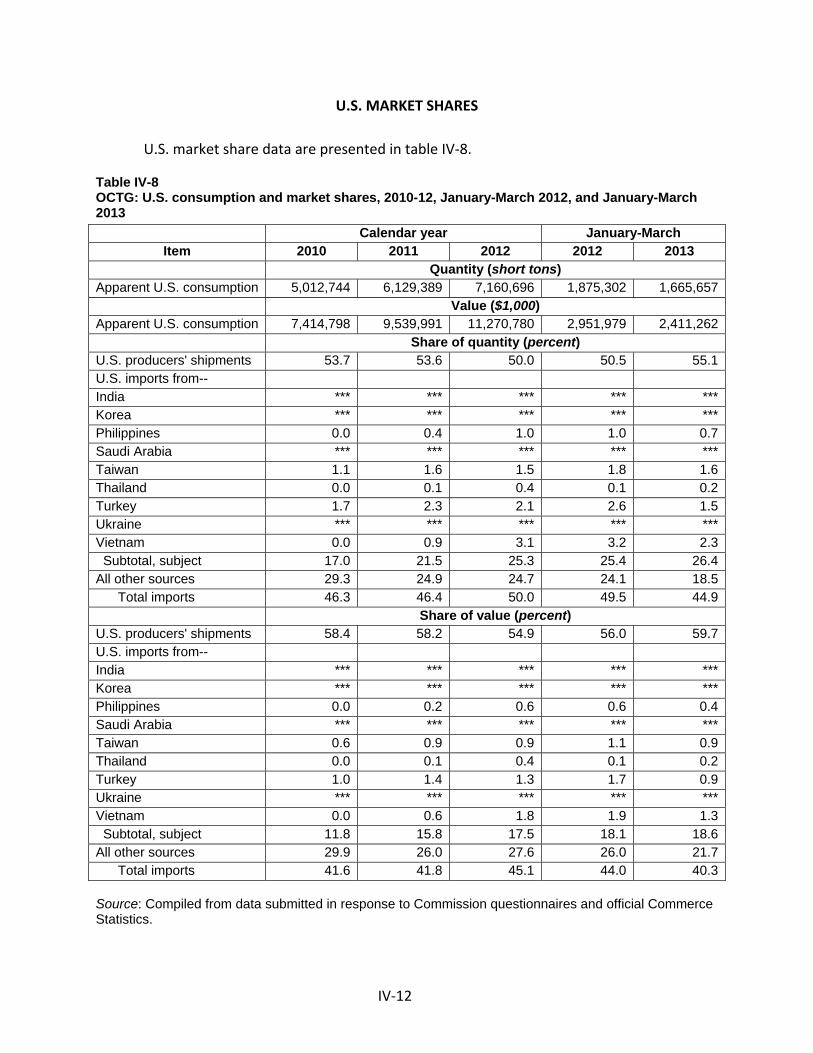
IV‐12
U.S. MARKET SHARES
U.S. market share data are presented in table IV‐8.
Table IV-8 OCTG: U.S. consumption and market shares, 2010-12, January-March 2012, and January-March 2013 Calendar year January-March
Item 2010 2011 2012 2012 2013 Quantity (short tons) Apparent U.S. consumption 5,012,744 6,129,389 7,160,696 1,875,302 1,665,657 Value ($1,000) Apparent U.S. consumption 7,414,798 9,539,991 11,270,780 2,951,979 2,411,262 Share of quantity (percent) U.S. producers' shipments 53.7 53.6 50.0 50.5 55.1U.S. imports from-- India *** *** *** *** ***Korea *** *** *** *** ***Philippines 0.0 0.4 1.0 1.0 0.7Saudi Arabia *** *** *** *** ***Taiwan 1.1 1.6 1.5 1.8 1.6Thailand 0.0 0.1 0.4 0.1 0.2Turkey 1.7 2.3 2.1 2.6 1.5Ukraine *** *** *** *** ***Vietnam 0.0 0.9 3.1 3.2 2.3 Subtotal, subject 17.0 21.5 25.3 25.4 26.4All other sources 29.3 24.9 24.7 24.1 18.5 Total imports 46.3 46.4 50.0 49.5 44.9 Share of value (percent) U.S. producers' shipments 58.4 58.2 54.9 56.0 59.7U.S. imports from-- India *** *** *** *** ***Korea *** *** *** *** ***Philippines 0.0 0.2 0.6 0.6 0.4Saudi Arabia *** *** *** *** ***Taiwan 0.6 0.9 0.9 1.1 0.9Thailand 0.0 0.1 0.4 0.1 0.2Turkey 1.0 1.4 1.3 1.7 0.9Ukraine *** *** *** *** ***Vietnam 0.0 0.6 1.8 1.9 1.3 Subtotal, subject 11.8 15.8 17.5 18.1 18.6All other sources 29.9 26.0 27.6 26.0 21.7 Total imports 41.6 41.8 45.1 44.0 40.3 Source: Compiled from data submitted in response to Commission questionnaires and official Commerce Statistics.
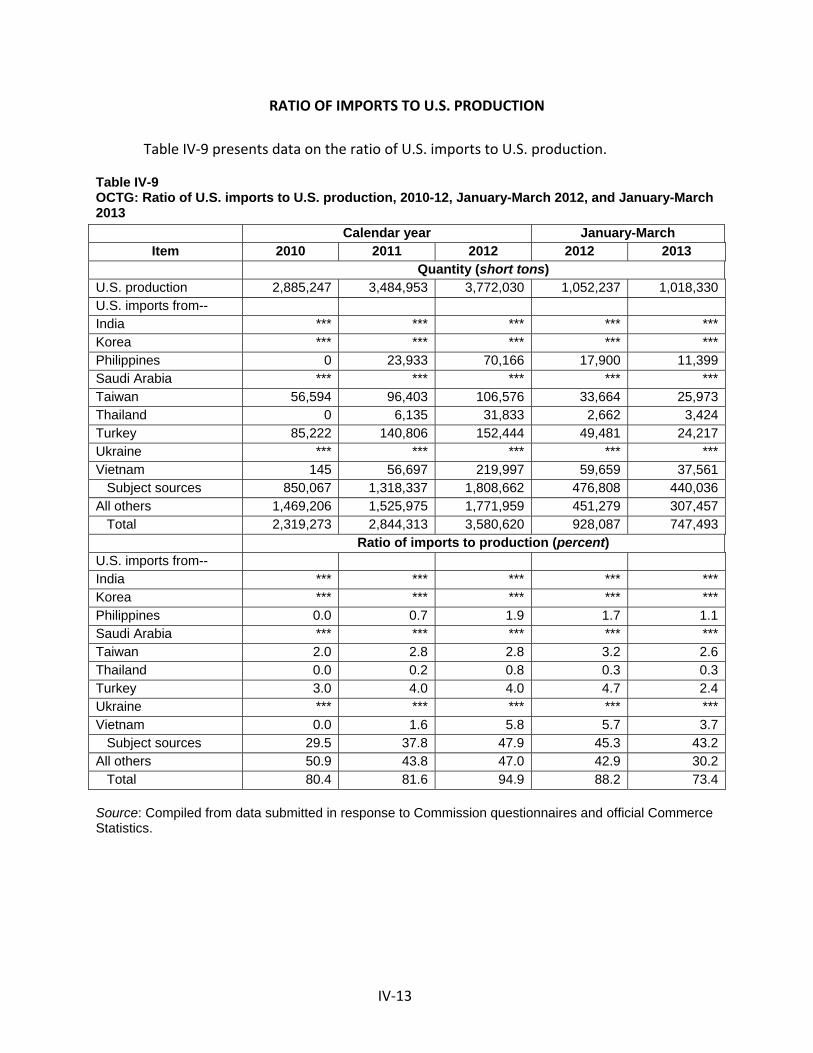
IV‐13
RATIO OF IMPORTS TO U.S. PRODUCTION
Table IV‐9 presents data on the ratio of U.S. imports to U.S. production.
Table IV-9 OCTG: Ratio of U.S. imports to U.S. production, 2010-12, January-March 2012, and January-March 2013 Calendar year January-March
Item 2010 2011 2012 2012 2013 Quantity (short tons) U.S. production 2,885,247 3,484,953 3,772,030 1,052,237 1,018,330U.S. imports from-- India *** *** *** *** ***Korea *** *** *** *** ***Philippines 0 23,933 70,166 17,900 11,399Saudi Arabia *** *** *** *** ***Taiwan 56,594 96,403 106,576 33,664 25,973Thailand 0 6,135 31,833 2,662 3,424Turkey 85,222 140,806 152,444 49,481 24,217Ukraine *** *** *** *** ***Vietnam 145 56,697 219,997 59,659 37,561 Subject sources 850,067 1,318,337 1,808,662 476,808 440,036All others 1,469,206 1,525,975 1,771,959 451,279 307,457 Total 2,319,273 2,844,313 3,580,620 928,087 747,493 Ratio of imports to production (percent) U.S. imports from-- India *** *** *** *** ***Korea *** *** *** *** ***Philippines 0.0 0.7 1.9 1.7 1.1Saudi Arabia *** *** *** *** ***Taiwan 2.0 2.8 2.8 3.2 2.6Thailand 0.0 0.2 0.8 0.3 0.3Turkey 3.0 4.0 4.0 4.7 2.4Ukraine *** *** *** *** ***Vietnam 0.0 1.6 5.8 5.7 3.7 Subject sources 29.5 37.8 47.9 45.3 43.2All others 50.9 43.8 47.0 42.9 30.2 Total 80.4 81.6 94.9 88.2 73.4 Source: Compiled from data submitted in response to Commission questionnaires and official Commerce Statistics.


R
iron, andshare of 2010 to 560.7 perctrend in tthat inputhe mostprices focosts of hbillets uspresente2013. Fig
Figure V-OCTG: Asheet pric
Source: Am
1 Data sections. Tfrom ***.
aw materiald hot‐briquetcost of good58.2 percentcent in Januatheir raw maut costs havet important rr raw materhot‐rolled stsed in the maed in figure Vgure V‐3 pres
-1 verage consces (Midwes
merican Metal M
are presenteThese data ar.
s, primarily ted iron), acds sold for dot in 2012, anary‐March 2aterial costs e been startiraw materiaials have eitteel sheet usanufacture oV‐1. Figure Vsents prices
sumer ferroust), monthly,
Market.
ed for square re believed to
PART V:
FACTORS A
Raw m
hot‐rolled stcount for thomestic prond were 59.22012. Althousince 2010,ng to rise. Imls in the proher been desed to make of seamless V‐2 presents of hot‐rolle
s scrap priceJanuary 201
cross‐sectiono be the best
V‐1
: PRICING
AFFECTING P
material cos
teel (or billehe majority oducers of OC2 percent in Jgh U.S. prod three notedmporters repoduction of Oeclining or fluwelded OCTOCTG duringlonger‐termd billets.1
es (No. 1 hea0-March 201
ned billets, as available dat
G DATA
PRICES
sts
ets and inputof the cost oCTG decreasJanuary‐Maducers most d a downwaported that OCTG, and auctuating sinTG and scrapg January 20
m trends, spe
avy melt, Ch13
opposed to bta regarding h
ts such as cof OCTG. Rawsed from 61.rch 2013, cooften notedrd trend andscrap and ho majority rence January p used to ma010 through ecifically Jan
icago) and h
billets with rohot‐rolled bill
oke, scrap, pw materials a.6 percent inompared witd a fluctuatind three repoot‐rolled coiported that 2010. Averaake hot‐rolleMarch 2013uary 2006‐Ju
hot-rolled ste
ound cross‐et prices. E‐m
ig as a n th ng orted il are
age ed 3 are une
eel
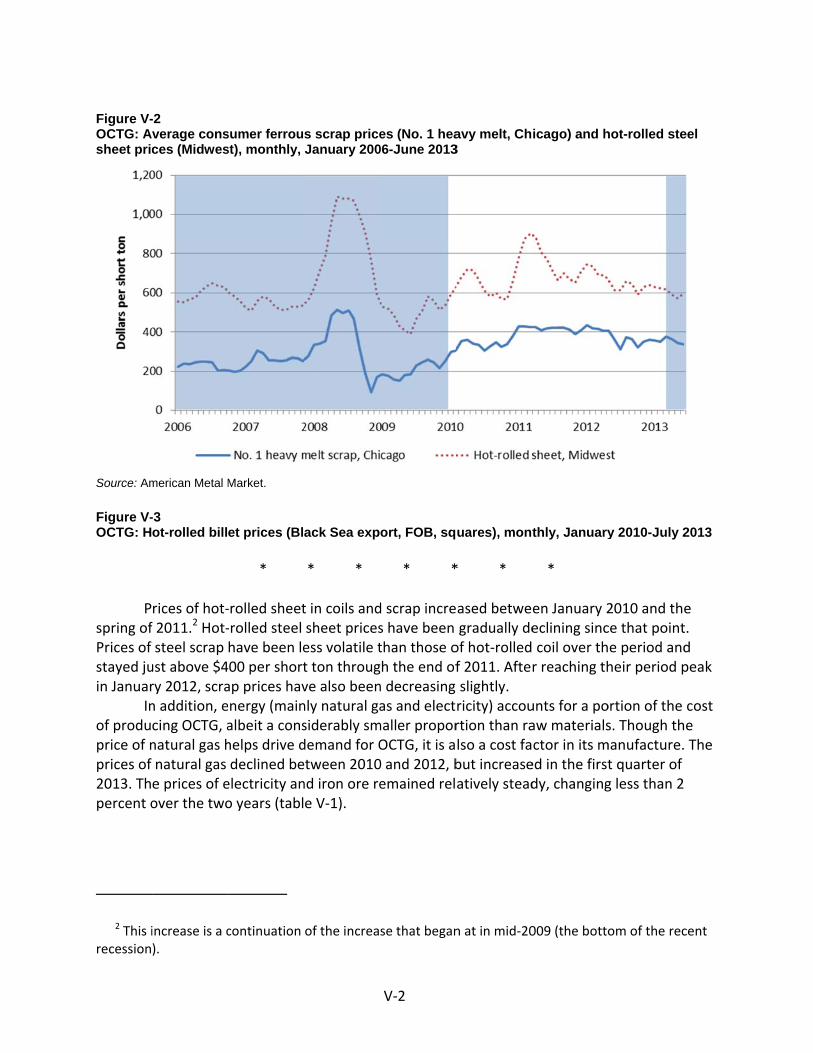
Figure V-OCTG: Asheet pric
Source: Am Figure V-OCTG: H
P
spring ofPrices of stayed juin Januar
Inof produprice of nprices of 2013. Thpercent o
2 This irecession
-2 verage consces (Midwes
merican Metal M
-3 ot-rolled bill
rices of hot‐f 2011.2 Hot‐steel scrap
ust above $4ry 2012, scran addition, ecing OCTG, anatural gas hnatural gas e prices of eover the two
increase is a c).
sumer ferroust), monthly,
Market.
et prices (Bl
*
‐rolled sheet‐rolled steel have been le400 per shortap prices havnergy (mainalbeit a conshelps drive ddeclined beelectricity ano years (tabl
continuation
s scrap priceJanuary 200
ack Sea exp
* *
t in coils andsheet pricesess volatile tt ton througve also beennly natural gasiderably smdemand for Otween 2010nd iron ore ree V‐1).
of the increa
V‐2
es (No. 1 hea06-June 2013
ort, FOB, sq
* *
d scrap incres have been than those ogh the end ofn decreasing as and elect
maller proporOCTG, it is a0 and 2012, bemained rel
se that began
avy melt, Ch3
uares), mont
* *
ased betwegradually deof hot‐rolledf 2011. Afteslightly. ricity) accourtion than ralso a cost fabut increaseatively stead
n at in mid‐20
icago) and h
thly, January
*
en January 2eclining sinc coil over thr reaching th
unts for a poaw materialsctor in its med in the firstdy, changing
009 (the botto
hot-rolled ste
y 2010-July 2
2010 and thece that pointe period andheir period p
ortion of the s. Though th
manufacture.t quarter of g less than 2
om of the rec
eel
2013
e t. d peak
cost e The
cent

V‐3
Table V-1 OCTG: Prices of inputs, yearly, 2010-12 and January - March 2013
Item 2010 2011 2012 Jan.-Mar. 2013Natural gas price (end-use, industrial sector, per mmBTU) $5.44 $5.11 $3.82 $4.56Electricity (industrial, cents per kwh) 6.8 6.8 6.7 6.8eIron ore (per metric ton) $98.79 $99.45 $101.00e n/aNote.‐‐An “e” after a number indicates that data for the entire period is unavailable, so the presented data are estimates. Sources: Energy Information Administration, http://www.eia.doe.gov, http://www.eia.gov/forecasts/steo/tables/?tableNumber=8#, and http://minerals.usgs.gov/minerals/pubs/commodity/iron_ore/mcs-2013-feore.pdf.
U.S. inland transportation costs
Seven U.S. producers provided usable U.S. transportation costs, averaging 7 percent and ranging from 4 to 12 percent of the total delivered cost of their U.S. shipments.3 U.S.‐produced OCTG is shipped a variety of distances, though a large majority in 2012 was shipped between 101 and 1,000 miles (43.0 percent) or more than 1,000 miles (46.1 percent).4 Six producers reported arranging transportation for purchasers, whereas seven reported that purchasers arrange it themselves.
Sixteen importers reported usable U.S. transportation costs, with 14 of the 16 reporting transportation costs that averaged less than 2 percent and ranged from 0.2 to 5.0 percent of total delivered costs.5 Low transportation costs were expected, as 19 of 28 importers shipped 90 to 100 percent of their OCTG 100 miles or less.6 Twenty‐nine of 34 responding importers reported that purchasers arrange transportation.
PRICING PRACTICES
Pricing methods
Pricing basis
Most firms reported selling OCTG on a spot basis. Twelve U.S. producers reported that they set prices for OCTG on a transaction‐by‐transaction basis, 5 reported selling via contracts, and 2 reported using price lists (table V‐2). A majority of importers also reported setting prices on a transaction‐by‐transaction basis. One producer (***) and one importer (***) reported
3 Two producers additionally reported transportation costs as either above 50 percent or as zero. These data were not used.
4 See Part II for further detail regarding shipment distances. 5 Transportation costs reported by importers *** were reported to be 10 percent. 6 As discussed in Part IV, a substantial portion of U.S. imports enter through the port of Houston‐
Galveston, Texas.

V‐4
using current competitive offers for all of its sales whether on the spot market or subject to short‐ or long‐term contracts. One other producer (***) noted that most of its sales are program sales (discussed in greater detail below).
Table V-2 OCTG: U.S. producers’ and importers’ reported price setting methods, by number of responding firms1
Method U.S. producers Importers Transaction-by-transaction 12 41 Contract 5 10 Set price list 2 3 Other 2 1 1 The sum of responses down will not add up to the total number of responding firms as each firm was instructed to check all applicable price setting methods employed. Source: Compiled from data submitted in response to Commission questionnaires.
Domestic sales are somewhat divided between short‐term contract sales and spot sales
(table V‐3). Eight of 12 responding producers reported that at least 50 percent of their 2012 OCTG sales were via short‐ or long‐term contracts.7 At the staff conference, an industry representative stated that many sales are considered “program sales,” which are more like price agreements than contracts.8
Table V-3 OCTG: U.S. producers’ and importers’ reported use of contracts and spot sales, by type of sale, 2012
Type of sale U.S. producers Importers Long-term contracts 2 1 Short-term contracts 10 15 Spot sales 12 25
Source: Compiled from data submitted in response to Commission questionnaires.
Fourteen of the 24 importers of subject OCTG sold exclusively on a spot basis, and eight others sold at least 50 percent of their OCTG on the spot market in 2012. Fourteen importers sold subject OCTG via short‐term contracts, with three doing so exclusively (***) reported selling OCTG on a long‐term basis; long‐term contracts accounted for all of its sales of OCTG.
When asked what proportion of their sales are subject to short‐term and long‐term contracts (as opposed to one‐time spot market sales), domestic producers indicated that 60.1 percent of their OCTG shipments were made pursuant to contracts, and 63.5 percent of reported shipments of imports were made pursuant to short‐ or long‐term contracts. *** was
7 These firms are ***. In all, contract sales accounted for approximately 60 percent of domestic producer sales of OCTG in 2012.
8 Conference transcript, p. 132 (Miller). Therefore, all program sales may not be accounted for in contract percentage data.
V‐5
the only importer reporting long‐term contract sales, and indicated all its sales are subject to these contracts. U.S. producers *** reported selling *** percent of their 2012 sales of OCTG on a long‐term contract basis.
A majority of 2012 shipments of OCTG imported from Korea, Saudi Arabia, and Taiwan were sold pursuant to short‐term contracts. A slight majority of 2012 OCTG shipments from India, Ukraine, and Vietnam were sold on the spot market, as were a large majority of those imported from the Philippines, Thailand, and Turkey (***).
Contract terms
Eleven U.S. producers’ short‐term contracts were reported to be between 1½ and 12 months long (averaging 5½ months). Terms also vary: 3 responding producers’ short‐term contracts fixed only price, whereas 4 fixed price and quantity; 6 typically had renegotiable prices whereas 4 did not; and 7 typically did not contain meet‐or‐release clauses, whereas 3 did.9
Importers’ short‐term contracts ranged between for 2 and 8 months (averaging 4 months), typically fixed both price and quantity, though they allowed price renegotiation, and did not have meet‐or‐release provisions.
Program sales
Program sales are non‐contractual obligations between mills, distributors, and end users that specify the type of OCTG to be supplied, when it will be supplied, and at the price at which it will be supplied. It may provide estimated consumption and a framework for pricing, which may be renegotiated during the term of the program.10 Terms of the program vary from agreement to agreement. One domestic industry participant estimated that program sales encompass as much as 80 to 85 percent of the market for OCTG.11 Respondents indicated that, with the exception of suppliers from Korea, the majority do not participate in program sales due to difficulties with being able to ensure on‐time delivery.12
Sales terms and discounts
Eleven of 14 responding producers13 and 22 of 28 responding importers reported that the majority of their sales were on an f.o.b. basis; 3 producers and 8 importers reported that most of their sales were on a delivered basis. The majority of producers shipping on an f.o.b.
9 Not all producers which indicated that they used short‐term contracts responded to all portions of this question.
10 Conference transcript, pp. 130‐133 (DuBois and Miller). 11 Conference transcript, p. 133 (DuBois). ***. 12 Conference transcript, pp. 253‐259 (Brewer, Cameron, Echavaria, Fowler, Khandelwal, McConnell,
and Simon). 13 One producer noted typically shipping on both a delivered and an f.o.b. basis.
V‐6
basis do so from their mill, while a majority of importers shipping on an f.o.b. basis (12) do so from Houston, Texas; six others noted selling from the port of entry or dock.
More than half (9 of 14) of responding producers do not offer discounts to purchasers of OCTG except for early payment discounts, whereas three offer quantity or annual volume discounts (***). The industry standard payment terms producers offered are 2% 10/net 30 days, although *** offers terms of 2% 25/net 60.14 Thirty‐four importers offer no discounts, whereas three (***) offer quantity or total volume discounts. Eight importers offer a discount other than quantity discounts: four offer a 2 percent early payment discount and four offer discounts on a transaction‐by‐transaction basis. Sales are typically made on a net 30 payment basis, although four responding importers reported net 60 payment terms. One importer, ***, stated that its standard payment terms are net 180 days.
PRICE DATA
The Commission requested U.S. producers (including processors) and U.S. importers of OCTG to provide quarterly data for the total quantity and value of OCTG that was shipped to unrelated customers in the U.S. market. Quarterly data were requested for the period January 2010–March 2013. The products for which pricing data were requested are as follows:
Product 1.‐‐ Tubing, Grade L‐80, 2 7/8" O.D., 6.5 lbs./ft., threaded and coupled, range 2, seamless
Product 2.‐‐ Tubing, Grade J‐55, 2 3/8" O.D., 4.7 lbs./ft., threaded and coupled, range 2, welded Product 3.‐‐ Casing, Grade J‐55, 5 ½" O.D., 17.0 lbs./ft., threaded and coupled, range 3, welded Product 4.‐‐ Casing, Grade P‐110, 5 ½" O.D., 17.0 lbs./ft., threaded and coupled, range 3,
seamless Product 5.‐‐ Casing, Grade J‐55, 8 5/8" O.D., 32.0 lbs./ft., threaded and coupled, range 3,
welded, and Product 6.‐‐ Casing, Grade J‐55, 9 5/8" O.D., 36.0 lbs./ft., threaded and coupled, range 3,
welded.
14 Eight of 14 responding producers offer these terms, while another three offer net 30 terms and three offer something different.

V‐7
Eleven U.S. producers (mills and processors)15 and 19 importers provided usable price data for sales of the six products, although not all firms reported prices for all products and all quarters. Reported pricing products represented 10.5 percent of U.S. shipments of U.S.‐produced products. Among subject imports, they represent 2.8 percent of shipments of imported product from India, 3.8 percent of shipments of imported product from Korea, 3.2 percent of shipments of imported product from the Philippines, 3.2 percent of shipments of imported product from Saudi Arabia, 0.8 percent of shipments of imported product from Taiwan, 2.6 percent of shipments of imported product from Thailand, 10.1 percent of shipments of imported product from Turkey, 5.3 percent of shipments of imported product from Ukraine, and 6.9 percent of shipments of imported product from Vietnam.16
In addition, the same data were requested for imports from nonsubject countries Canada and Japan. No pricing data were received for sales of imports from Japan, but the Commission received data for sales of imports from Canada. Price data are presented in tables V‐4 to V‐9 and figures V‐4 to V‐9. All data are reported in short tons and dollars per short ton.
15 U.S. price data consist primarily of data reported by U.S. mills but also include data reported by U.S. processors ***.
16 There are a large variety of grades and sizes of casing and tubing in the OCTG market. The selected products are representative of those used in the market. Consequently, these percentages are expectedly small.

V‐8
Table V-4 OCTG: Weighted-average f.o.b. prices and quantities of domestic and imported product 1,1 and margins of underselling/(overselling), by quarter, January 2010-March 2013
Period
United States India Korea Price
(dollars per ton)
Quantity (tons)
Price (dollars per ton)
Quantity (tons) Margin
Price (dollars per ton)
Quantity (tons) Margin
2010: Jan.-Mar. *** *** -- 0 -- -- 0 -- Apr.-Jun. *** *** *** *** *** -- 0 -- Jul.-Sept. 1,878 5,931 *** *** *** -- 0 -- Oct.-Dec. 1,981 4,833 -- 0 -- -- 0 --2011: Jan.-Mar. 1,811 5,584 *** *** *** -- 0 -- Apr.-Jun. 1,773 6,448 -- 0 -- -- 0 -- Jul.-Sept. 1,993 7,872 -- 0 -- -- 0 -- Oct.-Dec. 2,042 5,541 -- 0 -- -- 0 --2012: Jan.-Mar. 2,071 5,513 -- 0 *** -- 0 -- Apr.-Jun. 2,013 6,945 *** *** *** *** *** *** Jul.-Sept. 1,813 12,866 *** *** *** -- 0 -- Oct.-Dec. 1,850 10,486 *** *** *** *** *** ***2013: Jan.-Mar. 1,752 7,009 *** *** *** *** *** ***
Thailand Ukraine Vietnam Price
(dollars per ton)
Quantity (tons) Margin
Price (dollars per ton)
Quantity (tons) Margin
Price (dollars per ton)
Quantity (tons) Margin
2010: Jan.-Mar. -- 0 -- -- 0 -- -- 0 -- Apr.-Jun. -- 0 -- *** *** *** -- 0 -- Jul.-Sept. -- 0 -- *** *** *** -- 0 -- Oct.-Dec. -- 0 -- *** *** *** -- 0 --2011: Jan.-Mar. -- 0 -- *** *** *** -- 0 -- Apr.-Jun. -- 0 -- *** *** *** -- 0 -- Jul.-Sept. -- 0 -- *** *** *** -- 0 -- Oct.-Dec. -- 0 -- *** *** *** -- 0 --2012: Jan.-Mar. -- 0 -- *** *** *** -- 0 -- Apr.-Jun. *** *** *** *** *** *** -- 0 -- Jul.-Sept. *** *** *** *** *** *** -- 0 -- Oct.-Dec. *** *** *** *** *** *** *** *** ***2013: Jan.-Mar. -- 0 -- *** *** *** *** *** ***1 Product 1.-- Tubing, Grade L-80, 2 7/8" O.D., 6.5 lbs./ft., threaded and coupled, range 2, seamless. Note.--In addition to these quarterly data, there was one quarter in which imported product 1 from the Philippines was sold: in Jul.-Sept. 2012, *** short tons were sold at a price of $*** per short ton, yielding an underselling margin of *** percent. Source: Compiled from data submitted in response to Commission questionnaires.
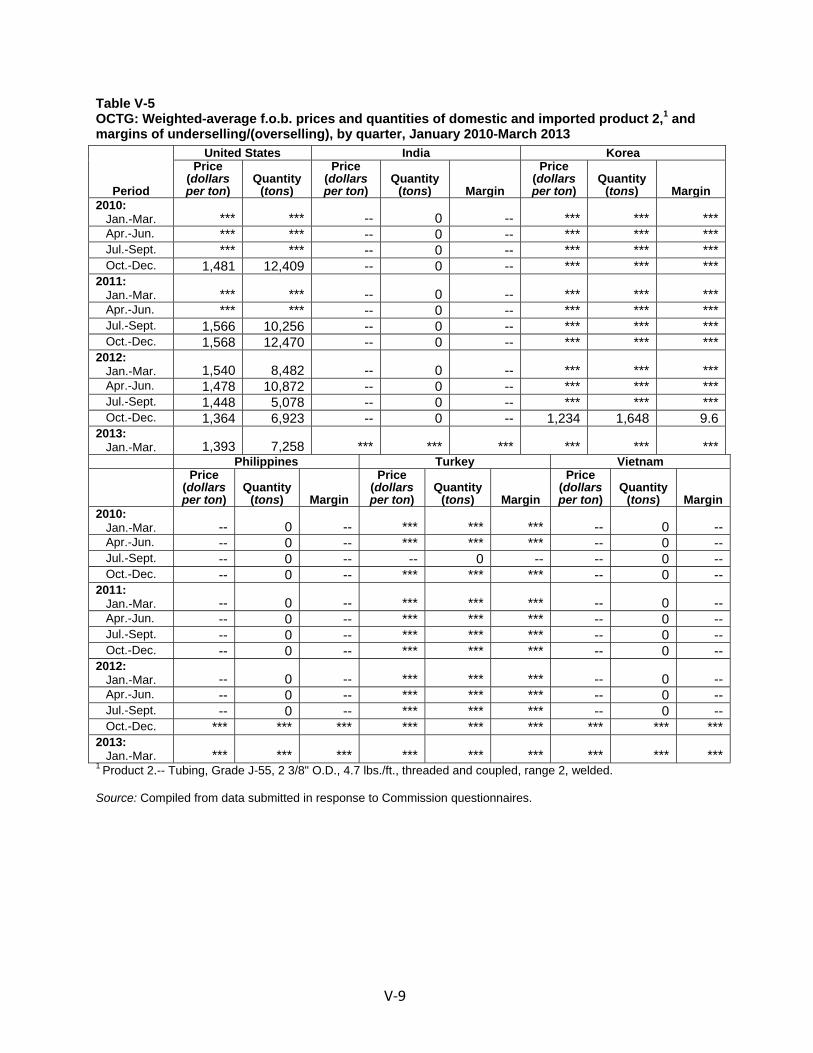
V‐9
Table V-5 OCTG: Weighted-average f.o.b. prices and quantities of domestic and imported product 2,1 and margins of underselling/(overselling), by quarter, January 2010-March 2013
Period
United States India Korea Price
(dollars per ton)
Quantity (tons)
Price (dollars per ton)
Quantity (tons) Margin
Price (dollars per ton)
Quantity (tons) Margin
2010: Jan.-Mar. *** *** -- 0 -- *** *** *** Apr.-Jun. *** *** -- 0 -- *** *** *** Jul.-Sept. *** *** -- 0 -- *** *** *** Oct.-Dec. 1,481 12,409 -- 0 -- *** *** ***2011: Jan.-Mar. *** *** -- 0 -- *** *** *** Apr.-Jun. *** *** -- 0 -- *** *** *** Jul.-Sept. 1,566 10,256 -- 0 -- *** *** *** Oct.-Dec. 1,568 12,470 -- 0 -- *** *** ***2012: Jan.-Mar. 1,540 8,482 -- 0 -- *** *** *** Apr.-Jun. 1,478 10,872 -- 0 -- *** *** *** Jul.-Sept. 1,448 5,078 -- 0 -- *** *** *** Oct.-Dec. 1,364 6,923 -- 0 -- 1,234 1,648 9.62013: Jan.-Mar. 1,393 7,258 *** *** *** *** *** ***
Philippines Turkey Vietnam Price
(dollars per ton)
Quantity (tons) Margin
Price (dollars per ton)
Quantity (tons) Margin
Price (dollars per ton)
Quantity (tons) Margin
2010: Jan.-Mar. -- 0 -- *** *** *** -- 0 -- Apr.-Jun. -- 0 -- *** *** *** -- 0 -- Jul.-Sept. -- 0 -- -- 0 -- -- 0 -- Oct.-Dec. -- 0 -- *** *** *** -- 0 --2011: Jan.-Mar. -- 0 -- *** *** *** -- 0 -- Apr.-Jun. -- 0 -- *** *** *** -- 0 -- Jul.-Sept. -- 0 -- *** *** *** -- 0 -- Oct.-Dec. -- 0 -- *** *** *** -- 0 --2012: Jan.-Mar. -- 0 -- *** *** *** -- 0 -- Apr.-Jun. -- 0 -- *** *** *** -- 0 -- Jul.-Sept. -- 0 -- *** *** *** -- 0 -- Oct.-Dec. *** *** *** *** *** *** *** *** ***2013: Jan.-Mar. *** *** *** *** *** *** *** *** ***1 Product 2.-- Tubing, Grade J-55, 2 3/8" O.D., 4.7 lbs./ft., threaded and coupled, range 2, welded. Source: Compiled from data submitted in response to Commission questionnaires.

V‐10
Table V-6 OCTG: Weighted-average f.o.b. prices and quantities of domestic and imported product 3,1 and margins of underselling/(overselling), by quarter, January 2010-March 2013
Period
United States Korea PhilippinesPrice
(dollars per ton)
Quantity (tons)
Price (dollars per ton)
Quantity (tons) Margin
Price (dollars per ton)
Quantity (tons) Margin
2010: Jan.-Mar. 1,097 10,334 *** *** *** -- 0 -- Apr.-Jun. 1,197 11,367 *** *** *** -- 0 -- Jul.-Sept. 1,266 11,583 *** *** *** -- 0 -- Oct.-Dec. 1,180 12,876 *** *** *** -- 0 --2011: Jan.-Mar. 1,198 13,050 *** *** *** -- 0 -- Apr.-Jun. 1,207 9,836 *** *** *** -- 0 -- Jul.-Sept. 1,310 11,821 *** *** *** -- 0 -- Oct.-Dec. 1,295 13,536 *** *** *** -- 0 --2012: Jan.-Mar. 1,283 11,373 *** *** *** -- 0 -- Apr.-Jun. 1,274 13,787 *** *** *** *** *** *** Jul.-Sept. 1,259 15,576 *** *** *** -- 0 -- Oct.-Dec. 1,187 11,180 *** *** *** *** *** ***2013: Jan.-Mar. 1,117 8,360 *** *** *** *** *** ***
Taiwan Turkey Vietnam Price
(dollars per ton)
Quantity (tons) Margin
Price (dollars per ton)
Quantity (tons) Margin
Price (dollars per ton)
Quantity (tons) Margin
2010: Jan.-Mar. -- 0 -- -- 0 -- -- 0 -- Apr.-Jun. -- 0 -- -- 0 -- -- 0 -- Jul.-Sept. -- 0 -- -- 0 -- -- 0 -- Oct.-Dec. -- 0 -- -- 0 -- -- 0 --2011: Jan.-Mar. -- 0 -- -- 0 -- *** *** *** Apr.-Jun. -- 0 -- *** *** *** -- 0 -- Jul.-Sept. -- 0 -- *** *** *** *** *** *** Oct.-Dec. -- 0 -- *** *** *** *** *** ***2012: Jan.-Mar. -- 0 -- *** *** *** *** *** *** Apr.-Jun. *** *** *** *** *** *** *** *** *** Jul.-Sept. *** *** *** *** *** *** *** *** *** Oct.-Dec. -- 0 -- *** *** *** *** *** ***2013: Jan.-Mar. -- 0 -- *** *** *** *** *** ***1 Product 3.-- Casing, Grade J-55, 5 ½" O.D., 17.0 lbs./ft., threaded and coupled, range 3, welded. Source: Compiled from data submitted in response to Commission questionnaires.

V‐11
Table V-7 OCTG: Weighted-average f.o.b. prices and quantities of domestic and imported product 4,1 and margins of underselling/(overselling), by quarter, January 2010-March 2013
Period
United States India Saudi ArabiaPrice
(dollars per ton)
Quantity (tons)
Price (dollars per ton)
Quantity (tons) Margin
Price (dollars per ton)
Quantity (tons) Margin
2010: Jan.-Mar. *** *** *** *** *** -- 0 -- Apr.-Jun. *** *** *** *** *** -- 0 -- Jul.-Sept. *** *** *** *** *** -- 0 -- Oct.-Dec. *** *** *** *** *** -- 0 --2011: Jan.-Mar. 1,927 1,698 -- 0 -- *** *** *** Apr.-Jun. 1,818 203 *** *** *** *** *** *** Jul.-Sept. *** *** *** *** *** *** *** *** Oct.-Dec. *** *** *** *** *** *** *** ***2012: Jan.-Mar. 1,929 5,390 *** *** *** *** *** *** Apr.-Jun. *** *** *** *** *** *** *** *** Jul.-Sept. 1,801 3,798 *** *** *** *** *** *** Oct.-Dec. *** *** *** *** *** *** *** ***2013: Jan.-Mar. 1,627 9,006 *** *** *** *** *** ***
Thailand Ukraine Price
(dollars per ton)
Quantity (tons) Margin
Price (dollars per ton)
Quantity (tons) Margin
2010: Jan.-Mar. -- 0 -- -- 0 -- Apr.-Jun. -- 0 -- *** *** *** Jul.-Sept. -- 0 -- -- 0 -- Oct.-Dec. -- 0 -- *** *** *** 2011: Jan.-Mar. -- 0 -- *** *** *** Apr.-Jun. -- 0 -- *** *** *** Jul.-Sept. -- 0 -- -- 0 -- Oct.-Dec. -- 0 -- *** *** *** 2012: Jan.-Mar. *** *** *** *** *** *** Apr.-Jun. -- 0 -- *** *** *** Jul.-Sept. -- 0 -- *** *** *** Oct.-Dec. *** *** *** *** *** *** 2013: Jan.-Mar. -- 0 -- -- 0 -- 1 Product 4.-- Casing, Grade P-110, 5 ½" O.D., 17.0 lbs./ft., threaded and coupled, range 3, seamless. Source: Compiled from data submitted in response to Commission questionnaires.

V‐12
Table V-8 OCTG: Weighted-average f.o.b. prices and quantities of domestic and imported product 5,1 and margins of underselling/(overselling), by quarter, January 2010-March 2013
Period
United States India Korea Price
(dollars per ton)
Quantity (tons)
Price (dollars per ton)
Quantity (tons) Margin
Price (dollars per ton)
Quantity (tons) Margin
2010: Jan.-Mar. 1,042 7,538 -- 0 -- *** *** *** Apr.-Jun. 1,133 6,751 -- 0 -- *** *** *** Jul.-Sept. 1,223 5,428 -- 0 -- *** *** *** Oct.-Dec. 1,144 8,131 *** *** *** *** *** ***2011: Jan.-Mar. 1,135 17,726 *** *** *** *** *** *** Apr.-Jun. 1,212 13,018 -- 0 -- *** *** *** Jul.-Sept. 1,261 9,338 *** *** *** *** *** *** Oct.-Dec. 1,301 18,333 *** *** *** *** *** ***2012: Jan.-Mar. 1,283 22,639 -- 0 -- *** *** *** Apr.-Jun. 1,274 23,542 -- 0 -- -- 0 -- Jul.-Sept. 1,244 25,329 -- 0 -- *** *** *** Oct.-Dec. 1,195 25,024 *** *** *** *** *** ***2013: Jan.-Mar. 1,112 23,751 *** *** *** *** *** ***
Taiwan Turkey Vietnam Price
(dollars per ton)
Quantity (tons) Margin
Price (dollars per ton)
Quantity (tons) Margin
Price (dollars per ton)
Quantity (tons) Margin
2010: Jan.-Mar. -- 0 -- -- 0 -- -- 0 -- Apr.-Jun. -- 0 -- -- 0 -- -- 0 -- Jul.-Sept. -- 0 -- -- 0 -- -- 0 -- Oct.-Dec. -- 0 -- -- 0 -- -- 0 --2011: Jan.-Mar. -- 0 -- *** *** *** -- 0 -- Apr.-Jun. -- 0 -- *** *** *** -- 0 -- Jul.-Sept. -- 0 -- -- 0 -- -- 0 -- Oct.-Dec. -- 0 -- *** *** *** -- 0 --2012: Jan.-Mar. -- 0 -- *** *** *** *** *** *** Apr.-Jun. -- 0 -- *** *** *** *** *** *** Jul.-Sept. *** *** *** *** *** *** *** *** *** Oct.-Dec. *** *** *** *** *** *** *** *** ***2013: Jan.-Mar. -- 0 -- *** *** *** *** *** ***1 Product 5.-- Casing, Grade J-55, 8 5/8" O.D., 32.0 lbs./ft., threaded and coupled, range 3, welded. Note.--In addition to these quarterly data, there was one quarter in which imported product 1 from the Philippines was sold: in Jan.-Mar. 2012, *** short tons were sold at a price of $*** per short ton, yielding an underselling margin of *** percent. Source: Compiled from data submitted in response to Commission questionnaires.

V‐13
Table V-9 OCTG: Weighted-average f.o.b. prices and quantities of domestic and imported product 6,1 and margins of underselling/(overselling), by quarter, January 2010-March 2013
Period
United States India Korea Price
(dollars per ton)
Quantity (tons)
Price (dollars per ton)
Quantity (tons) Margin
Price (dollars per ton)
Quantity (tons) Margin
2010: Jan.-Mar. 1,068 18,310 -- 0 -- *** *** *** Apr.-Jun. 1,144 32,283 -- 0 -- *** *** *** Jul.-Sept. 1,217 24,742 *** *** *** *** *** *** Oct.-Dec. 1,183 27,463 *** *** *** *** *** ***2011: Jan.-Mar. 1,151 28,507 -- 0 -- *** *** *** Apr.-Jun. 1,241 34,555 -- 0 -- *** *** *** Jul.-Sept. 1,296 30,419 -- 0 -- *** *** *** Oct.-Dec. 1,300 43,763 -- 0 -- *** *** ***2012: Jan.-Mar. 1,298 47,873 -- 0 -- *** *** *** Apr.-Jun. 1,276 35,100 *** *** *** *** *** *** Jul.-Sept. 1,228 43,430 *** *** *** *** *** *** Oct.-Dec. 1,167 43,753 *** *** *** *** *** ***2013: Jan.-Mar. 1,116 44,384 *** *** *** *** *** ***
Taiwan Turkey Vietnam Price
(dollars per ton)
Quantity (tons) Margin
Price (dollars per ton)
Quantity (tons) Margin
Price (dollars per ton)
Quantity (tons) Margin
2010: Jan.-Mar. -- 0 -- -- 0 -- -- 0 -- Apr.-Jun. -- 0 -- *** *** *** -- 0 -- Jul.-Sept. -- 0 -- *** *** *** -- 0 -- Oct.-Dec. -- 0 -- *** *** *** -- 0 --2011: Jan.-Mar. -- 0 -- *** *** *** -- 0 -- Apr.-Jun. -- 0 -- *** *** *** -- 0 -- Jul.-Sept. -- 0 -- *** *** *** -- 0 -- Oct.-Dec. -- 0 -- *** *** *** -- 0 --2012: Jan.-Mar. -- 0 -- *** *** *** -- 0 -- Apr.-Jun. -- 0 -- *** *** *** -- 0 -- Jul.-Sept. *** *** *** *** *** *** -- 0 -- Oct.-Dec. -- 0 -- *** *** *** *** *** ***2013: Jan.-Mar. *** *** *** *** *** *** -- 0 --1 Product 6.-- Casing, Grade J-55, 9 5/8" O.D., 36.0 lbs./ft., threaded and coupled, range 3, welded. Source: Compiled from data submitted in response to Commission questionnaires.
V‐14
Figure V-4 OCTG: Weighted-average f.o.b. prices and quantities of domestic and imported product 1, by quarter, January 2010-March 2013
* * * * * * *
Figure V-5 OCTG: Weighted-average f.o.b. prices and quantities of domestic and imported product 2, by quarter, January 2010-March 2013
* * * * * * *
Figure V-6 OCTG: Weighted-average f.o.b. prices and quantities of domestic and imported product 3, by quarter, January 2010-March 2013
* * * * * * *
Figure V-7 OCTG: Weighted-average f.o.b. prices and quantities of domestic and imported product 4, by quarter, January 2010-March 2013
* * * * * * *
Figure V-8 OCTG: Weighted-average f.o.b. prices and quantities of domestic and imported product 5, by quarter, January 2010-March 2013
* * * * * * *
Figure V-9 OCTG: Weighted-average f.o.b. prices and quantities of domestic and imported product 6, by quarter, January 2010-March 2013
* * * * * * *
Price trends
In general, prices increased during 2010 and 2011, and decreased during 2012 and in the first quarter of 2013. Table V‐10 summarizes the price trends, by country and by product. As shown in the table, domestic prices were lowest for each of the 6 products in the first quarter of 2010 and highest in the second half of 2011 or first half of 2012. Overall, prices between the first and the last quarter increased by between 0.1 and 6.7 percent. Pricing data for importers was more varied, both in terms of price changes between the first and last year of the period, and with respect to when the highest or lowest values were observed. Importer price changes ranged between a more than 30 percent decrease and a positive 16 percent increase.
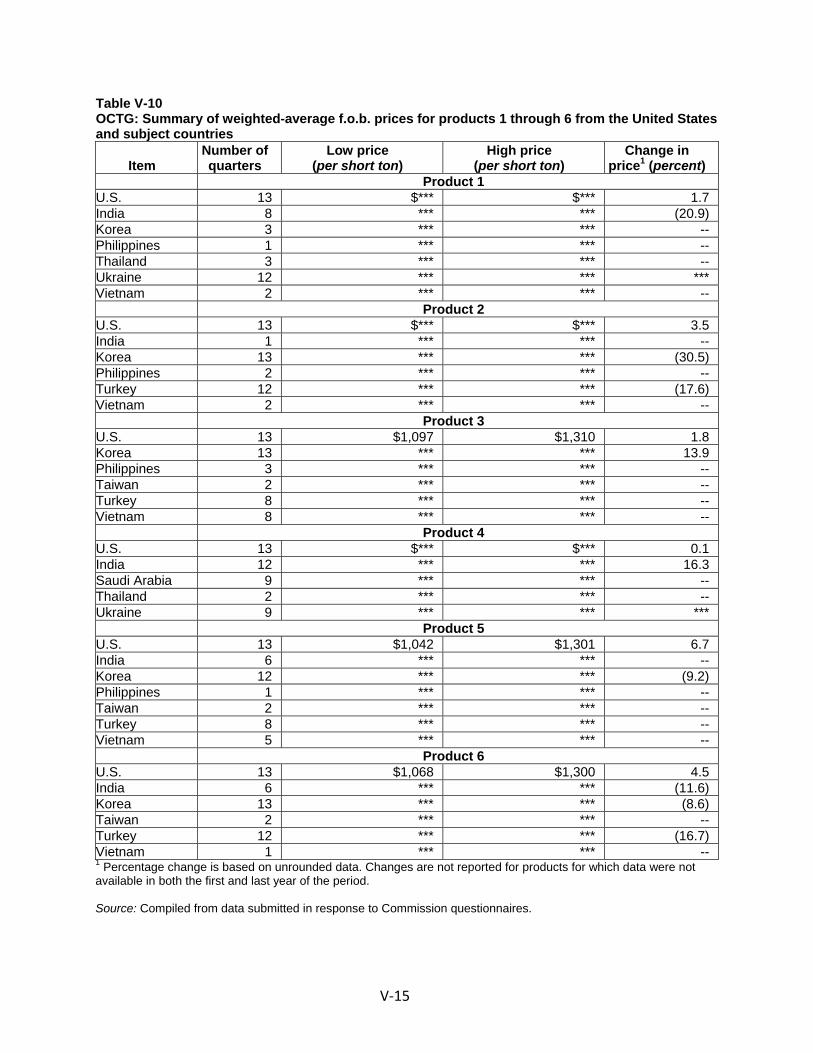
V‐15
Table V-10 OCTG: Summary of weighted-average f.o.b. prices for products 1 through 6 from the United States and subject countries
Item Number of quarters
Low price (per short ton)
High price (per short ton)
Change in price1 (percent)
Product 1 U.S. 13 $*** $*** 1.7 India 8 *** *** (20.9) Korea 3 *** *** -- Philippines 1 *** *** -- Thailand 3 *** *** -- Ukraine 12 *** *** *** Vietnam 2 *** *** -- Product 2 U.S. 13 $*** $*** 3.5 India 1 *** *** -- Korea 13 *** *** (30.5) Philippines 2 *** *** -- Turkey 12 *** *** (17.6) Vietnam 2 *** *** -- Product 3 U.S. 13 $1,097 $1,310 1.8 Korea 13 *** *** 13.9 Philippines 3 *** *** -- Taiwan 2 *** *** -- Turkey 8 *** *** -- Vietnam 8 *** *** -- Product 4 U.S. 13 $*** $*** 0.1 India 12 *** *** 16.3 Saudi Arabia 9 *** *** -- Thailand 2 *** *** -- Ukraine 9 *** *** *** Product 5 U.S. 13 $1,042 $1,301 6.7 India 6 *** *** -- Korea 12 *** *** (9.2) Philippines 1 *** *** -- Taiwan 2 *** *** -- Turkey 8 *** *** -- Vietnam 5 *** *** -- Product 6 U.S. 13 $1,068 $1,300 4.5 India 6 *** *** (11.6) Korea 13 *** *** (8.6) Taiwan 2 *** *** -- Turkey 12 *** *** (16.7) Vietnam 1 *** *** -- 1 Percentage change is based on unrounded data. Changes are not reported for products for which data were not available in both the first and last year of the period. Source: Compiled from data submitted in response to Commission questionnaires.

V‐16
Prices for the domestically produced welded OCTG products (products 2, 3, 5, and 6) moved in a similar fashion over the period of investigation. Prices increased between the first and third quarters of 2010, were depressed in the next two quarters, increased until the third quarter or fourth quarter of 2011, and have been generally decreasing since that time.
Domestically produced product 1, a seamless product, also followed the same pattern, but one quarter later than those for the four welded products. Prices for the other seamless product for which data were collected, product 4, produced in the United States, generally increased between the first quarter of 2010 and the third quarter of 2011, remained at those levels until the second quarter of 2012, but have decreased in each subsequent quarter.
The prices for product 1 imported from India and Korea generally increased from the third quarter of 2010 to the second quarter of 2012, and have decreased since then for all five subject countries for which trend data are available.
Subject imported product 2 from Korea and Turkey were priced highest in 2010 and have generally declined since that time. Pricing data for India, the Philippines, and Vietnam were only available in the final two quarters of the period.
Prices for product 3 imported from Korea followed a similar trend to those of the domestic product 3, with the exception of a one‐quarter price increase in the fourth quarter of 2012. Prices for product 3 imported from Vietnam increased from the first quarter of 2011 (the first quarter for which data were available) through the fourth quarter of 2011, but have been decreasing since that time. Prices for product 3 imported from Turkey stayed relatively level from the second quarter of 2011 (the first quarter for which data were available) through the fourth quarter of 2012, then decreased by more than *** percent in the first quarter of 2013.17
Prices for product 4 imported from Ukraine generally increased from the second quarter of 2010 until the second quarter of 2012 and stayed close to those prices in the third and fourth quarters of 2012 (decreasing *** percent). Prices for product 4 imported from Saudi Arabia increased from $*** per short ton in the first quarter of 2011 (the first quarter for which data were available) to $*** per ton in the third quarter of 2011. These prices remained between $*** and $*** per short ton through the second quarter of 2012 before decreasing to $*** per short ton (*** percent) by the first quarter of 2013. Prices for product 4 imported from India prices generally increased between the first quarter of 2010 and the fourth quarter of 2011. These prices were then lower in the first and second quarters of 2012,18 increased to over $*** per short ton in the third and fourth quarters of 2012 then declined to just over $*** per short ton in the first quarter of 2013.
Prices of product 5 imported from Korea were reported in 12 of 13 possible quarters. The prices increased in 2010, reaching a period peak in the fourth quarter of 2010, but decreased irregularly through the remainder of the period. Prices of product 5 imported from Turkey fluctuated around $*** per short ton between the first quarter of 2011 (the first quarter
17 Importer *** stated that it was facing stiff competition during that quarter, in particular from imports such as those from Korea, the Philippines, and Vietnam among others. It felt that if it did not bring its prices down, it would have been “sitting on the inventory for years.” Staff telephone interview with ***.
18 This decline is due to ***.
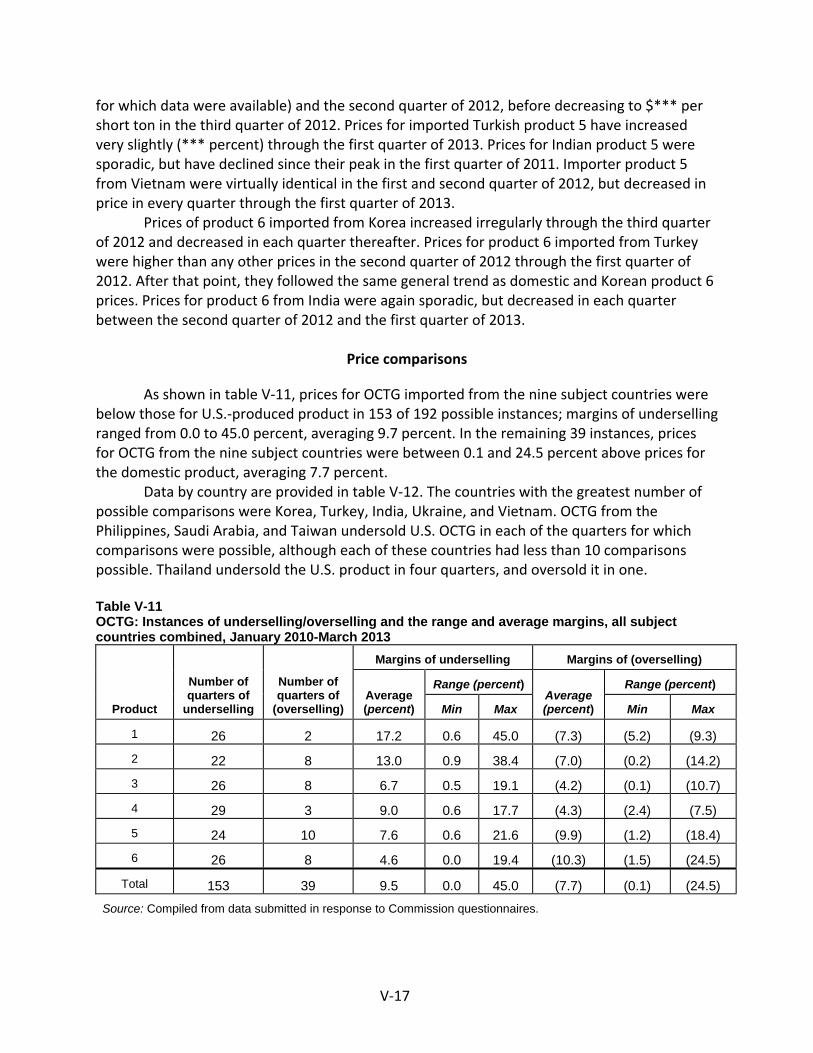
V‐17
for which data were available) and the second quarter of 2012, before decreasing to $*** per short ton in the third quarter of 2012. Prices for imported Turkish product 5 have increased very slightly (*** percent) through the first quarter of 2013. Prices for Indian product 5 were sporadic, but have declined since their peak in the first quarter of 2011. Importer product 5 from Vietnam were virtually identical in the first and second quarter of 2012, but decreased in price in every quarter through the first quarter of 2013.
Prices of product 6 imported from Korea increased irregularly through the third quarter of 2012 and decreased in each quarter thereafter. Prices for product 6 imported from Turkey were higher than any other prices in the second quarter of 2012 through the first quarter of 2012. After that point, they followed the same general trend as domestic and Korean product 6 prices. Prices for product 6 from India were again sporadic, but decreased in each quarter between the second quarter of 2012 and the first quarter of 2013.
Price comparisons
As shown in table V‐11, prices for OCTG imported from the nine subject countries were below those for U.S.‐produced product in 153 of 192 possible instances; margins of underselling ranged from 0.0 to 45.0 percent, averaging 9.7 percent. In the remaining 39 instances, prices for OCTG from the nine subject countries were between 0.1 and 24.5 percent above prices for the domestic product, averaging 7.7 percent.
Data by country are provided in table V‐12. The countries with the greatest number of possible comparisons were Korea, Turkey, India, Ukraine, and Vietnam. OCTG from the Philippines, Saudi Arabia, and Taiwan undersold U.S. OCTG in each of the quarters for which comparisons were possible, although each of these countries had less than 10 comparisons possible. Thailand undersold the U.S. product in four quarters, and oversold it in one.
Table V-11 OCTG: Instances of underselling/overselling and the range and average margins, all subject countries combined, January 2010-March 2013
Product
Number of quarters of
underselling
Number of quarters of
(overselling)
Margins of underselling Margins of (overselling)
Average (percent)
Range (percent) Average (percent)
Range (percent)
Min Max Min Max
1 26 2 17.2 0.6 45.0 (7.3) (5.2) (9.3)
2 22 8 13.0 0.9 38.4 (7.0) (0.2) (14.2)
3 26 8 6.7 0.5 19.1 (4.2) (0.1) (10.7)
4 29 3 9.0 0.6 17.7 (4.3) (2.4) (7.5)
5 24 10 7.6 0.6 21.6 (9.9) (1.2) (18.4)
6 26 8 4.6 0.0 19.4 (10.3) (1.5) (24.5)
Total 153 39 9.5 0.0 45.0 (7.7) (0.1) (24.5)
Source: Compiled from data submitted in response to Commission questionnaires.

V‐18
Table V-12 OCTG: Instances of underselling/overselling and the range and average margin by country, January 2010-March 2013
Product
and country
Number of quarters of
underselling
Number of quarters of
(overselling)
Margins of underselling Margins of (overselling)
Average (percent)
Range (percent) Average (percent)
Range (percent)
Min Max Min Max
India
1 *** *** *** *** *** *** *** ***
2 *** *** *** *** *** -- -- --
4 *** *** *** *** *** *** *** ***
5 *** *** *** *** *** *** *** ***
6 *** *** *** *** *** -- -- --
Total 28 4 8.6 0.6 25.9 (5.9) (3.1) (9.3)
Korea
1 *** *** *** *** *** -- -- --
2 *** *** *** *** *** *** *** ***
3 *** *** *** *** *** *** *** ***
5 *** *** *** *** *** *** *** ***
6 *** *** *** *** *** *** *** ***
Total 35 19 6.8 0.0 32.7 (7.4) (0.2) (18.4)
Philippines
1 *** 0 *** *** *** -- -- --
2 *** 0 *** *** *** -- -- --
3 *** 0 *** *** *** -- -- --
5 *** 0 *** *** *** -- -- --
Total 7 0 18.7 6.0 44.3 -- -- --
Saudi Arabia
4 9 0 *** *** *** -- -- --
Total 9 0 5.0 0.6 15.5 -- -- -- Table continued on next page.
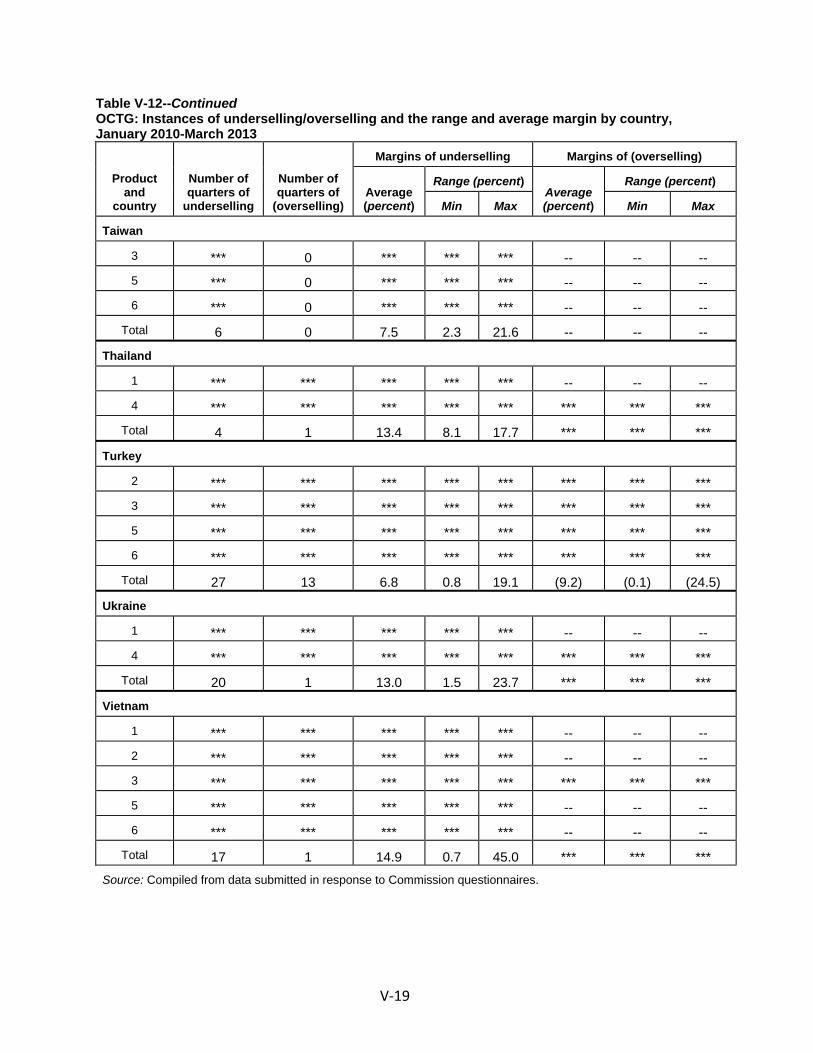
V‐19
Table V-12--Continued OCTG: Instances of underselling/overselling and the range and average margin by country, January 2010-March 2013
Product
and country
Number of quarters of
underselling
Number of quarters of
(overselling)
Margins of underselling Margins of (overselling)
Average (percent)
Range (percent) Average (percent)
Range (percent)
Min Max Min Max
Taiwan
3 *** 0 *** *** *** -- -- --
5 *** 0 *** *** *** -- -- --
6 *** 0 *** *** *** -- -- --
Total 6 0 7.5 2.3 21.6 -- -- --
Thailand
1 *** *** *** *** *** -- -- --
4 *** *** *** *** *** *** *** ***
Total 4 1 13.4 8.1 17.7 *** *** ***
Turkey
2 *** *** *** *** *** *** *** ***
3 *** *** *** *** *** *** *** ***
5 *** *** *** *** *** *** *** ***
6 *** *** *** *** *** *** *** ***
Total 27 13 6.8 0.8 19.1 (9.2) (0.1) (24.5)
Ukraine
1 *** *** *** *** *** -- -- --
4 *** *** *** *** *** *** *** ***
Total 20 1 13.0 1.5 23.7 *** *** ***
Vietnam
1 *** *** *** *** *** -- -- --
2 *** *** *** *** *** -- -- --
3 *** *** *** *** *** *** *** ***
5 *** *** *** *** *** -- -- --
6 *** *** *** *** *** -- -- --
Total 17 1 14.9 0.7 45.0 *** *** ***
Source: Compiled from data submitted in response to Commission questionnaires.
V‐20
Products 1 and 4 are seamless products. Among these products, there were 55 quarters of underselling, compared with 5 quarters of overselling. For welded products (products 2, 3, 5, and 6) in general, there were 98 quarters of underselling and 34 quarters of overselling.
When comparing margins among all subject countries, the average margins of underselling ranged between 5.0 percent (Saudi Arabia), and 18.7 percent (the Philippines). The countries with the largest average margin of underselling were the Philippines (18.7 percent), Vietnam (14.9 percent), Thailand (13.4 percent), and Ukraine (13.0 percent). These four countries were also four of the five with the greatest percentage increase in subject imports between 2010 and 2012: the Philippines and Thailand (infinite since there were no imports in 2010); Vietnam (over 150,000 percent); Thailand (419 percent); and Ukraine (179 percent). Average overselling margins ranged between *** percent (Ukraine) and 9.2 percent (Turkey). Nearly half of the quarters of overselling (19 of 39) were accounted for by imports from Korea, although an additional 13 of them were attributable to Turkey.
LOST SALES AND LOST REVENUES
The Commission requested U.S. producers of OCTG to report any instances of lost sales or revenue they experienced due to competition from imports of OCTG from India, Korea, the Philippines, Saudi Arabia, Taiwan, Thailand, Turkey, Ukraine, and Vietnam since January 2010. The majority were included in the petition, although *** added three allegations in its questionnaire response. All but one involve imports from Korea. Of the 10 responding U.S. producers, nine reported that they had to either reduce prices or roll back announced price increases. The 74 lost sales allegations totaled $267 million and involved 155,408 short tons and the 13 lost revenue allegations totaled $1.1 million and involved 12,372 short tons. Staff contacted 25 purchasers; a summary of the information obtained is presented in tables V‐13 and V‐14 along with the 16 responding purchasers’ replies. In total, purchasers agreed with allegations totaling 32,940 short tons of lost sales, accounting for $53.8 million, as well as 9,905 short tons of lost revenue accounting for $935,287. Table V-13 OCTG: U.S. producers’ lost sales allegations
* * * * * * *
Table V-14 OCTG: U.S. producers’ lost revenue allegations
* * * * * * *
The majority of purchasers also gave further comments regarding the allegations. *** stated that they could not recall the specific allegations and were therefore unable to provide verification. *** stated that it had insufficient information to make any conclusions regarding OCTG pricing by U.S. producers. *** further noted that it purchases a mix of products from domestic and foreign producers, but that no orders were “pulled” from U.S. producers since

V‐21
2010. It added that U.S. producers have occasionally reduced their price on specific quotes to compete with foreign producers of OCTG.
*** agreed with the alleged price differences, but did not purchase the imported foreign OCTG out of support for domestic mills. However, it stated that domestic producers of OCTG have had to lower their prices to compete with the imported product. According to its response, “our selling price has decreased ***% selling domestic product.”
*** somewhat agreed with the allegations, adding that “bids are often awarded based on a multitude of factors beyond price. These factors may include, but are not limited to, quality, mill delivery, requirement dates, relationships, customer preference, short and long term purchasing strategies, etc.” It further commented that “domestic mills are very competitive and both import and domestic OCTG mills adjust their pricing up and down based on a variety of factors.”
For ***, price did influence the choice to shift purchases away from domestic producers, but “availability of domestic tons for specific requirements also plays a big part in the selection of tubulars.”
*** noted that it did not have to lower its U.S. pricing in order to compete with import pricing.
*** commented that it only began focusing on domestic mill sources in ***, but noted that domestic producers have reduced their prices since late 2012 as a result of oversupply and more competitive market conditions.
*** stated that its rejection of the original quote from U.S. producers was not necessarily in response to competing imports from the specified subject country, but that, in general, domestic mills are forced to lower prices to compete with imported OCTG product prices.
*** noted that “these {foreign} mills were always below domestic pricing,” and that “to sell domestic pipe, it requires an end user that prefers it, and is willing to spend more to have it. Otherwise, the prices are too high.” Even in cases where domestic producers reduced their prices, it stated that the cost of domestically produced OCTG was “still higher than the mills mentioned in this trade case.”
*** added that prices of OCTG from the specified subject country are roughly $***/short ton less expensive than domestic goods. It further noted that it prefers domestic product, and thus often ***.
In addition to the data regarding the specific allegations, purchasers named in the allegations were asked two questions regarding the OCTG market. The first is whether the purchaser switched suppliers from a U.S. producer to imports of subject product since January 2010, and if price was the reason for the switch. They were also asked if U.S. producers had to decrease their prices in order to compete with the price of OCTG from subject sources. Responses are presented in table V‐15. Six of 15 responding purchasers noted switching to subject imports, with each reporting that they did so for price reasons. Eleven of 14 responding importers indicated that U.S. producers had to reduce their prices to compete with OCTG from subject countries.

V‐22
Table V-15 OCTG: Purchasers’ responses regarding shifting supply and price reductions
* * * * * * *

VI‐1
PART VI: FINANCIAL EXPERIENCE OF U.S. PRODUCERS
BACKGROUND
Thirteen U.S. producers provided useable financial data on their operations on OCTG.1 These data are believed to account for the majority of U.S. production of OCTG in 2012. No firm reported internal consumption or transfers in the financial section of the Commission’s questionnaire. *** firms provided data on their independent tolling operations on OCTG, which were equivalent to approximately *** percent of total net sales by value in 2012; these data are not presented separately in this section of the report. As noted below, all but two of the firms reported a fiscal year end of December 31.
Ten of the firms reported producing welded OCTG and six reported producing seamless OCTG; U.S. Steel and TMK IPSCO manufacture both seamless and welded OCTG, and Tejas processes both. Production is concentrated among a few firms: Overall, ***.2 The production of both seamless and welded OCTG rose from 2010 to 2012 and was lower in January‐March 2013 than in January‐March 2012.
Several U.S. producers started producing welded OCTG during the 2010‐13 period, including Boomerang, EnergeX, Northwest, Tejas, Texas Steel Conversion (began operations only in May 2013), and Vallourec Star.3 For some this involved expanding OCTG operations from heat‐treating and ending finishing to tube production. These firms together accounted for about *** percent of the industry’s operating income in 2012, largely accounted for by ***.
Operations on OCTG
Income‐and‐loss data for U.S. producers’ operations on OCTG are presented in table VI‐1, while table VI‐2 presents selected company‐specific financial data. Results of operations on OCTG are briefly described here:
Total net sales rose by quantity and value between 2010 and 2012 but both were lower in January‐March 2013 compared with the same period in 2012. The increase in average unit sales values between 2010 and 2012 and subsequent
1 These firms are: ***. Unless noted otherwise, each firm has a fiscal year that ends on or about December 31. The majority of U.S. producers reported their financial results on the basis of GAAP. Maverick and TMK IPSCO reported theirs on the basis of International Financial Reporting Standards (IFRS). Two firms additionally provided tolling data (section V of the Commission’s questionnaire): ***.
Differences between the trade and financial sections of the Commission’s questionnaire are accounted for by timing differences, differences in rounding, and because ***.
2 Separate trade data on seamless and welded OCTG are presented in appendix C. 3 Questionnaire responses, section II‐2a. Boomerang and Tejas, both opened a manufacturing facility
for welded OCTG in 2011, and both were processors only previously, for example. See Maverick’s postconference brief, p. 13.

VI‐2
decline from January‐March 2012 to January‐March 2013 led to the greater percentage increase and decrease, respectively in sales value compared with sales volume. As the data in table VI‐2 indicate, directional changes in period‐to‐period sales were generally the same for all firms. It also appears that changes in average sales values were due to changes in underlying prices as opposed to changes in product mix. Ramp up of operations by several of the newer firms and increased sales by established firms (***, for example) accounted for most of the increase in sales between 2010 and 2012.
Total cost of goods sold (“COGS”) increased between the yearly periods in dollar terms by 53.2 percent, which represented a greater increase than that of either sales volume or value; COGS was lower in January‐March 2013 compared to January‐March 2012 by a similar proportion as sales volume (3.6 percent compared with 3.3 percent). Between 2010 and 2012, directional changes in COGS were the same for each firm; between January‐March 2012 and January‐March 2013, such changes did vary by firm (table VI‐2). The change in total COGS was led by the cost categories of raw material costs and other factory costs, which averaged nearly 60 percent and 31 percent during the full yearly periods, respectively. As shown in the cost of sales section of the variance analysis (table VI‐3), the increase in total COGS is primarily attributable to increased sales volumes while the increase in unit costs of the components, principally raw materials and other factory costs, played a secondary role. Total raw material costs, the single largest cost component of OCTG, increased in dollar terms and as a ratio to sales with increasing sales volume. The per‐unit value increase was accounted for by increases in the price or cost of hot‐rolled sheet and billet used as inputs for pipe‐making. Between the interim periods, total raw material costs were lower in dollar terms and on a per‐unit basis but higher as a ratio to total sales. The pattern was not uniform or consistent throughout the period for all U.S. producers (table VI‐2). Other factory costs also increased in dollar terms and on a per‐unit basis during the yearly periods; some of this is accounted for by the greater volume of sales and some is accounted for by start‐up problems of U.S. producers.4 Between the interim periods, other factory costs increased in dollar terms as well as a ratio to total sales and on a per‐unit basis.
4 *** ramp up costs in 2012 and both interim periods, for example. Questionnaire response of ***, section III‐9.

VI‐3
Total selling, general, and administrative (“SG&A”) expenses rose in dollars between the yearly periods and were greater in January‐March 2013 than in January‐March 2012. As a ratio to sales and on a per‐unit basis SG&A expenses declined between 2010 and 2012, but were higher in January‐March 2013 than in the same period one year earlier. Generally, the direction of change by firm tracked the industry total and ratio to net sales. There was large variability between firms that reflected, in part, the start up of operations.
Total operating income was positive in each period and the industry collectively recorded higher operating income in 2012 than in 2010, but that operating income was much lower in January‐March 2013 than in the same period one year earlier. Operating profit as a ratio to total sales decreased by 3.8 percentage points from 2010 to 2012 and was lower by 10.2 percentage points in January‐March 2013 than in January‐March 2012. Operating income also fell on a per‐unit basis from 2010 to 2012 and was much lower in interim 2013 than in interim 2012. The number of firms recording operating losses declined from 5 firms in 2010 to *** firms in 2012, but was higher in January‐March 2013 at 4 firms compared with *** firm in the same period one year earlier. The operating income of ***.
Net income before taxes and cash flow also were positive in each period. Both increased between 2010 and 2011 but decreased in 2012. An increase of interest charges and other expenses between 2010 and 2012 (interest was about $48.7 million higher and other expenses also increased by $15.9 million) were greater than the increase in other income (about $3.4 million) and led to the decrease in net income and cash flow compared with operating income. Net income before taxes and cash flow were positive but were much lower in January‐March 2013 than in the same period one year earlier. As in the yearly periods, both followed the change in operating income and incorporated an increase in other expenses.
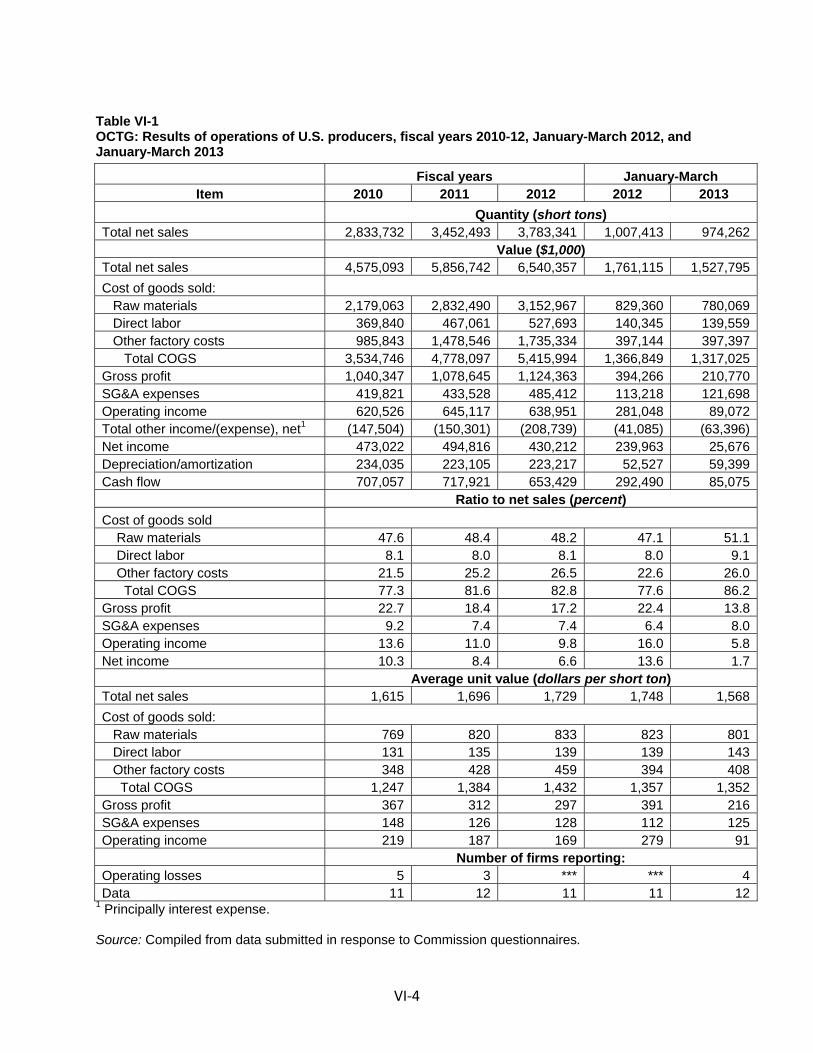
VI‐4
Table VI-1 OCTG: Results of operations of U.S. producers, fiscal years 2010-12, January-March 2012, and January-March 2013
Fiscal years January-March Item 2010 2011 2012 2012 2013
Quantity (short tons) Total net sales 2,833,732 3,452,493 3,783,341 1,007,413 974,262 Value ($1,000) Total net sales 4,575,093 5,856,742 6,540,357 1,761,115 1,527,795Cost of goods sold: Raw materials 2,179,063 2,832,490 3,152,967 829,360 780,069 Direct labor 369,840 467,061 527,693 140,345 139,559 Other factory costs 985,843 1,478,546 1,735,334 397,144 397,397 Total COGS 3,534,746 4,778,097 5,415,994 1,366,849 1,317,025Gross profit 1,040,347 1,078,645 1,124,363 394,266 210,770SG&A expenses 419,821 433,528 485,412 113,218 121,698Operating income 620,526 645,117 638,951 281,048 89,072Total other income/(expense), net1 (147,504) (150,301) (208,739) (41,085) (63,396)Net income 473,022 494,816 430,212 239,963 25,676Depreciation/amortization 234,035 223,105 223,217 52,527 59,399Cash flow 707,057 717,921 653,429 292,490 85,075 Ratio to net sales (percent) Cost of goods sold Raw materials 47.6 48.4 48.2 47.1 51.1 Direct labor 8.1 8.0 8.1 8.0 9.1 Other factory costs 21.5 25.2 26.5 22.6 26.0 Total COGS 77.3 81.6 82.8 77.6 86.2Gross profit 22.7 18.4 17.2 22.4 13.8SG&A expenses 9.2 7.4 7.4 6.4 8.0Operating income 13.6 11.0 9.8 16.0 5.8Net income 10.3 8.4 6.6 13.6 1.7 Average unit value (dollars per short ton) Total net sales 1,615 1,696 1,729 1,748 1,568 Cost of goods sold: Raw materials 769 820 833 823 801 Direct labor 131 135 139 139 143 Other factory costs 348 428 459 394 408 Total COGS 1,247 1,384 1,432 1,357 1,352 Gross profit 367 312 297 391 216 SG&A expenses 148 126 128 112 125 Operating income 219 187 169 279 91 Number of firms reporting: Operating losses 5 3 *** *** 4Data 11 12 11 11 12
1 Principally interest expense. Source: Compiled from data submitted in response to Commission questionnaires.

VI‐5
Two firms reported independent tolling operations. One of these was ***, which reported tolling data for 2012 only of ***, revenue of $*** but ***. ***. The other firm, ***, reported data during each of the periods for which data were collected. Together they reported tons tolled ranging from ***.5
Table VI-2 OCTG: Results of operations of U.S. producers, by firm, fiscal years 2010-12, January-March 2012, and January-March 2013
* * * * * * *
As depicted in tables VI‐1 and VI‐2, total COGS increased in dollar terms, as a ratio to total net sales, and on a per‐unit basis, driven by raw material and other factory costs. Raw material costs also are a substantial share of sales and on a per‐unit basis; raw material costs were the largest single component of COGS, and declined from 61.6 percent in 2010 to 58.2 percent in 2012, and was 59.2 percent in January‐March 2013 compared with 60.7 percent in the same period one year earlier. The steel industry often uses the term “metal spread,” defined as the difference in total dollars or in dollars per ton of product between the sales price and the cost of a firm’s raw material inputs, primarily hot‐rolled sheet or billet. An increasing metal spread indicates a widening between a firm’s sales value and its cost of raw materials, for example when a firm’s sales price is rising faster than is the cost of its raw materials, or that the raw materials’ costs are declining faster than a firm’s sales price, whereas a decreasing metal spread indicates the opposite. The metal spread widened during the full yearly periods ($2.4 million or $846 per short ton to $3.4 million or $895 per short ton) but narrowed between the interim periods ($931,000 or $925 per short ton to $747,000 or $767 per short ton). The term “metal margin” refers to the metal spread as a percentage of the product price, which is the ratio of the metal spread to total net sales. Like the metal spread, changes in the metal margin indicate similar aspects of changes in the underlying factors. The metal margin declined from 52.4 percent in 2010 to 51.8 percent in 2012, and was lower at 48.9 percent in January‐March 2013 compared to 52.9 percent in January‐March 2012.6
5 A third firm, ***, also reported data in section V of the Commission’s U.S. producers’ questionnaire, but the data were not usable and are not included here or in table C‐2.
6 Energy costs are variable costs and are typically classified in “other factory costs.” As variable costs, they vary with production, and rose with the increasing volume of sales between 2010 and 2012. Other factory costs also include charges such as *** as well as an increased allocated share of factory overhead costs as the share of production of OCTG rose relative to other pipe and tube products.

VI‐6
Variance analysis
The variance analysis showing the effects of prices and volume on U.S. producers’ net sales of OCTG, and of costs and volume on their total expenses, is presented in table VI‐3.7 The information for this variance analysis is derived from table VI‐1. The variance analysis provides an assessment of changes in profitability as related to changes in pricing, cost, and volume. The variance analysis for the reporting firms together indicates that the increase in operating income between 2010 and 2012 was mainly due to the combined effects of favorable price and volume variances on sales (sales volume increased and unit sales values increased) that were greater than the unfavorable net cost/expense variance (unit costs increased). Operating income was lower in January‐March 2013 than in January‐March 2012 due to the combined effects of unfavorable price, net cost/expense, and volume variances. The composition of net operating variance is summarized at the bottom of table VI‐3.
7 The Commission’s variance analysis is calculated in three parts: Sales variance, cost of sales variance (COGS variance), and SG&A expense variance. Each part consists of a price variance (in the case of the sales variance) or a cost or expense variance (in the case of the COGS and SG&A expense variance), and a volume variance. The sales or cost/expense variance is calculated as the change in unit price or per‐unit cost/expense times the new volume, while the volume variance is calculated as the change in volume times the old unit price or per‐unit cost/expense. Summarized at the bottom of the table, the price variance is from sales; the cost/expense variance is the sum of those items from COGS and SG&A variances, respectively, and the volume variance is the sum of the volume components of the net sales, COGS, and SG&A expense variances. The overall volume component of the variance analysis is generally small.
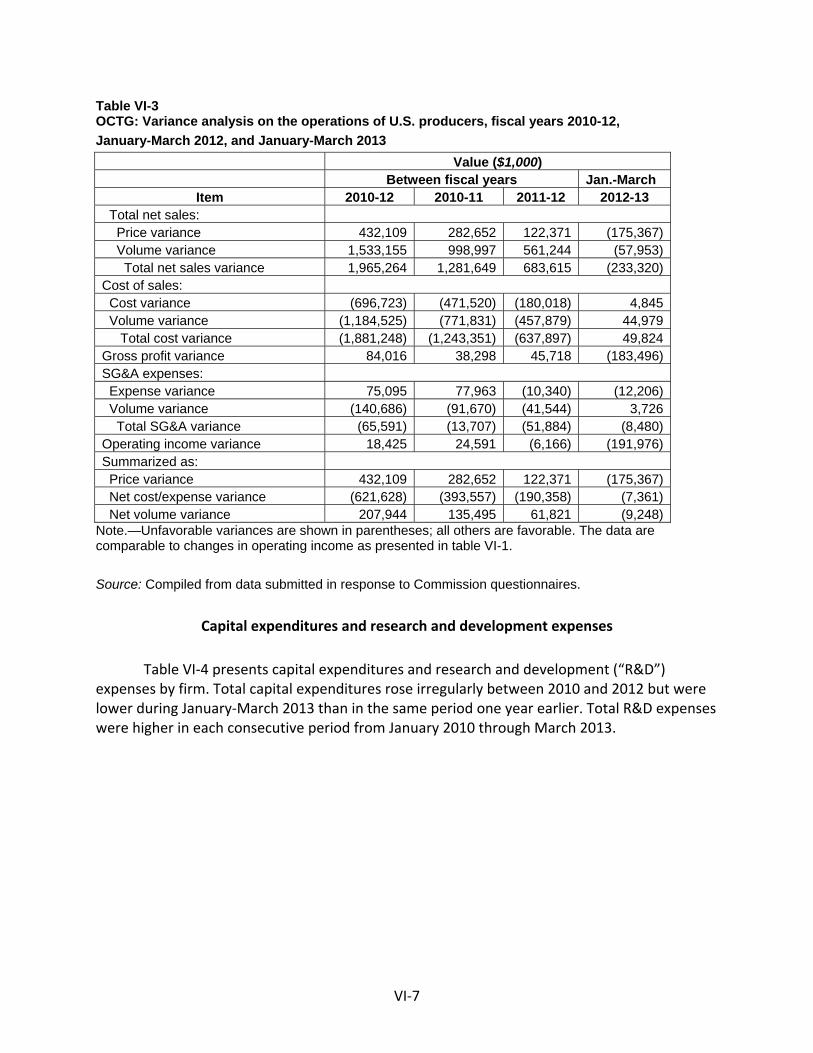
VI‐7
Table VI-3 OCTG: Variance analysis on the operations of U.S. producers, fiscal years 2010-12, January-March 2012, and January-March 2013 Value ($1,000) Between fiscal years Jan.-March
Item 2010-12 2010-11 2011-12 2012-13 Total net sales: Price variance 432,109 282,652 122,371 (175,367) Volume variance 1,533,155 998,997 561,244 (57,953) Total net sales variance 1,965,264 1,281,649 683,615 (233,320)Cost of sales: Cost variance (696,723) (471,520) (180,018) 4,845 Volume variance (1,184,525) (771,831) (457,879) 44,979 Total cost variance (1,881,248) (1,243,351) (637,897) 49,824 Gross profit variance 84,016 38,298 45,718 (183,496)SG&A expenses: Expense variance 75,095 77,963 (10,340) (12,206) Volume variance (140,686) (91,670) (41,544) 3,726 Total SG&A variance (65,591) (13,707) (51,884) (8,480)Operating income variance 18,425 24,591 (6,166) (191,976)Summarized as: Price variance 432,109 282,652 122,371 (175,367) Net cost/expense variance (621,628) (393,557) (190,358) (7,361) Net volume variance 207,944 135,495 61,821 (9,248)
Note.—Unfavorable variances are shown in parentheses; all others are favorable. The data are comparable to changes in operating income as presented in table VI-1. Source: Compiled from data submitted in response to Commission questionnaires.
Capital expenditures and research and development expenses
Table VI‐4 presents capital expenditures and research and development (“R&D”) expenses by firm. Total capital expenditures rose irregularly between 2010 and 2012 but were lower during January‐March 2013 than in the same period one year earlier. Total R&D expenses were higher in each consecutive period from January 2010 through March 2013.

VI‐8
Table VI-4 OCTG: Capital expenditures and research and development expenses of U.S. producers, fiscal years 2010-12, January-March 2012, and January-March 2013 Fiscal years January-March
Item 2010 2011 2012 2012 2013 Value ($1,000) Capital expenditures: Boomerang *** *** *** *** *** DPI *** *** *** *** *** EnergeX *** *** *** *** *** Evraz *** *** *** *** *** Laguna *** *** *** *** *** Maverick *** *** *** *** *** Northwest *** *** *** *** *** Paragon *** *** *** *** *** Tejas *** *** *** *** *** Texas Tubular *** *** *** *** *** TMK IPSCO *** *** *** *** *** U.S. Steel *** *** *** *** *** Vallourec Star *** *** *** *** *** Total 269,004 711,067 616,900 130,745 88,413 R&D expenses: Boomerang *** *** *** *** *** DPI *** *** *** *** *** EnergeX *** *** *** *** *** Evraz *** *** *** *** *** Laguna *** *** *** *** *** Maverick *** *** *** *** *** Northwest *** *** *** *** *** Paragon *** *** *** *** *** Tejas *** *** *** *** *** Texas Tubular *** *** *** *** *** TMK IPSCO *** *** *** *** *** U.S. Steel *** *** *** *** *** Vallourec Star *** *** *** *** *** Total 2,105 3,474 6,422 1,130 1,828
Source: Compiled from data submitted in response to Commission questionnaires.

VI‐9
Firms commented on their expansion efforts, including opening of plants, expansion of capacity, and other changes in their OCTG operations in their questionnaire responses.8 Their comments provide information regarding the capital expenditures programs of individual firms and are summarized below.
***.9
***.
***.
***.
***.10
***.11 ***.12
***.
Assets and return on investment
Table VI‐5 presents data on the U.S. producers’ total assets and their return on investment (“ROI”). Operating income was divided by total net assets resulting in ROI. Total net assets increased by about 25 percent from 2010 to 2012. Because the increase in dollars of investment was greater than that of operating income, the ratio declined.
8 See also table III‐2, presented earlier in this report. 9 ***. 10 ***. 11 ***. Additionally, ***. 12 Ibid.

VI‐10
Table VI-5 OCTG: U.S. producers’ total assets and return on investment, fiscal years 2010-12
Item 2010 2011 2012 Total assets: Value ($1,000) Boomerang *** *** *** DPI *** *** *** EnergeX *** *** *** Evraz *** *** *** Laguna *** *** *** Maverick *** *** *** Northwest *** *** *** Paragon *** *** *** Tejas *** *** *** Texas Tubular *** *** *** TMK IPSCO *** *** *** U.S. Steel *** *** *** Vallourec Star *** *** *** Total 6,040,769 6,818,551 7,530,863
ROI: Ratio of operating income to total assets (percent) Boomerang *** *** *** DPI (1) (1) (1) EnergeX *** *** *** Evraz *** *** *** Laguna *** *** *** Maverick *** *** *** Northwest *** *** *** Paragon *** *** *** Tejas *** *** *** Texas Tubular (1) *** (1) TMK IPSCO *** *** *** U.S. Steel *** *** *** Vallourec Star *** *** *** Average 10.3 9.5 8.5
1 Not applicable or not meaningful. Source: Compiled from data submitted in response to Commission questionnaires.
Capital and investment
The Commission requested U.S. producers of OCTG to describe any actual or potential negative effects of imports of OCTG from India, Korea, Philippines, Saudi Arabia, Taiwan, Thailand, Turkey, Ukraine, and Vietnam on their firms’ growth, investment, ability to raise capital, development and production efforts, or the scale of capital investments. Their responses are shown on the following pages.

VI‐11
Actual negative effects13
Boomerang: ***. DPI: ***. EnergeX: ***. Evraz: ***. Laguna: ***. Maverick: ***. ***. Northwest: ***. Paragon: ***. Tejas: ***. Texas Tubular: ***. TMK IPSCO: ***. U.S. Steel: ***.
***. ***. Vallourec Star: ***.
13 When asked whether the firm’s response differed by country, ***.
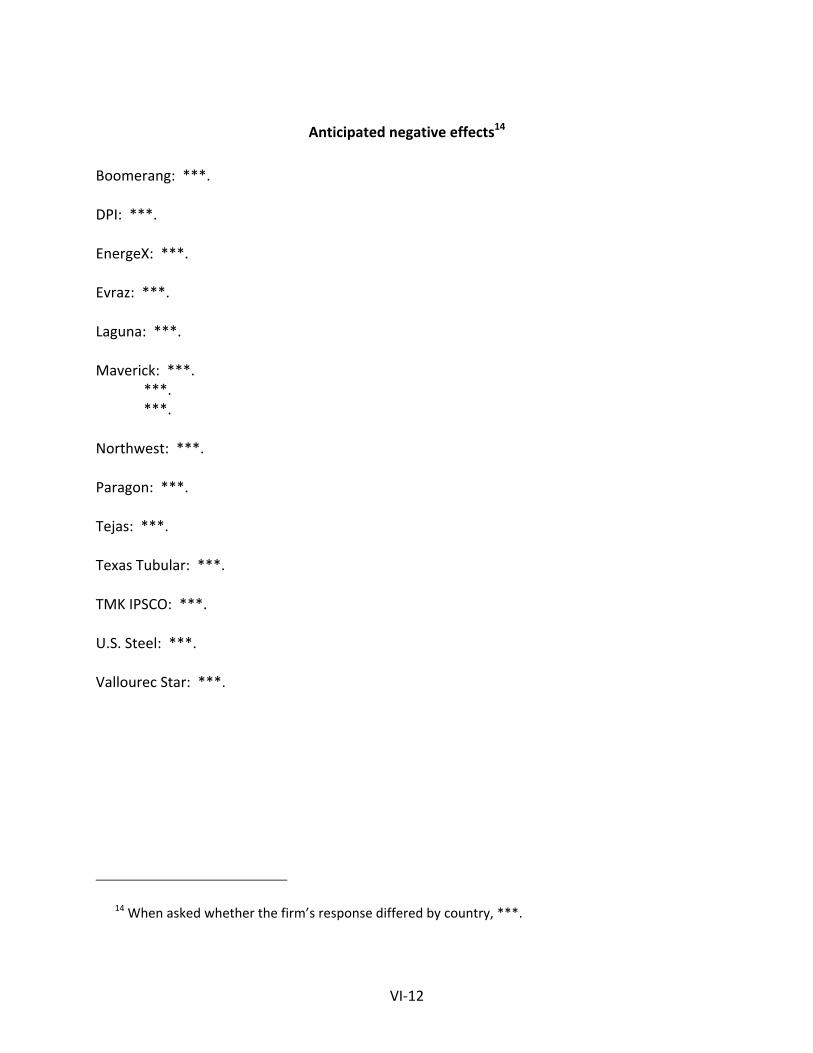
VI‐12
Anticipated negative effects14
Boomerang: ***. DPI: ***. EnergeX: ***. Evraz: ***. Laguna: ***. Maverick: ***. ***. ***. Northwest: ***. Paragon: ***. Tejas: ***. Texas Tubular: ***. TMK IPSCO: ***. U.S. Steel: ***. Vallourec Star: ***.
14 When asked whether the firm’s response differed by country, ***.

VII‐1
PART VII: THREAT CONSIDERATIONS AND INFORMATION ON NONSUBJECT COUNTRIES
Section 771(7)(F)(i) of the Act (19 U.S.C. § 1677(7)(F)(i)) provides that—
In determining whether an industry in the United States is threatened with material injury by reason of imports (or sales for importation) of the subject merchandise, the Commission shall consider, among other relevant economic factors1‐‐ (I) if a countervailable subsidy is involved, such information as may be
presented to it by the administering authority as to the nature of the subsidy (particularly as to whether the countervailable subsidy is a subsidy described in Article 3 or 6.1 of the Subsidies Agreement), and whether imports of the subject merchandise are likely to increase,
(II) any existing unused production capacity or imminent, substantial increase in production capacity in the exporting country indicating the likelihood of substantially increased imports of the subject merchandise into the United States, taking into account the availability of other export markets to absorb any additional exports,
(III) a significant rate of increase of the volume or market penetration of imports of the subject merchandise indicating the likelihood of substantially increased imports,
(IV) whether imports of the subject merchandise are entering at prices that are likely to have a significant depressing or suppressing effect on domestic prices, and are likely to increase demand for further imports,
(V) inventories of the subject merchandise,
1 Section 771(7)(F)(ii) of the Act (19 U.S.C. § 1677(7)(F)(ii)) provides that “The Commission shall consider {these factors} . . . as a whole in making a determination of whether further dumped or subsidized imports are imminent and whether material injury by reason of imports would occur unless an order is issued or a suspension agreement is accepted under this title. The presence or absence of any factor which the Commission is required to consider . . . shall not necessarily give decisive guidance with respect to the determination. Such a determination may not be made on the basis of mere conjecture or supposition.”

VII‐2
(VI) the potential for product‐shifting if production facilities in the foreign country, which can be used to produce the subject merchandise, are currently being used to produce other products,
(VII) in any investigation under this title which involves imports of both a raw agricultural product (within the meaning of paragraph (4)(E)(iv)) and any product processed from such raw agricultural product, the likelihood that there will be increased imports, by reason of product shifting, if there is an affirmative determination by the Commission under section 705(b)(1) or 735(b)(1) with respect to either the raw agricultural product or the processed agricultural product (but not both),
(VIII) the actual and potential negative effects on the existing development and production efforts of the domestic industry, including efforts to develop a derivative or more advanced version of the domestic like product, and
(IX) any other demonstrable adverse trends that indicate the probability that there is likely to be material injury by reason of imports (or sale for importation) of the subject merchandise (whether or not it is actually being imported at the time).2
Information on the nature of the alleged subsidies was presented earlier in this report; information on the volume and pricing of imports of the subject merchandise is presented in Parts IV and V; and information on the effects of imports of the subject merchandise on U.S. producers’ existing development and production efforts is presented in Part VI. Information on inventories of the subject merchandise; foreign producers’ operations, including the potential for “product‐shifting;” any other threat indicators, if applicable; and any dumping in third‐country markets, follows. Also presented in this section of the report is information obtained for consideration by the Commission on nonsubject countries.
2 Section 771(7)(F)(iii) of the Act (19 U.S.C. § 1677(7)(F)(iii)) further provides that, in antidumping investigations, “. . . the Commission shall consider whether dumping in the markets of foreign countries (as evidenced by dumping findings or antidumping remedies in other WTO member markets against the same class or kind of merchandise manufactured or exported by the same party as under investigation) suggests a threat of material injury to the domestic industry.”

VII‐3
THE INDUSTRY IN INDIA
The petition in these investigations identified 49 producers and/or exporters of OCTG in India.3 The Commission issued foreign producers questionnaires to these firms and received a completed response from nine producers and one exporter: GVN Fuels Limited (“GVN Fuels”) ***, ISMT, Jindal (India), Jindal Pipes, Jindal Saw Ltd. (“Jindal Saw”), M/S United Seamless Tubulaar (“United Seamless”), Maharashtra Seamless Limited (“Maharashtra”), Oil Country Tubular Ltd. (“Oil Country Tubular”), Surya Global Steel Tube Limited (“Surya”), and Welspun Corp. Lt. (“Welspun”). GVN Fuels reported that *** percent of its total sales in the most recent fiscal year were sales of OCTG. ISMT reported that *** percent of its total sales in the most recent fiscal year were sales of OCTG. Jindal (India) reported that *** percent of its total sales in the most recent fiscal year were sales of OCTG. Jindal Pipes reported that *** percent of its total sales in the most recent fiscal year were sales of OCTG reported Jindal Saw reported that *** percent of its total sales in the most recent fiscal year were sales of OCTG. United Seamless reported that *** percent of its total sales in the most recent fiscal year were sales of OCTG. Maharashtra reported that *** percent of its total sales in the most recent fiscal year were sales of OCTG. Oil Country Tubular reported that *** percent of its total sales in the most recent fiscal year were sales of OCTG. Surya reported that *** percent of its total sales in the most recent fiscal year were sales of OCTG. Welspun reported that *** percent of its total sales in the most recent fiscal year were sales of OCTG.
Jindal (India) estimated that its OCTG exports to the United States accounted for approximately *** percent of all such exports of OCTG from India in 2012, while Jindal Saw estimated that it exports to the United States accounted for approximately *** percent, United Seamless estimated that it exports to the United States accounted for approximately *** percent, Oil Country Tubular estimated that it exports to the United States accounted for approximately *** percent, and Welspun estimated that its exports to the United States accounted for *** percent.4 A comparison of the ten firms’ export data to adjusted official Commerce import statistics shows that in 2012 they accounted for virtually all U.S. imports of OCTG from India.5
***.6 Several firms reported experiencing plant expansions and investments in equipment, machinery, and capacity. *** and ***. 7 Two firms reported investments for the
3 Petition, exh. I‐5A. 4 Questionnaire responses of Jindal (India), Jindal Saw, United Seamless, and Welspun, II‐8. 5 Three Indian producers, ***, provided estimates of their shares of India’s total production of OCTG,
cumulatively accounting for approximately *** percent of production in 2012. Indian respondents claim that India has approximately *** tons of OCTG production capacity. Indian Respondents’ postconference brief at 18.
6 ***. Questionnaire response of ***, II‐2a. 7 Questionnaire responses of ***, II‐2a. ***. Questionnaire response of ***, II‐2b.

VII‐4
purpose of improving the quality of their products. *** and ***.8 Production curtailments were reported by one firm, ***, which reflected ***.9
Operations on OCTG
Table VII‐1 presents information on the OCTG operations of the nine responding producers and one exporter in India. Reported capacity in India increased by 38.9 percent from 2010 to 2012 and was about the same in January‐March 2013 relative to January‐March 2012. Reported capacity is projected to increase by 4.0 percent from 2012 to 2013 and to be 10.5 percent higher in 2014 than in 2012. Reported production in India increased by 83.4 percent from 2010 to 2012 but was 44.7 percent lower in January‐March 2013 than in January‐March 2012. Production is projected to be 1.0 percent lower in 2013 than in 2012 and 18.7 percent higher in 2014 than 2012. Capacity utilization increased from 37.6 percent in 2010 to 49.6 percent in 2012, and was 34.2 percent in January‐March 2013 compared to 61.7 percent in January‐March 2012.10
In 2012, 45.6 percent of total shipments of OCTG from India were exported to the United States, and 6.0 percent were exported to other markets. Exports of OCTG from India to the United States increased by 43.6 percent from 2010 to 2012 but were 40.5 percent lower in January‐March 2013 than in January‐March 2012.
8 Questionnaire responses of ***, II‐2a. 9 Questionnaire responses of ***, II‐2a. 10 With respect to production constraints, ISMT reported ***, Jindal (India) reported ***, Jindal Pipes
reported ***, Jindal Saw reported ***, Maharashtra reported ***, Oil Country Tubular reported ***, Surya reported ***, United Seamless reported ***, and Welspun reported ***. Questionnaire responses of Indian producers, II‐4d.

VII‐5
Table VII-1 OCTG: Data for producers and exporter in India, 2010-12, January-March 2012, January-March 2013, and projected 2013-14 Actual experience Projections Calendar year January-March Calendar year
Item 2010 2011 2012 2012 2013 2013 2014 Quantity (short tons) Capacity 555,217 748,850 771,354 194,455 194,376 802,406 852,406Production 208,734 367,749 382,883 120,074 66,440 378,904 454,420End-of-period inventories 18,666 18,706 21,541 23,394 21,666 16,005 12,915Shipments: Internal consumption/ transfers 289 868 2,525 471 194 2,010 1,724 Home market 56,401 161,324 179,121 46,155 27,909 197,451 247,302 Exports to: United States 119,250 174,469 171,257 60,732 36,136 164,851 170,863 All other markets 21,748 29,729 22,357 7,156 1,874 41,916 66,916 Total exports 140,998 204,198 193,614 67,888 38,010 206,767 237,779 Total shipments 197,688 366,390 375,260 114,514 66,113 406,228 486,805 Ratios and shares (percent) Capacity utilization 37.6 49.1 49.6 61.7 34.2 47.2 53.3Inventories/production 8.9 5.1 5.6 4.9 8.2 4.2 2.8Inventories/shipments 9.4 5.1 5.7 5.1 8.2 3.9 2.7Share of total shipments: Internal consumption/ transfers 0.1 0.2 0.7 0.4 0.3 0.5 0.4 Home market 28.5 44.0 47.7 40.3 42.2 48.6 50.8 Exports to: United States 60.3 47.6 45.6 53.0 54.7 40.6 35.1 All other markets 11.0 8.1 6.0 6.2 2.8 10.3 13.7 Total exports 71.3 55.7 51.6 59.3 57.5 50.9 48.8 Source: Compiled from data submitted in response to Commission questionnaires.
Alternative products
Table VII‐2 presents information on the total welded and total seamless tubular capacity and production of the nine responding producers in India.11
11 With respect to constraints on product shifting, ISMT reported ***, Jindal (India) reported ***, Jindal Pipes reported ***, Jindal Saw reported ***, Maharashtra reported ***, Oil Country Tubular reported ***, Surya reported ***, United Seamless reported ***, and Welspun reported ***. Questionnaire responses of Indian producers, II‐4e.
VII‐6
Table VII-2 OCTG: Indian capacity, production, and capacity utilization of welded and seamless tubular products, 2010-12, January-March 2012, and January-March 2013
* * * * * * *
THE INDUSTRY IN KOREA
The petition in these investigations identified 10 producers and/or exporters of OCTG in Korea.12 The Commission issued foreign producers questionnaires to these firms and received a completed response from seven firms: AJU Besteel Co., Ltd. (“AJU”), Daewoo International Corp. (“Daewoo”) (***), Husteel, Hyundai HYSCO, ILJIN Steel Corp. (“ILJIN”), Nexteel Co., Ltd. (Nexteel), and SeAH Steel Corp. (“SeAH”). AJU reported that *** percent of its total sales in the most recent fiscal year were sales of OCTG. Daewoo reported that *** percent of its total sales in the most recent fiscal year were sales of OCTG. Husteel reported that *** percent of its total sales in the most recent fiscal year were sales of OCTG. Hyundai HYSCO reported that *** percent of its total sales in the most recent fiscal year were sales of OCTG. ILJIN reported that *** percent of its total sales in the most recent fiscal year were sales of OCTG. Nexteel reported that *** percent of its total sales in the most recent fiscal year were sales of OCTG. SeAH reported that *** percent of its total sales in the most recent fiscal year were sales of OCTG.
The seven responding firms’ exports to the United States accounted for virtually all U.S. imports of OCTG from Korea over the period for which data were collected. According to estimates provided by the responding Korean producers, the production of OCTG in Korea reported by the responding producers accounts for virtually all production of OCTG in Korea.
One Korean firm, ILJIN, reported a plant opening. ILJIN, the sole producer of seamless OCTG in Korea, established its production facility in ***.13 Several other firms invested in their OCTG operations and experienced expansions. ***, ***.
Operations on OCTG
Table VII‐3 presents information on the OCTG operations of the six responding producers and exporters in Korea. Capacity in Korea increased by 21.1 percent from 2010 to 2012 and was 4.1 percent higher in January‐March 2013 than in January‐March 2012. Capacity is projected to increase by 1.7 percent from 2012 to 2013 and not to change from 2013 to 2014. Production in Korea increased by 50.3 percent from 2010 to 2012 and was 2.4 percent higher in January‐March 2013 than in January‐March 2012. Production is projected to increase by 3.7 percent from 2012 to 2013 and to be 4.0 percent higher in 2014 than in 2012. Capacity
12 Petition, exh. I‐5D. 13 Questionnaire responses of ***, II‐2a. ***. Questionnaire response of ***, II‐2b.

VII‐7
utilization increased from 62.0 percent in 2010 to 77.0 percent in 2012, and was 74.9 percent in January‐March 2013 compared to 76.2 percent in January‐March 2012.14
In 2012, 96.9 percent of total shipments of OCTG from Korea were exported to the United States, and 1.4 percent were exported to other markets. Exports of OCTG from Korea to the United States increased by 45.9 percent from 2010 to 2012, and were 7.0 percent higher in January‐March 2013 than in January‐March 2012.
Table VII-3 OCTG: Data for producers in Korea, 2010-12, January-March 2012, January-March 2013, and projected 2013-14 Actual experience Projections Calendar year January-March Calendar year
Item 2010 2011 2012 2012 2013 2013 2014 Quantity (short tons) Capacity 955,761 1,089,878 1,157,437 282,722 294,273 1,177,090 1,177,090Production 592,826 726,984 891,147 215,428 220,501 923,844 926,844End-of-period inventories 21,967 19,399 42,798 25,426 40,870 53,187 58,587Shipments: Internal consumption/ transfers 2,314 2,678 5,725 4,933 4,241 4,381 4,381 Home market 4,508 5,282 8,379 5,414 4,073 7,861 7,861 Exports to: United States 576,732 703,194 841,256 196,327 210,026 870,801 866,301 All other markets 5,054 18,885 12,385 2,652 4,063 19,466 29,466 Total exports 581,786 722,079 853,641 198,979 214,089 890,267 895,767 Total shipments 588,608 730,039 867,745 209,326 222,403 902,509 908,009 Ratios and shares (percent) Capacity utilization 62.0 66.7 77.0 76.2 74.9 78.5 78.7Inventories/production 3.7 2.7 4.8 3.0 4.6 5.8 6.3Inventories/shipments 3.7 2.7 4.9 3.0 4.6 5.9 6.5Share of total shipments: Internal consumption/ transfers 0.4 0.4 0.7 2.4 1.9 0.5 0.5 Home market 0.8 0.7 1.0 2.6 1.8 0.9 0.9 Exports to: United States 98.0 96.3 96.9 93.8 94.4 96.5 95.4 All other markets 0.9 2.6 1.4 1.3 1.8 2.2 3.2 Total exports 98.8 98.9 98.4 95.1 96.3 98.6 98.7 Source: Compiled from data submitted in response to Commission questionnaires.
14 With respect to production constraints, AJU reported ***, Husteel reported ***, Hyundai HYSCO reported ***, ILJIN reported ***, Nexteel reported ***, and SeAH reported ***. Questionnaire responses of Korean producers, II‐4d.

VII‐8
Alternative products
Table VII‐4 presents information on the total welded and total seamless tubular capacity and production of the responding producers and exporters in Korea.15 16
Table VII-4 Tubular products: Korean capacity, production, and capacity utilization of welded and seamless tubular products, 2010-12, January-March 2012, and January-March 2013
* * * * * * *
THE INDUSTRY IN THE PHILIPPINES
The petition in these investigations identified one producer and/or exporter of OCTG, HLD Clark Steel Pipe Co., Inc. (“HLD Clark”).17 The Commission issued a foreign producer questionnaire to HLD Clark and received a completed response. HLD Clark reported that *** percent of its total sales in the most recent fiscal year were sales of OCTG.18
HLD Clark estimated that its OCTG exports to the United States accounted for approximately *** percent of U.S imports of OCTG from the Philippines in 2012.19 A comparison of HLD Clark’s export data to official Commerce import statistics shows that in 2012 it accounted for *** U.S. imports from the Philippines. HLD Clark estimates that it accounts for all production of OCTG in the Philippines.20
HLD Clark was established in 2009.21 This firm is a welded pipe manufacturing subsidiary of Huludao City Steel Pipe Industrial, a Chinese firm.22 HLD Clark added *** and began to produce OCTG in 2011.23 HLD Clark ***.24
15 With respect to constraints on product shifting, AJU reported ***, Husteel reported ***, Hyundai HYSCO ***, ILJIN reported ***, Nexteel ***, and SeAH reported ***. Questionnaire responses of Korean producers, II‐4e.
16 *** noted that the apparent increase in its capacity in January‐June 2013 compared to January‐June 2012 ***. Questionnaire response of ***, II‐2b.
17 Petition, exh. I‐5B. 18 Questionnaire response of HLD Clark, II‐6 19 Questionnaire response of HLD Clark, II‐8 20 Ibid., II‐7 21 HLD Clark Steel Pipe Co., Inc., “About Us,” http://www.hldphpipe.com/Item/list.asp?id=1, accessed
on July 18, 2013. 22 Petition, exh I‐8 23 Questionnaire response of HLD Clark Steel Pipe Co., Inc., II‐2 24 Ibid., II‐4
VII‐9
Operations on OCTG
Table VII‐5 presents information on the OCTG operations of the sole producer and exporter in the Philippines. Capacity in the Philippines increased from none in 2010 to *** short tons in 2011. Capacity increased by *** percent from 2011 to 2012, but was *** percent lower in January‐March 2013 relative to January‐March 2012. Capacity is projected to decrease by *** percent from 2012 to 2013 and to *** from 2013 to 2014. Production in the Philippines increased by *** percent from 2011 to 2012, and was *** percent higher in January‐March 2013 than in January‐March 2012. Production is projected to *** from 2013 to 2014. Capacity utilization increased from *** percent in 2011 to *** percent in 2012, and was *** percent in January‐March 2013 compared to *** percent in January‐March 2012. 25
In 2012, *** percent of total shipments of OCTG from the Philippines were exported to the United States, and *** percent were exported to other markets, predominantly ***.26 Exports of OCTG from the Philippines to the United States increased by *** percent from 2011 to 2012, and were *** percent higher in January‐March 2013 than in January‐March 2012.
Table VII-5 OCTG: Data for the producer in the Philippines, 2010-12, January-March 2012, January-March 2013, and projected 2013-14
* * * * * * *
Alternative products
Table VII‐6 presents information on the total welded tubing capacity and production of HLD Clark the sole producer and exporter in the Philippines. HLD Clark reported that it produces *** on the same equipment used to produce OCTG.27 28
Table VII-6 Tubular products: Filipino capacity, production, and capacity utilization of welded and seamless tubular products, 2010-12, January-March 2012, and January-March 2013
* * * * * * *
25 With respect to production constraints, HLD Clark identified ***. Questionnaire response of HLD Clark, II‐4d.
26 Ibid., II‐5. 27 Ibid., II‐4. 28 With respect to constraints on product shifting, HLD Clark reported ***. Questionnaire response of
HLD Clark, II‐4e.

VII‐10
THE INDUSTRY IN SAUDI ARABIA
The petition in these investigations identified 13 producers and/or exporters of OCTG in Saudi Arabia. 29 The Commission issued foreign producers questionnaires to these firms and received a completed response from two firms, Jubail Energy Services Company (“JESCO”) and Saudi Steel Pipe Company (“SSP”). JESCO reported that *** percent of its total sales in the most recent fiscal year were sales of OCTG.30 SSP reported that *** percent of its total sales in the most recent fiscal year were sales of OCTG.31
JESCO estimated that its OCTG exports to the United States accounted for *** percent of all such exports of OCTG from Saudi Arabia (***).32 A comparison of *** export data to adjusted official Commerce statistics shows that in 2012 *** percent of imports from Saudi Arabia. According to estimates requested of the responding Saudi Arabian producers, the production of OCTG in Saudi Arabia reported by the responding producers accounts for approximately *** percent of overall production of OCTG in Saudi Arabia.
SSP, a producer of welded OCTG, reported that it ***. SSP reported that its investment to produce ERW *** OCTG was in order to supply ***.33 JESCO, a producer of seamless OCTG, reported that its mill ***. 34 JESCO noted that its capacity increases are not the result of new investments, but reflect the start‐up process of the mill as it slowly increased capacity and production.35
Operations on OCTG
Table VII‐7 presents information on the OCTG operations of the responding producers in Saudi Arabia. Reported capacity in Saudi Arabia increased by *** percent from 2010 to 2012 and was *** percent higher in January‐March 2013 than in January‐March 2012. Capacity is projected to be *** percent higher in 2013 compared to 2012 and *** percent higher in 2014 compared to 2012. Reported production in Saudi Arabia increased by *** percent from 2010 to 2012 and was *** percent higher in January‐March 2013 than in January‐March 2012. Production is projected to be *** percent higher in 2013 compared to 2012 and *** percent higher in 2014 compared to 2012. Capacity utilization fluctuated through the period for which data were provided, reflecting the increases in capacity and ramping up of production by JESCO. 36
29 Petition, exh. I‐5C. 30 Questionnaire response of JESCO, II‐6. 31 Questionnaire response of SSP, II‐6. 32 Questionnaire response of JESCO, II‐8. 33 Questionnaire response of SSP, II‐2a and II‐2b. 34 Questionnaire response of JESCO, II‐2a. 35 Questionnaire response of JESCO, II‐2b. JESCO also reported that it took *** months to fully
commission and accept the installed equipment. Questionnaire response of JESCO, II‐2a. 36 With respect to production constraints, JESCO reported ***, while SSP reported ***.
Questionnaire responses of Saudi Arabian producers, II‐4d.

VII‐11
In 2012, *** percent of total shipments of OCTG from Saudi Arabia were exported to the United States, and *** percent were exported to other markets, predominantly in ***. Exports of OCTG from Saudi Arabia to the United States increased by *** percent from 2010 to 2012, but were *** percent lower in January‐March 2013 than in January‐March 2012.
Table VII-7 OCTG: Data for producers in Saudi Arabia, 2010-12, January-March 2012, January-March 2013, and projected 2013-14
* * * * * * *
Alternative products
Table VII‐8 presents information on the total welded and seamless tubular capacity and production of the two responding producers in Saudi Arabia. SSP reported *** on the same equipment and machinery used to produce welded OCTG.37 JESCO reported *** on the same equipment and machinery used to produce OCTG.38 39
Table VII-8 Tubular products: Saudi capacity, production, and capacity utilization of welded and seamless tubular products, 2010-12, January-March 2012, and January-March 2013
* * * * * * *
THE INDUSTRY IN TAIWAN
The petition in these investigations identified five producers and/or exporters of OCTG in Taiwan. 40 The Commission issued foreign producer questionnaires to these firms and received a completed response from four firms: Chung Hung Steel Corp. (“Chung Hung”), Far East Machinery Co. Ltd. (“Far East Machinery”), Kao Hsing Change Iron & Steel Corp. (“Kao Hsing”), and Tension Steel Industries Co., Ltd. (“Tension Steel”). Chung Hung reported that *** percent of its total sales in the most recent fiscal year were sales of OCTG.41 Far East Machinery reported that *** percent of its total sales in the most recent fiscal year were sales of OCTG.42 Kao Hsing reported that *** percent of its total sales in the most recent fiscal year were sales of
37 Questionnaire response of SSP, II‐4a. 38 Questionnaire response of JESCO, II‐4a. 39 With respect to product shifting, JESCO reported ***. Questionnaire response of JESCO, II‐4e.
JESCO also reported that ***. Questionnaire response of JESCO, II‐5a. 40 Petition, exh. I‐5E. 41 Questionnaire response of Chung Hung, II‐6. 42 Questionnaire response of Far East Machinery, II‐6.
VII‐12
OCTG.43 Tension Steel reported that *** percent of its total sales in the most recent fiscal year were sales of OCTG.44
Chung Hung estimated that its OCTG exports to the United States accounted for approximately *** percent of all such exports of OCTG from Taiwan in 2012, Far East Machinery estimated that its exports to the United States accounted for approximately *** percent, Kao Hsing estimated that its exports to the United States accounted for approximately *** percent, and Tension Steel estimated that its exports to the United States accounted for approximately *** percent. A comparison of these firms’ export data to official Commerce import statistics shows that in 2012 they accounted for virtually all of U.S. imports of OCTG from Taiwan. According to estimates requested of the responding Taiwan producers, the production of OCTG in Taiwan reported by the responding producers accounts for approximately *** percent of overall production of OCTG in Taiwan.
One Taiwan firm, Chung Hung, reported investing in a new plant. The current plant ***. The new plant is slated to begin trial productions ***. Chung Hung reportedly plans ***. Chung Hung reported that the new mill ***.45
Operations on OCTG
Table VII‐9 presents information on the OCTG operations of the four responding producers and exporters in Taiwan. Reported capacity in Taiwan *** during 2010‐12. Capacity is projected to decline by *** percent in 2013 compared to 2012 and to decline an additional *** percent in 2014. Reported production in Taiwan increased by *** percent from 2010 to 2012, but was *** percent less in January‐March 2013 than in January‐March 2012. Production is expected to be *** percent lower in 2013 than in 2012 and *** percent lower in 2014 than in 2012. Capacity utilization increased from *** percent in 2010 to *** percent in 2012, and was *** percent in January‐March 2013 compared to *** percent in January‐March 2012.46
In 2012, *** percent of total shipments of OCTG from Taiwan were to the United States and *** percent were exported to other markets, predominantly ***. Exports of OCTG from Taiwan to the United States increased by *** percent from 2010 to 2012 but were *** percent lower in January‐March 2013 than in January‐March 2012.
Table VII-9 OCTG: Data for producers in Taiwan, 2010-12, January-March 2012, January-March 2013, and projected 2013-14
* * * * * * *
43 Questionnaire response of Kao Hsing, II‐6. 44 Questionnaire response of Tension Steel, II‐6. 45 Questionnaire response of Chung Hung, II‐2a. 46 With respect to production constraints, Chung Hung identified ***, Far East Machinery identified
***, Kao Hsing identified ***, and Tension Steel identified ***. Questionnaire responses of Taiwan producers, II‐4d.

VII‐13
Alternative products
Table VII‐10 presents information on the total welded tubular capacity and production of the four responding producers in Taiwan.47
Table VII-10 Tubular products: Taiwan capacity, production, and capacity utilization of welded and seamless tubular products, 2010-12, January-March 2012, and January-March 2013
* * * * * * *
THE INDUSTRY IN THAILAND
The petition in these investigations identified three producers and/or exporters of OCTG.48 The Commission issued foreign producer questionnaires to these firms and received a completed response from one firm, WSP Pipe Co., Ltd (“WSP”). WSP reported that *** percent of its total sales in the most recent fiscal year were sales of OCTG.49 WSP estimated that its exports to the United States accounted for approximately *** percent of U.S imports of OCTG from Thailand in 2012.50 A comparison of WSP export data to official Commerce import statistics shows that in 2012 WSP accounted for *** U.S. imports from Thailand. According to estimates requested of the responding Thai producer, the production of OCTG in Thailand reported in this part of the report accounts for approximately *** percent of overall production of OCTG in Thailand.51
WSP was established in 2010 and is the branch enterprise of WSP Holdings Limited.52 WSP Holdings Limited is a Chinese firm.53 WSP opened its first plant in 2011, beginning with a single production line in April and expanding to two production lines in August.54 WSP Pipe reported investing ***.55 WSP only produces seamless OCTG.56
47 With respect to product shifting, Chung Hung reported ***, Far East Machinery identified ***, Kao Hsing identified ***, and Tension Steel identified ***. Questionnaire responses of Taiwan producers, II‐4e.
48 Petition, exh. I‐5F. 49 Ibid., II‐6. 50 Questionnaire response of WSP Pipe Co., Ltd., II‐8. 51 Ibid., II‐7. 52 WSP Pipe Co., Ltd., “Company Introduction,” http://wspp.co.th/index.php/about‐us, accessed on
July 19, 2013. 53 WSP Holdings Limited, “Contact Us,” http://www.wsphl.com/elxwm.asp, accessed on July 19,
2013. 54 Questionnaire response of WSP Pipe Co., Ltd., II‐2. 55 Ibid. 56 Ibid., II‐4.
VII‐14
Operations on OCTG
Table VII‐11 presents information on the OCTG operations of the responding producer and exporter in Thailand. Reported capacity in Thailand increased by *** percent from 2011 to 2012, and was *** from January‐March 2012 relative to January‐March 2013.57 Reported capacity is projected ***. Reported production in Thailand increased by *** percent from 2011 to 2012, and was *** higher in January‐March 2013 than in January‐March 2012. Capacity utilization increased from *** percent in 2011 to *** percent in 2012, and was *** percent in January‐March 2013 compared to *** percent in January‐March 2012.58
In 2012, *** percent of total shipments of OCTG from Thailand were exported to the United States, and *** percent were exported to other markets, predominantly ***. Exports of OCTG from Thailand to the United States increased by *** percent from 2011 to 2012, and were *** percent higher in January‐March 2013 than in January‐March 2012.
Table VII-11 OCTG: Data for producers in Thailand, 2010-12, January-March 2012, January-March 2013, and projected 2013-14
* * * * * * *
Alternative products
Table VII‐12 presents information on the total seamless tubular capacity and production of the responding producer and exporter in Thailand. WSP reported that it produces *** on the same equipment used to produce OCTG.59 *** accounts for about *** percent of WSP’s reported production capacity.60
Table VII-12 Tubular products: Thai capacity, production, and capacity utilization of welded and seamless tubular products, 2010-12, January-March 2012, and January-March 2013
* * * * * * *
THE INDUSTRY IN TURKEY
The petition in these investigations identified five producers and/or exporters of OCTG in Turkey. 61 The Commission issued foreign producers questionnaires to these firms and
57 The production capacity reported by WSP Pipe is based on operating *** hours per week, *** weeks per year.
58 With respect to production constraints, WSP reported ***. Questionnaire response of WSP, II‐4e. 59 Ibid., II‐4 60 Ibid. 61 Petition, exh. I‐5G.

VII‐15
received a completed response from three firms, Borusan Mannesmann Boru Sanayi Ve Ticaret Tas (“Borusan”), Çayirova Boru Sanayi Ve Ticaret A.Ş (“Çayirova”), and Toscelik Profil Ve Sac Endustrisi A.S (“Toscelik”). Borusan reported that *** percent of its total sales in the most recent fiscal year were sales of OCTG.62 Çayirova reported that *** percent of its total sales in the most recent fiscal year were sales of OCTG.63 Toscelik reported that *** percent of its total sales in the most recent fiscal year were sales of OCTG.64
Borusan estimated that its OCTG exports to the United States accounted for approximately *** percent of all such exports of OCTG from Turkey in 2012, while Çayirova estimated that its exports to the United States accounted for approximately *** percent, and Toscelik estimated that its exports to the United States accounted for approximately *** percent. A comparison of these firms’ exports data to official Commerce import statistics shows that in 2012 they accounted for *** percent of all U.S. imports from Turkey. According to estimates requested of the responding Turkish producers, the production of OCTG in Turkey reported by the responding producers account for approximately all production of OCTG in Turkey and all exports to the United States.65
The three responding Turkish producers’ reported changes in operations through investments in new equipment and plant capabilities. Borusan reported that it ***.66 Çayirova reported that it ***.67 Toscelik reported that it ***.68 Toscelik began production of ERW pipe in July 2012 and capitalized an additional pipe machine that can produce OCTG in April 2013.69
Operations on OCTG
Table VII‐13 presents information on the OCTG operations of the responding producers and exporters in Turkey. Capacity increased by *** percent from 2010 to 2012 but was *** percent lower in January‐March 2013 than in January‐March 2012. Capacity is projected to be *** percent lower in 2013 than in 2012, and *** percent lower in 2014 than in 2012. Production in Turkey increased by *** percent from 2010 to 2012 but was *** percent lower in January‐March 2013 than in January‐March 2012. Production is projected to *** by *** from 2012 to 2013 and by *** percent in 2014 compared to 2012.70
In 2012, *** percent of total shipments of OCTG from Turkey were exported to the United States, and *** were exported to other markets. Exports of OCTG from Turkey to the
62 Questionnaire response of Tension Steel, II‐6. 63 Questionnaire response of Çayirova, II‐6. 64 Questionnaire response of Toscelik, II‐6. 65 Questionnaire responses of Turkish producers, II‐7. 66 Questionnaire response of Borusan, II‐2b. 67 Questionnaire response of Borusan, II‐2b. 68 Questionnaire response of Toscelik, II‐2b. 69 Questionnaire response of Toscelik, II‐2a. 70 With respect to production constraints, Borusan identified ***, Çayirova identified ***, and
Toscelik identified ***. Questionnaire responses of Turkish foreign producers, II‐4d.

VII‐16
United States increased by *** percent from 2010 to 2012, but was *** percent lower in January‐March 2013 than in January‐March 2012.
Table VII-13 OCTG: Data for producers in Turkey, 2010-12, January-March 2012, January-March 2013, and projected 2013-14
* * * * * * *
Alternative products
Table VII‐14 presents information on the overall welded tubular capacity and production of the responding producers in Turkey.71
Table VII-14 Tubular products: Turkish capacity, production, and capacity utilization of welded and seamless tubular products, 2010-12, January-March 2012, and January-March 2013
* * * * * * *
THE INDUSTRY IN UKRAINE
The petition in these investigations identified two producers and/or exporters of OCTG.72 The Commission issued foreign producer questionnaires to these firms and received a completed response from both firms, Interpipe Nizhnedneprovsky (“Interpipe NTRP”) and Interpipe Niko Tube Limited Liability Company (“Interpipe Niko”). Interpipe NTRP reported that *** percent of its total sales in the most recent fiscal year were sales of OCTG.73 Interpipe Niko reported that *** percent of its total sales in the most recent fiscal year were sales of OCTG.74
Interpipe NTRP estimated that its OCTG exports to the United States accounted for approximately *** percent of all such exports of OCTG from Ukraine in 2012, while Interpipe Niko’s estimated that its OCTG exports to the United States accounted for approximately *** percent.75 A comparison of these firms’ export data to official Commerce import statistics shows that in 2012 they accounted for *** U.S. imports from Ukraine. According to estimates requested of the responding Ukrainian producers, the production of OCTG in Ukraine reported
71 With respect to constraints on product shifting, Borusan identified ***, Çayirova identified ***, Toscelik stated ***. Questionnaire responses of Turkish foreign producers, II‐4e.
72 Petition, exh. I‐5H. 73 Questionnaire response of Interpipe Nizhnedneprovsky (Interpipe NTRP), II‐6. 74 Questionnaire response of Interpipe Niko Tube Limited Liability Company, II‐6. 75 Questionnaire responses of Interpipe Nizhnedneprovsky (Interpipe NTRP) and Interpipe Niko Tube
Limited Liability Company, II‐8.
VII‐17
by the responding producers accounts for approximately *** percent of overall production of OCTG in Ukraine.76
Interpipe NTRP and Interpipe Niko are mills belonging to Interpipe Group.77 78 According to their website, Interpipe Group is one of the biggest employers in Ukraine.79 *** 2010 and 2012.80 Both Interpipe NTRP and Interpipe Niko only produce seamless OCTG.81
Operations on OCTG
Table VII‐15 presents information on the OCTG operations of the responding producers and exporters in Ukraine. Reported capacity in Ukraine remained constant from 2010 to 2012, and was constant from January‐March 2012 relative to January‐March 2013.82 Reported capacity is projected ***. Production in Ukraine increased by *** percent from 2010 to 2012, but was *** percent lower in January‐March 2013 than in January‐March 2012. Production is projected to decrease by *** percent from 2013 to 2014. Capacity utilization increased from *** percent in 2010 to *** percent in 2012, and was *** percent in January‐March 2013 compared to *** percent in January‐March 2012.83
In 2012, *** percent of total shipments of OCTG from Ukraine were exported to the United States, and *** percent were exported to other markets, predominantly ***.84 Exports of OCTG from Ukraine to the United States increased by *** percent from 2010 to 2012, but were *** percent lower in January‐March 2013 than in January‐March 2012.
76 Ibid., II‐7. 77 Interpipe Group, “Interpipe NTRP – Dnepropetrovsk, Ukraine,”
http://interpipe.biz/en/company/productions/ntz/, accessed on July 25, 2013. 78 Interpipe Group, “Interpipe NIKO TUBE – Nikopol, Ukraine,”
http://interpipe.biz/en/company/productions/nikotube/, accessed on July 25, 2013. 79 Interpipe Group, “Social Policy,” http://interpipe.biz/en/company/respons/social/, accessed on
July 25, 2013. 80 Questionnaire responses of Interpipe Nizhnedneprovsky (Interpipe NTRP) and Interpipe Niko Tube
Limited Liability Company, II‐2. 81 Ibid., II‐4. 82 The production capacity reported by Interpipe NTRP is based on operating *** hours per week,
*** weeks per year. The production capacity reported by Interpipe Niko Tube is based on operating *** hours per week, *** weeks per year.
83 With respect to production constraints, Interpipe NTRP identified ***, and Interpipe Niko identified ***. Questionnaire response of Ukrainian producers, II‐4d.
84 Ibid., II‐5

VII‐18
Table VII-15 OCTG: Data for producers in Ukraine, 2010-12, January-March 2012, January-March 2013, and projected 2013-14
* * * * * * *
Alternative products
Table VII‐16 presents information on the total seamless tubular capacity and production of the responding producers and exporters in Ukraine.85 Interpipe NTRP reported that it produces *** on the same equipment used to produce OCTG.86 Interpipe Niko reported that it produces *** on the same equipment used to produce OCTG.87
Table VII-16 Tubular products: Ukrainian capacity, production, and capacity utilization of welded and seamless tubular products, 2010-12, January-March 2012, and January-March 2013
* * * * * * *
THE INDUSTRY IN VIETNAM
The petition in these investigations identified eight producers and/or exporters of OCTG in Vietnam.88 The Commission issued foreign producer questionnaires to these firms and received a completed response from two firms, SeAH Steel Vina Corporation and Hot Rolling Pipe Co., Ltd Vietnam. SeAH Steel Vina reported that *** percent of its total sales in the most recent fiscal year were sales of OCTG.89 Hot Rolling Pipe reported that *** percent of its total sales in the most recent fiscal year were sales of OCTG.90
SeAH Steel Vina estimated that its OCTG exports to the United States accounted for approximately *** percent of all such exports of OCTG from Vietnam in 2012, while Hot Rolling Pipe estimated that its exports to the United States accounted for approximately *** percent.91 A comparison of these firms’ export data to official Commerce import statistics shows that in 2012 they accounted for *** percent of all U.S. imports of OCTG from Vietnam. According to estimates requested of the responding Vietnamese producers, the production of OCTG in
85 With respect to constraints on product shifting, Interpipe NTRP identified ***, Interpipe Niko identified ***, Questionnaire responses of Ukrainian producers, II‐4e.
86 Questionnaire response of Interpipe Nizhnedneprovsky (Interpipe NTRP), II‐4. 87 Questionnaire response of Interpipe Niko Tube Limited Liability Company, II‐4. 88 Petition, exh. I‐5I. 89 Questionnaire response of SeAH Steel Vina Corporation, II‐6. 90 Questionnaire response of Hot Rolling Pipe Co., Ltd Vietnam, II‐6. 91 Questionnaire responses of SeAH Steel Vina Corporation and Hot Rolling Pipe Co., Ltd Vietnam, II‐
8.

VII‐19
Vietnam reported by the responding producers account for approximately *** percent of overall production of OCTG in Vietnam.92
SeAH Steel Vina’s first production lines came online in May of 1999.93 SeAH Steel Vina is a subsidiary of the SeAH Group, which is based in Korea. In 2013, SeAH Steel Vina invested *** towards the construction of a new production line capable of producing ***.94 SeAH Steel Vina cited ***.95 SeAH Steel Vina only produces welded OCTG. 96
Hot Rolling Pipe was established in August 2011, opening its plant in December 2011.97 98 A total of *** was invested in ***. 99 According to their website, Hot Rolling Pipe is the only producer of seamless OCTG in Vietnam.100 Hot Rolling Pipe only produces seamless OCTG.101
Operations on OCTG
Table VII‐17 presents information on the OCTG operations of the two responding producers and exporters in Vietnam. Reported capacity in Vietnam increased by *** percent from 2010 to 2012, and was the same in January‐March 2013 as in to January‐March 2012. Reported capacity is projected to increase by *** percent from 2013 to 2014. Reported production in Vietnam increased by *** percent from 2010 to 2012, and was *** percent higher in January‐March 2013 than in January‐March 2012. Production is projected to increase by *** percent from 2013 to 2014. Capacity utilization increased from *** percent in 2010 to *** percent in 2012, and was *** percent in January‐March 2013 compared to *** percent in January‐March 2012.102
In 2012, *** percent of total shipments of OCTG from Vietnam were exported to the United States, and *** percent were exported to other markets, predominantly Canada and Columbia.103 Exports of OCTG from Vietnam to the United States increased by *** percent
92 Ibid., II‐7. 93 SeAH Steel Vina Corporation, “Company’s History,” http://seahvina.com.vn/gioi‐thieu/companys‐
history.html, accessed on July 26, 2013. 94 Questionnaire response of SeAH Steel Vina Corporation, II‐2. 95 Ibid. 96 Ibid., II‐4. 97 Hot Rolling Pipe Co., Ltd Vietnam, “About Us,” http://www.hrpvietnam.com/about_us.php,
accessed on July 26, 2013. 98 Questionnaire response of Hot Rolling Pipe Co., II‐2. 99 Ibid. 100 Hot Rolling Pipe Co., Ltd Vietnam, “About Us,” http://www.hrpvietnam.com/about_us.php,
accessed on July 26, 2013. 101 Questionnaire response of Hot Rolling Pipe Co., II‐4. 102 With respect to production constraints, SeAH Steel Vina identified ***, while Hot Rolling Pipe Co.
identified ***. Questionnaire responses of SeAH Steel Vina Corporation and Hot Rolling Pipe Co., II‐4. 103 Questionnaire responses of SeAH Steel Vina Corporation and Hot Rolling Pipe Co., Ltd Vietnam, II‐
5.

VII‐20
from 2010 to 2012, and were *** percent higher in January‐March 2013 than in January‐March 2012.
Table VII-17 OCTG: Data for producers in Vietnam, 2010-12, January-March 2012, January-March 2013, and projected 2013-14
* * * * * * *
Alternative products
Table VII‐18 presents information on the total welded and seamless tubular capacity and production of the responding producers and exporters in Vietnam. SeAH Steel Vina reported that it ***.104 Hot Rolling Pipe reported ***.105
Table VII-18 Tubular products: Vietnamese capacity, production, and capacity utilization of welded and seamless tubular products, 2010-12, January-March 2012, and January-March 2013
* * * * * * *
104 Questionnaire response of SeAH Steel Vina Corporation, II‐4a. With respect to constraints on product shifting, SeAH Steel Vina identified ***. Questionnaire response of SeAH Steel Vina Corporation, II‐4e.
105 Questionnaire response of Hot Rolling Pipe Co., II‐4.
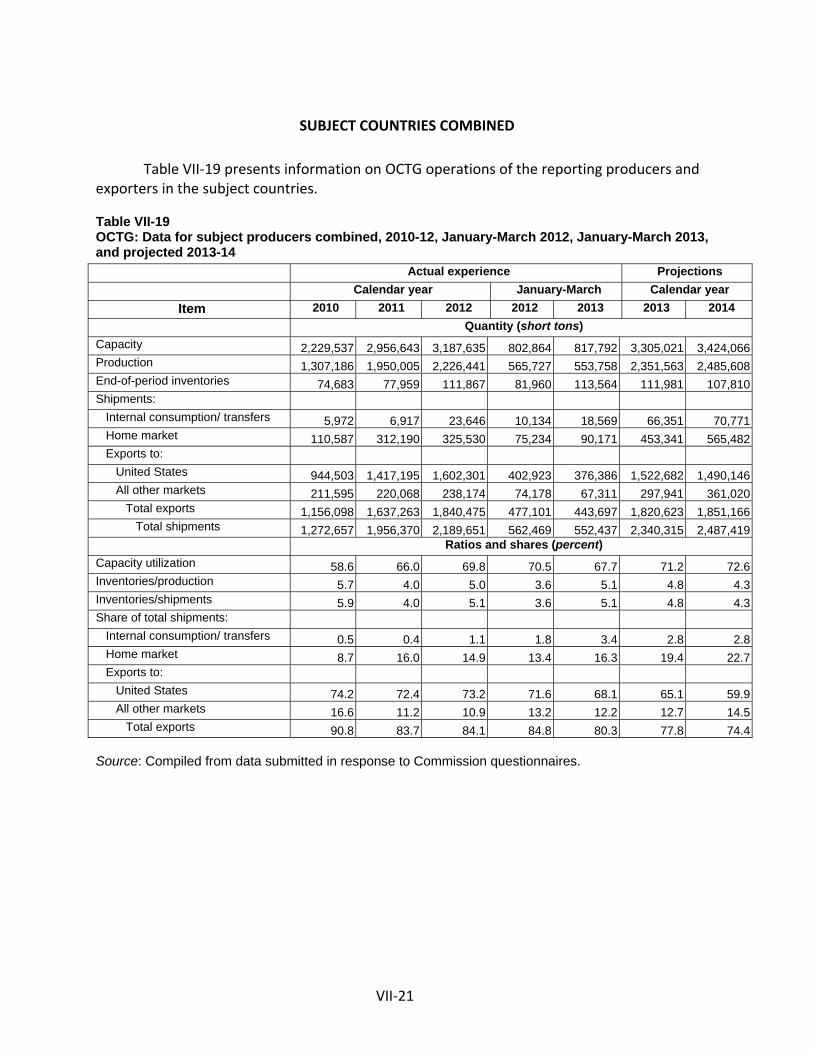
VII‐21
SUBJECT COUNTRIES COMBINED
Table VII‐19 presents information on OCTG operations of the reporting producers and exporters in the subject countries.
Table VII-19 OCTG: Data for subject producers combined, 2010-12, January-March 2012, January-March 2013, and projected 2013-14 Actual experience Projections Calendar year January-March Calendar year
Item 2010 2011 2012 2012 2013 2013 2014 Quantity (short tons) Capacity 2,229,537 2,956,643 3,187,635 802,864 817,792 3,305,021 3,424,066Production 1,307,186 1,950,005 2,226,441 565,727 553,758 2,351,563 2,485,608End-of-period inventories 74,683 77,959 111,867 81,960 113,564 111,981 107,810Shipments: Internal consumption/ transfers 5,972 6,917 23,646 10,134 18,569 66,351 70,771 Home market 110,587 312,190 325,530 75,234 90,171 453,341 565,482 Exports to: United States 944,503 1,417,195 1,602,301 402,923 376,386 1,522,682 1,490,146 All other markets 211,595 220,068 238,174 74,178 67,311 297,941 361,020 Total exports 1,156,098 1,637,263 1,840,475 477,101 443,697 1,820,623 1,851,166 Total shipments 1,272,657 1,956,370 2,189,651 562,469 552,437 2,340,315 2,487,419 Ratios and shares (percent) Capacity utilization 58.6 66.0 69.8 70.5 67.7 71.2 72.6Inventories/production 5.7 4.0 5.0 3.6 5.1 4.8 4.3Inventories/shipments 5.9 4.0 5.1 3.6 5.1 4.8 4.3Share of total shipments: Internal consumption/ transfers 0.5 0.4 1.1 1.8 3.4 2.8 2.8 Home market 8.7 16.0 14.9 13.4 16.3 19.4 22.7 Exports to: United States 74.2 72.4 73.2 71.6 68.1 65.1 59.9 All other markets 16.6 11.2 10.9 13.2 12.2 12.7 14.5 Total exports 90.8 83.7 84.1 84.8 80.3 77.8 74.4 Source: Compiled from data submitted in response to Commission questionnaires.

VII‐22
U.S. INVENTORIES OF IMPORTED MERCHANDISE
Table VII‐20 presents data on U.S. importers’ reported inventories of OCTG.
Table VII-20 OCTG: U.S. importers’ end-of-period inventories, 2010-12, January-March 2012, and January-March 2013 Calendar year January-March
Item 2010 2011 2012 2012 2013Imports from India Inventories (short tons) *** *** *** *** *** Ratio to U.S. imports (percent) *** *** *** *** *** Ratio to U.S. shipments of imports (percent) *** *** *** *** *** Imports from Korea Inventories (short tons) *** *** *** *** *** Ratio to U.S. imports (percent) *** *** *** *** *** Ratio to U.S. shipments of imports (percent) *** *** *** *** *** Imports from Philippines Inventories (short tons) *** *** *** *** *** Ratio to U.S. imports (percent) *** *** *** *** *** Ratio to U.S. shipments of imports (percent) *** *** *** *** *** Imports from Saudi Arabia Inventories (short tons) *** *** *** *** *** Ratio to U.S. imports (percent) *** *** *** *** *** Ratio to U.S. shipments of imports (percent) *** *** *** *** *** Imports from Taiwan Inventories (short tons) *** *** *** *** *** Ratio to U.S. imports (percent) *** *** *** *** *** Ratio to U.S. shipments of imports (percent) *** *** *** *** *** Imports from Thailand Inventories (short tons) *** *** *** *** *** Ratio to U.S. imports (percent) *** *** *** *** *** Ratio to U.S. shipments of imports (percent) *** *** *** *** *** Imports from Turkey Inventories (short tons) *** *** *** *** *** Ratio to U.S. imports (percent) *** *** *** *** *** Ratio to U.S. shipments of imports (percent) *** *** *** *** *** Imports from Ukraine Inventories (short tons) *** *** *** *** *** Ratio to U.S. imports (percent) *** *** *** *** *** Ratio to U.S. shipments of imports (percent) *** *** *** *** *** Imports from Vietnam Inventories (short tons) *** *** *** *** *** Ratio to U.S. imports (percent) *** *** *** *** *** Ratio to U.S. shipments of imports (percent) *** *** *** *** *** Imports from subject sources, subtotal Inventories (short tons) 143,927 190,730 323,088 252,892 349,916 Ratio to U.S. imports (percent) 19.0 15.6 19.9 15.9 22.0 Ratio to U.S. shipments of imports (percent) 22.0 17.9 23.9 18.9 25.4 Imports from all other sources Inventories (short tons) 202,132 188,563 263,085 216,211 221,781 Ratio to U.S. imports (percent) 18.0 15.1 17.4 15.1 21.4 Ratio to U.S. shipments of imports (percent) 17.1 15.0 18.6 16.5 19.8 Imports from all sources Inventories (short tons) 346,059 379,293 586,173 469,103 571,697 Ratio to U.S. imports (percent) 18.4 15.3 18.7 15.5 21.8 Ratio to U.S. shipments of imports (percent) 18.9 16.4 21.2 17.7 22.9 Source: Compiled from data submitted in response to Commission questionnaires.

VII‐23
U.S. IMPORTERS’ OUTSTANDING ORDERS
The Commission requested importers to indicate whether they imported or arranged for the importation of OCTG from subject sources after March 31, 2013. Table VII‐21 presents U.S. import shipments of OCTG arranged for importation after March 31, 2013.
Table VII-21 OCTG: U.S. importers’ arranged imports, April-December 2013 2013
Source April May June July August September October-
December Quantity (short tons)India-- Welded *** *** *** *** *** *** *** Seamless *** *** *** *** *** *** *** Total *** *** *** *** *** *** *** Korea-- Welded *** *** *** *** *** *** *** Seamless *** *** *** *** *** *** *** Total *** *** *** *** *** *** *** Philippines-- Welded *** *** *** *** *** *** *** Seamless *** *** *** *** *** *** *** Total *** *** *** *** *** *** *** Saudi Arabia-- Welded *** *** *** *** *** *** *** Seamless *** *** *** *** *** *** *** Total *** *** *** *** *** *** *** Taiwan-- Welded *** *** *** *** *** *** *** Seamless *** *** *** *** *** *** *** Total *** *** *** *** *** *** *** Thailand-- Welded *** *** *** *** *** *** *** Seamless *** *** *** *** *** *** *** Total *** *** *** *** *** *** *** Turkey-- Welded *** *** *** *** *** *** *** Seamless *** *** *** *** *** *** *** Total *** *** *** *** *** *** *** Ukraine-- Welded *** *** *** *** *** *** *** Seamless *** *** *** *** *** *** *** Total *** *** *** *** *** *** *** Vietnam-- Welded *** *** *** *** *** *** *** Seamless *** *** *** *** *** *** *** Total *** *** *** *** *** *** *** Subtotal, subject-- Welded 90,133 93,233 72,007 87,227 89,674 106,723 167,213 Seamless 19,709 20,278 18,924 12,860 5,939 17,443 24,748 Total 109,842 113,511 90,931 100,087 95,613 124,166 191,961 Source: Compiled from data submitted in response to Commission questionnaires.
VII‐24
ANTIDUMPING OR COUNTERVAILING DUTY ORDERS IN THIRD‐COUNTRY MARKETS
Exports of certain OCTG from Ukraine are subject to antidumping orders in the European Union (EU) and Russia. In the EU, exports of certain seamless pipes and tubes, including seamless iron and alloy casing and tubing, from Ukraine are subject to antidumping duties ranging from 12.3–25.7 percent.106 Effective September 9, 2012, Ukrainian OCTG producer Interpipe is subject to an antidumping duty rate of 13.8 percent.107 In Russia, Ukrainian exports of certain casing are reportedly subject to an antidumping duty rate of 18.9 percent, while exports of certain tubing are subject to a rate of 19.9 percent.108 Russian antidumping duty orders ***.109
INFORMATION ON NONSUBJECT COUNTRIES
Most published data on steel pipes and tubes distinguish OCTG and line pipe from other forms of pipe (including standard pipe and various forms of structural and mechanical pipe, pressure pipe, and pipe piling). That is, in terms of demand factors, most analysis focuses on energy applications or structural applications, very broadly defined. In addition, published analyses of supply factors are often grouped at an even more aggregated level, combining all forms of seamless pipe and all forms of welded pipe, reflecting, in part, a commonality among raw materials and some overlap of production facilities and methods. Accordingly, for the purpose of this section, information and data are provided based on their availability, and may include both subject and nonsubject pipe.
OCTG is produced in substantial quantities by pipe and tube producers throughout the world. The World Steel Association (WSA) publishes data on the global production of the larger product groupings of all pipe and tube. As shown in tables VII‐22 through VII‐24, global pipe and tube production declined between 2008 and 2009 following the global economic downturn, then rebounded and increased between 2009 and 2011. China accounted for a substantial majority of production growth, particular for welded tubular products.
106 The scope of the orders includes certain iron and alloy casing and tubing classified under HS 7304.29.
107 Official Journal of the European Union, Council Implementing Regulation (EU) No. 795/2012 of August 28, 2012, September 9, 2012.
108 U.S. Steel postconference brief, ex. 54 (“Medvedev decides not to extend quotas for Ukraine pipes,” Ukrinform, July 17, 2013).
109 ***.

VII‐25
Table VII-22 Welded and seamless steel pipe and fittings: Global production, by region, 2008–11
Region 2008 2009 2010 2011
Quantity (1,000 short tons)1
North America: United States 4,985 2,347 3,880 4,816 Canada 2,908 1,680 2,679 2,800 Mexico 1,448 1,290 1,516 1,411 Subtotal 9,342 5,316 8,074 9,027 South America: Argentina (2) (2) (2) (2) Others (2) 4 (2) (2) Subtotal (2) 4 (2) (2) EU (27): Germany 4,259 3,201 3,532 (2) Italy 4,471 2,884 3,347 (2) Spain 1,376 820 1,257 (2) Others 8,429 5,928 6,580 1,476 Subtotal 18,535 12,833 14,715 1,476 CIS: 3 Ukraine 2,610 1,725 2,022 2,538 Others 8,527 7,248 10,527 11,355 Subtotal 11,138 8,973 12,549 13,892 Asia: China 56,101 58,658 62,533 73,829 India 1,545 1,715 (2) 2,288 Japan 10,717 6,803 8,477 8,602 Korea 5,304 4,307 5,352 5,592 Philippines 152 64 55 99 Taiwan 1,164 977 1,265 1,338 Vietnam 606 626 742 806 Others 1,550 1,388 1,467 1,336 Subtotal 77,140 74,538 79,891 93,892 Others 409 268 277 299 Total 116,564 101,932 115,506 118,586 1 The data presented in this table are for all pipe and tube and, as a result, are substantially overstated with respect to OCTG subject to these investigations. 2 Not available. 3 Belarus, Kazakhstan, Russia, and Ukraine. Note.—Production data for 2012 are not available. Production data for 2011 are substantially understated since many countries, particularly EU member countries, did not report data for that year. Production data for Turkey are unavailable. Original data were published in metric tons, which were converted to short tons by multiplying by 1.102311. Because of rounding, figures may not add to the totals shown. Source: World Steel Association, Steel Statistical Yearbook, 2012, table 24, p. 47

VII‐26
Table VII-23 Seamless steel pipe: Global production, by region, 2008–11
Region 2008 2009 2010 2011
Quantity (1,000 short tons)1
North America: United States 2,338 1,053 1,919 2,443 Canada 280 168 268 280 Mexico 750 649 748 849 Subtotal 3,366 1,870 2,937 3,571 South America: Argentina 1,006 553 859 936 Others 50 4 (2) (2) Subtotal 1,056 558 859 936 EU (27): Germany 1,878 948 1,415 (2) Italy 966 529 648 (2) Spain 344 172 278 (2) Others 2,928 1,983 2,241 1,402 Subtotal 6,116 3,632 4,582 1,402 CIS: 3 Ukraine (2) (2) 862 966 Others (2) (2) 3,176 3,497 Subtotal (2) (2) 4,038 4,462 Asia: China 26,265 24,019 26,647 29,200 India (2) (2) (2) (2) Japan 2,923 1,811 2,364 2,512 Korea 23 20 18 19 Philippines (2) (2) (2) (2) Taiwan (2) (2) (2) (2) Vietnam (2) (2) (2) (2) Others (2) (2) (2) (2) Subtotal 29,211 25,849 29,029 31,731 Others (2) (2) (2) (2) Total 39,749 31,909 41,444 42,103 1 The data presented in this table are for all seamless steel pipe and tube and, as a result, are substantially overstated with respect to OCTG subject to these investigations. 2 Not available. 3 Belarus, Kazakhstan, Russia, and Ukraine. Note.—Production data for 2012 are not available. Production data for 2011 are substantially understated since many countries, particularly EU member countries, did not report data for that year. Production data for Turkey are unavailable. Original data were published in metric tons, which were converted to short tons by multiplying by 1.102311. Because of rounding, figures may not add to the totals shown. Source: World Steel Association, Steel Statistical Yearbook, 2012, table 25, p. 48.
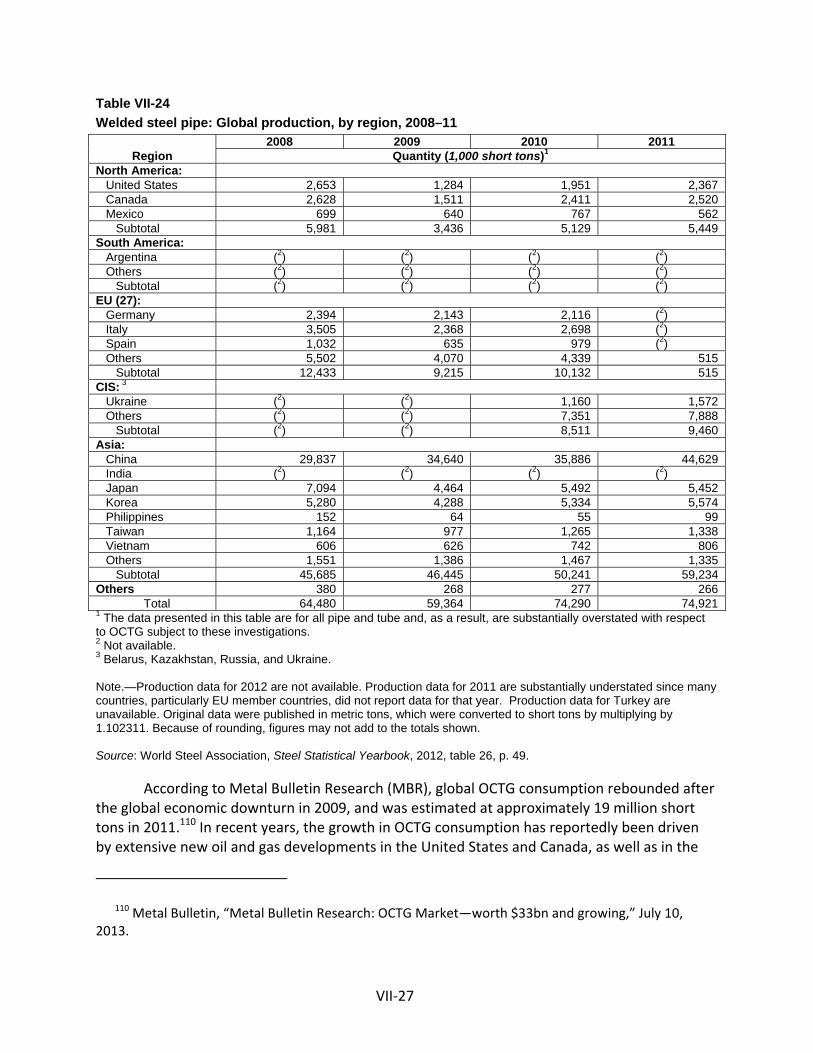
VII‐27
Table VII-24 Welded steel pipe: Global production, by region, 2008–11
Region 2008 2009 2010 2011
Quantity (1,000 short tons)1
North America: United States 2,653 1,284 1,951 2,367 Canada 2,628 1,511 2,411 2,520 Mexico 699 640 767 562 Subtotal 5,981 3,436 5,129 5,449 South America: Argentina (2) (2) (2) (2) Others (2) (2) (2) (2) Subtotal (2) (2) (2) (2) EU (27): Germany 2,394 2,143 2,116 (2) Italy 3,505 2,368 2,698 (2) Spain 1,032 635 979 (2) Others 5,502 4,070 4,339 515 Subtotal 12,433 9,215 10,132 515 CIS: 3 Ukraine (2) (2) 1,160 1,572 Others (2) (2) 7,351 7,888 Subtotal (2) (2) 8,511 9,460 Asia: China 29,837 34,640 35,886 44,629 India (2) (2) (2) (2) Japan 7,094 4,464 5,492 5,452 Korea 5,280 4,288 5,334 5,574 Philippines 152 64 55 99 Taiwan 1,164 977 1,265 1,338 Vietnam 606 626 742 806 Others 1,551 1,386 1,467 1,335 Subtotal 45,685 46,445 50,241 59,234 Others 380 268 277 266 Total 64,480 59,364 74,290 74,921 1 The data presented in this table are for all pipe and tube and, as a result, are substantially overstated with respect to OCTG subject to these investigations. 2 Not available. 3 Belarus, Kazakhstan, Russia, and Ukraine. Note.—Production data for 2012 are not available. Production data for 2011 are substantially understated since many countries, particularly EU member countries, did not report data for that year. Production data for Turkey are unavailable. Original data were published in metric tons, which were converted to short tons by multiplying by 1.102311. Because of rounding, figures may not add to the totals shown. Source: World Steel Association, Steel Statistical Yearbook, 2012, table 26, p. 49.
According to Metal Bulletin Research (MBR), global OCTG consumption rebounded after the global economic downturn in 2009, and was estimated at approximately 19 million short tons in 2011.110 In recent years, the growth in OCTG consumption has reportedly been driven by extensive new oil and gas developments in the United States and Canada, as well as in the
110 Metal Bulletin, “Metal Bulletin Research: OCTG Market—worth $33bn and growing,” July 10, 2013.

VII‐28
Middle East and Asia.111 In addition, directional and horizontal drilling, as well as drilling in more challenging environments for sour grades of hydrocarbons, has led to greater demand for higher‐value, heat‐treated grades of OCTG.112
However, declining natural gas prices in the United States due to the natural gas boom and ensuing domestic oversupply, coupled with a slowdown in the Chinese economy and the European debt crisis, has reportedly tempered OCTG demand growth globally, leading to weaker global demand in 2012 compared with 2011. For instance, according to Metal Bulletin demand for OCTG in some regions actually declined in 2012, including in Latin America, the Middle East, and the CIS. OCTG consumption in other regional markets fared better, including the North American and European markets, where OCTG consumption grew by 10–15 percent in 2012 compared to the previous year.113 Looking forward, MBR anticipates global growth in OCTG consumption to slow down in the next five years, averaging about 4 percent annually. According to MBR, Latin America and Africa will be areas of the fastest growth in OCTG consumption.114 On the supply side, MBR expects North America to see the largest addition of new OCTG capacity in the next 3–5 years.115
Table VII‐25 shows global reported exports of OCTG during 2010–12. China, Korea, and Japan collectively accounted for 45 percent of global OCTG exports in 2012. Tables VII‐26 and VII‐27 provide information on international rotary rig counts for the period 2010–12 and first‐half 2013. The following section provides information on the leading nonsubject producers and exporters of OCTG; namely, Argentina, Canada, Germany, Japan, and Mexico.
111 Metal Bulletin, “Metal Bulletin Research: OCTG Market—worth $33bn and growing,” July 10, 2013.
112 Metal Bulletin, “MB Research View—OCTG: Market’s global value will hit $40bn by 2017,” November 22, 2012.
113 Metal Bulletin, “Metal Bulletin Research: OCTG Market—worth $33bn and growing,” July 10, 2013.
114 Metal Bulletin, “MB Research View—OCTG: Market’s global value will hit $40bn by 2017,” November 22, 2012.
115 For a list of recent developments in the U.S. market, including OCTG capacity expansions, see section III of this report.

VII‐29
Table VII-25 OCTG: Global exports by reporting countries, 2010–12
Country Calendar year
2010 2011 2012Quantity (short tons)
China 1,685,072 1,926,801 2,323,787 Korea 604,586 661,559 874,299 Japan 740,947 761,705 749,340 Mexico 417,628 497,643 538,475 United States 377,447 458,228 455,237 Argentina 359,315 454,571 443,437 Canada 420,611 418,174 416,268 Germany 229,565 200,104 312,872 Ukraine 241,978 266,547 296,928 Singapore 214,752 249,126 252,154 Austria 201,903 251,029 247,590 France 177,954 256,618 240,975 Russia 209,046 228,716 238,530 Indonesia 157,763 156,032 175,389 Italy 109,410 89,063 141,407 Turkey 94,539 142,478 139,647 Brazil 82,631 60,206 118,861 Taiwan 67,476 110,334 118,039 Romania 85,682 75,134 99,003 United Kingdom 47,173 52,683 67,897 Colombia 41,522 61,219 63,522 Czech Republic 56,919 53,142 58,558 Azerbaijan 33,970 105,867 53,997 India 86,154 82,370 52,905 Thailand 8,717 14,629 52,841 Spain 31,865 47,770 51,272 Netherlands 12,797 16,017 30,526 Malaysia 17,350 23,303 23,070 Denmark 10,580 23,663 19,437 Belgium 8,426 8,734 10,867 Australia 8,709 4,488 7,036 Poland 7,226 4,618 5,147 Iran 164 338 4,864 Norway 7,463 10,016 3,322 Philippines 2,224 29,337 3,146 Slovakia 660 168 1,545 Georgia 0 0 896 Peru 79 1,324 840 South Africa 20,081 2,304 572 Cote d'Ivoire 227 823 434 Cyprus 3 56 373 Kazakhstan 30,443 68 370 Ghana 50 91 309 Lithuania 3 0 254 Table continued on next page.

VII‐30
Table VII-25--Continued OCTG: Global exports by reporting countries, 2010–12
Country Calendar year
2010 2011 2012Quantity (short tons)
Belarus 0 2 245 Hungary 3,100 459 183 Egypt 28 279 159 Ireland 174 105 131 Kenya 252 441 131 Sweden 574 395 130 El Salvador 6 18 110 Ecuador 36 175 109 Bulgaria 68 36 100 Switzerland 408 217 93 Guatemala 76 160 91 Hong Kong 390 93 86 Croatia 18,358 3,499 47 New Zealand 752 12 47 Algeria 6 267 45 Latvia 60 72 44 Chile 353 184 28 Portugal 60 90 22 Slovenia 1,054 60 22 Morocco 2 23 15 Mauritius 0 0 15 Greece 21 9 14 Costa Rica 7 142 12 Finland 12 7 9 Serbia 19 8 4 Estonia 12 0 4 Senegal 0 188 1 Honduras 0 0 1 Venezuela 179 7 1 Malta 9 0 0 Luxembourg 2 0 0 Paraguay 316 0 0 Vietnam (1) (1) (1) Total 6,937,441 7,814,039 8,698,141 1 Not available. Global Trade Atlas reported Vietnam OCTG exports during 2010 and 2011 in terms of value, but did not report exports in terms of volume. Reporting countries’ imports of OCTG from Vietnam totaled 1,215 short tons in 2010, 61,805 short tons in 2011, and 245,430 short tons in 2012. Note.-- Original data were published in metric tons, which were converted to short tons by multiplying by 1.102311. Because of rounding, figures may not add to the totals shown. Note.-- Global exports of OCTG reported by the Philippines are ***. Source: Global Trade Atlas (accessed July 24, 2013), HS subheadings 7304.29, 7305.20, 7306.29.

VII‐31
Table VII-26 OCTG: Baker Hughes International Rotary Rig Count, by country or region, 2010–12
Country or region Calendar year
2010 2011 2012Rig counts
Country: United States 1,541 1,875 1,919 Canada 351 423 365 Region: Latin America 383 424 423 Europe 94 118 119 Africa 83 78 96 Middle East 265 291 356 Asia Pacific 269 256 241 Total 2,986 3,465 3,519 Note.—Data include both onshore and offshore oil and gas rotary rigs. Source: Baker Hughes International Rig Count, June 2013, found at http://phx.corporate-ir.net/phoenix.zhtml?c=79687&p=irol-rigcountsintl, retrieved July 25, 2013. Table VII-27 OCTG: Baker Hughes International Rotary Rig Count, by country or region, Jan.–March 2012 through April–June 2013
Country or region
Calendar quarterJan.–March
2012 April–June
2012 July–Sept.
2012 Oct.–Dec.
2012 Jan.–March
2013 April–June
2013 Rig counts
Country: United States 1,991 1,970 1,906 1,809 1,758 1,761 Canada 592 173 326 368 536 155 Region: Latin America 432 438 414 408 426 425 Europe 112 117 117 129 134 133 Africa 83 90 108 103 114 127 Middle East 311 343 390 378 355 368 Asia Pacific 250 237 230 242 245 252 Total 3,771 3,368 3,491 3,437 3,568 3,221 Note.—Data include both onshore and offshore oil and gas rotary rigs. Source: Baker Hughes International Rig Count, June 2013, found at http://phx.corporate-ir.net/phoenix.zhtml?c=79687&p=irol-rigcountsintl, retrieved July 25, 2013.
Argentina
Although Argentina is South America’s largest natural gas consumer, its natural gas production has declined over 10 percent from peak levels in 2006.116 Moreover, oil production in Argentina has declined in recent years, and consequently, the country increasingly relies on
116 Energy Information Administration (EIA), “Argentina Energy Profile”, July 24, 2012, found at http://www.eia.gov/countries/cab.cfm?fips=AR, retrieved July 22, 2013.

VII‐32
imports of both products to meet its domestic energy needs.117 Argentina possesses the third largest endowment of recoverable shale gas in the world, and there are numerous projects under development to exploit these resources.118 As of June 2013, Argentina had 82 active rotary oil and gas rigs.119 In 2012, Argentina was the sixth‐largest exporter of OCTG (see table VII‐25). The leading markets for Argentina’s exports of OCTG in 2012 were the United States, Indonesia, and Iraq (table VII‐28).
According to ***120 and the American Petroleum Institute (API) Composite List,121 there are five known producers of OCTG in Argentina: Tenaris Siderca, M. Royo, Duralitte S.A., Formar S.A. and Tubhier. Tenaris Siderca is a wholly‐owned subsidiary of Tenaris (Luxembourg), a leading global tube producer, with an annual production capacity of over 900,000 short tons of seamless tubular products.122 Tenaris also has welded steel tube mills located in Buenos Aires and Santa Fe provinces, which together have an annual combined production capacity of 430,000 short tons of welded steel tubes.123 Tubhier produces a small amount of welded carbon and low‐alloy steel OCTG, line pipe, and standard pipe on its two mills in San Luis.124
117 EIA, “Argentina Energy Profile,” July 24, 2012, found at http://www.eia.gov/countries/cab.cfm?fips=AR, retrieved July 22, 2013.
118 EIA, “Argentina Energy Profile,” July 24, 2012, found at http://www.eia.gov/countries/cab.cfm?fips=AR, retrieved July 22, 2013.
119 Baker Hughes Inc., International Rig Rotary Rig Count, found at http://phx.corporate‐ir.net/phoenix.zhtml?c=79687&p=irol‐rigcountsintl, retrieved July 17, 2013.
120 ***. 121 The API Composite List is a directory of 4,107 companies in 78 countries supplying the oil and
natural gas industry. It includes licensing, registration, and product details of the organizations participating in the various API Certification Programs, including firms that are licensed for the API 5CT (oil and gas casing and tubing) Monogram. API Composite List, found at http://compositelist.api.org, retrieved July 16, 2013.
122 Tenaris is the parent company of U.S. OCTG producer Maverick Tube. 123 Tenaris Website, “Argentina Profile,” found at
http://www.tenaris.com/en/tenarisworldwide/southamerica/argentina.aspx, retrieved on July 23, 2013. 124 Tubhier Website, “Company Profile,” found at http://www.tubhier.com.ar/, retrieved July 23,
2013.

VII‐33
Table VII-28 OCTG: Argentina’s reported exports, 2010–12
Country Calendar year
2010 2011 2012Quantity (short tons)
United States 84,979 132,273 143,632 Indonesia 9,752 45,733 59,950 Iraq 11,976 12,671 35,609 Venezuela 27,379 25,628 27,788 Saudi Arabia 29,193 29,102 21,393 Ecuador 25,945 27,097 16,207 United Arab Emirates 209 21,211 15,500 Nigeria 9,899 4,885 12,376 Equatorial Guinea 905 6,089 11,644 Italy 2,992 5,149 9,712 Egypt 20,820 17,121 9,474 Colombia 14,252 7,934 8,510 Chile 5,338 7,642 7,261 Canada 29,421 27,996 6,997 Bolivia 3,142 6,626 6,586 Kazakhstan 1,339 1,587 6,303 Libya 11,849 13,793 5,445 Romania 291 9,915 4,404 Tunisia 1,005 648 3,532 Angola 4,130 3,734 3,514 All other 64,498 47,736 27,600 Total 359,315 454,571 443,438 Note.—Original data were published in metric tons, which were converted to short tons by multiplying by 1.102311. Because of rounding, figures may not add to the totals shown. Source: Global Trade Atlas (accessed July 25, 2013), HS subheadings 7304.29, 7305.20, 7306.29.
Canada
Canada is the world's sixth‐largest oil producer, and virtually all of its crude oil exports are destined for the United States.125 Canada holds a relatively small share of the world's proven natural gas reserves, yet is the fourth largest exporter of natural gas.126 As of June 2013, Canada’s rig count was 183.127
In 2012, Canada was the seventh‐largest exporter of OCTG (see table VII‐25). The United States is the leading market for Canada’s exports of OCTG (table VII‐29). Several Canadian companies produce casing and tubing. Some of these firms are owned by non‐Canadian parent companies, including Evraz North America (a subsidiary of Russian steel
125 EIA, “Canada Energy Profile,” December 10, 2012, found at http://www.eia.gov/countries/cab.cfm?fips=CA, retrieved July 22, 2013.
126 EIA, “Canada Energy Profile,” December 10, 2012, found at http://www.eia.gov/countries/cab.cfm?fips=CA, retrieved July 22, 2013.
127 Baker Hughes Inc., “Rig Count Overview and Summary Count,” found at http://phx.corporate‐ir.net/phoenix.zhtml?c=79687&p=irol‐rigcountsoverview, retrieved July 22, 2013. Canada’s rig count typically falls in the spring due to ground thawing, which makes moving drilling equipment more difficult to transport.
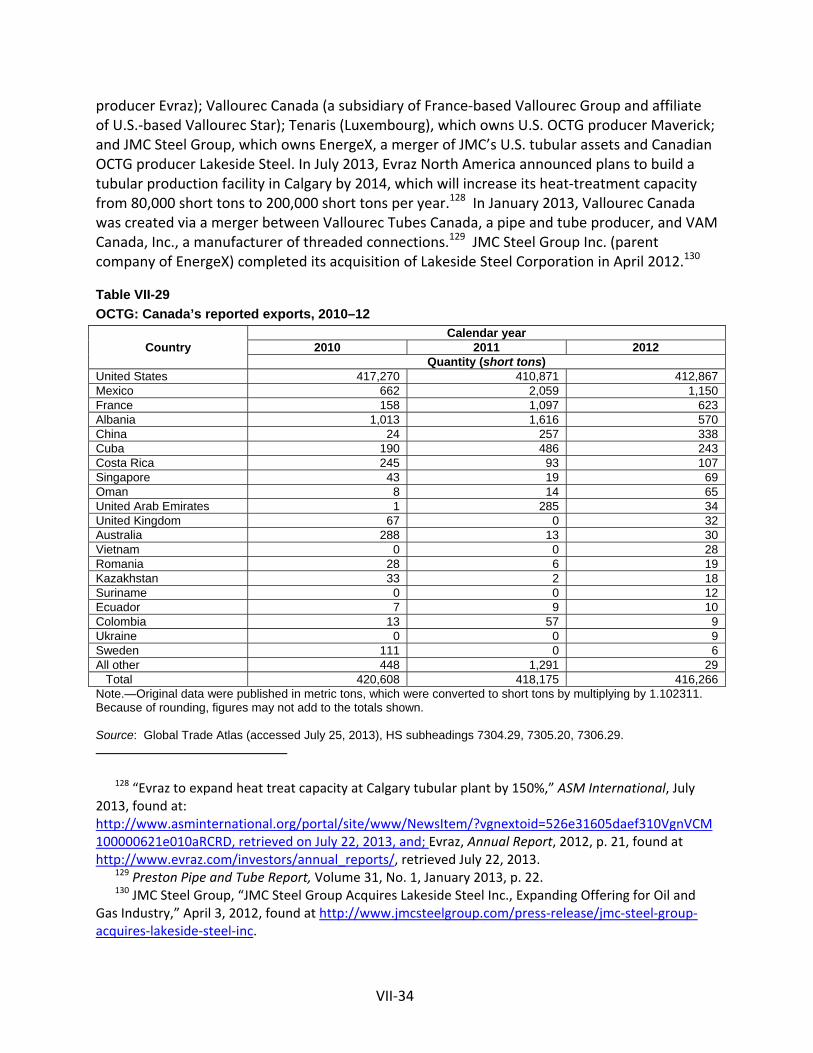
VII‐34
producer Evraz); Vallourec Canada (a subsidiary of France‐based Vallourec Group and affiliate of U.S.‐based Vallourec Star); Tenaris (Luxembourg), which owns U.S. OCTG producer Maverick; and JMC Steel Group, which owns EnergeX, a merger of JMC’s U.S. tubular assets and Canadian OCTG producer Lakeside Steel. In July 2013, Evraz North America announced plans to build a tubular production facility in Calgary by 2014, which will increase its heat‐treatment capacity from 80,000 short tons to 200,000 short tons per year.128 In January 2013, Vallourec Canada was created via a merger between Vallourec Tubes Canada, a pipe and tube producer, and VAM Canada, Inc., a manufacturer of threaded connections.129 JMC Steel Group Inc. (parent company of EnergeX) completed its acquisition of Lakeside Steel Corporation in April 2012.130
Table VII-29 OCTG: Canada’s reported exports, 2010–12
Country Calendar year
2010 2011 2012Quantity (short tons)
United States 417,270 410,871 412,867 Mexico 662 2,059 1,150 France 158 1,097 623 Albania 1,013 1,616 570 China 24 257 338 Cuba 190 486 243 Costa Rica 245 93 107 Singapore 43 19 69 Oman 8 14 65 United Arab Emirates 1 285 34 United Kingdom 67 0 32 Australia 288 13 30 Vietnam 0 0 28 Romania 28 6 19 Kazakhstan 33 2 18 Suriname 0 0 12 Ecuador 7 9 10 Colombia 13 57 9 Ukraine 0 0 9 Sweden 111 0 6 All other 448 1,291 29 Total 420,608 418,175 416,266 Note.—Original data were published in metric tons, which were converted to short tons by multiplying by 1.102311. Because of rounding, figures may not add to the totals shown. Source: Global Trade Atlas (accessed July 25, 2013), HS subheadings 7304.29, 7305.20, 7306.29.
128 “Evraz to expand heat treat capacity at Calgary tubular plant by 150%,” ASM International, July 2013, found at: http://www.asminternational.org/portal/site/www/NewsItem/?vgnextoid=526e31605daef310VgnVCM100000621e010aRCRD, retrieved on July 22, 2013, and; Evraz, Annual Report, 2012, p. 21, found at http://www.evraz.com/investors/annual_reports/, retrieved July 22, 2013.
129 Preston Pipe and Tube Report, Volume 31, No. 1, January 2013, p. 22. 130 JMC Steel Group, “JMC Steel Group Acquires Lakeside Steel Inc., Expanding Offering for Oil and
Gas Industry,” April 3, 2012, found at http://www.jmcsteelgroup.com/press‐release/jmc‐steel‐group‐acquires‐lakeside‐steel‐inc.

VII‐35
Germany
Germany imports nearly all of its oil and natural gas. Oil is Germany’s primary source of energy, accounting for 38 percent of Germany’s total primary energy consumption in 2011.131 In addition, Germany has no liquefied natural gas terminals, so it must import gas via pipeline exclusively from Russia, Norway, or other European countries.132 As of June 2013, Germany has 5 rigs.133 Nonetheless, Germany is the largest OCTG producer and exporter in Europe. In 2012, Germany was the eighth‐largest global exporter the largest European exporter of OCTG (see table VII‐25). The leading markets for Germany’s exports of OCTG in 2012 were the United States, the United Kingdom, and France (table VII‐30).
There are several OCTG producers in Germany, including V&M Deutschland, a subsidiary of Vallourec Group (France) and affiliate of U.S. OCTG producer Vallourec Star; Benteler Steel/Tube, which in 2012 announced plans to build a $900 million seamless OCTG mill in Caddo, Louisiana (slated for completion in 2015);134 and TPS Technitube Rohrenwerke.
131 EIA, “Germany Energy Profile,” May 30, 2013, found at http://www.eia.gov/countries/country‐data.cfm?fips=GM&trk=m, retrieved on July 22, 2013.
132 EIA, “Germany Energy Profile,” May 30, 2013, found at http://www.eia.gov/countries/country‐data.cfm?fips=GM&trk=m, retrieved on July 22, 2013.
133 Baker Hughes Inc., International Rotary Rig Count, found at http://phx.corporate‐ir.net/phoenix.zhtml?c=79687&p=irol‐rigcountsintl, retrieved July 17, 2013.
134 Preston Pipe and Tube Report, Vol. 30, No. 11, November 2012, p. 25.

VII‐36
Table VII-30 OCTG: Germany’s reported exports, 2010–12
Country Calendar year
2010 2011 2012Quantity (short tons)
United States 110,201 81,967 193,069 United Kingdom 14,552 14,548 21,050 France 26,278 12,592 15,115 Angola 5,579 6,103 12,596 Indonesia 15,737 11,908 12,501 Netherlands 4,360 3,142 6,551 Iraq 1,479 9,763 5,413 Saudi Arabia 5,916 13,847 4,470 Azerbaijan 3,535 2,039 3,957 Australia 140 47 3,523 Egypt 2,969 476 3,517 China 493 5,804 3,391 Poland 1,161 2,209 2,588 Nigeria 3,008 5,965 2,517 Canada 1,834 713 2,175 Pakistan 8 0 1,938 Belize 0 2,880 1,704 Hungary 420 26 1,681 Kazakhstan 2,810 1,942 1,607 Brazil 0 0 1,606 All other 29,087 24,132 11,903 Total 229,565 200,105 312,872 Note.—Original data were published in metric tons, which were converted to short tons by multiplying by 1.102311. Because of rounding, figures may not add to the totals shown. Source: Global Trade Atlas (accessed July 25, 2013), HS subheadings 7304.29, 7305.20, 7306.29.
Japan
Japan is the world’s largest importer of liquefied natural gas and the third largest importer of oil.135 Japan relies on oil imports to meet about 42 percent of its energy needs.136 With only 2 rigs as of June 2013, Japan has very limited domestic energy resources in its own country. 137 As a result, Japan exports almost all of its OCTG production. Japan was the third‐largest global exporter of OCTG in 2012 (see table VII‐25). The leading markets for Japan’s exports of OCTG in 2012 were the United States, Norway, and Malaysia (table VII‐31).
Japanese OCTG producers include Nippon Steel Sumitomo Metals (NSSM) Corporation (as the result of a merger between Nippon Steel and Sumitomo Metal Industries in 2012), JFE Steel Corporation, Tenaris NKK Tubes, a subsidiary of Tenaris (Luxembourg) and affiliate of U.S.
135 EIA, “Japan Energy Profile,” June 4, 2012, http://www.eia.gov/countries/country‐data.cfm?fips=JA&trk=m, retrieved July 22, 2013.
136 EIA, “Japan Energy Profile,” June 4, 2012, http://www.eia.gov/countries/country‐data.cfm?fips=JA&trk=m, retrieved July 22, 2013.
137 Baker Hughes Inc., “International Rig Rotary Rig Count,” found at http://phx.corporate‐ir.net/phoenix.zhtml?c=79687&p=irol‐rigcountsintl, retrieved July 17, 2013.

VII‐37
OCTG producer Maverick; and Maruichi Steel Tube. According to ***, NSSM’s combined annual production of tubular products is almost 8 million short tons (4.3 million short tons at Nippon Steel and 3.3 million short tons at Sumitomo Metal Industries). Tenaris NKK Tubes has an annual steel tube capacity of 287,000 short tons.138 Maruichi Steel Tube has an annual steel tube capacity of 1,323,000 short tons.139
Table VII-31 OCTG: Japan’s reported exports, 2010–12
Country Calendar year
2010 2011 2012Quantity (short tons)
United States 144,670 125,731 186,479 Norway 30,730 85,420 67,164 Malaysia 16,306 60,787 62,508 Saudi Arabia 50,381 76,349 51,314 Oman 5,059 4,666 46,559 United Arab Emirates 86,032 88,100 44,986 China 39,572 32,430 24,899 Iraq 1,753 21,196 23,661 Vietnam 23,351 14,687 22,995 Brunei Darussalam 12,895 14,316 22,625 Australia 12,151 27,388 20,855 Canada 27,429 14,881 17,014 Indonesia 29,394 22,741 16,589 Singapore 49,789 24,126 15,901 United Kingdom 15,228 18,487 15,824 Russia 27,503 14,692 11,568 Kuwait 47,120 39,367 11,514 Netherlands 17,012 6,856 10,417 Azerbaijan 13,665 11,089 7,331 Brazil 12,087 9,156 6,073 All other 78,817 49,241 63,064 Total 740,945 761,707 749,339 Note.—Original data were published in metric tons, which were converted to short tons by multiplying by 1.102311. Because of rounding, figures may not add to the totals shown. Source: Global Trade Atlas (accessed July 25, 2013), HS subheadings 7304.29, 7305.20, 7306.29.
138 Tenaris NKK Tubes, “Company Profile,” found at http://www.tenaris.com/shared/documents/files/CB48.pdf, retrieved July 23, 2013; ***.
139 ***.
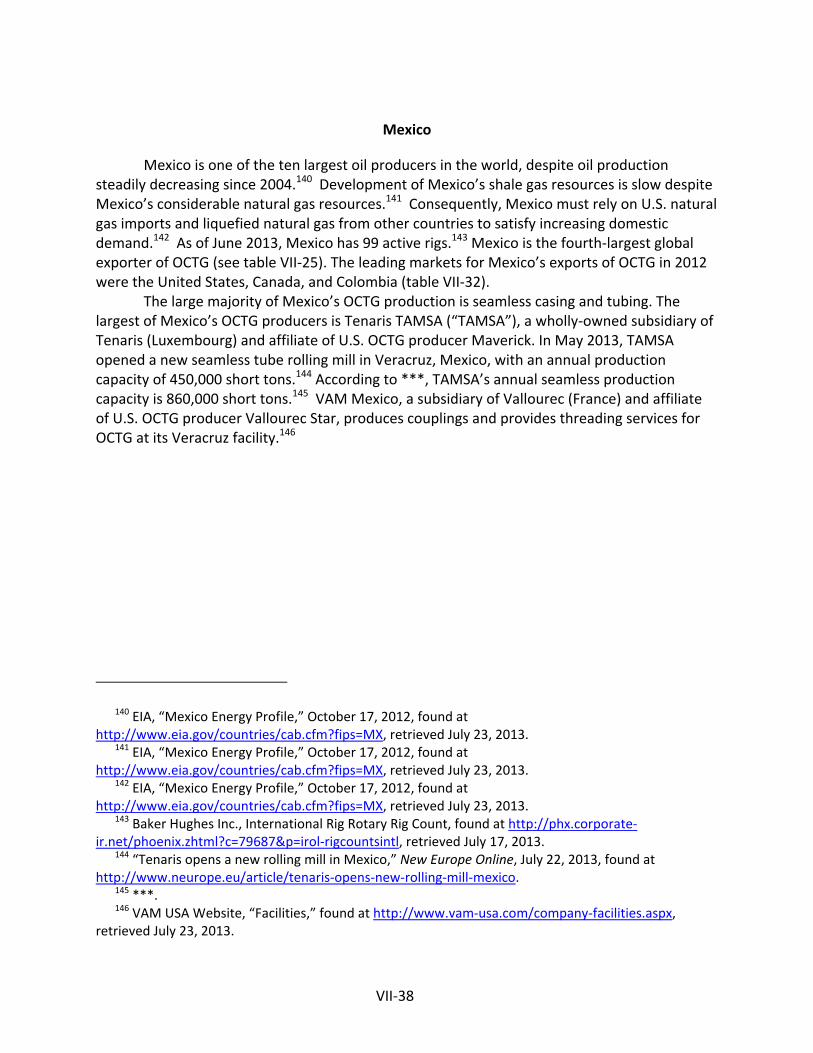
VII‐38
Mexico
Mexico is one of the ten largest oil producers in the world, despite oil production steadily decreasing since 2004.140 Development of Mexico’s shale gas resources is slow despite Mexico’s considerable natural gas resources.141 Consequently, Mexico must rely on U.S. natural gas imports and liquefied natural gas from other countries to satisfy increasing domestic demand.142 As of June 2013, Mexico has 99 active rigs.143 Mexico is the fourth‐largest global exporter of OCTG (see table VII‐25). The leading markets for Mexico’s exports of OCTG in 2012 were the United States, Canada, and Colombia (table VII‐32).
The large majority of Mexico’s OCTG production is seamless casing and tubing. The largest of Mexico’s OCTG producers is Tenaris TAMSA (“TAMSA”), a wholly‐owned subsidiary of Tenaris (Luxembourg) and affiliate of U.S. OCTG producer Maverick. In May 2013, TAMSA opened a new seamless tube rolling mill in Veracruz, Mexico, with an annual production capacity of 450,000 short tons.144 According to ***, TAMSA’s annual seamless production capacity is 860,000 short tons.145 VAM Mexico, a subsidiary of Vallourec (France) and affiliate of U.S. OCTG producer Vallourec Star, produces couplings and provides threading services for OCTG at its Veracruz facility.146
140 EIA, “Mexico Energy Profile,” October 17, 2012, found at http://www.eia.gov/countries/cab.cfm?fips=MX, retrieved July 23, 2013.
141 EIA, “Mexico Energy Profile,” October 17, 2012, found at http://www.eia.gov/countries/cab.cfm?fips=MX, retrieved July 23, 2013.
142 EIA, “Mexico Energy Profile,” October 17, 2012, found at http://www.eia.gov/countries/cab.cfm?fips=MX, retrieved July 23, 2013.
143 Baker Hughes Inc., International Rig Rotary Rig Count, found at http://phx.corporate‐ir.net/phoenix.zhtml?c=79687&p=irol‐rigcountsintl, retrieved July 17, 2013.
144 “Tenaris opens a new rolling mill in Mexico,” New Europe Online, July 22, 2013, found at http://www.neurope.eu/article/tenaris‐opens‐new‐rolling‐mill‐mexico.
145 ***. 146 VAM USA Website, “Facilities,” found at http://www.vam‐usa.com/company‐facilities.aspx,
retrieved July 23, 2013.

VII‐39
Table VII-32 OCTG: Mexico’s reported exports, 2010–12
Country Calendar year
2010 2011 2012Quantity (short tons)
United States 146,688 201,598 158,786 Canada 32,245 58,666 102,006 Colombia 46,413 67,546 42,937 Iraq 13,854 9,439 35,516 Ecuador 19,706 15,667 27,183 Venezuela 26,278 9,697 18,390 Russia 1,176 6,572 15,678 Norway 7,388 9,986 15,107 Saudi Arabia 582 29,895 13,654 Argentina 3,124 2,557 11,148 Egypt 7,987 7,139 10,100 Angola 4,039 8,287 10,094 United Arab Emirates 4,376 5,561 9,990 United Kingdom 2,859 5,052 7,564 Italy 995 6,771 7,014 Denmark 622 3,243 4,752 Romania 0 2,048 3,997 Nigeria 11,346 3,067 3,985 Peru 2,061 3,778 3,857 Turkey 1,291 6,117 3,023 All other 84,599 34,955 33,694 Total 417,629 497,642 538,476 Note.—Original data were published in metric tons, which were converted to short tons by multiplying by 1.102311. Because of rounding, figures may not add to the totals shown. Source: Global Trade Atlas (accessed July 25, 2013), HS subheadings 7304.29, 7305.20, 7306.29.


A‐1
APPENDIX A
FEDERAL REGISTER NOTICES


A‐3
The Commission makes available notices relevant to its investigations and reviews on its
website, www.usitc.gov. In addition, the following tabulation presents, in chronological order,
Federal Register notices issued by the Commission and Commerce during the current
proceeding.
Citation Title Link
78 FR 41421 July 10, 2013
Certain Oil Country Tubular Goods From India, Korea, Philippines, Saudi Arabia, Taiwan, Thailand, Turkey, Ukraine, and Vietnam; Institution of Antidumping and Countervailing Duty Investigations and Scheduling of Preliminary Phase Investigations
http://www.gpo.gov/fdsys/pkg/FR‐2013‐07‐10/pdf/2013‐16515.pdf
78 FR 45502 July 29, 2013
Certain Oil Country Tubular Goods From India and Turkey: Initiation of Countervailing Duty Investigations
http://www.gpo.gov/fdsys/pkg/FR‐2013‐07‐29/pdf/2013‐18165.pdf
78 FR 45505 July 29, 2013
Certain Oil Country Tubular Goods from India, the Republic of Korea, the Republic of the Philippines, Saudi Arabia, Taiwan, Thailand, the Republic of Turkey, Ukraine, and the Socialist Republic of Vietnam: Initiation of Antidumping Duty Investigations
http://www.gpo.gov/fdsys/pkg/FR‐2013‐07‐29/pdf/2013‐18164.pdf
Source: https://www.federalregister.gov/


B‐1
APPENDIX B
CALENDAR OF THE PUBLIC STAFF CONFERENCE


B‐3
CALENDAR OF PUBLIC PRELIMINARY CONFERENCE
Those listed below appeared as witnesses at the United States International Trade Commission’s preliminary conference:
Subject: Certain Oil Country Tubular Goods from India, Korea, Philippines, Saudi Arabia, Taiwan, Thailand, Turkey, Ukraine, and Vietnam
Inv. Nos.: 701‐TA‐499‐500 and 731‐TA‐1215‐1223 (Preliminary)
Date and Time: July 23, 2013 ‐ 9:30 a.m.
Sessions were held in connection with these preliminary phase investigations in the Main
hearing Room (Room 101), 500 E Street, S.W., Washington, DC.
CONGRESSIONAL APPEARANCE: The Honorable Rick Crawford, U.S. Representative, 1st District, Arkansas
In Support of the Imposition of
Antidumping and Countervailing Duty Orders: Schagrin Associates Washington, DC on behalf of
Boomerang Tube Energex Tube, a division of JMC Steel Group Northwest Pipe Company Tejas Tubular Products TMK IPSCO Vallourec Star, L.P. Welded Tube USA, Inc. The United Steel, Paper and Forestry, Rubber,
Manufacturing, Energy, Allied Industrial, and Service Workers International Union (“USW”) Gregg Eisenberg, President and CEO, Boomerang Tube Bill Snyder, Vice President of Sales and Marketing, Boomerang Tube Bob Okrzesik, Vice President of Marketing, Energex Tube Robert Mahoney, Senior Vice President of Strategy & Business Development, Northwest Pipe Company Maximo Tejeda, President and CEO, Tejas Tubular Products
B‐4
In Support of the Imposition of
Antidumping and Countervailing Duty Orders‐‐Continued Schagrin Associates Washington, DC on behalf of Darrell Ballinger, VIce PResident of Sales and Marketing, Tejas Tubular Products Scott Barnes, Senior Vice President and Chief Commercial Officer, TMK IPSCO Martin Marini, Director of Market Intelligence, TMK IPSCO Skip Herald, Manageing Director – North America, Vallourec USA Ronny Clark, General Manager – Sales and Maketing, Vallourec Stap, L.P. Robert “Butch” Mandel, Executive Vice President, Welded Tube Linda Andros, Legislative Counsel, USW Steve Tait, President, Pipeco Roger B. Schagrin ) John W. Bohn ) – OF COUNSEL Paul W. Jameson ) Wiley Rein LLP Washington, DC on behalf of
Maverick Tube Corporation (“Maverick”) Germán Curá, President and CEO, Maverick; and Managing Director, Tenaris North America Brad Lowe, Director, Maverick; and President, Tenaris Global Services (USA) Inc. Alan H. Price ) ) – OF COUNSEL Robert E. DeFrancesco, III )

B‐5
In Support of the Imposition of
Antidumping and Countervailing Duty Orders‐‐Continued Skadden, Arps, Slate, Meagher & Flom LLP Washington, DC on behalf of
United States Steel Corporation Douglas R. Matthews, Senior Vice President – North American Flat‐Rolled Operations, United States Steel Corporation George H. Thompson, Jr., Vice President – Tubular Commercial, United States Steel Corporation Scott M. Dorn, General Manager – Tubular Marketing, U.S. Steel Tubular Products, Inc. John B. Shoaff, President, Sooner Pipe, LLC Scott DuBois, President, Premier Pipe, LLC Steve Miller, Co‐Chief Executive Officer, Cinco
Pipe & Supply Professor Michael Whinston, Professor of Economics, Massachusetts Institute of Technology Dr. Seth Kaplan, Senior Economic Advisor, Capital Trade, Inc. James C. Hecht ) ) – OF COUNSEL Stephen P. Vaughn )
B‐6
In Opposition to the Imposition of
Antidumping and Countervailing Duty Orders: Arent Fox LLP Washington, DC on behalf of
Duferco Steel Inc. (“Duferco”) Jubail Energy Services Company (“JESCO”)
John Blomberg, Director of Pipe and Tube, Duferco SA David Echavaria, Vice President of OCTG, Duferco Steel Inc. John M. Gurley ) ) – OF COUNSEL Nancy A. Noonan ) Steptoe & Johnson LLP Washington, DC on behalf of
ILJIN Steel Corporation (“ILJIN”) Richard O. Cunningham ) ) – OF COUNSEL Joel D. Kaufman ) Grunfeld, Desiderio, Lebowitz, Silverman, & Klestadt LLP Washington, DC on behalf of
WSP Pipe Co., Ltd. (“WSP”) Max F. Schutzman ) ) – OF COUNSEL Ned H. Marshak ) Mowry & Grimson, PLLC Washington, DC on behalf of
Hot Rolling Pipe Co, Ltd. Vietnam HLD Clark Steel Pipe Co., Inc.
Bruce Malashevich, President, Economic Consulting Services Gary Horlick, Counsel, Law Office of Gary Horlick Kristin Mowry ) – OF COUNSEL
B‐7
In Opposition to the Imposition of
Antidumping and Countervailing Duty Orders: Hogan Lovells US LLP Washington, DC on behalf of
Interpipe North American Interpipe
Mark S. McConnell ) ) – OF COUNSEL Craig A. Lewis ) Morris, Manning & Martin, LLP Washington, DC on behalf of
Borusan Mannesmann Boru Sanayi ve Ticaret Anonium Sirketi AJU Besteel Co., Ltd. Husteel Co., Ltd. Hyundai HYSCO Nexteel Co., Ltd. SeAH Steel America, Inc. Husteel USA, Inc. Hyundai HYSCO USA, Inc. DeAH Steel America, Inc. Chung Hung Steel Corporation Far East Machinery Co., Ltd. Kao Hsing Chang Iron and Steel Corp. Shin Yang Steel Co., Ltd. Tension Steel Industries Co., Ltd.
Buddy Brewer, President and CEO, Borusan Mannesmann Pipe U.S. Inc. Zafer Atabey, Executive Vice President, Commercial and Special Pipes Sales, Borusan Mannesmann Pipe U.S. Inc. Ivan Li, Vice President of Sales Department, Chung Hung Steel Corporation Kevin Chang, Vice President of Sales Department, Tension Steel Industries Co., Ltd. Dong‐Heui Pi, Manager, Marketing Strategy Team, Hyundai HYSCO, Ltd. Steve Fowler, Principal, Tubular Synergy Group, LP Jim Dougan, Senior Economist, Economic Consulting Service, LLC

B‐8
In Opposition to the Imposition of
Antidumping and Countervailing Duty Orders‐‐Contiued Morris, Manning & Martin, LLP Washington, DC on behalf of Julie C. Mendoza ) Donald B. Cameron ) – OF COUNSEL R. Will Planert ) Kutak Rock LLP Washington, DC on behalf of
Jindal India Ltd. (“Jindal India”) Surya Global Steel Tubes Ltd. (“Surya Global”) Maharashtra Seamless Ltd. (“Maharashtra”) Jindal Pipe Ltd. (“Jindal Pipes”) GVN Fuels Ltd. (“GVN”) Jindal Saw Ltd. (India) (“Jindal Saw”) ISMT Limited (“ISMT”) Jindal Saw Ltd. (US) (“Jindal Saw US”) Indian Seamless Inc. (“India Seamless”)
Manish Khandelwal, Director, Maharashtra Lizbeth R. Levinson ) – OF COUNSEL Law Offices of David L. Simon Washington, DC on behalf of
Çayirova Boru Sanayi ve Ticaret A.S. (“Çayirova”) and its afilliated exporter Yücel Boru Ithalat‐Ihracet ve Pazarlama A.S. (“YIIP”)
Tosçelik ve Sac Endustrisi A.S. (“Tosçelik”) and its afilliated exporter Tosyali Dis Ticaret A.S. (“TDT”) Ahmet Sumer, Export Manager, Tosçelik Profil ve Sac. End. A.S./Tosyali Dis Ticaret A.S. David L. Simon ) – OF COUNSEL

B‐9
In Opposition to the Imposition of
Antidumping and Countervailing Duty Orders‐‐Contiued Greenberg Traurig, LLP Washington, DC on behalf of United Seamless Tubulaar Pvt. Ltd. Oil Country Tubular Ltd. Philippe M. Bruno ) ) – OF COUNSEL Rosa S. Jeong )

C‐1
APPENDIX C
SUMMARY DATA


Table C-1OCTG: Summary data concerning the U.S. market, 2010-12, January to March 2012, and January to March 2013
Jan-Mar2010 2011 2012 2012 2013 2010-12 2010-11 2011-12 2012-13
U.S. consumption quantity:Amount............................................................. 5,012,744 6,129,389 7,160,696 1,875,302 1,665,657 42.8 22.3 16.8 (11.2)Producers' share (fn1)....................................... 53.7 53.6 50.0 50.5 55.1 (3.7) (0.1) (3.6) 4.6Importers' share (fn1):
India.............................................................. *** *** *** *** *** *** *** *** ***Korea............................................................. *** *** *** *** *** *** *** *** ***Philippines..................................................... 0.0 0.4 1.0 1.0 0.7 1.0 0.4 0.6 (0.3)Saudi Arabia.................................................. *** *** *** *** *** *** *** *** ***Taiwan........................................................... 1.1 1.6 1.5 1.8 1.6 0.4 0.4 (0.1) (0.2)Thailand........................................................ 0.0 0.1 0.4 0.1 0.2 0.4 0.1 0.3 0.1Turkey........................................................... 1.7 2.3 2.1 2.6 1.5 0.4 0.6 (0.2) (1.2)Ukraine.......................................................... *** *** *** *** *** *** *** *** ***Vietnam......................................................... 0.0 0.9 3.1 3.2 2.3 3.1 0.9 2.1 (0.9)
Subtotal, subject......................................... 17.0 21.5 25.3 25.4 26.4 8.3 4.6 3.7 1.0All others sources, nonsubject....................... 29.3 24.9 24.7 24.1 18.5 (4.6) (4.4) (0.2) (5.6)
Total imports........................................... 46.3 46.4 50.0 49.5 44.9 3.7 0.1 3.6 (4.6)
U.S. consumption value:Amount............................................................. 7,414,798 9,539,991 11,270,780 2,951,979 2,411,262 52.0 28.7 18.1 (18.3)Producers' share (fn1)....................................... 58.4 58.2 54.9 56.0 59.7 (3.5) (0.2) (3.4) 3.8Importers' share (fn1):
India.............................................................. *** *** *** *** *** *** *** *** ***Korea............................................................. *** *** *** *** *** *** *** *** ***Philippines..................................................... 0.0 0.2 0.6 0.6 0.4 0.6 0.2 0.4 (0.2)Saudi Arabia.................................................. *** *** *** *** *** *** *** *** ***Taiwan........................................................... 0.6 0.9 0.9 1.1 0.9 0.2 0.3 (0.1) (0.2)Thailand........................................................ 0.0 0.1 0.4 0.1 0.2 0.4 0.1 0.3 0.1Turkey........................................................... 1.0 1.4 1.3 1.7 0.9 0.3 0.4 (0.1) (0.7)Ukraine.......................................................... *** *** *** *** *** *** *** *** ***Vietnam......................................................... 0.0 0.6 1.8 1.9 1.3 1.8 0.6 1.2 (0.6)
Subtotal, subject......................................... 11.8 15.8 17.5 18.1 18.6 5.8 4.1 1.7 0.5All others sources, nonsubject....................... 29.9 26.0 27.6 26.0 21.7 (2.3) (3.9) 1.7 (4.3)
Total imports........................................... 41.6 41.8 45.1 44.0 40.3 3.5 0.2 3.4 (3.8)
U.S. imports from:India: C D E F G
IMPsta Quantity......................................................... *** *** *** *** *** 9 *** *** *** ***IMPsta Value............................................................. *** *** *** *** *** 60 *** *** *** ***
200 Unit value...................................................... *** *** *** *** *** 61 *** *** *** ***200 Ending inventory quantity.............................. *** *** *** *** *** 250 *** *** *** ***
Korea:IMPsta Quantity......................................................... *** *** *** *** *** 10 *** *** *** ***IMPsta Value............................................................. *** *** *** *** *** 61 *** *** *** ***
200 Unit value...................................................... *** *** *** *** *** 131 *** *** *** ***200 Ending inventory quantity.............................. *** *** *** *** *** 320 *** *** *** ***
PhilippinesIMPsta Quantity......................................................... 0 23,933 70,166 17,900 11,399 11 fn2 fn2 193.2 (36.3)IMPsta Value............................................................. 0 21,542 64,973 16,992 9,223 62 fn2 fn2 201.6 (45.7)
200 Unit value...................................................... $0.00 $900.07 $925.99 $949.30 $809.13 201 fn2 fn2 2.9 (14.8)200 Ending inventory quantity.............................. *** *** *** *** *** 390 *** *** *** ***
Saudi Arabia C D E F GIMPsta Quantity......................................................... *** *** *** *** *** 12 *** *** *** ***IMPsta Value............................................................. *** *** *** *** *** 63 *** *** *** ***
200 Unit value...................................................... *** *** *** *** *** 271 *** *** *** ***200 Ending inventory quantity.............................. *** *** *** *** *** 460 *** *** *** ***
Taiwan:IMPsta Quantity......................................................... 56,594 96,403 106,576 33,664 25,973 13 88.3 70.3 10.6 (22.8)IMPsta Value............................................................. 47,697 90,113 98,124 32,581 20,643 64 105.7 88.9 8.9 (36.6)
200 Unit value...................................................... $842.78 $934.76 $920.69 $967.81 $794.80 341 9.2 10.9 (1.5) (17.9)200 Ending inventory quantity.............................. *** *** *** *** *** 530 *** *** *** ***
Thailand:IMPsta Quantity......................................................... 0 6,135 31,833 2,662 3,424 14 fn2 fn2 418.9 28.6IMPsta Value............................................................. 0 8,053 43,815 3,769 4,593 65 fn2 fn2 444.1 21.9
200 Unit value...................................................... $0.00 $1,312.51 $1,376.41 $1,415.97 $1,341.35 411 fn2 fn2 4.9 (5.3)200 Ending inventory quantity.............................. *** *** *** *** *** 600 *** *** *** ***
Turkey: C D E F GIMPsta Quantity......................................................... 85,222 140,806 152,444 49,481 24,217 15 78.9 65.2 8.3 (51.1)IMPsta Value............................................................. 76,626 133,698 145,153 48,923 22,480 66 89.4 74.5 8.6 (54.0)
200 Unit value...................................................... $899.13 $949.52 $952.18 $988.72 $928.30 481 5.9 5.6 0.3 (6.1)200 Ending inventory quantity.............................. *** *** *** *** *** 670 *** *** *** ***
Ukraine:IMPsta Quantity......................................................... *** *** *** *** *** 16 *** *** *** ***IMPsta Value............................................................. *** *** *** *** *** 67 *** *** *** ***
200 Unit value...................................................... *** *** *** *** *** 551 *** *** *** ***200 Ending inventory quantity.............................. *** *** *** *** *** 740 *** *** *** ***
Vietnam:IMPsta Quantity......................................................... 145 56,697 219,997 59,659 37,561 17 151,705.0 39,022.5 288.0 (37.0)IMPsta Value............................................................. 169 53,923 201,905 55,386 30,822 68 119,647.3 31,880.9 274.4 (44.4)
200 Unit value...................................................... $1,163.46 $951.07 $917.76 $928.38 $820.57 621 (21.1) (18.3) (3.5) (11.6)200 Ending inventory quantity.............................. *** *** *** *** *** 810 *** *** *** ***
Subtotal, subject sources:IMPsta Quantity......................................................... 850,067 1,318,337 1,808,662 476,808 440,036 18 112.8 55.1 37.2 (7.7)IMPsta Value............................................................. 871,927 1,511,511 1,976,638 533,883 448,046 69 126.7 73.4 30.8 (16.1)
200 Unit value...................................................... $1,025.72 $1,146.53 $1,092.87 $1,119.70 $1,018.20 301 6.5 11.8 (4.7) (9.1)200 Ending inventory quantity.............................. 143,927 190,730 323,088 252,892 349,916 880 124.5 32.5 69.4 38.4
All other sources:IMPsta Quantity......................................................... 1,469,206 1,525,975 1,771,959 451,279 307,457 53 20.6 3.9 16.1 (31.9)IMPsta Value............................................................. 2,215,397 2,475,629 3,112,109 766,201 522,974 104 40.5 11.7 25.7 (31.7)
200 Unit value...................................................... $1,507.89 $1,622.33 $1,756.31 $1,697.84 $1,700.97 401 16.5 7.6 8.3 0.2200 Ending inventory quantity.............................. 202,132 188,563 263,085 216,211 221,781 950 30.2 -6.7 39.5 2.6
Total imports:IMPsta Quantity......................................................... 2,319,273 2,844,313 3,580,620 928,087 747,493 54 54.4 22.6 25.9 (19.5)IMPsta Value............................................................. 3,087,325 3,987,139 5,088,748 1,300,084 971,020 105 64.8 29.1 27.6 (25.3)
200 Unit value...................................................... $1,331.16 $1,401.79 $1,421.19 $1,400.82 $1,299.04 501 6.8 5.3 1.4 (7.3)200 Ending inventory quantity.............................. 346,059 379,293 586,173 469,103 571,697 1,090 69.4 9.6 54.5 21.9
(Quantity=short tons; Value=1,000 dollars; Unit values, unit labor costs, and unit expenses=dollars per short ton; Period changes=percent--exceptions noted)
Report data Period changesCalendar year January to March Calendar year
C-3

Table C-1--continuedOCTG: Summary data concerning the U.S. market, 2010-12, January to March 2012, and January to March 2013
Jan-Mar2010 2011 2012 2012 2013 2010-12 2010-11 2011-12 2012-13
U.S. producers':100 Average capacity quantity................................. 5,498,058 5,744,456 5,987,827 1,510,530 1,557,600 274 8.9 4.5 4.2 3.1100 Production quantity........................................... 2,885,247 3,484,953 3,772,030 1,052,237 1,018,330 276 30.7 20.8 8.2 (3.2)100 Capacity utilization (fn1)................................... 52.5 60.7 63.0 69.7 65.4 222 10.5 8.2 2.3 (4.3)
U.S. shipments:100 Quantity......................................................... 2,693,471 3,285,076 3,580,076 947,215 918,164 302 32.9 22.0 9.0 (3.1)100 Value............................................................. 4,327,473 5,552,852 6,182,032 1,651,895 1,440,242 303 42.9 28.3 11.3 (12.8)100 Unit value...................................................... $1,606.65 $1,690.33 $1,726.79 $1,743.95 $1,568.61 234 7.5 5.2 2.2 (10.1)
Export shipments:100 Quantity......................................................... 138,884 176,942 209,383 59,175 42,311 283 50.8 27.4 18.3 (28.5)100 Value............................................................. 246,448 312,802 360,989 108,192 70,838 284 46.5 26.9 15.4 (34.5)100 Unit value...................................................... $1,774.49 $1,767.82 $1,724.06 $1,828.34 $1,674.22 230 (2.8) (0.4) (2.5) (8.4)100 Ending inventory quantity................................. 376,911 406,604 382,718 448,792 439,450 285 1.5 7.9 (5.9) (2.1)100 Inventories/total shipments (fn1)....................... 13.3 11.7 10.1 11.1 11.4 320 (3.2) (1.6) (1.6) 0.3100 Production workers........................................... 6,002 6,731 7,453 7,314 7,460 288 24.2 12.1 10.7 2.0100 Hours worked (1,000s)...................................... 12,664 14,286 16,115 4,051 4,098 289 27.3 12.8 12.8 1.2100 Wages paid ($1,000)........................................ 345,473 392,447 468,398 120,805 120,087 290 35.6 13.6 19.4 (0.6)100 Productivity (short tons per 1,000 hours)........... 227.8 243.9 234.1 259.7 248.5 254 2.7 7.1 (4.0) (4.3)100 Unit labor costs................................................. $119.74 $112.61 $124.18 $114.81 $117.93 256 3.7 (6.0) 10.3 2.7
Net Sales:100 Quantity......................................................... 2,833,732 3,452,493 3,783,341 1,007,413 974,262 551 33.5 21.8 9.6 (3.3)100 Value............................................................. 4,575,093 5,856,742 6,540,357 1,761,115 1,527,795 555 43.0 28.0 11.7 (13.2)100 Unit value...................................................... $1,614.51 $1,696.38 $1,728.73 $1,748.16 $1,568.16 503 7.1 5.1 1.9 (10.3)100 Cost of goods sold (COGS).............................. 3,534,745 4,778,097 5,415,994 1,366,849 1,317,025 559 53.2 35.2 13.4 (3.6)100 Gross profit or (loss)......................................... 1,040,347 1,078,645 1,124,363 394,266 210,770 560 8.1 3.7 4.2 (46.5)100 SG&A expenses............................................... 419,820 433,528 485,412 113,217 121,698 563 15.6 3.3 12.0 7.5100 Operating income or (loss)................................ 620,526 645,117 638,951 281,048 89,072 564 3.0 4.0 (1.0) (68.3)100 Capital expenditures......................................... 269,004 711,067 616,900 130,745 88,413 691 129.3 164.3 (13.2) (32.4)100 Unit COGS....................................................... $1,247.38 $1,383.96 $1,431.54 $1,356.79 $1,351.82 536 14.8 10.9 3.4 (0.4)100 Unit SG&A expenses........................................ $148.15 $125.57 $128.30 $112.38 $124.91 540 (13.4) (15.2) 2.2 11.1100 Unit operating income or (loss)......................... $218.98 $186.86 $168.89 $278.98 $91.43 541 (22.9) (14.7) (9.6) (67.2)100 COGS/sales (fn1)............................................. 77.3 81.6 82.8 77.6 86.2 517 5.5 4.3 1.2 8.6100 Operating income or (loss)/sales (fn1).............. 13.6 11.0 9.8 16.0 5.8 522 (3.8) (2.5) (1.2) (10.1)
fn1.--Report data are in percent and period changes are in percentage points.fn2.--Undefined.
Source: Compiled from data submitted in response to Commission questionnaires and from official Commerce statistics.
(Quantity=short tons; Value=1,000 dollars; Unit values, unit labor costs, and unit expenses=dollars per short ton; Period changes=percent--exceptions noted)
Report data Period changesCalendar year January to March Calendar year
C-4
C‐5
Table C‐2 OCTG (toll): Summary data concerning the U.S. market, 2010‐12, January to March 2012, and January to March 2013
* * * * * * *

Table C-3OCTG (Seamless): Summary data concerning the U.S. market, 2010-12, January to March 2012, and January to March 2013
Jan-Mar2010 2011 2012 2012 2013 2010-12 2010-11 2011-12 2012-13
U.S. consumption quantity:Amount............................................................. *** *** *** *** *** *** *** *** ***Producers' share (fn1)....................................... *** *** *** *** *** *** *** *** ***Importers' share (fn1):
India.............................................................. *** *** *** *** *** *** *** *** ***Korea............................................................. *** *** *** *** *** *** *** *** ***Philippines..................................................... *** *** *** *** *** *** *** *** ***Saudi Arabia.................................................. *** *** *** *** *** *** *** *** ***Taiwan........................................................... *** *** *** *** *** *** *** *** ***Thailand........................................................ *** *** *** *** *** *** *** *** ***Turkey........................................................... *** *** *** *** *** *** *** *** ***Ukraine.......................................................... *** *** *** *** *** *** *** *** ***Vietnam......................................................... *** *** *** *** *** *** *** *** ***
Subtotal, subject......................................... *** *** *** *** *** *** *** *** ***All others sources, nonsubject....................... *** *** *** *** *** *** *** *** ***
Total imports........................................... *** *** *** *** *** *** *** *** ***
U.S. consumption value:Amount............................................................. *** *** *** *** *** *** *** *** ***Producers' share (fn1)....................................... *** *** *** *** *** *** *** *** ***Importers' share (fn1):
India.............................................................. *** *** *** *** *** *** *** *** ***Korea............................................................. *** *** *** *** *** *** *** *** ***Philippines..................................................... *** *** *** *** *** *** *** *** ***Saudi Arabia.................................................. *** *** *** *** *** *** *** *** ***Taiwan........................................................... *** *** *** *** *** *** *** *** ***Thailand........................................................ *** *** *** *** *** *** *** *** ***Turkey........................................................... *** *** *** *** *** *** *** *** ***Ukraine.......................................................... *** *** *** *** *** *** *** *** ***Vietnam......................................................... *** *** *** *** *** *** *** *** ***
Subtotal, subject......................................... *** *** *** *** *** *** *** *** ***All others sources, nonsubject....................... *** *** *** *** *** *** *** *** ***
Total imports........................................... *** *** *** *** *** *** *** *** ***
U.S. imports from:India: C D E F G
IMPsta Quantity......................................................... *** *** *** *** *** 9 *** *** *** ***IMPsta Value............................................................. *** *** *** *** *** 60 *** *** *** ***
200 Unit value...................................................... *** *** *** *** *** 61 *** *** *** ***Korea:
IMPsta Quantity......................................................... *** *** *** *** *** 10 *** *** *** ***IMPsta Value............................................................. *** *** *** *** *** 61 *** *** *** ***
200 Unit value...................................................... *** *** *** *** *** 131 *** *** *** ***Philippines
IMPsta Quantity......................................................... *** *** *** *** *** 11 *** *** *** ***IMPsta Value............................................................. *** *** *** *** *** 62 *** *** *** ***
200 Unit value...................................................... *** *** *** *** *** 201 *** *** *** ***Saudi Arabia C D E F G
IMPsta Quantity......................................................... *** *** *** *** *** 12 *** *** *** ***IMPsta Value............................................................. *** *** *** *** *** 63 *** *** *** ***
200 Unit value...................................................... *** *** *** *** *** 271 *** *** *** ***Taiwan:
IMPsta Quantity......................................................... *** *** *** *** *** 13 *** *** *** ***IMPsta Value............................................................. *** *** *** *** *** 64 *** *** *** ***
200 Unit value...................................................... *** *** *** *** *** 341 *** *** *** ***Thailand:
IMPsta Quantity......................................................... *** *** *** *** *** 14 *** *** *** ***IMPsta Value............................................................. *** *** *** *** *** 65 *** *** *** ***
200 Unit value...................................................... *** *** *** *** *** 411 *** *** *** ***Turkey: C D E F G
IMPsta Quantity......................................................... *** *** *** *** *** 15 *** *** *** ***IMPsta Value............................................................. *** *** *** *** *** 66 *** *** *** ***
200 Unit value...................................................... *** *** *** *** *** 481 *** *** *** ***Ukraine:
IMPsta Quantity......................................................... *** *** *** *** *** 16 *** *** *** ***IMPsta Value............................................................. *** *** *** *** *** 67 *** *** *** ***
200 Unit value...................................................... *** *** *** *** *** 551 *** *** *** ***Vietnam:
IMPsta Quantity......................................................... *** *** *** *** *** 17 *** *** *** ***IMPsta Value............................................................. *** *** *** *** *** 68 *** *** *** ***
200 Unit value...................................................... *** *** *** *** *** 621 *** *** *** ***Subtotal, subject sources:
IMPsta Quantity......................................................... *** *** *** *** *** 18 *** *** *** ***IMPsta Value............................................................. *** *** *** *** *** 69 *** *** *** ***
200 Unit value...................................................... *** *** *** *** *** 301 *** *** *** ***All other sources:
IMPsta Quantity......................................................... *** *** *** *** *** 53 *** *** *** ***IMPsta Value............................................................. *** *** *** *** *** 104 *** *** *** ***
200 Unit value...................................................... *** *** *** *** *** 401 *** *** *** ***Total imports:
IMPsta Quantity......................................................... *** *** *** *** *** 54 *** *** *** ***IMPsta Value............................................................. *** *** *** *** *** 105 *** *** *** ***
200 Unit value...................................................... *** *** *** *** *** 501 *** *** *** ***
U.S. producers':U.S. shipments:
100 Quantity......................................................... 1,284,686 1,468,507 1,525,230 401,478 381,076 302 18.7 14.3 3.9 (5.1)100 Value............................................................. 2,379,864 2,827,714 3,075,821 801,570 694,056 303 29.2 18.8 8.8 (13.4)100 Unit value...................................................... $1,852.49 $1,925.57 $2,016.63 $1,996.55 $1,821.31 234 8.9 3.9 4.7 (8.8)
fn1.--Report data are in percent and period changes are in percentage points.fn2.--Undefined.
Source: Compiled from data submitted in response to Commission questionnaires and from official Commerce statistics.
C-6
(Quantity=short tons; Value=1,000 dollars; Unit values=dollars per short ton; Period changes=percent--exceptions noted)
Report data Period changesCalendar year January to March Calendar year

Table C-4OCTG (Welded): Summary data concerning the U.S. market, 2010-12, January to March 2012, and January to March 2013
Jan-Mar2010 2011 2012 2012 2013 2010-12 2010-11 2011-12 2012-13
U.S. consumption quantity:Amount............................................................. *** *** *** *** *** *** *** *** ***Producers' share (fn1)....................................... *** *** *** *** *** *** *** *** ***Importers' share (fn1):
India.............................................................. *** *** *** *** *** *** *** *** ***Korea............................................................. *** *** *** *** *** *** *** *** ***Philippines..................................................... *** *** *** *** *** *** *** *** ***Saudi Arabia.................................................. *** *** *** *** *** *** *** *** ***Taiwan........................................................... *** *** *** *** *** *** *** *** ***Thailand........................................................ *** *** *** *** *** *** *** *** ***Turkey........................................................... *** *** *** *** *** *** *** *** ***Ukraine.......................................................... *** *** *** *** *** *** *** *** ***Vietnam......................................................... *** *** *** *** *** *** *** *** ***
Subtotal, subject......................................... *** *** *** *** *** *** *** *** ***All others sources, nonsubject....................... *** *** *** *** *** *** *** *** ***
Total imports........................................... *** *** *** *** *** *** *** *** ***
U.S. consumption value:Amount............................................................. *** *** *** *** *** *** *** *** ***Producers' share (fn1)....................................... *** *** *** *** *** *** *** *** ***Importers' share (fn1):
India.............................................................. *** *** *** *** *** *** *** *** ***Korea............................................................. *** *** *** *** *** *** *** *** ***Philippines..................................................... *** *** *** *** *** *** *** *** ***Saudi Arabia.................................................. *** *** *** *** *** *** *** *** ***Taiwan........................................................... *** *** *** *** *** *** *** *** ***Thailand........................................................ *** *** *** *** *** *** *** *** ***Turkey........................................................... *** *** *** *** *** *** *** *** ***Ukraine.......................................................... *** *** *** *** *** *** *** *** ***Vietnam......................................................... *** *** *** *** *** *** *** *** ***
Subtotal, subject......................................... *** *** *** *** *** *** *** *** ***All others sources, nonsubject....................... *** *** *** *** *** *** *** *** ***
Total imports........................................... *** *** *** *** *** *** *** *** ***
U.S. imports from:India: C D E F G
IMPsta Quantity......................................................... *** *** *** *** *** 9 *** *** *** ***IMPsta Value............................................................. *** *** *** *** *** 54 *** *** *** ***
200 Unit value...................................................... *** *** *** *** *** 55 *** *** *** ***Korea:
IMPsta Quantity......................................................... *** *** *** *** *** 10 *** *** *** ***IMPsta Value............................................................. *** *** *** *** *** 55 *** *** *** ***
200 Unit value...................................................... *** *** *** *** *** 125 *** *** *** ***Philippines
IMPsta Quantity......................................................... *** *** *** *** *** 11 *** *** *** ***IMPsta Value............................................................. *** *** *** *** *** 56 *** *** *** ***
200 Unit value...................................................... *** *** *** *** *** 195 *** *** *** ***Saudi Arabia C D E F G
IMPsta Quantity......................................................... *** *** *** *** *** 12 *** *** *** ***IMPsta Value............................................................. *** *** *** *** *** 57 *** *** *** ***
200 Unit value...................................................... *** *** *** *** *** 265 *** *** *** ***Taiwan:
IMPsta Quantity......................................................... *** *** *** *** *** 13 *** *** *** ***IMPsta Value............................................................. *** *** *** *** *** 58 *** *** *** ***
200 Unit value...................................................... *** *** *** *** *** 335 *** *** *** ***Thailand:
IMPsta Quantity......................................................... *** *** *** *** *** 14 *** *** *** ***IMPsta Value............................................................. *** *** *** *** *** 59 *** *** *** ***
200 Unit value...................................................... *** *** *** *** *** *** *** *** ***Turkey: C D E F G
IMPsta Quantity......................................................... *** *** *** *** *** 15 *** *** *** ***IMPsta Value............................................................. *** *** *** *** *** 60 *** *** *** ***
200 Unit value...................................................... *** *** *** *** *** 70 *** *** *** ***Ukraine:
IMPsta Quantity......................................................... *** *** *** *** *** 16 *** *** *** ***IMPsta Value............................................................. *** *** *** *** *** 61 *** *** *** ***
200 Unit value...................................................... *** *** *** *** *** 140 *** *** *** ***Vietnam:
IMPsta Quantity......................................................... *** *** *** *** *** 17 *** *** *** ***IMPsta Value............................................................. *** *** *** *** *** 62 *** *** *** ***
200 Unit value...................................................... *** *** *** *** *** 210 *** *** *** ***Subtotal, subject sources:
IMPsta Quantity......................................................... *** *** *** *** *** 18 *** *** *** ***IMPsta Value............................................................. *** *** *** *** *** 63 *** *** *** ***
200 Unit value...................................................... *** *** *** *** *** 295 *** *** *** ***All other sources:
IMPsta Quantity......................................................... *** *** *** *** *** 47 *** *** *** ***IMPsta Value............................................................. *** *** *** *** *** 92 *** *** *** ***
200 Unit value...................................................... *** *** *** *** *** 395 *** *** *** ***Total imports:
IMPsta Quantity......................................................... *** *** *** *** *** 48 *** *** *** ***IMPsta Value............................................................. *** *** *** *** *** 93 *** *** *** ***
200 Unit value...................................................... *** *** *** *** *** 495 *** *** *** ***
U.S. producers':U.S. shipments:
100 Quantity......................................................... 1,408,785 1,816,569 2,054,846 545,737 537,088 302 45.9 28.9 13.1 (1.6)100 Value............................................................. 1,947,608 2,725,139 3,106,211 850,325 746,186 303 59.5 39.9 14.0 (12.2)100 Unit value...................................................... $1,382.47 $1,500.16 $1,511.65 $1,558.12 $1,389.32 234 9.3 8.5 0.8 (10.8)
fn1.--Report data are in percent and period changes are in percentage points.fn2.--Undefined.
Source: Compiled from data submitted in response to Commission questionnaires and from official Commerce statistics.
C-7
(Quantity=short tons; Value=1,000 dollars; Unit values=dollars per short ton; Period changes=percent--exceptions noted)
Report data Period changesCalendar year January to March Calendar year


D‐1
APPENDIX D
QUARTERLY NONSUBJECT‐COUNTRY PRICE DATA


D‐3
Three importers reported price data for nonsubject country Canada (***) for products 2
through 6. Importer price data accounted for *** percent of U.S. imports from Canada over
January 2010‐ March 2013. These price items and accompanying data are comparable to those
presented in tables V‐5 to V‐9. Price and quantity data for the United States, the relevant
subject countries, and Canada are shown in table D‐1 and in figures D‐1 to D‐5 (with domestic
and subject sources).
Prices for OCTG imported from Canada were lower than prices for domestically
produced OCTG in 44 of 52 possible comparisons by margins of 1.5 to 27.9 percent. Prices for
OCTG imported from Canada were higher than prices for domestically produced OCTG in 8 of
52 comparisons, by margins of 0.8 to 12.7 percent.
Prices for imported OCTG from Canada were lower than prices for product imported
from subject countries in 39 of 109 possible instances and higher in 70 of 109 possible
instances. The greatest number of comparisons were available between prices of Canadian
products and those from Korea and Turkey. Imports of OCTG from Canada were priced below
those of OCTG from Korea in 10 of 42 instances and higher in 32 of 42 instances. Imports of
OCTG from Canada were also priced below those from Turkey in 7 of 33 instances, and above in
26 of 33 instances.

D‐4
Table D-1 OCTG: Weighted-average f.o.b. prices and quantities from nonsubject source Canada, products 2-6,1 by quarters, January 2010-March 2013
Period
Product 2 Product 3 Product 4Price (dollars
per ton) Quantity
(tons)Price (dollars
per ton)Quantity
(tons)Price (dollars
per ton) Quantity
(tons)2010: Jan.-Mar. $*** *** $*** *** $*** *** Apr.-Jun. *** *** -- 0 *** *** Jul.-Sept. *** *** -- 0 *** *** Oct.-Dec. *** *** *** *** *** *** 2011: Jan.-Mar. *** *** *** *** -- 0 Apr.-Jun. *** *** *** *** -- 0 Jul.-Sept. -- 0 *** *** -- 0 Oct.-Dec. *** *** -- 0 -- 0 2012: Jan.-Mar. *** *** -- 0 *** *** Apr.-Jun. *** *** -- 0 *** *** Jul.-Sept. *** *** *** *** *** *** Oct.-Dec. *** *** -- 0 *** *** 2013: Jan.-Mar. *** *** *** *** *** ***
Period
Product 5 Product 6Price (dollars
per ton) Quantity
(tons)Price (dollars
per ton)Quantity
(tons)2010: Jan.-Mar. $*** *** $*** *** Apr.-Jun. *** *** *** *** Jul.-Sept. *** *** *** *** Oct.-Dec. *** *** *** *** 2011: Jan.-Mar. *** *** *** *** Apr.-Jun. -- 0 *** *** Jul.-Sept. *** *** 1,197 4,420 Oct.-Dec. -- 0 1,275 3,329 2012: Jan.-Mar. *** *** *** *** Apr.-Jun. *** *** *** *** Jul.-Sept. *** *** *** *** Oct.-Dec. *** *** *** *** 2013: Jan.-Mar. *** *** *** *** 1 Product 2.-- Tubing, Grade J-55, 2 3/8" O.D., 4.7 lbs./ft., threaded and coupled, range 2, welded. Product 3.-- Casing, Grade J-55, 5 ½" O.D., 17.0 lbs./ft., threaded and coupled, range 3, welded. Product 4.-- Casing, Grade P-110, 5 ½" O.D., 17.0 lbs./ft., threaded and coupled, range 3, seamless. Product 5.-- Casing, Grade J-55, 8 5/8" O.D., 32.0 lbs./ft., threaded and coupled, range 3, welded. Product 6.-- Casing, Grade J-55, 9 5/8" O.D., 36.0 lbs./ft., threaded and coupled, range 3, welded. Source: Compiled from data submitted in response to Commission questionnaires.

D‐5
Figure D-1 OCTG: Weighted-average f.o.b. prices and quantities of domestic product 2,1 by quarter, January 2010-March 2013
* * * * * * *
Figure D-2 OCTG: Weighted-average f.o.b. prices and quantities of domestic and imported product 3, by quarter, January 2010-March 2013
* * * * * * *
Figure D-3 OCTG: Weighted-average f.o.b. prices and quantities of domestic and imported product 4, by quarter, January 2010-March 2013
* * * * * * *
Figure D-4 OCTG: Weighted-average f.o.b. prices and quantities of domestic and imported product 5, by quarter, January 2010-March 2013
* * * * * * *
Figure D-5 OCTG: Weighted-average f.o.b. prices and quantities of domestic and imported product 6, by quarter, January 2010-March 2013
* * * * * * *
Table D-2 OCTG: Number of quarters that prices for OCTG from Canada were lower and higher than subject product prices
Comparison country Number of quarters of lower prices
for OCTG from Canada Number of quarters of higher prices for OCTG from Canada
United States 44 8
Korea 10 32
Philippines 2 2
Saudi Arabia 4 1
Taiwan 3 2
Thailand 1 1 Turkey 7 26 Ukraine 5 1 Vietnam 7 5 Total 39 70 Source: Compiled from data submitted in response to Commission questionnaires.


