Certain Lined Paper School Supplies from China, India, · PDF fileAntidumping investigations...
218
U.S. International Trade Commission Publication 4344 August 2012 Washington, DC 20436 Certain Lined Paper School Supplies from China, India, and Indonesia Investigation Nos. 701-TA-442-443 and 731-TA-1095-1097 (Review)
-
Upload
trankhuong -
Category
Documents
-
view
218 -
download
2
Transcript of Certain Lined Paper School Supplies from China, India, · PDF fileAntidumping investigations...

U.S. International Trade CommissionPublication 4344 August 2012
Washington, DC 20436
Certain Lined Paper School Supplies from China, India, and Indonesia
Investigation Nos. 701-TA-442-443 and 731-TA-1095-1097 (Review)

U.S. International Trade Commission
COMMISSIONERS
Irving A. Williamson, Chairman Deanna Tanner Okun
Daniel R. Pearson Shara L. Aranoff Dean A. Pinkert
David S. Johanson
Robert B. Koopman
Staff assigned
Address all communications to Secretary to the Commission
United States International Trade Commission Washington, DC 20436
Director, Office of Operations
Amy Sherman, Investigator Alberto Goetzl, Industry Analyst
Aimee Larsen, Economist Mary Klir, Accountant
Marc Bernstein, Attorney Steven Hudgens, Senior Statistician
Elizabeth Haines, Supervisory Investigator

U.S. International Trade CommissionWashington, DC 20436
www.usitc.gov
Publication 4344 August 2012
Certain Lined Paper School Supplies from China, India, and Indonesia
Investigation Nos. 701-TA-442-443 and 731-TA-1095-1097 (Review)


CONTENTS
Page
Determinations . . . . . . . . . . . . . . . . . . . . . . . . . . . . . . . . . . . . . . . . . . . . . . . . . . . . . . . . . . . . . . . . . 1Views of the Commission . . . . . . . . . . . . . . . . . . . . . . . . . . . . . . . . . . . . . . . . . . . . . . . . . . . . . . . . . 3Separate Views of Commissioner Shara L. Aranoff on Cumulation . . . . . . . . . . . . . . . . . . . . . . 43Concurring Views of Commissioner Dean A. Pinkert on CLPSS from Indonesia . . . . . . . . . . 47Additional and Dissenting Views of Commissioners Deanna Tanner Okun, Daniel R. Pearsonand David S. Johanson . . . . . . . . . . . . . . . . . . . . . . . . . . . . . . . . . . . . . . . . . . . . . . . . . . . . . . . . . . 51Separate and Dissenting Views of Chairman Irving A. Williamson . . . . . . . . . . . . . . . . . . . . . . 61
Part I: Introduction and overview . . . . . . . . . . . . . . . . . . . . . . . . . . . . . . . . . . . . . . . . . . . . . . . . . I-1Background . . . . . . . . . . . . . . . . . . . . . . . . . . . . . . . . . . . . . . . . . . . . . . . . . . . . . . . . . . . . . . . . . . I-1The original investigations . . . . . . . . . . . . . . . . . . . . . . . . . . . . . . . . . . . . . . . . . . . . . . . . . . . . . . I-2Statutory criteria . . . . . . . . . . . . . . . . . . . . . . . . . . . . . . . . . . . . . . . . . . . . . . . . . . . . . . . . . . . . . . I-2Summary data . . . . . . . . . . . . . . . . . . . . . . . . . . . . . . . . . . . . . . . . . . . . . . . . . . . . . . . . . . . . . . . . I-4Commerce’s reviews . . . . . . . . . . . . . . . . . . . . . . . . . . . . . . . . . . . . . . . . . . . . . . . . . . . . . . . . . . . I-9
Administrative reviews . . . . . . . . . . . . . . . . . . . . . . . . . . . . . . . . . . . . . . . . . . . . . . . . . . . . . . I-9Changed circumstances review . . . . . . . . . . . . . . . . . . . . . . . . . . . . . . . . . . . . . . . . . . . . . . . . I-13Results of five-year reviews . . . . . . . . . . . . . . . . . . . . . . . . . . . . . . . . . . . . . . . . . . . . . . . . . . I-14
The subject merchandise . . . . . . . . . . . . . . . . . . . . . . . . . . . . . . . . . . . . . . . . . . . . . . . . . . . . . . . . I-16Commerce’s scope . . . . . . . . . . . . . . . . . . . . . . . . . . . . . . . . . . . . . . . . . . . . . . . . . . . . . . . . . . I-16Tariff treatment . . . . . . . . . . . . . . . . . . . . . . . . . . . . . . . . . . . . . . . . . . . . . . . . . . . . . . . . . . . . I-18
The product . . . . . . . . . . . . . . . . . . . . . . . . . . . . . . . . . . . . . . . . . . . . . . . . . . . . . . . . . . . . . . . . . . I-20Physical characteristics and uses . . . . . . . . . . . . . . . . . . . . . . . . . . . . . . . . . . . . . . . . . . . . . . . I-20Manufacturing processes . . . . . . . . . . . . . . . . . . . . . . . . . . . . . . . . . . . . . . . . . . . . . . . . . . . . . I-21
Domestic like product issues . . . . . . . . . . . . . . . . . . . . . . . . . . . . . . . . . . . . . . . . . . . . . . . . . . . . I-23U.S. market participants . . . . . . . . . . . . . . . . . . . . . . . . . . . . . . . . . . . . . . . . . . . . . . . . . . . . . . . . I-23
U.S. producers . . . . . . . . . . . . . . . . . . . . . . . . . . . . . . . . . . . . . . . . . . . . . . . . . . . . . . . . . . . . . I-23U.S. importers . . . . . . . . . . . . . . . . . . . . . . . . . . . . . . . . . . . . . . . . . . . . . . . . . . . . . . . . . . . . . I-24U.S. purchasers . . . . . . . . . . . . . . . . . . . . . . . . . . . . . . . . . . . . . . . . . . . . . . . . . . . . . . . . . . . . I-26
Apparent U.S. consumption and market shares . . . . . . . . . . . . . . . . . . . . . . . . . . . . . . . . . . . . . . I-26
Part II: Conditions of competition in the U.S. market . . . . . . . . . . . . . . . . . . . . . . . . . . . . . . . . II-1U.S. market characteristics . . . . . . . . . . . . . . . . . . . . . . . . . . . . . . . . . . . . . . . . . . . . . . . . . . . . . . II-1Channels of distribution . . . . . . . . . . . . . . . . . . . . . . . . . . . . . . . . . . . . . . . . . . . . . . . . . . . . . . . . II-1Geographic distribution . . . . . . . . . . . . . . . . . . . . . . . . . . . . . . . . . . . . . . . . . . . . . . . . . . . . . . . . II-2Supply and demand considerations . . . . . . . . . . . . . . . . . . . . . . . . . . . . . . . . . . . . . . . . . . . . . . . . II-2
U.S. supply . . . . . . . . . . . . . . . . . . . . . . . . . . . . . . . . . . . . . . . . . . . . . . . . . . . . . . . . . . . . . . . II-2U.S. demand . . . . . . . . . . . . . . . . . . . . . . . . . . . . . . . . . . . . . . . . . . . . . . . . . . . . . . . . . . . . . . II-6
Substitutability issues . . . . . . . . . . . . . . . . . . . . . . . . . . . . . . . . . . . . . . . . . . . . . . . . . . . . . . . . . . II-8Factors affecting purchasing decisions . . . . . . . . . . . . . . . . . . . . . . . . . . . . . . . . . . . . . . . . . . II-8Comparison of domestic product, subject imports, and nonsubject imports . . . . . . . . . . . . . . II-13
Elasticity estimates . . . . . . . . . . . . . . . . . . . . . . . . . . . . . . . . . . . . . . . . . . . . . . . . . . . . . . . . . . . . II-18U.S. supply elasticity . . . . . . . . . . . . . . . . . . . . . . . . . . . . . . . . . . . . . . . . . . . . . . . . . . . . . . . . II-18U.S. demand elasticity . . . . . . . . . . . . . . . . . . . . . . . . . . . . . . . . . . . . . . . . . . . . . . . . . . . . . . . II-19Substitution elasticity . . . . . . . . . . . . . . . . . . . . . . . . . . . . . . . . . . . . . . . . . . . . . . . . . . . . . . . II-19
i

CONTENTS
Page
Part III: Condition of the U.S. industry . . . . . . . . . . . . . . . . . . . . . . . . . . . . . . . . . . . . . . . . . . . . III-1Overview . . . . . . . . . . . . . . . . . . . . . . . . . . . . . . . . . . . . . . . . . . . . . . . . . . . . . . . . . . . . . . . . . . . . III-1
Background . . . . . . . . . . . . . . . . . . . . . . . . . . . . . . . . . . . . . . . . . . . . . . . . . . . . . . . . . . . . . . . III-1Changes experienced in operations . . . . . . . . . . . . . . . . . . . . . . . . . . . . . . . . . . . . . . . . . . . . . III-1Anticipated changes in operations . . . . . . . . . . . . . . . . . . . . . . . . . . . . . . . . . . . . . . . . . . . . . . III-2
U.S. capacity, production, and capacity utilization . . . . . . . . . . . . . . . . . . . . . . . . . . . . . . . . . . . III-2U.S. producers’ shipments . . . . . . . . . . . . . . . . . . . . . . . . . . . . . . . . . . . . . . . . . . . . . . . . . . . . . . III-3U.S. producers’ inventories . . . . . . . . . . . . . . . . . . . . . . . . . . . . . . . . . . . . . . . . . . . . . . . . . . . . . III-5U.S. producers’ imports and purchases . . . . . . . . . . . . . . . . . . . . . . . . . . . . . . . . . . . . . . . . . . . . . III-5U.S. employment, wages, and productivity . . . . . . . . . . . . . . . . . . . . . . . . . . . . . . . . . . . . . . . . . III-5Financial experience of the U.S. producers . . . . . . . . . . . . . . . . . . . . . . . . . . . . . . . . . . . . . . . . . III-7
Introduction . . . . . . . . . . . . . . . . . . . . . . . . . . . . . . . . . . . . . . . . . . . . . . . . . . . . . . . . . . . . . . . III-7Operations on LPP . . . . . . . . . . . . . . . . . . . . . . . . . . . . . . . . . . . . . . . . . . . . . . . . . . . . . . . . . . III-7Capital expenditures and research and development expenses . . . . . . . . . . . . . . . . . . . . . . . . III-9Assets and return on investment . . . . . . . . . . . . . . . . . . . . . . . . . . . . . . . . . . . . . . . . . . . . . . . III-9
Part IV: U.S. imports and the foreign industry . . . . . . . . . . . . . . . . . . . . . . . . . . . . . . . . . . . . . . IV-1U.S. imports . . . . . . . . . . . . . . . . . . . . . . . . . . . . . . . . . . . . . . . . . . . . . . . . . . . . . . . . . . . . . . . . . IV-1
Overview . . . . . . . . . . . . . . . . . . . . . . . . . . . . . . . . . . . . . . . . . . . . . . . . . . . . . . . . . . . . . . . . . IV-1Imports from subject and nonsubject countries . . . . . . . . . . . . . . . . . . . . . . . . . . . . . . . . . . . . IV-2
U.S. importers’ imports subsequent to December 31, 2011 . . . . . . . . . . . . . . . . . . . . . . . . . . . . . IV-7U.S. importers’ inventories . . . . . . . . . . . . . . . . . . . . . . . . . . . . . . . . . . . . . . . . . . . . . . . . . . . . . . IV-7Antidumping investigations in third-country markets . . . . . . . . . . . . . . . . . . . . . . . . . . . . . . . . . IV-7Cumulation considerations . . . . . . . . . . . . . . . . . . . . . . . . . . . . . . . . . . . . . . . . . . . . . . . . . . . . . . IV-7
Geographic markets . . . . . . . . . . . . . . . . . . . . . . . . . . . . . . . . . . . . . . . . . . . . . . . . . . . . . . . . . IV-8Presence in the market . . . . . . . . . . . . . . . . . . . . . . . . . . . . . . . . . . . . . . . . . . . . . . . . . . . . . . . IV-8
The industry in China . . . . . . . . . . . . . . . . . . . . . . . . . . . . . . . . . . . . . . . . . . . . . . . . . . . . . . . . . . IV-11The industry in India . . . . . . . . . . . . . . . . . . . . . . . . . . . . . . . . . . . . . . . . . . . . . . . . . . . . . . . . . . . IV-11
Overview . . . . . . . . . . . . . . . . . . . . . . . . . . . . . . . . . . . . . . . . . . . . . . . . . . . . . . . . . . . . . . . . . IV-11CLPSS operations . . . . . . . . . . . . . . . . . . . . . . . . . . . . . . . . . . . . . . . . . . . . . . . . . . . . . . . . . . IV-12
The industry in Indonesia . . . . . . . . . . . . . . . . . . . . . . . . . . . . . . . . . . . . . . . . . . . . . . . . . . . . . . . IV-16Overview . . . . . . . . . . . . . . . . . . . . . . . . . . . . . . . . . . . . . . . . . . . . . . . . . . . . . . . . . . . . . . . . . IV-16CLPSS operations . . . . . . . . . . . . . . . . . . . . . . . . . . . . . . . . . . . . . . . . . . . . . . . . . . . . . . . . . . IV-16
Global market . . . . . . . . . . . . . . . . . . . . . . . . . . . . . . . . . . . . . . . . . . . . . . . . . . . . . . . . . . . . . . . . IV-17
Part V: Pricing and related information . . . . . . . . . . . . . . . . . . . . . . . . . . . . . . . . . . . . . . . . . . . . V-1Factors affecting prices . . . . . . . . . . . . . . . . . . . . . . . . . . . . . . . . . . . . . . . . . . . . . . . . . . . . . . . . . V-1
Raw material costs . . . . . . . . . . . . . . . . . . . . . . . . . . . . . . . . . . . . . . . . . . . . . . . . . . . . . . . . . . V-1U.S. inland transportation costs . . . . . . . . . . . . . . . . . . . . . . . . . . . . . . . . . . . . . . . . . . . . . . . . V-1
Pricing practices . . . . . . . . . . . . . . . . . . . . . . . . . . . . . . . . . . . . . . . . . . . . . . . . . . . . . . . . . . . . . . V-2Pricing methods . . . . . . . . . . . . . . . . . . . . . . . . . . . . . . . . . . . . . . . . . . . . . . . . . . . . . . . . . . . . V-2Sales terms and discounts . . . . . . . . . . . . . . . . . . . . . . . . . . . . . . . . . . . . . . . . . . . . . . . . . . . . V-2Contract vs. spot sales . . . . . . . . . . . . . . . . . . . . . . . . . . . . . . . . . . . . . . . . . . . . . . . . . . . . . . . V-3
ii

CONTENTS
PagePart V: Pricing and related information–Continued
Price data . . . . . . . . . . . . . . . . . . . . . . . . . . . . . . . . . . . . . . . . . . . . . . . . . . . . . . . . . . . . . . . . . . . V-3Price trends . . . . . . . . . . . . . . . . . . . . . . . . . . . . . . . . . . . . . . . . . . . . . . . . . . . . . . . . . . . . . . . V-4Price comparisons . . . . . . . . . . . . . . . . . . . . . . . . . . . . . . . . . . . . . . . . . . . . . . . . . . . . . . . . . . V-7
Bid data . . . . . . . . . . . . . . . . . . . . . . . . . . . . . . . . . . . . . . . . . . . . . . . . . . . . . . . . . . . . . . . . . . . . V-7
Appendixes
A. Federal Register notices and the Commission’s statement on adequacy . . . . . . . . . . . . . . . . . . A-1B. Hearing witnesses . . . . . . . . . . . . . . . . . . . . . . . . . . . . . . . . . . . . . . . . . . . . . . . . . . . . . . . . . . . . B-1C. Summary data . . . . . . . . . . . . . . . . . . . . . . . . . . . . . . . . . . . . . . . . . . . . . . . . . . . . . . . . . . . . . . . C-1D. Responses of U.S. producers, U.S. importers, U.S. purchasers, and foreign producers
concerning the significance of the antidumping duty and countervailing duty orders and the likely effects of revocation . . . . . . . . . . . . . . . . . . . . . . . . . . . . . . . . . . . . . . . . . . . . . . . . . . . . . D-1
E. U.S. imports by HTS number . . . . . . . . . . . . . . . . . . . . . . . . . . . . . . . . . . . . . . . . . . . . . . . . . . E-1F. Weighted-average prices and quantities of products 4-5, produced and imported by domestic
producers only, and weighted-average prices and quantities of products 4-5 imported by non-producer importers only, and margins of underselling/(overselling) . . . . . . . . . . . . . . . . . . . . . F-1
G. Weighted-average prices and quantities of products 1-4, January 2003-December 2011 . . . . . G-1
Note.--Information that would reveal confidential operations of individual concerns may not be publishedand therefore has been deleted from this report. Such deletions are indicated by asterisks.
iii


1
UNITED STATES INTERNATIONAL TRADE COMMISSION Investigation Nos. 701-TA-442-443 and 731-TA-1095-1097 (Review) CERTAIN LINED PAPER SCHOOL SUPPLIES FROM CHINA, INDIA, AND INDONESIA DETERMINATION
On the basis of the record1 developed in the subject five-year reviews, the United States International Trade Commission (Commission) determines, pursuant to section 751(c) of the Tariff Act of 1930 (19 U.S.C. ' 1675(c)), that revocation of the countervailing duty order on certain lined paper school supplies from India and the antidumping duty orders on certain lined paper school supplies from China and India would be likely to lead to continuation or recurrence of material injury to an industry in the United States within a reasonably foreseeable time.2 The Commission also determines that revocation of the countervailing duty order and antidumping duty order on certain lined paper school supplies from Indonesia would not be likely to lead to continuation or recurrence of material injury to an industry in the United States within a reasonably foreseeable time.3
BACKGROUND
The Commission instituted these reviews on August 1, 2011 (76 FR 45851) and determined on November 4, 2011 that it would conduct full reviews (76 FR 72213, November 22, 2011). Notice of the scheduling of the Commission=s reviews and of a public hearing to be held in connection therewith was given by posting copies of the notice in the Office of the Secretary, U.S. International Trade Commission, Washington, DC, and by publishing the notice in the Federal Register on February 1, 2012 (77 FR 5055). The hearing was held in Washington, DC, on June 12, 2012, and all persons who requested the opportunity were permitted to appear in person or by counsel.
1 The record is defined in sec. 207.2(f) of the Commission=s Rules of Practice and Procedure (19 CFR ' 207.2(f)).
2 Commissioners Okun, Pearson, and Johanson dissent with respect to India.
3 Chairman Williamson dissenting.


VIEWS OF THE COMMISSION
Based on the record in these five-year reviews, we determine under section 751(c) of the TariffAct of 1930, as amended (“the Act”), that revocation of the countervailing duty order on certain linedpaper school supplies (“CLPSS”) from India and the antidumping duty orders on CLPSS from China andIndia would be likely to lead to continuation or recurrence of material injury to an industry in the UnitedStates within a reasonably foreseeable time.1 The Commission further determines, pursuant to section751(c) of the Act, that revocation of the countervailing duty order and the antidumping duty order onCLPSS from Indonesia would not be likely to lead to continuation or recurrence of material injury to anindustry in the United States within a reasonably foreseeable time.2
I. BACKGROUND
In September 2006, the Commission determined that a domestic industry was materially injuredby reason of imports of CLPSS sold at less than fair value from China, India, and Indonesia, andsubsidized by the governments of India and Indonesia.3 On September 28, 2006, Commerce issuedantidumping duty orders on CLPSS from China, India, and Indonesia, and countervailing duty orders onCLPSS from India and Indonesia.4
The Commission instituted these reviews on August 1, 2011.5 Responding to the notice ofinstitution were the Association of American School Paper Suppliers (“AASPS”), an associationconsisting of domestic producers of CLPSS, and Indian producers and exporters FFI International, LodhaOffset Limited, Marisa International, Navneet Publications (India) Ltd., Pioneer Stationery Pvt. Ltd.,Riddhi Enterprises, Sab International, and SGM Paper Products (collectively, the “Indian respondents”),which submitted a joint response. On November 4, 2011, the Commission found each responseindividually adequate. It found the domestic interested party group response adequate, the respondentinterested party group response for the orders on subject imports from India adequate, and the respondentinterested party group responses for the orders on subject imports from China and Indonesia inadequate. The Commission determined to conduct full reviews on the orders on subject imports from India because
1 Commissioners Deanna Tanner Okun, Daniel R. Pearson, and David S. Johanson determine that revocation ofthe antidumping and countervailing duty orders on CLPSS from India would not be likely to lead to continuation orrecurrence of material injury to an industry in the United States within a reasonably foreseeable time. SeeAdditional and Dissenting Views of Commissioners Deanna Tanner Okun, Daniel R. Pearson, and David S.Johanson.
2 Chairman Irving A. Williamson determines that revocation of the antidumping and countervailing duty orderson CLPSS from Indonesia would be likely to lead to continuation or recurrence of material injury to an industry inthe United States within a reasonably foreseeable time. His determination is set forth in these views and his separateopinion. See Separate and Dissenting Views of Chairman Williamson.
3 Certain Lined Paper School Supplies from China, India, and Indonesia, Inv. Nos. 701-TA-442-443, 731-TA-1095-1097 (Final), USITC Pub. 3884 (Sept. 2006) (“Original Determinations”). The Commission made its originalaffirmative final determinations by a split vote, for which the majority findings are summarized below. ChairmanPearson and Commissioners Hillman and Okun made negative determinations respecting imports from India andIndonesia and found that the domestic industry was threatened with material injury by reason of subject imports fromChina. See Separate and Dissenting Views of Chairman Daniel R. Pearson and Commissioners Jennifer A. Hillmanand Deanna Tanner Okun, USITC Pub. 3884 at 51-82.
4 71 Fed. Reg. 56949 (Sept. 28, 2006). Commerce subsequently amended the order on subject imports fromChina to correct a ministerial error. 71 Fed. Reg. 62583 (Oct. 26, 2006).
5 76 Fed. Reg. 48581 (Aug. 1, 2011).
3

of adequate interested party responses and determined to conduct full reviews on the orders on subjectimports from China and Indonesia to promote administrative efficiency.6
The AASPS filed briefs and participated in the hearing. The Indian respondent parties andIndonesian producer and exporter PT Pabrik Kertas Tjiwi Kimia (“Tjiwi”) each filed briefs andparticipated in the hearing.7
In these reviews, domestic industry data are based on questionnaire responses of eight U.S.producers of lined paper products (“LPP”), the domestic like product as defined in the original finaldeterminations, six of which provided usable data. The eight responding producers account for virtuallyall known U.S. production of LPP.8 There were 25 importers of CLPSS, the merchandise defined byCommerce’s scope determination, that responded to the Commission’s questionnaires in these reviews. Responding importers accounted for 2.8 percent of subject imports from China in 2011, 50.0 percent ofsubject imports from India in 2011, and 0.0 percent of subject imports from Indonesia in 2011.9 Importdata in the Commission report are based on official statistics.10 No producer of subject merchandise fromChina responded to the Commission questionnaire.11 Eight producers or exporters of subject merchandisefrom India that are believed to account for *** percent of 2010 Indian CLPSS production responded tothe Commission questionnaire.12 Tjiwi, which estimates it accounted for *** percent of 2011 IndonesianCLPSS production, was the sole producer of subject merchandise from Indonesia to respond to theCommission questionnaire.13 II. DOMESTIC LIKE PRODUCT AND INDUSTRY
A. Domestic Like Product
In making its determination under section 751(c) of the Act, the Commission defines the“domestic like product” and the “industry.”14 The Act defines “domestic like product” as “a productwhich is like, or in the absence of like, most similar in characteristics and uses with, the article subject toan investigation under this subtitle.”15
6 Explanation of Commission Determinations on Adequacy, reprinted in Confidential Staff Report (“CR”)/PublicStaff Report (“PR”) at Appendix A.
7 Indian Respondents violated Commission rule 207.68(c) by submitting new factual information in their FinalComments. 19 C.F.R. § 207.68(c). Consequently, we have disregarded the new information that appears in Exhibit1 of their Final Comments and the first, fourth, fifth, and sixth sentences of the last paragraph starting at the bottomof page 4 of the comments, carrying over to page 5, together with the associated footnotes.
8 CR at I-5; PR at I-4.
9 CR/PR at IV-1.
10 CR at I-5; PR at I-4.
11 CR at IV-13; PR at IV-11.
12 CR at IV-15; PR at IV-12.
13 CR at IV-19; PR at IV-16.
14 19 U.S.C. § 1677(4)(A).
15 19 U.S.C. § 1677(10); see, e.g., Cleo Inc. v. United States, 501 F.3d 1291, 1299 (Fed. Cir. 2007); NEC Corp. v.Department of Commerce, 36 F. Supp. 2d 380, 383 (Ct. Int’l Trade 1998); Nippon Steel Corp. v. United States, 19CIT 450, 455 (1995); Timken Co. v. United States, 913 F. Supp. 580, 584 (Ct. Int’l Trade 1996); Torrington Co. v.United States, 747 F. Supp. 744, 748-49 (Ct. Int’l Trade 1990), aff’d, 938 F.2d 1278 (Fed. Cir. 1991); see also S.Rep. No. 249, 96th Cong., 1st Sess. 90-91 (1979).
4

Commerce has defined the imported merchandise within the scope of the orders under review asfollows:
The scope of these orders includes certain lined paper products, typically school supplies,composed of or including paper that incorporates straight horizontal and/or vertical lineson ten or more paper sheets, including but not limited to such products as single- andmulti-subject notebooks, composition books, wireless notebooks, looseleaf or glued fillerpaper, graph paper, and laboratory notebooks, and with the smaller dimension of thepaper measuring 6 inches to 15 inches (inclusive) and the larger dimension of the papermeasuring 8 3'4 inches to 15 inches (inclusive). Page dimensions are measured size (notadvertised, stated, or ‘‘tear-out’’ size), and are measured as they appear in the product(i.e., stitched and folded pages in a notebook are measured by the size of the page as itappears in the notebook page, not the size of the unfolded paper). However, formeasurement purposes, pages with tapered or rounded edges shall be measured at theirlongest and widest points. Subject lined paper products may be loose, packaged or boundusing any binding method (other than case bound through the inclusion of binders board,a spine strip, and cover wrap). Subject merchandise may or may not contain anycombination of a front cover, a rear cover, and/or backing of any composition, regardlessof the inclusion of images or graphics on the cover, backing, or paper. Subjectmerchandise is within the scope of these orders whether or not the lined paper and/orcover are hole punched, drilled, perforated, and/or reinforced. Subject merchandise maycontain accessory or informational items including but not limited to pockets, tabs,dividers, closure devices, index cards, stencils, protractors, writing implements, referencematerials such as mathematical tables, or printed items such as sticker sheets or miniaturecalendars, if such items are physically incorporated, included with, or attached to theproduct, cover and/or backing thereto.16
In the original preliminary determinations, the Commission defined the domestic like product tobe all lined paper with dimensions including and between 5 inches by 7 inches and 15 inches by 15inches, a broader category than the scope merchandise, CLPSS. Although AASPS argued that thedomestic like product should be defined as CLPSS, the Commission found, for purposes of thepreliminary determinations, that CLPSS and the other lined paper products shared a basic use, namelynote taking and other writing, and shared common channels of distribution and common manufacturingfacilities, production processes, and production employees.17
In the original final determinations, neither AASPS nor any other party argued that the domesticlike product should be defined as CLPSS.18 Instead, party arguments concerned whether the Commissionshould define the domestic like product with the same size limitation specified in the preliminarydeterminations, or whether the Commission should instead include all lined paper products regardless ofdimension in the domestic like product. The Commission adopted the latter definition because it foundno clear dividing line between outsized lined paper products and other lined paper products. The
16 76 Fed. Reg. 76123, 76123-24 (Dec. 6, 2011). The notice lists 15 types of paper products and fourtrademarked items that are outside or specifically excluded from the scope. Id. at 76124. These include unlinedcopy machine paper, lined paper with a pad without a front cover (such as legal pads), index cards, and stenographicpads.
17 Certain Lined Paper School Supplies from China, India, and Indonesia, Inv. Nos. 701-TA-442-443, 731-TA-1095-1097 (Preliminary), USITC Pub. 3811 at 11 (Oct. 2005).
18 Original Determinations, USITC Pub. 3884 at 6.
5

Commission found that, apart from size differences, all lined paper products had similar physicalcharacteristics, were used for note taking and other types of writing, were used in both school andbusiness applications, had common channels of distribution, and shared common manufacturing facilities,production processes, and employees.19 Thus, the Commission defined the domestic like product as alllined paper products or “LPP.” As in the original determinations, we will refer to the lined paperproducts within the domestic like product but outside the scope definition as other lined paper products or“OLPP.”
LPP is generally sold in the form of spiral-bound or wireless notebooks (with or without pocketsand/or dividers), hole-punched filler paper, and composition books.20 The paper may be wide-ruled orcollege ruled and is typically white in color, while notebook covers may be plain or adorned with graphicdesigns.21 LPP is primarily used for note-taking and assignments by students in school, although it mayalso be used for business purposes.22
Arguments of the Parties. AASPS argued for the first time at the hearing that the domestic likeproduct should be defined as CLPSS, coextensive with the scope,23 and elaborated on this argument onlyin its posthearing brief.24 Tjiwi contends that the Commission should reject AASPS’s argument that thedomestic like product should be defined as CLPSS.25 Indian Respondents argue that the Commissionshould define the like product in the same manner as it did in the original investigations.26
Analysis: Because AASPS not only failed to assert at the time it filed its questionnaire commentsthat it intended to make a domestic like product argument, but instead had previously stated in writing itagreed with the definition the Commission adopted in the original investigations, the Commission did notseek narrative information in its questionnaires to U.S. producers and purchasers concerning possibledistinctions between CLPSS and OLPP. The record consequently contains little new informationpertinent to the similarities and distinctions between CLPSS and OLPP, and much of AASPS’s argumentis based on data collected in the original investigations.27 Because AASPS only provided the rationale for
19 Original Determinations, USITC Pub. 3884 at 7-10.
20 CR/PR at II-1.
21 CR/PR at II-1.
22 CR/PR at II-1.
23 Hearing Tr. at 154-55 (Price).
24 AASPS changed its argument concerning the appropriate definition of the domestic like product twice duringthese reviews. In its response to the notice of institution, it stated that it agreed with the domestic like productdefinition the Commission made in the original final determinations. AASPS Response to Notice of Institution at24. In its prehearing brief, AASPS argued for the first time that the Commission should define the domestic likeproduct differently, to include LPP other than legal pads without covers, a product on which it had not requested thatthe Commission collect data. AASPS Prehearing Brief, ex. 2. It indicated at the hearing that it did not intend topursue this argument. Hearing Tr. at 154-55 (Price).
25 Tjiwi Posthearing Brief at 15.
26 Indian Respondents Prehearing Brief at 4.
27 Cf. Bottom Mount Combination Refrigerator-Freezers from Korea and Mexico, Inv. Nos. 701-TA-477, 731-TA-1180-1181 (Final), USITC Pub. 4318 at 8-9 (May 2012) (rejecting domestic like product argument asserted forfirst time in prehearing brief). The Commission does have trade, employment, and financial data in the record fordomestic production of CLPSS, as well as for domestic production of OLPP. The Commission does not, however,have data (or any other information) corresponding to a domestic like product consisting of LPP other than
(continued...)
6

its proposed CLPSS domestic like product argument in its posthearing brief, Commission staff and therespondent interested parties had limited time to meaningfully assess the argument.
Nevertheless, we consider below AASPS’s argument that the domestic like product should bedefined as CLPSS. The Commission’s practice in five-year reviews is to examine the like productdefinition in the original determination and any prior completed reviews and consider whether the recordindicates any reason to revisit the prior findings.28 Consequently, we will examine the findings made inthe original investigations and examine whether the current record provides any reason to revisit them.
Physical Characteristics and End Uses. In the original determinations, the Commission foundthat all lined paper products shared similar characteristics because they contained paper lined with blue orred ink and that is bound or loose-leaf and/or hole-punched. Additionally, all lined paper products wereused for note-taking and other types of writing.29 There is nothing in the record of these reviews thatwould call these findings into question.
AASPS contends that the end uses of CLPSS and OLPP are different because the former is usedin schools and the latter is used principally in commercial settings. This is not consistent with anadmission AASPS made during the original investigations.30 Moreover, the record contains noinformation that would support a finding that the end uses of CLPSS and OLPP have changed since theoriginal investigations. In the original investigations, when market participants were asked to describeany differences in physical characteristics and end uses among lined paper products, only two of over 40responding participants cited the fact that OLPP was principally used in home or business settings.31
Interchangeability. In the original investigations, the Commission found that all lined paperproducts were interchangeable in the sense that they can all be used for the same principal application:note taking. It observed that interchangeability was limited somewhat by the differences in productfeatures and size among various types of lined paper products.32 There is nothing in the record of thesereviews that would call these findings into question. AASPS’s arguments merely emphasize theCommission’s latter finding while disregarding the former.33
27 (...continued)uncovered legal pads, which AASPS advocated in its prehearing brief but not subsequently. Indeed, AASPS did notrequest in its questionnaire comments that data be collected for this product. Compare 61 Fed. Reg. 37818, 37826(July 22, 1996) (data collection requests pertaining to possible domestic like product issues should be made inquestionnaire comments, rather than later in proceedings). In light of both AASPS’s failure to pursue its argumentthat the domestic like product should be defined as LPP other than uncovered legal pads and the lack of any data inthe record concerning this product, we do not discuss this potential domestic like product definition further.
28 See, e.g., Brass Sheet and Strip from France, Germany, Italy, and Japan, Inv. Nos. 731-TA-313, 314, 317, and379 (Third Reviews), USITC Pub. 4313 at 5 (Apr. 2012); Internal Combustion Industrial Forklift Trucks FromJapan, Inv. No. 731-TA-377 (Second Review), USITC Pub. 3831 at 8-9 (Dec. 2005); Crawfish Tail Meat FromChina, Inv. No. 731-TA-752 (Review), USITC Pub. 3614 at 4 (Jul. 2003); Steel Concrete Reinforcing Bar FromTurkey, Inv. No. 731-TA-745 (Review), USITC Pub. 3577 at 4 (Feb. 2003).
29 Original Determinations, USITC Pub. 3884 at 7-8.
30 Original Determinations, USITC Pub. 3884 at 9 (“Petitioner acknowledges that LPP and outsize lined paperproducts are used in schools and business settings.”).
31 INV-DD-117 (Aug. 15, 2006) at D-36-40 (EDIS Doc. 460949).
32 Original Determinations, USITC Pub. 3884 at 9.
33 Furthermore, AASPS’s arguments concerning the disparate trends of domestic industry’s U.S. shipments ofCLPSS and OLPP during the period of review are not pertinent to an analysis of interchangeability. There was no
(continued...)
7

Channels of Distribution. In the original determinations, the Commission found that all linedpaper products were sold through the same retail channels of distribution. Moreover, a majority of theresponding purchasers indicated that they purchase CLPSS as part of the same bid or contract as OLPP.34 There is nothing in the record of these reviews that would call these findings into question. To thecontrary, AASPS’s argument that CLPSS are likely to be promoted in back-to-school sales while OLPPare not merely underscores that all lined paper products are sold by retailers.
Common Manufacturing Facilities, Production Processes, and Production Employees. In theoriginal determinations, the Commission found that the production processes of all lined paper productsare similar, because they involve ruling the paper, binding and/or hole-punching the paper, and packagingthe product for sale. It further found that the majority of U.S. producers reported that they produced therange of lined paper products on the same equipment and machinery.35
There is no information in these reviews indicating that the lined paper production process haschanged since the time of the original investigations. AASPS’s argument that there is a distinctionbetween CLPSS and OLPP producers is not supported by the record. Of the six domestic producers thatprovided usable questionnaire responses in these reviews, four reported production of both CLPSS andOLPP, and at least one reported that it produces CLPSS and OLPP on the same equipment.36
Customer and Producer Perceptions. The Commission characterized customer and producerperceptions as mixed in the original investigations. About half of responding purchasers indicated nodifferences in perceptions among different types of lined paper products. Non-petitioning producers alsoindicated no differences, while the petitioning producers distinguished between products used for schoolsupplies and products used in commercial applications.37 The record of these reviews contains no newinformation concerning this factor. At most, AASPS’s arguments reiterate something that theCommission acknowledged in the original determinations – that its members perceive CLPSS and OLPPto be separate products.
Price. The Commission observed in the original investigations that it was difficult to comparethe prices of the various lined paper products in any meaningful way in light of their variety.38 AASPShas not submitted argument concerning this factor.
Conclusion. AASPS has provided little new information in support of its argument that thedomestic like product should be defined as CLPSS, and this information does not call into question any ofthe central findings that the Commission made in the original final determinations when it defined theappropriate domestic like product as LPP. In the absence of new information that would warrantrevisiting our prior like product findings, we again define the domestic like product as LPP.
33 (...continued)movement away from OLPP products in the U.S. market during the period of review. To the contrary, apparent U.S.consumption of OLPP increased between 2006 and 2011, while apparent U.S. consumption of CLPSS declined. CR/PR at Tables C-2, C-3.
34 Original Determinations, USITC Pub. 3884 at 9.
35 Original Determinations, USITC Pub. 3884 at 9-10.
36 See Producers’ Questionnaires.
37 Original Determinations, USITC Pub. 3884 at 10.
38 Original Determinations, USITC Pub. 3884 at 10.
8

B. Domestic Industry and Related Parties
Section 771(4)(A) of the Act defines the relevant industry as the domestic “producers as a wholeof a domestic like product, or those producers whose collective output of a domestic like productconstitutes a major proportion of the total domestic production of the product.”39 In defining the domesticindustry, the Commission’s general practice has been to include in the industry producers of all domesticproduction of the like product, whether toll-produced, captively consumed, or sold in the domesticmerchant market. Section 771(4)(B) of the Act allows the Commission, if appropriate circumstancesexist, to exclude from the domestic industry producers that are related to an exporter or importer ofsubject merchandise, or which are themselves importers.40
In the original investigations, the Commission found that eight domestic producers were relatedparties, and that appropriate circumstances existed to exclude from the domestic industry two of theseproducers. The producers excluded were American Scholar and CPP, both of which had ceased domesticproduction by the end of the period examined.41
During the period examined in these reviews, five U.S. producers of LPP imported subjectmerchandise, and therefore qualify as related parties subject to possible exclusion from the domesticindustry: ***.42 We find that appropriate circumstances do not exist to exclude any of the related party
39 19 U.S.C. § 1677(4)(A). The definitions in 19 U.S.C. § 1677 are applicable to the entire subtitle containing theantidumping and countervailing duty laws, including 19 U.S.C. §§ 1675 and 1675a. See 19 U.S.C. § 1677.
40 The primary factors the Commission has examined in deciding whether appropriate circumstances exist toexclude a related party include the following:
(1) the percentage of domestic production attributable to the importing producer;(2) the reason the U.S. producer has decided to import the product subject to investigation, i.e., whether thefirm benefits from the LTFV sales or subsidies or whether the firm must import in order to enable it tocontinue production and compete in the U.S. market; and(3) the position of the related producer vis-a-vis the rest of the industry, i.e., whether inclusion or exclusionof the related party will skew the data for the rest of the industry.
See, e.g., Torrington Co. v. United States, 790 F. Supp. 1161 (Ct. Int’l Trade 1992), aff’d without opinion, 991 F.2d809 (Fed. Cir. 1993).
41 Original Determinations, USITC Pub. 3884 at 12-16; Confidential Original Determinations, EDIS Doc. 460953at 16-23.
42 See CR/PR at Table III-5. A sixth producer, ***, reported purchasing a small quantity of subject imports fromIndia in 2009. Id. In certain circumstances, a domestic producer that purchases subject imports may be deemed arelated party if it is responsible for a predominant proportion of an importer's purchases and the importer's purchaseswere substantial. See, e.g., Foundry Coke from China, Inv. No. 731-TA-891 (Final), USITC Pub. 3449 (September2001) at 8-9. However, *** purchases, which accounted for only *** pieces in a single year, were not substantial.
9

producers from the domestic industry.43 44 45 Accordingly, we define the domestic industry to include alldomestic producers of LPP.
III. CUMULATION
A. Legal Standard
With respect to five-year reviews, section 752(a) of the Act provides as follows:the Commission may cumulatively assess the volume and effect of imports of the subjectmerchandise from all countries with respect to which reviews under section 1675(b) or(c) of this title were initiated on the same day, if such imports would be likely to competewith each other and with domestic like products in the United States market. TheCommission shall not cumulatively assess the volume and effects of imports of thesubject merchandise in a case in which it determines that such imports are likely to haveno discernible adverse impact on the domestic industry.46
Cumulation therefore is discretionary in five-year reviews, unlike original investigations, whichare governed by section 771(7)(G)(I) of the Act.47 The Commission may exercise its discretion tocumulate, however, only if the reviews are initiated on the same day, the Commission determines that the
43 With the exception of ***, each of the related parties’ subject imports were very small in relation to domesticproduction. CR/PR at Table III-5. Between 2006 and 2011, *** imports as a share of domestic production rangedfrom *** to *** percent, *** ranged from *** to *** percent, and *** ranged from *** to *** percent. Id. Even for***, their subject imports occurred respectively for one and two years of the period of review; during the two mostrecent years of the review, each of these producers produced merchandise in the United States but did not importsubject merchandise. Id. at Table III-5. Thus, the most recent data indicates that each of the related party producers’principal interest is in domestic production. Additionally, the record does not indicate that any of the related partyproducers derived a financial benefit from importation, notwithstanding that *** reported that they imported subjectmerchandise at least in part for pricing reasons. Id. at Table III-5, nn. 4, 5, and 7. The imports of *** were too smallto have any material effect on financial performance. See CR/PR at Table III-5. Additionally, there does not appearto be a clear correlation between importation and financial performance for any of the related party producers. Compare CR/PR at Table III-5 with id. at Table III-10.
44 Consistent with her practice in past investigations and reviews, Commissioner Aranoff does not rely onindividual-company operating income margins, which reflect a domestic producer’s financial operations related toproduction of the domestic like product, in assessing whether a related party has benefitted from importation ofsubject merchandise. Rather, she determines whether to exclude a related party based principally on its ratio ofsubject imports to domestic production and whether its primary interests lie in domestic production or importation.
45 Commissioner Dean A. Pinkert does not rely upon the financial performance of *** as a factor in determiningwhether there are appropriate circumstances to exclude these related parties from the domestic industry in these five-year reviews. The record is not sufficient to infer from their profitability on U.S. operations whether they havederived a specific benefit from importing. See Allied Mineral Products v. United States, 28 CIT 1861, 1865-67(2004).
46 19 U.S.C. § 1675a(a)(7).
47 19 U.S.C. § 1677(7)(G)(i); see also, e.g., Nucor Corp. v. United States, 601 F.3d 1291, 1293 (Fed. Cir. 2010)(Commission may reasonably consider likely differing conditions of competition in deciding whether to cumulatesubject imports in five-year reviews); Allegheny Ludlum Corp. v. United States, 475 F. Supp. 2d 1370, 1378 (Ct.Int’l Trade 2006) (recognizing the wide latitude the Commission has in selecting the types of factors it considersrelevant in deciding whether to exercise discretion to cumulate subject imports in five-year reviews); Nucor Corp. v.United States, 569 F. Supp. 2d 1328, 1337-38 (Ct. Int’l Trade 2008).
10

subject imports are likely to compete with each other and the domestic like product in the U.S. market,and imports from each such subject country are not likely to have no discernible adverse impact on thedomestic industry in the event of revocation. Our focus in five-year reviews is not only on presentconditions of competition, but also on likely conditions of competition in the reasonably foreseeablefuture.
In the original investigations, all Commissioners cumulated subject imports from the three subjectcountries for purposes of their analysis of material injury by reason of subject imports.48 TheCommission found that subject imports from all three subject countries were fungible with both thedomestic like product and with each other. This finding relied on market participants’ reports that linedpaper products from various sources were always or frequently comparable with each other and thedomestic like product in most respects, notwithstanding variations in paper composition and weight,quality, and brightness.49 The Commission found the domestic like product and imports from eachcountry were sold nationwide.50 It also found that the domestic like product and imports from each of thesubject sources were sold primarily to retailers.51 The domestic like product and imports from each of thesubject sources were present in the U.S. market throughout the period of investigation.52 Accordingly, theCommission found a reasonable overlap of competition among the subject imports and between theimports from each subject country and the domestic like product.
The statutory threshold for cumulation is satisfied in these reviews, because all reviews wereinitiated on the same day: August 1, 2011.53 We consider the following issues in deciding whether toexercise our discretion to cumulate the subject imports: (1) whether imports from any of the subjectcountries are precluded from cumulation because they are likely to have no discernible adverse impact onthe domestic industry; (2) whether there is a likelihood of a reasonable overlap of competition amongimports from the subject countries and the domestic like product; and (3) whether there are similaritiesand differences in the likely conditions of competition under which subject imports are likely to competein the U.S. market.54 55
48 Original Determinations, USITC Pub. 3884 at 21-23. In their threat analysis, the three Commissioners whoreached negative determinations with respect to subject imports from India and Indonesia exercised their discretionnot to cumulate subject imports from China with subject imports from India and Indonesia, although they didexercise their discretion to cumulate subject imports from India and Indonesia. They found that subject imports fromChina had displayed different pricing and volume trends than imports from the other two countries, and had a morerapidly increasing export orientation. See id. at 63-65 (dissenting opinion).
49 Original Determinations, USITC Pub. 3884 at 22.
50 Original Determinations, USITC Pub. 3884 at 22-23.
51 Original Determinations, USITC Pub. 3884 at 23.
52 Original Determinations, USITC Pub. 3884 at 23.
53 See 76 Fed. Reg. 45778 (Aug. 1, 2011).
54 Commissioners Okun and Pearson note that, while they consider the same issues discussed in this section indetermining whether to exercise their discretion to cumulate the subject imports, their analytical framework beginswith whether imports from the subject countries are likely to face similar conditions of competition. For thosesubject imports which are likely to compete under similar conditions of competition, they next proceed to considerwhether there is a likelihood of a reasonable overlap of competition whereby those imports are likely to competewith each other and with the domestic like product. Finally, if based on that analysis they intend to exercise theirdiscretion to cumulate one or more subject countries, they analyze whether they are precluded from cumulating suchimports because the imports from one or more subject countries, assessed individually, are likely to have nodiscernible adverse impact on the domestic industry. See Steel Concrete Reinforcing Bar From Belarus, China,Indonesia, Korea, Latvia, Moldova, Poland, and Ukraine, Invs. Nos. 731-TA-873 to 875, 877 to 880, and 882
(continued...)
11

Based on the record, we find that subject imports from each of the three countries would not belikely to have no discernible adverse impact on the domestic industry were the countervailing duty ordersand antidumping duty orders to be revoked.56 We also find a likely reasonable overlap of competitionamong the subject imports and between the subject imports and the domestic like product were the ordersto be revoked.
B. Likelihood of No Discernible Adverse Impact
The statute precludes cumulation if the Commission finds that subject imports from a country arelikely to have no discernible adverse impact on the domestic industry.57 Neither the statute nor theUruguay Round Agreements Act (“URAA”) Statement of Administrative Action (“SAA”) providesspecific guidance on what factors the Commission is to consider in determining that imports “are likely tohave no discernible adverse impact” on the domestic industry.58 With respect to this provision, theCommission generally considers the likely volume of subject imports and the likely impact of thoseimports on the domestic industry within a reasonably foreseeable time if the orders are revoked. Ouranalysis for each of the subject countries takes into account, among other things, the nature of the productand the behavior of subject imports in the original investigations.
We preface our analysis by observing that the pertinent harmonized tariff schedule (HTS)classifications changed during the period of review, affecting the information available on the volume ofsubject imports. Specifically, in July 2009, a residual classification covering subject and nonsubjectmerchandise, 4820.10.2050, was subdivided into three separate classifications, which are 4820.10.2030,4820.10.2040, and 4820.10.2060. The first two of these categories contain subject merchandise but thethird contains only out of scope product.59 In light of this change, we analyze subject import volumetrends using the broader category of data, including classification 4820.10.2060, because these datameasure the same universe of imports over time. In analyzing subject import volume in 2010 and 2011,however, we rely principally on the narrower category of data, excluding classification 4820.10.2060,because these data more accurately reflect the most recent CLPSS import volumes.
China. During 2005, the last year for which data were collected in the original investigations, thethree Chinese CLPSS producers that responded to the Commission’s questionnaire reported capacity of*** pieces, production of *** pieces, and that exports constituted *** percent of all shipments, with the
54 (...continued)(Review), USITC Pub. 3933 (Jul. 2007) (Separate and Dissenting Views of Chairman Daniel R. Pearson andCommissioner Deanna Tanner Okun Regarding Cumulation). Accord Nucor Corp. v. United States, 605 F. Supp.2d1361, 1372 (Ct. Int’l Trade 2009); Nucor Corp. v. United States, 594 F. Supp.2d 1320, 1345-47 (Ct. Int’l Trade2008), aff’d, 601F.3d 1291 (Fed Cir., 2010). Their cumulation analysis in these reviews is set forth in theiradditional and dissenting views and they do not join the remainder of section III of this opinion.
55 Commissioner Johanson finds that in light of the cumulation methodology applied by Commissioners Okun andPearson, it appears unnecessary to reach the issues of no discernible adverse impact and reasonable overlap ofcompetition applying the traditional four factors. However, for thoroughness, he notes that he agrees with thecontent of the analysis set forth below in sections IIIA-IIIC.
56 Commissioner Pinkert finds that revocation of the antidumping and countervailing duty orders on subjectimports from Indonesia would likely have no discernible adverse impact on the domestic industry. See ConcurringViews of Commissioner Dean A. Pinkert on CLPSS from Indonesia.
57 19 U.S.C. § 1675a(a)(7).
58 SAA, H.R. Rep. No. 103-316, vol. I at 887 (1994).
59 CR at I-19; PR at I-18; CR/PR at Table I-7.
12

United States the *** supplied by the reporting Chinese producers.60 No producer of subject merchandisefrom China responded to the Commission’s questionnaires in these reviews and the record contains littlenew information concerning the CLPSS industry in China. Available public data, which concern broaderproduct groupings than CLPSS, indicate that China’s production of writing and printing paper hasincreased in recent years and that China is now a net exporter of paper products.61 Throughout the currentperiod of review, China has continued to supply CLPSS in the U.S. market, albeit at lower levels than inthe original investigations.62
Based on the Chinese CLPSS industry’s significant capacity and degree of export orientation inthe original investigations and evidence of the Chinese paper industry’s growth since that time, as well asthe continued presence of subject imports from China in the U.S. market, we find that subject importsfrom China, upon revocation, are not likely to have no discernible adverse impact on the domesticindustry.
India. Subject imports from India have maintained a consistent presence in the U.S. market, bothduring the original period of investigation and during the current period of review.63
The Commission received questionnaire responses in these reviews from eight producers orexporters of CLPSS from India, all of which are members of the Indian Respondents group.64 These firmsreported data for each year in the 2006-11 period.65 Although Indian Respondents claim that the CLPSS
60 CR at IV-13; PR at IV-11.
61 CR at IV-13; PR at IV-11.
62 During the original period of investigation, the quantity of subject imports from China increased from 186.3million pieces in 2003 to 220.7 million pieces in 2004, and then to 345.9 million pieces in 2005. CR/PR at Table I-1. Subject imports from China declined to 159.6 million pieces in 2006, the year provisional and final duties becameeffective. Id. Using the broader import measure, subject imports fluctuated at lower levels thereafter. Id. Using thenarrower import measure, they were at 24.0 million pieces in 2010 and 17.5 million pieces in 2011. Id. at Table IV-12. Using the broader import measure, the market penetration of subject imports from China increased from ***percent in 2003 to *** percent in 2004 and then to *** percent in 2005, fell to 14.0 percent in 2006, and ranged from10.5 percent to 11.9 percent thereafter. Id. at Table I-1. Using the narrower import measure, the market penetrationof subject imports from China was 2.5 percent in 2010 and 1.9 percent in 2011. Id. at Table I-13.
63 During the original period of investigation, the quantity of subject imports from India declined from 37.2million pieces in 2003 to 36.0 million pieces in 2004, and then to 31.3 million pieces in 2005. CR/PR at Table I-1. In 2006, subject imports from India declined to 24.2 million pieces. Id. They then increased to 42.4 million piecesin 2007, declined to 36.9 million pieces in 2008, attained a period high of 43.9 million pieces in 2009, and declinedthe following two years. Id. Using the narrower import measure, subject imports from India were at 32.8 millionpieces in 2010 and 25.5 million pieces in 2011. Id. at Table IV-2. Using the broader import measure, the marketpenetration of subject imports from India declined from *** percent in 2003 to *** percent in 2004, fell to ***percent in 2005 and then to 2.1 percent in 2006, and ranged from 3.0 percent to 4.0 percent thereafter. Id. at Table I-1. Using the narrower import measure, the market penetration of subject imports from India was 3.5 percent in 2010and 2.8 percent in 2011. Id. at Table I-13.
64 See CR/PR at Table IV-8.
65 CR at IV-15; PR at IV-12. Contrary to the Indian respondents’ claim that industry coverage was greater in2011 than 2006, Hearing Tr. at 172 (Maleshevich), the questionnaire data reflect information from the same group ofproducers throughout the period of review and are therefore indicative of these producers’ trends in capacity,production, and capacity utilization during the period of review. At most, the responding producers may have beenresponsible for varying percentages of the Indian CLPSS industry’s exports to the United States at different timesduring the period.
13

industry in India is highly fragmented,66 the eight responding producers themselves estimated that theyaccounted for *** percent of Indian production of CLPSS in 2010.67 Based on the narrower importmeasure, these producers’ 2011 exports to the United States accounted for 91.0 percent of total subjectimports from India in 2011.68
Reporting Indian producers’ CLPSS capacity rose during each year of the period of review,69
their production rose during all but one year of the period, and their capacity utilization fluctuated duringthe period.70 The percentage of shipments exported by these producers generally increased during theperiod, as did the percentage of shipments that they exported to the United States.71 In 2010 and 2011,the United States was their largest export market.72
Based on the responding Indian producers’ significant capacity, including some excess capacity,and export orientation, as well as their continued presence in the U.S. market, we find that subject importsfrom India, upon revocation, are not likely to have no discernible adverse impact on the domesticindustry.
Indonesia.73 During the original period of investigation, the quantity of subject imports fromIndonesia declined from 39.0 million pieces in 2003 to 35.0 million pieces in 2004, and then increased to39.3 million pieces in 2005.74 Subject imports from Indonesia declined to 3.2 million pieces in 2006 andremained at low levels throughout the period of review.75
66 Indian Respondents’ Prehearing Brief at 22.
67 CR at IV-15; PR at IV-12.
68 CR at IV-15 n.27; PR at IV-12 n.27.
69 The responding Indian producers’ CLPSS capacity increased from 44.0 million pieces in 2006 to 85.1 millionpieces in 2011. CR/PR at Table IV-9. We are unpersuaded by the Indian respondents’ argument that the apparentincrease in Indian production capacity was a function of the fact that responding Indian producers accounted for 13percent of Indian exports to the United States in 2006 but 91 percent of such exports in 2011. Indian Respondents’Posthearing Brief at 4-5. The Indian respondents’ coverage comparisons are not apposite because the 2006 coveragefigure is based on the broader measure of subject imports and the 2011 figure is based on the narrower measure. Inany event, because the responding Indian producers accounted for the vast majority of Indian exports to the UnitedStates in 2011, we find their reported data to be representative of the portion of the Indian industry during the periodexamined in these reviews that is currently exporting subject merchandise to the United States and is likely to do soin the reasonably foreseeable future.
70 Reporting Indian producers’ CLPSS production rose during all but one year of the period of review, increasingfrom 30.7 million pieces in 2006 to a period high of 70.8 million pieces in 2011. CR/PR at Table IV-9. Capacityutilization fluctuated, ranging from 69.8 percent in 2006 to 91.9 percent in 2010, and was 83.1 percent in 2011. Id.
71 Reporting Indian producers’ exports as a share of total shipments ranged from 38.7 percent in 2006 to periodhighs of 51.5 percent in 2010 and 2011. CR/PR at Table IV-9. Their exports to the United States as a share of totalshipments ranged from 10.5 percent to 26.8 percent. Id.
72 CR/PR at Table IV-9.
73 Commissioner Pinkert does not join this section.
74 CR/PR at Table I-1.
75 Using the broader import measure, official import statistics indicate that subject imports from Indonesiafluctuated between 4.4 million pieces and 8.3 million pieces between 2007 and 2011. CR/PR at Table I-1. Usingthe narrower import measure, official statistics report subject imports from Indonesia of 2.2 million pieces in 2010and 1.6 million pieces in 2011. Id. at Table IV-2. Using the broader import measure, the market penetration ofsubject imports from Indonesia declined from *** percent in 2003 to *** percent in 2004 and then increased to ***percent in 2005, fell to 0.3 percent in 2006, and ranged from 0.4 percent to 0.8 percent thereafter. Id. at Table I-1.
(continued...)
14

Notwithstanding these import data showing some imports of CLPSS from Indonesia over theperiod, Tjiwi, essentially the *** exporter of CLPSS from Indonesia, ceased exports of CLPSS to theUnited States after December 2005.76 Customs import data indicate that the ***.77
Tjiwi submitted a response to the Commission’s foreign producers’ questionnaire. In itsresponse, it indicated that its CLPSS capacity increased over the period,78 and its capacity utilizationreached *** percent in 2011.79 The percentage of shipments that Tjiwi exported ranged from *** percentin 2011 to *** percent in 2006.80 *** of these shipments were exported to the United States.81
Tjiwi lacks the spare capacity to increase exports to the United States significantly and replacedits previous exports to the United States with exports to third country markets.82 Nevertheless, the UnitedStates was Tjiwi’s principal export market during the original investigations and the United Statesremains the world’s largest importer of CLPSS.83 Moreover, Tjiwi continued to export OLPP to theUnited States during the period examined, thereby maintaining contacts with U.S. customers.84 For thesereasons, we find that subject imports from Indonesia, upon revocation, are not likely to have nodiscernible adverse impact on the domestic industry.
C. Likelihood of a Reasonable Overlap of Competition85
The Commission generally has considered four factors intended to provide a framework fordetermining whether subject imports compete with each other and with the domestic like product.86 Only
75 (...continued)Using the narrower import measure, the market penetration of subject imports from Indonesia was 0.2 percent inboth 2010 and 2011. Id. at Table I-13.
76 Hearing Tr. at 182 (Alfian); see also Tjiwi Prehearing Brief at 6; Tjiwi Posthearing Brief at 3-4; CR at IV-19;PR at IV-16.
77 CR/PR at IV-2 n.8.
78 Tjiwi’s capacity increased from *** pieces in 2006 to *** pieces in 2008, declined to *** pieces in 2009,increased to a period high of *** pieces in 2010, and then declined to *** pieces in 2011. CR/PR at Table IV-11.
79 Tjiwi’s reported capacity utilization was *** percent in 2006 and at least *** percent each year thereafter. CR/PR at Table IV-11.
80 CR/PR at Table IV-11.
81 CR/PR at Table IV-11.
82 Chairman Williamson does not join this sentence.
83 CR/PR at Table IV-12.
84 CR/PR at Table C-3; see also Tjiwi’s Posthearing Brief at 2 (stating that other Indonesian producers have notexported OLPP to the United States).
85 Commissioner Pinkert joins the following discussion only insofar as it concerns subject imports from Chinaand India.
86 The four factors generally considered by the Commission in assessing whether imports compete with eachother and with the domestic like product are as follows: (1) the degree of fungibility between subject imports fromdifferent countries and between subject imports and the domestic like product, including consideration of specificcustomer requirements and other quality-related questions; (2) the presence of sales or offers to sell in the samegeographical markets of imports from different countries and the domestic like product; (3) the existence of commonor similar channels of distribution for subject imports from different countries and the domestic like product; and(4) whether subject imports are simultaneously present in the market with one another and the domestic like product. See, e.g., Wieland Werke, AG v. United States, 718 F. Supp. 50 (Ct. Int’l Trade 1989).
15

a “reasonable overlap” of competition is required.87 In five-year reviews, the relevant inquiry is whetherthere likely would be competition even if none currently exists because the subject imports are absentfrom the U.S. market.88
Fungibility. The record indicates that there is a moderate to high degree of substitutabilitybetween and among subject imports from China, India, and Indonesia and the domestic like product.89 Large majorities of U.S. producers, importers, and purchasers found imports from each subject country tobe always or frequently interchangeable with imports from other subject sources and the domesticallyproduced product.90 Majorities or pluralities of purchasers further found imports from each subjectcountry to be comparable with each other and with the domestic like product with respect to most non-price product characteristics.91 In particular, a plurality of purchasers found that subject imports fromIndia and the domestically produced product were comparable with respect to paper brightness, andmajorities of purchasers found that subject imports from India were comparable to imports from the othertwo subject countries in this respect.92 Majorities of purchasers also found that subject imports from Indiawere comparable to both domestically produced product and subject imports from China and Indonesiawith respect to paper weight.93
Channels of Distribution. During each year of the period of review, the *** percentage ofdomestic producers’ U.S. shipments of LPP was made to retailers.94 A majority of subject imports from
87 See Mukand Ltd. v. United States, 937 F. Supp. 910, 916 (Ct. Int’l Trade 1996); Wieland Werke, 718 F. Supp.at 52 (“Completely overlapping markets are not required.”); United States Steel Group v. United States, 873 F. Supp. 673, 685 (Ct. Int’l Trade 1994), aff’d, 96 F.3d 1352 (Fed. Cir. 1996). We note, however, that there have beeninvestigations where the Commission has found an insufficient overlap in competition and has declined to cumulatesubject imports. See, e.g., Live Cattle From Canada and Mexico, Invs. Nos. 701-TA-386 and 731-TA-812 to 813(Prelim.), USITC Pub. 3155 at 15 (Feb. 1999), aff’d sub nom, Ranchers-Cattlemen Action Legal Foundation v.United States, 74 F. Supp. 2d 1353 (Ct. Int’l Trade 1999); Static Random Access Memory Semiconductors from theRepublic of Korea and Taiwan, Invs. Nos. 731-TA-761 to 762 (Final), USITC Pub. 3098 at 13-15 (Apr. 1998).
88 See generally Chefline Corp. v. United States, 219 F. Supp. 2d 1313, 1314 (Ct. Int’l Trade 2002).
89 CR at II-13; PR at II-8.
90 CR/PR at Table II-9.
91 CR/PR at Table II-8. Majorities of purchasers found the domestically produced product superior to importsfrom each subject country with respect to delivery time. Majorities of purchasers found the domestically producedproduct superior to imports from China in terms of delivery terms and marketing/merchandising support. Id.
92 CR/PR at Table II-8.
93 CR/PR at Table II-8. Indian Respondents provided no meaningful documentation supporting their contentionthat differences in brightness, paper weight, or materials limit fungibility of the subject imports from India with thedomestic like product or the other subject imports. See Indian Respondents’ Prehearing Brief at 24-26. When askedat the hearing whether Indian Respondents could provide any statements from U.S. purchasers that CLPSS fromIndia could not meet specifications due to its brightness or weight, counsel responded in the negative. Hearing Tr. at199 (Davis). Indian Respondents submitted no such statements with their posthearing brief.
Purchasers’ perceptions of differences of interchangeability of papers of different weights, brightness, ormaterials (virgin vs. recycled) were mixed, with a plurality of purchasers stating that they had “no familiarity” withany of the three types of distinctions. CR/PR at Table II-6. Of those purchasers that provided responses, a majoritystated that papers of different weights, brightness, or materials were at least “sometimes” interchangeable, althoughthe majorities were larger with respect to variations in weight or materials than for brightness. CR/PR at Table II-6.
94 CR/PR at Table II-1.
16

China during each year was also directed to retailers.95 At least some percentage of subject imports fromIndia was directed to retailers each year; this percentage exceeded *** percent for three of the six yearsduring the period of review, including 2011.96 Moreover, the record indicates that during the period ofreview, Indian suppliers of CLPSS made bids to the same purchasers, including retailers, as domestic andnonsubject suppliers.97
As previously discussed, subject imports from Indonesia during the period of review wereextremely limited. In the original investigations, however, three of the four types of entities mostfrequently named as customers for subject imports from Indonesia were retailers.98 Additionally, Tjiwihas indicated that imports of nonsubject OLPP from Indonesia were made to retailers during the period ofreview.99 Thus, the information concerning distribution patterns of CLPSS from Indonesia during theoriginal investigation and OLPP from Indonesia during the period of review indicates that any subjectimports from Indonesia that would enter the U.S. market after revocation would likely be sold in the retailchannel of distribution.
Geographic Overlap. The domestic like product is sold nationwide.100 The majority ofresponding importers of CLPSS from China and all reporting importers of CLPSS from India andIndonesia reported nationwide sales.101
Simultaneous Presence in Market. The domestic like product has been present in the U.S. marketthroughout the period of review.102 Official import statistics indicate that imports of CLPSS from eachsubject country were present in the U.S. market during the period of review.103 Because we have foundthat subject imports from Indonesia will likely enter the U.S. market in quantities sufficient not to have nodiscernible adverse impact after revocation, they will likely be continuously present in the U.S. market, asthey were during the original period of investigation.104
Conclusion. The record of these reviews indicates that, if the orders were revoked, there wouldlikely be a reasonable overlap of competition with respect to fungibility, geographic overlap, channels ofdistribution, and simultaneous presence in the U.S. market. Based on these considerations, we find thatthere would likely be a reasonable overlap of competition between and among imports from each subjectcountry and the domestic like product if the orders were to be revoked.
95 CR/PR at Table II-1.
96 CR/PR at Table II-1. Additionally, *** retailer that directly imported subject merchandise from India reportedits imports as shipments to end users, the category which accounted for the largest proportion of reported U.S.commercial shipments of subject imports from India during four of the six years of the period of review. CR at II-2n.5; PR at II-1 n.5; CR/PR at Table II-1. Direct imports by retailers, reported as sales to end users, take place in thesame channel of distribution as reported sales to retailers, which accounted for most reported domestic producers’U.S. shipments and U.S. importers’ U.S shipments of subject imports from China. Id. at Table II-1.
97 CR/PR at Table V-11.
98 INV-DD-117 at II-2 (Aug. 15, 2006) (EDIS Doc. 460949).
99 Tjiwi Posthearing Brief at Q-5-6.
100 CR at II-3; PR at II-2.
101 CR at II-4; PR at II-2.
102 CR/PR at Table I-10.
103 CR at IV-10; PR at IV-8; CR/PR at Table IV-7.
104 Commissioner Pinkert does not join this statement.
17

D. Likely Conditions of Competition105
In determining whether to exercise our discretion to cumulate the subject imports, we assesswhether the subject imports from China, India, and Indonesia are likely to compete under similar ordifferent conditions in the U.S. market after revocation of the orders.106 We find that subject imports fromChina and India are likely to compete under conditions of competition that are similar with respect tothose countries, as further explained below.
Both industries maintained a presence in the U.S. market during the period examined. Based onthe broader measure of import volume, subject imports from China represented between 10.5 percent and14.0 percent of apparent U.S. consumption while subject imports from India represented between 2.1 and4.0 percent of apparent U.S. consumption.107 Based on the narrower measure of import volume, subjectimports from China represented 2.5 percent of apparent U.S. consumption in 2010 and 1.9 percent in2011 while subject imports from India represented 3.5 percent of apparent U.S. consumption in 2010 and2.8 percent in 2011.108 Responding importers reported having arranged for the importation of *** piecesof CLPSS from China and *** pieces of CLPSS from India in 2012, equivalent to *** percent and ***percent of the total reported volume of arranged imports of CLPSS that year.109 Moreover, subjectproducers in India bid on contracts representing a large volume of sales in 2011, indicating their interestin serving the U.S. market.110 Producers in both China and India could use their existing channels ofdistribution and customer contacts in the U.S. market to increase exports to the United States afterrevocation.
105 Commissioner Pinkert does not join in this section and explains his analysis of other considerations as follows. Where, in a five-year review, he does not find that imports of the subject merchandise would be likely to have nodiscernible adverse impact on the domestic industry in the event of revocation, and finds that such imports would belikely to compete with each other and with the domestic like product in the U.S. market, he cumulates them unlessthere is a condition or propensity – not merely a trend – that is likely to persist for a reasonably foreseeable time andthat significantly limits competition such that cumulation is not warranted.
Commissioner Pinkert finds no such condition or propensity with respect to imports from India or China,and he therefore cumulates imports from those countries for purposes of his analysis of likelihood of material injury. He notes in this regard the argument made by Indian producers that the low brightness of their recycled, low-weightpaper is a condition limiting their ability to compete in the U.S. market but finds it unavailing for two reasons. First,U.S. purchasers found Indian product to be highly interchangeable with product from the United States and othercountries. CR/PR at Table II-9. Second, Indian producers made several large bids for contracts with major U.S.retailers (two of which were won by an Indian producer). Id. at Table V-11.
106 See Nucor Corp. v. United States, 601 F.3d 1291, 1296 (Fed. Cir. 2010); see also Allegheny Ludlum Corp.,475 F. Supp. 2d at 1378 (recognizing the wide latitude the Commission has in selecting the type of factors itconsiders relevant in deciding whether to exercise discretion to cumulate subject imports in five-year reviews);Nucor v. United States, 569 F. Supp. 2d at 1337-38; United States Steel, Slip Op. 08-82.
107 CR/PR at Table I-11. Throughout these views, our analysis of market share trends is based upon apparentU.S. consumption of LPP, domestic industry U.S. shipments of LPP, and subject imports of CLPSS. See id. atTables I-1, 12, 13.
108 CR/PR at Table I-13.
109 CR/PR at Table IV-4.
110 See CR/PR at Table V-11. Purchasers were asked to report bid data for their three largest purchases based ondollar value in 2011. CR at V-26; PR at V-8. Although only *** percent of the value of the reported contracts wasawarded to Indian producers, id., we find it more instructive that Indian producers bid on six of the twelve reportedcontracts, representing *** percent of the total contract volume on which bidding data were reported. CR/PR atTable V-11.
18

Furthermore, the information available in the record indicates that the CLPSS industries in bothChina and India are export oriented and have increased capacity. In 2005, the last year for which data onthe Chinese industry was collected, responding Chinese producers reported exporting *** percent of theirtotal shipments, with *** percent of their total shipments exported to the United States.111 RespondingChinese producers reported a capacity of *** pieces, including unused capacity of *** pieces, that sameyear.112 The information available on the record of these reviews indicates that Chinese production ofprinting and writing paper of the kind used to manufacture LPP and Chinese exports of paper productshave grown significantly since the original investigations.113
Responding Indian producers reported that exports as a share of their total shipments increasedduring the period examined from 38.7 percent in 2006 to 51.5 percent in 2011, while exports to theUnited States as a share their total shipments increased from 10.5 percent to 26.8 percent.114 During thesame period, their reported capacity increased 93.4 percent from 44.0 million pieces in 2006 to 85.1million pieces in 2011, including unused capacity of 14.4 million pieces.115
E. Conclusion
For the reasons set forth in these views and his separate opinion, Chairman Williamson hasexercised his discretion to cumulate subject imports from China, India, and Indonesia. For the reasons setforth in these views and her separate opinion, Commissioner Aranoff has exercised her discretion tocumulate subject imports from China and India and has exercised her discretion not to cumulate subjectimports from Indonesia with any other subject imports. For the reasons set forth in these views and hisseparate opinion, Commissioner Pinkert has determined to exercise his discretion to cumulate subjectimports from China and India and has determined that revocation of the orders on subject imports fromIndonesia would have no likely discernible adverse impact. For the reasons set forth in their dissentingopinion, Commissioners Okun, Pearson, and Johanson have exercised their discretion not to cumulatesubject imports from China, India, or Indonesia, respectively, with any other subject imports.
IV. WHETHER REVOCATION OF THE ANTIDUMPING DUTY AND COUNTERVAILINGDUTY ORDERS WOULD LIKELY LEAD TO CONTINUATION OR RECURRENCE OFMATERIAL INJURY WITHIN A REASONABLY FORESEEABLE TIME
A. Legal Standards
In a five-year review conducted under section 751(c) of the Act, Commerce will revoke anantidumping or countervailing duty order unless (1) it makes a determination that dumping orsubsidization is likely to continue or recur and (2) the Commission makes a determination that revocationof the antidumping or countervailing duty order “would be likely to lead to continuation or recurrence of
111 Original Investigations Confidential Staff Report (“OCR”)/Original Investigations Public Staff Report(“OPR”) at Table VII-1; see also CR at IV-13; PR at IV-11.
112 OCR/OPR at Table VII-1.
113 See CR at IV-13; PR at IV-11.
114 CR/PR at Table IV-9.
115 CR/PR at Table IV-9.
19

material injury within a reasonably foreseeable time.”116 The SAA states that “under the likelihoodstandard, the Commission will engage in a counterfactual analysis; it must decide the likely impact in thereasonably foreseeable future of an important change in the status quo – the revocation or termination of aproceeding and the elimination of its restraining effects on volumes and prices of imports.”117 Thus, thelikelihood standard is prospective in nature.118 The U.S. Court of International Trade has found that“likely,” as used in the five-year review provisions of the Act, means “probable,” and the Commissionapplies that standard in five-year reviews.119 120
The statute states that “the Commission shall consider that the effects of revocation or terminationmay not be imminent, but may manifest themselves only over a longer period of time.”121 According tothe SAA, a “‘reasonably foreseeable time’ will vary from case-to-case, but normally will exceed the‘imminent’ timeframe applicable in a threat of injury analysis in original investigations.”122
Although the standard in a five-year review is not the same as the standard applied in an originalantidumping duty investigation, it contains some of the same fundamental elements. The statute providesthat the Commission is to “consider the likely volume, price effect, and impact of imports of the subjectmerchandise on the industry if the orders are revoked or the suspended investigation is terminated.”123 Itdirects the Commission to take into account its prior injury determination, whether any improvement inthe state of the industry is related to the order or the suspension agreement under review, whether theindustry is vulnerable to material injury if the orders are revoked or the suspension agreement isterminated, and any findings by Commerce regarding duty absorption pursuant to 19 U.S.C.§
116 19 U.S.C. § 1675a(a).
117 SAA at 883-84. The SAA states that “{t}he likelihood of injury standard applies regardless of the nature ofthe Commission’s original determination (material injury, threat of material injury, or material retardation of anindustry). Likewise, the standard applies to suspended investigations that were never completed.” Id. at 883.
118 While the SAA states that “a separate determination regarding current material injury is not necessary,” itindicates that “the Commission may consider relevant factors such as current and likely continued depressedshipment levels and current and likely continued {sic} prices for the domestic like product in the U.S. market inmaking its determination of the likelihood of continuation or recurrence of material injury if the order is revoked.” SAA at 884.
119 See NMB Singapore Ltd. v. United States, 288 F. Supp. 2d 1306, 1352 (Ct. Int’l Trade 2003) (“‘likely’ meansprobable within the context of 19 U.S.C. § 1675(c) and 19 U.S.C. § 1675a(a)”), aff’d mem., 140 Fed. Appx. 268(Fed. Cir. 2005); Nippon Steel Corp. v. United States, 26 CIT 1416, 1419 (2002) (same); Usinor Industeel, S.A. v.United States, 26 CIT 1402, 1404 nn.3, 6 (2002) (“more likely than not” standard is “consistent with the court’sopinion;” “the court has not interpreted ‘likely’ to imply any particular degree of ‘certainty’”); Indorama Chemicals(Thailand) Ltd. v. United States, Slip Op. 02-105 at 20 (Ct. Int’l Trade Sept. 4, 2002) (“standard is based on alikelihood of continuation or recurrence of injury, not a certainty”); Usinor v. United States, 26 CIT 767, 794 (2002)(“‘likely’ is tantamount to ‘probable,’ not merely ‘possible’”).
120 For a complete statement of Commissioner Okun’s interpretation of the likely standard, see Additional Viewsof Vice Chairman Deanna Tanner Okun Concerning the “Likely” Standard in Certain Seamless Carbon and AlloySteel Standard, Line and Pressure Pipe From Argentina, Brazil, Germany, and Italy, Invs. Nos. 701-TA-362(Review) and 731-TA-707 to 710 (Review)(Remand), USITC Pub. 3754 (Feb. 2005).
121 19 U.S.C. § 1675a(a)(5).
122 SAA at 887. Among the factors that the Commission should consider in this regard are “the fungibility ordifferentiation within the product in question, the level of substitutability between the imported and domesticproducts, the channels of distribution used, the methods of contracting (such as spot sales or long-term contracts),and lead times for delivery of goods, as well as other factors that may only manifest themselves in the longer term,such as planned investment and the shifting of production facilities.” Id.
123 19 U.S.C. § 1675a(a)(1).
20

1675(a)(4).124 The statute further provides that the presence or absence of any factor that the Commissionis required to consider shall not necessarily give decisive guidance with respect to the Commission’sdetermination.125
In evaluating the likely volume of imports of subject merchandise if the orders under review arerevoked and/or the suspended investigation is terminated, the Commission is directed to consider whetherthe likely volume of imports would be significant either in absolute terms or relative to production orconsumption in the United States.126 In doing so, the Commission must consider “all relevant economicfactors,” including four enumerated factors: (1) any likely increase in production capacity or existingunused production capacity in the exporting country; (2) existing inventories of the subject merchandise,or likely increases in inventories; (3) the existence of barriers to the importation of the subjectmerchandise into countries other than the United States; and (4) the potential for product shifting ifproduction facilities in the foreign country, which can be used to produce the subject merchandise, arecurrently being used to produce other products.127
In evaluating the likely price effects of subject imports if the orders under review are revokedand/or the suspended investigation is terminated, the Commission is directed to consider whether there islikely to be significant underselling by the subject imports as compared to the domestic like product andwhether the subject imports are likely to enter the United States at prices that otherwise would have asignificant depressing or suppressing effect on the price of the domestic like product.128
In evaluating the likely impact of imports of subject merchandise if the orders under review arerevoked and/or the suspended investigation is terminated, the Commission is directed to consider allrelevant economic factors that are likely to have a bearing on the state of the industry in the United States,including but not limited to the following: (1) likely declines in output, sales, market share, profits,productivity, return on investments, and utilization of capacity; (2) likely negative effects on cash flow,inventories, employment, wages, growth, ability to raise capital, and investment; and (3) likely negativeeffects on the existing development and production efforts of the industry, including efforts to develop aderivative or more advanced version of the domestic like product.129 All relevant economic factors are tobe considered within the context of the business cycle and the conditions of competition that aredistinctive to the industry. As instructed by the statute, we have considered the extent to which anyimprovement in the state of the domestic industry is related to the orders under review and whether theindustry is vulnerable to material injury upon revocation.130
124 19 U.S.C. § 1675a(a)(1). Commerce has not issued any duty absorption findings with respect to CLPSS fromthe subject countries. See CR at I-10 n.10; PR at I-9 n.10.
125 19 U.S.C. § 1675a(a)(5). Although the Commission must consider all factors, no one factor is necessarilydispositive. SAA at 886.
126 19 U.S.C. § 1675a(a)(2).
127 19 U.S.C. § 1675a(a)(2)(A-D).
128 See 19 U.S.C. § 1675a(a)(3). The SAA states that “{c}onsistent with its practice in investigations, inconsidering the likely price effects of imports in the event of revocation and termination, the Commission may relyon circumstantial, as well as direct, evidence of the adverse effects of unfairly traded imports on domestic prices.” SAA at 886.
129 19 U.S.C. § 1675a(a)(4).
130 The SAA states that in assessing whether the domestic industry is vulnerable to injury if the order is revoked,the Commission “considers, in addition to imports, other factors that may be contributing to overall injury. Whilethese factors, in some cases, may account for the injury to the domestic industry, they may also demonstrate that anindustry is facing difficulties from a variety of sources and is vulnerable to dumped or subsidized imports.” SAA at
(continued...)
21

B. Findings in the Original Investigations
Conditions of Competition. In the original investigations, the Commission observed that U.S.demand for CLPSS increased over the period of investigation. The parties agreed that demand wasseasonal, peaking during a four to ten-week back-to-school shopping period beginning in July and endingno later than September.131 Both the domestically produced products and the subject imports wereprimarily sold to retailers, which increasingly imported CLPSS directly.132 A limited number of largeretailers, consisting of general merchandise superstores, office supply stores, and grocery chains andpharmacies, purchased substantial quantities of all lined paper products.133 Generally speaking, retailersplaced their paper orders in the fall of the preceding year, with U.S. production peaking in winter andspring.134
With respect to supply, during the 2003-05 period reviewed, the domestic industry was theprincipal supplier of the U.S. market, followed by the subject producers and then the nonsubjectproducers.135 The principal nonsubject sources of supply were Brazil, Canada, and Mexico.136
The Commission found that the domestic like product, the subject imports, and nonsubjectimports were generally substitutable. Most market participants indicated that domestic product andproduct from subject sources were always or frequently interchangeable and comparable in quality. TheCommission characterized price as an important factor in purchasing decisions, but observed thatpurchasers indicated that availability, delivery time, product consistency, quality, and reliability of supplywere also important purchasing considerations. It stated, however, that the because there were numerousreliable, quality suppliers in the market, the great majority of sales were ultimately made on price.137 Thecost of paper, the principal input in the production of lined paper products, increased during the period ofinvestigation.138
Subject Import Volume. In the original investigations, the Commission found that the volume ofcumulated subject imports increased significantly over the period of investigation, both in absolute termsand relative to consumption and production in the United States. The volume of cumulated subjectimports increased from 262.5 million pieces in 2003 to 291.7 million pieces in 2004 and then to 416.5million pieces in 2005. The market share of the subject imports also increased, and the subject importstook market share from the domestic industry.139
The Commission rejected respondents’ argument that the domestic industry was itself responsiblefor the increase in subject imports because of its outsourcing strategies. The Commission observed thatthe statute does not differentiate imports of subject merchandise by the identity of the importer, and thatwhen domestic producers import subject merchandise to remain competitive and avoid losing customers,
130 (...continued)885.
131 Original Determinations, USITC Pub. 3884 at 24.
132 Original Determinations, USITC Pub. 3884 at 26-27.
133 Original Determinations, USITC Pub. 3884 at 27.
134 Original Determinations, USITC Pub. 3884 at 25.
135 Original Determinations, USITC Pub. 3884 at 25.
136 Original Determinations, USITC Pub. 3884 at 26.
137 Original Determinations, USITC Pub. 2884 at 28.
138 Original Determinations, USITC Pub. 3884 at 27.
139 Original Determinations, USITC Pub. 3884 at 29.
22

“this action may itself be evidence of the material injury the industry is sustaining.”140 The Commissionalso acknowledged that nonsubject imports increased during the period examined, but stated that these didnot diminish the significance of the much larger increase in subject imports.141
Price Effects. The Commission began its price effects analysis by repeating its findings that thedomestic like product and the subject imports were generally substitutable, and that most sales were wonand lost on price.142 The Commission found significant underselling by the subject imports. Cumulatedsubject imports undersold the domestic like product in 78 of 126 quarterly comparisons, with marginsranging from 0.5 percent to 55.5 percent.143
The Commission further found that subject imports depressed domestic prices to a significantdegree overall, especially in 2004. Prices for the two products with the greatest volume of trade, forwhich the subject imports generally undersold the domestic like product, declined between 2003 and2005. There were additionally several confirmed lost sales and lost revenues allegations.144
Impact. In the original investigations, the Commission emphasized that nearly all the domesticindustry’s trade and financial indicators displayed negative trends that worsened as subject importsincreased. Notwithstanding increasing demand, the domestic industry’s production, shipments, capacity,and capacity utilization all declined. The domestic industry’s market share fell sharply.145 Employmentalso declined.146 Operating income, operating margins, capital expenditures, and research anddevelopment expenditures all displayed downward trends.147 The Commission found that the domesticindustry’s performance declines were caused by the increased volumes of subject imports thatsignificantly undersold the domestic like product and took market share away from the domestic industry. While the domestic industry did stabilize its financial condition at the end of the period of investigation, itdid this only by reducing domestic shipment quantities to maintain price levels. During this period, theincrease in subject import market penetration was particularly large.148
The Commission rejected the argument that the domestic industry’s injury was self-inflicted as aresult of its outsorcing strategies. The Commission observed that, under the statute, its analysis of impactexamined exclusively the domestic industry’s production operations within the United States.149 TheCommission further found as a factual matter that the subject imports were increasingly imported byentities other than domestic producers.150
140 Original Determinations, USITC Pub. 3884 at 29-30.
141 Original Determinations, USITC Pub. 3884 at 31.
142 Original Determinations, USITC Pub. 3884 at 32.
143 Original Determinations, USITC Pub. 3884 at 33.
144 Original Determinations, USITC Pub. 3884 at 34.
145 Original Determinations, USITC Pub. 3884 at 35-36.
146 Original Determinations, USITC Pub. 3884 at 36.
147 Original Determinations, USITC Pub. 3884 at 36-37.
148 Original Determinations, USITC Pub. 3884 at 37-38.
149 Original Determinations, USITC Pub. 3884 at 38.
150 Original Determinations, USITC Pub. 3884 at 39.
23

C. Conditions of Competition and the Business Cycle
In evaluating the likely impact of the subject imports on the domestic industry if an order isrevoked, the statute directs the Commission to consider all relevant economic factors “within the contextof the business cycle and conditions of competition that are distinctive to the affected industry.”151 Thefollowing conditions of competition inform our determinations.
1. Demand Conditions
Apparent U.S. consumption of LPP, based on the broader measure of import volume, fluctuatedwithin a narrow band during the period examined in these reviews, increasing from 1,135,979 pieces in2006 to 1,218,248 pieces in 2007, declining to 1,213,736 pieces in 2008 and 1,086,690 pieces in 2009,increasing to 1,206,771 pieces in 2010, and declining to 1,113,877 pieces in 2011, a level 1.9 percentlower than in 2006.152 Apparent U.S. consumption of LPP, based on the narrower measure of importvolume, was 945,441 pieces in 2010 and 896,348 pieces in 2011.153
Consistent with these data, AASPS characterizes the U.S. CLPSS market as “mature andstable.”154 When asked how overall demand for LPP has changed in the United States since 2006, aplurality of producers reported that demand has fluctuated while a plurality of importers, purchasers, andforeign producers reported that demand for LPP has remained unchanged.155 When asked aboutanticipated changes in LPP demand in the United States, a plurality of producers indicated that theybelieved demand would fluctuate, and pluralities of other market participants indicated that theyanticipated that demand for LPP will not change.156
Most LPP is purchased by retailers, and the concentration of purchases in the hands of a few largeretailers increased since the original investigations.157 The largest five responding purchasers (***)accounted for *** percent of reported purchases and 32 percent of apparent U.S. consumption in 2011.158
Demand of LPP is highly seasonal, with purchases peaking in the second and third quarters ofeach year as retailers stock up for back-to-school promotions.159 The back-to-school season runs frommid-July through September.160
2. Supply Conditions
During the period examined in these reviews, the domestic industry’s share of apparent U.S.consumption, based on the broader measure of import volume, declined from 27.4 percent in 2006 to 22.7percent in 2007, increased to 23.4 percent in 2008 and 23.6 percent in 2009, declined to 22.5 percent in
151 19 U.S.C. § 1675a(a)(4).
152 CR/PR at Table I-11.
153 CR/PR at Table I-12.
154 CR at II-12; PR at II-7.
155 CR at II-12; PR at II-7.
156 CR at II-12; PR at II-7.
157 CR/PR at II-1; Hearing Tr. at 132-33 (Mclachlan).
158 CR/PR at II-1.
159 CR at II-11; PR at II-7.
160 CR at II-11; PR at II-7.
24

2010, and increased to 25.3 percent in 2011, a level 2.1 percentage points lower than in 2006.161 Thedomestic industry’s share of apparent U.S. consumption, based on the narrower measure of importvolume, was 28.7 percent in 2010 and 31.4 percent in 2011.162 The three largest domestic producers ofLPP, ***, together accounted for *** percent of reported domestic production of LPP in 2011.163
Domestic industry capacity declined from 547.9 million pieces in 2006 to 540.8 million pieces in2007 before increasing steadily to 601.3 million pieces in 2011, a level 9.7 percent higher than in 2006.164 The increase in domestic industry capacity resulted in part from ***.165 As of the end of the period ofreview, *** were each considering additions to their LPP production capacity and ***.166
Based on the broader measure of import volume, cumulated subject imports from China and Indiaaccounted for between 13.9 and 16.1 percent of apparent U.S. consumption between 2006 and 2011,while subject imports from Indonesia accounted for between 0.3 and 0.8 percent of apparent U.S.consumption.167 Based on the narrower measure of import volume, cumulated subject imports from Chinaand India accounted for 6.0 percent of apparent U.S. consumption in 2010 and 4.7 percent in 2011, whilesubject imports from Indonesia accounted for 0.2 percent of apparent U.S. consumption in both years.168 Customs data indicates that the only entry of LPP from Indonesia during the period of review on whichduties were paid occurred in 2006.169
The market penetration trends of subject imports from China, India, and Indonesia varied uponimposition of the antidumping and countervailing duty orders. Based on the broader measure of importvolume, subject imports from China as a share of apparent U.S. consumption declined *** from ***percent in 2005 to 14.0 percent in 2006 before declining irregularly to 10.8 percent in 2011.170 Subjectimports from India as a share of apparent U.S. consumption declined *** from *** percent of apparentU.S. consumption in 2005 to 2.1 percent in 2006 before increasing irregularly to 3.1 percent in 2011.171 Subject imports from Indonesia accounted for *** percent of apparent U.S. consumption in 2005,172 butlargely exited the U.S. market after 2006.173
Information on the Chinese industry during the period of review is limited because none of the 17Chinese producers that received a foreign producers’ questionnaire responded to it.174 The informationavailable indicates that China surpassed the United States in 2008 as the world’s largest paper andpaperboard producer, and the world’s third largest exporter of paper products, by value.175 Chineseproduction of all paper and paperboard increased 165 percent between 2001 and 2010, from 36.4 million
161 CR/PR at Table I-11.
162 CR/PR at Table I-13.
163 CR/PR at Table I-8.
164 CR/PR at Table III-2.
165 CR/PR at Table III-1. ***. Id.
166 CR at III-3; PR at III-2. *** Id.
167 CR/PR at Table I-11.
168 CR/PR at Table I-13.
169 CR/PR at IV-2 n.8.
170 CR/PR at Table I-1.
171 CR/PR at Table I-1.
172 CR/PR at Table I-1.
173 CR/PR at IV-2 n.8.
174 CR at IV-13; PR at IV-11.
175 CR at IV-13; PR at IV-11; CR/PR at Table IV-13.
25
metric tons to 96.5 million metric tons, while Chinese production of printing and writing paper of the kindused to produce LPP increased 155 percent over the same period, from 9 million metric tons to 23 millionmetric tons.176
The Indian paper and paperboard industry is highly fragmented with about 600 operating mills,many of which are small.177 Nevertheless, the eight responding Indian producers estimated that theyaccounted for *** percent of Indian production of CLPSS in 2010.178 There is evidence that some Indianproducers procure CLPSS from subcontractors in order to sell CLPSS in quantities that would otherwiseexceed their own production capacity.179
Tjiwi, part of the Asia Pulp and Paper Group, accounted for *** percent of Indonesian CLPSSproduction in 2011 and was ***.180 As part of the Asia Pulp and Paper Group, Tjiwi stated that its “basicbusiness objective” is to use paper sourced from Asia Pulp and Paper’s Indonesian operations, whichhave not received certification for observing sustainable forestry practices.181
Imports of CLPSS from nonsubject countries combined accounted for between 24.9 and 32.1percent of apparent U.S. consumption, based on the broader measure of import volume, during the periodexamined in these reviews.182 Based on the narrower measure of import volume, such imports accountedfor 18.4 percent of apparent U.S. consumption in 2010 and 19.4 percent in 2011.183 Leading sources ofnonsubject imports during the period examined in the reviews were Vietnam, which was the largestsource of nonsubject imports, Brazil, Egypt, Mexico, and Taiwan.184
3. Other Likely Conditions of Competition
As addressed in section III.C. above, there is a moderate to high degree of substitutabilitybetween subject imports from each source and the domestic like product.185
The record also indicates that price is an important factor for purchasing decisions in the U.S.LPP market. When asked to rank the factors used in purchasing decisions, responding purchasers ranked“price” as the most important factor more than any other factor and ranked price among the three most
176 CR at IV-13; PR at IV-11.
177 CR at IV-14; PR at IV-11.
178 CR at IV-15; PR at IV-12.
179 *** each bid on business in 2011 that was in excess of their reported capacity that year. See ForeignProducers’ Questionnaire Response of ***at Question II-14b (capacity of *** pieces per year in 2011; ***); ForeignProducers’ Questionnaire Response of *** at Question II-14b (capacity of *** pieces per year in 2011); CR/PR atTable V-11 (*** bids totaling *** pieces), 32 (*** bid for *** pieces). Indeed, Navneet reported both its owncapacity and its capacity “with subcontractor amounts” in response to question II-14b of the foreign producers’questionnaire.
180 CR at IV-19; PR at IV-16.
181 Hearing Tr. at 186-87 (Alfian). Environmental certification is conferred by organizations such as theProgramme for the Endorsement of Forest Certification (“PEFC”) and the Forest Stewardship Council (“FSC”). SeeTjiwi’s Prehearing Brief at 33, Exhibit 8.
182 CR/PR at Table I-11.
183 CR/PR at Table I-13.
184 CR at II-10; PR at II-11; CR/PR at IV-2.
185 See CR at II-13; PR at II-8; CR/PR at Tables II-8-10.
26

important factors more than any other factor.186 More than half of responding purchasers reported thatthey “always” or “usually” purchase the lowest-priced LPP, while five reported “sometimes” and sixreported “never.”187 When asked to rate the importance of 21 enumerated factors when making LPPpurchasing decisions, 23 of 25 responding purchasers rated “price” as “very important.”188 Respondingpurchasers also indicated that availability and reliability of supply were very important factors in theirpurchasing decisions.189
Several other factors serve to magnify the importance of price in the U.S. LPP market. Retailersoften sell LPP at a loss as a “loss leader,” calculated to attract customers into the store in the hope thatthey will make discretionary purchases of profitable products.190 In addition, the record indicates that theprevalence of auctions held by retailers, and the increased use of multilevel bidding processes, hasincreased the importance of price in the U.S. market since the original period of investigation.191 Anotherfactor that has heightened price competition is direct imports of CLPSS by retailers with offices inAsia.192
D. Revocation of the Antidumping Duty Orders on Subject Imports from China andIndia Is Likely to Lead to Continuation or Recurrence of Material Injury to theDomestic Industry within a Reasonably Foreseeable Time193
1. Likely Volume of Subject Imports
We find that cumulated subject imports from China and India are likely to increase significantlyfrom current levels after revocation of the orders. As discussed below, subject producers in China andIndia have both the means and the incentive to significantly increase their exports to the U.S. market afterrevocation.
Since imposition of the orders, cumulated subject imports from China and India have maintaineda continuous presence in the U.S. market. Based on the broader measure of import volume, cumulatedsubject import volume from China and India declined from 183.8 million pieces in 2006 to 170.7 millionpieces in 2007, increased to 178.8 million pieces in 2008, and then declined to 173.7 million pieces in2009 to 170.1 million pieces in 2010 and 154.2 million pieces in 2011.194 As a share of apparent U.S.consumption, cumulated subject imports from China and India declined from 16.1 percent in 2006 to 14.0percent in 2007, increased to 14.7 percent in 2008 and 15.9 percent in 2009, and then declined to 14.1percent in 2010 and 13.9 percent in 2011.195 Based on the narrower measure of import volume,cumulated subject import volume from China and India was 56.8 million pieces in 2010, equivalent to 6.0percent of apparent U.S. consumption, and 43.0 million pieces in 2011, equivalent to 4.7 percent of
186 CR/PR at Table II-14.
187 CR at II-15; PR at II-9.
188 CR/PR at Table II-5.
189 CR/PR at Table II-7. Twenty-three of 25 responding purchasers ranked price, availability, and reliability ofsupply as “very important” to their purchasing decisions. Id.
190 CR at II-1-2; PR at II-1; Hearing Tr. at 70 (Rahn), 70-71 (Robinson).
191 CR at V-25 & n.56; PR at V-8 & n.56; Hearing Tr. at 131-32 (Robinson), 132-33 (McLachlan).
192 CR/PR at Table II-1; CR at V-5; PR at V-4; Hearing Tr. at 52 (Kaplan), 129 (Robinson).
193 Commissioners Okun, Pearson, and Johanson do not join this section of the opinion.
194 CR/PR at Table I-11.
195 CR/PR at Table I-11.
27

apparent U.S. consumption.196 Thus, subject producers in China and India have demonstrated a continuedinterest in serving the U.S. market, and maintain ongoing relationships with U.S. customers.
Subject producers in China and India also possessed significant capacity in 2011 with which theycould significantly increase exports to the United States. The excess capacity of reporting Chineseproducers in 2005 was *** pieces.197 Information available indicates that the Chinese industry’s totalcapacity, and excess capacity, have likely increased since 2005. China surpassed the United States in2008 as the world’s largest paper and paperboard producer, and the world’s third largest exporter of paperproducts, by value.198 Chinese production of all paper and paperboard increased 165 percent between2001 and 2010, from 36.4 million metric tons to 96.5 million metric tons, while Chinese production ofprinting and writing paper of the kind used to product LPP increased 155 percent over the same period,from 9 million metric tons to 23 million metric tons.199 The Chinese government’s current “five yearplan” expressly identifies the paper industry as a new source of economic growth.200 This information,together with that collected in the original investigations, supports a finding that subject producers inChina possess the capacity with which to significantly increase exports to the United States.
Responding Indian producers reported a significant increase in their capacity during the periodexamined in the reviews and possessed significant excess capacity in 2011. Responding Indian producersreported that their capacity increased from 44.0 million pieces in 2006 to 51.9 million pieces in 2007,59.8 million pieces in 2008, 64.8 million pieces in 2009, 76.6 million pieces in 2010, and 85.1 millionpieces in 2011.201 In 2011, responding Indian producers reported a capacity utilization rate of 83.1percent, resulting in excess capacity of 14.4 million pieces.202 These data likely understate the ability ofIndian producers to increase exports to the United States, given evidence that Indian producers usesubcontractors to sell CLPSS in volumes that would otherwise exceed their own production capacity.203
196 CR/PR at Table I-12.
197 CR at IV-13; PR at IV-11.
198 CR at IV-13; PR at IV-11; CR/PR at Table IV-13.
199 CR at IV-13; PR at IV-11.
200 CR at IV-13; PR at IV-11.
201 CR/PR at Table IV-9. We are unpersuaded by the Indian respondents’ argument that the apparent increase inIndian production capacity was a function of the fact that responding Indian producers accounted for 13 percent ofIndian exports to the United States in 2006 but 91 percent of such exports in 2011. Indian Respondents’ PosthearingBrief at 4-5. The Indian respondents’ coverage comparisons are not comparable because the 2006 coverage figure isbased on the broader measure of subject imports and the 2011 figure is based on the narrower measure. In anyevent, because the responding Indian producers accounted for the vast majority of subject imports from India in2011, we find their reported data to be representative of the portion of the Indian industry during the periodexamined in these reviews that is currently exporting subject merchandise to the United States and is likely to do soin the reasonably foreseeable future.
202 CR/PR at Tables I-12, IV-9.
203 *** each bid on business in 2011 that was in excess of their reported capacity that year. See ForeignProducers’ Questionnaire Response of *** at Question II-14b (capacity of *** pieces per year in 2011; ***);Foreign Producers’ Questionnaire Response of *** at Question II-14b (capacity of *** pieces per year in 2011);CR/PR at Table V-11 (*** bids totaling *** pieces), 32 (*** bid for *** pieces). Indeed, Navneet reported both itsown capacity and its capacity “with subcontractor amounts” in response to question II-14b of the foreign producers’questionnaire.
In addition, *** responding Indian producers reported the ability to shift production from OLPP to CLPSSusing the same equipment and/or labor. See Foreign Producers’ Questionnaire Responses of *** at Question II-7. These producers together produced *** pieces of OLPP in 2011. See id. at Question II-5. Accordingly, by shifting
(continued...)
28
In addition, three Indian producers that did not complete questionnaire responses, ***, bid on contracts tosupply U.S. purchasers with significant volumes of CLPSS in 2011, indicating that there are Indianproducers other than the responding Indian producers with the ability to increase exports of CLPSS to theUnited States.204 In sum, we find that producers in China and India, on a cumulated basis, possess thecapacity with which to significantly increase exports to the United States.
Subject producers in China and India also have the incentive to use their excess capacity toincrease exports to the United States after revocation, given their significant degree of export orientationand the size of the U.S. market. The information available indicates that the Chinese paper productsindustry is export oriented. Reporting Chinese CLPSS producers exported *** percent of all shipments in2005, and exports to the United States accounted for the *** share of these producers’ reportedshipments.205 While no producer of subject merchandise provided information to the Commission inthese reviews, available public data indicate that China was the world’s third largest exporter of paperproducts, by value, in 2011.206 Responding Indian producers reported that their export orientationincreased significantly during the period examined in these reviews.207 They reported that exports as ashare of their total shipments increased from 38.7 percent in 2006 to 45.5 percent in 2007, 48.1 percent in2008, declined to 47.9 percent in 2008, and then increased to 51.5 percent in 2010 and 2011.208 Theyreported that exports to the United States as a share of their total shipments increased from 10.5 percent in2006 to 18.5 percent in 2007, declined to 12.4 percent in 2008, increased to 19.0 percent in 2009 and 27.1percent in 2010, and then declined to 26.8 percent in 2011, a level over twice that in 2006.209 The UnitedStates was by far the largest export market for Indian producers throughout the period.210
Given its large and stable market, the United States would likely be targeted by Chinese andIndian producers interested in filling their capacity and increasing their exports. In the originalinvestigations, Chinese producers signaled their keen interest in serving the U.S. market by rapidlyincreasing their share of apparent U.S. consumption, based on the broader measure of import volume,from *** percent in 2003 to *** percent in 2005.211 There is no information on the record indicating thatChinese producers would be any less interested in serving the U.S. market today. Indian producers havedemonstrated their interest in increasing their penetration of the U.S. market by both increasing theirshare of apparent U.S. consumption since imposition of the orders and bidding on contracts representing alarge volume of sales in 2011.212
203 (...continued)production from OLPP to CLPSS, these producers have the ability to increase significantly their exports of CLPSSto the United States after revocation.
204 CR/PR at Table V-11. One or more of these three producers bid on four contracts for the supply of anaggregate *** pieces of CLPSS. Id. We note that this evidence conflicts with the Indian respondents’ contentionthat *** has ***. See Indian Respondents’ Posthearing Brief at Exhibit 3.
205 CR at IV-13; PR at IV-11.
206 CR/PR at Table IV-13.
207 CR/PR at Table IV-9.
208 CR/PR at Table IV-9.
209 CR/PR at Table IV-9.
210 CR/PR at Table IV-9.
211 CR/PR at Table I-1.
212 See CR/PR at Tables I-1, I-12-13, V-11. Purchasers were asked to report bid data for their three largestpurchases based on dollar value in 2011. CR at V-26; PR at V-8. Although only *** percent of the value of the
(continued...)
29

Responding purchasers and importers indicated that revocation of the orders would likely resultin increased subject imports from China and India. Specifically, when asked how revocation of theantidumping duty orders on CLPSS from China and India and the countervailing duty order on CLPSSfrom India would affect their future activities, 11 responding purchasers indicated that revocation of theorders would make them more receptive to subject imports from China and India.213 Nine respondingimporters reported that they would consider increasing imports of CLPSS from China and/or India werethe orders to be revoked.214
For all of these reasons, we conclude that revocation of the orders on subject imports from Chinaand India would likely result in a significant increase in cumulated subject imports from China and Indiawithin a reasonably foreseeable time.215
2. Likely Price Effects
We find that cumulated subject imports from China and India would likely undersell the domesticlike product to a significant degree after revocation, thereby depressing domestic like product prices to asignificant degree. We conduct our analysis of likely price effects in light of our finding that there is amoderate to high degree of interchangeability between subject imports from each of the sources and thedomestic like product, and that price is an important factor in the U.S. LPP market, as detailed in sectionsIII.C and IV.C.3 above.
The Commission collected pricing data on sales of five products.216 Five U.S. producers and tenimporters provided usable pricing data, although not every responding U.S. producer or importer reportedpricing data for every product.217 In addition, the Commission collected purchase price data from fourretailers that imported CLPSS directly.218 Reported sale price data accounted for approximately ***percent of U.S. producers’ U.S. commercial shipments, *** percent of reported U.S. commercialshipments of subject imports from China, and *** percent of reported U.S. commercial shipments of
212 (...continued)reported contracts was awarded to Indian producers, id., we find it more instructive that Indian producers bid on sixof the twelve reported contracts, representing *** percent of the total contract volume on which bidding data wasreported. CR/PR at Table V-11.
213 See CR/PR at D-17-18.
214 See CR/PR at D-15-16.
215 U.S. importers of subject imports from China and India did not report significant inventories at the end of theperiod of review. With respect to existing inventories of subject merchandise, U.S. importers’ end-of-periodinventories of cumulated subject imports from China and India were *** pieces in 2011, equivalent to *** percent ofU.S. shipments of such imports that year. CR/PR at Table IV-5. Responding Indian producers reported end-of-period inventory of *** pieces in 2011, equivalent to *** percent of their total shipments that year. CR/PR at TableIV-9. Absent evidence to the contrary, we accept Indian respondents’ claim that these inventories consist of CLPSSproducts suitable only for the Indian market, as all CLPSS exported to the United States is produced to order. Hearing Tr. at 167 (Sampat).
There are no known antidumping or countervailing duty investigations or determinations on CLPSS fromChina or India in any other country. CR at IV-9; PR at IV-7.
216 CR at V-4; PR at V-3.
217 CR at V-4; PR at V-3-4.
218 CR at V-5; PR at V-4.
30

subject imports from India.219 Reported purchase price data accounted for approximately *** percent ofreported U.S. commercial shipments of subject imports from China, and *** percent of reported U.S.commercial shipments of subject imports from India.220
As an initial matter, prices for domestically produced CLPSS generally increased after impositionof the orders. In terms of annual weighted-average f.o.b. selling prices,221 domestically produced product1 prices increased from $*** in 2005 to $*** in 2011, domestically produced product 2 prices increasedfrom $*** in 2005 to $*** in 2011, and domestically produced product 3 prices increased from $*** in2005 to $*** in 2011.222 Between the first and last quarters for which pricing data were collected in thesereviews, domestic prices increased *** percent with respect to product 1, *** percent with respect toproduct 2, *** percent with respect to product 3 and *** percent with respect to product 5.223 Theincrease in prices for domestically produced products 1 and 2 are particularly noteworthy, as these werethe highest volume pricing products.224 These data suggest that the orders have been effective at reversingthe significant degree of price depression that the Commission found to have been caused by subjectimports in the original investigations.225
The record indicates that cumulated subject imports from China and India undersold the domesticlike product to a significant degree even with the orders in place. During the period examined in thesereviews, cumulated subject imports from China and India undersold the domestic like product in 28quarterly comparisons and oversold the domestic like product in 41 quarterly comparisons.226 However,the seasonality of the U.S. CLPSS market, with sales volume concentrated in the second and thirdquarters of each year, makes counting quarters of under and overselling less instructive.227 Under thefacts of this case, we find it more probative that a *** greater volume of cumulated subject import volumeundersold the domestic like product, *** pieces, than oversold the domestic like product, *** pieces.228 Thus, even under the discipline of the orders, *** percent of reported commercial shipments of cumulatedsubject imports undersold the domestic like product, which is consistent with the *** percent of reported
219 CR at V-5 & nn.45-46; PR at V-4 nn.45-46.
220 CR at V-5 & nn.45-46; PR at V-4 nn.45-46.
221 We rely on annual quantity weighted average sales prices, which give less weight to quarterly fluctuations, tocompensate for the seasonality of the U.S. CLPSS market. CR at V-5; PR at V-4.
222 Compare OCR/OPR at Tables V-1-3 with CR/PR at Table V-8. No pricing was reported for domesticallyproduced product 4 sold during the 2006-2010 period, but the annual weighted-average f.o.b. price of domesticallyproduced product 4 in 2011, at $***, was slightly lower than in 2005, at $***. Compare OCR/OPR at Tables V-4with CR/PR at Table V-8.
223 CR/PR at Table V-7. Domestic prices for product 4 declined *** percent. Id.
224 See CR/PR at Tables V-2-6.
225 Original Determinations, USITC Pub. 3884 at 34.
226 CR at V-10-11; PR at V-4; PR at V-7-8; CR/PR at Table V-8.
227 CR at V-5; PR at V-4; CR/PR at Tables V-2-6.
228 See CR/PR at Tables V-2-6. We have considered bid data reported by six purchasers, covering eachpurchaser’s three largest purchases by dollar value in 2011. CR at V-26; PR at V-8. These data indicate that ***percent of the value of the contracts was awarded to Indian suppliers, CR/PR at Table V-11, which is greater thanthe 2.1 percent share of apparent U.S. consumption, by value, captured by Indian producers in 2011, based on thenarrower measure of imports. CR/PR at Table I-13. We note that in every instance of Indian producer bids incompetition with domestic producer bids, the Indian bid prices were lower. See CR/PR at Table V-11. Purchasersreported no bids from Chinese producers. See id.
31

commercial shipments of subject imports from China and India that undersold the domestic like productin the original investigations.229
We also have considered purchase price data reported by retailers that imported CLPSS fromChina and India.230 Retailer direct import purchase price data accounted for *** percent of reported U.S.commercial shipments of subject imports from China, and *** percent of reported U.S. commercialshipments of subject imports from India.231 While recognizing that these data are at a different level oftrade than domestic producer sales prices, we observe that retailer direct import purchase prices forsubject imports from China and India were lower than domestic like product sales prices with respect topurchases of *** pieces and higher with respect to purchases of *** pieces.232 The fact that *** percentof reported retailer purchases of subject imports from China and India were priced lower than domesticproducer sales lends additional support to our finding that subject imports from China and India werepriced aggressively even with the orders in place.
In view of our finding that the cumulated volume of subject imports from China and India wouldlikely increase significantly after revocation, the moderate to high degree of substitutability betweensubject imports and the domestic like product, the importance of price, and the prevalence of subjectimport underselling even with the orders in place, we find that subject import underselling would likelyintensify after revocation of the orders, as subject producers in China and India seek to increase theirpenetration of the U.S. market. We also find that the significant underselling of subject imports fromChina and India after revocation would likely result in the depression of domestic like product prices to asignificant degree. The disciplining effect of the orders has enabled domestic producers to raise theirprices. After revocation, domestic producers would likely have to reduce their prices to retain theirmarket share and maintain an acceptable rate of capacity utilization in the face of significantly increasedquantities of low priced subject imports from China and India. When asked how revocation of the orderswould likely effect the U.S. CLPSS market as a whole, six responding purchasers indicated that CLPSSprices would likely decline.233
Thus, we conclude that, if the orders were revoked, significant volumes of subject imports fromChina and India likely would significantly undersell the domestic like product to gain market share,thereby depressing like product prices to a significant degree.
229 See OCR/OPR at Tables V-2-6. In the original investigations, subject imports from China and India undersoldthe domestic like product in 43 quarterly comparisons and oversold the domestic like product in 61 quarterlycomparisons. CR/PR at Table V-10 n.1.
230 CR at V-5; PR at V-4.
231 CR at V-5 nn.45-46; PR at V-4 nn.45-46.
232 See CR/PR at Tables V-2-6.
233 CR/PR at D-19-20 (responses of ***).
32

3. Likely Impact234
We find that the domestic industry is not in a vulnerable condition. As LPP prices increasedduring the period examined in these reviews, the domestic industry’s operating income and return oninvestment increased to robust levels. Other indices of domestic industry performance increased as well,including capacity, production, employment, net shipments, U.S. shipments, and net sales, although not asmarkedly.
Domestic industry capacity and production increased during the period examined, although theindustry’s rate of capacity utilization ended the period slightly lower as the increase in its capacityexceeded the increase in its production. Domestic industry LPP capacity increased irregularly from 547.9million pieces in 2006 to 601.3 million pieces in 2011, a level 9.7 percent higher than in 2006.235 Domestic industry LPP production declined steadily from 305.0 million pieces in 2006 to 222.1 millionpieces in 2009 before increasing to 260.8 million pieces in 2010 and 330.5 million pieces in 2011, a level8.3 percent higher than in 2006.236 The domestic industry’s rate of capacity utilization declined from 55.7percent in 2006 to 53.7 percent in 2007, 50.3 percent in 2008, and 39.5 percent in 2009 before increasingto 45.8 percent in 2010 and 55.0 percent in 2011.237
Domestic industry employment, hours worked, and wages generally improved during the periodof review, although productivity declined slightly. Domestic industry employment increased from 498production and related workers (“PRWs”) in 2006 to 506 PRWs in 2007, declined to 500 PRWs in 2008and 485 PRWs in 2009, and then increased to 519 PRWs in 2010 and 524 PRWs in 2011, a level 5.2percent higher than in 2005.238 Domestic industry hours worked increased from 853,000 hours in 2006 to868,000 hours in 2007 and 869,000 hours in 2008, declined to 846,000 hours in 2009, and then increasedto 879,000 hours in 2010 and 942,000 hours in 2011, a level 10.4 percent higher than in 2006.239 Domestic industry wages paid increased from $24.4 million in 2006 to $24.7 million in 2007, declined to$24.2 million in 2008 and 2009, and then increased to $25.7 million in 2010 and $26.4 million in 2011, alevel 8.2 percent higher than in 2005.240 Domestic industry productivity, however, declined 1.9 percentduring the period, from 357.6 pieces per hour in 2006 to 350.8 pieces per hour in 2011.241
Domestic industry sales volume and market share fluctuated during the period examined. Thedomestic industry’s net sales quantity declined from 320.9 million pieces in 2006 to 287.5 million piecesin 2007, increased to 294.4 million pieces in 2008, declined to 263.6 million pieces in 2009, and thenincreased to 279.6 million pieces in 2010 and 290.7 million pieces in 2011, a level 9.4 percent lower than
234 Section 752(a)(6) of the Act states that “the Commission may consider the magnitude of the margin ofdumping” in making its determination in a five-year review. 19 U.S.C. § 1675a(a)(6). The statute defines the“magnitude of the margin of dumping” to be used by the Commission in five-year reviews as “the dumping marginor margins determined by the administering authority under section 1675a(c)(3) of this title.” 19 U.S.C.§ 1677(35)(C)(iv). See also SAA at 887. Commerce calculated likely antidumping duty margins ranging from78.38 to 258.21 percent for exporters in China and from 3.91 to 23.17 percent for exporters in India. CR/PR atTable I-6. It calculated likely countervailing duty margins of 7.52 to 10.71 percent for exporters in India. Id. atTable I-5.
235 CR/PR at Table III-2.
236 CR/PR at Table III-2.
237 CR/PR at Table III-2.
238 CR/PR at Table III-8.
239 CR/PR at Table III-8.
240 CR/PR at Table III-8.
241 CR/PR at Table III-8.
33

in 2006.242 The domestic industry’s U.S. shipments followed a similar trend, declining from 310.7million pieces in 2006 to 276.9 million pieces in 2007, increasing to 284.5 million pieces in 2008,declining in 256.2 million pieces in 2009, and then increasing to 271.7 million pieces in 2010 and 281.3million pieces in 2011, a level 9.5 percent lower than in 2006.243 The domestic industry’s share ofapparent U.S. consumption, based on the broader measure of import volume, declined from 27.4 percentin 2006 to 22.7 percent in 2007, increased to 23.4 percent in 2008 and 23.6 percent in 2009, declined to22.5 percent in 2010, and then increased to 25.3 percent in 2011, a level 2.1 percentage points lower thanin 2006.244 Based on the narrower measure of import volume, however, the domestic industry’s share ofapparent U.S. consumption was 28.7 percent in 2010 and 31.4 percent in 2011.245
The domestic industry displayed strong financial performance during the period examined,notwithstanding a general decline in the industry’s net sales value. The domestic industry’s net salesvalue declined from $251.7 million in 2006 to $245.8 million in 2007, $244.3 million in 2008, $240.2million in 2009, and $230.8 million in 2010, before increasing to $243.3 million in 2011, a level 3.3percent lower than in 2006.246 Although the domestic industry’s operating income fluctuated during theperiod examined, it was higher in 2011 than in 2006 and the industry’s operating income as a share of netsales remained above *** percent throughout the period. The domestic industry’s operating incomedeclined from $34.3 million in 2006 to $31.8 million in 2007, increased to $38.0 million in 2008 and$44.1 million in 2009, and then declined to $43.0 million in 2010 and $37.4 million in 2011, a level 8.9percent higher than in 2006.247 The industry’s operating income as a share of net sales declined from 13.6percent in 2006 to 12.9 percent in 2007, increased to 15.6 percent in 2008, 18.4 percent in 2009, and 18.7percent in 2010, and then declined to 15.4 percent in 2011, a level still 1.8 percentage points higher thanin 2006.248 The domestic industry’s return on investment was even stronger, increasing from 27.3 percentin 2006 to 27.8 percent in 2007, 35.7 percent in 2008, 42.0 percent in 2009, and 43.0 percent in 2010,before declining to 37.6 percent in 2011, a level still 10.3 percentage points higher than in 2006.249
The domestic industry’s financial performance enabled producers to make significant investmentsin their operations during the period examined.250 The industry’s capital expenditures increased from
242 CR/PR at Table III-9.
243 CR/PR at Table III-3. The domestic industry’s end-of-period inventories fluctuated during the periodexamined, increasing from *** pieces in 2006 to *** pieces in 2007, declining to *** pieces in 2008, *** pieces in2009, and *** pieces in 2010, and then increasing to *** pieces in 2011, a level *** percent higher than in 2006. CR/PR at Table III-4. The industry’s end-of-period inventories as a share of its production increased from ***percent in 2006 to *** percent in 2007 and *** percent in 2008, declined to *** percent in 2009 and *** percent in2010, and then increased to *** percent in 2011. Id. The industry’s end-of-period inventories as a share of its U.S.shipments increased from *** percent in 2006 to *** percent in 2007, declined to *** percent in 2008, *** percentin 2009, and *** percent in 2010, and increased to *** percent in 2011. Id. According to AASPS, the domesticindustry maintains inventories of CLPSS due to the seasonal nature of the CLPSS market, to balance productionschedules with shipment timing and logistical requirements. AASPS’s Posthearing Brief, Exhibit 1 at 44.
244 CR/PR at Table I-11.
245 CR/PR at Table I-13.
246 CR/PR at Table III-9.
247 CR/PR at Table III-9.
248 CR/PR at Table III-9.
249 CR/PR at Table III-12.
250 Responding domestic producers reported no research and development expenditures. CR at III-16; PR at III-9.
34

$*** in 2006 to $*** in 2007 and $*** in 2008, declined to $*** in 2009, and then increased to $*** in2010 and $*** in 2011.251
In light of the foregoing analysis, and also projected stable demand for LPP,252 we find that thedomestic industry is not in a vulnerable condition. Nevertheless, the domestic industry’s improvedfinancial performance resulted largely from the higher prices permitted by the disciplining effect of theorders on subject imports from China and India.253 Were the orders to be revoked, we find that cumulatedsubject imports from China and India would likely have a significant adverse impact on the domesticindustry.
As addressed above, we have found that revocation of the orders on subject imports from Chinaand India would likely result in a significant increase in subject import volume that would likely undersellthe domestic like product, thereby depressing domestic like product prices to a significant degree. Giventhat the domestic industry’s improved financial performance resulted largely from the higher pricespermitted by the disciplining effect of the orders,254 we find that the likely volume and price effects of thesubject imports would likely have a significant adverse impact on the domestic industry’s profitabilityand return on investment, as well as its ability to raise capital and make and maintain necessary capitalinvestments.255 We find that the likely volume and price effects of the subject imports also would likelyhave a significant adverse impact on the production, shipments, sales, market share, revenues, andemployment of the domestic industry. We therefore conclude that, if the orders were revoked, subjectimports from China and India would be likely to have a significant adverse impact on the domesticindustry within a reasonably foreseeable time.
In our analysis of the likely impact of subject imports on the domestic industry, we have takeninto account whether there are other factors that likely would affect the domestic industry. As discussedabove, nonsubject imports maintained a significant share of apparent U.S. consumption during the periodexamined in these reviews. Nonsubject imports of CLPSS as a share of apparent U.S. consumption,based on the broader measure of import volume, increased from 26.4 percent in 2006 to 30.1 percent in2007 and 32.1 percent in 2008, declined to 26.2 percent in 2009, increased to 26.5 percent in 2010, andthen declined to 24.9 percent in 2011.256 Based on the narrower measure of import volume, nonsubjectimports as a share of apparent U.S. consumption were 18.4 percent in 2010 and 19.4 percent in 2011.257 We find that nonsubject imports do not weaken the causal nexus between cumulated subject imports andthe likelihood of continuation or recurrence of material injury to the domestic industry after revocation ofthe orders for several reasons. The significant volume and market share of nonsubject imports throughoutthe period examined did not prevent the domestic industry from raising prices and enjoying strongfinancial performance throughout the period.258 In this regard, witnesses for AASPS testified at the
251 CR/PR at Table III-11. ***. CR at III-16 n.11; PR at III-9 n.11.
252 See CR/PR at Table II-2.
253 See CR at III-15; PR at III-7; CR/PR at Table V-8.
254 See CR at III-15; PR at III-7.
255 See CR/PR at D-3-8.
256 CR/PR at Table I-11.
257 CR/PR at Table I-13.
258 See CR/PR at Table III-9. We are unpersuaded by the Indian respondents’ argument that revocation of theantidumping and countervailing duty orders on CLPSS from India would not likely result in the continuation orrecurrence of material injury to the domestic industry because the domestic industry remained profitable during theperiod examined notwithstanding the presence of subject imports from India. See Indian Respondents’ PrehearingBrief at 18-20; Indian Respondents’ Final Comments at 3. Because we have determined to exercise our discretion to
(continued...)
35

hearing that nonsubject import competition has not adversely impacted the domestic industry’sperformance because nonsubject imports have not been priced aggressively.259 Bidding data confirms thatbids from nonsubject import suppliers in competition with bids from Indian suppliers were generallyhigher than the Indian suppliers’ bids,260 and nonsubject imports did not increase their penetration of theU.S. market from 2006 to 2011.261 Accordingly, we find that subject imports from China and India arelikely to have a significant adverse impact on the domestic industry if the orders were revoked,notwithstanding the presence of nonsubject imports in the U.S. market. Thus, we conclude that if theorders were revoked, cumulated subject imports from China and India would likely lead to thecontinuation or recurrence of material injury to the domestic industry within a reasonably foreseeabletime.
E. Revocation of the Countervailing Duty Order and the Antidumping Duty Order onSubject Imports from Indonesia Would Not Likely Lead to the Continuation orRecurrence of Material Injury to the Domestic Industry within a ReasonablyForeseeable Time262
1. Likely Volume of Subject Imports
We find that subject imports from Indonesia are not likely to increase significantly from currentlevels after revocation of the orders. As further discussed below, we find that subject producers inIndonesia lack the incentive to significantly increase their exports to the U.S. market after revocation.
During the original investigations, subject imports from Indonesia increased slightly in absoluteterms but declined as a share of apparent U.S. consumption, using the broader measure of import volume. Subject imports from Indonesia declined from 39.0 million pieces in 2003, equivalent to *** percent ofapparent U.S. consumption, to 35.0 million pieces in 2004, equivalent to *** percent of apparent U.S.consumption, before increasing to 39.3 million pieces in 2005, equivalent to *** percent of apparent U.S.consumption.263
Since imposition of the orders, subject imports from Indonesia have essentially exited the U.S.market. Based on the broader measure of import volume, subject import volume from Indonesiaincreased from 3.2 million pieces in 2006 to 4.4 million pieces in 2007, 5.0 million pieces in 2008, and8.3 million pieces in 2009, before declining to 4.9 million pieces in 2010 and 4.4 million pieces in
258 (...continued)cumulate subject imports from China and India, as addressed in section III above, we conduct our likely injuryanalysis with respect to cumulated subject imports from China and India. Moreover, subject import trends with theorders in place are not predicative of what will happen should the orders be revoked. For example, bidding data for2011 indicate that Indian producers are interested in increasing their penetration of the U.S. market, see CR/PR atTable V-11, and Indian producers would likely bid more aggressively for contracts were the orders to be revoked.
259 See Hearing Tr. at 62 (McLachlan), 63 (Robinson).
260 See CR/PR at Table V-11 (nonsubject import bids were higher than Indian bids in *** comparisons and lowerin *** comparisons). Although nonsubject import suppliers were awarded with 53.0 percent of the value of thereported contracts, revocation of the orders would likely increase competition for such contracts, which couldprompt nonsubject import suppliers to offer lower prices in an effort to compete with subject imports from China andIndia.
261 See CR/PR at Tables I-11, 13.
262 Chairman Williamson and Commissioner Pinkert do not join this section.
263 CR/PR at Table I-1.
36

2011.264 As a share of apparent U.S. consumption, subject imports from Indonesia increased from 0.3percent in 2006 to 0.4 percent in 2007 and 2008 and to 0.8 percent in 2009 before declining to 0.4 percentin 2010 and 2011.265 Based on the narrower measure of import volume, subject imports from Indonesiawere 2.2 million pieces in 2010 and 1.6 million pieces in 2011, equivalent to 0.2 percent of apparent U.S.consumption in both years.266
These data likely exaggerate the presence of subject imports from Indonesia in the U.S. market,as the HTS categories utilized include nonsubject merchandise.267 As addressed above, Tjiwi accountedfor *** percent of Indonesian CLPSS production in 2011 and was ***.268 Tjiwi indicates that it ceasedexporting CLPSS to the United States after December 2005,269 and Customs data ***.270 Thus, Tjiwiexited the U.S. CLPSS market after 2006. Although Customs data still show imports of CLPSS fromIndonesia subsequent to 2006, Tjiwi contends that these imports are out-of-scope products and thus areOLPP as opposed to CLPSS.271
We find that Tjiwi lacks the incentive to resume exports to the United States at significant levels. Tjiwi’s capacity increased from *** pieces in 2006 to *** pieces in 2007 and *** pieces in 2008,declined to *** pieces in 2009, increased to *** pieces in 2010, and declined to *** pieces in 2011, alevel *** percent higher than in 2006.272 Tjiwi claims that the apparent increase in its CLPSS capacityduring the period examined resulted from the reallocation of capacity from OLPP to CLPSS as exports ofCLPSS to third country markets and home market shipments increased during the period.273 It has notadded any new or upgraded CLPSS production equipment since 1997 and has no plans to do so.274 Tjiwi’s rate of capacity utilization increased from *** percent in 2006 to *** percent in 2007, *** percentin 2008, *** percent in 2009, and *** percent in 2010, before declining to *** percent in 2011.275
264 CR/PR at Table I-10.
265 CR/PR at Table I-11.
266 CR/PR at Tables I-12-13.
267 See Tjiwi’s Prehearing Brief at 20-21.
268 CR at IV-19; PR at IV-16. Tjiwi also was the only Indonesia exporter of CLPSS identified in the originalinvestigations, OCR at VII-8 & n.33; OPR at VII-5 & n.33, and the only Indonesian producer identified by AASPSin its response to the notice of institution. See AASPS’s Response to the Notice of Institution at Exhibit 4. Notwithstanding AASPS’s more recent assertions that there are other producers of CLPSS in Indonesia, see AASPSPosthearing Brief at 10, the record does not indicate that there is any other producer of subject merchandise otherthan Tjiwi with the ability to export significant quantities of subject merchandise to the United States.
269 Hearing Tr. at 182 (Alfian); Tjiwi’s Prehearing Brief at 6; see also CR/PR at Table IV-11.
270 CR/PR at IV-2 n.8. In addition, U.S. importers reported no inventories of subject imports from Indonesia,CR/PR at Table IV-5, and no sales price or bid price data were reported for subject imports from Indonesia. CR atV-5 n.47; PR at V-4 n.47; CR/PR at Table V-11. Purchase price data were reported for subject imports fromIndonesia only for *** 2006, consistent with Tjiwi’s contention that it ceased exports to the United States afterDecember 2005. See CR at V-5 n.47; PR at V-4 n.47; CR/PR at Tables V-2-6.
271 See Tjiwi’s Final Comments at 2 n.2 (explaining that out-of-scope index cards, steno pads, and outsizednotebooks that Tjiwi exports to the United States enter under HTS numbers that also cover in-scope CLPSS).
272 CR/PR at Table IV-11.
273 Tjiwi’s Prehearing Brief at 29-30; Hearing Tr. at 182-84 (Alfian); Foreign Producers’ Questionnaire Responseof Tjiwi at Question II-5.
274 Hearing Tr. at 184 (Alfian); CR at IV-20; PR at IV-16.
275 CR/PR at Table IV-11.
37

Having *** its CLPSS production capacity during the last *** years of the period examined, Tjiwi ***with which to increase exports to the United States at the end of the period.276
Tjiwi’s export orientation, while significant, declined during the period examined, as Tjiwiincreased sales *** to the Indonesian market during the period examined.277 Tjiwi explains that robusteconomic growth in Indonesia has translated into increased Indonesian demand for education and, byextension, CLPSS.278 Tjiwi’s home market shipments increased from *** pieces in 2006 to *** pieces in2007, *** pieces in 2008, *** pieces in 2009, *** pieces in 2010, and *** pieces in 2011, a level ***percent higher than in 2006. Conversely, Tjiwi’s exports as a share of its total shipments declined from*** percent in 2006 to *** percent in 2007, increased to *** percent in 2008, declined to *** percent in2009, increased to *** percent in 2010, and then declined to *** percent in 2011, a level *** percentagepoints lower than in 2006.279
At the same time, Tjiwi has replaced its previous exports to the United States with exports to thirdcountry markets.280 Exports to third country markets declined from *** pieces in 2006 to *** pieces in2007, increased to *** pieces in 2008, declined to *** pieces in 2009, increased to *** pieces in 2010,and then declined to *** pieces in 2011, a level still *** percent higher than in 2006.281
Tjiwi claims that its exports to third country markets during the period examined have been moreprofitable than its previous exports to the United States for four reasons.282 ***.283 ***.284 ***.285 ***.286 AASPS itself has emphasized that the prevalence of multiple bids and auctions and the concentration ofpurchases in the hands of a few large retailers has served to increase price competition in the U.S.market,287 and the record tends to support their view.288 By contrast, there is no evidence on the recordindicating that the U.S. market is more attractive to Tjiwi than the third country markets it developedduring the period examined.289 We find that, without needing to address specifically Tjiwi’s empirical
276 ***, Foreign Producers’ Questionnaire Response of Tjiwi at Question II-7, ***. Id. at Question II-5. ***, id.at Question II-7, and there is no evidence on the record that suggests otherwise.
277 See CR/PR at D-22. ***. Id. ***. Id.
278 Tjiwi’s Prehearing Brief at 40-41.
279 CR/PR at Table IV-11.
280 CR/PR at D-22-23; Hearing Tr. at 183 (Alfian).
281 CR/PR at Table IV-11.
282 We note that many of the factors that make Tjiwi’s exports to third country markets more attractive than itsprevious exports to the United States would seem to apply equally to Tjiwi’s home market shipments.
283 CR/PR at D-23.
284 CR/PR at D-23.
285 CR/PR at D-23.
286 CR/PR at D-23.
287 See Hearing Tr. at 32 (McLachlan), 52 (Kaplan), 129-30 (Robinson), 133-34 (Rahn).
288 See CR/PR at II-1 (the five largest U.S. purchasers of LPP (***) accounted for *** percent of reportedpurchases and 32 percent of apparent U.S. consumption of LPP in 2011.); CR at V-25; PR at V-7 (12 of 26responding purchasers reported purchasing LPP through auctions or bidding in 2011, including each of the fivelargest purchasers).
289 We reject AASPS’s invitation to compare prices in the U.S. market to prices in third country markets usingaverage unit values. AASPS’s Posthearing Brief at 12. Due to the great variety of CLPSS products at different pricepoints, see CR/PR at Table V-7, average unit value data would reflect differences in product mix and are thereforenot an accurate measure of relative prices. AASPS’s own economist rejected average unit values as a means of
(continued...)
38

data about the relative “profitability” of its various export markets, the general considerations that Tjiwicites indicate that it lacks an incentive to shift exports from its existing third country markets to the U.S.market in significant quantities after revocation.
We find that the environmental and sustainability concerns of U.S. purchasers further reduce thelikelihood of a significant increase in subject imports from Indonesia within a reasonably foreseeabletime. As part of the Asia Pulp and Paper Group, Tjiwi stated that its “basic business objective” is to usepaper sourced from Asia Pulp and Paper’s Indonesian operations, which have not received certificationfor observing sustainable forestry practices.290 It is unlikely that the Asia Pulp and Paper Group willreceive such a certification for its Indonesian operations because managed tree plantations were notestablished in Indonesia until 1995 and FSC standards normally preclude the certification of plantationsestablished after November 1994.291
There is evidence that Tjiwi’s inability to provide environmental certification for its CLPSSproducts has limited its access to the U.S. market to some extent. Both Staples, which accounted for ***percent of Tjiwi’s U.S. sales during the period examined in the original investigations, and *** droppedTjiwi as a supplier of OLPP during the period examined in these reviews due to environmental andsustainability concerns.292 There is some evidence that retailers beyond Staples and *** also havecurtailed their purchases of nonsubject paper products imported from Indonesia over such concerns,293
and several responding purchasers reported that their CLPSS sourcing decisions are predicated in part onenvironmental and sustainability considerations.294 Even to the extent that retailer environmental andsustainability procurement policies are merely hortatory, they would still likely have a restraining effect
289 (...continued)comparing prices at the hearing. See Hearing Tr. at 137-38 (Kaplan).
290 Hearing Tr. at 186-87 (Alfian); CR at II-18; PR at II-11.
291 Tjiwi’s Prehearing Brief at 34, Exhibit 8.
292 CR at II-18; PR at II-11; CR/PR at D-16, 18-19; see also Tjiwi’s Prehearing Brief at Exhibit 9; Tjiwi’sPosthearing Brief at Q-6; Hearing Tr. at 186 (Alfian); Purchasers’ Questionnaire Response of *** at question III-28;Importers’ Questionnaire Response of *** at Question II-10.
293 See Tjiwi’s Prehearing Brief at Exhibit 7; Tjiwi’s Posthearing Brief at Q-3-6. Although Tjiwi maintained apresence in the U.S. OLPP market during the period examined, imports of OLPP from Indonesia, which are notsubject merchandise and hence are not subject to duties, declined sharply during the period in absolute terms and asa share of apparent U.S. consumption. See CR/PR at Table C-3. Nonsubject imports of OLPP from Indonesiaincreased from 59.3 million pieces in 2006 to 59.6 million pieces in 2007, declined to 26.6 million pieces in 2008and 6.0 million pieces in 2009, and then increased to 10.7 million pieces in 2010 and 10.9 million pieces in 2011, alevel still 81.6 percent lower than in 2006. Id. As a share of apparent U.S. consumption of OLPP, nonsubjectimports of OLPP from Indonesia declined from *** percent in 2006 to *** percent in 2007, *** percent in 2008, and*** percent in 2009, before increasing to *** percent in 2010 and *** percent in 2011, a level still *** percentagepoints lower than in 2006. Id. These data suggest that either Tjiwi’s interest in serving the U.S. OLPP marketwaned during the period examined or purchasers were reluctant to buy Indonesian OLPP.
We also acknowledge that these data indicate that imports from Indonesia continue to have some, albeitreduced, presence in the U.S. OLPP market. We do not disagree with the proposition advanced by AASPS that thiscontinued presence demonstrates that neither Indonesian producers generally or Tjiwi in particular havedemonstrated any propensity to withdraw from the U.S. market. Indeed, this is one basis why we did not find thesubject imports from Indonesia to have no discernible likely adverse impact. Nevertheless, for the reasons indicatedin this discussion, any slight increase upon revocation in the minimal levels of subject imports from Indonesiaobserved during the period of review is not likely to be significant.
294 See Purchasers’ Questionnaire Responses of ***; see also Tjiwi’s Prehearing Brief at Exhibit 6 (environmentalprocurement policies of Staples, Office Depot, and Levi Strauss).
39

on purchases of CLPSS from Indonesia, making it less likely that such imports could increasesignificantly within a reasonably foreseeable time.
For all of these reasons, we conclude that revocation of the orders on subject imports fromIndonesia would not likely result in a significant increase in subject imports from Indonesia within areasonably foreseeable time.295
2. Likely Price Effects
We conduct our analysis of likely price effects in light of our finding that there is a moderate tohigh degree of interchangeability between subject imports from each of the sources and the domestic likeproduct, and that price is an important factor in the U.S. LPP market, as detailed in sections III.C andIV.C.3 above. Nevertheless, based on our finding that revocation would not likely result in a significantincrease in subject import volume from Indonesia, we conclude that the likely volume of subject importsfrom Indonesia after revocation would likely be insufficient to have any significant adverse effects onprices for the domestic like product.296
We recognize that subject imports from Indonesia predominantly undersold the domestic likeproduct during the period examined in the original investigations, in 39 of 39 quarterly comparisons withan average margin of *** percent.297 As addressed above, however, Tjiwi currently lacks the incentive toincrease significantly its exports to the United States within a reasonably foreseeable time. Specifically,we have found that Tjiwi has no excess capacity and no incentive to shift sales from home market andthird country market customers to the U.S. market, due in part to the intensity of the price competition inthe U.S. market. In light of this, we find it unlikely that Tjiwi would significantly reduce its current sales
295 U.S. importers reported *** inventories of subject imports from Indonesia. CR/PR at Table IV-5. Tjiwireported an end-of-period inventory of *** pieces in 2011, equivalent to *** percent of their total shipments thatyear. CR/PR at Table IV-11. Tjiwi reports that *** percent of this inventory reflects product stockpiled to meetspecific customer orders in third country markets, and is therefore not produced in sizes suitable for export to theUnited States. CR at II-8 n.13, II-9 n.16; PR at II-4 n.13, II-5 n.16; see also Tjiwi’s Prehearing Brief at 28.
We are unpersuaded by AASPS’s argument that Tjiwi could serve third country markets from inventorywhile using its capacity to increase significantly its exports to the United States. See AASPS’s Final Comments at11. Because school schedules vary by market, Tjiwi reportedly spreads CLPSS production over the year and buildsup inventories for the purpose of satisfying back to school orders from customers in third country markets atdifferent points of the year. Tjiwi’s Prehearing Brief at 28. Consequently, while Tjiwi is drawing from inventory tosatisfy specific customer orders, it must use its capacity to produce inventory earmarked for different customers. Itcould not use its capacity to increase significantly exports to the United States without foregoing sales to existingcustomers, and we find it unlikely that Tjiwi would shift a significant volume of exports from third country marketsto the United States for the reasons addressed above.
There are no known antidumping or countervailing duty investigations or determinations on CLPSS fromIndonesia in any other country. CR at IV-9; PR at IV-7.
296 No sales price or bid data were reported for subject imports from Indonesia during the period of review. CR atV-5 n.47; PR at V-4 n.47; CR/PR at Table V-11. *** reported direct purchases of products 1-4 from Indonesia in thefirst quarter of 2006. Id. Although *** purchase price for each of these products was *** than the correspondingsales prices of the domestic like product, CR/PR at Tables V-2-6, purchase prices are at a different level of tradethan sales prices. In light of the very limited purchase price data available and the absence of sales price data onsubject imports from Indonesia, we draw no conclusions from the purchase price data pertaining to subject importsfrom Indonesia during the period of review. Moreover, *** reported purchase price data based upon the estimatedarrival date of its direct imports of CLPSS from Indonesia, rather than the actual entry date of such imports. CR atV-5 n.47; PR at V-4 n.47.
297 CR/PR at Table V-10 n.1.
40

to home market and third country market customers in favor of sales to U.S. customers at prices thatundersell the domestic like product to a significant degree.
Thus, we find that subject imports from Indonesia are not likely to significantly undersell thedomestic like product or suppress or depress domestic like product prices to a significant degree afterrevocation.
3. Likely Impact298
We evaluate the likely impact of subject imports from Indonesia in light of our finding that thedomestic industry is not vulnerable to the continuation or recurrence of material injury, detailed in sectionIV.D.3 above. In light of this, and given that we do not find it likely that subject imports from Indonesiawill increase significantly in terms of volume or have significant adverse price effects, we find thatrevocation of the antidumping duty and countervailing duty orders on subject imports from Indonesiawould not likely lead to a significant adverse impact on the domestic industry within a reasonablyforeseeable time.
For all of the foregoing reasons, we conclude that if the antidumping duty and countervailingduty orders were revoked, subject imports from Indonesia would not be likely to lead to continuation orrecurrence of material injury to the domestic industry within a reasonably foreseeable time.
CONCLUSION
For all the foregoing reasons, we determine that revocation of the countervailing duty order onCLPSS from India and the antidumping duty orders on CLPSS from China and India would be likely tolead to continuation or recurrence of material injury to an industry in the United States within areasonably foreseeable time.299 We also determine that revocation of the countervailing duty order andthe antidumping duty order on CLPSS from Indonesia would not be likely to lead to continuation orrecurrence of material injury to an industry in the United States within a reasonably foreseeable time.300
298 Section 752(a)(6) of the Act states that “the Commission may consider the magnitude of the margin ofdumping or the magnitude of the net countervailable subsidy” in making its determination in a five-year review. 19U.S.C. § 1675a(a)(6). The statute defines the “magnitude of the margin of dumping” to be used by the Commissionin five-year reviews as “the dumping margin or margins determined by the administering authority under section1675a(c)(3) of this title.” 19 U.S.C. § 1677(35)(C)(iv). See also SAA at 887. Commerce calculated likelyantidumping duty margins of 97.85 to 118.63 percent and likely countervailing duty margins of 40.55 percent forexporters in Indonesia. CR/PR at Tables I-5-6.
299 Commissioners Okun, Pearson, and Johanson dissenting with respect to subject imports from India.
300 Chairman Williamson dissenting.
41


43
SEPARATE VIEWS OF COMMISSIONER SHARA L. ARANOFF ON CUMULATION Commissioner Aranoff finds that subject imports from Indonesia will likely compete in the U.S.
market under significantly different conditions of competition than subject imports from China and India for a number of reasons. First, imports of CLPSS from the subject countries have exhibited different trends over the period of review, with imports from Indonesia virtually exiting the U.S. market while imports from China and India maintained a significant presence. Between 2006 and 2011, subject imports from China ranged between 120.2 million pieces and 159.6 million pieces, and subject imports from India ranged between 24.2 million pieces and 43.9 million pieces. These imports from China accounted for 10.5 to 14.0 percent of apparent U.S. consumption over the same period, and the imports from India accounted for between 2.1 and 4.0 percent of apparent U.S. consumption. CLPSS imports from Indonesia, however, ranged between 3.2 and 8.3 million pieces between 2006 and 2011 and their share of apparent U.S. consumption ranged between *** and *** percent during the same period.1
Based on the narrower measure of subject import volume for 2010 and 2011, CLPSS imports from China were 24.0 million pieces in 2010 and 17.5 million pieces in 2011, which accounted for 2.5 percent and 1.9 percent of apparent U.S. consumption, respectively. Subject imports from India were 32.8 million pieces in 2010 and 25.5 million pieces in 2011, which accounted for 3.5 percent and 2.8 percent of apparent U.S. consumption, respectively. Subject imports from Indonesia, however, were only 2.2 million pieces in 2010 and 1.6 million pieces in 2011. These import volumes accounted for just 0.2 percent of apparent U.S. consumption in each year.2
The volume of OLPP imports from the subject countries show similarly disparate trends. Imports of OLPP from both China and India increased significantly over the period of review, with imports from China increasing 45.1 percent and imports from India increasing 250.0 percent, while imports of OLPP from Indonesia declined 81.6 percent between 2006 and 2011.3 Given that OLPP imports are not subject to any antidumping or countervailing duty orders, this demonstrates the Indonesian producers’ lack of interest and/or inability to serve the U.S. lined paper market even without the restraining effect of an order. By contrast, producers in China and India have shown an active interest in the U.S. lined paper market as well as an ability to significantly increase their lined paper exports to the United States.
In addition, the Indonesian industry has become less export-oriented over the period of review while the industries in China and India have increased their export-orientation. Unlike the industries in China and India, the lined paper products industry in Indonesia is dominated by a single large producer, PT Pabrik Kertas Tjiwi Kimia (“Tjiwi”).4 Over the period of review, Tjiwi’s exports of CLPSS declined as a percentage of its total shipments, while shipments to its home market increased, and Tjiwi reported no exports of CLPSS to the United States.5 Thus, the dominant Indonesian producer has become less export-oriented over the review period. The available information regarding the industry in China,
1 CR/PR at Table I-1. 2 CR/PR at Tables I-12 & I-13. 3 CR/PR at Table C-3. 4 Subsequent to filing its response to the Commission’s Notice of Institution, in which it provided only one
name of a known Indonesian producer (Tjiwi), the Association of American School Paper Suppliers (“AASPS”) provided names of additional potential Indonesian producers of subject merchandise. See AASPS Posthearing Brief at 10. AASPS does not dispute, however, that Tjiwi Kimia is the dominant producer of subject merchandise in Indonesia. Moreover, there is no information on the record in these reviews or in the original investigations showing that any Indonesian producer besides Tjiwi Kimia has exported subject merchandise to the United States. See CR/PR at IV-2, n.8 & CR at IV-19; PR at IV-16; Original Investigations Confidential Staff Report at VII-8 & n.33.
5 CR/PR at Table IV-11. Tjiwi asserts that it stopped exporting CLPSS to the United States after December 2005. Tjiwi’s Prehearing Brief at 6. The record supports this assertion as Customs data show that ***. See CR/PR at IV-2 n.8.

44
however, shows that during the period of review, China became the world’s largest paper and paperboard producer and became a net exporter of paper products. The Chinese government also named the paper industry as a new source of economic growth in its most recent five-year plan and, thus, appears focused on growing this sector further.6 The responding Indian producers’ data show a significant increase in total CLPSS exports, as well as an absolute increase in exports of CLPSS to the U.S. and an increase in the percentage of their total shipments directed to the United States. Thus, the responding Indian producers’ data demonstrate an increasing level of export-orientation and an increased reliance on the U.S. market.7
Tjiwi also reported capacity utilization rates of *** percent or higher over the last five years of the period and, thus, does not have excess capacity with which it could significantly increase exports of subject merchandise to the United States.8 The responding Indian producers reported much lower capacity utilization rates throughout the period and had excess capacity of 14.4 million pieces in 2011.9 Although the record contains no specific capacity and production data for producers in China, given the significant increase in production of paper and paperboard products and China’s focus on continued growth in this area, it is likely that they have the ability to increase exports to the U.S. were the order to be revoked. In light of Tjiwi’s reduced export-orientation, its current high level of capacity utilization and its extremely limited interest in the U.S. lined paper products market over the period of review, Commissioner Aranoff finds that if the orders are revoked, subject imports from Indonesia will not compete in the United States under the same conditions of competition as subject imports from China and India, which have shown a consistent focus on the U.S. market during the period of review.
Finally, imports of CLPSS from Indonesia face an additional condition of competition that limits their ability to compete in the U.S. market to the same extent as subject imports from China and India. The main purchaser of Indonesian CLPSS in the original investigation was *** and this customer has explicitly stated it will no longer purchase CLPSS, or other lined paper products, from Tjiwi due to a lack of environmental certification for sustainable forestry practices.10 Another large purchaser of CLPSS, ***, also stopped buying products from Tjiwi and has indicated that Indonesian producers may have difficulty selling their product in the U.S. market because of environmental concerns.11 By contrast, there is no evidence that environmental concerns affect imports from China and India to a significant degree. Indian producers contend that environmental certification is not usually required for their lined paper products because they primarily use recycled paper or non-wood pulp in the production process.12 There is limited information on the record regarding the industry or production processes in China, but the significant volume of CLPSS imports and the increasing volume of OLPP imports from China demonstrate that environmental concerns are not a significant impediment for Chinese producers’ sales of lined paper products to the United States. Thus, Tjiwi’s inability to obtain environmental certification for its lined paper products places it at a competitive disadvantage compared to producers in other subject countries and limits at least a portion of the U.S. market to which it could export CLPSS.
6 CR at IV-13. 7 CR/PR at Table IV-9. 8 CR/PR at Table IV-11. ***. Foreign Producers’ Questionnaire Response of Tjiwi at Question II-5. ***. Id.
at Question II-7. Accordingly, it is unlikely that Tjiwi would shift production from OLPP to CLPSS in order to increase exports of CLPSS to the United States if the order is revoked.
9 CR/PR at Table IV-9. 10 See Tjiwi’s Prehearing Brief at 35 & Exhibit 9. 11 See Tjiwi’s Posthearing Brief at 6 n.9 & Q-6; CR at D-16; PR at D-4. In addition to *** and ***, multiple
other purchasers reported that environmental and sustainability considerations factored into their purchasing decisions when buying CLPSS. See, e.g., Purchasers’ Questionnaire Responses of ***.
12 CR at II-18; PR at II-11.

45
For these reasons, Commissioner Aranoff exercises her discretion not to cumulate subject imports from Indonesia with those from China and India for purposes of evaluating the likelihood of continuation or recurrence of material injury if the orders subject to these reviews are revoked.

47
CONCURRING VIEWS OF COMMISSIONER DEAN A. PINKERT ON CERTAIN LINED PAPER SCHOOL SUPPLIES FROM INDONESIA
Based on the record in these five-year reviews, I determine under section 751(c) of the Tariff Act
of 1930, as amended (the Act), that revocation of the antidumping and countervailing duty orders on certain lined paper school supplies (“CLPSS”) from Indonesia would not be likely to lead to continuation or recurrence of material injury to an industry in the United States within a reasonably foreseeable time. My central finding, explained below, is that, in the event of revocation, there is likely to be no discernible adverse impact by reason of imports of the subject merchandise from Indonesia.
I. Likelihood Of No Discernible Adverse Impact In The Event Of Revocation By
Reason Of Subject Merchandise From Indonesia
I find that imports of the subject merchandise from Indonesia would likely have no discernible adverse impact on the domestic industry if the orders on Indonesia were revoked. I have therefore not cumulated imports from Indonesia with imports from any other country for purposes of my analysis of likelihood of continuation or recurrence of material injury.
During the original period of investigation, the quantity of subject imports from Indonesia declined from 39.0 million pieces in 2003 to 35.0 million pieces in 2004, and then increased to 39.3 million pieces in 2005. The market penetration of subject imports declined from *** percent in 2003 to *** percent in 2004 and then increased to *** percent in 2005.1
During the review period, in 2006, subject imports2 declined to 3.2 million pieces.3 Official import statistics indicate that, between 2006 and 2011, the volume of subject imports generally fluctuated between 3.2 million pieces and 5.0 million pieces (with the exception of 2009, when it reached 8.3 million pieces).4 The market penetration of subject imports generally ranged from 0.3 to 0.4 percent between 2006 and 2011 (with the exception again of 2009, when it reached 0.8 percent).5 The volume of subject imports was 2.2 million pieces in 2010 and 1.6 million pieces in 2011, with a market penetration of 0.2 percent in both of those years.6
1 CR/PR at Table I-1. 2 The pertinent harmonized tariff rate schedule (HTS) classifications changed during the review period. Specifically, a residual classification covering subject and nonsubject merchandise was subdivided into three separate classifications. One of these three HTS classifications, 4820.10.2060, contains nonsubject merchandise, while the other two contain subject merchandise. I have generally analyzed volume trends relying on a broader category of data that includes merchandise imported under HTS 4820.10.2060, in order to make apples-to-apples comparisons over time. When I specifically reference volume data for 2010 and 2011, however, I rely on a narrower category of data which excludes nonsubject merchandise under HTS 4820.10.2060 in order to reflect accurately the most recent CLPSS import volumes. 3 CR/PR at Table I-1. 4 CR/PR at Table IV-1. 5 CR/PR at Table I-11. 6 CR/PR at Table I-13 and Table IV-2 (excluding nonsubject merchandise under HTS 4820.10.2060).

48
P.T. Pabrik Kertas Tjiwi (“Tjiwi”) challenges these import data. Tjiwi is the only significant producer of CLPSS in Indonesia and the only known exporter from Indonesia to the United States. Tjiwi is believed to have accounted for *** percent of Indonesian production in 2011.7 Tjiwi states that it ceased exporting to the United States after December 2005, that imports of subject merchandise from Indonesia were at, or close to, zero during the review period, and that the volume data on subject merchandise from Indonesia largely consists of out-of-scope merchandise.8 Even using the data questioned by Tijiwi, however, it appears that subject merchandise from Indonesia virtually abandoned the U.S. market after the orders were imposed.
I note that Tjiwi’s capacity utilization was *** percent in 2007, *** percent in 2008, *** percent in 2009, *** percent in 2010, and *** percent in 2011.9 Thus, there is essentially no excess capacity that could be used to send exports to the United States. Tjiwi’s inventories are already designated for specific customer orders or specific markets, and it has no plans to expand its capacity.10 Although Tjiwi could theoretically shift production from other lined paper products (“OLPP”) to CLPSS, that is not likely to happen in light of the fact that Tjiwi’s production of all lined paper products was at, or close to, full capacity from 2008 to 2011.11
Moreover, Tjiwi has very limited interest in the U.S. market. It is especially noteworthy in this regard that Tjiwi did not export CLPSS to the United States during the review period.12 In addition, the 2011 bidding data do not reflect any bids by Tjiwi to win contracts to sell to large U.S. CLPSS purchasers, U.S. importers do not hold any inventories from Tjiwi, and only one U.S. importer ordered product from Tjiwi in 2012 (*** pieces).13 Similarly, imports of OLPP from Indonesia have decreased sharply.14
7 CR at IV-19; PR at IV-16. Tjiwi is the only Indonesian producer that submitted a questionnaire response in the original investigations or in these reviews and the only Indonesian producer listed in AASPS’ Response to the Notice of Institution for these reviews. CR at IV-19; PR at IV- 16. Tjiwi Posthearing Brief, Exhibit 16. Tjiwi is part of the Asia Pulp and Paper Group (“APP”). Tjiwi’s “basic business objective” in producing CLPSS is to add value to its own manufactured paper, which is made from Indonesian wood fiber and has not received certification for observing sustainable forestry practices. Hearing Transcript (“Tr.”) at 186-87 (Alfian); CR at IV-19; PR at IV-16. Although AASPS identifies ***, Tjiwi identifies ***. AASPS Prehearing Brief at 24-25; Tjiwi Foreign Producer Questionnaire Response at Question III-16. AASPS says that one of these producers provide envelopes to the U.S. market. Envelopes, however, are not lined paper products, and, therefore, not CLPSS. 8 Tjiwi Prehearing Brief at 6, 20-23. Tjiwi Posthearing Brief at 4. Tr. at 182 (Alfian). Commission staff has examined Customs import data to ascertain whether there were any subject imports from Indonesia during the period of review on which duties were paid. These data indicate that the ***. CR at IV-2 n.8. PR at IV-2, n.8. 9 CR/PR at Table IV-11. 10 Tjiwi Prehearing Brief at 28, 30. Tr. at 183-84 (Alfian). Tjiwi states that its increases in reported capacity measured in units over the review period reflect changes in product mix. Tjiwi Prehearing Brief at 16-17, 29-30. 11 CR/PR at Table IV-10. 12 Tjiwi Prehearing Brief at 21. 13 CR/PR at Table IV-4, Table IV-5, and Table V-11. 14 Tjiwi Posthearing Brief at 4.

49
Tjiwi’s lack of focus on the U.S. market in part reflects that it faces a significant barrier in selling CLPSS in the United States in that it cannot obtain environmental certification from entities such as the Programme for the Endorsement of Forest Certification and the Forest Stewardship Council (FSC).15 This has caused large U.S. purchasers to look for other suppliers.
In 2008, Tjiwi lost ***, its primary customer prior to the antidumping and countervailing duty orders, because of its lack of environmental certification.16 *** also ceased purchasing OLPP from Tjiwi during the review period.17 Overall, imports of OLPP from Indonesia decreased by 81.6 percent from 2006 to 2011, from 59.3 million pieces in 2006 to 10.9 million pieces in 2011.18
Several large purchasers reported that their CLPSS sourcing decisions are predicated in part on environmental, social compliance, and sustainability considerations.19 Tjiwi has provided several retailers’ polices on environmental certification.20 In response to a question as to the likely effect of revocation, ***.”21
Tjiwi has a business strategy of ***, where it maintains that demand for its products has decreased due to environmental concerns.22
In its home market, Tjiwi’s shipments surged from *** pieces in 2006 to *** pieces in 2011 (constituting *** percent of its total shipments in 2006 and *** percent in 2011).23 Tjiwi asserts that it ***.24
Outside of Indonesia, Tjiwi focuses its sales on markets where purchasers have less pricing power than in the United States, prices are higher, and prices are negotiated rather than determined through a bidding process.25 Tjiwi’s sales to Asia increased from *** pieces in 2006 to *** pieces in 2011. Its
15 These entities will provide certification only to paper produced from timber harvested using sustainable forest management principles. Tjiwi Prehearing Brief at 32-33. Tjiwi’s products cannot qualify for FSC certification because FSC requirements effectively prevent certification for paper products sourced from plantations certified after November 1994, and Indonesia did not certify plantations until 1996. Tjiwi Prehearing Brief at 34; Tr. at 185-86 (Alfian). 16 Tjiwi Prehearing Brief at 7 & Exhibit 9. Tr. at 186 (Alfian). Tjiwi Posthearing Brief at 6 & n.9. *** accounted for approximately *** percent of Tjiwi’s U.S. CLPSS sales prior to the imposition of the antidumping and countervailing duty orders. Tjiwi Prehearing Brief at 7. 17 CR at II-18, D-16, D-18-19. PR at II-11, D-5. Tjiwi Posthearing Brief at Q-6. Purchaser Questionnaire Response of Target at Question III-28. 18 CR/PR at Table C-3. 19 See Purchasers’ Questionnaire Responses of ***. See also Tjiwi Posthearing Brief at Q-3-Q-6. 20 Tjiwi Prehearing Brief, Exhibit 6. AASPS acknowledges that many large U.S. purchasers have policies concerning environmental standards, but contends that these policies are typically hortatory and rarely require that suppliers furnish particular environmental certifications. AASPS Posthearing Brief, Exhibit 1 at 21. One of its industry witnesses, however, submitted a declaration stating that the witness was aware that Staples had a written objection to purchasing paper from APP for environmental reasons and that three of his company’s other U.S. customers – *** – had expressed to him that their firms did not want to purchase APP paper for environmental reasons. AASPS Posthearing Brief, Exhibit 10A. 21 CR at D-18; PR at D-5. See also CR at D-19, PR at D-5. Tjiwi reports that its inability to provide FSC certification caused its CLPSS exports to Canada, which are not subject to trade remedy orders, to decline sharply between 2005 and 2011. Tjiwi Prehearing Brief at 37-38. 22 Tjiwi’s Prehearing Brief at 27-28, 40. Tr at 182-83 (Alfian). 23 CR/PR at Table IV-11. 24 CR at D-22; PR at D-6. Although AASPS argues that Tjiwi can reconfigure its equipment to produce CLPSS in the dimensions sold in the U.S. market, AASPS Posthearing Brief, Exhibit 1 at 10, there is no clear incentive for Tjiwi to do so. Moreover as discussed above, certain large U.S. purchasers are not interested in purchasing CLPSS from Tjiwi. 25 CR at D- 23; PR at D-6. See also Tr. at 183-85. Tjiwi’s business strategy is not surprising given that it is at full

50
sales to “All Other Markets,” ***, increased from *** pieces in 2006 to *** in 2011.26 Given the foregoing facts, the likely volume of subject merchandise from Indonesia in the event
of revocation is minimal, which necessarily means that the likely amount of underselling in the event of revocation is minimal. Consequently, subject merchandise from Indonesia would not likely have suppressing or depressing effects on U.S. prices. As discussed in IV.D.3. of the Views of the Commission, the financial performance of the domestic industry is robust. Accordingly, the likely volume of subject merchandise from Indonesia in the event of revocation would not likely have a discernible adverse impact on the domestic industry.
II. Revocation Of The Orders On Imports Of The Subject Merchandise From
Indonesia Would Not Likely Lead To Continuation Or Recurrence Of Material Injury Within A Reasonably Foreseeable Time
In section I. above, I find that imports of CLPSS from Indonesia would be likely to have no
discernible adverse impact on the domestic industry if the antidumping and countervailing duty orders were revoked. It necessarily follows from this determination that such imports would be unlikely to cause material injury to the domestic industry. The minimal likely volume of subject merchandise from Indonesia that would enter the U.S. market would not likely have adverse effects on U.S. prices, nor would it have an adverse impact on an industry that is not vulnerable.
Accordingly, I determine that revocation of the antidumping and countervailing duty orders on CLPSS from Indonesia would not be likely to lead to continuation or recurrence of material injury to the domestic industry within a reasonably foreseeable time.
capacity and that it states that, prior to the orders, *** used its considerable purchasing power to put downward pressure on Tjiwi’s prices, resulting in *** of profitability on U.S. sales. CR at D-22; PR at D-6. See also Tr. at 181. (Alfian). In addition, I note that there are no known antidumping or countervailing duty investigations or determinations in third markets. CR at IV-9; PR at IV-7. 26 CR/PR at Table IV-11. Tjiwi Questionnaire Response, Attachment II-14c.

51
ADDITIONAL AND DISSENTING VIEWS OF COMMISSIONERS DEANNA TANNER OKUN, DANIEL R. PEARSON, AND DAVID S. JOHANSON
I. INTRODUCTION
Based on the record in these reviews, we determine, under section 751(c) of the Tariff Act of 1930, as amended (“the Act”), 1 that revocation of the antidumping duty order on imports of certain lined paper school supplies (“CLPSS”) from China would be likely to lead to the continuation or recurrence of material injury to an industry in the United States within a reasonably foreseeable time. We further determine that revocation of the antidumping duty orders and countervailing duty orders on CLPSS from India and Indonesia would not be likely to lead to the continuation or recurrence of material injury within a reasonably foreseeable time. Accordingly, we join in the affirmative determination reached by our colleagues with respect to subject imports from China and the negative determination with respect to subject imports from Indonesia. We write separately because our analysis with respect to China is different as we do not cumulate subject imports from China with subject imports from India or Indonesia, and because we reach a negative determination with respect to subject imports from India.
Consequently, these views consist of: (1) an analysis of why, based on this record, we do not exercise our discretion to cumulate subject imports from any of the three subject countries, (2) our affirmative determination on subject imports from China, and (3) our negative determination on subject imports from India. We join the discussion of background (section I), domestic like product and industry (section II), legal standards and findings in the original investigations (sections IV.A-IV.B), conditions of competition and the business cycle (section IV.C), and the likely injury analysis for subject imports from Indonesia (section IV.E), as set forth in the majority views.
II. CUMULATION
Section 752(a) of the Act provides that: the Commission may cumulatively assess the volume and effect of imports of the subject merchandise from all countries with respect to which reviews under section 1675(b) or (c) of this title were initiated on the same day, if such imports would be likely to compete with each other and with domestic like products in the United States market. The Commission shall not cumulatively assess the volume and effects of imports of the subject merchandise in a case in which it determines that such imports are likely to have no discernible adverse impact on the domestic industry.2
Thus, cumulation is discretionary in five-year reviews. The Commission, however, may exercise its discretion to cumulate only if the reviews are initiated on the same day and the Commission determines that the subject imports are likely to compete with each other and the domestic like product in the U.S. market. The statute precludes cumulation if the Commission finds that subject imports from a country are likely to have no discernible adverse impact on the domestic industry.3 We note that neither the statute nor the Uruguay Round Agreements Act (“URAA”) Statement of Administrative Action (“SAA”) provides specific guidance on what factors the Commission is to consider in determining that subject imports “are likely to have no discernible adverse impact” on the domestic industry.4
1 19 U.S.C. § 1675(c). 2 19 U.S.C. § 1675a(a)(7). 3 19 U.S.C. § 1675a(a)(7). 4 SAA, H.R. Rep. No. 103-316, vol. I (1994).

52
In the original investigations, the Commission majority finding material injury by reason of imports of CLPSS from China, India, and Indonesia determined to cumulate imports of CLPSS from all three subject countries, on the basis that there was a reasonable overlap of competition of such imports with each other and with the domestic like products in the U.S. market.5 In their dissenting views, in making determinations of threat of material injury, the three dissenting Commissioners declined to exercise their discretion to cumulate subject imports from China with those from India and Indonesia.
In these reviews, the statutory requirement that all reviews be initiated on the same day is satisfied as the Commission initiated all the reviews on August 1, 2011.6 We do not exercise our discretion to cumulate imports of CLPSS from China with those from India and/or Indonesia because we find that subject imports of CLPSS from each of the three subject countries would likely face different conditions of competition in the U.S. market if the orders were revoked. Subject producers in the three countries are likely to operate differently from each other in the U.S. market based on pre-order differences in volume and pricing trends among the subject sources, along with differences in the subject countries’ channels of distribution, export orientation, capacity and capacity utilization levels, and industry structures.
As an initial matter, in view of the counterfactual nature of our determinations in five-year reviews, we consider a country’s experience during the period examined in the original investigation -- the last period during which the country competed free from the restraints of an antidumping or countervailing duty order -- in analyzing the likely volume and pricing patterns of a subject country supplier in the event of revocation of an order. In this regard, the dissenting Commissioners in the original investigations noted that, with respect to subject import volume and pricing patterns during the period examined: “These differing import levels and trends clearly indicate that, in the absence of antidumping and countervailing duty orders in these investigations, imports from subject sources would have very different impacts on the U.S. industry.”7
This conclusion applies with equal force in these reviews. First, it is significant that, during the original investigations, subject imports from China, India, and Indonesia exhibited substantially different trends in volume and market share. Specifically, imports from China increased steadily throughout the period, with a particularly sharp increase in 2005, whereas imports from Indonesia first declined in 2004, then increased in 2005 to a level just slightly above their 2003 level, and imports from India steadily declined throughout the period.8 Moreover, the volume of imports from China was much larger than either imports from India or Indonesia, ranging from at least four times larger in 2003 to over eight times larger in 2005. Similarly, by the end of the period examined, the market share of subject imports from China was over eight times that of imports from Indonesia, and 11 times that of imports from India.9 10
5 Original Determinations, USITC Pub. 3884, at 23. 6 76 Fed. Reg. 45,851 (Aug. 1, 2011). 7 Original Determinations, USITC Pub. 3884, at 64 (Separate and Dissenting Views of Chairman Daniel R.
Pearson and Commissioners Jennifer A. Hillman and Deanna Tanner Okun (“Original Dissent”). 8 Subject imports from China increased from 186 million pieces in 2003 to 221 million pieces in 2004, and then increased more sharply to 346 million pieces in 2005, for an overall increase of 86 percent. By contrast,
imports from India declined from 37.2 million pieces in 2003 to 36.0 million pieces in 2004, then declined again, but more rapidly, to 31.3 million pieces in 2005, for an overall decline of 15.9 percent. For their part, imports from Indonesia fluctuated, first declining from 39.0 million pieces in 2004 to 34.9 million pieces, then increasing to 39.3 million pieces in 2005, for an overall increase of only 0.8 percent. CR/PR at Table I-1.
9 During the period examined in the original investigations, the market share of imports from China increased from *** percent in 2003, to *** percent in 2004, and again to *** percent in 2005. In contrast, the market shares of imports from India and Indonesia, which were much lower, declined overall. The market share of imports from India declined steadily from *** percent in 2003 to *** percent in 2005. The market share of imports from Indonesia declined irregularly from *** percent in 2003 to *** percent in 2005. CR/PR at Table I -1.
10 With the orders in place, the volume trends continued to be different. Subject imports from China and their (…continued)

53
Second, with regard to pre-order pricing trends, imports from Indonesia exclusively undersold the domestic like product at high margins, whereas imports from India mostly oversold.11 With regard to imports from China, although there were more quarters in which imports from China oversold the domestic like product, on a weighted-average basis imports from China predominantly undersold, inasmuch as imports from China that were undersold accounted for 88 percent of the volume of the subject merchandise from China considered in pricing comparisons.12 Accordingly, price trends among the subject imports prior to imposition of the orders were significantly different.
Third, the comparative degrees of export orientation among the three countries have been markedly different, both during the period examined in the original investigations and, to a lesser extent, during the period of review. In the original investigations, the Chinese industry was substantially export-oriented, with exports accounting for *** percent of all shipments, and shipments to the United States accounting for *** percent of its total shipments by the end of the period examined, a substantial increase from earlier in the period.13 On the other hand, the share of total shipments made to the U.S. market for both India and Indonesia declined during the original investigation period. Thus, although the industries in Indonesia and India were export-oriented, they were gradually decreasing their dependence on the U.S. market during the period examined in the original investigations, in contrast to the Chinese industry. Similarly, although the industry in India increased its degree of export orientation during the review period, it was less export-oriented than either the Indonesian industry or, based on the information available, the Chinese industry.14
Fourth, record evidence indicates that imports from India currently move in different channels of distribution from imports from China. In particular, although importers from all three countries sold primarily to retailers during the period of review, importers from India reported more sales to end users, indicating that the importers themselves were retailers that were importing directly from the Indian producers, as opposed to importers from China, who acted as middlemen.15
Fifth, with regard to current capacity in the subject countries, although capacity increased during the period of review in all three countries, at the close of the period there was little excess capacity in
share of apparent U.S. consumption declined over the period. CR/PR at Tables I-1, I-12-13. The volume levels and trends of subject imports from India and Indonesia differed as well. India’s limited CLPSS imports increased overall with the orders in place, though they never exceeded 4.0 percent of the market. CR/PR at Tables I-1, I-12-13. The volume of subject imports from Indonesia fluctuated, capturing below 1.0 percent of the market in every year of the period. CR/PR at Tables I-1, I-12-13. Due to changes in the harmonized tariff schedule in July 2009, there are two measures of subject import volume as outlined by the majority in section III.B of its opinion. In the text that follows, we cite the broader measure, but we note that our reasoning for both the cumulation and injury analyses would be the same under either measure.
11 CR/PR at Table V-10 n.1. For Indonesia, there were *** instances of underselling and no instances of overselling, with an average underselling margin of *** percent. In contrast, for India there were *** instances of underselling with an average margin of *** percent and *** instances of overselling with an average margin of *** percent.
12 USITC Pub. 3884 at 64 (citing Original Final Phase Investigation Staff Report at Table V-8). We noted further that, with regard to imports from India, imports that were oversold accounted for 57 percent of the volume of subject merchandise from India considered in pricing comparisons.
13 CR at IV-13; PR at IV-11; Original Final Staff Report, INV-DD-117 (Aug. 15, 2006) at Table VII-1 (EDIS Doc. 460949).
14 CR/PR at Tables IV-9 & IV-11. For India, the share of shipments accounted for by exports increased irregularly from 38.7 percent in 2006 to 51.5 percent in 2011. For Indonesia, the share of shipments accounted for by exports decreased irregularly from *** percent in 2006 to *** percent in 2011. With regard to China, there is no information on the record that indicates that the industry is any less export-oriented now than during the period examined in the original investigation.
15 CR/PR at Table II-1; CR at II-2; PR at II-1. Because there were so few imports from Indonesia during the period of review, data on the channels of distribution used by importers from Indonesia are extremely limited, and no conclusions can be drawn from those data.

54
Indonesia, and although there was some excess capacity in India, the amount pales next to that likely existing in China.16 Although there are no capacity data for China during the period of review, during the original investigations Chinese capacity increased, was projected to increase, and there was considerable excess capacity. Responding firms reported a capacity increase of *** percent between 2003 and 2005, and excess capacity of *** million pieces in 2005.17 Although this amount of excess capacity does not at first appear substantial; we are mindful that in the original investigations the Commission received responses from only 3 of the 20 Chinese firms to which it had sent foreign producer questionnaires. The dissenting opinion noted, therefore, that substantial additional capacity likely existed in China to increase exports to the United States over and above the capacity reported by the three reporting producers and/or exporters.18 Hence, in these reviews, given that we have received no information from Chinese producers/exporters in response to our questionnaires, it is likely that current excess capacity in China far exceeds *** million pieces and likely accounts for a substantial share of 2011 apparent U.S. consumption. Finally, the subject countries differ greatly in terms of industry structure. Production in Indonesia is very highly concentrated in a single producer, Tijwi Kimia, which is believed to account for *** percent of Indonesian production of CLPSS in 2011.19 In contrast, the industries in China and India consist of hundreds of small producers, although a small number of Indian producers account for the bulk of production and exports to the United States.20 Eight firms are believed to account for *** percent of Indian production of CLPSS in 2010 and accounted for 91.0 percent of total Indian imports to the United States in 2011.21
Accordingly, based on the information in the record, we find significant differences in the likely conditions of competition that subject imports from China, India, and Indonesia would face in the U.S. market. Therefore, we do not exercise our discretion to cumulate subject imports of CLPSS from China, India, and Indonesia.
III. REVOCATION OF THE ANTIDUMPING DUTY ORDER ON SUBJECT IMPORTS
FROM CHINA WOULD LIKELY LEAD TO THE CONTINUATION OR RECURRENCE OF MATERIAL INJURY TO THE DOMESTIC INDUSTRY WITHIN A REASONABLY FORESEEABLE TIME
1. Likely Volume of Subject Imports
In evaluating the likely volume of imports of subject merchandise if the antidumping duty order
is revoked, the Commission is directed to consider whether the likely volume of imports would be
16 With regard to the industry in Indonesia, capacity first increased rapidly from 108.8 million pieces in 2006 to
171.3 million pieces in 2008, then fluctuated irregularly during the remainder of the period, ending higher at 174.9 million pieces in 2011. In 2011, there were only *** pieces of excess capacity in Indonesia, an amount equal to *** percent of apparent U.S. LLP consumption. CR/PR at Table IV-11. With regard to the Indian industry, capacity increased steadily from 44.0 million pieces in 2006 to 85.1 million pieces in 2011. In 2011, there were 14.4 million pieces of excess capacity in the Indian industry, an amount equal to 1.29 percent of apparent U.S. LPP consumption. CR/PR at Table IV-9.
17 USITC Pub. 3884 at 67. Reported capacity of the Chinese industry increased from *** million pieces in 2003 to *** million pieces in 2005, and was projected to continue to increase, to *** million pieces, in 2007. Excess capacity in 2005 accounted for *** percent of apparent U.S. consumption in that year.
18 USITC Pub. 3884 at 67. 19 CR at IV-19; PR at IV-16. 20 “Of the hundreds and hundreds of producers in India and the staff report correctly notes that it's a very
fragmented industry, they are all, with one exception, small scale....” Hearing Transcript, p. 228 (Mr. Davis). 21 CR at IV-13, IV-15 n.27; PR at IV-11-IV-12 n.27.

55
significant either in absolute terms or relative to all production or consumption in the United States.22 In doing so, the Commission must consider “all relevant economic factors” including four enumerated factors: (1) any likely increase in production capacity or existing unused production capacity in the exporting country; (2) existing inventories of the subject merchandise, or likely increases in inventories; (3) the existence of barriers to the importation of such merchandise into countries other than the United States, and (4) the potential for product-shifting if production facilities in the foreign country, which can be used to produce the subject merchandise, are currently being used to produce other products.23
Imports from China increased significantly during the original investigation. By quantity, subject imports from China rose 85.7 percent over the period, from about 186.3 million units in 2003 to 345.9 million units in 2005.24 The share of apparent consumption captured by subject imports from China correspondingly rose from *** percent in 2003 to *** percent in 2005.25 Responding Chinese firms reported capacity increases of *** percent over the same period, with *** million units of excess capacity reported in 2005. Reported production rose from about *** million units to *** million units from 2003 to 2005.26 Additionally, reporting Chinese firms became increasingly dependent on the U.S. market during the original investigation, such that by 2005, *** percent of their shipments were exported to the U.S. and only *** percent were shipped to their home market.27 Responding Chinese producers’ inventories *** from *** units in 2003 to *** units in 2005.28
While imports of CLPSS from China declined sharply after imposition of the order, they maintained a substantial presence in the U.S. market.29 Subject imports from China accounted for between *** percent and *** percent of U.S. apparent consumption over the period of review.30 As in the original investigation, subject imports from China were by far the largest source of subject imports over the period of review, with annual quantities between 120.2 million pieces and 159.6 million pieces.31
The absolute and relative volumes of subject imports from China during the period of review indicate that China will likely maintain and strengthen its position as the largest single country supplier to the U.S. market in the event of revocation of the order. Import trends with respect to China’s OLPP -- the U.S. production of which is part of the domestic like product -- further support this conclusion. Unconstrained by any order, Chinese OLPP imports to the United States have grown rapidly from 182 million pieces in 2006 to 265 million pieces in 2011, an increase of 45.1 percent. OLPP imports from China increased their market share by *** percentage points over the period at the expense of both domestic and other subject producers.32
The limited information available on China in this review offers little insight into the current condition of the Chinese industry.33 The record does indicate that China became the world’s largest paper
22 19 U.S.C. § 1675a(a)(2). 23 Id. 24 Original Staff Report, INV-DD-117 (Aug. 15, 2006) at Table C-1 (EDIS Doc. 460949). 25 Confidential Original Determinations (“Original Determinations”) EDIS Doc. 460953 at 70. 26 Original Staff Report, INV-DD-117 (Aug. 15, 2006) at Table VII-7 (EDIS Doc. 460949). 27 Original Determinations at 71. 28 Original Determinations at 71 n.115. 29 CR/PR at Table I-1. Immediately after the order was entered, imports from China of CLPSS dropped from
345.9 million pieces to 159.6 million pieces in 2006. U.S. imports of CLPSS from China were 128.3 million pieces in 2007, 142.0 million pieces in 2008, 129.8 million pieces in 2009, 129.6 million pieces in 2010, and 120.2 million pieces in 2011.
30 CR/PR at Table I-1. 31 Id. 32 CR/PR at Table C-3. 33 There is no indication in the record that China faces barriers in any third country markets. See CR at IV-9; PR
at IV-7. U.S. importers’ inventories of subject product from China were minimal in every year of the period after 2006. See CR/PR at Table IV-5. Additionally, we make no finding on product shifting capabilities in China, and do not rely on that factor for our determination.

56
producer in 2008, and produced 23 million metric tons of printing and writing paper of the kind used to manufacture LPP in 2010, having increased production of such paper by over 14 million metric tons in the previous ten years.34 There is no evidence on this record that China has experienced any declines in capacity, production, or excess capacity since the original investigations. Additionally, the Chinese industry appears to remain export oriented, as it is currently the third largest paper exporter in the world in terms of value.35
Given the continued significant presence of Chinese subject imports in the U.S. market, the relative size and export orientation of the Chinese paper industry, and the lack of any evidence of declines in the Chinese industry’s capacity or production, we find that the volume of subject imports from China would likely be significant, both in absolute terms and relative to production and consumption in the United States, if the order were revoked.
2. Likely Price Effects of Subject Imports
In evaluating the likely price effects of subject imports if the antidumping duty order is revoked,
the Commission is directed to consider whether there is likely to be significant underselling by the subject imports as compared to the domestic like product and whether the subject imports are likely to enter the United States at prices that otherwise would have a significant depressing or suppressing effect on the price of domestic like products.36
In the original investigations, the Commission found that subject imports of CLPSS were generally substitutable for the domestic like product and that most sales are won or lost on price.37 Subject imports from China undersold U.S. prices in 22 of 48 quarterly comparisons, or in 45.8 percent of comparisons.38 However, 88 percent of the volume of subject imports from China was sold in quarters in which the Chinese product undersold the domestic product.39
There are very limited pricing data for China on the record in these reviews. However, the record indicates that price continues to remain the most important factor in LPP purchasing decisions.40 Additionally, most responding purchasers identified U.S. and Chinese product as comparable for all characteristics except for price, for which the product from China was rated as superior (i.e., lower).41
Due primarily to the likely significant volume of imports, but also to the importance of price in purchasing decisions and the general substitutability of subject and domestic product, we find that subject imports from China are likely to significantly undersell the domestic like product and suppress or depress domestic like product prices to a significant degree if the order is revoked.
3. Likely Impact of Subject Imports
In evaluating the likely impact of imports of subject merchandise if an antidumping duty order
under review is revoked, the Commission is directed to consider all relevant economic factors that are likely to have a bearing on the state of the industry in the United States, including, but not limited to, the following: (1) likely declines in output, sales, market share, profits, productivity, return on investments,
34 CR at IV-13; PR at IV-11. 35 Id. 36 19 U.S.C. § 1675(a)(3). The SAA states that “[c]onsistent with its practice in investigations, in considering
the likely price effects of imports in the event of revocation and termination, the Commission may rely on circumstantial, as well as direct, evidence of the adverse effects of unfairly traded imports on domestic prices.” SAA at 886.
37 Original Determinations at 44-45. 38 Original Dissent at 72. 39 Id. 40 CR at II-14; PR at II-11-II-12. 41 CR/PR at Table II-8.

57
and utilization of capacity; (2) likely negative effects on cash flow, inventories, employment, wages, growth, ability to raise capital, and investment; and (3) likely negative effects on the existing development and production efforts of the industry, including efforts to develop a derivative or more advanced version of the domestic like product.42 All relevant factors are to be considered “within the context of the business cycle and the conditions of competition that are distinctive to the affected industry.”43 As instructed by the statute, we have considered the extent to which any improvement in the state of the domestic industry is related to the order at issue and whether the industry is vulnerable to material injury if the order were revoked.44
In the original investigations, the Commission found that “[n]early all of the domestic industry’s trade and financial indicators displayed unfavorable trends that worsened during the period examined in the original investigation until the original petition was filed.”45 The domestic industry’s net sales quantity of LPP fell *** percent over the period, and its capacity utilization fell 12.5 points to 48.6 percent in 2005.46 The industry’s operating margin for LPP dropped *** points over the period, from *** percent in 2003 to *** percent in 2005.47
The domestic industry’s condition improved appreciably during the period of review. The domestic industry has reported operating margins as high as 18.7 percent during the period and, despite the economic recession, was profitable in every year of the period.48 In addition, the domestic industry posted healthy rates of return on its investment, ranging from 27.3 percent to 43.0 percent.49 Given these consistently strong financial results, we do not find the domestic industry to be currently vulnerable. However, due to the likely significant volumes from China and the likely significant adverse price effects they would have in the U.S. market absent the order, we find that subject imports from China would likely have a significant adverse impact on the production, shipments, sales, market share, and revenues of the domestic industry. For these reasons, we conclude that if the antidumping duty order were revoked, subject imports from China would be likely to have a significant adverse impact on the domestic industry within a reasonably foreseeable time.50
Accordingly, we determine that revocation of the antidumping duty order on CLPSS from China would likely lead to the continuation or recurrence of material injury to an industry in the United States within a reasonably foreseeable time.
IV. REVOCATION OF THE COUNTERVAILING DUTY ORDER AND ANTIDUMPING
DUTY ORDER ON SUBJECT IMPORTS FROM INDIA WOULD NOT LIKELY LEAD TO THE CONTINUATION OR RECURRENCE OF MATERIAL INJURY TO THE DOMESTIC INDUSTRY WITHIN A REASONABLY FORESEEABLE TIME 1. Likely Volume of Subject Imports
Imports of CLPSS from India are not likely to reach significant levels after revocation of the
42 19 U.S.C. § 1675a(a)(4) 43 Id. 44 19 U.S.C. § 1675a(a)(1)(B),(C) 45 Original Determinations at 49. 46 Original Staff Report at Revised Table C-1. 47 Id. 48 CR/PR at Table C-1. 49 CR/PR at Table III-12. 50 In light of our likely volume and likely price effects findings respecting subject imports from China, and
given the limited record respecting nonsubject imports of CLPSS and nonsubject country CLPSS industries, we are unpersuaded that, if the antidumping duty order on CLPSS from China were revoked, nonsubject imports would simply replace subject imports or break the requisite link between subject imports and the domestic industry’s condition.

58
orders. The industry in India has been a consistent, low-volume supplier of CLPSS to the U.S. market regardless of the presence or absence of the orders. During the original investigations, subject imports from India declined from 37.2 million pieces in 2003, to 36.0 million pieces in 2004, and to 31.3 million pieces in 2005 -- a period in which apparent U.S. consumption increased overall.51 After the orders were imposed, subject imports from India maintained their presence in the U.S. market, ranging from 24.2 million pieces (in 2006) to 43.9 million pieces (in 2009), and ending the period at 34.0 million pieces (in 2011), slightly above where they were at the end of the period examined in the original investigations.52 The share of apparent U.S. consumption of subject imports from India further demonstrates this consistent, limited level of participation in the U.S. market. During the original investigations, the share was *** percent in 2003 and declined overall to *** percent in 2005.53 During the period of these reviews, Indian subject imports fluctuated from a low of 2.1 percent of apparent U.S. consumption in 2006 to a high of 4.0 percent in 2009, and were identical in 2011 to what they were in 2003, 3.1 percent of apparent U.S. consumption.54
The absolute and relative volumes of subject imports from India during the period of review indicate that India will likely continue to play the role of steady, small supplier to the U.S. market in the event of revocation of the orders. Import trends with respect to India’s non-subject OLPP -- the U.S. production of which, as noted, is part of the domestic like product -- further support this conclusion. Despite not being subject to any order, Indian OLPP import volumes to the United States have consistently remained low in absolute and relative terms,55 trends that are similar to those exhibited by Indian OLPP imports during the original investigations. 56 Such trends do not depict an opportunistic supplier likely to increase import volumes significantly in the event of revocation.
We have also taken into consideration India’s capacity and capacity utilization.57 The data show an increase in capacity during the period of review.58 In 2011, the Indian industry’s capacity was 85.1 million pieces and its capacity utilization was 83.1 percent.59 Excess capacity thus amounted to 14.3 million pieces, equivalent to 1.6 percent of apparent U.S. consumption in that year.60 There is no evidence in the record of a likely significant increase in the Indian industry’s capacity in the reasonably foreseeable future.
51 CR/PR at Table I-1 (between 2003 and 2005, apparent U.S. consumption increased from *** billion pieces to
*** billion pieces). 52 CR/PR at Table I-1 (in 2005, they totaled 31.3 million pieces, as indicated above). 53 CR/PR at Table I-1. 54 CR/PR at Table I-1. In contrast, the share of CLPSS imports from China during these reviews ranged from
14 percent at the beginning of the period to 10.8 percent in 2011, well below their peak level of *** percent in the period examined in the original investigation. CR/PR at Table I-1.
55 CR/PR at Table C-3 (e.g., 3.5 million pieces in 2010, amounting to *** percent of U.S. consumption of OLPP, or 6.3 million pieces in 2011, *** percent of consumption).
56 See, e.g., Census Bureau statistics based on the HTS code designated by Staff as OLPP – 4820.10.2020. Import Statistics (Aug. 26, 2006), at 36-40 (EDIS Doc. 261139).
57 We find that the data reported by eight Indian producers or exporters in these reviews are representative of the portion of the Indian industry that has been recently active in the United States market and is likely to continue to be active in the reasonably foreseeable future. The responding Indian producers estimated that they accounted for *** percent of Indian production of CLPSS in 2010. CR at IV-15; PR at IV-12. These producers’ 2011 exports to the United States accounted for 91.0 percent of total subject imports from India in 2011. CR at IV-15, n. 27; PR at IV-12, n. 27. “I can assure you that anyone that has not responded to ITC questionnaire in this review is either insignificant, bankrupt, or no longer exporting.” Hearing Transcript, p. 162 (Mr. Sampat).
58 CR/PR at Table IV-9. 59 CR/PR at Table IV-9. The Indian industry has operated with excess capacity since 2004, often with lower
utilization rates than that evidenced in 2011. CR/PR at Table IV-9; Original Final Staff Report at Table VII-2. 60 CR/PR at Tables IV-9, I-13 (which excludes an HTS subheading that captures subject and non-subject
imports and is therefore more reliable though it necessarily understates apparent U.S. consumption).

59
India’s paper and paperboard industry is highly fragmented, with about 600 operating mills, many of which are small.61 On a global scale, India remains a small supplier of CLPSS, and its export volumes do not remotely place it among the top exporting countries.62 In 2011, India exported slightly more CLPSS than it shipped to its home market, and approximately half of India’s CLPSS exports were to the United States.63 However, its largest market is and has always been its home market, to which it shipped 48.5 percent of its CLPSS production in 2011.64 Moreover, projections are for growth in India’s home market, due in part to increased investments in education by the Indian government.65
Indian producers indicated that they ***.66 End-of-period inventories of Indian product held by U.S. importers were minimal and do not support finding a likelihood of significantly increased volumes of subject imports absent the orders.67 There is no record evidence that reporting Indian producers would likely engage in product shifting to increase exports to the U.S. market.68 Nor are there any known antidumping duty or countervailing duty investigations on CLPSS from India in third countries that would make the United States a more attractive market if the orders were revoked.69
For all of these reasons, we conclude that revocation of the orders on India is not likely to lead to a significant volume of subject imports from India in the reasonably foreseeable future.
2. Likely Price Effects of Subject Imports
We find that subject imports from India are not likely to undersell the domestic like product or
depress or suppress U.S. prices to a significant degree after revocation of the orders. In the original investigations, CLPSS from India oversold the domestic product in the majority of available price comparisons (***), by an average margin of *** percent.70 This trend continued during the period of review, in which the Indian product oversold the domestic product in 35 of 61 available price
61 CR at IV-14; PR at IV-11-IV-12. 62 See, e.g., CR/PR at Table IV-13 (listing India 22nd among countries exporting paper products). “India is a net
importer of bulk paper. India doesn't have spare paper that it needs to find a way of value adding and get it out of the country as an export. India is importing paper.” Hearing Transcript, p. 252 (Mr. Davis).
63 CR/PR at Table IV-9 (51.5 percent of India’s total shipments were to export destinations; the United States comprised 26.8 percent of its total shipments).
64 CR/PR at Table IV-9; see also Original Final Staff Report at Table VII-2. 65 See, e.g., Indian Respondents’ Prehearing Brief at 28. “Most of the Indian producers have built their capacity
considering the Indian market, which is growing at more than 10 percent.” Hearing Transcript, p. 164 (Mr. Sampat). 66 See, e.g., Indian Respondents’ Prehearing Brief at 29. We note further that reported inventories held in India
were fairly modest for this industry, including as a ratio to shipments. CR/PR at Table IV-9 (13.7 million pieces or 15.8 percent of total shipments in 2011 compared with *** percent for the domestic industry, CR/PR at Table C-2). “I wish to point out that all of the Indian producers produce all of their export orders, including their U.S. export products, on made-to-order basis. They produce for exports only after receiving a sales order. No Indian producer maintains an inventory of U.S. products.” Hearing Transcript, p. 167 (Mr. Sampat).
67 CR/PR at Table IV-5 (for example, *** pieces in 2011). 68 Indeed, Indian Respondents reported that CLPSS products exported to the United States are made on
dedicated machines that cannot be made to produce other than their dedicated product, and that CLPSS made for other markets could not be sent to the United States due to different consumer preferences in different markets. Indian Respondents’ Prehearing Brief at 29-30. “In the case of India, the big distinction is the finishing of the booklet. The majority of production is for those pin-bound booklets that you saw. That machine cannot be used at all for making the U.S. sewn or spiral-bound product. Those are just completely different machines. There's no amount of adjusting or resizing that would let you do that.” Hearing Transcript, p. 254 (Mr. Davis). “In India, the machines that make the pin-bound products are just entirely separate from the machines that make the other products, and there is no shifting back and forth. It's simply not possible.” Hearing Transcript, pp. 254-255 (Mr. Davis).
69 CR at IV-9; PR at IV-7. 70 CR/PR at Table V-10 n.1.

60
comparisons, by an average margin of *** percent.71 Bid data submitted by purchasers for 2011 showed that, as measured by value, *** percent of the contracts was awarded to U.S. producers, *** percent to non-subject suppliers, and only *** percent to Indian suppliers.72 Moreover, based on the pricing data collected in these reviews, U.S. prices generally increased from their 2006 levels.73 In addition to achieving price increases, the U.S. industry is not currently experiencing a cost-price squeeze, as the ratio of COGS to net sales fluctuated without any meaningful trend during the period of review.74 On this record, and particularly as it relates to the original investigations and the limited likely volume of subject imports from India, we find that subject imports from India are not likely to significantly undersell the domestic like product, much less suppress or depress like product prices to any significant degree, in the event of revocation of the orders.
3. Likely Impact of Subject Imports
We further find that subject imports from India would not likely have a significant adverse impact on the domestic industry in the event of revocation. As discussed above, we have found that the domestic industry is not vulnerable to the continuation or recurrence of material injury in the reasonably foreseeable future. To the contrary, and in stark contrast to the industry’s condition in the original period of investigation, we have found significant improvement in the industry’s financial performance. With regard to imports from India, there is no correlation between the volume of subject imports from India and the domestic industry’s condition. India has not only remained in the market notwithstanding the orders, its limited exports actually increased during the period of review, a period in which the domestic industry achieved improved financial performance. On this record, we are not persuaded that the orders on India had any impact on India’s level of participation in the U.S. market, much less contributed to the improvement in the condition of the domestic industry.
In light of the domestic industry’s current condition, and given that we do not find that the volume of subject imports from India will be significant or have significant adverse price effects, we find that revocation of the orders on India would not likely lead to a significant adverse impact on the domestic industry.
Accordingly, we conclude that revocation of the antidumping duty and countervailing duty orders on India is not likely to lead to the continuation or recurrence of material injury to the domestic industry within a reasonably foreseeable time.
V. CONCLUSION
For the above-stated reasons, and those set forth in the sections of the majority views that we join,
we determine that revocation of the antidumping duty order on imports of CLPSS from China would be likely to lead to the continuation or recurrence of material injury to an industry in the United States within a reasonably foreseeable time and that revocation of the antidumping duty orders and countervailing duty orders on CLPSS from India and Indonesia would not be likely to lead to the continuation or recurrence of material injury within a reasonably foreseeable time.
71 CR/PR at Table V-10. AASPS has argued in these reviews that direct imports by retailers should be
combined with price data reported by importers. AASPS Posthearing Br. Exh. 1 at 59-60. We have analyzed the pricing data collected using our traditional approach that excludes direct imports by retailers from direct price comparisons. Direct imports by retailers are not at the same level of trade as sales made by importers, and therefore are not comparable.
72 CR at V-26; PR at V-7-V-8; CR/PR at Table V-11. We note that, based on the bid data reported, *** percent of the value of contracts awarded to non-subject suppliers were actually arranged through U.S. producers with non-subject suppliers. CR at V-26, PR at V-7-V-8.
73 CR at V-5; PR at V-4; CR/PR at Table V-2 & Figs. V-2-V-6. 74 CR/PR at Table C-1.

SEPARATE AND DISSENTING VIEWS OF CHAIRMAN IRVING A. WILLIAMSON
Based on the record in these investigations, I determine that revocation of the antidumping andcountervailing duty orders covering certain lined paper school supplies from India and Indonesia, and theantidumping duty order covering certain lined paper school supplies from China, would be likely to leadto continuation or recurrence of material injury to an industry in the United States within a reasonablyforeseeable time. I join the Views of the Commission except that I find no likely conditions of competition thatwould warrant decumulating Indonesia from the other subject countries. I write these views to explain:(a) my conclusion on this issue; (b) my analysis of the volume effects, price effects, and impact of subjectimports from Indonesia; and (c) my analysis of likely conditions of competition and likely volume, likelyprice effects, and likely impact based upon cumulated subject imports from China, India, and Indonesia.
Cumulation for Indonesia – other conditions of competition
I find that the subject imports from China, India, and Indonesia are likely to compete undersimilar conditions in the U.S. market in the event of revocation. The Views of the Commission explainhow the CLPSS industries in China and India are large, export-oriented, present in the U.S. market beforethe orders, and viewed similarly by U.S. purchasers. In my view, the Indonesian CLPSS industryresembles those of China and India.
The Indonesian CLPSS industry is large and export-oriented. In 2011, Tjiwi produced over ***pieces of LPP, *** pieces of which were subject CLPSS. Of that CLPSS production, *** pieces wereexported.1 The Indonesian industry also has substantial capacity for producing OLPP, producing ***pieces in 2011. ***.2 Thus, even if ***, this would be enough to have a substantial impact on its exportsof CLPSS.
Indonesian CLPSS was present in the U.S. market over 2003-2005, accounting for between ***percent of U.S. CLPSS consumption.3 In these reviews, U.S. purchasers described U.S. and Indonesianproduct as interchangeable, and some expressed an interest in Indonesian product should it becomeavailable again.4
Tjiwi makes two arguments regarding likely conditions of competition to explain why Indonesiashould not be cumulated with China and India. I do not find either argument persuasive.
First, Tjiwi claims that it is operating at full capacity, is not planning any future capacityexpansions, and has no interest in the U.S. market.5 However, even accepting Tjiwi’s claim, Tjiwi’soverall capacity for LPP nonetheless rose by *** over 2006-11.6 Tjiwi describes these capacity changesas due to ***. However, these *** resulted in a *** increase in CLPSS capacity and a *** increase inOLPP capacity, suggesting that smaller changes in OLPP capacity can lead to larger changes in CLPSScapacity. Furthermore, Tjiwi clearly has substantial ability to produce OLPP, with its OLPP production
1 CR/PR at Tables IV-10 and IV-11.
2 ***. CR/PR at Table IV-10.
3 OCR at Table C-3.
4 CR at D-17 and D-19; PR at D-5.
5 Tjiwi Posthearing Brief at 7-8, CR/PR at Table IV-10, and Tjiwi Prehearing Brief, p. 16.
6 CR at Table IV-10.
61

reaching *** pieces in 2011.7 Also, although it has *** 2011 exports to the United States with the ordersin place, Tjiwi has substantial export shipments of CLPSS, with those exports reaching *** pieces in2011.8
In order to accept Tjiwi’s claim that it does not have an interest in substantial exports to the U.S.market, one must accept both that Tjiwi is not interested in the single-largest national market for paperproducts in the world,9 and that it would not use its OLPP capacity to produce CLPSS for the U.S.market. The evidence does not support Tjiwi’s claim that it is more interested in other countries’ CLPSSmarkets than in the U.S. market. Some of the markets in which it claims to have an interest aresubstantially smaller than the U.S. market (the largest in the world).10 Because the U.S. order on CLPSSfrom China will continue, Tjiwi could face substantial Chinese competition in its other markets becauseno other country has imposed antidumping restrictions on Chinese imports of subject product.11 12
Tjiwi attempts to show its lack of interest in the U.S. CLPSS market with “The Kelly Report,”attached to its prehearing and posthearing briefs.13 This report shows alleged price levels in othercountries’ markets, and in particular shows markets with higher price levels than in the United States. Nonetheless, the data underlying these claims, as well as more detailed descriptions of the exact productsfor which data was offered, were generally not provided. Thus, other parties could not address thereport’s claims, nor could staff confirm if similar trends existed in other available data.14 I do not findthese claims, as submitted, to be persuasive.
Tjiwi also argues that its participation in the U.S. OLPP market over the POI demonstrates itslack of interest in the U.S. CLPSS market. It is true that from 2007 to 2011, U.S. imports of OLPP fromIndonesia fell by 48.7 million pieces, and this fall may be due mostly to ***. At the same time, however,U.S. imports of OLPP from China rose by 52.3 million, while overall U.S. OLPP consumption fell by ***pieces.15 This rise of OLPP from China, while U.S. consumption fell, may explain much of Tjiwi’sinability to find replacements for all of the sales that it lost. However, because the antidumping dutyorder on CLPSS from China will continue, the U.S. CLPSS market will fundamentally differ from theU.S. OLPP market, which has no restraints on Chinese imports. Given this difference in the U.S. CLPSSand OLPP markets, I cannot draw conclusions about the U.S. CLPSS market based on the U.S. OLPPmarket.
After considering Tjiwi’s claims concerning Indonesia’s capacity and finding them unpersuasive,I observe that, regarding Tijwi’s interest in the U.S. market: (1) Tjiwi previously sold in the U.S. market;
7 CR at Table IV-10.
8 CR at Table IV-11.
9 CR at Table IV-12.
10 For example, Tjiwi cites its *** (for example, see Tjiwi’s Posthearing Brief, ex. 15 in ex. 1 and 2), while no*** are listed in the staff report’s list of the largest world importers of paper products. CR/PR at Table IV-12.
11 CR at p. IV-9; PR at p. IV-7.
12 Furthermore, AASPS' description of the Canadian market, dominated by two large purchasers, begs thequestion of whether developing country markets are more similar to the smaller Canadian market (with relativelyfew purchasers) or the U.S. market (with many purchasers). If other markets are more similar to the Canadianmarket, it seems even more likely that such markets are thus more difficult to sell into with higher-priced product, asthey are not only smaller, but have fewer purchasers.
13 Tjiwi Prehearing Brief at ex. 1; Tjiwi Posthearing Brief at ex. 15.
14 AASPS Posthearing Brief, ex. 1 p. 70.
15 CR/PR at Table C-3.
62

(2) the U.S. market remains the single largest market in the world, with a multitude of purchasers;16 and(3) the U.S. market is fundamentally different (and more appealing to Indonesia) than other worldmarkets because the antidumping duty order on subject imports from China will limit Chinesecompetition. I also observe that, regarding Tjiwi’s ability to supply the U.S. market: (1) Tjiwi has shownsome ability to increase capacity; (2) Tjiwi has considerable spare OLPP capacity that it could divert toCLPSS; and (3) Tjiwi has considerable exports of CLPSS to third-country markets. Based on thesefactors, I conclude that Indonesia would likely have an interest and capability in resuming high volumeexports to the U.S. market. Tjiwi’s second major argument for why subject imports from Indonesiashould be decumulated is that, due to the lack of environmental certification for subject imports fromIndonesia, such imports face likely differences in conditions of competition.17 I find two deficiencieswith this argument. First, purchaser adherence to existing environmental standards is voluntary and cancease at any time. In the original investigations, Indonesian product undersold U.S. product in all ***comparisons, by an average margin of *** percent.18 In a market in which price plays an important rolein purchasing,19 purchasers’ desire for low prices may outweigh their reticence to purchase Indonesianmaterial.
Second, there is limited evidence that purchasers are currently using such standards. Tjiwisupplied a ***, and evidence that ***. Additionally, in its purchaser questionnaire, *** noted someconcerns about using product made from Indonesian wood, while also noting that product from Indonesia“would return as an option.”20 However, these three purchasers are hardly the only purchasers of LPP. The Commission received questionnaires from 26 purchasers, including ***, but even these 26 purchasersonly accounted for 32 percent of 2011 U.S. apparent consumption of LPP.21 In such a broad market, thefact that *** indicated an unwillingness to purchase Indonesian product or expressed a concern aboutdoing so weighs against finding that current purchaser preferences would lead to substantially differentconditions of competition for Indonesian product.
Large retailers *** indicated that in the event of revocation of the duties, they would considerpurchasing the subject imports from Indonesia, and did not mention environmental concerns.22 Additionally, in the original investigations, petitioners allegedly lost sales and revenues to purchasersother than ***. These purchasers included ***. While *** disagreed with the allegations, the other firmseither agreed or did not respond.23
Furthermore, purchasers had an opportunity in their questionnaire responses to nameenvironmental certification as an important purchasing factor, and few did so. The staff report does notindicate that purchasers regarded environmental certification as a factor determining quality.24 Purchasersnamed price, quality (already shown not to mean environmental certification), availability, and reliabilityas the most important factors in purchasing decisions. They did not name environmental certification,although the questionnaire allowed them to name their own factors as well as define quality as theywished.
16 CR at p. I-31.
17 Tjiwi Posthearing Brief at pp. 7-8.
18 OCR at Table V-8.
19 CR/PR Tables II-4 and II-5, and CR at p. II-15; PR at II-9.
20 Parties in support of continuation of the orders also note that ***. AASPS Posthearing Brief, ex. 1, p. 20.
21 CR at p. I-31 and II-1; PR at I-26 and II-1.
22 CR at pp. D-17 and D-19; PR at p. D-5.
23 OCR at table V-11. AASPS supplied a declaration *** that *** However, in that ***. AASPS PosthearingBrief, ex. 10A.
24 CR at p. II-16; PR at p. II-10.
63
Finally, in addition to the two deficiencies with Tjiwi’s argument on certification alreadydiscussed, parties in support of continuation of the order noted that Tjiwi could use pulp from non-Indonesian, certifiable sources (such as from related parties in China).25
Given the Indonesian industry’s clear ability to supply the U.S. market, its past behavior in doingso, and its lack of convincing arguments as to why its imports should be decumulated from other subjectimports, I exercise my discretion to cumulate subject imports from China, India, and Indonesia.
Additional Volume and Price Effects of Subject Imports from Indonesia
In addition to the analysis in the Views of the Commission, I add the following discussion of thevolume effects, price effects, and impact of subject imports from Indonesia.
Likely Volume–
I reach the same conclusion as in the Views, but also include Indonesia in the analysis. Indonesiais the 12th-largest exporter (by value) of paper products in the world.26 In the original investigations,Indonesian CLPSS accounted for between *** and *** percent of U.S. consumption (by quantity)between 2003 and 2005.27 In 2011, Indonesia exported over *** pieces out of its *** pieces ofproduction, giving it substantial ability to divert future exports to the United States.28 While Tjiwi hasargued that its total capacity to produce LPP has not changed much over 2006-11, over that period itallocated an additional *** pieces of capacity to CLPSS.29 As discussed above, the U.S. CLPSS market islikely more appealing than other world markets due to the continued antidumping duties on China. Tjiwihas substantial ability to switch more capacity into CLPSS and export to the U.S. market. Based on thisevidence and the analysis in section IV.D.1 of the Views, I find that revocation of the orders on subjectimports from China, India, and Indonesia would likely result in a significant increase in cumulated subjectimports from China, India, and Indonesia within a reasonably foreseeable time.
Likely Price Effects--
I reach the same conclusion as in the Views, but also include Indonesia in the analysis. Whilethere is almost no pricing data for Indonesia in these reviews, the pricing data in the originalinvestigations showed that Indonesian product undersold U.S. product in *** comparisons, with anaverage margin of *** percent.30 Additionally, I note that both U.S. AUVs and pricing product prices roseafter imposition of the orders, while nonsubject AUVs remained substantially above the levels of subjectAUVs before imposition of the orders.31 Thus, based on this analysis and the analysis in section IV.D.2of the Views, I find that, if the orders were revoked, significant volumes of subject imports from China,India, and Indonesia would significantly undersell the domestic like product to gain market share, therebydepressing like product prices to a significant degree.
25 Tr. at 118 (Robinson).
26 CR/PR at Table IV-13.
27 OCR, Table C-3.
28 CR/PR at Table IV-11.
29 CR/PR at Table IV-11.
30 OCR, Table V-8.
31 CR/PR at Tables I-1 and V-1-5.
64

Likely Impact–
While I agree with the majority’s Views, I further find that cumulating subject imports fromIndonesia with subject imports from China and India makes it more likely that revocation of the orderswill result in a significant adverse impact on the domestic industry within a reasonably foreseeable time.
Thus I conclude that, if the orders were revoked, cumulated subject imports from China, India,and Indonesia would likely lead to the continuation or recurrence of material injury to the domesticindustry within a reasonably foreseeable time.
65


PART I: INTRODUCTION AND OVERVIEW
BACKGROUND
On August 1, 2011, the U.S. International Trade Commission (“Commission” or “USITC”) gavenotice, pursuant to section 751(c) of the Tariff Act of 1930, as amended (“the Act”),1 that it had institutedreviews to determine whether revocation of the countervailing duty orders on certain lined paper schoolsupplies (“CLPSS”) from India and Indonesia and the antidumping duty orders on CLPSS from China,India, and Indonesia would likely lead to the continuation or recurrence of material injury to a domesticindustry.2 3 On November 4, 2011, the Commission determined that it would conduct full reviewspursuant to section 751(c)(5) of the Act.4 The following tabulation presents information relating to theschedule of this proceeding:5
Effective date Action
September 28, 2006Commerce’s countervailing duty orders on CLPSS from India and Indonesiaand antidumping duty orders on CLPSS from China, India, and Indonesia (71 FR 56949 and 71 FR 62583)
August 1, 2011 Commission’s institution of five-year reviews (76 FR 45851)
August 1, 2011 Commerce’s initiation of five-year reviews (76 FR 45778)
November 4, 2011 Commission’s determinations to conduct full five-year reviews (76 FR72213, November 22, 2011)
November 29, 2011 Commerce’s final results of expedited five-year review of the countervailingduty order on CLPSS from Indonesia (76 FR 73592)
December 6, 2011 Commerce’s final results of expedited five-year review of the antidumpingduty orders on CLPSS from China, India, and Indonesia (76 FR 76123)
Tabulation continued on next page.
1 19 U.S.C. 1675(c).
2 Certain Lined Paper School Supplies From China, India, and Indonesia-Institution of Five-Year ReviewsConcerning the Countervailing Duty Orders on Certain Lined Paper School Supplies From India and Indonesia andthe Antidumping Duty Orders on Certain Lined Paper School Supplies From China, India, and Indonesia, 76 FR45851, August 1, 2011. All interested parties were requested to respond to this notice by submitting the informationrequested by the Commission.
3 In accordance with section 751(c) of the Act, the U.S. Department of Commerce (“Commerce”) published anotice of initiation of five-year reviews of the subject antidumping and countervailing duty orders concurrently withthe Commission’s notice of institution. Initiation of Five-Year (‘‘Sunset’’) Review, 76 FR 45778, August 1, 2011.
4 Certain Lined Paper School Supplies From China, India, and Indonesia; Notice of Commission DeterminationsTo Conduct Full Five-Year Reviews, 76 FR 72213, November 22, 2011. Commissioner Charlotte R. Lane dissentedfrom the majority, instead finding that the respondent interested party group response was inadequate and that theCommission should conduct expedited reviews.
5 The Commission’s notice of institution, notice to conduct full reviews, scheduling notice, and statement onadequacy appear in appendix A and may also be found at the Commission’s web site (internet addresswww.usitc.gov). Commissioners’ votes on whether to conduct expedited or full reviews may also be found at theweb site. Appendix B presents the witnesses appearing at the Commission’s hearing.
I-1

Effective date Action
December 6, 2011 Commerce’s final results of expedited five-year review of the countervailingduty order on CLPSS from India (76 FR 76147)
January 26, 2012 Commission’s scheduling of the reviews (77 FR 5055, February 1, 2012)
June 12, 2012 Commission’s hearing
August 2, 2012 Commission’s vote
August 14, 2012 Commission’s determinations transmitted to Commerce
The Original Investigations
The original investigations resulted from a petition filed on September 9, 2005 by MeadWestvacoCorp. (“MeadWestvaco”) of Dayton, OH; Norcom, Inc. (“Norcom”) of Norcross, GA; and Top Flight,Inc. (“Top Flight”) of Chattanooga, TN (collectively, Association of American School Paper Suppliers(“AASPS”)), alleging that an industry in the United States is materially injured and threatened withmaterial injury by reason of subsidized imports of CLPSS from India and Indonesia and less-than-fair-value (“LTFV”) imports of CLPSS from China, India, and Indonesia. Following notification of a finaldetermination by Commerce that imports of CLPSS from India and Indonesia were being subsidized andthat imports from China, India, and Indonesia were being sold at LTFV, the Commission determined onSeptember 6, 2006 that a domestic industry was materially injured by reason of subsidized imports ofCLPSS from India and Indonesia and LTFV imports of CLPSS from China, India, and Indonesia.6 Commerce published the countervailing duty order on subject imports of CLPSS from India andIndonesia and the antidumping duty order on CLPSS from China, India, and Indonesia on September 28,2006.7
STATUTORY CRITERIA
Section 751(c) of the Act requires Commerce and the Commission to conduct a review no laterthan five years after the issuance of an antidumping or countervailing duty order or the suspension of aninvestigation to determine whether revocation of the order or termination of the suspended investigation“would be likely to lead to continuation or recurrence of dumping or a countervailable subsidy (as thecase may be) and of material injury.”
Section 752(a) of the Act provides that in making its determination of likelihood of continuationor recurrence of material injury–
6 Certain Lined Paper School Supplies from China, India, and Indonesia, Inv. Nos. 701-TA-442-443 and 731-TA-1095-1097 (Final), USITC Publication 3884 (September 2006).
7 Notice of Amended Final Determination of Sales at Less Than Fair Value: Certain Lined Paper Products fromthe People's Republic of China; Notice of Antidumping Duty Orders: Certain Lined Paper Products from India,Indonesia and the People's Republic of China; and Notice of Countervailing Duty Orders: Certain Lined PaperProducts from India and Indonesia, 71 FR 56949, September 28, 2006; and Notice of Correction to Notice ofAmended Final Determination of Sales at Less Than Fair Value: Certain Lined Paper Products from the People'sRepublic of China; Notice of Antidumping Duty Orders: Certain Lined Paper Products from India, Indonesia andthe People's Republic of China; and Notice of Countervailing Duty Orders: Certain Lined Paper Products fromIndia and Indonesia, 71 FR 62583, October 26, 2006.
I-2

(1) IN GENERAL.-- . . . the Commission shall determine whether revocation ofan order, or termination of a suspended investigation, would be likely to lead tocontinuation or recurrence of material injury within a reasonably foreseeable time. TheCommission shall consider the likely volume, price effect, and impact of imports of thesubject merchandise on the industry if the order is revoked or the suspended investigationis terminated. The Commission shall take into account--
(A) its prior injury determinations, including the volume, priceeffect, and impact of imports of the subject merchandise on the industrybefore the order was issued or the suspension agreement was accepted,
(B) whether any improvement in the state of the industry isrelated to the order or the suspension agreement,
(C) whether the industry is vulnerable to material injury if theorder is revoked or the suspension agreement is terminated, and
(D) in an antidumping proceeding . . ., (Commerce’s findings)regarding duty absorption . . ..
(2) VOLUME.--In evaluating the likely volume of imports of the subjectmerchandise if the order is revoked or the suspended investigation is terminated, theCommission shall consider whether the likely volume of imports of the subjectmerchandise would be significant if the order is revoked or the suspended investigation isterminated, either in absolute terms or relative to production or consumption in theUnited States. In so doing, the Commission shall consider all relevant economic factors,including--
(A) any likely increase in production capacity or existing unusedproduction capacity in the exporting country,
(B) existing inventories of the subject merchandise, or likelyincreases in inventories,
(C) the existence of barriers to the importation of suchmerchandise into countries other than the United States, and
(D) the potential for product-shifting if production facilities inthe foreign country, which can be used to produce the subjectmerchandise, are currently being used to produce other products.
(3) PRICE.--In evaluating the likely price effects of imports of the subjectmerchandise if the order is revoked or the suspended investigation is terminated, theCommission shall consider whether--
(A) there is likely to be significant price underselling by importsof the subject merchandise as compared to domestic like products, and
(B) imports of the subject merchandise are likely to enter theUnited States at prices that otherwise would have a significantdepressing or suppressing effect on the price of domestic like products.
(4) IMPACT ON THE INDUSTRY.--In evaluating the likely impact of imports ofthe subject merchandise on the industry if the order is revoked or the suspendedinvestigation is terminated, the Commission shall consider all relevant economic factorswhich are likely to have a bearing on the state of the industry in the United States,including, but not limited to–
I-3

(A) likely declines in output, sales, market share, profits,productivity, return on investments, and utilization of capacity,
(B) likely negative effects on cash flow, inventories, employment,wages, growth, ability to raise capital, and investment, and
(C) likely negative effects on the existing development andproduction efforts of the industry, including efforts to develop aderivative or more advanced version of the domestic like product.
The Commission shall evaluate all such relevant economic factors . . . within the contextof the business cycle and the conditions of competition that are distinctive to the affectedindustry.
Section 752(a)(6) of the Act states further that in making its determination, “the Commission mayconsider the magnitude of the margin of dumping or the magnitude of the net countervailable subsidy. Ifa countervailable subsidy is involved, the Commission shall consider information regarding the nature ofthe countervailable subsidy and whether the subsidy is a subsidy described in Article 3 or 6.1 of theSubsidies Agreement.” Information obtained during the course of the reviews that relates to the statutorycriteria is presented throughout this report.
SUMMARY DATA
Table I-1 presents a summary of data from the original investigations and the current full five-year reviews.8 U.S. industry data and related information for the original investigations were based onquestionnaire responses from ten firms, while industry information for the current five-year reviews isbased on the questionnaire responses of eight U.S. producers of lined paper products (“LPP”), six ofwhich provided usable data.9 U.S. import data for both the original investigations and the five-yearreviews are based on official Commerce statistics. Related information on imports in the originalinvestigations was based on questionnaire responses of 49 U.S. importers, while related information onimports in the current reviews is from the questionnaire responses of 25 U.S. importers of CLPSS. Asummary of trade and financial data for LPP, CLPSS, and other lined paper products (“OLPP”) ascollected in the reviews is presented in appendix C. Responses by U.S. producers, importers, purchasers,and foreign producers of CLPSS to a series of questions concerning the significance of the existingantidumping and countervailing duty orders and the likely effects of revocation of such orders arepresented in appendix D.
8 As was done in the final investigations, the Commission collected all quantity data in pieces for these reviews. Parties that provided comments on the Commission’s draft questionnaires did not object to collecting quantity datain pieces. However, Tjiwi Kimia states that it tracks capacity and production in metric tons and not units. Itbelieves that units are not a common unit of measure because LPP encompass a wide range of paper products withdifferent dimensions and weights. Tjiwi Kimia’s prehearing brief, pp. 14-16. Likewise, Indian respondents agreethat the average size and weight for paper products can change considerably from year to year and that a singleconversion factor is not entirely accurate. Indian producers’ prehearing brief, pp. 7-9.
9 In the original investigations, the ten responding U.S. producers accounted for virtually all known production ofLPP. In the current five-year reviews, the eight responding U.S. producers also account for virtually all knownproduction of LPP.
I-4

I-5
Table I-1LPP: Comparative data from the original investigations and current reviews, 2003-05 and 2006-2011
(Quantity=1,000 pieces; value=$1,000; unit values are per piece)Item 2003 2004 2005 2006 2007 2008 2009 2010 2011
U.S. consumption quantity: *** *** *** 1,135,979 1,218,248 1,213,736 1,086,690 1,206,771 1,113,877
Producers’ share1 *** *** *** 27.4 22.7 23.4 23.6 22.5 25.3
Importer’s share:1
CLPSS from China *** *** *** 14.0 10.5 11.7 11.9 10.7 10.8
CLPSS from India *** *** *** 2.1 3.5 3.0 4.0 3.4 3.1
CLPSS from Indonesia *** *** *** 0.3 0.4 0.4 0.8 0.4 0.4
Subtotal, subject *** *** *** 16.5 14.4 15.1 16.8 14.5 14.2
All other sources *** *** *** 26.4 30.1 32.1 26.2 26.5 24.9
Subtotal, CLPSS *** *** *** 42.8 44.5 47.3 43.0 41.0 39.1
OLPP imports (all sources) *** *** *** 29.8 32.8 29.3 33.4 36.5 35.6
Total imports *** *** *** 72.6 77.3 76.6 76.4 77.5 74.7
U.S. consumption value: *** *** *** 740,577 833,782 846,942 710,466 754,675 736,103
Producers’ share1 *** *** *** 32.8 28.3 27.8 33.0 29.6 32.0
Importer’s share:1
CLPSS from China *** *** *** 14.8 13.5 14.6 13.8 15.7 15.2
CLPSS from India *** *** *** 1.4 3.0 2.3 3.3 2.9 2.4
CLPSS from Indonesia *** *** *** 0.1 0.2 0.2 0.4 0.3 0.2
Subtotal, subject *** *** *** 16.4 16.6 17.1 17.5 18.9 17.8
All other sources *** *** *** 27.1 29.8 32.2 29.5 29.1 26.6
Subtotal, CLPSS *** *** *** 43.5 46.4 49.3 47.0 48.0 44.5
OLPP imports (all sources) *** *** *** 23.7 25.3 23.0 20.1 22.3 23.5
Total imports *** *** *** 67.2 71.7 72.2 67.0 70.4 68.0
Table continued on next page.

I-6
Table I-1--ContinuedLPP: Comparative data from the original investigations and current reviews, 2003-05 and 2006-2011
(Quantity=1,000 pieces; value=$1,000; unit values are per piece)
Item 2003 2004 2005 2006 2007 2008 2009 2010 2011
U.S. imports of CLPSS from–China:
Quantity 186,278 220,744 345,897 159,562 128,262 141,967 129,796 129,581 120,247
Value 108,779 131,836 191,063 109,795 112,295 123,715 98,172 118,835 111,941
Unit value $0.58 $0.60 $0.55 $0.69 $0.88 $0.87 $0.76 $0.92 $0.93
India:Quantity 37,226 35,991 31,312 24,240 42,421 36,882 43,940 40,568 33,994
Value 15,779 13,122 11,929 10,659 24,680 19,401 23,370 21,970 17,774
Unit value $0.42 $0.36 $0.38 $0.44 $0.58 $0.53 $0.53 $0.54 $0.52
Indonesia:Quantity 38,998 34,985 39,305 3,207 4,415 4,956 8,315 4,933 4,369
Value 15,477 12,603 14,804 1,034 1,560 1,651 2,628 2,169 1,672
Unit value $0.40 $0.36 $0.38 $0.32 $0.35 $0.33 $0.32 $0.44 $0.38
Subject sources:Quantity 262,503 291,719 416,514 187,009 175,097 183,804 182,052 175,083 158,610
Value 140,035 157,561 217,797 121,489 138,535 144,768 124,171 142,974 131,387
Unit value $0.53 $0.54 $0.52 $0.65 $0.79 $0.79 $0.68 $0.82 $0.83
Table continued on next page.

I-7
Table I-1--ContinuedLPP: Comparative data from the original investigations and current reviews, 2003-05 and 2006-2011
(Quantity=1,000 pieces; value=$1,000; unit values are per piece)
Item 2003 2004 2005 2006 2007 2008 2009 2010 2011
All other sources:Quantity 89,175 165,790 143,794 299,506 367,145 390,036 285,059 319,606 277,336
Value 75,755 133,590 138,241 200,642 248,189 272,694 209,458 219,582 195,959
Unit value $0.85 $0.81 $0.96 $0.67 $0.68 $0.70 $0.73 $0.69 $0.71
All countries:Quantity 351,678 457,509 560,308 486,515 542,243 573,840 467,111 494,688 435,947
Value 215,791 291,151 356,037 322,131 386,724 417,461 333,629 362,556 327,346
Unit value $0.61 $0.64 $0.64 $0.66 $0.71 $0.73 $0.71 $0.73 $0.75
U.S. imports of OLPP from–All sources:
Quantity 276,025 283,201 297,775 338,716 399,065 355,426 363,371 440,408 396,623
Value 128,851 148,124 165,348 175,776 210,797 194,451 142,597 168,370 173,099
Unit value $0.47 $0.52 $0.56 $0.52 $0.53 $0.55 $0.39 $0.38 $0.44
U.S. producers’--Capacity quantity 994,544 968,949 898,352 547,915 540,808 555,892 561,910 569,482 601,280
Production quantity 607,883 568,079 436,979 305,048 290,428 279,511 222,102 260,753 330,475
Capacity utilization1 61.1 58.6 48.6 55.7 53.7 50.3 39.5 45.8 55.0
U.S. shipments:
Quantity *** *** *** 310,747 276,940 284,470 256,208 271,675 281,308
Value *** *** *** 242,670 236,262 235,031 234,240 223,749 235,657
Unit value $*** $*** $*** $0.78 $0.85 $0.83 $0.91 $0.82 $0.84
Ending inventory quantity 116,926 124,097 118,683 *** *** *** *** *** ***
Inventories/total shipments1 *** *** *** *** *** *** *** *** ***
Table continued on next page.

I-8I-8
Table I-1--ContinuedLPP: Comparative data from the original investigations and current reviews, 2003-05 and 2006-2011
(Quantity=1,000 pieces; value=$1,000; unit values are per piece)
Item 2003 2004 2005 2006 2007 2008 2009 2010 2011
Production workers 1,264 1,157 942 498 506 500 485 519 524
Hours worked (1,000 hours) 2,540 2,266 1,610 853 868 869 846 879 942
Wages paid (1,000 dollars) 44,669 40,870 29,319 24,385 24,675 24,172 24,177 25,712 26,392
Hourly wages $17.58 $18.03 $18.21 $28.59 $28.43 $27.82 $28.58 $29.25 $28.02
Productivity (pieces per hour) 239.3 250.7 271.4 357.6 334.6 321.6 262.5 296.6 350.8
Net sales:Quantity *** *** *** 320,883 287,499 294,387 263,608 279,577 290,696
Value *** *** *** 251,668 245,824 244,344 240,215 230,800 243,276
Unit value *** *** *** $0.78 $0.86 $0.83 $0.91 $0.83 $0.84
Cost of goods sold *** *** *** 191,350 189,892 182,644 170,775 162,736 179,048
Gross profit or (loss) *** *** *** 60,318 55,932 61,700 69,440 68,064 64,228
Operating income or (loss) *** *** *** 34,326 31,791 38,038 44,142 43,048 37,386
Unit cost of goods sold *** *** *** $0.60 $0.66 $0.62 $0.65 $0.58 $0.62
Unit operating income or (loss) *** *** *** $0.11 $0.11 $0.13 $0.17 $0.15 $0.13
Cost of goods sold/sales1 *** *** *** 76.0 77.2 74.7 71.1 70.5 73.6
Operating income or (loss)/sales1 *** *** *** 13.6 12.9 15.6 18.4 18.7 15.4
1 In percent.
Source: Data for the period 2003-05 are compiled from information presented in the final investigation staff report. Data for 2006-11 are compiled from data submitted in response to Commissionquestionnaires and official Commerce statistics. CLPSS import data are based on HTS subheadings 4811.90.9050, 4811.90.9090, 4820.10.2030, 4820.10.2040, 4820.10.2050, and 4820.10.2060. OLPP import data are based on HTS subheading 4820.10.2020.

COMMERCE’S REVIEWS
Administrative Reviews10
Commerce has completed three antidumping duty administrative reviews with regard to subjectimports of CLPSS from China, four administrative reviews of the outstanding antidumping duty order onCLPSS from India, and one administrative review on the countervailing duty order on CLPSS from India. There have been no administrative reviews concerning the antidumping or countervailing duty orders onCLPSS from Indonesia.11
China
Commerce has completed three antidumping duty administrative reviews with regard to subjectimports of CLPSS from China. The results of the administrative reviews are shown in table I-2.
Table I-2CLPSS: Administrative reviews of the antidumping duty order for China
Date resultspublished
Period ofreview Producer or exporter
Margin(percent)
April 14, 200974 FR 17160
4/17/2006-8/31/2007
Shanghai Lian Li Paper Products Co., Ltd. 8.101
Hwa Fuh Plastics Co., Ltd./ Li Teng Plastics(Shenzhen)Co., Ltd. 20.702
Leo's Quality Products Co., Ltd./Denmax PlasticStationery Factory 20.702
The Watanabe Group (consisting of the followingcompanies) Watanabe Paper Product (Shenghai)Co., Ltd. Watanabe Paper Product (Linqing) Co., Ltd.Hotrock Stationery (Shenzhen) Co., Ltd. 20.702
December 3, 200974 FR 63387
9/1/2007-8/ 31/ 2008 PRC-wide Entity (which includes Watanabe) 258.21
April 26, 201176 FR 23288
9/1/2008-8/31/2009
PRC-Wide Rate (which includes the WatanabeGroup) 258.21
1 Amended final results pursuant to court decision, 76 FR 28213, May 16, 2011 and 76 FR 53116 August 25,2011. 2 Amended final results, 74 FR 68036, December 22, 2009 and 76 FR 76144, December 6, 2011.
Note.–An administrative review for the period September 1, 2010 through August 31, 2011 was initiated on October31, 2011. Initiation of Antidumping and Countervailing Duty Administrative Reviews and Request for Revocation inPart, 76 FR 67133.
Source: Cited Federal Register notices.
10 Commerce has not issued any duty absorption findings with respect to CLPSS from the subject countries.
11 For previously reviewed or investigated companies not included in an administrative review, the cash depositrate continues to be the company-specific rate published for the most recent period.
I-9

IndiaCommerce has completed four antidumping duty administrative reviews and one countervailing
duty administrative review with regard to subject imports of CLPSS from India. The results of theadministrative reviews are shown in tables I-3 and I-4.
Table I-3CLPSS: Administrative reviews of the antidumping duty order for India
Date resultspublished
Period ofreview Producer or exporter
Margin(percent)
April 14, 200974 FR 17149
4/17/2006-8/31/2007
Kejriwal Exports and Kejriwal Paper Limited 1.22Ria ImpEx Pvt. Ltd. 23.17Blue Bird India Ltd. 1.22Creative Divya 1.22Exel India Pvt. Ltd. 1.22FFI International 1.22Global Art India Inc. 1.22M/S Super ImpEx 1.22Magic International 1.22Marigold ExIm Pvt. Ltd. 1.22Marisa International 1.22Navneet Publications (India) Ltd. 1.22Pioneer Stationery Pvt. Ltd. 1.22Rajvansh International 1.22Riddhi Enterprises 1.22SAB International 1.22TKS Overseas 1.22Unlimited Accessories Worldwide 1.22V. Joshi Co. 1.22
Table continued on next page.
I-10

Table I-3--ContinuedCLPSS: Administrative reviews of the antidumping duty order for India
February 22, 201075 FR 7563
9/1/2007-8/31/2008
Navneet Publications (India) Ltd. 1.34Blue Bird 72.03Agility Logistics Pvt. Ltd. 1.34Ceal Shipping Logistics Pvt. Ltd. 1.34Cello International Pvt. Ltd. 1.34Corporate Stationary Pvt. Ltd 1.34Creative Divya 1.34Exel India Pvt. Ltd. 1.34FFI International 1.34Global Art India Inc. 1.34International Greetings Pvt. Ltd. 1.34Karim General Handmade Paper DIAR 1.34M/S Super ImpEx 1.34Magic International 1.34Marigold ExIm Pvt. Ltd. 1.34Marisa International 1.34Pentagon Waterlines Pvt. Ltd. 1.34Pioneer Stationery Pvt. Ltd. 1.34Rajvansh International 1.34Riddhi Enterprises 1.34SAB International 1.34TKS Overseas 1.34Unlimited Accessories Worldwide 1.34V. Joshi Co. 1.34Abhinav Paper Products Pvt. Ltd. 1.34American Scholar, Inc. and/or I-Scholar 1.34Ampoules & Vials Mfg. Co. Ltd 1.34Bafna Exports 1.34Cello International Pvt. Ltd. (M/S Cello PaperProducts) 1.34Corporate Stationary Pvt. Ltd 1.34Creative Divya 1.34D.D. International 1.34Exmart International Pvt. Ltd 1.34Fatechand Mahendrakumar 1.34FFI International 1.34Freight India Logistics Pvt. Ltd 1.34
Table continued on next page.
I-11

Table I-3--ContinuedCLPSS: Administrative reviews of the antidumping duty order for India
February 28, 201176 FR 10876
9/1/2008-8/31/2009
International Greetings Pvt. Ltd 1.34Lodha Offset Limited 1.34Magic International 1.34Marigold ExIm Pvt. Ltd 1.34Marisa International 1.34Paperwise Inc 1.34Pioneer Stationery Pvt. Ltd 1.34Premier Exports 1.34Riddhi Enterprises 1.34
SAB International 1.34Sar Transport Systems 1.34Seet Kamal International 1.34Solitaire Logistics Pvt. Ltd. (Eternity Int'l Freight,forwarder on behalf of Solitaire Logistics Pvt.Ltd.) 1.34Sonal Printers Pvt Ltd 1.34Swati Growth Funds Ltd 1.34V & M 1.34Yash Laminates 1.34Abhinav Paper Products Pvt. Ltd. 3.05American Scholar, Inc. and/or I-Scholar 3.05Ampoules & Vials Mfg. Co. Ltd 3.05AR Printing & Packaging (India) Pvt 3.05Bafna Exports 3.05Cello International Pvt. Ltd. (M/S Cello PaperProducts) 3.05Corporate Stationary Pvt. Ltd 3.05Creative Divya 3.05D.D. International 3.05Exel India (Pvt.) Ltd 3.05Exmart International Pvt. Ltd 3.05Fatechand Mahendrakumar 3.05FFI International 3.05Freight India Logistics Pvt. Ltd 3.05International Greetings Pvt. Ltd 3.05Kejriwal Paper Ltd., and Kejriwal Exports 3.05Lodha Offset Limited 3.05Magic International 3.05
Table continued on next page.
I-12

Table I-3--ContinuedCLPSS: Administrative reviews of the antidumping duty order for India
March 13, 201277 FR 14729
9/1/2009-8/31/2010
Marigold ExIm Pvt. Ltd 3.05Marisa International 3.05Paperwise Inc 3.05Pioneer Stationery Pvt. Ltd 3.05Premier Exports 3.05Rajvansh International 3.05SAB International 3.05Sar Transport Systems 3.05Seet Kamal International 3.05Super Impex 3.05Sonal Printers Pvt Ltd 3.05Swati Growth Funds Ltd 3.05V & M 3.05Yash Laminates 3.05
Note.–An administrative review for the period September 1, 2010 through August 31, 2011 was initiated on October31, 2011. Initiation of Antidumping and Countervailing Duty Administrative Reviews and Request for Revocation inPart, 76 FR 67133.
Source: Cited Federal Register notices.
Table I-4CLPSS: Administrative reviews of the countervailing duty order for India
Date resultspublished
Period ofreview Producer or exporter
Margin(percent)
February 10, 200974 FR 6573
2/13/2006-12/31/2006 Navneet Publication India Limited 8.76
Note.–An administrative review for the period January 1, 2010 through December 31, 2010 was initiated on October31, 2011. Initiation of Antidumping and Countervailing Duty Administrative Reviews and Request for Revocation inPart, 76 FR 67133.
Source: Cited Federal Register notice.
Changed Circumstances Review
Commerce conducted one changed circumstances antidumping administrative review with respectto CLPSS from China. On September 30, 2011, Commerce published its final results in the FederalRegister.12 The antidumping duty order was revoked, in part, with respect to FiveStar® Advance TMnotebooks and notebook organizers without polyvinyl chloride (“PVC”) coatings.
12 Certain Lined Paper Products From People's Republic of China: Final Results of Antidumping Duty ChangedCircumstances Review and Revocation, in Part, 76 FR 60803, September 30, 2011.
I-13

Results of Five-Year Reviews
Commerce has issued the final results of its expedited reviews with respect to all subjectcountries. Tables I-5 and I-6 present the countervailable subsidy rates and dumping margins calculatedby Commerce in its original investigations and the current reviews, respectively.
Table I-5CLPSS: Commerce’s original and first five-year countervailable subsidy rates forproducers/exporters, by subject country
Producer/exporterOriginal rate
(percent)First five-year review
rate (percent)
India1
Aero Exports 7.05 7.52
Navneet Publications 10.24 10.71
All others1 9.42 9.89
Indonesia
PT. Pabrik Kertas Tjiwi Kimia Tbk 40.55 40.55
All others 40.55 40.55
1 Kejriwal Exports, a division of Kejriwal Paper Limited was excluded from the order on the basis of de minimissubsidies during the period of investigation.
Source: Notice of Amended Final Determination of Sales at Less Than Fair Value: Certain Lined Paper Productsfrom the People's Republic of China; Notice of Antidumping Duty Orders: Certain Lined Paper Products from India,Indonesia and the People's Republic of China; and Notice of Countervailing Duty Orders: Certain Lined PaperProducts from India and Indonesia, 71 FR 56949, September 28, 2006; Certain Lined Paper Products FromIndonesia: Final Results of the Expedited Sunset Review of the Countervailing Duty Order, 76 FR 73592,November 29, 2011; Final Results of Expedited Sunset Review of Countervailing Duty Order: Certain Lined PaperProducts From India, 76 FR 76147, December 6, 2011.
I-14

Table I-6CLPSS: Commerce’s original and first five-year dumping margins for producers/exporters, bysubject country
Producer/exporterOriginal margin
(percent)First five-year review
margin (percent)
China
Shanghai Lian Li Paper Products Co., Ltd. 94.91 94.91
Watanabe Paper Product Co., Ltd. 76.70 Not listed separately
Hotrock Stationery Co., Ltd. 76.70 Not listed separately
Separate rate firms1 78.38 78.38
PRC Entity 258.21 258.212
India
Aero Exports 23.17 23.17
Kejriwal Paper Limited 3.91 3.91
Navneet Publications (India) Ltd. 23.17 23.17
All others 3.91 3.91
Indonesia
PT. Pabrik Kertas Tjiwi Kimia Tbk 118.63 118.63
All others 97.85 97.85
1 Commerce names 52 firms with the rate for the final determination, and 52 firms for the final results of theexpedited five-year review. Individual company names can be found in the relevant Federal Register noticespresented in appendix A.
2 Including Atico, Planet International, and Watanabe Paper Products.
Source: Notice of Amended Final Determination of Sales at Less Than Fair Value: Certain Lined Paper Productsfrom the People's Republic of China; Notice of Antidumping Duty Orders: Certain Lined Paper Products from India,Indonesia and the People's Republic of China; and Notice of Countervailing Duty Orders: Certain Lined PaperProducts from India and Indonesia, 71 FR 56949, September 28, 2006; Notice of Correction to Notice of AmendedFinal Determination of Sales at Less Than Fair Value: Certain Lined Paper Products from the People's Republic ofChina; Notice of Antidumping Duty Orders: Certain Lined Paper Products from India, Indonesia and the People'sRepublic of China; and Notice of Countervailing Duty Orders: Certain Lined Paper Products from India andIndonesia, 71 FR 62583, October 26, 2006; and Final Results of Expedited Sunset Review of Antidumping DutyOrders: Lined Paper Products From India, Indonesia, and the People’s Republic of China, 76 FR 76123,December 6, 2011.
I-15

THE SUBJECT MERCHANDISE
Commerce’s Scope
The imported product subject to the antidumping and countervailing duty orders under review, asdefined by Commerce,13 is as follows:
Certain lined paper products, typically school supplies,14 composed of or including paper thatincorporates straight horizontal and/or vertical lines on ten or more paper sheets,15 including butnot limited to such products as single- and multi-subject notebooks, composition books, wirelessnotebooks, looseleaf or glued filler paper, graph paper, and laboratory notebooks, and with thesmaller dimension of the paper measuring 6 inches to 15 inches (inclusive) and the largerdimension of the paper measuring 8-3/4 inches to 15 inches (inclusive). Page dimensions aremeasured size (not advertised, stated, or "tear-out" size), and are measured as they appear in theproduct (i.e., stitched and folded pages in a notebook are measured by the size of the page as itappears in the notebook page, not the size of the unfolded paper). However, for measurementpurposes, pages with tapered or rounded edges shall be measured at their longest and widestpoints. Subject lined paper products may be loose, packaged or bound using any binding method(other than case bound through the inclusion of binders board, a spine strip, and cover wrap). Subject merchandise may or may not contain any combination of a front cover, a rear cover,and/or backing of any composition, regardless of the inclusion of images or graphics on thecover, backing, or paper. Subject merchandise is within the scope of these orders whether or notthe lined paper and/or cover are hole punched, drilled, perforated, and/or reinforced. Subjectmerchandise may contain accessory or informational items including but not limited to pockets,tabs, dividers, closure devices, index cards, stencils, protractors, writing implements, referencematerials such as mathematical tables, or printed items such as sticker sheets or miniaturecalendars, if such items are physically incorporated, included with, or attached to the product,cover and/or backing thereto.
Specifically excluded from the scope of these orders are:
• Unlined copy machine paper;• Writing pads with a backing (including but not limited to products commonly known as
“tablets,” “note pads,” “legal pads,” and “quadrille pads”), provided that they do not have afront cover (whether permanent or removable). This exclusion does not apply to such writingpads if they consist of hole-punched or drilled filler paper;
• Three-ring or multiple-ring binders, or notebook organizers incorporating such a ring binderprovided that they do not include subject paper;
• Index cards;• Printed books and other books that are case bound through the inclusion of binders board, a
spine strip, and cover wrap;• Newspapers;• Pictures and photographs;
13 Final Results of Expedited Sunset Review of Antidumping Duty Orders: Lined Paper Products From India,Indonesia, and the People's Republic of China, 76 FR 76123, December 6, 2011.
14 For purposes of this scope definition, the actual use or labeling of these products as school supplies ornon-school supplies is not a defining characteristic.
15 There shall be no minimum page requirement for looseleaf filler paper.
I-16

• Desk and wall calendars and organizers (including but not limited to such products generallyknown as “office planners,” “time books,” and “appointment books”);
• Telephone logs;• Address books;• Columnar pads & tablets, with or without covers, primarily suited for the recording of written
numerical business data;• Lined business or office forms, including but not limited to: preprinted business forms, lined
invoice pads and paper, mailing and address labels, manifests, and shipping log books;• Lined continuous computer paper;• Boxed or packaged writing stationary (including but not limited to products commonly
known as “fine business paper,” “parchment paper,” and “letterhead”), whether or notcontaining a lined header or decorative lines;
• Stenographic pads (“steno pads”), Gregg ruled,16 measuring 6 inches by 9 inches;
Also excluded from the scope of these investigations are the following trademarked products:17
• Fly™ lined paper products: A notebook, notebook organizer, loose or glued note paper, withpapers that are printed with infrared reflective inks and readable only by a Fly™ pen-topcomputer. The product must bear the valid trademark Fly™.
• Zwipes™: A notebook or notebook organizer made with a blended polyolefin writingsurface as the cover and pocket surfaces of the notebook, suitable for writing using aspecially-developed permanent marker and erase system (known as a Zwipes™ pen). Thissystem allows the marker portion to mark the writing surface with a permanent ink. Theeraser portion of the marker dispenses a solvent capable of solubilizing the permanent inkallowing the ink to be removed. The product must bear the valid trademark Zwipes™.
• FiveStar® Advance™: A notebook or notebook organizer bound by a continuous spiral, orhelical, wire and with plastic front and rear covers made of a blended polyolefin plasticmaterial joined by 300 denier polyester, coated on the backside with PVC (poly vinylchloride) coating, and extending the entire length of the spiral or helical wire. The polyolefinplastic covers are of specific thickness; front cover is .019 inches (within normalmanufacturing tolerances) and rear cover is .028 inches (within normal manufacturingtolerances). Integral with the stitching that attaches the polyester spine covering, is capturedboth ends of a 1" wide elastic fabric band. This band is located 2-3/8" from the top of thefront plastic cover and provides pen or pencil storage. Both ends of the spiral wire are cut andthen bent backwards to overlap with the previous coil but specifically outside the coildiameter but inside the polyester covering. During construction, the polyester covering issewn to the front and rear covers face to face (outside to outside) so that when the book isclosed, the stitching is concealed from the outside. Both free ends (the ends not sewn to thecover and back) are stitched with a turned edge construction. The flexible polyester materialforms a covering over the spiral wire to protect it and provide a comfortable grip on theproduct. The product must bear the valid trademarks FiveStar®Advance™.
• FiveStar Flex™: A notebook, a notebook organizer, or binder with plastic polyolefin frontand rear covers joined by 300 denier polyester spine cover extending the entire length of thespine and bound by a 3-ring plastic fixture. The polyolefin plastic covers are of a specific
16 “Gregg ruling'” consists of a single- or double-margin vertical ruling line down the center of the page. For asix-inch by nine-inch stenographic pad, the ruling would be located approximately three inches from the left of thebook.
17 Products found to be bearing an invalidly licensed or used trademark are not excluded from the scope.
I-17

thickness; front cover is .019 inches (within normal manufacturing tolerances) and rear coveris .028 inches (within normal manufacturing tolerances). During construction, the polyestercovering is sewn to the front cover face to face (outside to outside) so that when the book isclosed, the stitching is concealed from the outside. During construction, the polyester coveris sewn to the back cover with the outside of the polyester spine cover to the inside backcover. Both free ends (the ends not sewn to the cover and back) are stitched with a turnededge construction. Each ring within the fixture is comprised of a flexible strap portion thatsnaps into a stationary post which forms a closed binding ring. The ring fixture is riveted withsix metal rivets and sewn to the back plastic cover and is specifically positioned on theoutside back cover. The product must bear the valid trademark FiveStar Flex™.
Tariff Treatment
CLPSS are classifiable in the Harmonized Tariff Schedule of the United States (“HTS”) undersubheadings 4810.22.50, 4811.90.90, 4820.10.20, and 4820.10.40, and are reported for statisticalpurposes under statistical reporting numbers 4810.22.5044, 4811.90.9050, 4820.10.2010, 4820.10.2020,4820.10.2030, 4820.10.2040, 4820.10.2060, and 4820.10.4000. Imports of CLPSS from China, India,and Indonesia currently enter under a general rate of duty of “free”.
In the original investigations, data on U.S. imports of the subject product were based on officialstatistics for two of the HTS subheadings: 4811.90.9090 (4811.90.9000 prior to July 1, 2005) and4820.10.2050. During these reviews, data on U.S. imports of the subject product are based on officialstatistics of the same two HTS subheadings and their replacements. Table 1-7 presents HTS numbersused in the original investigations and in these reviews.
Respondent parties argue that HTS subheading 4820.10.2060, which was created in July 2009 asan expanded statistical breakout, should not be included in tabulations of subject imports. They state thatgoods imported under this subheading are notebooks outside the dimensional requirements of CLPSS,and thus are not CLPSS.18 Because this HTS subheading was created in 2009 during the period ofreview, it is included in official statistics for 2009-11 to maintain data consistency across the period ofreview. Staff acknowledges however, that HTS subheading 4820.10.2060 contains out of scope productand tabulations that exclude this number throughout the report are expressly indicated.
18 Tjiwi Kimia’s prehearing breif, p. 20, and Indian producers’ prehearing brief, pp. 2-4.
I-18

Table I-7CLPSS: HTS excerpts and subheadings used for the final investigations and five-year reviews
HTS provision Article description Final Review
4811 Paper, paperboard, cellulose wadding and webs of cellulose fibers,coated, impregnated, covered, surface-colored, surface-decorated orprinted, in rolls or rectangular (including square) sheets, of any size,other than goods of the kind described in heading 4803, 4809, or4810:
4811.90 Other paper, paperboard, cellulose wadding and webs of cellulosefibers: In strips or rolls of a width exceeding 15 cm or in rectangular (including square) sheets with one side exceeding 36 cm and the other side exceeding 15 cm in the unfolded state:
4811.90.90 Other
4811.90.9010 Tissue papers having a basis weight not exceeding 29g/m2, in sheets
4811.90.9050 Other (1) CLPSS1
4811.90.9090 Other CLPSS2 CLPSS2
4820 Registers, account books, notebooks, order books, receipt books,letter pads, memorandum pads, diaries and similar articles, exercisebooks, blotting pads, binders (looseleaf or other), folders, file covers,manifold business forms, interleaved carbon sets and other articles ofstationery, of paper or paperboard; albums for samples or forcollections and books covers (including cover boards and bookjackets) of paper or paperboard:
4820.10 Registers, account books, notebooks, order books, receipt books,letter pads, memorandum pads, diaries and similar articles:
4820.10.20 Diaries, notebooks and address books, bound; memorandumpads, letter pads and similar articles
4820.10.2010 Diaries and address books
4820.10.2020 Memorandum pads, letter pads and similar articles OLPP OLPP
4820.10.2030 Sewn composition books with dimensions of 152.4-381mm (6"- 15"), inclusive (small side) X 222.5-381 mm(8.75"-15"), inclusive (large side) (3) CLPSS3
4820.10.2040 Other note books with dimensions of 152.4-381 mm (6" -15"), inclusive (small side) X 222.5-381 mm (8.75" -15"),inclusive (large side) (3) CLPSS3
4820.10.2050 Other CLPSS CLPSS4
4820.10.2060 Other (3) (3) (5)1 4811.90.9050 was in effect from January 1, 2009 until July 1, 2011.2 4811.90.9090 was established July 1, 2005 and discontinued January 1, 2009.3 Annotations 4820.10.2030, 4820.10.2040, and 4820.10.2060 went into effect July 1, 2009. Prior to July 1, 2009, these items
were included in annotation 4820.10.2050.4 4820.10.2050 was discontinued on July 1, 2009.5 Data for this subheading has been included as CLPSS in some tables to maintain data consistency across the period of
review. Tabulations that include this number throughout the report are expressly indicated.
Source: Harmonized Tariff Schedule of the United States (2006 and 2011).
I-19

THE PRODUCT
CLPSS is the product encompassed by Commerce’s scope definition. In the originalinvestigations, the Commission defined the domestic like product as LPP, which encompasses the scopeproduct, CLPSS, as well as OLPP. OLPP is defined as any lined paper or lined paper product with thesmaller dimension measuring less than 6 inches or larger than 15 inches, or with the larger dimensionmeasuring less than 8 3/4 inches or greater than 15 inches.
Physical Characteristics and Uses
CLPSS encompass a range of products, including, but not limited to, looseleaf filler paper,composition books, and notebooks. Commerce’s scope definition (above) provides information regardingthe physical characteristics of products included within the scope of theses reviews. Generally, subjectmerchandise comprises a group of paper products having “straight horizontal and/or vertical lines” and isbroadly inclusive of lined filler paper and many types of bound notebooks, but excludes certain specifictypes of products enumerated in the scope definition. Information provided in the original investigationsnoted that the primary use for CLPSS is to take notes, perform class assignments, and provide completedwork to teachers for correction and grades.19 The Petitioner in the original investigations noted thatCLPSS must conform to teacher and student expectations relating to size, the presence of margins, andhole punches for storage. The Petitioner contended that the sizes of products covered by the scope of thepetition are the most effective for the uses in which they are employed.20
Information from the original investigations noted further that the physical characteristics ofCLPSS include elements of privacy, protection, and convenience. Notebooks, for instance, includecovers that shield written work from others, as well as protect pages from wear during transport, whilelooseleaf paper (when placed in a binder21) performs a similar function. The Petitioner observed thatnotebooks may also contain enhancements such as dividers, pockets, and reference materials that promotetheir core classroom and educational use.22
The nature of the pulp process utilized to make the paper that, in turn, is used for CLPSS canaffect product characteristics such as strength and texture. Paper can be manufactured from virgin pulp,pulp made from agricultural residues, recovered paper pulp, or a combination of furnish types. Chemicaladditives and bleaching will also influence paper characteristics such as brightness or whiteness. Industrystandards for measuring brightness and/or whiteness vary and are not always comparable.23
19 See Commission Report, August 15, 2006, p. I-13 and Response to Commerce Request for PetitionClarification, September 26, 2005, p. 3.
20 Ibid.
21 As indicated in Commerce’s scope definition, binders are not included in the scope of the subject product,provided they do not include lined paper of the type included in the scope.
22 See Commission Report, August 15, 2006, p. I-13 and Response to Commerce Request for PetitionClarification, September 26, 2005, p. 3.
23 For example, to measure brightness, some companies use an ISO method; others reference a TAPPI standard.See Pulp & Paper Magazine: http://www.risiinfo.com/magazines/July/2006/PP/newspp20060904301.html.
I-20

Manufacturing Processes24
The domestic production of CLPSS begins with rolls of unlined paper, purchased by U.S.producers at arms length.25 Most of the paper used in the production of CLPSS has a basis weight of 56grams per square meter (15 pounds). The width of the rolls typically varies between 31 and 36 inchesdepending on the dimensions of the final product for which the paper is to be used. The most importantperformance specification is a smooth surface suitable for writing with either a pen or pencil.
Manufacturing entails three basic processes: ruling, binding, and wrapping/packing. Theseprocesses can be accomplished with highly automated “web-to-finish” machines that rule, bind, and wrapproducts in one continuous line of production, or with multiple machines for ruling and binding (andgreater labor input) in a “step and repeat” process. According to the U.S. industry producers, many out-of-scope lined paper products are produced in China by many of the same companies using the samemachinery and production processes.26 Machines that produce CLPSS such as filler paper can alsoproduce other lined paper products such as index cards.27 However, not all CLPSS use the sameproduction machinery. For example, producing composition books requires different machinery thanproducing spiral notebooks.28 Pin-bound notebooks (that are not sold in the United States) also usedifferent machinery for manufacturing (i.e., staple-pinning machines) than is used for other forms ofCLPSS.29
Ruling
Ruling is typically done in the same manner whether on separate ruling machines or web-to-finishmachines. Rolls of paper are mounted on a roll stand at the upstream end of the machine. The web ofpaper runs through a rotary flexographic press that has four cylinders. Two cylinders (one for red ink andone for blue) print the top of the paper, and two print the bottom of the paper. Given appropriate printingplates for their presses, ruling machines can be used to make products with any ruling pattern and of anydimension.30 31 Web-to-finish machines are generally dedicated to particular products but can beconfigured to make products with various dimensions and ruling patterns.
After printing, the paper passes under a rotary sheeter, which cuts the web perpendicular to thedirection of travel into large sheets depending on the dimensions of the finished product. The large sheetsare counted, stacked to the desired page count, and, if necessary, covers, backing material, dividers and/or
24 Information regarding the manufacturing process for CLPSS is based on the description provided in theoriginal investigations report (See Commission Report, August 15, 2006, pp. I-14-I-18) which was based on fieldvisits and information submitted by the Petitioners. There have been no significant changes in the manufacturingprocess for CLPSS since the time of the original investigations.
25 During the original investigations, an industry representative noted that there are no remaining verticallyintegrated producers of both paper and lined paper products in the United States. Conference transcript, p. 92(McLachlan).
26 ***.
27 Hearing transcript, p. 246 (Shor).
28 Hearing transcript, p. 66 (Robinson).
29 Hearing transcript, p. 164 (Sampat).
30 ***.
31 ***.
I-21

an inner liner are added to the stack. Perforations may also be made and holes may be punched,depending on the particular product being made. The compiled layers of large sheets are then eithercollected on a pallet at the end of the ruling machine to await further processing or moved to the bindingoperation in web-to-finish machines.
Binding
Binding equipment differs depending on the type of binding required (e.g., spiral binding,double-wire binding, glue tape binding, center-stitch binding, or stapling). Web-to-finish machines aretherefore configured to handle exclusively one particular type of binding. For wire-bound notebooks,compiled layers of large sheets resulting from the ruling process outlined above are cut into three rowsrepresenting the size of two notebooks each. These “two-on strips” are then punched with wire bindingand ring holes, and cut into two notebooks each. Each notebook is then automatically wired, and passedalong a conveyer for packing. The components of notebooks produced by web-to-finish machines mustbe of the same size and of a single consistency; the process does not allow for oversized covers or backs,or for pocketed dividers.
For spiral bound products made with the step and repeat process, pallets of large sheets aredelivered by forklift to an automatic programmable paper cutter (“APPC”) that makes a series of cuts thatreduce the large sheets into product-size pieces. The heart of an APPC is a large guillotine that is capableof cutting several layers at a time. The APPC also has various movable fences that corral the sheets asthey are being cut. Because the position of the fences for each cut is computer controlled, APPCs arecapable of cutting products of any dimension; cutting patterns can be changed at the touch of a button,with no set-up time in between. Once cut to the proper size, the notebooks are moved to a spiral bindingmachine. For single-subject notebooks, a binder operator may add a cover to each layer as it is fed intothe binder. The machine then punches small holes into the edges of the completed stack and twistsspiraled wire into the holes in a fraction of a second. For multi-subject notebooks, an operator addspockets to the bottom and middle sections of the notebook, and a cover to the top section. The bindermachine then hole-punches each section, assembles each section into a notebook, and finally twists a wirebinding on. Some binder machines are capable of both single- or twin-wire binding. The same machinescan be used to bind CLPSS and out-of-scope lined paper products.32
Composition books and exercise books that require stitch-binding are ***. Traditionalcomposition books begin with ***.33
Wrapping and Packing
Finished CLPSS is often wrapped in plastic before packing. Wrapping is an integral function ofweb-to-finish machines. For the step and repeat process, wrapping equipment is ***. Looseleaf paperrequires wrapping in lieu of binding. Printed top sheets are inserted onto finished paper stacks prior tocutting, and the requisite number of sheets are then passed through a plastic wrapper. Other products,such as notebooks, may be collected in multiples and also packaged in plastic wrap. Finished CLPSS,wrapped or otherwise, passes along a conveyer to an employee for hand-packing in a corrugated shippingbox. Corrugated boxes may be “display ready” to facilitate restocking on retailers’ shelves.
In the preliminary phase of the original investigations, counsel for Chinese respondents noted thatthe production process for CLPSS in China is different from that employed in the United States. According to counsel, the production process for CLPSS in China occurs on multiple single-function
32 ***.
33 ***.
I-22

machines, involving far greater use of manual labor than those employed by U.S. manufacturers.34 Preliminary phase record evidence indicated that CLPSS are produced in Indonesia using “automaticmachines,”35 whereas production in India ranged from “manual to fully automatic,” with the majority ofmanufacturers using a “semi-automatic” process.36
DOMESTIC LIKE PRODUCT ISSUES
In its original determinations, the Commission defined the domestic like product as to include alllined paper products regardless of dimension, encompassing LPP as well as outsized lined paperproducts.37 In its notice of institution in these current five-year reviews, the Commission solicitedcomments from interested parties regarding the appropriate domestic like product and domestic industry.38 In its response to the notice of institution, the AASPS indicated that it agrees with the domestic likeproduct definition used by the Commission in the original investigations;39 however, in its prehearingbrief, the AASPS stated that the Commission should exclude legal pads without covers from the domesticlike product definition in these reviews.40 At the hearing, the AASPS again modified its position, statingthat CLPSS should be classified as a separate like product.41 The AASPS contends that since the time ofthe original determinations, OLPP have become distinct products from CLPSS and should not be includedin the definition of the domestic like product.42 Both the Indian and Indonesian respondents agree that thedomestic like product should continue to be defined as LPP.43
U.S. MARKET PARTICIPANTS
U.S. Producers
During the original investigations, ten firms supplied the Commission with information on theirU.S. operations with respect to LPP. These firms accounted for virtually all known U.S. production ofLPP in 2005.44 In these current reviews, the Commission issued producers’ questionnaires to 12 firms,eight of which provided the Commission with information on their LPP operations. These firms arebelieved to account for virtually all known U.S. production of LPP in 2011. Presented in table I-8 is a list
34 Chinese respondents’ postconference brief, p. 34.
35 ***.
36 Indian respondents’ postconference brief, exh. 1.
37 Certain Lined Paper School Supplies from China, India, and Indonesia, Inv. Nos. 701-TA-442-443 and 731-TA-1095-1097 (Final), USITC Publication 3884 (September 2006), p. 11.
38 Certain Lined Paper School Supplies From China, India, and Indonesia-Institution of Five-Year ReviewsConcerning the Countervailing Duty Orders on Certain Lined Paper School Supplies From India and Indonesia andthe Antidumping Duty Orders on Certain Lined Paper School Supplies From China, India, and Indonesia, 76 FR45851, August 1, 2011.
39 AASPS’ response to the notice of institution, August 31, 2011, p. 24.
40 AASPS’ prehearing brief, p. 7 and exhibit 2.
41 Hearing transcript, p. 104 (Price).
42 AASPS’ posthearing brief, Exhibit 1, pp. 86-93.
43 Tjiwi Kimia’s prehearing brief, p. 14, and Indian producers’ prehearing brief, p. 4.
44 Eight of the ten firms that supplied the Commission with information in the final investigations have providedresponses in the current reviews. American Scholar was excluded from the domestic industry in the finalinvestigations under the related parties provision and ***. Attempts to contact U.S. producer *** wereundeliverable. ***.
I-23

of current domestic producers of LPP and each company’s position on continuation of the orders,production location(s), related and/or affiliated firms, and share of reported production of LPP in 2011.
As indicated in the table below, *** related to foreign producers of CLPSS and none are relatedto U.S. importers of the subject merchandise. In addition, as discussed in greater detail in Part III, fiveU.S. producers directly import the subject merchandise and three purchase the subject merchandise fromU.S. importers.
Table I-8LPP: U.S. producers, positions on the orders, U.S. production locations, and shares of 2011reported U.S. production
Firm
Position oncontinuation of
the orders U.S. production location(s)
Share of 2011production(percent)
Esselte1 *** Melville, NY ***
Kurtz Bros. *** Clearfield, PA ***
Mead2 *** Kettering, OH; Alexandria, PA; Sidney, NY ***
Norcom3 *** Griffin, GA ***
Pacon4 *** Appleton, WI ***
Roaring Spring *** Roaring Spring, PA ***
TOPS5 *** Downers Grove, IL ***
Top Flight *** Chattanooga, TN ***
1 ***. 2 ***. 3 ***. 4 ***. 5 ***.
Note.–Because of rounding, shares may not total to 100.0 percent.
Source: Compiled from data submitted in response to Commission questionnaires.
U.S. Importers
In the original investigations, 49 U.S. importing firms, nine of which were also U.S. producers, supplied the Commission with usable information on their operations involving the importation ofCLPSS, accounting for 39 percent of the value of total U.S. imports of CLPSS in 2005.
In these current reviews, the Commission issued importers’ questionnaires to 67 firms believed tobe importers of subject CLPSS, as well as to all U.S. producers of LPP. Usable questionnaire responseswere received from 25 companies, representing 29.7 percent of total subject imports from China, India,and Indonesia.45 Table I-9 lists all responding U.S. importers of LPP, their headquarter locations, andtheir shares of U.S. imports in 2011.
45 Coverage was calculated using the quantity of U.S. imports of CLPSS from China, India, and Indonesiareported by responding U.S. importers in 2011 – 13.251 million pieces, compared to the quantity from officialimport statistics – 44.575 million pieces (based on the five HTS subheadings, 4811.90.9050, 4811.90.9090,4820.10.2030, 4820.10.2040, and 4820.10.2050).
I-24

Table I-9LPP: U.S. importers, U.S. headquarters, and shares of reported imports in 2011
Firm Headquarters
Share of imports (percent)
CLPSSChina
CLPSSIndia
CLPSSIndonesia
TotalCLPSSSubject
OLPPChina,
India, andIndonesia
LPPAll OtherSources
Big Lots Stores Columbus, OH *** *** *** *** *** ***
Carolina Pad Charlotte, NC *** *** *** *** *** ***
CBI Distributing Hoffman Estates, IL *** *** *** *** *** ***
DaySpring Siloam Springs, AR *** *** *** *** *** ***
Dolgen Goodlettsville, TN *** *** *** *** *** ***
EducationalProducts Carrollton, TX *** *** *** *** *** ***
Greenbrier Chesapeake, VA *** *** *** *** *** ***
iScholar Lindenhurst, NY *** *** *** *** *** ***
Kittrich La Mirada, CA *** *** *** *** *** ***
Kurtz Bros. Clearfield, PA *** *** *** *** *** ***
Mead Kettering, OH *** *** *** *** *** ***
Michaels Irving, TX *** *** *** *** *** ***
Norcom Griffin, GA *** *** *** *** *** ***
NuCarta Stillwater, MN *** *** *** *** *** ***
Oriental Trading Omaha, NE *** *** *** *** *** ***
Sears Hoffman Estates, IL *** *** *** *** *** ***
Staples Framingham, MA *** *** *** *** *** ***
Target Minneapolis, MN *** *** *** *** *** ***
TOPS Downers Grove, IL *** *** *** *** *** ***
Top Flight Chattanooga, TN *** *** *** *** *** ***
Tri-CoastalDesign Wharton, NJ *** *** *** *** *** ***
UPD Grandview, MO *** *** *** *** *** ***
U.S. Toy Vernon, CA *** *** *** *** *** ***
Walgreen Deerfield, IL *** *** *** *** *** ***
Walmart Bentonville, AR *** *** *** *** *** ***
Total 100.0 100.0 none 100.0 100.0 100.0
Source: Compiled from data submitted in response to Commission questionnaires.
I-25

U.S. Purchasers
The Commission sent purchasers’ questionnaires to approximately 55 firms believed to havepurchased LPP during the period 2006-11. Twenty-six purchasers, two of which are U.S. producers ofLPP, and eight of which are importers of CLPSS, provided purchaser questionnaire responses, accounting for 35 percent of U.S. apparent consumption of LPP in 2011. Twenty of the respondingpurchasers reported that they were retailers, eight reported that they were distributors, and one reportedthat it was a wholesaler. The top three largest purchasers in 2011 were retailers ***.
APPARENT U.S. CONSUMPTION AND MARKET SHARES
Data concerning apparent U.S. consumption and market shares of LPP during the period forwhich data were collected in these reviews are shown in tables I-10 through I-13, and in figures I-1 and I-2. As previously discussed, imports contained under HTS subheading 4820.10.2060 include out ofscope product. Apparent consumption tables are presented using official import statistics both includingand without this HTS subheading.46
46 Staff notes that because HTS subheading 4820.10.2060 was created in July 2009 as an expanded statisticalbreakout, import data contained in tables I-10-11 and figure I-1 will be overstated across all years of the period. Import data contained in tables I-12-13 and figure I-2 will be overstated for years 2006 through 2009 (half-year).
I-26

Table I-10LPP: U.S. shipments of domestic product, U.S. imports, and apparent U.S. consumption, 2006-11
Item
Calendar year
2006 2007 2008 2009 2010 2011
Quantity (1,000 pieces)
U.S. producers’ U.S. shipments 310,747 276,940 284,470 256,208 271,675 281,308
U.S. CLPSS imports from– China 159,562 128,262 141,967 129,796 129,581 120,247
India 24,240 42,421 36,882 43,940 40,568 33,994
Indonesia 3,207 4,415 4,956 8,315 4,933 4,369
Subtotal, subject imports 187,009 175,097 183,804 182,052 175,083 158,610
All other sources 299,506 367,145 390,036 285,059 319,606 277,336
Subtotal, total CLPSS imports 486,515 542,243 573,840 467,111 494,688 435,947
U.S. OLPP imports (all sources) 338,716 399,065 355,426 363,371 440,408 396,623
Total imports 825,231 941,308 929,266 830,482 935,097 832,570
Apparent U.S. consumption 1,135,979 1,218,248 1,213,736 1,086,690 1,206,771 1,113,877
Value (1,000 dollars)
U.S. producers’ U.S. shipments 242,670 236,262 235,031 234,240 223,749 235,657
U.S. CLPSS imports from– China 109,795 112,295 123,715 98,172 118,835 111,941
India 10,659 24,680 19,401 23,370 21,970 17,774
Indonesia 1,034 1,560 1,651 2,628 2,169 1,672
Subtotal, subject imports 121,489 138,535 144,768 124,171 142,974 131,387
All other sources 200,642 248,189 272,694 209,458 219,582 195,959
Subtotal, total CLPSS imports 322,131 386,724 417,461 333,629 362,556 327,346
U.S. OLPP imports (all sources) 175,776 210,797 194,451 142,597 168,370 173,099
Total imports 497,907 597,520 611,912 476,226 530,926 500,446
Apparent U.S. consumption 740,577 833,782 846,942 710,466 754,675 736,103
Note.–Because of rounding, figures may not add to the totals shown. CLPSS import data are based on HTS subheadings4811.90.9050, 4811.90.9090, 4820.10.2030, 4820.10.2040, 4820.10.2050, and 4820.10.2060. OLPP import data are based onHTS subheading 4820.10.2020.
Source: Compiled from data submitted in response to Commission questionnaires and from official Commerce statistics.
I-27
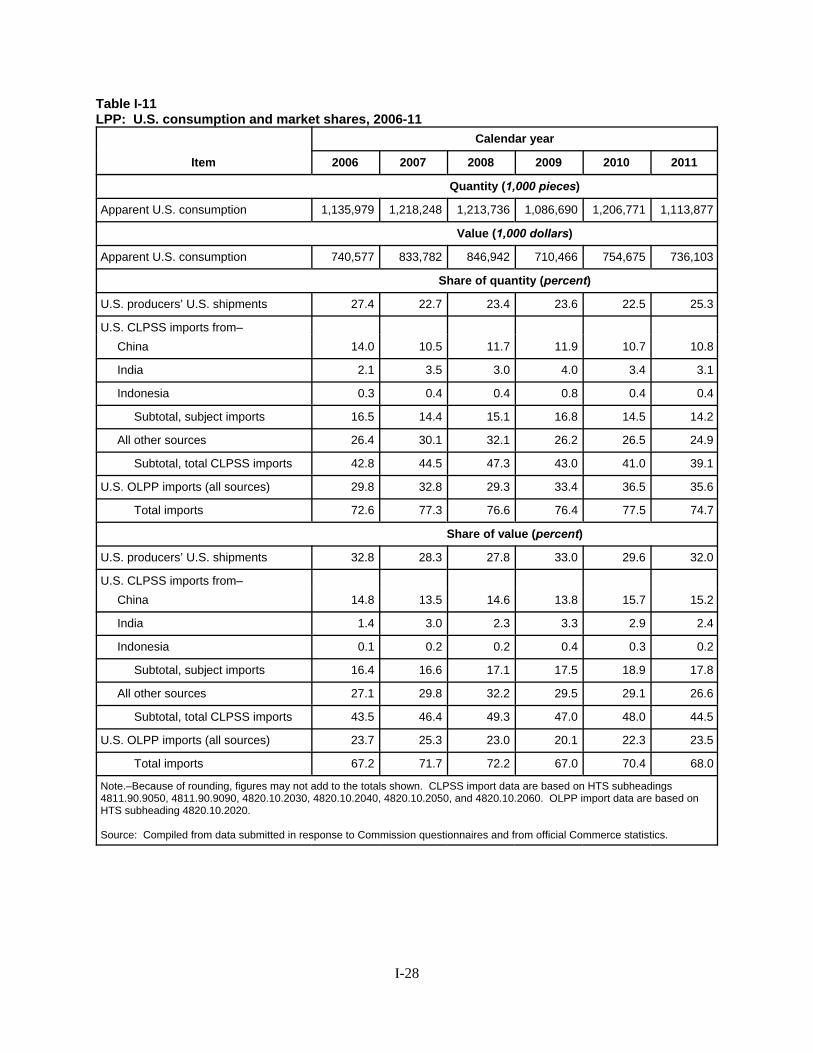
Table I-11LPP: U.S. consumption and market shares, 2006-11
Item
Calendar year
2006 2007 2008 2009 2010 2011
Quantity (1,000 pieces)
Apparent U.S. consumption 1,135,979 1,218,248 1,213,736 1,086,690 1,206,771 1,113,877
Value (1,000 dollars)
Apparent U.S. consumption 740,577 833,782 846,942 710,466 754,675 736,103
Share of quantity (percent)
U.S. producers’ U.S. shipments 27.4 22.7 23.4 23.6 22.5 25.3
U.S. CLPSS imports from– China 14.0 10.5 11.7 11.9 10.7 10.8
India 2.1 3.5 3.0 4.0 3.4 3.1
Indonesia 0.3 0.4 0.4 0.8 0.4 0.4
Subtotal, subject imports 16.5 14.4 15.1 16.8 14.5 14.2
All other sources 26.4 30.1 32.1 26.2 26.5 24.9
Subtotal, total CLPSS imports 42.8 44.5 47.3 43.0 41.0 39.1
U.S. OLPP imports (all sources) 29.8 32.8 29.3 33.4 36.5 35.6
Total imports 72.6 77.3 76.6 76.4 77.5 74.7
Share of value (percent)
U.S. producers’ U.S. shipments 32.8 28.3 27.8 33.0 29.6 32.0
U.S. CLPSS imports from– China 14.8 13.5 14.6 13.8 15.7 15.2
India 1.4 3.0 2.3 3.3 2.9 2.4
Indonesia 0.1 0.2 0.2 0.4 0.3 0.2
Subtotal, subject imports 16.4 16.6 17.1 17.5 18.9 17.8
All other sources 27.1 29.8 32.2 29.5 29.1 26.6
Subtotal, total CLPSS imports 43.5 46.4 49.3 47.0 48.0 44.5
U.S. OLPP imports (all sources) 23.7 25.3 23.0 20.1 22.3 23.5
Total imports 67.2 71.7 72.2 67.0 70.4 68.0
Note.–Because of rounding, figures may not add to the totals shown. CLPSS import data are based on HTS subheadings4811.90.9050, 4811.90.9090, 4820.10.2030, 4820.10.2040, 4820.10.2050, and 4820.10.2060. OLPP import data are based onHTS subheading 4820.10.2020.
Source: Compiled from data submitted in response to Commission questionnaires and from official Commerce statistics.
I-28

Figure I-1LPP: Apparent U.S. consumption, by sources, 2006-11
Source: Table I-10.
I-29

Table I-12LPP: U.S. shipments of domestic product, U.S. imports (excluding HTS subheading 4820.10.2060),and apparent U.S. consumption, 2006-11
Item
Calendar year
2006 2007 2008 2009 2010 2011
Quantity (1,000 pieces)
U.S. producers’ U.S. shipments 310,747 276,940 284,470 256,208 271,675 281,308
U.S. CLPSS imports from– China 159,562 128,262 141,967 82,688 24,023 17,457
India 24,240 42,421 36,882 38,393 32,779 25,521
Indonesia 3,207 4,415 4,956 5,481 2,173 1,597
Subtotal, subject imports 187,009 175,097 183,804 126,563 58,976 44,575
All other sources 299,506 367,145 390,036 235,121 174,382 173,842
Subtotal, total CLPSS imports 486,515 542,243 573,840 361,684 233,357 218,417
U.S. OLPP imports (all sources) 338,716 399,065 355,426 363,371 440,408 396,623
Total imports 825,231 941,308 929,266 725,055 673,766 615,040
Apparent U.S. consumption 1,135,979 1,218,248 1,213,736 981,263 945,441 896,348
Value (1,000 dollars)
U.S. producers’ U.S. shipments 242,670 236,262 235,031 234,240 223,749 235,657
U.S. CLPSS imports from– China 109,795 112,295 123,715 69,168 38,496 33,656
India 10,659 24,680 19,401 20,424 17,606 12,513
Indonesia 1,034 1,560 1,651 2,138 1,539 1,081
Subtotal, subject imports 121,489 138,535 144,768 91,730 57,641 47,250
All other sources 200,642 248,189 272,694 178,742 142,593 133,025
Subtotal, total CLPSS imports 322,131 386,724 417,461 270,473 200,234 180,274
U.S. OLPP imports (all sources) 175,776 210,797 194,451 142,597 168,370 173,099
Total imports 497,907 597,520 611,912 413,070 368,605 353,374
Apparent U.S. consumption 740,577 833,782 846,942 647,309 592,354 589,031
Note.–Because of rounding, figures may not add to the totals shown. CLPSS import data are based on HTS subheadings4811.90.9050, 4811.90.9090, 4820.10.2030, 4820.10.2040, and 4820.10.2050. OLPP import data are based on HTS subheading4820.10.2020. Import data prior to the HTS statistical subheading breakout of 4820.10.2050 in July 2009 are overstated.
Source: Compiled from data submitted in response to Commission questionnaires and from official Commerce statistics.
I-30

Table I-13LPP: U.S. consumption and market shares (excluding imports under HTS subheading4820.10.2060), 2006-11
Item
Calendar year
2006 2007 2008 2009 2010 2011
Quantity (1,000 pieces)
Apparent U.S. consumption 1,135,979 1,218,248 1,213,736 981,263 945,441 896,348
Value (1,000 dollars)
Apparent U.S. consumption 740,577 833,782 846,942 647,309 592,354 589,031
Share of quantity (percent)
U.S. producers’ U.S. shipments 27.4 22.7 23.4 26.1 28.7 31.4
U.S. CLPSS imports from– China 14.0 10.5 11.7 8.4 2.5 1.9
India 2.1 3.5 3.0 3.9 3.5 2.8
Indonesia 0.3 0.4 0.4 0.6 0.2 0.2
Subtotal, subject imports 16.5 14.4 15.1 12.9 6.2 5.0
All other sources 26.4 30.1 32.1 24.0 18.4 19.4
Subtotal, total CLPSS imports 42.8 44.5 47.3 36.9 24.7 24.4
U.S. OLPP imports (all sources) 29.8 32.8 29.3 37.0 46.6 44.2
Total imports 72.6 77.3 76.6 73.9 71.3 68.6
Share of value (percent)
U.S. producers’ U.S. shipments 32.8 28.3 27.8 36.2 37.8 40.0
U.S. CLPSS imports from– China 14.8 13.5 14.6 10.7 6.5 5.7
India 1.4 3.0 2.3 3.2 3.0 2.1
Indonesia 0.1 0.2 0.2 0.3 0.3 0.2
Subtotal, subject imports 16.4 16.6 17.1 14.2 9.7 8.0
All other sources 27.1 29.8 32.2 27.6 24.1 22.6
Subtotal, total CLPSS imports 43.5 46.4 49.3 41.8 33.8 30.6
U.S. OLPP imports (all sources) 23.7 25.3 23.0 22.0 28.4 29.4
Total imports 67.2 71.7 72.2 63.8 62.2 60.0
Note.–Because of rounding, figures may not add to the totals shown. CLPSS import data are based on HTS subheadings4811.90.9050, 4811.90.9090, 4820.10.2030, 4820.10.2040, and 4820.10.2050. OLPP import data are based on HTS subheading4820.10.2020. Import data prior to the HTS statistical subheading breakout of 4820.10.2050 in July 2009 are overstated.
Source: Compiled from data submitted in response to Commission questionnaires and from official Commerce statistics.
I-31

Figure I-2LPP: Apparent U.S. consumption (excluding imports under HTS subheading 4820.10.2060), bysources, 2006-11
Source: Table I-12.
I-32

II-1
PART II: CONDITIONS OF COMPETITION IN THE U.S. MARKET
U.S. MARKET CHARACTERISITCS
LPP is sold in three main forms: spiral-bound or wireless notebooks (with or without pockets and/or dividers); hole-punched filler paper; and composition books. The paper may be wide-ruled or college-ruled and is typically white in color, while notebook covers may be plain or consist of fashion graphics. The product is primarily used for note-taking and assignments by students in school, although it may also be used for business purposes.
Most sales of LPP are to retailers, including general merchandise superstores, office supply stores, and grocery chains and pharmacies. According to AASPS, sales of LPP have become more concentrated since the original investigations, with a few retailers purchasing the majority of LPP.1 2 Based on questionnaire responses, the five largest purchasers (***) accounted for *** percent of total purchases of LPP in 2011 (approximately *** percent of apparent consumption). Of the 26 responding purchasers, eight reported that at least some of their imported CLPSS was imported directly from foreign producers in China, India, and Indonesia, with four of the five largest purchasers reporting direct imports during the period of review. According to AASPS, these large retailers have buying offices overseas and deal directly with the factories in order to capture the lowest price.3
Demand for LPP tends to be highly seasonal, peaking in the second and third quarters as retailers stock up for back-to-school promotions. According to AASPS, purchasers of LPP often sell LPP at or below cost during back-to-school promotions. LPP is often used as a loss leader, which is a product that is considered a necessity and draws people into the store for other products that are discretionary and have a higher markup, such as back-to-school clothes.4
CHANNELS OF DISTRIBUTION
U.S. producers and importers sell LPP to distributors, retailers, and end users. As shown in table II-1, U.S. producers and importers of CLPSS from China shipped the majority of their product to retailers. However, importers of CLPSS from India and Indonesia sold their product primarily to end users during the period of review.5 Table II-1 LPP: Channels of distribution for commercial shipments of domestic LPP and subject imports of CLPSS sold in the U.S. market, by year and by source, 2006-111
* * * * * * *
1 Hearing transcript, p. 87 (Price). 2 There were three major acquisitions of significant purchasers of lined paper during the period of review. In
2008, Staples acquired Corporate Express, a large supplier of office products to businesses and institutions. Also in 2008, CVS acquired Longs Drug Stores, which operated 521 drug stores in the Western United States. In 2010, Walgreens’ purchased Duane Reade, a major drug store chain with 257 stores in the New York area. AASPS posthearing brief, p. 50.
3 Hearing transcript, pp. 129-130 (Robinson). 4 Hearing transcript, pp. 71 and 114-115 (Robinson and Kaplan). 5 The shift in channels of distribution of U.S. shipments from India between 2010 and 2011 is primarily the
result of two large importers. *** reported no U.S. shipments of CLPSS from subject countries for 2011, which decreased the reported U.S. shipments of CLPSS from India to end users. *** was the only firm to report U.S. shipments of CLPSS from India to distributors and significantly increased its imports of CLPSS from India over the period.

II-2
GEOGRAPHIC DISTRIBUTION
U.S. producers and importers, as a whole, reported nationwide sales. All six responding
producers reported selling to all regions within the contiguous United States, five of which also sold product to all “other” regions.6 Six of the seven responding importers of CLPSS from China reported selling CLPSS to all regions within the contiguous United States, and the remaining importer of CLPSS from China reported serving primarily the Southeast, Midwest, and Northeast regions. All four responding importers of CLPSS from India reported that they sold to all regions within the contiguous United States. The sole responding importer of CLPSS from Indonesia reported selling CLPSS to all regions within the contiguous United States.7
SUPPLY AND DEMAND CONSIDERATIONS
U.S. Supply
Domestic Production
Based on available information, U.S. producers have the ability to respond to changes in demand with large changes in the quantity of shipments of U.S.-produced LPP to the U.S. market. The main factors contributing to the large degree of responsiveness of supply are substantial unused capacity, large and increasing inventories, and production alternatives tempered by low export levels. Industry capacity
Capacity for U.S. producers of LPP increased from 547.9 million pieces in 2006 to 601.3 million pieces in 2011. Capacity utilization decreased from 55.7 percent in 2006 to 39.5 percent in 2009 before rising to 45.8 percent in 2010 and 55.0 percent in 2011. Alternative markets Exports of LPP decreased irregularly from *** percent of U.S. producers’ total shipments in 2006 to *** percent in 2011. *** responding producers reported that they have a limited ability to shift sales of LPP between the U.S. market and alternative country markets. *** reported that many countries have different product standards and use metric sizing which would require significant changes to its equipment in order to significantly increase its export opportunities. *** reported that they sell primarily in the U.S. market and have not established export channels of LPP. *** reported that subject imports are being dumped in other regions of the world which limits *** ability to export to those markets. Inventory levels U.S. producers’ inventories as a ratio of their total LPP shipments fluctuated during 2006-2011. U.S. producers’ inventories increased irregularly from *** percent in 2006 to *** percent in 2008, then fell to *** percent in 2009 and *** percent in 2010 before rising to *** percent in 2011.
6 “Other” includes all other markets not in the contiguous United States, such as Alaska, Hawaii, Puerto Rico, and the U.S. Virgin Islands.
7 Importers that reported purchasing CLPSS from different subject countries were counted separately for each country.

II-3
Production alternatives Three producers reported that they produce other products on the same equipment and machinery, such as phone message books, business notebooks, unlined pads and tablets, drawing paper, and construction paper.8 *** reported that it is able to switch a limited amount of production to these other products in response to relative price changes; however, because the machines are engineered to produce LPP, they are less efficient when producing other products. Supply constraints
U.S. producers, importers, and purchasers were asked if there have been any changes in factors affecting the supply of U.S.-produced LPP.9 Five of 6 responding producers indicated “yes.” Two producers cited the reduced supply of subject imports as the result of the antidumping and countervailing duty orders which they asserted had increased U.S. production of LPP.10 One producer cited increased fuel and transportation costs. One producer noted the increase in paper prices as well as a shift away from sales through traditional school distribution channels to consumer retail sales due to the reduction in school budgets. *** reported that it has invested in equipment to domestically manufacture composition books which has increased domestic capacity. *** also noted that it believes another U.S. producer has recently purchased a wire binding machine.
Seven of 18 importers and seven of 22 purchasers reported changes in factors that affect supply of U.S.-produced LPP. Four importers and three purchasers reported increased transportation costs (noting both ocean freight and inland transportation costs), increased raw material costs, increased labor costs, and fluctuating exchange rates. *** noted that there has been an increase in the availability of various raw material components. *** noted the Forest Stewardship Council (FSC) certification which certifies an environmental and corporate social responsibility standard.
When asked about anticipated changes in the availability of U.S.-produced LPP in the U.S. market, three of six responding producers reported that they anticipate that U.S. supply will remain unchanged. Two producers reported that they anticipate that U.S. supply will increase. *** reported that it is evaluating purchasing an additional CLPSS machine as long as the orders are not revoked. *** reported that it is currently engaged in capital improvement projects that will increase its production capacity of CLPSS, particularly reinforced filler paper; however, it noted that revocation of the orders would threaten these expansion projects.
Supply of Subject Imports The sensitivity of supply of CLPSS imports from China, India, and Indonesia to changes in price in the U.S. market depends upon such factors as the existence of excess capacity, the levels of inventories, and the existence of export markets. The Commission received no questionnaire responses from Chinese suppliers in these reviews. Relevant information for India and Indonesia follows.
8 All three producers reported that capacity and workers were allocated to LPP or other products based on sales. 9 Factors identified as affecting supply include changes in the availability or prices of energy or labor;
transportation conditions; production capacity and/or methods of production; technology; export markets; or alternative production opportunities that affected the availability of U.S.-produced lined paper products in the U.S. market since 2006.
10 U.S. production of LPP fell from 2006 to 2009 but rose in 2010 and 2011, resulting in an overall increase of 8.3 percent during the period of review.

II-4
Supply of subject imports from India
The Commission received eight usable questionnaire responses from Indian suppliers.11 Based on available information, Indian producers have the ability to respond to changes in demand with large changes in the quantity of shipments of CLPSS to the U.S. market. The main contributing factors to the large degree of responsiveness of supply are unused capacity and the existence of alternate markets, tempered by moderate levels of inventories. Industry capacity Capacity for reporting producers nearly doubled during the period increasing from 44.0 million pieces in 2006 to 85.1 million pieces in 2011. Capacity utilization increased irregularly from 69.8 percent in 2006 to 83.1 percent in 2011. Inventory levels Responding Indian producers’ inventories, relative to total shipments, increased irregularly from 10.6 percent in 2006 to 15.8 percent in 2011. Alternative markets Seven of the eight responding Indian producers reported that approximately half of their products were shipped primarily to the home market during the period (figure II-1). The eight responding Indian producers’ export shipments to the United States, as a share of total shipments of CLPSS, increased from 10.5 percent in 2006 to 26.8 percent in 2011. Figure II-1 CLPSS: Shares of total shipments of CLPSS by Indian producers, by destination, 2006-2011
* * * * * * * Supply of subject imports from Indonesia
The Commission received one questionnaire response from Indonesian producer Tjiwi Kimia.12 Based on available information, Tjiwi Kimia has the ability to respond to changes in demand with moderate changes in the quantity of shipments of CLPSS to the U.S. market.13 The main contributing factors to the moderate degree of responsiveness of supply are the existence of alternate markets and large inventories constrained by high levels of capacity utilization.
11 The eight responding producers accounted for approximately *** percent of Indian production of CLPSS in
2011. 12 Tijiwi Kimia accounted for approximately *** percent of Indonesian production of CLPSS in 2011. 13 Tjiwi Kimia contends that the supply responsiveness was overstated because reported inventory volumes
reflect product made for specific customer orders and cannot be shipped to the U.S. market because they are not produced to U.S. size standards. Tjiwi Kimia’s prehearing brief, p. 29. Staff has revised the supply responsiveness from “moderately high” to “moderate.”

II-5
Industry capacity Tjiwi Kimia’s reported capacity for CLPSS increased from *** million pieces in 2006 to *** million pieces in 2011.14 Capacity utilization increased from *** percent in 2006 to *** percent in 2011.15 Inventory levels Tjiwi Kimia’s inventories, as a share of total shipments, fell from *** percent in 2006 to *** percent in 2011.16 Alternative markets Tjiwi Kimia’s exports, as a share of total shipments, fell from *** percent in 2006 to *** percent in 2011. Tjiwi Kimia *** export shipments to the United States during the period of review (figure II-2). Figure II-2 CLPSS: Shares of total shipments of CLPSS by Indonesian producer Tjiwi Kimia, by destination, 2006-2011
* * * * * * * Supply constraints
When asked if there have been any changes in factors that affect the supply of subject product, two of eight Indian producers and the *** reported “yes.” Both Indian producers reported that labor and energy prices have increased. Indian producers reported raw material constraints, including agricultural waste material.17 Indian producers also reported a chronic shortage of paper in India, and stated that the Indian industry imports at least 30 percent of its paper requirements.18
The sole Indonesian producer, Tjiwi Kimia, reported that environmental concerns and FSC certification now required by major U.S. purchasers have severely limited demand for its products in the U.S. market.19 Mead also noted that major purchasers of LPP in Europe have established sustainable forestry requirements for all suppliers which has reduced shipments of CLPSS from subject countries, particularly Indonesia, to the EU.
All 16 responding importers and six of eight foreign producers reported that they anticipate the supply of subject imports from China, India, and Indonesia to remain unchanged. However, several firms
14 Tjiwi Kimia asserts that it has not increased its capacity to produce CLPSS since the order. It contends that
“changes from year-to-year in reported “units” of capacity and/or units of production do not necessarily reflect any real change in actual capacity of production volumes. It may simply reflect changes in product mix, i.e., the same volume of paper simply is cut to a different size or bound with a different number of sheets.” Tjiwi Kimia’s prehearing brief, p. 16 and p. 29.
15 Tjiwi Kimia does not have any plans to expand its LPP capacity in the near future. Hearing transcript, p. 269 (Shor).
16 Tjiwi Kimia contends that the CLPSS products currently in inventory are metric sized, and, therefore, not suitable for sale in the U.S. market. Tjiwi Kimia’s prehearing brief, p. 28.
17 India produces the great majority of its paper from recycled paper, straw, bagasse (sugarcane waste), and other agricultural waste products due to a lack of forest resources and by law. Indian producers’ posthearing brief, p. 19.
18 Indian producers’ posthearing brief, p. 18. 19 Hearing transcript, p. 218 (Gupta).

II-6
reported that if the orders were revoked, they would anticipate a “large” increase in the availability of subject imports in the U.S. market. One Indian producer reported that it anticipates the supply from India to decrease due to increasing prices in labor, electricity, and other raw material costs. Two foreign producers reported that the supply of CLPSS from India will remain unchanged because of the limited availability of raw materials and their limited conversion capacity.
Nonsubject Imports
Based on official Commerce statistics which overstate imports of CLPSS, U.S. imports of CLPSS from nonsubject countries accounted for 61.6 percent of the quantity of total U.S. imports in 2006, fluctuated within a narrow range during the intervening years, and accounted for 63.6 percent in 2011.
The majority of producers (four of six) and six of 17 responding importers reported that the availability of LPP imported from nonsubject countries has changed since 2006. Firms noted an increase in supply from Brazil, Egypt, Mexico, Taiwan, and, in particular, Vietnam. *** reported that Brazil and Vietnam have continued to invest in production equipment; however, Vietnam’s import prices are competitive with U.S. prices and Brazil is currently focused on its home market and its products are not competitively priced for sales in the U.S. market. *** also reported that U.S. imports from Vietnam, Brazil, Mexico, and Egypt have increased since 2006. New Suppliers
Seven of 23 responding purchasers indicated that new suppliers have entered the U.S. market since 2006. Purchasers cited Aclor (Mexico), Bazic (China), Bei Bang Stationary (Vietnam), Girl of All Work (U.S.), iScholar (India), Kejriwal Paper (India), Lodha (India), Super Impex (India), Roselle (U.S.), Unison (India), and Urman (India). *** reported that it has seen new suppliers from Egypt, Mexico, Taiwan, and Vietnam.
U.S. Demand
Based on available information, the overall demand for LPP is likely to experience moderately small changes in response to changes in price. The main contributing factor is the lack of close substitute products. Apparent U.S. Consumption Apparent U.S. consumption of LPP fluctuated during the period. According to the data in Table 1-12, apparent consumption increased from 1,136.0 million pieces in 2006 to 1,213.7 million pieces in 2008 then decreasing to 896.3 million pieces in 2011.

II-7
Business Cycles
The demand for LPP tends to be highly seasonal, peaking in the second and third quarters as retailers stock up for back-to-school promotions. The generally accepted back-to-school season runs for four to ten weeks, from mid-July through September. There is also a smaller peak in demand occurring in January for second semester sales. The vast majority of producers, and all responding importers and purchasers reported that the business cycles or conditions of competition have not changed since 2006. However, *** reported that conditions of competition have changed due to the reduction of imports from subject countries. Demand Characteristics
According to AASPS, “the market for CLPSS is mature and stable.”20 LPP is used primarily for note-taking and assignments by students in school, although it may also be used for business purposes. The limited availability of substitutes for LPP discussed below indicates that demand for this product is likely to be slightly price inelastic. The population of school-age children is a significant determiner of the demand for LPP.21 When asked how overall demand for LPP has changed within the United States since 2006, a plurality of producers reported that demand has fluctuated, and a plurality of importers, purchasers, and foreign producers reported that demand for LPP has remained unchanged since 2006 (table II-2). U.S. producers Mead and Top Flight stated that demand for LPP has not grown over the period, and they predict demand to remain stable over the next few years.22 Of those firms that reported a decrease in demand, an increased use of electronic devices for note taking was the primary factor identified. Reported factors that led to fluctuating demand include: the economy; retail competition; price of paper and other raw materials; and freight charges. When asked about anticipated changes in LPP demand in the United States, a plurality of producers indicated that they believed demand would fluctuate, and pluralities of other market participants indicated that they anticipated that demand for LPP will not change.
Table II-2 LPP: U.S. producer, importer, purchaser, and foreign producer responses regarding the demand for LPP in the United States
Item Number of firms reporting
Increase No Change Decrease Fluctuate Demand since 2006 U.S. producers 1 2 0 3 Importers 2 8 3 3 Purchasers 3 9 5 4 Foreign producers 1 5 2 1 Anticipated demand changes U.S. producers 1 2 0 3 Importers 2 8 3 3 Purchasers 2 9 4 3 Foreign producers 2 6 0 1
Source: Compiled from data submitted in response to Commission questionnaires.
20 AASPS posthearing brief, p. 52. 21 Hearing transcript, pp. 106 and 109 (McLachlan and Kaplan). 22 Hearing transcript, pp. 106-107 (McLachlan and Robinson).

II-8
Substitute Products While there are reported substitutes for LPP, the potential for substitution is limited. Nonetheless, *** cited alternative products including legal pads, unlined copy paper, journals, and stenopads.
SUBSTITUTABILITY ISSUES
The degree of substitution between domestically produced and imported LPP depends upon such factors as relative prices, quality (e.g., grade standards, reliability of supply, etc.), and conditions of sale (e.g., price discounts/rebates, lead times between order and delivery dates, payment terms, product services, etc.). Based on available data, staff believes that there may be some differences between domestic and imported LPP, but overall, there is a moderate to high degree of substitution between LPP produced in the United States and LPP from subject countries and other import sources.
Factors Affecting Purchasing Decisions
Purchasers were asked a variety of questions to determine what factors influence their decisions when buying LPP. Information obtained from their responses indicates that availability, lead times, quality, and price are important factors. Knowledge of Country Sources
Nineteen of 24 responding purchasers indicated they had marketing/pricing knowledge of domestic LPP, 9 of Chinese product, 8 of Indian, 3 of Indonesian, 9 of Vietnamese, and 7 of other nonsubject countries. As shown in table II-3, most purchasers (and their customers) “sometimes” or “never” make purchasing decisions based on producer or country of origin.
Table II-3 LPP: Purchaser responses to questions regarding the origin of their purchases
Purchaser/customer decision Always Usually Sometimes Never Purchaser makes decision based on producer 3 4 7 10 Purchaser's customer makes decision based on producer 0 2 8 11 Purchaser makes decision based on country 2 2 1 17 Purchaser's customer makes decision based on country 0 0 3 15 Source: Compiled from data submitted in response to Commission questionnaires.
Major Factors in Purchasing Available information indicates that purchasers consider a variety of factors as important in the purchasing decision for LPP. While price and quality were cited most frequently as being important factors, other factors such as availability are also important considerations. Price was most frequently cited as the first most important factor (12 firms), quality was the most frequently reported second most important factor (11), and reliability was the most frequently reported third most important factor (7) (table II-4).

II-9
Table II-4 LPP: Ranking factors used in purchasing decisions, as reported by U.S. purchasers
Factor Number of firms reporting
First Second Third Total Price 12 7 5 24 Quality 9 11 1 21
Availability 1 6 3 10 Reliability 1 1 7 9
Other1 2 1 9 12 1 Other factors include range of product line and country of origin for the first factor; production meets product specifications for the second factor; and country of origin, credit, shipping costs, brand, range of product line, delivery, demand, product meets minimum quality standards, and vendor’s performance history for the third factor. Source: Compiled from data submitted in response to Commission questionnaires.
More than half of purchasers (14 of 25) reported that they “always” or “usually” purchase the lowest-priced LPP, while 5 reported “sometimes” and 6 reported “never.” Fourteen purchasers also reported that they purchase higher-priced LPP from one source although a comparable product was available at a lower price from another source. Purchasers most frequently identified quality, on-time delivery, and availability as reasons for choosing higher-priced LPP. Other reasons included consistency, production capacity, terms of service, minimum order size, specialty items and non-seasonal purchases, transportation cost, support from suppliers, and country of origin.
Only one of 24 purchasers reported that certain grades/types/sizes of CLPSS were available from only one source. Purchaser *** reported that certain suppliers have licensed products that can be purchased only through them, regardless of the paper’s country of origin.
The majority of purchasers (18 of 21) reported that domestically produced LPP “always” or “usually” meets minimum quality specifications; the remaining three purchasers reported that they did not know the quality of domestic product. More than half of responding purchasers reported that they were unaware of the quality or specifications of LPP imported from subject countries. However, of those purchasers with knowledge of subject imports, the majority of purchasers reported that imported subject LPP “always” or “usually” meets minimum quality specifications for their uses. Three purchasers reported that nonsubject imports from Italy and Vietnam “always” or “usually” met minimum quality specifications.
Importance of Specified Purchase Factors Purchasers were asked to rate the importance of 21 factors when making their purchasing decisions (table II-5). The factors listed as “very important” by more than three-quarters of the responding 25 firms were quality meets industry standards (25); availability (24); reliability of supply (24); delivery time (23); price (23); product consistency (23); and delivery terms (18).

II-10
Table II-5 LPP: Importance of purchase factors, reported by U.S. purchasers
Factor Very important Somewhat important Not important
Number of firms responding Availability 24 1 0 Delivery terms 18 6 1 Delivery time 23 2 0 Discounts offered 14 7 4 Extension of credit 10 8 7 Marketing and merchandising support 6 9 8 Minimum quantity requirements 7 15 3 Packaging 13 11 1 Price 23 2 0 Product consistency 23 2 0 Quality meets industry standards 25 0 0 Quality exceeds industry standards 9 12 4 Paper brightness 15 9 0 Paper weight 17 7 0 Paper made of virgin fibers 3 14 7 Product range 5 15 5 Rebates 5 6 14 Reliability of supply 24 1 0 Return policy 6 8 11 Technical support/service 3 10 12 U.S. transportation costs 11 12 1 Source: Compiled from data submitted in response to Commission questionnaires.
Factors determining quality U.S. purchasers identified various principal factors they considered in determining the quality of LPP. Reported factors principally included brightness and paper weight, but also included packaging, consistency of lines, quality of wire binding, graphics, and smoothness of surface. Purchasers were asked to indicate how interchangeable certain paper specifications (paper brightness, weight, and fiber) are in their firms’ purchases of lined paper products. Purchasers’ knowledge and their perspective on the ability to interchange paper of varying brightness, weight, and fiber were mixed. A plurality of purchasers had no familiarity with the interchangeability of the listed paper specifications. Table II-6 indicates purchasers’ responses.

II-11
Table II-6 LPP: Interchangeability of low and high paper quality, reported by U.S. purchasers
Paper specification Always Frequently Sometimes Never No
familiarity Brightness: 75-85 TAPPI vs 86-95 TAPPI 1 3 5 7 9
Paper weight: less than 56 gsm vs more than 56 gsm 0 3 8 6 8
Material: virgin fibers vs non-virgin fibers 1 2 9 4 9
Source: Compiled from data submitted in response to Commission questionnaires. Supplier certification Ten of 25 purchasers reported that they require suppliers of LPP to become certified or pre-qualified for all of their purchases. One purchaser reported that it requires suppliers to become certified for some of its purchases, but did not indicate the share. Thirteen purchasers reported that they do not require suppliers to become certified or qualified. Ten purchasers provided information on the time necessary to qualify a supplier, ranging from one week to 6 months, with 6 purchasers reporting ranges from 7 to 30 days and 3 purchasers reporting ranges from 45 to 180 days.
When asked if any domestic or foreign suppliers had failed to obtain certification, three of 19 purchasers reported “yes.” ***, ***, and *** were listed as suppliers who had failed to become certified or qualified due to quality issues.
Environmental certification The importance of environmentally certified paper as a purchasing factor was disputed by parties. AASPS contends that environments/forest sustainability policies of most large retailers are hortatory rather than mandatory.23 *** reported that none of its customers require an environmental certification of the paper, and that it is aware of only Staples having a written environmental policy against procuring product made with paper produced by Asian Pulp & Paper.24 Both Mead and Top Flight stated that while they do use certified paper, they do not promote this feature and they receive no pricing premiums as a result of the environmental certification.25 *** stated that whenever possible, it purchases paper that has some sort of certification.26 AASPS asserts that while many major retailers have policies that encourage high environmental standards and social responsibility, these policies rarely require a particular environmental certification.27
However, Tjiwi Kimia reports that environmental and sustainability factors caused it to lose Staples, its largest U.S. customer in 2008, ***. ***. Tjiwi Kimia stated that not only has it lost other customers,28 it anticipates that ongoing environmental/sustainability issues will deter U.S. retailers from buying significant quantities of CLPSS from Indonesia for the foreseeable future.29 According to Indian respondents, most U.S. purchasers do not request an environmental certification for LPP produced in India because the product is made from recycled paper or non-wood pulp.30
23 AASPS posthearing brief, p. 21. 24 Hearing transcript, p. 81 (Robinson); AASPS posthearing brief, p. 21. 25 Hearing transcript, pp. 111-112 (Robinson and McLachlan). 26 Hearing transcript, p. 110 (Rahn). 27 AASPS posthearing brief, p. 21 and exhibit 7. 28 ***. Posthearing brief, p. Q-3. 29 Tjiwi Kimia posthearing brief, p. 1 and 6. 30 Hearing transcript, p. 217 (Sampat).

II-12
Lead times Of the six responding producers, 94.2 percent of their sales came from inventories in 2011, with lead times ranging from 6 to 10 days. The remaining 5.8 percent of producers’ sales were produced-to-order in 2011, with lead times ranging from 21 to 60 days. The majority of importers reported that the majority of their sales came from U.S. inventories, with 9 responding importers indicating that over 90 percent of their sales came from inventories. Importers reported lead times that ranged from 7 to 90 days for sales from U.S. inventories. Two importers reported that 100 percent of their sales were produced-to-order with lead times ranging from 105 to 120 days. All six responding Indian producers reported that all of their sales of CLPSS to U.S. customers were produced-to-order in 2011, with lead times ranging from 45 days to 120 days. Changes in purchasing patterns
Purchasers were asked to indicate how their purchasing patterns for LPP from different sources have changed since 2006. While purchase patterns for domestic and nonsubject product varied, the majority of purchasers reported that they had not purchased LPP produced from subject countries (table II-7). Reasons reported for changes in sourcing included duties, creating a strategic alignment with a particular producer, and licensed and fashion manufacturers moved to other countries. Table II-7 LPP: Changes in purchase patterns from U.S., subject, and nonsubject countries Source Decreased Increased Constant Fluctuated Did not purchase United States 3 8 6 4 0China 5 0 0 0 11
India 5 1 0 0 9Indonesia 1 1 0 0 13
Other 1 6 3 2 5
Source: Compiled from data submitted in response to Commission questionnaires.
Seventeen of 24 responding purchasers reported that they had changed suppliers since 2006. These purchasers identified a variety of considerations including competitive pricing, quality, credit terms, licenses, shipping costs, and reliability of supply. Additionally, two purchasers, ***, reported that they hold annual bids and their business is split between several suppliers.
Of the 24 purchasers, 10 purchased LPP weekly, 3 purchased monthly, 3 purchased quarterly, 2 purchased daily, 2 purchased annually, 1 purchased bi-weekly, 1 purchased twice a year, and 2 purchased on an as-needed basis. When asked if purchasers expected their purchasing pattern to change in the next two years, all 24 purchasers responded “no.” The majority of purchasers (16 of 22) contact at least three suppliers before making a purchase, with 7 of these purchasers contacting five or more suppliers. The remainder reported contacting between 1 and 2 suppliers. Seventeen of 24 purchasers reported negotiations between the supplier and the purchaser when purchasing LPP. The majority of purchasers reported that negotiations are based on price, quality, delivery time, product specifications, and quantity. Four of 23 responding purchasers reported that they vary their purchases from a given supplier within a specified time period based on the price offered for that period. Importance of purchasing domestic product
The majority of purchasers (22 of 25) reported that buying U.S. product is not an important factor in their firms’ purchases of LPP. One purchaser (***) reported that buying domestic product was

II-13
required by its customers. Purchaser *** reported that 50 percent of its purchases are of domestic product which it buys for “competitive reasons.” Purchaser *** reported that while buying domestic product is important to its customers, it does not purchase U.S. product at this time because it is not competitively priced.
Comparisons of Domestic Product, Subject Imports, and Nonsubject Imports
Purchasers were asked a number of questions comparing LPP produced in the United States, China, India, Indonesia, and nonsubject countries. First, purchasers were asked for a country-by-country comparison on the 21 factors for which they were asked to rate the importance of various purchasing factors (table II-8).
At least half of purchasers reported that U.S. product was superior to Chinese product in terms of delivery terms, delivery time, and marketing/merchandising support. Most responding purchasers identified U.S. product and Chinese product as comparable for all other characteristics except for price, for which the product from China was rated as superior. When comparing U.S. product to Indian and Indonesian product, most responding purchasers reported that U.S. product was comparable to product from India31 and Indonesia32 for all characteristics except for price, for which the product from India was rated as superior, and delivery time, for which U.S. product was rated as superior.
31 Purchaser responses indicated no clear majority rating when comparing delivery terms,
marketing/merchandising support, paper brightness, rebates, technical support, and U.S. transportation costs of U.S. product and product from India.
32 Purchaser responses indicated no clear majority rating when comparing delivery terms, discounts offered, marketing/merchandising support, price, and rebates of U.S. product and product from Indonesia.

II-14
Table II-8 LPP: Comparisons of product by source country, as reported by U.S. purchasers
Factor U.S. vs. China U.S. vs. India U.S. vs. Indonesia
S C I S C I S C I Availability 3 8 0 2 8 0 1 6 0 Delivery terms 6 5 0 5 5 0 3 3 0 Delivery time 8 3 0 7 3 0 4 2 0 Discounts offered 3 8 0 4 6 0 3 3 0 Extension of credit 3 8 0 3 6 1 3 4 0 Marketing/merchandising support 6 5 0 4 4 1 3 3 0 Minimum quantity requirements 5 6 1 4 6 1 3 4 0 Packaging 2 8 1 2 7 2 1 5 1 Price1 2 3 6 2 3 6 2 2 3 Product consistency 2 9 1 4 6 1 3 4 0 Quality meets industry standards 1 10 0 2 8 1 1 6 0 Quality exceeds industry standards 3 7 1 4 6 1 2 5 0 Paper brightness 2 9 0 4 5 1 2 5 0 Paper weight 2 9 0 2 7 1 1 6 0 Paper made of virgin fibers 2 8 0 2 6 1 1 5 0 Product range 1 9 1 1 7 2 1 5 1 Rebates 3 7 0 3 4 1 2 3 1 Reliability of supply 4 7 0 3 7 1 1 6 0 Return policy 5 6 0 4 6 1 3 4 0 Technical support/service 4 6 1 3 5 2 2 4 1 U.S. transportation costs1 4 7 0 4 5 1 3 4 0 Table continued on the following page.

II-15
Table II-8-Continued LPP: Comparisons of product by source country, as reported by U.S. purchasers
Factor China vs. India China vs. Indonesia
S C I S C I Availability 1 9 1 0 5 1 Delivery terms 2 7 1 1 5 0 Delivery time 2 7 1 1 5 0 Discounts offered 0 9 0 0 5 0 Extension of credit 0 9 0 0 5 0 Marketing/merchandising support 1 7 1 1 4 0 Minimum quantity requirements 0 10 0 0 6 0 Packaging 2 7 1 1 5 0 Price1 0 9 1 0 6 0 Product consistency 3 7 0 1 4 1 Quality meets industry standards 1 9 0 0 6 0 Quality exceeds industry standards 0 9 1 0 6 0 Paper brightness 4 6 0 1 4 1 Paper weight 1 9 0 0 5 1 Paper made of virgin fibers 1 9 1 0 6 0 Product range 2 8 0 2 5 0 Rebates 0 9 0 0 6 0 Reliability of supply 2 8 0 1 6 0 Return policy 0 9 0 0 6 0 Technical support/service 0 10 0 0 7 0 U.S. transportation costs1 1 8 1 0 6 1 Table continued on the following page.

II-16
Table II-8-Continued LPP: Comparisons of product by source country, as reported by U.S. purchasers
Factor India vs. Indonesia U.S. vs. nonsubject countries
S C I S C I Availability 0 7 0 4 6 0 Delivery terms 1 5 1 6 4 0 Delivery time 1 5 1 8 2 0 Discounts offered 0 6 0 4 6 0 Extension of credit 0 6 0 4 6 0 Marketing/merchandising support 1 5 0 4 4 1 Minimum quantity requirements 0 7 0 4 5 1 Packaging 0 6 1 1 9 0 Price1 0 7 0 2 5 3 Product consistency 0 5 2 1 9 0 Quality meets industry standards 0 5 2 0 10 0 Quality exceeds industry standards 0 5 2 1 9 0 Paper brightness 0 5 2 1 9 0 Paper weight 0 5 2 0 10 0 Paper made of virgin fibers 0 4 2 0 9 0 Product range 0 7 0 0 9 1 Rebates 0 6 0 3 6 0 Reliability of supply 0 6 1 2 8 0 Return policy 0 6 0 4 5 0 Technical support/service 0 6 1 3 7 0 U.S. transportation costs1 1 5 1 3 7 0 1 A rating of superior means that price/U.S. transportation cost is generally lower. For example, if a firm reported “U.S. superior”, it meant that the price of the U.S. product was generally lower than the price of the imported product. Note.--S=first listed country’s product is superior; C=both countries’ products are comparable; I=first listed country’s product is inferior. Source: Compiled from data submitted in response to Commission questionnaires.
When comparing subject product, most responding purchasers reported that Chinese product was comparable to product from India and Indonesia for all characteristics. Additionally, most responding purchasers identified product from India and Indonesia as comparable for all characteristics. When comparing U.S. product with product from nonsubject countries, at least half of the responding purchasers reported that U.S. product was superior to product from nonsubject countries in terms of delivery terms and delivery time. At least half of the responding purchasers identified U.S. product and product from nonsubject countries as comparable for all other characteristics.33
To determine whether U.S.-produced LPP can generally be used in the same applications as LPP from both subject and nonsubject countries, U.S. producers, importers, and purchasers were asked whether LPP can “always,” “frequently,” “sometimes,” or “never” be used interchangeably. Five of six responding U.S. producers reported that domestic and imported product from subject countries are “always” or “frequently” interchangeable. The majority of importers and purchasers reported that
33 Purchaser responses indicated no clear majority rating when comparing marketing/merchandising support.

II-17
domestic and imported product from subject countries are “always” or “frequently” interchangeable (table II-9).34
The majority of U.S. producers, importers, and purchasers reported that domestic and imported product from nonsubject subject countries are “always” or “frequently” interchangeable. In addition, the majority of firms generally reported a high frequency of interchangeability between subject country comparisons. Table II-9 LPP: Perceived interchangeability of products produced in the United States and in other countries, by country pairs
Country pair U.S. producers U.S. importers U.S. purchasers
A F S N A F S N A F S N U.S. vs. subject countries U.S. vs. China 3 2 0 1 10 4 1 0 8 3 2 0 U.S. vs. India 3 2 0 1 8 3 0 0 8 3 2 0 U.S. vs. Indonesia 3 2 0 1 6 2 0 0 8 1 2 0 U.S. vs. nonsubject countries U.S. vs. nonsubject 3 2 0 1 6 5 0 0 6 3 2 0 Subject country comparisons China vs. India 3 2 0 1 8 3 0 0 8 2 1 1 China vs. Indonesia 3 2 0 1 6 2 0 0 7 2 1 0 India vs. Indonesia 3 2 0 1 6 2 0 0 7 2 1 0 China vs. nonsubject 3 2 0 1 6 5 0 0 5 4 1 0 India vs. nonsubject 3 2 0 1 6 4 0 0 5 3 1 0 Indonesia vs. nonsubject 3 2 0 1 6 3 0 0 5 2 1 0 Note.--A = Always, F = Frequently, S = Sometimes, N = Never. Source: Compiled from data submitted in response to Commission questionnaires.
In addition, producers, importers, and purchasers were asked to assess how often differences
other than price were significant in sales of LPP from the United States, subject, or nonsubject countries (table II-10). Four of 6 responding U.S. producers reported that differences other than price were “sometimes” important for any subject country combination, and the remaining two producers reported that differences other than price were “never” important.
The majority of responding importers reported that differences other than price were “sometimes” or “never” a significant factor. However, responses from purchasers were varied, with nearly half of the responding purchasers reporting that differences other than price between U.S.-produced and imported LPP are “always” or “frequently” a significant factor. *** stated that there are no substitutes for some brands, such as Mead Five Star, which has a high market share and resonance with the customers. *** also noted that some licensed character products can only be obtained from the license holder.
When comparing the United States to nonsubject countries, all five responding producers and the majority of responding importers reported that differences other than price are “sometimes” or “never” a
34 The Indian respondents contend that LPP produced domestically is not interchangeable with product produced
in India. Because LPP produced in India is produced with paper made largely from agricultural waste pulp (non-wood pulp), the product is not smooth and white. The Indian respondents argue that these physical differences limit the interchangeability. Hearing transcript, p. 196 (Davis).

II-18
significant factor. Responses from purchasers were mixed, with more than half of the responding firms reporting that differences other than price are “sometimes” or “never” a significant factor.35 Table II-10 LPP: Perceived significance of differences other than price between products produced in the United States and in other countries, by country pairs
Country pair U.S. producers U.S. importers U.S. purchasers A F S N A F S N A F S N
U.S. vs. subject countries U.S. vs. China 0 0 4 2 2 1 6 5 4 2 5 3 U.S. vs. India 0 0 4 2 1 1 5 3 4 2 5 2 U.S. vs. Indonesia 0 0 4 2 1 1 3 2 4 2 4 2 U.S. vs. nonsubject countries U.S. vs. nonsubject 0 0 4 1 1 1 6 2 3 1 6 1 Subject country comparisons China vs. India 0 0 4 2 1 1 5 3 4 1 5 2 China vs. Indonesia 0 0 4 2 1 1 3 2 4 1 4 1 India vs. Indonesia 0 0 4 2 1 1 3 2 4 1 4 1 China vs. nonsubject 0 0 4 1 1 1 5 2 3 0 6 1 India vs. nonsubject 0 0 4 1 1 1 5 2 3 0 6 1 Indonesia vs. nonsubject 0 0 4 1 1 1 4 1 3 0 5 1 Note.--A = Always, F = Frequently, S = Sometimes, N = Never. Source: Compiled from data submitted in response to Commission questionnaires.
ELASTICITY ESTIMATES
This section discusses elasticity estimates; although parties were requested to comment on these estimates in their prehearing or posthearing brief, none commented.
U.S. Supply Elasticity36
The domestic supply elasticity for LPP measures the sensitivity of the quantity supplied by the U.S. producers to changes in the U.S. market price of LPP. The elasticity of domestic supply depends on several factors including the level of excess capacity, the existence of inventories, and the availability of alternate markets for U.S.-produced LPP. Previous analysis of these factors indicates that the U.S.
35 Only one purchaser (***) identified factors other than price which are always or frequently a significant factor
in the firm’s purchases of LPP. *** noted that purchasing domestic LPP has much lower freight cost than China, India, Indonesia, and Brazil. It stated that countries such as India do not have paper with a “bright white”, but LPP in Brazil is predominantly “high bright.” It reported that “countries such as Indonesia have factories that have been reported to be destroying forests.” It noted that countries such as Brazil have low availability of LPP during the Back-To-School periods. It also stated that the duties on CLPSS from China and India make it highly improbable to purchase products from those countries. Purchaser questionnaire response, section IV-3.
36 A supply function is not defined in the case of a non-competitive market.

II-19
industry has a substantial ability to increase or decrease shipments to the U.S. market based on unused capacity and production flexibilities. An estimate in the range of 4 to 6 is suggested.
U.S. Demand Elasticity
The U.S. demand elasticity for LPP measures the sensitivity of the overall quantity demanded to a change in the U.S. market price of LPP. This estimate depends on factors discussed earlier such as the existence, availability, and commercial viability of substitute products. Because of a lack of close, broadly accepted substitutes, it is likely that the aggregate demand for LPP is moderately inelastic, with values ranging between -0.5 to -1.5.
Substitution Elasticity
The elasticity of substitution depends upon the extent of product differentiation between the domestic product and subject imports. Product differentiation, in turn, depends upon such factors as quality and condition of sale (availability, delivery, etc.). Based on available information indicating that the domestic and imported products can frequently be used interchangeably, the elasticity of substitution between U.S.-produced LPP and CLPSS from subject countries is likely to be in the range of 3 to 5.


PART III: CONDITION OF THE U.S. INDUSTRY
OVERVIEW
Background
In the current reviews, the Commission issued U.S. producer questionnaires to 12 firms identifiedas possible producers of LPP in the United States. Eight firms provided the Commission with U.S.producer questionnaires.1 The list of these firms, each company’s position on continuation of the orders,headquarters location, related and/or affiliated forms, and share of reported production of LPP in 2011, ispresented in part I.2
Changes Experienced in Operations
U.S. LPP producers were asked to indicate whether their firms have experienced any plantopenings, closings, relocations, expansions, acquisitions, consolidations, closures, prolonged shutdownsor production curtailments, revised labor agreements, or any other change in the character of theiroperations or organization relating to the production of LPP since January 1, 2006. Table III-1summarizes important industry events that have taken place in the U.S. industry since 2006.
Table III-1LPP: Survey of industry events since 2006
Year CompanyDescription of event
(acquisition, bankruptcy, merger, shutdown)
2006Mead (formerlyMeadWestvaco)
Closed its Garden Grove, CA manufacturing plant.1 Workers were certified as eligible to receive assistanceunder the Trade Adjustment Assistance Act.2
2008 NorcomMoved its corporate headquarters and distribution facilityfrom Norcross, GA to Griffin, GA.3
2008 NorcomPurchased and installed a wirebound notebook productionline4 ***.
2006-08 *** ***.
2010 Esselte Acquired American Pad & Paper, LLC ("Ampad").5
2011 Esselte
Closed its Mattoon, IL plant.6 ***. Workers were certified aseligible to receive assistance under the Trade AdjustmentAssistance Act7
2011 NorcomAcquired and installed a composition book production line,8
***.
2011 PaconPurchased by Mason Wells, a Milwaukee, WI-based privateequity firm.9
Table continued on next page.
1 One firm, ***, certified that it has not produced LPP since 2006; one firm, ***, did not respond to theCommission’s questionnaire or staff follow-up; and two questionnaires sent to *** were returned as undeliverable.
2 ***.
III-1

Table III-1--ContinuedLPP: Survey of industry events since 2006
Year CompanyDescription of event
(acquisition, bankruptcy, merger, shutdown)
May 2012 Mead
MeadWestvaco’s Consumer & Office Products businesscompleted the spin-off and merger with ACCO BrandsCorporation.10
1 “Paper Products Maker Cuts in Garden Grove, “ Orange County Business Journal, December 4, 2006, p. 3. 2 U.S. Department of Labor, TAA Decision 61878, January 4, 2008, found athttp://www.doleta.gov/tradeact/taa/taadecisions/taadecision.cfm?taw=61878. 3 “Norcom Acquires Griffin Industrial Bldg. for $4M,” CoStar Group, September 18, 2008, found athttp://www.costar.com/News/Article/Norcom-Acquires-Griffin-Industrial-Bldg-for-$4M/105521, retrieved on May 7,2012. 4 Hearing transcript, p. 25 (Rahn). 5 “Esselte Acquires Ampad,” June 7, 2010, found athttp://www.pendaflex.com/enUS/PressRelease/Esselte_Acquires_Ampad.html, retrieved on May 7, 2012. 6 “Ampad to close Mattoon facility; 129 people to lose their jobs,” Herald-Review, December 3, 2010, found athttp://herald-review.com/business/local/article_cc2d3bf0-d398-50e8-be33-d77ae4cd8f75.html, retrieved on May 7,2012. 7 U.S. Department of Labor, TAA Decision 75080, March 9, 2011, found athttp://www.doleta.gov/tradeact/taa/taadecisions/taadecision.cfm?taw=75080. 8 Hearing transcript, p. 25 (Rahn). 9 “Milwaukee firm purchases Pacon Corporation,” October 31, 2011, found athttp://www.pacon.com/about/images/MasonWellspurchasesPaconPR.jpg, retrieved on May 7, 2012. 10 “MWV Completes Spin-Off and Merger of Consumer & Office Products Businesswith ACCO Brands Corporation,” May 1, 2012, found athttp://www.meadwestvaco.com/mwv/groups/content/@corp/@newsevts/documents/document/mwv037912.pdf,retrieved on May 7, 2012.
Note.–In addition, ***.
Source: Compiled from cited sources and questionnaire responses.
Anticipated Changes in Operations
The Commission asked whether domestic producers anticipate any changes in the character oftheir operations relating to the production of LPP in the future. Only one producer, ***, anticipateschanges in the future. It is ***. While *** indicated that is does not anticipate changes its futureoperations, it stated that it is ***. In addition, *** stated that it is ***.
U.S. CAPACITY, PRODUCTION, AND CAPACITY UTILIZATION
U.S. producers’ capacity, production, and capacity utilization data for LPP are presented in tableIII-2. Total reported capacity for LPP increased by 9.7 percent from 2006 to 2011, and total productionincreased by 8.3 percent during the same period. Three firms, ***, reported producing only CLPSS,while the remaining firms produced both CLPSS and OLPP.
While most producers have reported LPP capacity based on operating year round, CLPSSproduction is seasonal and produced for the back-to-school season, typically between January and May. According to the AASPS, full-year CLPSS capacity utilization is not necessarily possible, or expected.3
3 AASPS’ posthearing brief, Exhibit 1, p. 39.
III-2

Table III-2LPP: U.S. capacity, production, and capacity utilization, 2006-11
Item
Calendar year
2006 2007 2008 2009 2010 2011
Capacity (1,000 pieces) 547,915 540,808 555,892 561,910 569,482 601,280
Production (1,000 pieces) 305,048 290,428 279,511 222,102 260,753 330,475
Capacity utilization (percent) 55.7 53.7 50.3 39.5 45.8 55.0
Note.–*** reported capacity (production capability) based on operating 120 hours per week and 52 weeks per year. *** reported capacity (production capability) based on operating 40 hours per week and 40 weeks per year. ***reported capacity (production capability) based on operating 168 hours per week and 52 weeks per year. ***reported capacity (production capability) based on operating 120 hours per week and 49 weeks per year. ***reported capacity (production capability) based on operating 40 hours per week and 52 weeks per year. Source: Compiled from data submitted in response to Commission questionnaires.
The Commission asked domestic producers to report the constraints on their capacity to produceLPP. The primary constraint on production, as reported by four producers, is machine capacity. One firmstated that some individual machines are tooled to produce only a narrow band of products, and one firmmentioned that it would need to purchase additional binding/printing equipment to make covers. Otherconstraints mentioned by producers are the lack of skilled labor, strict union work rules, and theavailability of raw materials.
All firms reported that it is not feasible to switch production between LPP and other products. One firm, ***, reported that while it is technically possible, it is not practical because most of itsmachines are tooled to produce only a very narrow band of goods. While retooling is possible, it is asignificant cost and inefficient use of the machinery. *** stated that its lining and ruling equipment isfixed and will operate as needed to fill orders for lined papers, while other equipment such as sheeters andtrimmers are multi-use and can be adapted for other products within several hours.
Four firms reported producing or anticipate producing other products on the same equipment andmachinery as in the production of LPP and using the same production and related workers. In 2011,companies that produced other products on the same equipment as LPP reported an overall productioncapacity of 182.8 million pieces. The other products produced were drawing paper, unlined school andhome office paper, and construction paper.
U.S. PRODUCERS’ SHIPMENTS
Data on U.S. producers’ shipments of LPP are presented in table III-3. The quantity of U.S.producers’ U.S. shipments of LPP declined from 2006 to 2011, by 9.5 percent over the entire period, andthe value decreased by 2.9 percent.
III-3

Table III-3LPP: U.S. producers’ shipments, by types, 2006-11
Item
Calendar year
2006 2007 2008 2009 2010 2011
Quantity (1,000 pieces)
Commercial shipments *** *** *** *** *** ***
Internal consumption *** *** *** *** *** ***
U.S. shipments 310,747 276,940 284,470 256,208 271,675 281,308
Export shipments *** *** *** *** *** ***
Total shipments *** *** *** *** *** ***
Value (1,000 dollars)
Commercial shipments *** *** *** *** *** ***
Internal consumption *** *** *** *** *** ***
U.S. shipments 242,670 236,262 235,031 234,240 223,749 235,657
Export shipments *** *** *** *** *** ***
Total shipments *** *** *** *** *** ***
Unit value (per piece)
Commercial shipments *** *** *** *** *** ***
Internal consumption *** *** *** *** *** ***
U.S. shipments 0.78 0.85 0.83 0.91 0.82 0.84
Export shipments *** *** *** *** *** ***
Total shipments *** *** *** *** *** ***
Share of quantity (percent)
Commercial shipments *** *** *** *** *** ***
Internal consumption *** *** *** *** *** ***
U.S. shipments *** *** *** *** *** ***
Export shipments *** *** *** *** *** ***
Total shipments 100.0 100.0 100.0 100.0 100.0 100.0
Note.–Because of rounding, figures may not add to the totals shown.
Source: Compiled from data submitted in response to Commission questionnaires.
III-4

U.S. PRODUCERS’ INVENTORIES
Table III-4 presents end-of-period inventories for LPP.4 It shows that inventories fluctuated ineach year, but was up overall by *** percent from 2006 to 2011. The ratio of inventories to productionincreased by *** percentage points, while the ratio of inventories to total shipments increased by ***percentage points over the period. The LPP industry is highly seasonal and most of the product is sold forthe back-to-school season.5 U.S. producers hold smaller volumes of OLPP inventories than CLPSSinventories, which are needed to act as a buffer for capacity.6
Table III-4LPP: U.S. producers’ end-of-period inventories, 2006-11
* * * * * * *
U.S. PRODUCERS’ IMPORTS AND PURCHASES
U.S. producers’ imports and purchases of LPP are presented in tables III-5 through III-7. FiveU.S. producers, ***, reported that they imported CLPSS from subject sources, and three producers, ***,reported that they purchased imports of CLPSS from subject sources.
Table III-5CLPSS: U.S. producers’ imports and purchases, 2006-11
* * * * * * *
Table III-6OLPP: U.S. producers’ imports from subject countries, 2006-11
* * * * * * *Table III-7LPP: U.S. producers’ imports and purchases from nonsubject sources, 2006-11
* * * * * * *
U.S. EMPLOYMENT, WAGES, AND PRODUCTIVITY
Data provided by U.S. producers on the number of production and related workers (“PRWs”),involved in the production of LPP, the total hours worked by such workers, and wages paid to such PRWsduring the period for which data were collected in these reviews are presented in table III-8. Employmentfluctuated between 2006 and 2011; PRWs increased in that period by 5.2 percent and total hours workedincreased by 10.4 percent, while hourly wages and productivity decreased by 2.0 and 1.9 percentrespectively.
4 Data obtained from U.S. producers concerning inventories, production, and shipments do not reconcile; severalproducers provided various reasons on why their data do not reconcile.
5 Hearing transcript, pp. 119-120 (Price).
6 AASPS’ posthearing brief, Exhibit 1, pp. 43-44.
III-5

Table III-8LPP: U.S. producers’ employment-related data, 2006-11
Item
Calendar year
2006 2007 2008 2009 2010 2011
Production and related workers (PRWs) 498 506 500 485 519 524
Hours worked by PRWs (1,000 hours) 853 868 869 846 879 942
Hours worked per PRW 1,713 1,715 1,738 1,744 1,694 1,798
Wages paid to PRWs (1,000 dollars) 24,385 24,675 24,172 24,177 25,712 26,392
Hourly wages $28.59 $28.43 $27.82 $28.58 $29.25 $28.02
Productivity (pieces produced per hour) 357.6 334.6 321.6 262.5 296.6 350.8
Unit labor costs (per piece) $0.08 $0.08 $0.09 $0.11 $0.10 $0.08
Source: Compiled from data submitted in response to Commission questionnaires.
III-6

FINANCIAL EXPERIENCE OF THE U.S. PRODUCERS
Introduction
Seven firms provided financial results on their domestic operations producing LPP.7 These firmsare believed to account for the vast majority of the domestic production volume of LPP during 2011. ***reported a small amount of affiliated party transactions, accounting for less than *** percent of total sales(quantity and value) from 2006 through 2011. Accordingly, these data are not presented separately. Financial data on CLPSS and OLPP are presented in appendix C.
On May 1, 2012, MeadWestvaco completed the spinoff of its consumer office products division(which includes LPP) to ACCO Brands. In November 2011, MeadWestvaco agreed to this transaction ina deal valued at $860 million. This new subsidiary of ACCO Brands is called Mead Products, LLC.8
Operations on LPP
Income-and-loss data for U.S. producers on their operations on LPP are presented in table III-9. Selected financial data, by firm, are presented in table III-10. The domestic industry experienced anoverall increase in operating income from 2006-09, followed by moderate declines in 2010 and 2011 thatreturned the industry to a level of operating income similar to the level achieved in 2008. Net salesquantities declined irregularly from 2006-09 by 17.8 percent, then consistently increased by 10.3 percentfrom 2009-11. In contrast, net sales values continually declined by 8.3 percent from 2006-10, thenincreased by 5.4 percent from 2010-11. These fluctuations in overall net sales quantity and value resultedin generally increasing per-unit values from 2006-09, followed by a decline in 2010 and a modestincrease in 2011.
Per-unit operating income improved from 2006-09 as the changes in per-unit net sales valueincreasingly offset the more moderate changes in per-unit operating expenses (cost of goods sold(“COGS”) and selling, general, and administrative (“SG&A”) expenses, combined). In 2010, per-unitrevenue declined more than per-unit operating expenses, while in 2011 per-unit revenue increased lessthan per-unit operating expenses. Thus, in the last two years of the period for which data were collected,per-unit operating income declined. 9 10
7 The U.S. producers and their fiscal year ends if other than December 31 are: ***.
8 “MeadWestvaco closes on spinoff of unit to Acco,” May 1, 2012, found athttp://www.cbsnews.com/8301-505245_162-57425405/meadwestvaco-closes-on-spinoff-of-unit-to-acco, retrievedon May 3, 2012. See also Mead’s U.S. producers’ questionnaire, question II-2.
9 Per-unit data should be used with caution due to differences in per-unit measures (e.g., per notebook, perpackage) and product mix. Due to the variability of product mix during the period examined, a variance analysis isnot presented in this report.
10 The reported financial data for CLPSS and OLPP reveal relatively higher operating income margins for CLPSSduring the first half of the period examined, followed by relatively higher operating income margins for OLPPduring the second half of the period examined. Operating income margins for CLPSS were *** (2006), *** (2007),*** (2008), *** (2009), *** (2010), and *** (2011). In contrast, operating income margins for OLPP were *** (2006), *** (2007), *** (2008), *** (2009), *** (2010), and *** (2011). Net sales quantities of CLPSS declinedby *** percent from 2006-09, then increased by *** percent from 2009-11. Net sales quantities of OLPP declinedby *** percent from 2006-09 and continued to decline by *** percent from 2009-11. See also appendix C.
III-7

Table III-9LPP: Results of operations of U.S. producers, 2006-11
ItemFiscal year
2006 2007 2008 2009 2010 2011Quantity (1,000 pieces)
Total net sales 320,883 287,499 294,387 263,608 279,577 290,696Value ($1,000)
Total net sales 251,668 245,824 244,344 240,215 230,800 243,276COGS 191,350 189,892 182,644 170,775 162,736 179,048Gross profit 60,318 55,932 61,700 69,440 68,064 64,228SG&A expenses 25,992 24,141 23,662 25,298 25,016 26,842Operating income 34,326 31,791 38,038 44,142 43,048 37,386Interest expense 6,027 7,047 5,005 4,377 3,661 3,880CDSOA income 0 61 2,527 405 263 761Other income/(expense) 427 432 219 166 552 1,099Net income 28,726 25,237 35,779 40,336 40,202 35,366Depreciation 6,783 4,769 4,169 4,019 3,691 3,669Cash flow 35,509 30,006 39,948 44,355 43,893 39,035
Ratio to net sales (percent) COGS: Raw materials 53.0 56.0 54.8 51.2 51.6 54.9 Direct labor 6.1 6.4 6.2 6.2 6.1 6.2 Other factory costs 17.0 14.9 13.7 13.8 12.8 12.4 Total COGS 76.0 77.2 74.7 71.1 70.5 73.6Gross profit 24.0 22.8 25.3 28.9 29.5 26.4SG&A expenses 10.3 9.8 9.7 10.5 10.8 11.0Operating income 13.6 12.9 15.6 18.4 18.7 15.4Net income 11.4 10.3 14.6 16.8 17.4 14.5
Value (per piece)1
Total net sales $0.78 $0.86 $0.83 $0.91 $0.83 $0.84 COGS: Raw materials 0.42 0.48 0.46 0.47 0.43 0.46 Direct labor 0.05 0.05 0.05 0.06 0.05 0.05 Other factory costs 0.13 0.13 0.11 0.13 0.11 0.10 Total COGS 0.60 0.66 0.62 0.65 0.58 0.62Gross profit 0.19 0.19 0.21 0.26 0.24 0.22SG&A expenses 0.08 0.08 0.08 0.10 0.09 0.09Operating income 0.11 0.11 0.13 0.17 0.15 0.13Net income 0.09 0.09 0.12 0.15 0.14 0.12
Number of firms reportingOperating losses 1 0 0 0 1 0Data 6 6 6 6 7 7 1 Per-unit data should be used with caution due to differences in per-unit measures (e.g., per notebook, per package) andproduct mix.
Source: Compiled from data submitted in response to Commission questionnaires.
III-8

Table III-10LPP: Results of operations of U.S. producers, by firm, 2006-11
* * * * * * *
An analysis of the data as a percentage of net sales value reveals somewhat different trends in thedata. In absolute terms, COGS declined more than net sales value from 2006-10; therefore, as a ratio tonet sales, COGS declined, which led to increased gross profit and operating income as a percentage ofsales during this time. The gross profit margin and operating income margin both declined from 2010-11as the absolute increase in COGS was greater than the absolute increase in net sales value. SG&Aexpenses as a percentage of net sales were relatively stable during the period for which data werecollected. While the gross profit margin and operating income margin had similar trends, SG&Aexpenses moderated the change in the operating income margin (as compared to the gross profit margin)in some periods.
Capital Expenditures and Research and Development Expenses
The responding firms’ aggregate data on capital expenditures are shown in table III-11. Aggregate capital expenditures *** from 2006-08, *** in 2009, then *** in 2010 and 2011. ***accounted for the majority of reported capital expenditures during the period examined.11 In total, sixfirms reported capital expenditure data. No firms reported R&D expenses. Table III-11LPP: Capital expenditures and research and development expenses of U.S. producers, 2006-11
* * * * * * *
Assets and Return on Investment
Data on the U.S. LPP producers’ total assets and their ROI are presented in table III-12. The totalassets utilized in the production, warehousing, and sale of LPP declined from $125.6 million in 2006 to$99.5 million in 2011.12 From 2006 to 2010, the ROI continuously increased from 27.3 percent to 43.0percent, then declined somewhat to 37.6 percent in 2011.
11 ***. See also table III-1.
12 ***. E-mail correspondence from *** , June 20, 2012, and Domestic Interested Parties’ posthearing brief, exh.1, pp. 45-47. In their posthearing brief, the Domestic Interested Parties asserted that the high ROI for the period ofreview is due in part to the relatively lower receivables and inventories that occur in the fourth calendar quarter for ahighly seasonal business, and that total assets at the end of the second calendar quarter may be *** percent higherthan year-end assets as reported to the Commission. Ibid.
III-9

Table III-12LPP: Value of assets and return on investment of U.S. producers, 2006-11
ItemFiscal year
2006 2007 2008 2009 2010 2011Value of assets: Value ($1,000)Total assets 125,573 114,355 106,408 105,193 100,112 99,530
Operating income or (loss) 34,326 31,791 38,038 44,142 43,048 37,386Share (percent)
Return on investment 27.3 27.8 35.7 42.0 43.0 37.6Source: Compiled from data submitted in response to Commission questionnaires.
III-10

PART IV: U.S. IMPORTS AND THE FOREIGN INDUSTRY
U.S. IMPORTS
Overview
The Commission issued questionnaires to 67 firms believed to have imported CLPSS between2006 and 2011 as well as to all U.S. producers of LPP.1 Twenty-five firms provided data and informationin response to the questionnaires, while seven firms indicated that they had not imported CLPSS duringthe period for which data were collected.2 Firms responding to the Commission’s questionnaireaccounted for 29.7 percent of subject imports during 2011.3 Firms responding to the Commission’squestionnaire accounted for the following shares of individual subject country subject imports during thereview period: 2.8 percent of the subject imports from China during 2011;4 50.0 percent of the subjectimports from India during 2011; 5 and 0.0 percent of the subject imports from Indonesia during 2011.6
U.S. import data are based on official Commerce import statistics of CLPSS. As discussed in partI, import data for CLPSS are based on HTS statistical reporting numbers 4811.90.9050 (reported inkilograms), 4811.90.9090 (reported in kilograms), 4820.10.2030 (reported in pieces), 4820.10.2040(reported in pieces), 4820.10.2050 (reported in pieces), and 4820.10.2060 (reported in pieces).7 Importdata for OLPP are based on HTS statistical reporting number 4820.10.2020 (reported in pieces).
HTS subheading 4811.90.9090 changed to 4811.90.9050 in January 2009; and 4820.10.2050changed to 4820.10.2030, 4820.10.2040, and 4820.10.2060 in July 2009. Because 4820.10.2060 containsout of scope product, import tables that exclude this number are also presented.
1 Confidential Customs data indicates that CLPSS imported under all HTS subheadings identified in Commerce’sscope from subject sources were imported by over *** firms from 2006 to 2011. Importer questionnaires wereissued to all firms that imported more than *** percent of total imports of CLPSS from China, *** percent fromIndia, and *** percent from Indonesia from 2006 to 2011.
2 Questionnaire responses were received from the *** largest importers from China, *** of the largest tenimporters from India, and *** of the largest ten importers from Indonesia.
3 Coverage was calculated using the quantity of U.S. imports of CLPSS from China, India, and Indonesia reportedby responding U.S. importers in 2011 – 13.251 million pieces, compared to the quantity from official importstatistics – 44.575 million pieces (based on the five HTS subheadings, 4811.90.9050, 4811.90.9090, 4820.10.2030,4820.10.2040, and 4820.10.2050).
4 Coverage was calculated using the quantity of U.S. imports of CLPSS from China by responding U.S. importers– 496,000 pieces, compared to the quantity from official import statistics – 17.457 million pieces (based on the fiveHTS subheadings, 4811.90.9050, 4811.90.9090, 4820.10.2030, 4820.10.2040, and 4820.10.2050).
5 Coverage was calculated using the quantity of U.S. imports of CLPSS from India by responding U.S. importers– 12.754 million pieces, compared to the quantity from official import statistics – 25.521 million pieces (based on thefive HTS subheadings, 4811.90.9050, 4811.90.9090, 4820.10.2030, 4820.10.2040, and 4820.10.2050).
6 While the Commission received questionnaires from *** firms that were identified by Customs data asimporters of CLPSS from Indonesia in 2006-11, these firms reported their imports as OLPP, or did not import in2011. ***, the largest importer of CLPSS from Indonesia, reported importing ***.
7 Kilograms are converted to pieces using the conversion factor used in the final investigations. It reflects theper-unit weight of the most common imported looseleaf filler paper package (150-count, at 0.491262 kg). TjiwiKimia argues that this conversion factor is no longer appropriate for Indonesia after the order, exports in subheading4811.90.90 are all non-CLPSS products that vary widely without a single appropriate conversion factor. TjiwiKimia’s prehearing brief, p. 21. The Indian producers also note that imposing a single conversion factor over theperiod is problematic because the conversion factor varies over time with the overall product mix. Indian Producers’prehearing brief, p. 9.
IV-1

Imports from Subject and Nonsubject Countries
Tables IV-1 presents data for U.S. imports of CLPSS from China, India, Indonesia and all othersources, based on six HTS subheadings, and table IV-2 presents data for U.S. imports of CLPSS fromChina, India, Indonesia and all other sources, based on five HTS subheadings.8 9 Imports of CLPSS fromChina decreased from 2006 to 2011, by 24.6 percent, while imports from India increased by 40.2 percent,and imports from Indonesia increased by 36.2 percent. China was the largest source of imports in 2011,representing 34.2 percent of the value of total imports.
Table IV-3 presents data for U.S. imports of CLPSS from nonsubject sources. Vietnam was thesecond largest source of all CLPSS imports and the leading source of nonsubject imports, representing22.3 percent of the value of total imports in 2011.
Table IV-1CLPSS: U.S. imports, by source, 2006-11
Source
Calendar year
2006 2007 2008 2009 2010 2011
Quantity (1,000 pieces)
China 159,562 128,262 141,967 129,796 129,581 120,247
India 24,240 42,421 36,882 43,940 40,568 33,994
Indonesia 3,207 4,415 4,956 8,315 4,933 4,369
Subtotal 187,009 175,097 183,804 182,052 175,083 158,610
Other sources 299,506 367,145 390,036 285,059 319,606 277,336
Total 486,515 542,243 573,840 467,111 494,688 435,947
Value (1,000 dollars)1
China 109,795 112,295 123,715 98,172 118,835 111,941
India 10,659 24,680 19,401 23,370 21,970 17,774
Indonesia 1,034 1,560 1,651 2,628 2,169 1,672
Subtotal 121,489 138,535 144,768 124,171 142,974 131,387
Other sources 200,642 248,189 272,694 209,458 219,582 195,959
Total 322,131 386,724 417,461 333,629 362,556 327,346
Table continued on next page.
8 Tjiwi Kimia states that HTS numbers 4811.90.9050 and 4811.90.9090 are basket categories and contain manyout-of-scope products, including index cards, scrapbook paper, and origami kits, and asks that the Commission lookat Customs import data where AD/CVD duties were paid on imports. Tjiwi Kimia’s prehearing brief, pp. 20-21. Customs data for 2006-2011 show that ***.
9 Appendix E presents import data by individual HTS number.
IV-2

Table IV-1--ContinuedCLPSS: U.S. imports, by sources, 2006-11
Source
Calendar year
2006 2007 2008 2009 2010 2011
Unit value (per piece)
China $0.69 $0.88 $0.87 $0.76 $0.92 $0.93
India 0.44 0.58 0.53 0.53 0.54 0.52
Indonesia 0.32 0.35 0.33 0.32 0.44 0.38
Subtotal 0.65 0.79 0.79 0.68 0.82 0.83
Other sources 0.67 0.68 0.70 0.73 0.69 0.71
Total 0.66 0.71 0.73 0.71 0.73 0.75
Share of quantity (percent)
China 32.8 23.7 24.7 27.8 26.2 27.6
India 5.0 7.8 6.4 9.4 8.2 7.8
Indonesia 0.7 0.8 0.9 1.8 1.0 1.0
Subtotal 38.4 32.3 32.0 39.0 35.4 36.4
Other sources 61.6 67.7 68.0 61.0 64.6 63.6
Total 100.0 100.0 100.0 100.0 100.0 100.0
Share of value (percent)
China 34.1 29.0 29.6 29.4 32.8 34.2
India 3.3 6.4 4.6 7.0 6.1 5.4
Indonesia 0.3 0.4 0.4 0.8 0.6 0.5
Subtotal 37.7 35.8 34.7 37.2 39.4 40.1
Other sources 62.3 64.2 65.3 62.8 60.6 59.9
Total 100.0 100.0 100.0 100.0 100.0 100.0
1 Landed, duty-paid.
Note.–Conversion factor: 0.491262 kg = 1 piece.
Source: Compiled from official Commerce statistics. CLPSS import data are based on HTS subheadings4811.90.9050, 4811.90.9090, 4820.10.2030, 4820.10.2040, 4820.10.2050, and 4820.10.2060.
IV-3

Table IV-2CLPSS: U.S. imports (excluding HTS 4820.10.2060), by source, 2006-11
Source
Calendar year
2006 2007 2008 2009 2010 2011
Quantity (1,000 pieces)
China 159,562 128,262 141,967 82,688 24,023 17,457
India 24,240 42,421 36,882 38,393 32,779 25,521
Indonesia 3,207 4,415 4,956 5,481 2,173 1,597
Subtotal 187,009 175,097 183,804 126,563 58,976 44,575
Other sources 299,506 367,145 390,036 235,121 174,382 173,842
Total 486,515 542,243 573,840 361,684 233,357 218,417
Value (1,000 dollars)1
China 109,795 112,295 123,715 69,168 38,496 33,656
India 10,659 24,680 19,401 20,424 17,606 12,513
Indonesia 1,034 1,560 1,651 2,138 1,539 1,081
Subtotal 121,489 138,535 144,768 91,730 57,641 47,250
Other sources 200,642 248,189 272,694 178,742 142,593 133,025
Total 322,131 386,724 417,461 270,473 200,234 180,274
Unit value (per piece)
China $0.69 $0.88 $0.87 $0.84 $1.60 $1.93
India 0.44 0.58 0.53 0.53 0.54 0.49
Indonesia 0.32 0.35 0.33 0.39 0.71 0.68
Subtotal 0.65 0.79 0.79 0.72 0.98 1.06
Other sources 0.67 0.68 0.70 0.76 0.82 0.77
Total 0.66 0.71 0.73 0.75 0.86 0.83
Table continued on next page.
IV-4

Table IV-2--ContinuedCLPSS: U.S. imports (excluding HTS 4820.10.2060), by sources, 2006-11
Source
Calendar year
2006 2007 2008 2009 2010 2011
Share of quantity (percent)
China 32.8 23.7 24.7 22.9 10.3 8.0
India 5.0 7.8 6.4 10.6 14.0 11.7
Indonesia 0.7 0.8 0.9 1.5 0.9 0.7
Subtotal 38.4 32.3 32.0 35.0 25.3 20.4
Other sources 61.6 67.7 68.0 65.0 74.7 79.6
Total 100.0 100.0 100.0 100.0 100.0 100.0
Share of value (percent)
China 34.1 29.0 29.6 25.6 19.2 18.7
India 3.3 6.4 4.6 7.6 8.8 6.9
Indonesia 0.3 0.4 0.4 0.8 0.8 0.6
Subtotal 37.7 35.8 34.7 33.9 28.8 26.2
Other sources 62.3 64.2 65.3 66.1 71.2 73.8
Total 100.0 100.0 100.0 100.0 100.0 100.0
1 Landed, duty-paid.
Note.–Conversion factor: 0.491262 kg = 1 piece.
Source: Compiled from official Commerce statistics. CLPSS import data are based on HTS subheadings4811.90.9050, 4811.90.9090, 4820.10.2030, 4820.10.2040, and 4820.10.2050.
IV-5
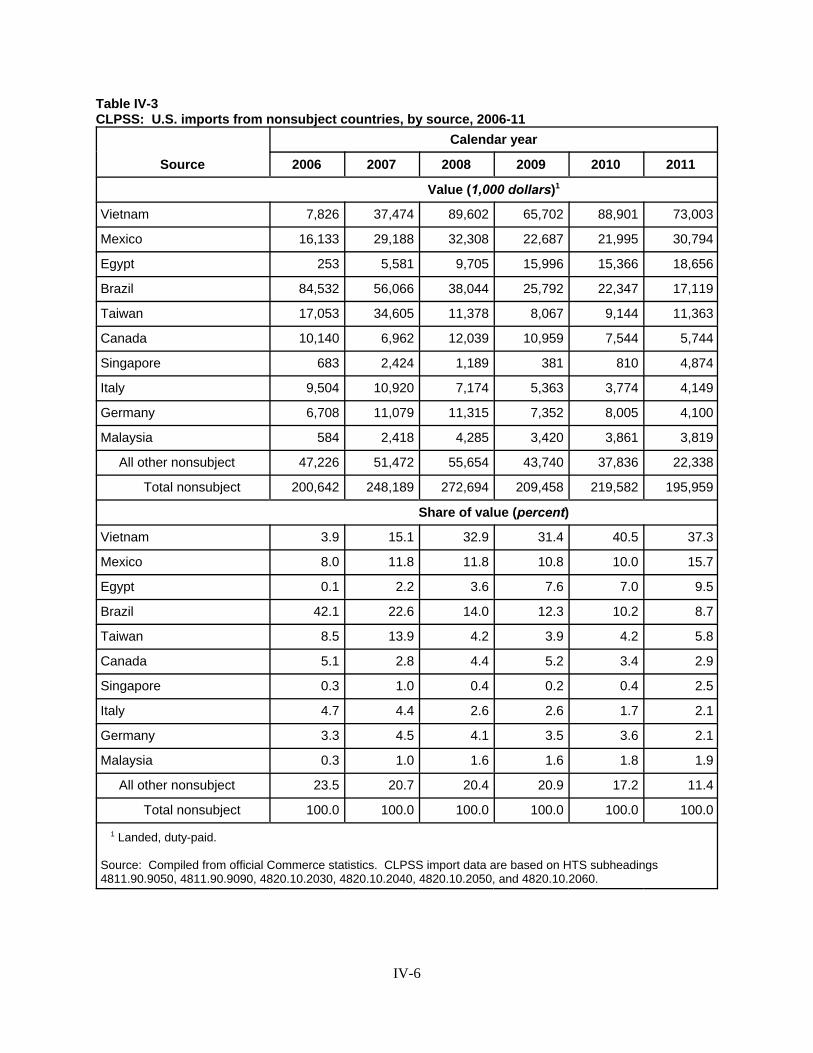
Table IV-3CLPSS: U.S. imports from nonsubject countries, by source, 2006-11
Source
Calendar year
2006 2007 2008 2009 2010 2011
Value (1,000 dollars)1
Vietnam 7,826 37,474 89,602 65,702 88,901 73,003
Mexico 16,133 29,188 32,308 22,687 21,995 30,794
Egypt 253 5,581 9,705 15,996 15,366 18,656
Brazil 84,532 56,066 38,044 25,792 22,347 17,119
Taiwan 17,053 34,605 11,378 8,067 9,144 11,363
Canada 10,140 6,962 12,039 10,959 7,544 5,744
Singapore 683 2,424 1,189 381 810 4,874
Italy 9,504 10,920 7,174 5,363 3,774 4,149
Germany 6,708 11,079 11,315 7,352 8,005 4,100
Malaysia 584 2,418 4,285 3,420 3,861 3,819
All other nonsubject 47,226 51,472 55,654 43,740 37,836 22,338
Total nonsubject 200,642 248,189 272,694 209,458 219,582 195,959
Share of value (percent)
Vietnam 3.9 15.1 32.9 31.4 40.5 37.3
Mexico 8.0 11.8 11.8 10.8 10.0 15.7
Egypt 0.1 2.2 3.6 7.6 7.0 9.5
Brazil 42.1 22.6 14.0 12.3 10.2 8.7
Taiwan 8.5 13.9 4.2 3.9 4.2 5.8
Canada 5.1 2.8 4.4 5.2 3.4 2.9
Singapore 0.3 1.0 0.4 0.2 0.4 2.5
Italy 4.7 4.4 2.6 2.6 1.7 2.1
Germany 3.3 4.5 4.1 3.5 3.6 2.1
Malaysia 0.3 1.0 1.6 1.6 1.8 1.9
All other nonsubject 23.5 20.7 20.4 20.9 17.2 11.4
Total nonsubject 100.0 100.0 100.0 100.0 100.0 100.0
1 Landed, duty-paid.
Source: Compiled from official Commerce statistics. CLPSS import data are based on HTS subheadings4811.90.9050, 4811.90.9090, 4820.10.2030, 4820.10.2040, 4820.10.2050, and 4820.10.2060.
IV-6

U.S. IMPORTERS’ IMPORTS SUBSEQUENT TO DECEMBER 31, 2011
The Commission requested importers to indicate whether they had imported or arranged for theimportation of CLPSS from China, India, Indonesia, and all other sources for delivery after December 31,2011. Four importers responded that they have imported or arranged for the imports of CLPSS fromChina in 2012; eight from India, one from Indonesia, and eight from all other sources. Data on U.S.importers’ actual and arranged imports for 2012 are presented in table IV-4.
Table IV-4CLPSS: Actual and arranged imports, 2012
Source
Calendar year 2012
Jan-Mar Apr-Jun Jul-Sept Oct-Dec Total
Quantity (1,000 pieces)
China *** *** *** *** ***
India *** *** *** *** ***
Indonesia *** *** *** *** ***
All other sources *** *** *** *** ***
Total *** *** *** *** ***
Source: Compiled from data submitted in response to Commission questionnaires.
U.S. IMPORTERS’ INVENTORIES
Table IV-5 presents data for inventories of U.S. imports of CLPSS from China, India, Indonesia,and all other sources held in the United States.
Table IV-5CLPSS: U.S. importers’ end-of-period inventories of imports, by source, 2006-11
* * * * * * *
ANTIDUMPING INVESTIGATIONS IN THIRD-COUNTRY MARKETS
There are no known antidumping or countervailing duty investigations or determinations oncertain lined paper school supplies in any other country.
CUMULATION CONSIDERATIONS
In assessing whether subject imports are likely to compete with each other and with the domesticlike product with respect to cumulation, the Commission generally has considered the following fourfactors: (1) the degree of fungibility, including specific customer requirements and other quality-relatedquestions; (2) presence of sales or offers to sell in the same geographic markets; (3) common channels ofdistribution; and (4) simultaneous presence in the market. A discussion of the degree of fungibility andchannels of distribution was presented in Part II. Additional information concerning geographicalmarkets, and simultaneous presence in the market is presented below.
IV-7

Geographic Markets
As indicated in Part II, U.S.-produced LPP is sold throughout the United States. While importsof CLPSS from the subject countries may enter specific Customs districts, the product is then generallysold nationwide. Table IV-6 presents the value of U.S. imports of CLPSS from subject countries duringthe 2006-11 period, by Customs district. CLPSS imports from China entered through 40 differentCustoms districts; CLPSS from India through 30; and CLPSS from Indonesia through 19.
Table IV-6CLPSS: U.S. imports, by Customs district, 2006-11 aggregated
Customs district China India Indonesia
Value1 ($1,000)
Los Angeles, CA 178,529 21,463 5,197
New York, NY 103,467 35,373 730
Chicago, IL 96,801 3,687 0
Savannah, GA 49,313 10,632 3,602
Great Falls, MT 40,094 665 0
All others 206,552 46,034 1,185
1 Landed, duty-paid.
Source: Compiled from official Commerce statistics.
Presence in the Market
Table IV-7 presents monthly import statistics for CLPSS from subject and nonsubject sourcesduring 2006-11, by value. Imports of CLPSS from China, India, and Indonesia were present in theUnited States in each month of this period.
IV-8

IV-9
Table IV-7CLPSS: Monthly U.S. imports, by source, 2006-11
Value ($1,000)
Month Jan Feb Mar Apr May Jun Jul Aug Sep Oct Nov Dec
2006
China 8,635 5,193 11,482 8,321 13,759 14,264 7,745 10,064 7,115 9,395 7,514 6,309
India 901 532 256 127 730 1,564 2,526 2,395 283 182 425 738
Indonesia 352 44 94 171 61 67 35 98 26 3 8 75
Subtotal 9,888 5,769 11,832 8,620 14,550 15,894 10,305 12,557 7,424 9,580 7,947 7,123
All others 7,080 7,255 9,980 17,376 30,574 38,007 34,725 14,509 9,536 11,554 11,761 8,286
Total 16,969 13,023 21,811 25,996 45,124 53,901 45,031 27,066 16,960 21,133 19,708 15,408
2007
China 7,010 7,723 7,791 9,096 12,080 12,368 10,379 8,136 11,516 11,081 7,269 7,846
India 472 203 1,395 1,742 3,940 4,134 4,990 5,089 618 933 961 202
Indonesia 18 147 55 151 231 291 50 277 190 3 106 40
Subtotal 7,501 8,074 9,241 10,989 16,251 16,792 15,420 13,501 12,324 12,017 8,336 8,088
All others 12,093 12,914 16,876 28,918 32,928 36,187 31,677 19,736 10,715 15,158 14,806 16,180
Total 19,594 20,988 26,118 39,907 49,179 52,980 47,097 33,238 23,039 27,174 23,142 24,269
2008
China 7,646 9,487 5,568 8,481 12,789 17,905 14,488 8,551 10,540 10,097 9,901 8,261
India 231 310 636 1,363 3,936 5,471 2,500 1,397 747 630 1,452 728
Indonesia 52 70 325 450 100 190 310 10 15 16 70 41
Subtotal 7,929 9,867 6,530 10,295 16,825 23,566 17,298 9,957 11,302 10,744 11,424 9,031
All others 11,170 13,091 20,274 31,751 41,525 47,261 30,414 20,742 12,417 16,795 12,978 14,274
Total 19,100 22,957 26,803 42,046 58,350 70,828 47,712 30,699 23,720 27,539 24,402 23,305
Table continued on next page.

IV-10
Table IV-7--ContinuedCLPSS: Monthly U.S. imports, by source, 2006-11
Value ($1,000)
Month Jan Feb Mar Apr May Jun Jul Aug Sep Oct Nov Dec
2009
China 6,651 5,806 5,876 8,714 11,219 13,239 9,560 8,069 8,270 6,856 6,574 7,338
India 926 740 4,557 4,371 3,258 3,370 3,127 698 617 623 503 581
Indonesia 92 2 272 141 336 528 473 173 176 71 220 144
Subtotal 7,669 6,548 10,704 13,226 14,813 17,137 13,160 8,940 9,063 7,550 7,297 8,063
All others 11,741 8,283 15,812 27,877 39,484 36,877 21,094 14,895 9,721 6,246 6,670 10,758
Total 19,410 14,831 26,516 41,103 54,297 54,014 34,254 23,836 18,784 13,796 13,967 18,822
2010
China 6,339 6,574 8,011 7,082 11,637 16,292 12,342 10,498 9,856 10,929 9,620 9,654
India 352 966 3,654 1,650 3,472 4,872 3,167 1,453 572 744 807 260
Indonesia 125 246 333 244 46 323 99 436 98 64 55 99
Subtotal 6,815 7,786 11,998 8,976 15,156 21,488 15,607 12,388 10,526 11,738 10,483 10,013
All others 9,823 13,894 15,562 17,746 34,503 37,200 36,653 18,920 10,571 9,053 8,651 7,007
Total 16,638 21,680 27,560 26,722 49,658 58,688 52,260 31,308 21,097 20,791 19,134 17,020
2011
China 9,437 10,082 4,574 9,895 14,915 14,183 10,659 6,322 7,928 8,755 6,089 9,103
India 1,013 702 1,200 1,349 3,464 3,609 1,972 1,360 993 646 644 820
Indonesia 334 86 164 68 256 98 97 52 105 12 262 140
Subtotal 10,784 10,870 5,938 11,311 18,634 17,890 12,729 7,734 9,025 9,413 6,994 10,064
All others 11,513 15,308 16,745 22,679 43,367 32,264 19,557 7,694 4,289 5,810 8,388 8,346
Total 22,297 26,178 22,683 33,991 62,001 50,154 32,285 15,428 13,314 15,223 15,382 18,410
Source: Compiled from official Commerce statistics. CLPSS import data are based on HTS subheadings 4811.90.9050, 4811.90.9090, 4820.10.2030, 4820.10.2040, 4820.10.2050,and 4820.10.2060.

THE INDUSTRY IN CHINA
In 2008, China surpassed the United States as the world’s largest paper and paperboardproducer.10 Despite a huge and growing domestic market, China has transitioned from being a netimporter to a net exporter of paper products, producing an estimated 96.5 million metric tons of paper andpaperboard in 2010, compared to just 36.4 million metric tons in 2001 (a 165 percent increase).11 Thousands of paper mills in China are very small and rely on non-wood fiber such as straw and bagasse.However, the government has targeted the small, inefficient mills for closure while large, modern highcapacity mills and papermaking machines have come on line over the past decade. In 2010, Chinaproduced 23 million metric tons of printing and writing paper of the kind used to manufacture LPP,having increased production of such paper by over 14 million metric tons in the previous ten years.12
Information on the proportion of Chinese printing and writing paper production utilized for CLPSS,OLPP, and total LPP is not available.
At the time of the Commission’s original investigations, usable questionnaire responses werereceived from three firms. The responding firms’ production in 2005 was *** pieces and their totalcapacity was *** pieces. Exports accounted for *** percent of all shipments, and exports to the UnitedStates accounted for *** of responding producers’ total shipments.13
In these reviews, the Commission issued foreign producer questionnaires to 17 Chinese firmsbelieved to produce CLPSS. No Chinese producer responded to the Commission’s questionnaire. TheChinese government’s current “five-year plan” explicitly labeled the paper industry a new source ofeconomic growth.14 In addition, parties have suggested that Chinese paper is now being sent to Vietnamto be converted into lined paper products, resulting in the large increase of CLPSS imports from Vietnamover the period of review.15
THE INDUSTRY IN INDIA
Overview
The paper and paperboard industry in India is highly fragmented with about 600 operating mills,many of which are small.16 Indian government regulations state that any CLPSS producer that is notdesignated as a “small-scale” producer17 is required to match any domestic sales with an equivalentexport.18 Indian respondents further report that producers remain small scale so as to ensure participation
10 FAOSTAT, Food and Agriculture Organization of the United Nations (FAO), accessed May 9, 2012.
11 Ibid.
12 Ibid.
13 Commission Report, August 15, 2006, pp. VII-2-VII-5.
14 “Industry Special: Paper industry on track to grow with government support,” China Daily, May 3, 2012, foundat http://www.chinadaily.com.cn/cndy/2012-05/03/content_15193298.htm.
15 Indian producers’ prehearing brief, pp. 12-13 and hearing transcript, p. 240-241 (Gupta).
16 Rushton, Mark. "Tamil Nadu's expanding jewel in an Indian crown." Pulp & Paper International Magazine,RISI. May 2, 2011. Available at:http://www.risiinfo.com/technologyarchives/papermaking/An-expanding-jewel-in-an-Indian-crown.html.
17 Small-scale producers are defined as manufacturers that have a limit on investment of Rs. 50 million, or theequivalent of about $1 million.
18 Indian producers' posthearing brief, Response to Commissioners' Questions, pp. 15-16 and hearing transcript, p.163 (Sampat).
IV-11

in the growing domestic market. In contrast, AASPS views the regulation as encouraging exports.19 AASPS also believes that Indian exporters consolidate for export CLPSS from smaller producersotherwise not engaged in the export markets.20
Indian paper and paperboard production in 2010 totaled 10.3 million metric tons, compared to 4.2million metric tons in 2001 (an increase of 140 percent).21 Approximately 40 percent (4.2 million metrictons) of total paper and paperboard production is in printing and writing segments that include the typesof products used in the production of LPP.22 Information on the proportion of Indian printing and writingpaper production utilized for CLPSS, OLPP, and total LPP is not available. Because wood fiber islimited, India’s industry is highly dependent on non-wood raw material. An estimated 70 percent of theraw material used in India’s pulp and paper industry consists of agricultural residues, such as bagasse andstraw, and recovered paper.23 According to the Indian respondents, India is required by lack of resourcesand by law to produce the great majority of its paper from recycled paper, straw, bagasse (sugarcanewaste), and other agricultural waste products.24
CLPSS Operations
At the time of the Commission’s original investigations, usable questionnaire responses werereceived from eight firms. In these reviews, the Commission issued foreign producer questionnaires to 13Indian firms believed to produce CLPSS. Questionnaire responses were received from eight firms25 thatare believed to account for *** percent26 of Indian production of CLPSS in 2010.27 Each responding firmprovided data for the entire 2006-11 period. Table IV-8 presents 2011 production, and U.S. export datafor the responding Indian firms.
19 Petitioner's Posthearing Brief, Exhibit 1, pp. 5-6.
20 Ibid.
21 FAOSTAT.
22 Ibid.
23 See Indian Pulp & Paper Technical Association. Presentation by N. Gopalaratnamn, Agm & Seminar -Chennai, February 5, 2010. Available at:http://www.spbltd.com/pdf/IPPTA%20AGM%20-%20CHENNAI%20-%20FEB%2005%202010.pdf.
24 Indian respondents posthearing brief, Response to Commissioners’ Questions, p. 19.
25 The five firms that did not submit questionnaires are: ***. The responding Indian producers note that ***. Indian Producers’ posthearing brief, Exhibit 3. In addition, the AASPS identified the following Indian producerswith the capacity to produce CLPSS: Sundaram Multipap Ltd., 120 tonnes per day; Blue Bird (India) Limited, 71million tons pers year. It has also identified Ballapur Industries Limited, Indian Tobacco Copmany and JK PaperLtd. as Indian companies with plans to increase CLPSS capacity. AASPS’ prehearing brief, pp. 42-44. In addition,Indian producers ***. AASPS’ posthearing brief, p. 6.
26 Indian respondents’ response to the notice of institution, August 31, 2011, p. 12.
27 The eight responding Indian producers account for 91.0 of total Indian exports to the United States in 2011. Coverage was calculated using the quantity of reported Indian exports to the United States (23.221 million pieces)compared to the quantity of U.S. imports from India, based on five HTS subheadings (25.521 million pieces).
IV-12

Table IV-8CLPSS: Responding Indian manufactures’ reported production and U.S. exports, by firm, 2011
Producer
Production(1,000
pieces)
Share ofreported 2011production inIndia (percent)
Exports to the U.S.
(1,000 pieces)
Share ofreported 2011exports to theU.S. (percent)
FFI International (“FFI”) *** *** *** ***
Lodha Offset *** *** *** ***
Marisa International (“Marisa”) 1 *** *** *** ***
Navneet Publications (“Navneet”) *** *** *** ***
Pioneer Stationery (“Pioneer”) *** *** *** ***
Riddhi Enterprises (“Riddhi”) *** *** *** ***
SAB International (“SAB”) *** *** *** ***
SGM Paper Products (“SGMPaper”) *** *** *** ***
Total 70,758 100.0 23,221 100.0
1 Marisa International ***.
Source: Compiled from data submitted in response to Commission questionnaires.
Indian producers were asked to indicate whether their firms had experienced any plant openings,closing, relocations, expansions, acquisitions, consolidations, prolonged shutdowns or curtailments,revised labor agreements, or any other change in the character of their operations or organization relatingto the production of CLPSS since 2006. One firm, ***, reported that it closed its factory in ***, andrelocated to ***. *** also reported a manufacturing plant relocation to ***. Three expansions werereported by ***.
Information on reported Indian producers’ production capacity, production, shipments andinventories is presented in table IV-9. The data show an increase in capacity and production by 93.4 and130.4 percent respectively from 2006 to 2011. Export shipments to the United States have also increasedby over 600 percent.
IV-13

Table IV-9CLPSS: India’s reported capacity, production, shipments, and inventories, 2006-11
Item
Calendar year
2006 2007 2008 2009 2010 2011
Quantity (1,000 pieces)
Capacity 44,002 51,868 59,767 64,784 76,554 85,115
Production 30,708 43,163 52,025 51,063 70,355 70,758
End of period inventories 3,219 4,938 11,017 7,867 10,882 13,689
Home market shipments 18,687 24,228 27,066 29,054 38,539 42,003
Exports: United States 3,196 8,225 6,448 10,583 21,565 23,221
European Union *** *** *** *** *** ***
Asia *** *** *** *** *** ***
All other markets 8,451 11,632 17,046 12,650 14,701 17,389
Total exports 11,783 20,242 25,058 26,712 40,966 44,623
Total shipments 30,470 44,470 52,124 55,766 79,505 86,626
Value ($1,000)
Home market shipments 6,273 7,761 10,122 12,820 15,286 16,182
Exports: United States 1,142 5,032 3,841 7,386 10,014 9,207
European Union *** *** *** *** *** ***
Asia *** *** *** *** *** ***
All other markets 2,549 4,221 6,748 5,646 6,604 6,999
Total exports 3,857 9,397 11,048 14,265 17,903 17,308
Total shipments 10,130 17,158 21,170 27,085 33,189 33,490
Table continued on next page.
IV-14

Table IV-9--ContinuedCLPSS: India’s reported capacity, production, shipments, and inventories, 2006-11
Item
Calendar year
2006 2007 2008 2009 2010 2011
Average unit value (dollars per piece)
Home market shipments 0.34 0.32 0.37 0.44 0.40 0.39
Exports: United States 0.36 0.61 0.60 0.70 0.46 0.40
European Union *** *** *** *** *** ***
Asia (1) (1) *** *** *** ***
All other markets 0.30 0.36 0.40 0.45 0.45 0.40
Total exports 0.33 0.46 0.44 0.53 0.44 0.39
Total shipments 0.33 0.39 0.41 0.49 0.42 0.39
Ratios and shares (percent)
Capacity utilization 69.8 83.2 87.0 78.8 91.9 83.1
Inventories to production 10.5 11.4 21.2 15.4 15.5 19.3
Inventories to total shipments 10.6 11.1 21.1 14.1 13.7 15.8
Share of total shipment quantity: Home market 61.3 54.5 51.9 52.1 48.5 48.5
Exports to United States 10.5 18.5 12.4 19.0 27.1 26.8
Exports to European Union *** *** *** *** *** ***
Exports to Asia *** *** *** *** *** ***
Exports to all other markets 27.7 26.2 32.7 22.7 18.5 20.1
Total exports 38.7 45.5 48.1 47.9 51.5 51.5
1 ***.
Source: Compiled from data submitted in response to Commission questionnaires.
IV-15

THE INDUSTRY IN INDONESIA
Overview
In 2010, Indonesia was the seventh largest producer of paper and paperboard products, behindChina, the United States, Japan, Germany, Canada, and Finland.28 Paper and paperboard productiontotaled 11.5 million metric tons, of which 55 percent (6.3 million metric tons) was in printing and writinggrades that include the types of products used in the production of LPP.29 However, information on theproportion of Indonesia's printing and writing paper production utilized for CLPSS, OLPP and total LPPis not available. Indonesia’s pulp and paper industry is based primarily on virgin wood fiber, the majorityof which is derived from forest plantations.
CLPSS Operations
At the time of the Commission’s original investigations, one questionnaire response was receivedfrom PT. Pabrik Kertas Tjiwi Kimia (“Tjiwi Kimia”). In these reviews, the Commission received aforeign producer questionnaire from Tjiwi Kimia, which is believed to account for *** percent ofIndonesian production of CLPSS in 2011, and states that it ***.30 31 Tjiwi Kimia is part of the Asia Pulpand Paper Group,32 and started operating in 1978. Its annual paper and board production capacity is 1.2million metric tons, and it stationery converting capacity is 320,000 metric tons.33 Tjiwi Kimia producesall of its lined paper products from base paper it also produces, using wood fiber from Indonesia.34
Tjiwi Kimia *** changes in operations since 2006. Tjiwi Kimia has no plans to add anyadditional lined paper conversion machinery, or to improve its existing machinery, nor does it have thespace to add additional machinery in its existing lined paper conversion buildings.35 Information on TjiwiKimia’s total reported capacity for LPP is presented in table IV-10. Information on Tjiwi Kimia’sreported production capacity, production, shipments and inventories for CLPSS is presented in table IV-11.
Table IV-10LPP: Tjiwi Kimia’s reported overall capacity and production
* * * * * * *
Table IV-11CLPSS: Tjiwi Kimia’s reported capacity, production, shipments, and inventories, 2006-11
* * * * * * *
28 FAOSTAT.
29 Ibid.
30 Questionnaire response of Tjiwi Kimia.
31 While Tjiwi Kimia contends that ***, the AASPS has identified several Indonesian producers of LPP,including ***. AASPS prehearing brief, pp. 24-25.
32 Hearing transcript, p. 266 (Shor).
33 Tjiwi Kimia, The Company, found at http://www.tjiwi.co.id/index.php/the-company, retrieved on June 21,2012.
34 Tjiwi Kimia’s posthearing brief, p. Q-9.
35 Tjiwi Kimia’s posthearing brief, p. Q-18.
IV-16

GLOBAL MARKET
CLPSS are produced in a number of countries in addition to the United States, China, India, andIndonesia. However, trade statistics do not allow an accurate assessment of trade flows of CLPSSbecause the subject product is included in categories that also include nonsubject paper products. TableIV-12 presents world imports of paper products classified in the three six-digit HS subheadings (HS4810.22, 4811.90, and 4820.10) that include most lined paper supplies, by country. Table IV-13 presentsworld exports of paper products classified in the three six-digit HS subheadings (HS 4810.22, 4811.90,and 4820.10) that include most lined paper supplies, by country.
Table IV-12Paper products: World imports, by country, 2006-11
Country
Calendar Year
2006 2007 2008 2009 2010 2011
Value ($1,000)
United States 2,110,226 1,975,923 2,017,855 1,408,977 1,453,424 1,613,073
Germany 1,005,596 1,129,464 1,185,068 867,312 817,383 926,057
France 834,443 951,948 916,862 698,038 771,496 861,530
United Kingdom 776,725 900,113 826,974 681,523 767,448 811,172
Japan 276,816 208,363 216,642 347,456 374,277 504,727
Italy 528,563 597,395 589,207 447,237 480,352 482,601
Belgium 367,483 416,081 484,115 379,551 408,194 461,716
Australia 290,038 338,846 388,090 332,067 419,897 432,165
Canada 421,553 402,695 386,057 308,980 335,146 350,260
Poland 241,454 306,925 342,297 237,476 313,857 331,102
All others 4,285,446 4,773,187 5,176,988 3,901,078 4,483,546 4,739,762
World total 11,138,342 12,000,941 12,530,155 9,609,694 10,625,020 11,514,165
Note.--Data reflect imports for GTIS reporting countries only.
Source: GTIS Global Trade Atlas, 4810.22 (“Paper, Light-Weight Coated, Used For Writing, Printing Or OtherGraphic Purposes, Over 10% (Wt.) Mechanical Fibers, In Rolls Or Sheets”), 4811.90 (“Paper, Paperboard,Cellulose Wadding And Webs Of Cellulose Fibers, Coated, Impregnated, Etc. Nesoi, In Rolls Or Sheets”), and4820.10 (“Registers, Account Books, Notebooks, Order Books, Receipt Books, Letter Pads, Memorandum Pads,Diaries And Similar Articles Of Paper Or Paperboard”). Retrieved May 9, 2012.
IV-17

Table IV-13Paper products: World exports, by country, 2006-11
Country
Calendar Year
2006 2007 2008 2009 2010 2011
Value ($1,000)
Germany 2,866,502 3,124,157 3,141,456 2,445,176 2,551,599 2,765,818
Finland 1,720,666 1,728,706 1,428,289 1,263,525 1,539,132 1,708,729
China 640,435 761,966 797,810 815,242 1,027,074 1,264,793
United States 757,146 779,898 848,156 682,260 792,556 866,141
Italy 715,231 776,133 858,835 674,647 735,406 821,921
Thailand 42,662 49,814 61,406 26,994 27,277 730,293
France 662,549 721,207 783,324 608,289 628,597 695,387
Belgium 490,231 522,876 599,050 384,107 421,165 443,788
Canada 714,814 639,250 546,186 415,839 375,689 402,296
United Kingdom 241,356 267,766 305,646 269,034 326,227 375,510
Sweden 384,143 388,299 460,225 371,375 320,512 350,641
Indonesia 51,861 57,127 66,801 273,582 410,362 348,517
Austria 244,102 263,943 248,192 256,874 281,157 296,745
Japan 315,950 335,568 381,026 259,065 292,814 250,501.0
Switzerland 271,430 296,606 280,726 212,215 193,367 220,030
Hong Kong 240,882 241,696 231,651 164,507 172,243 179,309
Poland 139,156 182,909 194,753 118,895 151,801 162,119
Spain 134,847 171,185 214,867 175,173 177,806 157,916
Netherlands 113,778 152,603 159,528 113,711 103,123 95,425
Singapore 253,068 342,127 217,555 68,112 76,201 87,473
Vietnam (1) (1) (1) (1) 79,443 81,778
India 30,640 44,726 57,856 86,266 86,860 (1)
All others 599,581 613,619 640,308 459,963 471,452 553,234
World total 11,631,030 12,506,909 12,581,502 10,231,117 11,328,723 12,858,363
Note.--Data reflect exports for GTIS reporting countries only.
1 Not available.
Source: GTIS Global Trade Atlas, 4810.22 (“Paper, Light-Weight Coated, Used For Writing, Printing Or OtherGraphic Purposes, Over 10% (Wt.) Mechanical Fibers, In Rolls Or Sheets”), 4811.90 (“Paper, Paperboard,Cellulose Wadding And Webs Of Cellulose Fibers, Coated, Impregnated, Etc. Nesoi, In Rolls Or Sheets”), and4820.10 (“Registers, Account Books, Notebooks, Order Books, Receipt Books, Letter Pads, Memorandum Pads,Diaries And Similar Articles Of Paper Or Paperboard”). Retrieved May 9, 2012.
IV-18

V-1
PART V: PRICING AND RELATED INFORMATION
FACTORS AFFECTING PRICES
Raw Material Costs
Raw materials constitute a substantial portion of the final costs of LPP. As discussed in greater detail in Part III of this report, raw material costs, as a percentage of the total costs of goods sold, increased from 69.7 percent in 2006 to 74.6 percent in 2011. The principal raw material input used to produce LPP is printing and writing paper.37 Other raw materials include stainless steel wire, plastic-coated wire, cardboard and paperboard for backings, staples, stitching, glue, and film or other packaging materials. Public data show that prices of writing and printer papers relatively stable during 2006-07 but began to rise in 2008, with prices increasing by 17 percent between January 2006 and December 2011 (figure V-1). Figure V-1 Material costs: Producer price index of writing and printing paper by months, January 2006-December 2011
Source: U.S. Bureau of Labor Statistics, http://data.bls.gov/cgi-bin/dsrv, retrieved May 7, 2012.
U.S. Inland Transportation Costs
All six producers and the majority of responding importers (14 of 17) indicated that their firms generally arrange for transportation to customers’ locations. U.S. producers reported that U.S. inland transportation costs for LPP ranged from 4 to 9 percent of the delivered price. Eight responding importers of CLPSS reported that U.S. inland transportation costs of CLPSS ranged from 2 to 20 percent of the delivered price. Five of six responding producers reported shipping the majority of their sales in distances of 101 to 1,000 miles and one producer reported shipping the majority of its sales in distances
37 Printing and writing paper includes three types of papers: uncoated free sheet; coated papers; and uncoated
mechanical papers. LPP is primarily made from uncoated free sheet paper but can also be made from the other two types of paper for certain products.
100
102
104
106
108
110
112
114
116
118
120
Janu
ary
2006
= 1
00

V-2
greater than 1,000 miles. Seven of 9 responding importers reported shipping the majority of their sales in distances of 101 to 1,000 miles, and two importers reported shipping their sales equally among distances of 100 miles, 1001 miles, and greater than 1001 miles.
PRICING PRACTICES38
Pricing Methods The majority of firms (4 of 6 producers and 9 of 16 importers) quote prices of LPP on a delivered basis with the remaining firms quoting prices on an f.o.b. basis.39 Producers’ sales terms varied by firm with 2 producers reporting sales terms of net 30 days; one producer reported net 45 days; one producer reported 1/30 net 31 days; one producer reported 2/10 net 31 days; and one producer reported that its sales terms varies by customer. Importers’ sales terms are primarily net 30 days. Three producers and 10 importers reported selling LPP on a transaction-by-transaction basis, three producers and five importers reported using set price lists,40 one producer and two importers reported selling through contracts, and one producer reported “other.”41
Sales Terms and Discounts
Three of six responding producers reported that they do not offer any discounts because they compete in bids or auctions to supply retailers. Two producers reported offering annual total volume discounts, and one producer reported that discounts are provided through “advertising allowances, payment terms, and specific customer programs.” The majority of importers (9 of 16) reported that they do not offer any discounts. Two importers reported offering both quantity and annual total volume discounts, three importers reported offering only quantity discounts, and one producer reported offering only annual total volume discounts.
Contract vs. Spot Sales
U.S.-produced LPP is most commonly sold on a short-term contract basis. However, the majority of imported LPP is sold on a spot basis. Six U.S. producers and five importers reported their 2011 U.S. commercial shipments of LPP by type of sale; their shipment shares, based on value, are shown in table V-1.42
38 Questionnaire respondents were requested to separate their answers if their responses differ materially by
CLPSS or OLPP. None of the responding firms reported any differences between CLPSS and OLPP in their responses.
39 U.S. producer and importer *** reported that it quoted prices on both a delivered basis and f.o.b. basis. 40 Both *** reported that while they generate price lists, actual prices are based on negotiations with their
customers. 41 *** reported that sales prices are negotiated separately with each of its customers for multiple shipments over
periods ranging from 6 months to 12 months. 42 Two Indian producers, ***, reported that more than *** percent of their sales of CLPSS to U.S. customers
were on a short-term contract basis with spot sales accounting for the remaining sales in 2011.

V-3
Table V-1 LPP: U.S. producers’ and importers’ U.S. commercial shipments by type of sale, 2011
Type of sale
Shares of 2011 U.S. commercial shipments (percent) U.S. producers Importers1
Spot 27.4 100.0 Short-term contracts 72.6 0.0
Long-term contracts 0.0 0.0 Total 100.0 100.0 Note.–Because of rounding, figures may not add to the totals shown. 1 Six additional importers (***) provided information on their sales but did not import CLPSS during 2011, such that they were not able to provide data for this table. Four of these six importers reported selling more than 70 percent of their product on a short-term contract basis and the remaining two reported selling the majority of their sales on a spot basis. Source: Compiled from data submitted in response to Commission questionnaires.
Two producers reported that their short-term contracts were typically for one year and one producer reported that its short-term contracts ranged from 60 days to 120 days. Two of the three producers reported that prices could not be renegotiated. All three producers reported that both price and quantity are initially fixed. Two producers reported that contracts generally contain meet-or-release provisions. Four Indian foreign producers reported that their short-term contracts with U.S. customers typically ranged from 120 day to 180 days. All four Indian producers reported that price could not be renegotiated and that both price and quantity are initially fixed. Three of the four Indian producers reported that contracts generally do not contain meet-or-release provisions.
PRICE DATA
The Commission requested U.S. producers of LPP and importers of CLPSS provide quarterly data for the total quantity and f.o.b. value of the following CLPSS products shipped to unrelated U.S. customers during January 2006-December 2011.
Product 1 (CLPSS).-- 70-sheet count 10.5" x 8.0" wirebound notebook with paperboard cover and backing, no pockets/folders, and no fashion graphic
Product 2 (CLPSS).-- 150-sheet count 10.5" x 8.0" package of filler paper--college ruled or wide
ruled Product 3 (CLPSS).-- 180-sheet count 10.5" x 8.0" 5-subject wirebound notebook with
paperboard cover and backing and no fashion graphics Product 4 (CLPSS).-- 100-sheet count 9.75" x 7.5" composition book with a marbleized cover
and no fashion graphics Product 5 (CLPSS).-- 100-sheet count 10.5" x 8.0" wire bound notebook with poly cover, no
pockets/folders, and no fashion graphics
Five producers and ten importers provided price data. All five producers (***) provided price data for products 1 and 3; three producers (***) provided price data for products 2 and 5; and one producer (***) provided price data for product 4. Four importers of CLPSS from China (***) and seven

V-4
importers of CLPSS from India (***) reported usable price information, but not necessarily for all products or periods.43 In addition, four retailers that imported CLPSS directly (***) provided their purchase price data.44 By quantity, pricing data by responding firms accounted for approximately *** percent of U.S. producers’ commercial shipments of CLPSS during January 2006-December 2011, *** percent of reported U.S. commercial shipments of subject imports from China,45 *** percent of reported U.S. commercial shipments of subject imports from India, 46 and *** percent of U.S. commercial shipments of subject imports from Indonesia. 47
Price Trends
As show in tables V-2 through V-7 and in figures V-2 through V-6, weighted-average f.o.b. sale prices of all U.S.-produced LPP products fluctuated but generally increased from their 2006 levels.48 Overall, the annual weighted sales price of most U.S.-produced products peaked in 2009. Prices of all U.S.-produced LPP and subject imports of CLPSS often fell during the third quarter of each year during the height of back-to-school promotions. Since sales of LPP are highly seasonal, comparing CLPSS prices in the first quarter of 2006 to CLPSS in the fourth quarter of 2011 may be misleading. Therefore, the trend analysis discussed below uses the annual quantity weighted average sales prices which may compensate for some of the seasonality issues by giving less weight to quarterly fluctuations. Table V-2 LPP: Weighted-average f.o.b. prices and quantities of domestic and imported CLPSS product 1,1 and margins of underselling/(overselling), by quarters, January 2006-December 2011
* * * * * * * Table V-3 LPP: Weighted-average f.o.b. prices and quantities of domestic and imported CLPSS product 2,1 and margins of underselling/(overselling), by quarters, January 2006-December 2011
* * * * * * *
.
43 U.S. producers *** provided price data for their sales of products 4 and 5 imported from both China and India.
By quantity, their price data accounted for *** percent of the total price data for product 4 from China, *** percent of the total price data for product 4 from India, *** percent of the total price data for product 5 from China, and *** percent of the total price data for product 5 from India. In appendix F, price data for imported products, as reported by U.S. producers only, are presented separately from price data as reported by importers only. The corresponding margins of underselling and overselling are also presented in appendix F.
44 In tables V-2 through V-7, “purchase” data indicates direct retailer imports. 45 Importer sales price data from China accounted for *** percent and retailer direct import purchase price data
accounted for *** percent of reported U.S. commercial shipments of subject imports from China during the period. 46 Importer sales price data from India accounted for *** percent and retailer direct import purchase price data
accounted for *** percent of reported U.S. commercial shipments of subject imports from India during the period. 47 No sales price data were reported for imports of CLPSS from Indonesia. *** reported direct imports of
CLPSS from Indonesia in 2006. It noted that its purchase price data was “based on and limited to HTS codes and country of origin as declared to Customs at time of entry. Period of shipment was based on estimated arrival date, not actual entry date.” ***.
48 Price trends of products 1-4 from January 2003 to December 2011 are presented in appendix G. The price definition for product 5 changed between the final investigations and the current reviews, and therefore, is excluded.

V-5
Table V-4 LPP: Weighted-average f.o.b. prices and quantities of domestic and imported CLPSS product 3,1 and margins of underselling/(overselling), by quarters, January 2006-December 2011
* * * * * * * Table V-5 LPP: Weighted-average f.o.b. prices and quantities of domestic and imported CLPSS product 4,1 and margins of underselling/(overselling), by quarters, January 2006-December 2011
* * * * * * * Table V-6 LPP: Weighted-average f.o.b. prices and quantities of domestic and imported CLPSS product 5,1 and margins of underselling/(overselling), by quarters, January 2006-December 2011
* * * * * * * Figure V-2 LPP: Weighted-average quarterly f.o.b. selling prices and quantities of domestic and imported CLPSS product 1, by quarters, January 2006-December 2011
* * * * * * * Figure V-3 LPP: Weighted-average quarterly f.o.b. selling prices and quantities of domestic and imported CLPSS product 2, by quarters, January 2006-December 2011
* * * * * * * Figure V-4 LPP: Weighted-average quarterly f.o.b. selling prices and quantities of domestic and imported CLPSS product 3, by quarters, January 2006-December 2011
* * * * * * * Figure V-5 LPP: Weighted-average quarterly f.o.b. selling prices and quantities of domestic and imported CLPSS product 4, by quarters, January 2006-December 2011
* * * * * * * Figure V-6 LPP: Weighted-average quarterly f.o.b. selling prices and quantities of domestic and imported CLPSS product 5, by quarters, January 2005-June 2011
* * * * * * * Table V-7 LPP: Summary of quarterly weighted-average f.o.b. prices for products 1-5 from the United States, China, and India
* * * * * * *

V-6
Table V-8 LPP: Annual weighted-average f.o.b. selling prices of domestic and imported CLPSS, by product, 2006-11
* * * * * * *
As seen in table V-8, the annual weighted average sale price of U.S.-produced product 1
increased by *** percent from 2006 to 2009, with a decrease of *** percent from 2009 to 2010 followed by a *** percent increase from 2010 to 2011. The annual weighted average sale price of product 1 imported from China was only available for 2011; therefore, price trends are not available.49 Purchase price data for product 1 imported from China were reported in 2006 and 2007 and fell by *** percent. The annual weighted average sale price of product 1 imported from India decreased by *** percent from 2006 to 2008, peaked in 2009 increasing by *** percent from the previous year, and then decreased by *** percent from 2009 to 2011. The annual weighted average purchase price of product 1 imported from India increased by *** percent.50
The annual weighted average sale price of U.S.-produced product 2 increased by *** percent from 2006 to 2009, decreased by *** percent during the following year, followed by a *** percent increase from 2010 to 2011. No price data were reported for product 2 imported from China. The annual weighted average sale price of product 2 from India fluctuated but increased overall by *** percent during the period. The annual weighted purchase price of product 2 from India also fluctuated, peaking in 2009, and increased overall by *** percent during the period for which data were provided.
The annual weighted average sale price of U.S.-produced product 3 increased by *** percent from 2006 to 2009, decreased by *** percent from 2009 to 2010, followed by a *** percent increase from 2010 to 2011. No price data were reported for product 3 imported from China. The annual weighted average sale price of product 3 from India fell by *** percent from 2008 to 2010 and then increased by *** percent in 2011.51
The annual weighted average sale price for U.S.-produced product 4 was only available for 2011; therefore, price trends are not available. The annual weighted average sale price of product 4 imported from China increased by *** percent from 2006 to 2008 and then fell by *** percent from 2008 to 2011.52 The annual weighted average sale price of product 4 from India peaked in 2009, increasing by *** percent from 2006 to 2009, and then decreased by *** percent from 2009 to 2011. The annual weighted average purchase price of product 4 from India fell by *** percent from 2007 to 2010 and then increased by *** percent in 2011.53
The annual weighted average sale price of U.S.-produced product 5 decreased by *** percent from 2006 to 2008, increased by *** percent from 2008 to 2009, decreased by *** percent from 2009 to 2010, followed by a *** percent increase from 2010 to 2011. The annual weighted average sale price of product 5 imported from China increased incrementally for each year data were reported,54 with an overall price increase of *** percent from 2006 to 2011. The annual weighted average sale price of product 5 from India increased by *** percent between 2007 and 2010 and then decreased by *** percent in 2011.55 The annual weighted average purchase price of product 5 imported from India was only available for 2010; therefore, price trends are not available.
49 Staff excluded *** value for sales of product 1 imported from China as reported by *** as it was deemed an
outlier. 50 Purchase price data for product 1 from India were only reported in 2007 and 2009-10. 51 Price data for product 3 imported from India were not reported during 2006 and 2007. 52 Price data for product 4 imported from China were not reported during 2009 and 2010. 53 Purchase price data for product 4 from India were not reported during 2006 and 2008. 54 Price data for product 5 imported from China were not reported during 2009 and 2010. 55 Price data for product 5 imported from India were not reported for 2006 and 2008-09.

V-7
More than half of responding purchasers reported that prices of domestically produced LPP have changed by the same amount as the prices of subject product imported from China (table V-9). More than half of responding purchasers reported that U.S. prices have increased relative to the price of subject imports from India. For price comparisons between domestically produced LPP and subject product imported from Indonesia, two purchasers reported that prices of U.S.-produced LPP have changed by the same amount as prices of subject imports from Indonesia, and two purchasers reported that U.S. prices have increased relative to the price of subject imports from Indonesia. Table V-9 LPP: Comparison of relative prices, by source, as reported by U.S. purchasers
Country pair Prices have changed
by same amount
U.S. prices have increased relative to
source
U.S. prices have decreased relative to
source U.S. vs. China 5 3 1
U.S. vs. India 2 4 1 U.S. vs. Indonesia 2 2 0
Source: Compiled from data submitted in response to Commission questionnaires.
Price Comparisons
Margins of underselling and overselling for the period are presented by pricing product and by year in table V-10 below. The data show that prices of imports from China were lower than the U.S. producers’ price in 2 of 8 quarterly comparisons, with underselling margins ranging from *** percent, and an average margin of *** percent. The price of imports from China were higher than U.S. producers’ prices in 6 quarterly comparison, with overselling margins ranging from *** percent, and an average margin of *** percent. The data show that prices of imports from India were lower than U.S. producers’ prices in 26 of 61 quarterly comparisons, with underselling margins ranging from *** percent, and an average margin of *** percent. Underselling occurred primarily in ***, which was also the peak in Indian volume import levels for these products. The price of imports from India were higher than U.S. producers’ prices in 35 of 61 quarterly comparisons, with overselling margins ranging from *** percent, and an average margin of *** percent. Table V-10 LPP: Summary of underselling/(overselling) by product and by year from China and India, January 2006-December 20111
* * * * * * *
BID DATA
More than half of purchasers (14 of 26) reported that none or nearly none of their purchases were accounted for by auctions or bid sales in 2011. Three purchasers reported that 100 percent of their purchases were conducted by auction or bid sales in 2011. Three purchasers reported that approximately 60 percent or more of their purchases in 2011 were via a bid process. Two purchasers reported that 20 to

V-8
34 percent of their purchases were held through a bid process.56 The top five largest purchasers (***) all reported engaging in some type of auction or bid at one point during the period of review.
Twelve purchasers described the types of auctions or bids they held. *** hold bids using a Request for Quote form (RFQ) that identifies the product specifications, anticipated volumes, and ship dates. *** reported that it conducts an annual bid process for Back-To-School products, including notebooks and filler paper; the bid process typically begins in late August, with bids due back in September, and awards are made between October and December for the following year’s business. *** reported holding on-line auctions which entail three rounds of competitive bidding. *** negotiations occur both through a product line review process and by an online bid system, and only prequalified suppliers are allowed to bid. *** reported that negotiations begin with suppliers submitting product samples that are evaluated on quality; suppliers that meet quality specifications are allowed to participate in a closed auction process. *** has three rounds of bids, with suppliers receiving feedback throughout the process on their overall competitive position based on various criteria including shipping location, quantity, ship dates, and price. *** choses its suppliers based on price and freight costs. *** reported that their suppliers are chosen based on price, quality, service and reputation. *** reported that it holds bids in preparation for Back-To-School and only reliable suppliers that it typically purchases from are allowed to participate. *** reported that its auctions are held online every two to three years and suppliers are chosen based on reputation, ability to comply to all vendor agreement requirements, and ability to meet volume requirements. *** reported that suppliers are chosen based primarily on price although reliability and quality are also considered if they meet the price threshold. The majority of firms reported that the product mix is based on current and projected sales trends.
Six purchasers reported holding an annual auction, particularly in preparation for the Back-To-School season; two purchasers (***) reported holding bids for two separate events which include Back-To-School and their in-line negotiation event; one purchaser reported holding bids twice a year; one purchaser reported that bids are held every two to three years; and two purchasers reported holding online auctions when needed. Bid data were requested for the three largest purchases based on dollar value for 2011. Six purchasers provided usable bid data for sales of CLPSS (table V-11). Bid data are grouped by purchaser and include the initial and awarded bids. A total of 19 awarded bid contracts were reported for 2011, involving *** million pieces valued at $ *** million (in winning bid values).57 Of these contracts, *** percent of the value was awarded to U.S. producers, *** percent was awarded to Indian suppliers, and *** percent was awarded to nonsubject suppliers.58 However, based on the bid data reported, *** percent of the value of contracts that were awarded to foreign suppliers were actually arranged through U.S. producers with foreign suppliers. In particular, *** accounted for *** percent of the value of contracts
56 The number of purchasers that use auctions or bids as a method for making purchases has not significantly
changed since the original investigations. During the original investigations, nineteen of 26 purchasers reported that none or nearly none of their purchases since January 2003 were via auction or bid. One purchaser reported that 100 percent of its purchases were via a bid process; four reported that approximately 70 percent or more of their purchases in 2005 were via bid; and two reported that approximately 40 to 50 percent of their purchases were via bid. Certain Lined Paper School Supplies from China, India, and Indonesia, Inv. 701-TA-442-443 and 731-TA-1095-1097 (Final), USITC Publication 3884, September 2006. However, the types of auctions and bids have reportedly changed. According to Top Flight, while the use of live auctions and reverse auctions has decreased, “there are more multilevel bidding processes today than there were before.” Hearing transcript, p. 132 (Robinson). AASPS also noted that the breadth of products that are purchased via auctions has also increased, and is not used only for key products anymore. AASPS posthearing brief, p. 51.
57 Purchaser *** did not report its awarded bid values; however, its contract quantities were reported and are included in the total awarded bid contracts for 2011. Its awarded bid contracts accounted for *** percent of the quantity of total awarded bid contracts reported by purchasers for 2011.
58 Purchaser *** was unable to provide the country of origin of its purchased CLPSS, but indicated that all of its bids were awarded to ***.

V-9
awarded to nonsubject suppliers, *** accounted for *** percent of the contracts awarded to nonsubject suppliers, and *** accounted for *** percent of the value awarded to nonsubject suppliers. Table V-11 CLPSS: Bid information and sales to purchasers, 2011
* * * * * * *


APPENDIX A
FEDERAL REGISTER NOTICES AND THE COMMISSION’S STATEMENT ON ADEQUACY
A-1

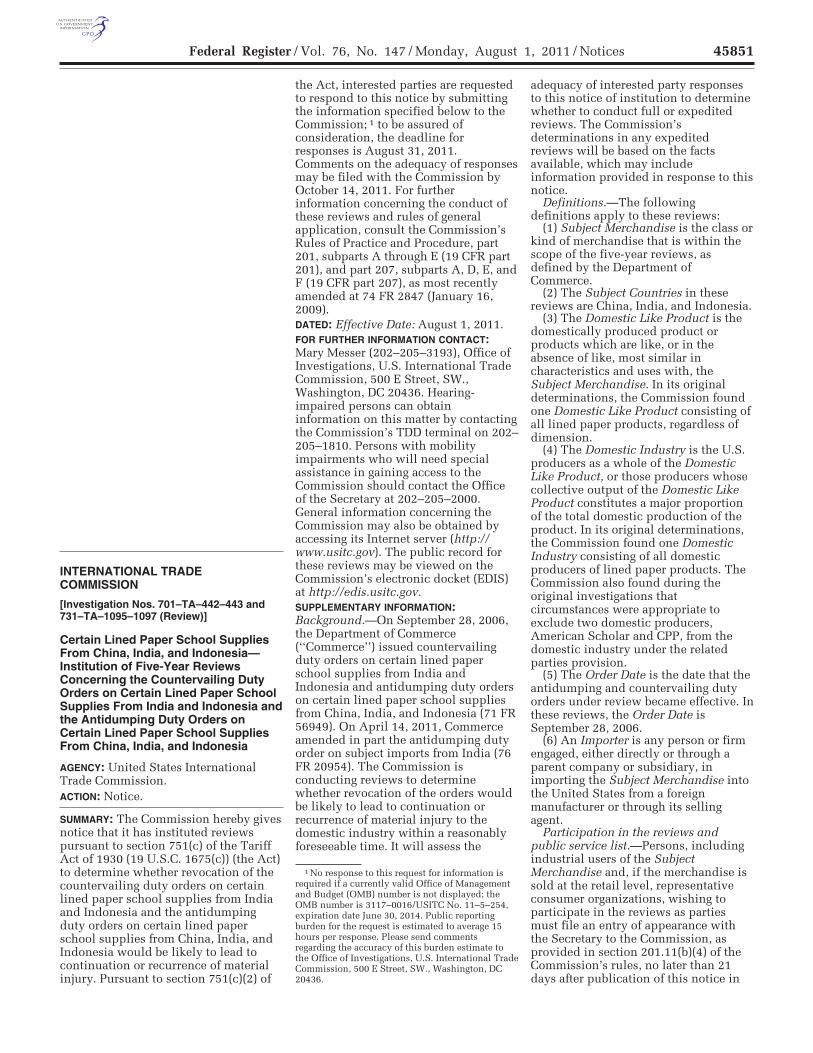
45851 Federal Register / Vol. 76, No. 147 / Monday, August 1, 2011 / Notices
1 No response to this request for information is required if a currently valid Office of Management and Budget (OMB) number is not displayed; the OMB number is 3117–0016/USITC No. 11–5–254, expiration date June 30, 2014. Public reporting burden for the request is estimated to average 15 hours per response. Please send comments regarding the accuracy of this burden estimate to the Office of Investigations, U.S. International Trade Commission, 500 E Street, SW., Washington, DC 20436.
secretary/fed_reg_notices/rules/ documents/ handbook_on_electronic_filing.pdf ). Persons with questions regarding electronic filing should contact the Secretary (202–205–2000).
Any person desiring to submit a document to the Commission in confidence must request confidential treatment. All such requests should be directed to the Secretary to the Commission and must include a full statement of the reasons why the Commission should grant such treatment. See 19 CFR 201.6. Documents for which confidential treatment by the Commission is properly sought will be treated accordingly. All nonconfidential written submissions will be available for public inspection at the Office of the Secretary.
This action is taken under the authority of section 337 of the Tariff Act of 1930, as amended (19 U.S.C. 1337), and of sections 201.10 and 210.50(a)(4) of the Commission’s Rules of Practice and Procedure (19 CFR 201.10, 210.50(a)(4)).
By order of the Commission. Issued: July 26, 2011.
James R. Holbein, Secretary to the Commission. [FR Doc. 2011–19355 Filed 7–29–11; 8:45 am]
BILLING CODE 7020–02–P
INTERNATIONAL TRADE COMMISSION
[Investigation Nos. 701–TA–442–443 and 731–TA–1095–1097 (Review)]
Certain Lined Paper School Supplies From China, India, and Indonesia— Institution of Five-Year Reviews Concerning the Countervailing Duty Orders on Certain Lined Paper School Supplies From India and Indonesia and the Antidumping Duty Orders on Certain Lined Paper School Supplies From China, India, and Indonesia
AGENCY: United States International Trade Commission. ACTION: Notice.
SUMMARY: The Commission hereby gives notice that it has instituted reviews pursuant to section 751(c) of the Tariff Act of 1930 (19 U.S.C. 1675(c)) (the Act) to determine whether revocation of the countervailing duty orders on certain lined paper school supplies from India and Indonesia and the antidumping duty orders on certain lined paper school supplies from China, India, and Indonesia would be likely to lead to continuation or recurrence of material injury. Pursuant to section 751(c)(2) of
the Act, interested parties are requested to respond to this notice by submitting the information specified below to the Commission; 1 to be assured of consideration, the deadline for responses is August 31, 2011. Comments on the adequacy of responses may be filed with the Commission by October 14, 2011. For further information concerning the conduct of these reviews and rules of general application, consult the Commission’s Rules of Practice and Procedure, part 201, subparts A through E (19 CFR part 201), and part 207, subparts A, D, E, and F (19 CFR part 207), as most recently amended at 74 FR 2847 (January 16, 2009). DATED: Effective Date: August 1, 2011. FOR FURTHER INFORMATION CONTACT: Mary Messer (202–205–3193), Office of Investigations, U.S. International Trade Commission, 500 E Street, SW., Washington, DC 20436. Hearing- impaired persons can obtain information on this matter by contacting the Commission’s TDD terminal on 202– 205–1810. Persons with mobility impairments who will need special assistance in gaining access to the Commission should contact the Office of the Secretary at 202–205–2000. General information concerning the Commission may also be obtained by accessing its Internet server (http:// www.usitc.gov). The public record for these reviews may be viewed on the Commission’s electronic docket (EDIS) at http://edis.usitc.gov. SUPPLEMENTARY INFORMATION: Background.—On September 28, 2006, the Department of Commerce (‘‘Commerce’’) issued countervailing duty orders on certain lined paper school supplies from India and Indonesia and antidumping duty orders on certain lined paper school supplies from China, India, and Indonesia (71 FR 56949). On April 14, 2011, Commerce amended in part the antidumping duty order on subject imports from India (76 FR 20954). The Commission is conducting reviews to determine whether revocation of the orders would be likely to lead to continuation or recurrence of material injury to the domestic industry within a reasonably foreseeable time. It will assess the
adequacy of interested party responses to this notice of institution to determine whether to conduct full or expedited reviews. The Commission’s determinations in any expedited reviews will be based on the facts available, which may include information provided in response to this notice.
Definitions.—The following definitions apply to these reviews:
(1) Subject Merchandise is the class or kind of merchandise that is within the scope of the five-year reviews, as defined by the Department of Commerce.
(2) The Subject Countries in these reviews are China, India, and Indonesia.
(3) The Domestic Like Product is the domestically produced product or products which are like, or in the absence of like, most similar in characteristics and uses with, the Subject Merchandise. In its original determinations, the Commission found one Domestic Like Product consisting of all lined paper products, regardless of dimension.
(4) The Domestic Industry is the U.S. producers as a whole of the Domestic Like Product, or those producers whose collective output of the Domestic Like Product constitutes a major proportion of the total domestic production of the product. In its original determinations, the Commission found one Domestic Industry consisting of all domestic producers of lined paper products. The Commission also found during the original investigations that circumstances were appropriate to exclude two domestic producers, American Scholar and CPP, from the domestic industry under the related parties provision.
(5) The Order Date is the date that the antidumping and countervailing duty orders under review became effective. In these reviews, the Order Date is September 28, 2006.
(6) An Importer is any person or firm engaged, either directly or through a parent company or subsidiary, in importing the Subject Merchandise into the United States from a foreign manufacturer or through its selling agent.
Participation in the reviews and public service list.—Persons, including industrial users of the Subject Merchandise and, if the merchandise is sold at the retail level, representative consumer organizations, wishing to participate in the reviews as parties must file an entry of appearance with the Secretary to the Commission, as provided in section 201.11(b)(4) of the Commission’s rules, no later than 21 days after publication of this notice in
VerDate Mar<15>2010 17:45 Jul 29, 2011 Jkt 223001 PO 00000 Frm 00095 Fmt 4703 Sfmt 4703 E:\FR\FM\01AUN1.SGM 01AUN1srob
inso
n on
DS
K4S
PT
VN
1PR
OD
with
NO
TIC
ES

45852 Federal Register / Vol. 76, No. 147 / Monday, August 1, 2011 / Notices
the Federal Register. The Secretary will maintain a public service list containing the names and addresses of all persons, or their representatives, who are parties to the reviews.
Former Commission employees who are seeking to appear in Commission five-year reviews are advised that they may appear in a review even if they participated personally and substantially in the corresponding underlying original investigation. The Commission’s designated agency ethics official has advised that a five-year review is not considered the ‘‘same particular matter’’ as the corresponding underlying original investigation for purposes of 18 U.S.C. 207, the post employment statute for Federal employees, and Commission rule 201.15(b) (19 CFR 201.15(b)), 73 FR 24609 (May 5, 2008). This advice was developed in consultation with the Office of Government Ethics. Consequently, former employees are not required to seek Commission approval to appear in a review under Commission rule 19 CFR 201.15, even if the corresponding underlying original investigation was pending when they were Commission employees. For further ethics advice on this matter, contact Carol McCue Verratti, Deputy Agency Ethics Official, at 202–205– 3088.
Limited disclosure of business proprietary information (BPI) under an administrative protective order (APO) and APO service list.—Pursuant to section 207.7(a) of the Commission’s rules, the Secretary will make BPI submitted in these reviews available to authorized applicants under the APO issued in the reviews, provided that the application is made no later than 21 days after publication of this notice in the Federal Register. Authorized applicants must represent interested parties, as defined in 19 U.S.C. 1677(9), who are parties to the reviews. A separate service list will be maintained by the Secretary for those parties authorized to receive BPI under the APO.
Certification.—Pursuant to section 207.3 of the Commission’s rules, any person submitting information to the Commission in connection with these reviews must certify that the information is accurate and complete to the best of the submitter’s knowledge. In making the certification, the submitter will be deemed to consent, unless otherwise specified, for the Commission, its employees, and contract personnel to use the information provided in any other reviews or investigations of the same or comparable products which the
Commission conducts under Title VII of the Act, or in internal audits and investigations relating to the programs and operations of the Commission pursuant to 5 U.S.C. Appendix 3.
Written submissions.—Pursuant to section 207.61 of the Commission’s rules, each interested party response to this notice must provide the information specified below. The deadline for filing such responses is August 31, 2011. Pursuant to section 207.62(b) of the Commission’s rules, eligible parties (as specified in Commission rule 207.62(b)(1)) may also file comments concerning the adequacy of responses to the notice of institution and whether the Commission should conduct expedited or full reviews. The deadline for filing such comments is October 14, 2011. All written submissions must conform with the provisions of sections 201.8 and 207.3 of the Commission’s rules and any submissions that contain BPI must also conform with the requirements of sections 201.6 and 207.7 of the Commission’s rules. The Commission’s rules do not authorize filing of submissions with the Secretary by facsimile or electronic means, except to the extent permitted by section 201.8 of the Commission’s rules, as amended, 67 FR 68036 (November 8, 2002). Also, in accordance with sections 201.16(c) and 207.3 of the Commission’s rules, each document filed by a party to the reviews must be served on all other parties to the reviews (as identified by either the public or APO service list as appropriate), and a certificate of service must accompany the document (if you are not a party to the reviews you do not need to serve your response).
Inability to provide requested information.—Pursuant to section 207.61(c) of the Commission’s rules, any interested party that cannot furnish the information requested by this notice in the requested form and manner shall notify the Commission at the earliest possible time, provide a full explanation of why it cannot provide the requested information, and indicate alternative forms in which it can provide equivalent information. If an interested party does not provide this notification (or the Commission finds the explanation provided in the notification inadequate) and fails to provide a complete response to this notice, the Commission may take an adverse inference against the party pursuant to section 776(b) of the Act in making its determinations in the reviews.
INFORMATION TO BE PROVIDED IN RESPONSE TO THIS NOTICE OF INSTITUTION: If you are a domestic producer, union/worker group, or trade/ business association; import/export
Subject Merchandise from more than one Subject Country; or produce Subject Merchandise in more than one Subject Country, you may file a single response. If you do so, please ensure that your response to each question includes the information requested for each pertinent Subject Country. As used below, the term ‘‘firm’’ includes any related firms.
(1) The name and address of your firm or entity (including World Wide Web address) and name, telephone number, fax number, and E-mail address of the certifying official.
(2) A statement indicating whether your firm/entity is a U.S. producer of the Domestic Like Product, a U.S. union or worker group, a U.S. importer of the Subject Merchandise, a foreign producer or exporter of the Subject Merchandise, a U.S. or foreign trade or business association, or another interested party (including an explanation). If you are a union/worker group or trade/business association, identify the firms in which your workers are employed or which are members of your association.
(3) A statement indicating whether your firm/entity is willing to participate in these reviews by providing information requested by the Commission.
(4) A statement of the likely effects of the revocation of the antidumping and countervailing duty orders on the Domestic Industry in general and/or your firm/entity specifically. In your response, please discuss the various factors specified in section 752(a) of the Act (19 U.S.C. § 1675a(a)) including the likely volume of subject imports, likely price effects of subject imports, and likely impact of imports of Subject Merchandise on the Domestic Industry.
(5) A list of all known and currently operating U.S. producers of the Domestic Like Product. Identify any known related parties and the nature of the relationship as defined in section 771(4)(B) of the Act (19 U.S.C. 1677(4)(B)).
(6) A list of all known and currently operating U.S. importers of the Subject Merchandise and producers of the Subject Merchandise in each Subject Country that currently export or have exported Subject Merchandise to the United States or other countries since the Order Date.
(7) A list of 3–5 leading purchasers in the U.S. market for the Domestic Like Product and the Subject Merchandise (including street address, World Wide Web address, and the name, telephone number, fax number, and E-mail address of a responsible official at each firm).
(8) A list of known sources of information on national or regional prices for the Domestic Like Product or
VerDate Mar<15>2010 17:45 Jul 29, 2011 Jkt 223001 PO 00000 Frm 00096 Fmt 4703 Sfmt 4703 E:\FR\FM\01AUN1.SGM 01AUN1srob
inso
n on
DS
K4S
PT
VN
1PR
OD
with
NO
TIC
ES

45853 Federal Register / Vol. 76, No. 147 / Monday, August 1, 2011 / Notices
the Subject Merchandise in the U.S. or other markets.
(9) If you are a U.S. producer of the Domestic Like Product, provide the following information on your firm’s operations on that product during calendar year 2010, except as noted (report quantity data in pieces and value data in U.S. dollars, f.o.b. plant). If you are a union/worker group or trade/ business association, provide the information, on an aggregate basis, for the firms in which your workers are employed/which are members of your association.
(a) Production (quantity) and, if known, an estimate of the percentage of total U.S. production of the Domestic Like Product accounted for by your firm’s(s’) production;
(b) Capacity (quantity) of your firm to produce the Domestic Like Product (i.e., the level of production that your establishment(s) could reasonably have expected to attain during the year, assuming normal operating conditions (using equipment and machinery in place and ready to operate), normal operating levels (hours per week/weeks per year), time for downtime, maintenance, repair, and cleanup, and a typical or representative product mix);
(c) the quantity and value of U.S. commercial shipments of the Domestic Like Product produced in your U.S. plant(s);
(d) the quantity and value of U.S. internal consumption/company transfers of the Domestic Like Product produced in your U.S. plant(s); and
(e) the value of (i) net sales, (ii) cost of goods sold (COGS), (iii) gross profit, (iv) selling, general and administrative (SG&A) expenses, and (v) operating income of the Domestic Like Product produced in your U.S. plant(s) (include both U.S. and export commercial sales, internal consumption, and company transfers) for your most recently completed fiscal year (identify the date on which your fiscal year ends).
(10) If you are a U.S. importer or a trade/business association of U.S. importers of the Subject Merchandise from the Subject Country(ies), provide the following information on your firm’s(s’) operations on that product during calendar year 2010 (report quantity data in pieces and value data in U.S. dollars). If you are a trade/ business association, provide the information, on an aggregate basis, for the firms which are members of your association.
(a) The quantity and value (landed, duty-paid but not including antidumping or countervailing duties) of U.S. imports and, if known, an estimate of the percentage of total U.S.
imports of Subject Merchandise from each Subject Country accounted for by your firm’s(s’) imports;
(b) the quantity and value (f.o.b. U.S. port, including antidumping and/or countervailing duties) of U.S. commercial shipments of Subject Merchandise imported from each Subject Country; and
(c) the quantity and value (f.o.b. U.S. port, including antidumping and/or countervailing duties) of U.S. internal consumption/company transfers of Subject Merchandise imported from each Subject Country.
(11) If you are a producer, an exporter, or a trade/business association of producers or exporters of the Subject Merchandise in the Subject Country(ies), provide the following information on your firm’s(s’) operations on that product during calendar year 2010 (report quantity data in pieces and value data in U.S. dollars, landed and duty-paid at the U.S. port but not including antidumping or countervailing duties). If you are a trade/business association, provide the information, on an aggregate basis, for the firms which are members of your association.
(a) Production (quantity) and, if known, an estimate of the percentage of total production of Subject Merchandise in each Subject Country accounted for by your firm’s(s’) production;
(b) Capacity (quantity) of your firm to produce the Subject Merchandise in each Subject Country (i.e., the level of production that your establishment(s) could reasonably have expected to attain during the year, assuming normal operating conditions (using equipment and machinery in place and ready to operate), normal operating levels (hours per week/weeks per year), time for downtime, maintenance, repair, and cleanup, and a typical or representative product mix); and
(c) the quantity and value of your firm’s(s’) exports to the United States of Subject Merchandise and, if known, an estimate of the percentage of total exports to the United States of Subject Merchandise from each Subject Country accounted for by your firm’s(s’) exports.
(12) Identify significant changes, if any, in the supply and demand conditions or business cycle for the Domestic Like Product that have occurred in the United States or in the market for the Subject Merchandise in the Subject Country(ies) since the Order Date, and significant changes, if any, that are likely to occur within a reasonably foreseeable time. Supply conditions to consider include technology; production methods; development efforts; ability to increase
production (including the shift of production facilities used for other products and the use, cost, or availability of major inputs into production); and factors related to the ability to shift supply among different national markets (including barriers to importation in foreign markets or changes in market demand abroad). Demand conditions to consider include end uses and applications; the existence and availability of substitute products; and the level of competition among the Domestic Like Product produced in the United States, Subject Merchandise produced in the Subject Country(ies), and such merchandise from other countries.
(13) (OPTIONAL) A statement of whether you agree with the above definitions of the Domestic Like Product and Domestic Industry; if you disagree with either or both of these definitions, please explain why and provide alternative definitions.
Authority: This review is being conducted under authority of title VII of the Tariff Act of 1930; this notice is published pursuant to section 207.61 of the Commission’s rules.
By order of the Commission. Issued: July 26, 2011.
James R. Holbein, Secretary to the Commission. [FR Doc. 2011–19314 Filed 7–29–11; 8:45 am]
BILLING CODE 7020–02–P
INTERNATIONAL TRADE COMMISSION
[Investigation Nos. 731–TA–344 and 391A– 393A (Third Review)]
Certain Bearings From China, France, Germany, and Italy; Institution of Five- Year Reviews Concerning the Antidumping Duty Orders on Certain Bearings From China, France, Germany, and Italy
AGENCY: United States International Trade Commission.
ACTION: Notice.
SUMMARY: The Commission hereby gives notice that it has instituted reviews pursuant to section 751(c) of the Tariff Act of 1930 (19 U.S.C. 1675(c)) (the Act) to determine whether revocation of the antidumping duty orders on certain bearings from China, France, Germany, and Italy would be likely to lead to continuation or recurrence of material injury. Pursuant to section 751(c)(2) of the Act, interested parties are requested to respond to this notice by submitting the information specified below to the
VerDate Mar<15>2010 17:45 Jul 29, 2011 Jkt 223001 PO 00000 Frm 00097 Fmt 4703 Sfmt 4703 E:\FR\FM\01AUN1.SGM 01AUN1srob
inso
n on
DS
K4S
PT
VN
1PR
OD
with
NO
TIC
ES

45778 Federal Register / Vol. 76, No. 147 / Monday, August 1, 2011 / Notices
1 See July 14, 2011, memorandum to the file, regarding ‘‘U.S. Customs and Border Protection Data.’’
Department received a NSR request from GGB Bearing Technology (Suzhou) Co., Ltd. (‘‘GGB’’). GGB’s request was made in June 2011, which is the anniversary month of the Order. See 19 CFR 351.214(d).
In its submission, GGB certified that it is the exporter and producer of the subject merchandise upon which the request was based. Pursuant to section 751(a)(2)(B)(i)(I) of the Act and 19 CFR 351.214(b)(2)(i), GGB certified that it did not export TRBs to the United States during the period of investigation (‘‘POI’’). In addition, pursuant to section 751(a)(2)(B)(i)(II) of the Act and 19 CFR 351.214(b)(2)(iii)(A), GGB certified that, since the initiation of the investigation, it has not been affiliated with a PRC exporter or producer who exported TRBs to the United States during the POI, including those not individually examined during the investigation. As required by 19 CFR 351.214(b)(2)(iii)(B), GGB also certified that its export activities were not controlled by the central government of the PRC.
In addition to the certifications described above, pursuant to 19 CFR 351.214(b)(2)(iv), GGB submitted documentation establishing the following: (1) The date on which GGB first shipped TRBs for export to the United States and the date on which the TRBs were first entered, or withdrawn from warehouse, for consumption; (2) the volume of its first shipment; and (3) the date of its first sale to an unaffiliated customer in the United States.
The Department conducted U.S. Customs and Border Protection (‘‘CBP’’) database queries in an attempt to confirm that GGB’s shipments of subject merchandise had entered the United States for consumption and that liquidation of such entries had been properly suspended for antidumping duties. The Department also examined whether the CBP data confirmed that such entries were made during the NSR POR.1 The information which the Department examined was consistent with that provided by GGB in its request. See Memorandum to the File titled ‘‘Initiation of Antidumping New Shipper Review: Tapered Roller Bearings and Parts Thereof, Finished and Unfinished, from the People’s Republic of China, A–570–601,’’ (‘‘Initiation Checklist’’) dated concurrently with this notice.
Period of Review In accordance with 19 CFR
351.214(g)(1)(i)(A), the POR for a NSR
initiated in the month immediately following the anniversary month will be the twelve-month period immediately preceding the anniversary month. Therefore, the POR for this NSR is June 1, 2010, through May 31, 2011. The sales and entries into the United States of subject merchandise produced and exported by GGB occurred during this twelve-month POR.
Initiation of New Shipper Review Pursuant to section 751(a)(2)(B) of the
Act and 19 CFR 351.214(b), the Department finds that the request submitted by GGB meets the threshold requirements for initiation of a NSR for the shipment of TRBs from the PRC produced and exported by GGB. See Initiation Checklist. However, if the information supplied by GGB is later found to be incorrect or insufficient during the course of this proceeding, the Department may rescind the review or apply adverse facts available pursuant to section 776 of the Act, depending upon the facts on record. The Department intends to issue the preliminary results of this NSR no later than 180 days from the date of initiation, and the final results no later than 90 days from the issuance of the preliminary results. See section 751(a)(2)(B)(iv) of the Act.
It is the Department’s usual practice, in cases involving non-market economies, to require that a company seeking to establish eligibility for an antidumping duty rate separate from the country-wide rate provide evidence of de jure and de facto absence of government control over the company’s export activities. Accordingly, the Department will issue a questionnaire to GGB which will include a section requesting information with regard to GGB’s export activities for separate rates purposes. The review will proceed if the response provides sufficient indication that GGB is not subject to either de jure or de facto government control with respect to its export of subject merchandise.
The Department will instruct CBP to allow, at the option of the importer, the posting, until the completion of the review, of a bond or security in lieu of a cash deposit for each entry of the subject merchandise from GGB in accordance with section 751(a)(2)(B)(iii) of the Act and 19 CFR 351.214(e). Because GGB certified that it produced and exported the subject merchandise, the Department will apply the bonding privilege to GGB for all subject merchandise produced and exported by GGB.
To assist in its analysis of the bona fides of GGB’s sales, upon initiation of
this new shipper review, the Department will require GGB to submit on an ongoing basis complete transaction information concerning any sales of subject merchandise to the United States that were made subsequent to the POR.
Interested parties requiring access to proprietary information in this NSR should submit applications for disclosure under administrative protective order in accordance with 19 CFR 351.305 and 19 CFR 351.306. This initiation and notice are in accordance with section 751(a)(2)(B) of the Act and 19 CFR 351.214 and 19 CFR 351.221(c)(1)(i).
Dated: July 27, 2011. Christian Marsh, Deputy Assistant Secretary for Antidumping and Countervailing Duty Operations. [FR Doc. 2011–19407 Filed 7–29–11; 8:45 am]
BILLING CODE 3510–DS–P
DEPARTMENT OF COMMERCE
International Trade Administration
Initiation of Five-Year (‘‘Sunset’’) Review
AGENCY: Import Administration, International Trade Administration, Department of Commerce. SUMMARY: In accordance with section 751(c) of the Tariff Act of 1930, as amended (‘‘the Act’’), the Department of Commerce (‘‘the Department’’) is automatically initiating a five-year review (‘‘Sunset Review’’) of the antidumping and countervailing duty orders listed below. The International Trade Commission (‘‘the Commission’’) is publishing concurrently with this notice its notice of Institution of Five- Year Review which covers the same orders.
DATES: Effective Date: August 1, 2011. FOR FURTHER INFORMATION CONTACT: The Department official identified in the Initiation of Review section below at AD/CVD Operations, Import Administration, International Trade Administration, U.S. Department of Commerce, 14th Street and Constitution Avenue, NW., Washington, DC 20230. For information from the Commission contact Mary Messer, Office of Investigations, U.S. International Trade Commission at (202) 205–3193. SUPPLEMENTARY INFORMATION:
Background
The Department’s procedures for the conduct of Sunset Reviews are set forth in its Procedures for Conducting Five- Year (‘‘Sunset’’) Reviews of
VerDate Mar<15>2010 17:45 Jul 29, 2011 Jkt 223001 PO 00000 Frm 00022 Fmt 4703 Sfmt 4703 E:\FR\FM\01AUN1.SGM 01AUN1srob
inso
n on
DS
K4S
PT
VN
1PR
OD
with
NO
TIC
ES

45779 Federal Register / Vol. 76, No. 147 / Monday, August 1, 2011 / Notices
Antidumping and Countervailing Duty Orders, 63 FR 13516 (March 20, 1998) and 70 FR 62061 (October 28, 2005). Guidance on methodological or analytical issues relevant to the Department’s conduct of Sunset
Reviews is set forth in the Department’s Policy Bulletin 98.3—Policies Regarding the Conduct of Five-Year (‘‘Sunset’’) Reviews of Antidumping and Countervailing Duty Orders: Policy Bulletin, 63 FR 18871 (April 16, 1998).
Initiation of Review
In accordance with 19 CFR 351.218(c), we are initiating the Sunset Review of the following antidumping and countervailing duty orders:
DOC Case No. ITC Case No. Country Product Department Contact
A–570–601 ........ 731–TA–344 PRC .................. Tapered Roller Bearings and Parts Thereof, Fin-ished and Unfinished (3rd Review).
Julia Hancock, (202) 482–1394.
A–570–828 ........ 731–TA–672 PRC .................. Silicomanganese (3rd Review) ................................ Julia Hancock, (202) 482–1394. A–351–824 ........ 731–TA–671 Brazil ................. Silicomanganese (3rd Review) ................................ Dana Mermelstein, (202) 482–
1391. A–823–805 ........ 731–TA–673 Ukraine .............. Silicomanganese (3rd Review) ................................ Dana Mermelstein, (202) 482–
1391. A–427–801 ........ 731–TA–392–A France ............... Ball Bearings and Parts Thereof (3rd Review) ....... Dana Mermelstein, (202) 482–
1391. A–428–801 ........ 731–TA–391–A Germany ........... Ball Bearings and Parts Thereof (3rd Review) ....... Dana Mermelstein, (202) 482–
1391. A–475–801 ........ 731–TA–393–A Italy ................... Ball Bearings and Parts Thereof (3rd Review) ....... Dana Mermelstein, (202) 482–
1391. A–588–804 ........ 731–TA–394–A Japan ................ Ball Bearings and Parts Thereof (3rd Review) ....... Dana Mermelstein, (202) 482–
1391. A–412–801 ........ 731–TA–399–A United Kingdom Ball Bearings and Parts Thereof (3rd Review) ....... Dana Mermelstein, (202) 482–
1391. A–570–901 ........ 731–TA–1095 PRC .................. Lined Paper Products (a.k.a. Lined Paper School
Supplies).David Goldberger, (202) 482–
4136. A–533–843 ........ 731–TA–1096 India .................. Lined Paper Products (a.k.a. Lined Paper School
Supplies).David Goldberger, (202) 482–
4136. A–560–818 ........ 731–TA–1097 Indonesia .......... Lined Paper Products (a.k.a. Lined Paper School
Supplies).David Goldberger, (202) 482–
4136. C–533–844 ........ 731–TA–442 India .................. Lined Paper Products (a.k.a. Lined Paper School
Supplies).David Goldberger, (202) 482–
4136. C–560–819 ........ 731–TA–443 Indonesia .......... Lined Paper Products (a.k.a. Lined Paper School
Supplies).David Goldberger, (202) 482–
4136.
Filing Information
As a courtesy, we are making information related to Sunset proceedings, including copies of the pertinent statute and Department’s regulations, the Department schedule for Sunset Reviews, a listing of past revocations and continuations, and current service lists, available to the public on the Department’s Internet Web site at the following address: http://ia.ita.doc.gov/sunset/. All submissions in these Sunset Reviews must be filed in accordance with the Department’s regulations regarding format, translation, and service of documents. These rules can be found at 19 CFR 351.303.
This notice serves as a reminder that any party submitting factual information in an AD/CVD proceeding must certify to the accuracy and completeness of that information. See section 782(b) of the Act. Parties are hereby reminded that revised certification requirements are in effect for company/government officials as well as their representatives in all AD/CVD investigations or proceedings initiated on or after March 14, 2011. See Certification of Factual Information to Import Administration During Antidumping and Countervailing Duty
Proceedings: Interim Final Rule, 76 FR 7491 (February 10, 2011) (‘‘Interim Final Rule’’) amending 19 CFR 351.303(g)(1) and (2). The formats for the revised certifications are provided at the end of the Interim Final Rule. The Department intends to reject factual submissions in investigations/proceedings initiated on or after March 14, 2011 if the submitting party does not comply with the revised certification requirements.
Pursuant to 19 CFR 351.103(d), the Department will maintain and make available a service list for these proceedings. To facilitate the timely preparation of the service list(s), it is requested that those seeking recognition as interested parties to a proceeding contact the Department in writing within 10 days of the publication of the Notice of Initiation.
Because deadlines in Sunset Reviews can be very short, we urge interested parties to apply for access to proprietary information under administrative protective order (‘‘APO’’) immediately following publication in the Federal Register of this notice of initiation by filing a notice of intent to participate. The Department’s regulations on submission of proprietary information and eligibility to receive access to business proprietary information under
APO can be found at 19 CFR 351.304– 351.306.
Information Required From Interested Parties
Domestic interested parties defined in section 771(9)(C), (D), (E), (F), and (G) of the Act and 19 CFR 351.102(b) wishing to participate in a Sunset Review must respond not later than 15 days after the date of publication in the Federal Register of this notice of initiation by filing a notice of intent to participate. The required contents of the notice of intent to participate are set forth at 19 CFR 351.218(d)(1)(ii). In accordance with the Department’s regulations, if we do not receive a notice of intent to participate from at least one domestic interested party by the 15-day deadline, the Department will automatically revoke the order without further review. See 19 CFR 351.218(d)(1)(iii).
If we receive an order-specific notice of intent to participate from a domestic interested party, the Department’s regulations provide that all parties wishing to participate in the Sunset Review must file complete substantive responses not later than 30 days after the date of publication in the Federal Register of this notice of initiation. The required contents of a substantive
VerDate Mar<15>2010 17:45 Jul 29, 2011 Jkt 223001 PO 00000 Frm 00023 Fmt 4703 Sfmt 4703 E:\FR\FM\01AUN1.SGM 01AUN1srob
inso
n on
DS
K4S
PT
VN
1PR
OD
with
NO
TIC
ES

45780 Federal Register / Vol. 76, No. 147 / Monday, August 1, 2011 / Notices
1 In comments made on the interim final sunset regulations, a number of parties stated that the proposed five-day period for rebuttals to substantive responses to a notice of initiation was insufficient. This requirement was retained in the final sunset regulations at 19 CFR 351.218(d)(4). As provided in 19 CFR 351.302(b), however, the Department will consider individual requests to extend that five-day deadline based upon a showing of good cause.
response, on an order-specific basis, are set forth at 19 CFR 351.218(d)(3). Note that certain information requirements differ for respondent and domestic parties. Also, note that the Department’s information requirements are distinct from the Commission’s information requirements. Please consult the Department’s regulations for information regarding the Department’s conduct of Sunset Reviews.1 Please consult the Department’s regulations at 19 CFR part 351 for definitions of terms and for other general information concerning antidumping and countervailing duty proceedings at the Department.
This notice of initiation is being published in accordance with section 751(c) of the Act and 19 CFR 351.218 (c).
Dated: July 21, 2011. Christian Marsh, Deputy Assistant Secretary for Antidumping and Countervailing Duty Operations. [FR Doc. 2011–19402 Filed 7–29–11; 8:45 am]
BILLING CODE 3510–DS–P
DEPARTMENT OF COMMERCE
National Oceanic and Atmospheric Administration
RIN 0648–XA600
Notice of Availability for a Finding of No Significant Impact and Environmental Assessment for Emergency Restoration of Seagrass Impacts From the Deepwater Horizon Oil Spill Response
AGENCY: National Marine Fisheries Service (NMFS), National Oceanic and Atmospheric Administration (NOAA), Commerce. ACTION: Notice of availability; request for comments.
SUMMARY: Officials of the National Oceanic and Atmospheric Administration of the U.S. Department of Commerce (NOAA); U.S. Department of Interior; and the five states of Florida, Alabama, Mississippi, Louisiana and Texas are all designated, pursuant to section 1006(b) of the Oil Pollution Act of 1990 (OPA), as trustees (Trustees) for natural resources harmed by this
Incident. NOAA is serving as the Lead Administrative Trustee (LAT) for this emergency seagrass restoration. Under the National Environmental Policy Act, an Environmental Assessment for Emergency Restoration of Seagrass Impacts from the Deepwater Horizon Oil Spill Response (EA) was completed by NOAA, and a Finding of No Significant Impact (FONSI) was signed on July 8, 2011.
DATES: Comments on this EA and FONSI must be received by August 16, 2011. ADDRESSES: Submit comments to: Kay McGraw, NOAA Restoration Center, Rm 15862, 1315 East West Highway, Silver Spring, MD 20910; or electronically to [email protected].
FOR FURTHER INFORMATION CONTACT: Patricia A. Montanio, 301–427–8600. SUPPLEMENTARY INFORMATION: The purpose of this project is to address injuries to seagrass beds that resulted from Deepwater Horizon (DWH) oil spill response activities. The injuries were caused by motorized boats, and included propeller scars, blowholes from response vessels, and scouring from boom curtains and anchor tethers. The proposed action will restore damaged seagrass beds and decrease risk of secondary injury to nearby seagrass communities. The environmental review process led NOAA to conclude that this action will not have a significant effect on the human environment, therefore an environmental impact statement will not be prepared.
Section 990.26(d) of OPA requires the Trustees to provide notice to the public, to the extent practicable, of any planned emergency restoration actions. Trustees must also provide public notice of the justification for, nature and extent of, and results of emergency restoration actions within a reasonable time frame. NOAA is expediting regulatory clearance of this action due to the emergency nature of it. The Trustees believe the best method to address this requirement is to post a copy of the FONSI and EA on NOAA’s Deepwater Horizon Web site at http:// www.gulfspillrestoration.noaa.gov/. The documents will be available there on August 1, 2011.
NOAA believes it is important to undertake the restoration immediately in order to minimize the possibility of further adverse sea grass impacts that may occur in the absence of immediate action, such as secondary damage that may result from storms or other events. NOAA will accept public comments on this EA and FONSI until August 16,
2011. All comments will be fully considered and included in the administrative record for this action.
Dated: July 26, 2011. Brian Pawlak, Acting Director, Office of Habitat Conservation, National Marine Fisheries Service. [FR Doc. 2011–19403 Filed 7–29–11; 8:45 am]
BILLING CODE 3510–22–P
DEPARTMENT OF COMMERCE
National Oceanic and Atmospheric Administration
RIN 0648–XA609
South Atlantic Fishery Management Council; Public Hearings
AGENCY: Commerce, National Oceanic and Atmospheric Administration, National Marine Fisheries Service (NMFS). ACTION: Notice of Public Hearing Series. SUMMARY: The South Atlantic Fishery Management Council (Council) will hold a series of public hearings regarding Amendment 24 to the Snapper Grouper Fishery Management Plan (FMP) for the South Atlantic Region. See SUPPLEMENTARY INFORMATION for the public hearings schedule. DATES: The series of four public hearings will be held August 22, 2011 through August 25, 2011. The hearings will be held from 5 p.m. until 7 p.m. Council staff will present an overview of the amendment and will be available for informal discussions and to answer questions. Members of the public will have an opportunity to go on record at any time during the meeting hours to record their comments on the public hearing topics for consideration by the Council. Local Council representatives will attend the meetings and take public comment. Written comments will be accepted from August 12, 2011 until 5 p.m. on September 1, 2011. See SUPPLEMENTARY INFORMATION. ADDRESSES: Written comments should be sent to Bob Mahood, Executive Director, South Atlantic Fishery Management Council, 4055 Faber Place Drive, Suite 201, North Charleston, SC 29405, or via e-mail to: [email protected] for Amendment 24 to the Snapper Grouper FMP. Written comments will be received from August 12, 2011 until 5 p.m. on September 1, 2011.
Copies of the public hearing documents are available by contacting Kim Iverson, Public Information Officer,
VerDate Mar<15>2010 17:45 Jul 29, 2011 Jkt 223001 PO 00000 Frm 00024 Fmt 4703 Sfmt 4703 E:\FR\FM\01AUN1.SGM 01AUN1srob
inso
n on
DS
K4S
PT
VN
1PR
OD
with
NO
TIC
ES

72213 Federal Register / Vol. 76, No. 225 / Tuesday, November 22, 2011 / Notices
1 Chairman Deanna Tanner Okun did not participate.
2 Commissioner Charlotte R. Lane dissented from the majority, instead finding that the respondent interested party group response was inadequate and determining to proceed to an expedited review.
the Tariff Act of 1930 (19 U.S.C. 1675(c)(5)) to determine whether revocation of the antidumping duty orders on silicomanganese from Brazil, China, and Ukraine would be likely to lead to continuation or recurrence of material injury within a reasonably foreseeable time. A schedule for the reviews will be established and announced at a later date. For further information concerning the conduct of these reviews and rules of general application, consult the Commission’s Rules of Practice and Procedure, part 201, subparts A through E (19 CFR part 201), and part 207, subparts A, D, E, and F (19 CFR part 207), as amended, 76 FR 61937 (October 6, 2011). DATES: Effective Date: November 4, 2011. FOR FURTHER INFORMATION CONTACT: Mary Messer ((202) 205–3193), Office of Investigations, U.S. International Trade Commission, 500 E Street SW., Washington, DC 20436. Hearing- impaired persons can obtain information on this matter by contacting the Commission’s TDD terminal on (202) 205–1810. Persons with mobility impairments who will need special assistance in gaining access to the Commission should contact the Office of the Secretary at (202) 205–2000. General information concerning the Commission may also be obtained by accessing its Internet server (http:// www.usitc.gov). The public record for these reviews may be viewed on the Commission’s electronic docket (EDIS) at http://edis.usitc.gov. SUPPLEMENTARY INFORMATION: On November 4, 2011, the Commission determined that it should proceed to full reviews in the subject five-year reviews pursuant to section 751(c)(5) of the Act. The Commission found that the domestic interested party group response to its notice of institution (76 FR 45856, August 1, 2011) was adequate and that the respondent interested party group responses with respect to Brazil and Ukraine were adequate, and decided to conduct full reviews of the antidumping duty orders on silicomanganese from Brazil and Ukraine. The Commission found that the respondent interested party group response with respect to China was inadequate. However, the Commission determined to conduct a full review concerning the order on silicomanganese from China to promote administrative efficiency in light of its decision to conduct full reviews with respect to Brazil and Ukraine. A record of the Commissioners’ votes, the Commission’s statement on adequacy, and any individual Commissioner’s
statements will be available from the Office of the Secretary and at the Commission’s Web site.
Authority: These reviews are being conducted under authority of title VII of the Tariff Act of 1930; this notice is published pursuant to section 207.62 of the Commission’s rules.
By order of the Commission. Issued: November 16, 2011.
James R. Holbein, Secretary to the Commission. [FR Doc. 2011–30036 Filed 11–21–11; 8:45 am]
BILLING CODE 7020–02–P
INTERNATIONAL TRADE COMMISSION
[Investigation No. 731–TA–344 (Third Review)]
Tapered Roller Bearings From China; Notice of Commission determination To Conduct a Full Five-Year Review
AGENCY: United States International Trade Commission. ACTION: Notice
SUMMARY: The Commission hereby gives notice that it will proceed with a full review pursuant to section 751(c)(5) of the Tariff Act of 1930 (19 U.S.C. 1675(c)(5)) to determine whether revocation of the antidumping duty order on tapered roller bearings from China would be likely to lead to continuation or recurrence of material injury within a reasonably foreseeable time. A schedule for the review will be established and announced at a later date. For further information concerning the conduct of this review and rules of general application, consult the Commission’s Rules of Practice and Procedure, part 201, subparts A through E (19 CFR part 201), and part 207, subparts A, D, E, and F (19 CFR part 207), as amended, 76 FR 61937 (October 6, 2011). DATES: Effective Date: November 4, 2011. FOR FURTHER INFORMATION CONTACT: Mary Messer (202) 205–3193), Office of Investigations, U.S. International Trade Commission, 500 E Street SW., Washington, DC 20436. Hearing- impaired persons can obtain information on this matter by contacting the Commission’s TDD terminal on (202) 205–1810. Persons with mobility impairments who will need special assistance in gaining access to the Commission should contact the Office of the Secretary at (202) 205–2000. General information concerning the Commission may also be obtained by accessing its internet server (http://
www.usitc.gov). The public record for this review may be viewed on the Commission’s electronic docket (EDIS) at http://edis.usitc.gov. SUPPLEMENTARY INFORMATION: On November 4, 2011, the Commission determined that it should proceed to a full review in the subject five-year review pursuant to section 751(c)(5) of the Act.1 The Commission found that both the domestic and respondent interested party group responses to its notice of institution (76 FR 45853, August 1, 2011) were adequate.2 A record of the Commissioners’ votes, the Commission’s statement on adequacy, and any individual Commissioner’s statements will be available from the Office of the Secretary and at the Commission’s Web site.
Authority: This review is being conducted under authority of title VII of the Tariff Act of 1930; this notice is published pursuant to section 207.62 of the Commission’s rules.
By order of the Commission. Issued: November 16, 2011.
James R. Holbein, Secretary to the Commission. [FR Doc. 2011–30040 Filed 11–21–11; 8:45 am]
BILLING CODE 7020–02–P
INTERNATIONAL TRADE COMMISSION
[Investigation Nos. 701–TA–442–443 and 731–TA–1095–1097 (Review)]
Certain Lined Paper School Supplies From China, India, and Indonesia; Notice of Commission Determinations To Conduct Full Five-Year Reviews
AGENCY: United States International Trade Commission. ACTION: Notice.
SUMMARY: The Commission hereby gives notice that it will proceed with full reviews pursuant to section 751(c)(5) of the Tariff Act of 1930 (19 U.S.C. 1675(c)(5)) to determine whether revocation of the countervailing duty orders on certain lined paper school supplies from India and Indonesia and the antidumping duty orders on certain lined paper school supplies from China, India, and Indonesia would be likely to lead to continuation or recurrence of material injury within a reasonably foreseeable time. A schedule for the reviews will be established and announced at a later date. For further
VerDate Mar<15>2010 17:14 Nov 21, 2011 Jkt 226001 PO 00000 Frm 00055 Fmt 4703 Sfmt 4703 E:\FR\FM\22NON1.SGM 22NON1mst
ocks
till o
n D
SK
4VP
TV
N1P
RO
D w
ith N
OT
ICE
S

72214 Federal Register / Vol. 76, No. 225 / Tuesday, November 22, 2011 / Notices
1 Commissioner Charlotte R. Lane dissented, instead finding that the respondent interested party group response with respect to India was inadequate and determining to conduct expedited reviews of all orders concerning certain lined paper school supplies from China, India, and Indonesia.
information concerning the conduct of these reviews and rules of general application, consult the Commission’s Rules of Practice and Procedure, part 201, subparts A through E (19 CFR part 201), and part 207, subparts A, D, E, and F (19 CFR part 207), as amended, 76 FR 61937 (October 6, 2011). DATES: Effective Date: November 4, 2011. FOR FURTHER INFORMATION CONTACT: Mary Messer (202) 205–3193, Office of Investigations, U.S. International Trade Commission, 500 E Street SW., Washington, DC 20436. Hearing- impaired persons can obtain information on this matter by contacting the Commission’s TDD terminal on (202) 205–1810. Persons with mobility impairments who will need special assistance in gaining access to the Commission should contact the Office of the Secretary at (202) 205–2000. General information concerning the Commission may also be obtained by accessing its Internet server (http:// www.usitc.gov). The public record for these reviews may be viewed on the Commission’s electronic docket (EDIS) at http://edis.usitc.gov. SUPPLEMENTARY INFORMATION: On November 4, 2011, the Commission determined that it should proceed to full reviews in the subject five-year reviews pursuant to section 751(c)(5) of the Act. The Commission found that the domestic interested party group response to its notice of institution (76 FR 45851, August 1, 2011) was adequate and that the respondent interested party group response with respect to the orders on subject merchandise from India was adequate, and decided to conduct full reviews of the antidumping and countervailing duty orders on certain lined paper school supplies from India. The Commission found that the respondent interested party group responses with respect to the orders on subject merchandise from China and Indonesia were inadequate. However, the Commission determined to conduct full reviews concerning the orders on certain lined paper school supplies from China and Indonesia to promote administrative efficiency in light of its decision to conduct full reviews with respect to the orders on subject merchandise from India.1 A record of the Commissioners’ votes, the Commission’s statement on adequacy, and any individual Commissioner’s
statements will be available from the Office of the Secretary and at the Commission’s Web site.
Authority: These reviews are being conducted under authority of title VII of the Tariff Act of 1930; this notice is published pursuant to section 207.62 of the Commission’s rules.
By order of the Commission. Issued: November 16, 2011.
James R. Holbein, Secretary to the Commission. [FR Doc. 2011–30039 Filed 11–21–11; 8:45 am]
BILLING CODE 7020–02–P
INTERNATIONAL TRADE COMMISSION
[DN 2855]
Certain Semiconductor Chips with DRAM Circuitry, and Modules and Products Containing Same Receipt of Complaint; Solicitation of Comments Relating to the Public Interest
AGENCY: U.S. International Trade Commission. ACTION: Notice.
SUMMARY: Notice is hereby given that the U.S. International Trade Commission has received a complaint entitled In Re Certain Semiconductor Chips with DRAM Circuitry, and Modules and Products Containing Same, DN 2855; the Commission is soliciting comments on any public interest issues raised by the complaint. FOR FURTHER INFORMATION CONTACT: James R. Holbein, Secretary to the Commission, U.S. International Trade Commission, 500 E Street SW., Washington, DC 20436, telephone (202) 205–2000. The public version of the complaint can be accessed on the Commission’s electronic docket (EDIS) at http://edis.usitc.gov, and will be available for inspection during official business hours (8:45 a.m. to 5:15 p.m.) in the Office of the Secretary, U.S. International Trade Commission, 500 E Street SW., Washington, DC 20436, telephone (202) 205–2000.
General information concerning the Commission may also be obtained by accessing its Internet server (http:// www.usitc.gov). The public record for this investigation may be viewed on the Commission’s electronic docket (EDIS) at http://edis.usitc.gov. Hearing- impaired persons are advised that information on this matter can be obtained by contacting the Commission’s TDD terminal on (202) 205–1810. SUPPLEMENTARY INFORMATION: The Commission has received a complaint
filed on behalf of Elpida Memory, Inc. and Elpida Memory (USA) Inc. on November 15, 2011. The complaint alleges violations of section 337 of the Tariff Act of 1930 (19 U.S.C. 1337) in the importation into the United States, the sale for importation, and the sale within the United States after importation of certain semiconductor chips with dram circuitry, and modules and products containing same. The complaint names Nanya Technology Corporation of Taiwan and Nanya Technology Corporation, U.S.A. of Santa Clara, CA, as respondents.
The complainant, proposed respondents, other interested parties, and members of the public are invited to file comments, not to exceed five pages in length, on any public interest issues raised by the complaint. Comments should address whether issuance of an exclusion order and/or a cease and desist order in this investigation would negatively affect the public health and welfare in the United States, competitive conditions in the United States economy, the production of like or directly competitive articles in the United States, or United States consumers.
In particular, the Commission is interested in comments that:
(i) Explain how the articles potentially subject to the orders are used in the United States;
(ii) Identify any public health, safety, or welfare concerns in the United States relating to the potential orders;
(iii) Indicate the extent to which like or directly competitive articles are produced in the United States or are otherwise available in the United States, with respect to the articles potentially subject to the orders; and
(iv) Indicate whether Complainant, Complainant’s licensees, and/or third party suppliers have the capacity to replace the volume of articles potentially subject to an exclusion order and a cease and desist order within a commercially reasonable time.
Written submissions must be filed no later than by close of business, five business days after the date of publication of this notice in the Federal Register. There will be further opportunities for comment on the public interest after the issuance of any final initial determination in this investigation.
Persons filing written submissions must file the original document and 12 true copies thereof on or before the deadlines stated above with the Office of the Secretary. Submissions should refer to the docket number (‘‘Docket No. 2855’’) in a prominent place on the cover page and/or the first page. The
VerDate Mar<15>2010 17:14 Nov 21, 2011 Jkt 226001 PO 00000 Frm 00056 Fmt 4703 Sfmt 4703 E:\FR\FM\22NON1.SGM 22NON1mst
ocks
till o
n D
SK
4VP
TV
N1P
RO
D w
ith N
OT
ICE
S
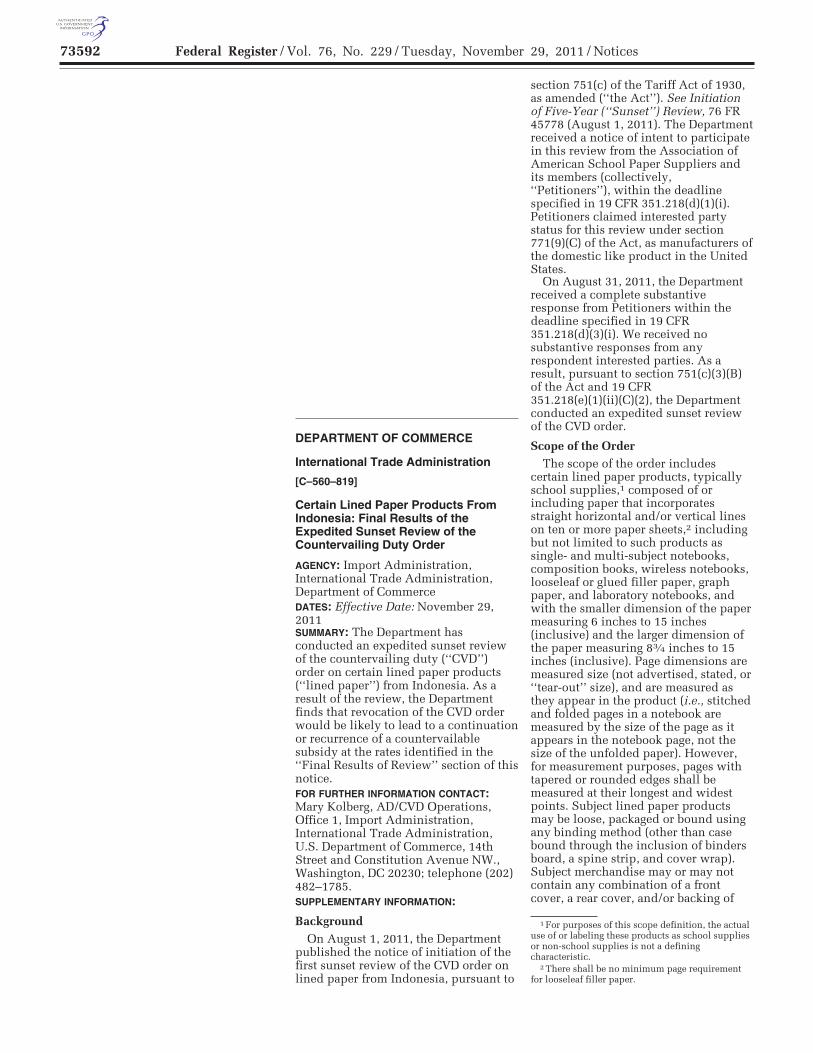
73592 Federal Register / Vol. 76, No. 229 / Tuesday, November 29, 2011 / Notices
1 See Uncovered Innerspring Units from the People’s Republic of China: Preliminary Intent to Rescind New Shipper Review, 76 FR 47151 (August 4, 2011) (‘‘Preliminary Results’’).
2 See Uncovered Innerspring Units from the People’s Republic of China: Extension of Final Results of Antidumping Duty New Shipper Review, 76 FR 65695 (October 24, 2011).
3 See section 751(a)(2)(B)(iv) of the Act and 19 CFR 351.214(i)(2).
1 For purposes of this scope definition, the actual use of or labeling these products as school supplies or non-school supplies is not a defining characteristic.
2 There shall be no minimum page requirement for looseleaf filler paper.
DEPARTMENT OF COMMERCE
International Trade Administration
[A–570–928]
Uncovered Innerspring Units From the People’s Republic of China: Second Extension of Final Results of Antidumping Duty New Shipper Review
AGENCY: Import Administration, International Trade Administration, Department of Commerce. SUMMARY: The Department of Commerce (the ‘‘Department’’) is extending the time limit for the final results of the first new shipper review of uncovered innerspring units (‘‘innersprings’’) from the People’s Republic of China (‘‘PRC’’). The review covers the period of review (‘‘POR’’) of February 1, 2010, through July 31, 2010. DATES: Effective Date: November 29, 2011.
FOR FURTHER INFORMATION CONTACT: Paul Walker, AD/CVD Operations, Office 9, Import Administration, International Trade Administration, U.S. Department of Commerce, 14th Street and Constitution Avenue NW., Washington, DC 20230; telephone: (202) 482–0413.
Background
On August 4, 2011, the Department published in the Federal Register the Preliminary Results of the new shipper review of innersprings from the PRC.1 On October 24, 2011, the Department extended the final results until November 22, 2011.2 The respondent in this new shipper review is Foshan Nanhai Jiujiang Quan Li Spring Hardware Factory (‘‘Quan Li’’).
Statutory Time Limits
Section 751(a)(2)(B)(iv) of the Tariff Act of 1930, as amended (the ‘‘Act’’), and section 351.214(i)(1) of the Department’s regulations, require the Department to issue the final results in a new shipper review 90 days after the date on which the preliminary results are issued. The Department may, however, extend the deadline for completion of the final results of a new shipper review to 150 days if it determines that the case is extraordinarily complicated.3
Extension of Time Limit for Final Results of Review
We determine that this case is extraordinarily complicated because the Department requires additional time to analyze interested parties’ case and rebuttal briefs concerning the bona fide nature of the sale under review. Therefore, in accordance with section 751(a)(2)(B)(iv) of the Act, and section 351.214(i)(2) of the Department’s regulations, we are fully extending the time for the completion of the final results of this review until December 23, 2011.
We are issuing and publishing this notice in accordance with sections 751(a)(2)(B) and 777(i)(1) of the Act.
Dated: November 18, 2011. Christian Marsh, Deputy Assistant Secretary for Antidumping and Countervailing Duty Operations. [FR Doc. 2011–30776 Filed 11–28–11; 8:45 am]
BILLING CODE 3510–DS–P
DEPARTMENT OF COMMERCE
International Trade Administration
[C–560–819]
Certain Lined Paper Products From Indonesia: Final Results of the Expedited Sunset Review of the Countervailing Duty Order
AGENCY: Import Administration, International Trade Administration, Department of Commerce DATES: Effective Date: November 29, 2011 SUMMARY: The Department has conducted an expedited sunset review of the countervailing duty (‘‘CVD’’) order on certain lined paper products (‘‘lined paper’’) from Indonesia. As a result of the review, the Department finds that revocation of the CVD order would be likely to lead to a continuation or recurrence of a countervailable subsidy at the rates identified in the ‘‘Final Results of Review’’ section of this notice. FOR FURTHER INFORMATION CONTACT: Mary Kolberg, AD/CVD Operations, Office 1, Import Administration, International Trade Administration, U.S. Department of Commerce, 14th Street and Constitution Avenue NW., Washington, DC 20230; telephone (202) 482–1785. SUPPLEMENTARY INFORMATION:
Background On August 1, 2011, the Department
published the notice of initiation of the first sunset review of the CVD order on lined paper from Indonesia, pursuant to
section 751(c) of the Tariff Act of 1930, as amended (‘‘the Act’’). See Initiation of Five-Year (‘‘Sunset’’) Review, 76 FR 45778 (August 1, 2011). The Department received a notice of intent to participate in this review from the Association of American School Paper Suppliers and its members (collectively, ‘‘Petitioners’’), within the deadline specified in 19 CFR 351.218(d)(1)(i). Petitioners claimed interested party status for this review under section 771(9)(C) of the Act, as manufacturers of the domestic like product in the United States.
On August 31, 2011, the Department received a complete substantive response from Petitioners within the deadline specified in 19 CFR 351.218(d)(3)(i). We received no substantive responses from any respondent interested parties. As a result, pursuant to section 751(c)(3)(B) of the Act and 19 CFR 351.218(e)(1)(ii)(C)(2), the Department conducted an expedited sunset review of the CVD order.
Scope of the Order The scope of the order includes
certain lined paper products, typically school supplies,1 composed of or including paper that incorporates straight horizontal and/or vertical lines on ten or more paper sheets,2 including but not limited to such products as single- and multi-subject notebooks, composition books, wireless notebooks, looseleaf or glued filler paper, graph paper, and laboratory notebooks, and with the smaller dimension of the paper measuring 6 inches to 15 inches (inclusive) and the larger dimension of the paper measuring 83⁄4 inches to 15 inches (inclusive). Page dimensions are measured size (not advertised, stated, or ‘‘tear-out’’ size), and are measured as they appear in the product (i.e., stitched and folded pages in a notebook are measured by the size of the page as it appears in the notebook page, not the size of the unfolded paper). However, for measurement purposes, pages with tapered or rounded edges shall be measured at their longest and widest points. Subject lined paper products may be loose, packaged or bound using any binding method (other than case bound through the inclusion of binders board, a spine strip, and cover wrap). Subject merchandise may or may not contain any combination of a front cover, a rear cover, and/or backing of
VerDate Mar<15>2010 15:20 Nov 28, 2011 Jkt 226001 PO 00000 Frm 00011 Fmt 4703 Sfmt 4703 E:\FR\FM\29NON1.SGM 29NON1mst
ocks
till o
n D
SK
4VP
TV
N1P
RO
D w
ith N
OT
ICE
S

73593 Federal Register / Vol. 76, No. 229 / Tuesday, November 29, 2011 / Notices
3 ‘‘Gregg ruling’’ consists of a single- or double- margin vertical ruling line down the center of the page. For a six-inch by nine-inch stenographic pad, the ruling would be located approximately three inches from the left of the book.
4 Products found to be bearing an invalidly licensed or used trademark are not excluded from the scope.
5 Products found to be bearing an invalidly licensed or used trademark are not excluded from the scope.
6 Products found to be bearing an invalidly licensed or used trademark are not excluded from the scope.
7 Products found to be bearing an invalidly licensed or used trademark are not excluded from the scope.
any composition, regardless of the inclusion of images or graphics on the cover, backing, or paper. Subject merchandise is within the scope of the order whether or not the lined paper and/or cover are hole punched, drilled, perforated, and/or reinforced. Subject merchandise may contain accessory or informational items including but not limited to pockets, tabs, dividers, closure devices, index cards, stencils, protractors, writing implements, reference materials such as mathematical tables, or printed items such as sticker sheets or miniature calendars, if such items are physically incorporated, included with, or attached to the product, cover and/or backing thereto.
Specifically excluded from the scope of the order are: Unlined copy machine paper; writing pads with a backing (including but not limited to products commonly known as ‘‘tablets,’’ ‘‘note pads,’’ ‘‘legal pads,’’ and ‘‘quadrille pads’’), provided that they do not have a front cover (whether permanent or removable). This exclusion does not apply to such writing pads if they consist of hole-punched or drilled filler paper; three-ring or multiple-ring binders, or notebook organizers incorporating such a ring binder provided that they do not include subject paper; index cards; printed books and other books that are case bound through the inclusion of binders board, a spine strip, and cover wrap; newspapers; pictures and photographs; desk and wall calendars and organizers (including but not limited to such products generally known as ‘‘office planners,’’ ‘‘time books,’’ and ‘‘appointment books’’); telephone logs; address books; columnar pads and tablets, with or without covers, primarily suited for the recording of written numerical business data; lined business or office forms, including but not limited to: preprinted business forms, lined invoice pads and paper, mailing and address labels, manifests, and shipping log books; lined continuous computer paper; boxed or packaged writing stationary (including but not limited to products commonly known as ‘‘fine business paper,’’ ‘‘parchment paper,’’ and ‘‘letterhead’’), whether or not containing a lined header or decorative lines; Stenographic pads (‘‘steno pads’’), Gregg ruled,3 measuring 6 inches by 9 inches.
Also excluded from the scope of the order are the following trademarked
products: FlyTM lined paper products: A notebook, notebook organizer, loose or glued note paper, with papers that are printed with infrared reflective inks and readable only by a FlyTM pen-top computer. The product must bear the valid trademark FlyTM.4 ZwipesTM: A notebook or notebook organizer made with a blended polyolefin writing surface as the cover and pocket surfaces of the notebook, suitable for writing using a specially-developed permanent marker and erase system (known as a ZwipesTM pen). This system allows the marker portion to mark the writing surface with a permanent ink. The eraser portion of the marker dispenses a solvent capable of solubilizing the permanent ink allowing the ink to be removed. The product must bear the valid trademark ZwipesTM.5 FiveStar®AdvanceTM: A notebook or notebook organizer bound by a continuous spiral, or helical, wire and with plastic front and rear covers made of a blended polyolefin plastic material joined by 300 denier polyester, coated on the backside with PVC (poly vinyl chloride) coating, and extending the entire length of the spiral or helical wire. The polyolefin plastic covers are of specific thickness; front cover is .019 inches (within normal manufacturing tolerances) and rear cover is .028 inches (within normal manufacturing tolerances). Integral with the stitching that attaches the polyester spine covering, is captured both ends of a 1’’ wide elastic fabric band. This band is located 23⁄8’’ from the top of the front plastic cover and provides pen or pencil storage. Both ends of the spiral wire are cut and then bent backwards to overlap with the previous coil but specifically outside the coil diameter but inside the polyester covering. During construction, the polyester covering is sewn to the front and rear covers face to face (outside to outside) so that when the book is closed, the stitching is concealed from the outside. Both free ends (the ends not sewn to the cover and back) are stitched with a turned edge construction. The flexible polyester material forms a covering over the spiral wire to protect it and provide a comfortable grip on the product. The product must bear the valid trademarks FiveStar®AdvanceTM.6 FiveStar FlexTM: a notebook, a notebook organizer, or
binder with plastic polyolefin front and rear covers joined by 300 denier polyester spine cover extending the entire length of the spine and bound by a 3-ring plastic fixture. The polyolefin plastic covers are of a specific thickness; front cover is .019 inches (within normal manufacturing tolerances) and rear cover is .028 inches (within normal manufacturing tolerances). During construction, the polyester covering is sewn to the front cover face to face (outside to outside) so that when the book is closed, the stitching is concealed from the outside. During construction, the polyester cover is sewn to the back cover with the outside of the polyester spine cover to the inside back cover. Both free ends (the ends not sewn to the cover and back) are stitched with a turned edge construction. Each ring within the fixture is comprised of a flexible strap portion that snaps into a stationary post which forms a closed binding ring. The ring fixture is riveted with six metal rivets and sewn to the back plastic cover and is specifically positioned on the outside back cover. The product must bear the valid trademark FiveStar FlexTM.7
Merchandise subject to the order is typically imported under headings 4810.22.5044, 4811.90.9035, 4811.90.9050, 4811.90.9080, 4811.90.9090, 4820.10.2010, 4820.10.2020, 4820.10.2030, 4820.10.2040, 4820.10.2050, 4820.10.2060, 4820.10.4000, and 4820.30.0040 of the Harmonized Tariff Schedule of the United States.
The tariff classifications are provided for convenience and U.S. Customs and Border Protection (‘‘CBP’’) purposes; however, the written description of the scope of the order is dispositive.
Analysis of Comments Received All issues raised in these reviews are
addressed in the Issues and Decision Memorandum (‘‘Decision Memorandum’’) from Christian Marsh, Deputy Assistant Secretary for Antidumping and Countervailing Duty Operations, to Paul Piquado, Assistant Secretary for Import Administration, dated concurrently with this notice, which is hereby adopted by this notice. The issues discussed in the Decision Memorandum include the likelihood of continuation or recurrence of a countervailable subsidy if the order were revoked, the net countervailable subsidy likely to prevail if the order were revoked, and the nature of the subsidies. The Issues and Decision
VerDate Mar<15>2010 15:20 Nov 28, 2011 Jkt 226001 PO 00000 Frm 00012 Fmt 4703 Sfmt 4703 E:\FR\FM\29NON1.SGM 29NON1mst
ocks
till o
n D
SK
4VP
TV
N1P
RO
D w
ith N
OT
ICE
S

73594 Federal Register / Vol. 76, No. 229 / Tuesday, November 29, 2011 / Notices
1 See Notice of Amended Final Determination of Sales at Less Than Fair Value and Antidumping Duty Order: Certain Frozen Warmwater Shrimp from the Socialist Republic of Vietnam, 70 FR 5152 (February 1, 2005).
2 See Certain Frozen Warmwater Shrimp from the Socialist Republic of Vietnam: Initiation of Antidumping Duty New Shipper Review, 76 FR 16384 (March 23, 2011).
3 See Certain Frozen Warmwater Shrimp From the Socialist Republic of Vietnam: Extension of Time Limit for the Preliminary Results of the New Shipper Review, 76 FR 55350 (September 7, 2011).
4 See Certain Frozen Warmwater Shrimp From the Socialist Republic of Vietnam: Extension of Time Limit for the Preliminary Results of the New Shipper Review, 76 FR 67418 (November 1, 2011).
5 See Notice of Clarification: Application of ‘‘Next Business Day’’ Rule for Administrative Determination Deadlines Pursuant of the Tariff Act of 1930, As Amended, 70 FR 24533 (May 10, 2005).
Memorandum is a public document and is on file electronically via Import Administration’s Antidumping and Countervailing Duty Centralized Electronic Service System (‘‘IA ACCESS’’). Access to IA Access is available in the Central Records Unit (‘‘CRU’’), room 7046 of the main Department of Commerce building. In addition, a complete version of the Issues and Decision Memorandum can be accessed directly on the internet at http://www.trade.gov/ia/. The signed Issues and Decision Memorandum and the electronic versions of the Issues and Decision Memorandum are identical in content.
Final Results of Review
Pursuant to sections 752(c)(1) and (3) of the Act, we determine that revocation of the CVD order on lined paper from Indonesia would be likely to lead to continuation or recurrence of the countervailable subsidy rates listed below:
Manufacturers/producers/ex-porters
Net countervailable
subsidy (percent)
PT. Pabrik Kertas Tjiwi Kimia Tbk .................................... 40.55
All Others .............................. 40.55
This notice also serves as the only reminder to parties subject to administrative protective order (‘‘APO’’) of their responsibility concerning the return or destruction of proprietary information disclosed under APO in accordance with 19 CFR 351.305. Timely notification of the return or destruction of APO materials or conversion to judicial protective orders is hereby requested. Failure to comply with the regulations and terms of an APO is a violation which is subject to sanction.
We are issuing and publishing the final results and notice in accordance with sections 751(c), 752(c), and 777(i)(1) of the Act.
Dated: November 16, 2011.
Paul Piquado, Assistant Secretary for Import Administration. [FR Doc. 2011–30773 Filed 11–28–11; 8:45 am]
BILLING CODE 3510–DS–P
DEPARTMENT OF COMMERCE
International Trade Administration
[A–552–802]
Certain Frozen Warmwater Shrimp From the Socialist Republic of Vietnam: Extension of Time Limit for the Preliminary Results of the New Shipper Review
AGENCY: Import Administration, International Trade Administration, Department of Commerce. DATES: Effective Date: November 29, 2011. SUMMARY: The Department of Commerce (the ‘‘Department’’) has decided to extend the time limit for the preliminary results of the new shipper review (‘‘NSR’’) of the antidumping duty order on certain frozen warmwater shrimp (‘‘shrimp’’) from the Socialist Republic of Vietnam (‘‘Vietnam’’) to January 9, 2012. The period of review (‘‘POR’’) for this NSR is February 1, 2010, through January 31, 2011. FOR FURTHER INFORMATION CONTACT: Susan Pulongbarit or Seth Isenberg, AD/ CVD Operations, Office 9, Import Administration, International Trade Administration, U.S. Department of Commerce, 14th Street and Constitution Avenue NW., Washington, DC 20230; telephone: (202) 482–4031 and (202) 482–0588, respectively. SUPPLEMENTARY INFORMATION:
Background
The antidumping duty order on shrimp from Vietnam was published in the Federal Register on February 1, 2005.1 On February 28, 2011, pursuant to section 751(a)(2)(B)(i) of the Tariff Act of 1930, as amended (the ‘‘Act’’), and 19 CFR 351.214(c), the Department received a NSR request from Thong Thuan Company Limited and its subsidiary company, Thong Thuan Seafood Company Limited (collectively, ‘‘Thong Thuan’’). Thong Thuan certified that it is a producer and exporter of the subject merchandise upon which the request was based.
The notice initiating the NSR was published in the Federal Register on March 23, 2011.2 The Department extended the time limit for the preliminary results by 60 days on
September 7, 2011.3 The Department extended the time limit for the preliminary results by an additional 30 days on November 1, 2011.4 The preliminary results are currently due no later than December 9, 2011.
Statutory Time Limits
Section 751(a)(2)(B)(iv) of the Act, provides that the Department will issue the preliminary results of a new shipper review of an antidumping duty order within 180 days after the day on which the review was initiated. See also 19 CFR 351.214 (i)(1). The Act further provides that the Department may extend that 180-day period to 300 days if it determines that the case is extraordinarily complicated. See also 19 CFR 351.214 (i)(2).
Extension of Time Limit of Preliminary Results
The Department determines that this new shipper review involves extraordinarily complicated methodological issues, including Thong Thuan’s multiple production stages for subject merchandise and the need to evaluate the bona fide nature of Thong Thuan’s sales. The Department finds that these extraordinarily complicated issues require additional time to evaluate. Therefore, in accordance with section 751(a)(2)(B)(iv) of the Act and 19 CFR 351.214(i)(2), the Department is extending the time limit for the preliminary results by an additional 30 days. The preliminary results are now due no later than January 8, 2012. As that day falls on a Sunday, the final results are due no later than January 9, 2012.5 The final results continue to be due 90 days after the publication of the preliminary results.
We are issuing and publishing this notice in accordance with sections 751(a)(2)(B)(iv) and 777(i) of the Act.
Dated: November 21, 2011.
Christian Marsh, Deputy Assistant Secretary for Antidumping and Countervailing Duty Operations. [FR Doc. 2011–30747 Filed 11–28–11; 8:45 am]
BILLING CODE 3510–DS–P
VerDate Mar<15>2010 15:20 Nov 28, 2011 Jkt 226001 PO 00000 Frm 00013 Fmt 4703 Sfmt 9990 E:\FR\FM\29NON1.SGM 29NON1mst
ocks
till o
n D
SK
4VP
TV
N1P
RO
D w
ith N
OT
ICE
S

76147 Federal Register / Vol. 76, No. 234 / Tuesday, December 6, 2011 / Notices
1 For purposes of this scope definition, the actual use or labeling of these products as school supplies or non-school supplies is not a defining characteristic.
2 There shall be no minimum page requirement for looseleaf filler paper. the scope of this order are:
Period of Investigation
The period of investigation is July 1, 2010, through June 30, 2011.
Postponement of Preliminary Determination
Section 733(b)(1)(A) of the Tariff Act of 1930, as amended (the Act), requires the Department to make a preliminary determination no later than 140 days after the initiation of the investigation.
On November 23, 2011, petitioners ABB Inc., Delta Star, Inc., and Pennsylvania Transformer Technology Inc. (collectively, petitioners) made a timely request pursuant to 19 CFR 351.205(e) for a postponement of the preliminary determination because of the extraordinarily complicated nature of the proceeding and its required analysis, and because the Department is still gathering questionnaire responses from the respondents. See Letter from petitioners to the Department, entitled ‘‘Large Power Transformers from the Republic of Korea—Petitioners’ Request for Extension of Preliminary Determination,’’ dated November 23, 2011.
For the reasons stated above and because there are no compelling reasons to deny the request, the Department is postponing by 50 days to February 9, 2012, the deadline for its preliminary determination of this investigation pursuant to section 733(c)(1)(A) of the Act and 19 CFR 351.205(e) and (f). In accordance with section 735(a)(1) of the Act, the deadline for the final determination of this antidumping duty investigation will continue to be 75 days after the date of the preliminary determination, unless extended.
This notice is issued and published in accordance with section 733(c)(2) of the Act and 19 CFR 351.205(f)(1).
Dated: November 30, 2011. Paul Piquado, Assistant Secretary for Import Administration. [FR Doc. 2011–31288 Filed 12–5–11; 8:45 am]
BILLING CODE 3510–DS–P
DEPARTMENT OF COMMERCE
International Trade Administration
[C–533–844]
Final Results of Expedited Sunset Review of Countervailing Duty Order: Certain Lined Paper Products From India
AGENCY: Import Administration, International Trade Administration, Department of Commerce.
SUMMARY: On August 1, 2011, the Department of Commerce (the Department) initiated a sunset review of the countervailing duty (CVD) order on certain lined paper products (CLPP) from India pursuant to section 751(c) of the Tariff Act of 1930, as amended (the Act). See Initiation of Five-Year (‘‘Sunset’’) Review, 76 FR 45778 (August 1, 2011) (Initiation Notice). On the basis of a notice of intent to participate and an adequate substantive response filed on behalf of domestic interested parties and an inadequate response (in this case, no response) from respondent interested parties, the Department decided to conduct an expedited sunset review of this CVD order pursuant to section 751(c)(3)(B) of the Act and 19 CFR 351.218(e)(1)(ii)(C). As a result of this review, the Department finds that revocation of the CVD order would be likely to lead to continuation or recurrence of a countervailable subsidy at the level indicated in the ‘‘Final Results of Review’’ section of this notice. DATES: Effective Date: December 6, 2011. FOR FURTHER INFORMATION CONTACT: Eric Greynolds, AD/CVD Operations, Office 3, Import Administration, International Trade Administration, U.S. Department of Commerce, 14th Street & Constitution Avenue NW., Washington, DC 20230; telephone: (202) 482–6071. SUPPLEMENTARY INFORMATION:
Background On August 1, 2011, the Department
initiated a sunset review of the CVD order on LPP from India pursuant to section 751(c) of the Act. See Initiation Notice, 76 FR 45778 (August 1, 2011). The Department received a notice of intent to participate on behalf of the Association of American School Paper Suppliers (AASPS) and its individual members—MWV Consumer & Office Products (MWV), Norcom, Inc., and TopFlight, Inc. (collectively, petitioners), within the deadline specified in 19 CFR 351.218(d)(1)(i). The petitioners claimed interested party status under sections 771(9) (F) and 771(9)(C) of the Act, as an association of domestic producers of CLLP and domestic producers of CLPP, respectively.
The Department received a complete substantive response from the petitioners within the 30-day deadline specified in 19 CFR 351.218(d)(3)(i). However, the Department did not receive a substantive response from any respondent interested party to this proceeding. As a result, pursuant to section 751(c)(3)(B) of the Act and 19 CFR 351.218(e)(1)(ii)(C)(2), the
Department conducted an expedited review of this order.
Scope of the Order The scope of this order includes
certain lined paper products, typically school supplies,1 composed of or including paper that incorporates straight horizontal and/or vertical lines on ten or more paper sheets,2 including but not limited to such products as single- and multi-subject notebooks, composition books, wireless notebooks, looseleaf or glued filler paper, graph paper, and laboratory notebooks, and with the smaller dimension of the paper measuring 6 inches to 15 inches (inclusive) and the larger dimension of the paper measuring 83⁄4 inches to 15 inches (inclusive). Page dimensions are measured size (not advertised, stated, or ‘‘tear-out’’ size), and are measured as they appear in the product (i.e., stitched and folded pages in a notebook are measured by the size of the page as it appears in the notebook page, not the size of the unfolded paper). However, for measurement purposes, pages with tapered or rounded edges shall be measured at their longest and widest points. Subject lined paper products may be loose, packaged or bound using any binding method (other than case bound through the inclusion of binders board, a spine strip, and cover wrap). Subject merchandise may or may not contain any combination of a front cover, a rear cover, and/or backing of any composition, regardless of the inclusion of images or graphics on the cover, backing, or paper. Subject merchandise is within the scope of this order whether or not the lined paper and/or cover are hole punched, drilled, perforated, and/or reinforced. Subject merchandise may contain accessory or informational items including but not limited to pockets, tabs, dividers, closure devices, index cards, stencils, protractors, writing implements, reference materials such as mathematical tables, or printed items such as sticker sheets or miniature calendars, if such items are physically incorporated, included with, or attached to the product, cover and/or backing thereto.
• Unlined copy machine paper; • Writing pads with a backing
(including but not limited to products commonly known as ‘‘tablets,’’ ‘‘note pads,’’ ‘‘legal pads,’’ and ‘‘quadrille
VerDate Mar<15>2010 17:04 Dec 05, 2011 Jkt 226001 PO 00000 Frm 00028 Fmt 4703 Sfmt 4703 E:\FR\FM\06DEN1.SGM 06DEN1jlent
ini o
n D
SK
4TP
TV
N1P
RO
D w
ith N
OT
ICE
S

76148 Federal Register / Vol. 76, No. 234 / Tuesday, December 6, 2011 / Notices
3 ‘‘Gregg ruling’’ consists of a single- or double- margin vertical ruling line down the center of the page. For a six-inch by nine-inch stenographic pad, the ruling would be located approximately three inches from the left of the book.
4 Products found to be bearing an invalidly licensed or used trademark are not excluded from the scope.
5 Products found to be bearing an invalidly licensed or used trademark are not excluded from the scope.
6 Products found to be bearing an invalidly licensed or used trademark are not excluded from the scope.
7 Products found to be bearing an invalidly licensed or used trademark are not excluded from the scope.
8 Kejriwal Exports, a division of Kejriwal Paper Limited was excluded from the order on the basis
pads’’), provided that they do not have a front cover (whether permanent or removable). This exclusion does not apply to such writing pads if they consist of hole-punched or drilled filler paper;
• Three-ring or multiple-ring binders, or notebook organizers incorporating such a ring binder provided that they do not include subject paper;
• Index cards; • Printed books and other books that
are case bound through the inclusion of binders board, a spine strip, and cover wrap;
• Newspapers; • Pictures and photographs; • Desk and wall calendars and
organizers (including but not limited to such products generally known as ‘‘office planners,’’ ‘‘time books,’’ and ‘‘appointment books’’);
• Telephone logs; • Address books; • Columnar pads & tablets, with or
without covers, primarily suited for the recording of written numerical business data;
• Lined business or office forms, including but not limited to: preprinted business forms, lined invoice pads and paper, mailing and address labels, manifests, and shipping log books;
• Lined continuous computer paper; • Boxed or packaged writing
stationery (including but not limited to products commonly known as ‘‘fine business paper,’’ ‘‘parchment paper,’’ and ‘‘letterhead’’), whether or not containing a lined header or decorative lines; and
• Stenographic pads (steno pads), Gregg ruled,3 measuring 6 inches by 9 inches.
Also excluded from the scope of this order are the following trademarked products:
• FlyTM lined paper products: A notebook, notebook organizer, loose or glued note paper, with papers that are printed with infrared reflective inks and readable only by a FlyTM pen-top computer. The product must bear the valid trademark FlyTM.4
• ZwipesTM: A notebook or notebook organizer made with a blended polyolefin writing surface as the cover and pocket surfaces of the notebook, suitable for writing using a specially- developed permanent marker and erase system (known as a ZwipesTM pen).
This system allows the marker portion to mark the writing surface with a permanent ink. The eraser portion of the marker dispenses a solvent capable of solubilizing the permanent ink allowing the ink to be removed. The product must bear the valid trademark ZwipesTM.5
• FiveStar® AdvanceTM: A notebook or notebook organizer bound by a continuous spiral, or helical, wire and with plastic front and rear covers made of a blended polyolefin plastic material joined by 300 denier polyester, coated on the backside with PVC (poly vinyl chloride) coating, and extending the entire length of the spiral or helical wire. The polyolefin plastic covers are of specific thickness; front cover is 0.019 inches (within normal manufacturing tolerances) and rear cover is 0.028 inches (within normal manufacturing tolerances). Integral with the stitching that attaches the polyester spine covering, is captured both ends of a 1″ wide elastic fabric band. This band is located 23⁄8″ from the top of the front plastic cover and provides pen or pencil storage. Both ends of the spiral wire are cut and then bent backwards to overlap with the previous coil but specifically outside the coil diameter but inside the polyester covering. During construction, the polyester covering is sewn to the front and rear covers face to face (outside to outside) so that when the book is closed, the stitching is concealed from the outside. Both free ends (the ends not sewn to the cover and back) are stitched with a turned edge construction. The flexible polyester material forms a covering over the spiral wire to protect it and provide a comfortable grip on the product. The product must bear the valid trademarks FiveStar® AdvanceTM.6
• FiveStar FlexTM: A notebook, a notebook organizer, or binder with plastic polyolefin front and rear covers joined by 300 denier polyester spine cover extending the entire length of the spine and bound by a 3-ring plastic fixture. The polyolefin plastic covers are of a specific thickness; front cover is 0.019 inches (within normal manufacturing tolerances) and rear cover is 0.028 inches (within normal manufacturing tolerances). During construction, the polyester covering is sewn to the front cover face to face (outside to outside) so that when the book is closed, the stitching is concealed from the outside. During
construction, the polyester cover is sewn to the back cover with the outside of the polyester spine cover to the inside back cover. Both free ends (the ends not sewn to the cover and back) are stitched with a turned edge construction. Each ring within the fixture is comprised of a flexible strap portion that snaps into a stationary post which forms a closed binding ring. The ring fixture is riveted with six metal rivets and sewn to the back plastic cover and is specifically positioned on the outside back cover. The product must bear the valid trademark FiveStar FlexTM.7
Currently, merchandise subject to this order is typically imported under headings 4810.22.5044, 4811.90.9050, 4820.10.2010, 4820.10.2020, 4820.10.2030, 4820.10.2040, 4820.10.2060, and 4820.10.4000 of the Harmonized Tariff Schedule of the United States (HTSUS). The tariff classifications are provided for convenience and customs purposes; however, the written description of the scope of the order is dispositive.
Analysis of Comments Received All issues raised in this review are
addressed in the Issues and Decision Memorandum (Decision Memorandum) from Christian Marsh, Deputy Assistant Secretary for Antidumping and Countervailing Duty Operations, to Paul Piquado, Assistant Secretary for Import Administration, dated concurrently with this notice, which is hereby adopted by this notice. Parties can find a complete discussion of all issues raised in this review and the corresponding recommendation in this public memorandum which is on file electronically via Import Administration’s Antidumping and Countervailing Duty Centralized Electronic Service System (IA ACCESS). Access to IA ACCESS is available in the Central Records Unit, room 7046, of the main Commerce building. In addition, a complete version of the Decision Memorandum can be accessed directly on the Web at http://ia.ita.doc.gov/frn. The electronic versions of the Decision Memorandum in IA ACCESS and on the Web are identical in content.
Final Results of Review The Department determines that
revocation of the countervailing duty order would be likely to lead to continuation or recurrence of a countervailable subsidy at the rates listed below:
VerDate Mar<15>2010 17:04 Dec 05, 2011 Jkt 226001 PO 00000 Frm 00029 Fmt 4703 Sfmt 4703 E:\FR\FM\06DEN1.SGM 06DEN1jlent
ini o
n D
SK
4TP
TV
N1P
RO
D w
ith N
OT
ICE
S

76149 Federal Register / Vol. 76, No. 234 / Tuesday, December 6, 2011 / Notices
of de minimis subsidies during the period of investigation.
Producers/exporters
Net countervailable
subsidy (percent)
Aero Exports ......................... 7.52 Navneet Publications ............ 10.71 All Other Producers/Export-
ers 8 ................................... 9.89
Notification Regarding Administrative Protective Order
This notice serves as the only reminder to parties subject to administrative protective order (APO) of their responsibility concerning the return or destruction of proprietary information disclosed under APO in accordance with 19 CFR 351.305. Timely notification of return/ destruction of APO materials or conversion to judicial protective order is hereby requested. Failure to comply with the regulations and the terms of an APO is a sanctionable violation.
We are issuing and publishing these final results and notice in accordance with sections 751(c), 752, and 777(i)(1) of the Act.
Dated: November 29, 2011. Paul Piquado, Assistant Secretary for Import Administration. [FR Doc. 2011–31290 Filed 12–5–11; 8:45 am]
BILLING CODE 3510–DS–P
DEPARTMENT OF DEFENSE
Office of the Secretary
[Docket ID DOD–2011–OS–0139]
Submission for OMB Review; Comment Request
ACTION: Notice.
SUMMARY: The Department of Defense has submitted to OMB for clearance, the following proposal for collection of information under the provisions of the Paperwork Reduction Act (44 U.S.C. Chapter 35). DATES: Consideration will be given to all comments received by [insert 15 days from publication of this notice in the Federal Register].
Title, Form, and OMB Number: Department of Defense Inventory of Contracts for Services Compliance; OMB Control Number 0704–TBD.
Type of Request: New, emergency. Number of Respondents: 48,884. Responses per Respondent: 1. Annual Responses: 48,884. Average Burden per Response: 5
minutes.
Annual Burden Hours: 4,074 hours. Needs and Uses: This collection is
necessary to allow all DoD organizations to fully implement sections 235 and 2330a of title 10, United States Code. The information requested, such as the Reporting Period, Contract Number, Task/Delivery Order Number, Customer Name and Address, Contracting Office Name and Address, Federal Supply Class or Service Code, Contractor Name and Address, Value of Contract Instrument, and the Number and Value of Direct Labor Hours will be used to facilitate the accurate identification of the function performed and to facilitate estimate of the reliability of the data. The Direct Labor Hours are requested for use in calculating contractor manpower equivalents. This information is reported directly from the contractor because this is the most credible data source.
Affected Public: Business or other for profit; not-for-profit institutions.
Frequency: Annually. Respondent’s Obligation: Required to
obtain or retain benefits. OMB Desk Officer: Ms. Jasmeet
Seehra. Written comments and
recommendations on the proposed information collection should be sent to Ms. Seehra at the Office of Management and Budget, Desk Officer for DoD, Room 10236, New Executive Office Building, Washington, DC 20503.
You may also submit comments, identified by docket number and title, by the following method:
• Federal eRulemaking Portal: http:// www.regulations.gov. Follow the instructions for submitting comments.
Instructions: All submissions received must include the agency name, docket number and title for this Federal Register document. The general policy for comments and other submissions from members of the public is to make these submissions available for public viewing on the Internet at http:// www.regulations.gov as they are received without change, including any personal identifiers or contact information.
DoD Clearance Officer: Ms. Patricia Toppings.
Written requests for copies of the information collection proposal should be sent to Ms. Toppings at WHS/ESD/ Information Management Division, 4800 Mark Center Drive, 2nd Floor, East Tower, Suite 02G09, Alexandria, VA 22350–3100.
Dated: November 28, 2011. Morgan F. Park, Alternate OSD Federal Register Liaison Officer, Department of Defense. [FR Doc. 2011–31229 Filed 12–5–11; 8:45 am]
BILLING CODE 5001–06–P
DEPARTMENT OF DEFENSE
Office of the Secretary
[Docket ID DOD–2011–OS–0140]
Privacy Act of 1974; System of Records
AGENCY: Defense Logistics Agency, DoD. ACTION: Notice to Amend a System of Records.
SUMMARY: The Defense Logistics Agency is proposing to amend a system of records notice in its existing inventory of record systems subject to the Privacy Act of 1974 (5 U.S.C. 552a), as amended. DATES: The proposed action will be effective without further notice on January 5, 2012 unless comments are received which would result in a contrary determination. ADDRESSES: You may submit comments, identified by docket number and title, by any of the following methods:
* Federal Rulemaking Portal: http:// www.regulations.gov.
Follow the instructions for submitting comments.
* Mail: Federal Docket Management System Office, 4800 Mark Center Drive, East Tower, 2nd Floor, Suite 02G09, Alexandria, VA 22350–3100.
Instructions: All submissions received must include the agency name and docket number for this Federal Register document. The general policy for comments and other submissions from members of the public is to make these submissions available for public viewing on the Internet at http:// www.regulations.gov as they are received without change, including any personal identifiers or contact information. FOR FURTHER INFORMATION CONTACT: Ms. Jody Sinkler at (703) 767–5045, or DLA FOIA/Privacy Act Office, Headquarters, Defense Logistics Agency, ATTN: DGA, 8725 John J. Kingman Road, Suite 1644, Fort Belvoir, VA 22060–6221. SUPPLEMENTARY INFORMATION: The Defense Logistics Agency’s system of record notices subject to the Privacy Act of 1974 (5 U.S.C. 552a), as amended, have been published in the Federal Register and are available from the address in FOR FURTHER INFORMATION CONTACT.
The specific changes to the record system being amended are set forth
VerDate Mar<15>2010 17:04 Dec 05, 2011 Jkt 226001 PO 00000 Frm 00030 Fmt 4703 Sfmt 4703 E:\FR\FM\06DEN1.SGM 06DEN1jlent
ini o
n D
SK
4TP
TV
N1P
RO
D w
ith N
OT
ICE
S

76123 Federal Register / Vol. 76, No. 234 / Tuesday, December 6, 2011 / Notices
1 For purposes of this scope definition, the actual use or labeling of these products as school supplies or non-school supplies is not a defining characteristic.
2 There shall be no minimum page requirement for looseleaf filler paper.
correction 74 FR 3987, 01/22/09; 75 FR 71069–71070, 11/22/10) as an option for the establishment or reorganization of general-purpose zones;
Whereas, the County of Monroe, grantee of Foreign-Trade Zone 141, submitted an application to the Board (FTZ Docket 29–2011, filed 04/28/11) for authority to reorganize and expand under the ASF with a service area of Monroe County, New York, in and adjacent to the Rochester Customs and Border Protection port of entry; remove existing Sites 1, 3, 4, 6, 7, 8, 10 and 11; FTZ 141’s Sites 2, 5 and 9 would be categorized as magnet sites; and, Site 12 would be categorized as a usage-driven site;
Whereas, notice inviting public comment was given in the Federal Register (76 FR 25301, 05/04/11) and the application has been processed pursuant to the FTZ Act and the Board’s regulations; and,
Whereas, the Board adopts the findings and recommendation of the examiner’s report, and finds that the requirements of the FTZ Act and Board’s regulations are satisfied, and that the proposal is in the public interest;
Now, therefore, the Board hereby orders:
The application to reorganize and expand FTZ 141 under the alternative site framework is approved, subject to the FTZ Act and the Board’s regulations, including Section 400.28, to the Board’s standard 2,000-acre activation limit for the overall general-purpose zone project, to a five-year ASF sunset provision for magnet sites that would terminate authority for Sites 2, 5 and 9 if not activated by November 30, 2016, and to a three-year ASF sunset provision for usage-driven sites that would terminate authority for Site 12 if no foreign-status merchandise is admitted for a bona fide customs purpose by November 30, 2014.
Signed at Washington, DC, this 28 day of November, 2011.
Paul Piquado, Assistant Secretary of Commerce, for Import Administration, Alternate Chairman, Foreign- Trade Zones Board. Andrew McGilvray, Executive Secretary. [FR Doc. 2011–31300 Filed 12–5–11; 8:45 am]
BILLING CODE P
DEPARTMENT OF COMMERCE
International Trade Administration
[A–533–843, A–560–818, A–579–901]
Final Results of Expedited Sunset Review of Antidumping Duty Orders: Lined Paper Products From India, Indonesia, and the People’s Republic of China
AGENCY: Import Administration, International Trade Administration, Department of Commerce. DATES: Effective Date: December 6, 2011. SUMMARY: On August 1, 2011, the Department of Commerce (‘‘the Department’’) initiated a sunset review of the antidumping duty (‘‘AD’’) orders on lined paper products (‘‘CLPP’’) from India, Indonesia, and the People’s Republic of China (‘‘PRC’’) pursuant to section 751(c) of the Tariff Act of 1930, as amended (‘‘the Act’’). See Initiation of Five-Year (‘‘Sunset’’) Review, 76 FR 45778 (August 1, 2011). On the basis of a notice of intent to participate and an adequate substantive response filed on behalf of domestic interested parties and an inadequate response (in this case, no response) from respondent interested parties in each of these reviews, the Department decided to conduct expedited sunset reviews of these AD orders pursuant to section 751(c)(3)(B) of the Act and 19 CFR 351.218(e)(1)(ii)(A). As a result of these reviews, the Department finds that revocation of the antidumping duty orders would likely lead to a continuation or recurrence of dumping at the margins identified in the ‘‘Final Results of Review’’ section of this notice.
FOR FURTHER INFORMATION CONTACT: George McMahon, AD/CVD Operations, Office 3, Import Administration, International Trade Administration, U.S. Department of Commerce, 14th Street and Constitution Avenue NW., Washington, DC 20230; telephone (202) 482–1167. SUPPLEMENTARY INFORMATION:
Background On August 1, 2011, the Department
initiated sunset reviews of the AD orders on CLPP from India, Indonesia, and the PRC pursuant to section 751(c) of the Act. See Initiation of Five-Year (‘‘Sunset’’) Reviews, 76 FR 45778 (August 1, 2011). The Department received a notice of intent to participate in each of these reviews from the Association of American School Paper Suppliers (‘‘AASPS’’) and its individual members—MWV Consumer & Office Products (‘‘MWV’’), Norcom, Inc., and
TopFlight, Inc. (collectively, ‘‘petitioners’’), within the deadline specified in 19 CFR 351.218(d)(1)(i). The petitioners claimed interested party status for each of these reviews under section 771(9)(C) of the Act, as domestic producers of CLPP.
The Department received a complete substantive response from the petitioners for each of these reviews within the 30-day deadline specified in 19 CFR 351.218(d)(3)(i). However, the Department did not receive a substantive response from any respondent interested party to either of these proceedings. As a result, pursuant to section 751(c)(3)(B) of the Act and 19 CFR 351.218(e)(1)(ii)(C)(2), the Department conducted expedited reviews of these AD orders.
Scope of the Orders The scope of these orders includes
certain lined paper products, typically school supplies,1 composed of or including paper that incorporates straight horizontal and/or vertical lines on ten or more paper sheets,2 including but not limited to such products as single- and multi-subject notebooks, composition books, wireless notebooks, looseleaf or glued filler paper, graph paper, and laboratory notebooks, and with the smaller dimension of the paper measuring 6 inches to 15 inches (inclusive) and the larger dimension of the paper measuring 83⁄4 inches to 15 inches (inclusive). Page dimensions are measured size (not advertised, stated, or ‘‘tear-out’’ size), and are measured as they appear in the product (i.e., stitched and folded pages in a notebook are measured by the size of the page as it appears in the notebook page, not the size of the unfolded paper). However, for measurement purposes, pages with tapered or rounded edges shall be measured at their longest and widest points. Subject lined paper products may be loose, packaged or bound using any binding method (other than case bound through the inclusion of binders board, a spine strip, and cover wrap). Subject merchandise may or may not contain any combination of a front cover, a rear cover, and/or backing of any composition, regardless of the inclusion of images or graphics on the cover, backing, or paper. Subject merchandise is within the scope of these orders whether or not the lined paper and/or cover are hole punched, drilled, perforated, and/or reinforced.
VerDate Mar<15>2010 17:04 Dec 05, 2011 Jkt 226001 PO 00000 Frm 00004 Fmt 4703 Sfmt 4703 E:\FR\FM\06DEN1.SGM 06DEN1jlent
ini o
n D
SK
4TP
TV
N1P
RO
D w
ith N
OT
ICE
S

76124 Federal Register / Vol. 76, No. 234 / Tuesday, December 6, 2011 / Notices
3 ‘‘Gregg ruling’’ consists of a single- or double- margin vertical ruling line down the center of the page. For a six-inch by nine-inch stenographic pad, the ruling would be located approximately three inches from the left of the book.
4 Products found to be bearing an invalidly licensed or used trademark are not excluded from the scope.
5 Products found to be bearing an invalidly licensed or used trademark are not excluded from the scope.
6 Products found to be bearing an invalidly licensed or used trademark are not excluded from the scope.
7 Products found to be bearing an invalidly licensed or used trademark are not excluded from the scope.
Subject merchandise may contain accessory or informational items including but not limited to pockets, tabs, dividers, closure devices, index cards, stencils, protractors, writing implements, reference materials such as mathematical tables, or printed items such as sticker sheets or miniature calendars, if such items are physically incorporated, included with, or attached to the product, cover and/or backing thereto.
Specifically excluded from the scope of these orders are:
• Unlined copy machine paper; • Writing pads with a backing
(including but not limited to products commonly known as ‘‘tablets,’’ ‘‘note pads,’’ ‘‘legal pads,’’ and ‘‘quadrille pads’’), provided that they do not have a front cover (whether permanent or removable). This exclusion does not apply to such writing pads if they consist of hole-punched or drilled filler paper;
• Three-ring or multiple-ring binders, or notebook organizers incorporating such a ring binder provided that they do not include subject paper;
• Index cards; • Printed books and other books that
are case bound through the inclusion of binders board, a spine strip, and cover wrap;
• Newspapers; • Pictures and photographs; • desk and wall calendars and
organizers (including but not limited to such products generally known as ‘‘office planners,’’ ‘‘time books,’’ and ‘‘appointment books’’);
• Telephone logs; • Address books; • Columnar pads & tablets, with or
without covers, primarily suited for the recording of written numerical business data;
• Lined business or office forms, including but not limited to: preprinted business forms, lined invoice pads and paper, mailing and address labels, manifests, and shipping log books;
• Lined continuous computer paper; • Boxed or packaged writing
stationery (including but not limited to products commonly known as ‘‘fine business paper,’’ ‘‘parchment paper,’’ and ‘‘letterhead’’), whether or not containing a lined header or decorative lines;
• Stenographic pads (‘‘steno pads’’), Gregg ruled,3 measuring 6 inches by 9 inches;
Also excluded from the scope of these orders are the following trademarked products:
• FlyTM lined paper products: A notebook, notebook organizer, loose or glued note paper, with papers that are printed with infrared reflective inks and readable only by a FlyTM pen-top computer. The product must bear the valid trademark FlyTM.4
• ZwipesTM: A notebook or notebook organizer made with a blended polyolefin writing surface as the cover and pocket surfaces of the notebook, suitable for writing using a specially- developed permanent marker and erase system (known as a ZwipesTM pen). This system allows the marker portion to mark the writing surface with a permanent ink. The eraser portion of the marker dispenses a solvent capable of solubilizing the permanent ink allowing the ink to be removed. The product must bear the valid trademark ZwipesTM.5
• FiveStar® AdvanceTM: A notebook or notebook organizer bound by a continuous spiral, or helical, wire and with plastic front and rear covers made of a blended polyolefin plastic material joined by 300 denier polyester, coated on the backside with PVC (poly vinyl chloride) coating, and extending the entire length of the spiral or helical wire. The polyolefin plastic covers are of specific thickness; front cover is 0.019 inches (within normal manufacturing tolerances) and rear cover is 0.028 inches (within normal manufacturing tolerances). Integral with the stitching that attaches the polyester spine covering, is captured both ends of a 1’’ wide elastic fabric band. This band is located 23⁄8″ from the top of the front plastic cover and provides pen or pencil storage. Both ends of the spiral wire are cut and then bent backwards to overlap with the previous coil but specifically outside the coil diameter but inside the polyester covering. During construction, the polyester covering is sewn to the front and rear covers face to face (outside to outside) so that when the book is closed, the stitching is concealed from the outside. Both free ends (the ends not sewn to the cover and back) are stitched with a turned edge construction. The flexible polyester material forms a covering over the spiral wire to protect it and provide a comfortable grip on the product. The
product must bear the valid trademarks FiveStar® AdvanceTM.6
• FiveStar FlexTM: A notebook, a notebook organizer, or binder with plastic polyolefin front and rear covers joined by 300 denier polyester spine cover extending the entire length of the spine and bound by a 3-ring plastic fixture. The polyolefin plastic covers are of a specific thickness; front cover is 0.019 inches (within normal manufacturing tolerances) and rear cover is 0.028 inches (within normal manufacturing tolerances). During construction, the polyester covering is sewn to the front cover face to face (outside to outside) so that when the book is closed, the stitching is concealed from the outside. During construction, the polyester cover is sewn to the back cover with the outside of the polyester spine cover to the inside back cover. Both free ends (the ends not sewn to the cover and back) are stitched with a turned edge construction. Each ring within the fixture is comprised of a flexible strap portion that snaps into a stationary post which forms a closed binding ring. The ring fixture is riveted with six metal rivets and sewn to the back plastic cover and is specifically positioned on the outside back cover. The product must bear the valid trademark FiveStar FlexTM.7
Since the issuance of the PRC order, the Department has clarified the scope of the order in response to numerous scope inquiries. In addition, on September 23, 2011, the Department revoked, in part, the PRC AD order with respect to FiveStar® AdvanceTM notebooks and notebook organizers without PVC coatings. See Certain Lined Paper Products From People’s Republic of China: Final Results of Antidumping Duty Changed Circumstances Review and Revocation, in Part, 76 FR 60803 (September 30, 2011).
Merchandise subject to these orders is typically imported under headings 4810.22.5044, 4811.90.9050, 4820.10.2010, 4820.10.2020, 4820.10.2030, 4820.10.2040, 4820.10.2060, and 4820.10.4000 of the Harmonized Tariff Schedule of the United States (‘‘HTSUS’’). The tariff classifications are provided for convenience and customs purposes; however, the written description of the scope of the orders is dispositive.
VerDate Mar<15>2010 17:04 Dec 05, 2011 Jkt 226001 PO 00000 Frm 00005 Fmt 4703 Sfmt 4703 E:\FR\FM\06DEN1.SGM 06DEN1jlent
ini o
n D
SK
4TP
TV
N1P
RO
D w
ith N
OT
ICE
S

76125 Federal Register / Vol. 76, No. 234 / Tuesday, December 6, 2011 / Notices
Analysis of Comments Received
All issues raised in these reviews are addressed in the Issues and Decision Memorandum (‘‘Decision Memorandum’’) from Christian Marsh, Deputy Assistant Secretary for Antidumping and Countervailing Duty Operations, to Paul Piquado, Assistant Secretary for Import Administration, dated concurrently with this notice, which is hereby adopted by this notice. Parties can find a complete discussion of all issues raised in this review and the corresponding recommendation in this public memorandum which is on file electronically via Import Administration’s Antidumping and
Countervailing Duty Centralized Electronic Service System (‘‘IA ACCESS’’). Access to IA ACCESS is available in the Central Records Unit, room 7046, of the main Commerce building. In addition, a complete version of the Decision Memorandum can be accessed directly on the Web at http://ia.ita.doc.gov/frn. The electronic versions of the Decision Memorandum in IA ACCESS and on the Web are identical in content.
Final Results of Review
Pursuant to sections 752(c)(1) and (3) of the Act, we determine that revocation of the antidumping duty orders on CLPP from India, Indonesia, and the PRC
would be likely to lead to continuation or recurrence of dumping at the following weighted-average percentage margins:
Country manufacturer/exporter Margin (percent)
India: Aero Exports ........................... 23.17 Kejriwal Paper Limited ............ 3.91 Navneet Publications (India)
Ltd. ....................................... 23.17 All Others ................................ 3.91
Indonesia: PT. Pabrik Kertas Tjiwi Kimia
Tbk ....................................... 118.63 All Others ................................ 97.85
PRC
Exporter Producer Margin (percent)
Shanghai Lian Li Paper Products Co., Ltd ................................. Shanghai Lian Li Paper Products Co., Ltd ................................ 94.91 Shanghai Lian Li Paper Products Co., Ltd ................................. Sentian Paper Products Co., Ltd ............................................... 94.91 Shanghai Lian Li Paper Products Co., Ltd ................................. Shanghai Miaopaofang Paper Products Co., Ltd ...................... 94.91 Shanghai Lian Li Paper Products Co., Ltd ................................. Shanghai Pudong Wenbao Paper Products Co., Ltd ................ 94.91 Shanghai Lian Li Paper Products Co., Ltd ................................. Changshu Changjiang Printing Co., Ltd .................................... 94.91 Shanghai Lian Li Paper Products Co., Ltd ................................. Shanghai Loutang Stationery Factory ....................................... 94.91 Shanghai Lian Li Paper Products Co., Ltd ................................. Shanghai Beijia Paper Products Co., Ltd .................................. 94.91 Ningbo Guangbo Imports and Exports Co. Ltd .......................... Ningbo Guangbo Plastic Products Manufacture Co., Ltd .......... 78.38 Yalong Paper Products (Kunshan) Co., Ltd ............................... Yalong Paper Products (Kunshan) Co., Ltd .............................. 78.38 Suzhou Industrial Park Asia Pacific Paper Converting Co., Ltd Suzhou Industrial Park Asia Pacific Paper Converting Co., Ltd 78.38 Sunshine International Group (HK) Ltd ...................................... Dongguan Shipai Tonzex Electronics Plastic Stationery Fac-
tory.78.38
Sunshine International Group (HK) Ltd ...................................... Dongguan Kwong Wo Stationery Co., Ltd ................................. 78.38 Sunshine International Group (HK) Ltd ...................................... Hua Lian Electronics Plastic Stationery Co., Ltd ....................... 78.38 Suzhou Industrial Park You-You Trading Co., Ltd ..................... Linqing YinXing Paper Co., Ltd ................................................. 78.38 Suzhou Industrial Park You-You Trading Co., Ltd ..................... Jiaxing Seagull Paper Products Co., Ltd ................................... 78.38 Suzhou Industrial Park You-You Trading Co., Ltd ..................... Shenda Paper Product Factory ................................................. 78.38 Suzhou Industrial Park You-You Trading Co., Ltd ..................... Lianyi Paper Product Factory .................................................... 78.38 Suzhou Industrial Park You-You Trading Co., Ltd ..................... Changhang Paper Product Factory ........................................... 78.38 Suzhou Industrial Park You-You Trading Co., Ltd ..................... Tianlong Paper Product Factory ................................................ 78.38 Suzhou Industrial Park You-You Trading Co., Ltd ..................... Rugao Paper Printer Co., Ltd .................................................... 78.38 Suzhou Industrial Park You-You Trading Co., Ltd ..................... Yinlong Paper Product Factory .................................................. 78.38 You You Paper Products (Suzhou) Co., Ltd .............................. You You Paper Products (Suzhou) Co., Ltd ............................. 78.38 Haijing Stationery (Shanghai) Co., Ltd ....................................... Haijing Stationery (Shanghai) Co., Ltd ...................................... 78.38 Orient International Holding Shanghai Foreign Trade Co., Ltd .. Yalong Paper Products (Kunshan) Co., Ltd .............................. 78.38 Orient International Holding Shanghai Foreign Trade Co., Ltd .. Shanghai Comwell Stationery Co., Ltd ...................................... 78.38 Orient International Holding Shanghai Foreign Trade Co., Ltd .. Yuezhou Paper Co., Ltd ............................................................ 78.38 Orient International Holding Shanghai Foreign Trade Co., Ltd .. Changshu Guangming Stationery Co., Ltd ................................ 78.38 Shanghai Foreign Trade Enterprise Co., Ltd ............................. Shanghai Xin Zhi Liang Culture Products Co., Ltd ................... 78.38 Shanghai Foreign Trade Enterprise Co., Ltd ............................. Shangyu Zhongsheng Paper Products Co., Ltd ........................ 78.38 Shanghai Foreign Trade Enterprise Co., Ltd ............................. Shanghai Miaoxi Paper Products Factory ................................. 78.38 Shanghai Foreign Trade Enterprise Co., Ltd ............................. Shanghai Xueya Stationery Co., Ltd ......................................... 78.38 Anhui Light Industries International Co., Ltd .............................. Shanghai Pudong Wenbao Paper Products Factory ................. 78.38 Anhui Light Industries International Co., Ltd .............................. Foshan City Wenhai Paper Factory ........................................... 78.38 Fujian Hengda Group Co., Ltd ................................................... Fujian Hengda Group Co., Ltd ................................................... 78.38 Changshu Changjiang Printing Co., Ltd ..................................... Changshu Changjiang Paper Industry Co., Ltd ......................... 78.38 Jiaxing Te Gao Te Paper Products Co., Ltd .............................. Jiaxing Te Gao Te Paper Products Co., Ltd ............................. 78.38 Jiaxing Te Gao Te Paper Products Co., Ltd .............................. Jiaxing Seagull Paper Products Co., Ltd ................................... 78.38 Jiaxing Te Gao Te Paper Products Co., Ltd .............................. Jiaxing Boshi Paper Products Co., Ltd ...................................... 78.38 Chinapack Ningbo Paper Products Co., Ltd .............................. Jiaxing Te Gao Te Paper Products Co., Ltd ............................. 78.38 Linqing Silver Star Paper Products Co., Ltd .............................. Linqing Silver Star Paper Products Co., Ltd .............................. 78.38 Wah Kin Stationery and Paper Product Limited ......................... Shenzhen Baoan Waijing Development Company .................... 78.38 Shanghai Pudong Wenbao Paper Products Factory ................. Shanghai Pudong Wenbao Paper Products Factory ................. 78.38 Shanghai Pudong Wenbao Paper Products Factory ................. Linqing Glistar Paper Products Co., Ltd .................................... 78.38 Shanghai Pudong Wenbao Paper Products Factory ................. Changshu Changjiang Printing Co., Ltd .................................... 78.38 Shanghai Pudong Wenbao Paper Products Factory ................. Linqing Silver Star Paper Products Co., Ltd .............................. 78.38 Paperline Limited ........................................................................ Shanghai Pudong Wenbao Paper Products Factory ................. 78.38 Paperline Limited ........................................................................ Linqing Glistar Paper Products Co., Ltd .................................... 78.38 Paperline Limited ........................................................................ Changshu Changjiang Printing Co., Ltd .................................... 78.38 Paperline Limited ........................................................................ Linqing Silver Star Paper Products Co., Ltd .............................. 78.38 Paperline Limited ........................................................................ Jiaxing Te Gao Te Paper Products Co., Ltd ............................. 78.38 Paperline Limited ........................................................................ Yantai License Printing & Making Co., Ltd ................................ 78.38
VerDate Mar<15>2010 17:04 Dec 05, 2011 Jkt 226001 PO 00000 Frm 00006 Fmt 4703 Sfmt 4703 E:\FR\FM\06DEN1.SGM 06DEN1jlent
ini o
n D
SK
4TP
TV
N1P
RO
D w
ith N
OT
ICE
S

76126 Federal Register / Vol. 76, No. 234 / Tuesday, December 6, 2011 / Notices
1 See Uncovered Innerspring Units from the People’s Republic of China: Notice of Antidumping Duty Order, 74 FR 7661 (February 19, 2009).
2 The petitioner is Leggett & Platt, Inc. (hereinafter referred to as ‘‘Petitioner’’).
3 See Initiation of Antidumping Duty Administrative Reviews, Requests for Revocation in Part, and Deferral of Administrative Review, 76 FR 17825 (March 31, 2011).
4 See Letter from Department to Reztec, regarding Second Administrative Review of Uncovered Innerspring Units from the People’s Republic of China: Antidumping Duty Questionnaire, dated April 28, 2011; and Letter from Department to Goodnite, regarding Second Administrative Review of Uncovered Innerspring Units from the People’s Republic of China: Antidumping Duty Questionnaire, dated April 28, 2011.
5 See Memorandum to the File, from Susan Pulongbarit, International Trade Analyst, AD/CVD Office 9, Import Administration, regarding 2010– 2011 Administrative Review of Uncovered Innerspring Units from the People’s Republic of China: Confirmation of Receipt, dated May 17, 2011.
6 See Letter from Reztec, to the Secretary of Commerce, regarding Uncovered Innerspring Units from China Entry of Appearance and No-Shipment Letter of Reztec Industries Sdn Bhd, dated May 19, 2011.
Exporter Producer Margin (percent)
Yantai License Printing & Making Co., Ltd ................................ Yantai License Printing & Making Co., Ltd ................................ 78.38 Paperline Limited ........................................................................ Anhui Jinhua Import & Export Co., Ltd ...................................... 78.38 Essential Industries Limited ........................................................ Dongguan Yizhi Gao Paper Products Ltd ................................. 78.38 MGA Entertainment (H.K.) Limited ............................................. Kon Dai (Far East) Packaging Co., Ltd ..................................... 78.38 MGA Entertainment (H.K.) Limited ............................................. Dong Guan Huang Giang Rong Da Printing Factory ................ 78.38 MGA Entertainment (H.K.) Limited ............................................. Dong Guan Huang Giang Da Printing Co., Limited .................. 78.38 Excel Sheen Limited ................................................................... Dongguan Shipai Fuda Stationery Factory ................................ 78.38 Maxleaf Stationery Ltd ................................................................ Maxleaf Stationery Ltd ............................................................... 78.38 PRC Entity* ................................................................................. ..................................................................................................... 258.21
*Including Atico, Planet International, the companies that did not respond to the Q&V questionnaire in the underlying investigation, and Watanabe Paper Products.
Notification Regarding Administrative Protective Order
This notice also serves as the only reminder to parties subject to administrative protective order (‘‘APO’’) of their responsibility concerning the return or destruction of proprietary information disclosed under APO in accordance with 19 CFR 351.305. Timely notification of the return or destruction of APO materials or conversion to judicial protective orders is hereby requested. Failure to comply with the regulations and terms of an APO is a violation which is subject to sanction.
We are issuing and publishing the final results and notice in accordance with sections 751(c), 752(c), and 777(i)(1) of the Act.
Dated: November 29, 2011. Paul Piquado, Assistant Secretary for Import Administration. [FR Doc. 2011–31286 Filed 12–5–11; 8:45 am]
BILLING CODE 3510–DS–P
DEPARTMENT OF COMMERCE
International Trade Administration
[A–570–928]
Uncovered Innerspring Units from the People’s Republic of China: Preliminary Results and Preliminary Rescission, in Part, of the Antidumping Duty Administrative Review
AGENCY: Import Administration, International Trade Administration, Department of Commerce. SUMMARY: The Department of Commerce (‘‘Department’’) is conducting an administrative review of the antidumping duty order 1 on uncovered innerspring units (‘‘innersprings’’) from the People’s Republic of China (‘‘PRC’’) for the period of review (‘‘POR’’) February 1, 2010, through January 31,
2011. As discussed below, we preliminarily determine that Goodnite Sdn Bhd (‘‘Goodnite’’) failed to cooperate to the best of its ability and are, therefore, applying adverse facts available (‘‘AFA’’) to Goodnite’s PRC- origin merchandise. If these preliminary results are adopted in our final results of review, we will instruct U.S. Customs and Border Protection (‘‘CBP’’) to assess antidumping duties on entries of subject merchandise during the POR. FOR FURTHER INFORMATION CONTACT: Susan Pulongbarit, AD/CVD Operations, Office 9, Import Administration, International Trade Administration, Department of Commerce, 14th Street and Constitution Avenue NW., Washington, DC 20230; telephone: (202) 482–4031. SUPPLEMENTARY INFORMATION:
Case Timeline On February 28, 2011, the Department
received a request from Petitioner 2 to conduct an administrative review of two companies, Reztec Industries Sdn Bhd (‘‘Reztec’’) and Goodnite. On March 31, 2011, the Department published in the Federal Register a notice of initiation of an administrative review of the antidumping duty order on innersprings from the PRC.3
On April 28, 2011, the Department issued antidumping duty questionnaires to Reztec and Goodnite, since they were the only two companies for which a review was requested.4 On May 3, 2011, Goodnite received the antidumping duty questionnaire issued by the
Department.5 On May 19, 2011, Reztec submitted a no-shipment certification to the Department.6 Goodnite did not respond to the Department’s questionnaire.
Scope of the Order The merchandise subject to the order
is uncovered innerspring units composed of a series of individual metal springs joined together in sizes corresponding to the sizes of adult mattresses (e.g., twin, twin long, full, full long, queen, California king and king) and units used in smaller constructions, such as crib and youth mattresses. All uncovered innerspring units are included in the scope regardless of width and length. Included within this definition are innersprings typically ranging from 30.5 inches to 76 inches in width and 68 inches to 84 inches in length. Innersprings for crib mattresses typically range from 25 inches to 27 inches in width and 50 inches to 52 inches in length.
Uncovered innerspring units are suitable for use as the innerspring component in the manufacture of innerspring mattresses, including mattresses that incorporate a foam encasement around the innerspring.
Pocketed and non-pocketed innerspring units are included in this definition. Non-pocketed innersprings are typically joined together with helical wire and border rods. Non-pocketed innersprings are included in this definition regardless of whether they have border rods attached to the perimeter of the innerspring. Pocketed innersprings are individual coils covered by a ‘‘pocket’’ or ‘‘sock’’ of a
VerDate Mar<15>2010 17:04 Dec 05, 2011 Jkt 226001 PO 00000 Frm 00007 Fmt 4703 Sfmt 4703 E:\FR\FM\06DEN1.SGM 06DEN1jlent
ini o
n D
SK
4TP
TV
N1P
RO
D w
ith N
OT
ICE
S

5055 Federal Register / Vol. 77, No. 21 / Wednesday, February 1, 2012 / Notices
please explain why and provide alternative definitions.
Authority: This review is being conducted under authority of Title VII of the Tariff Act of 1930; this notice is published pursuant to section 207.61 of the Commission’s rules.
Issued: January 25, 2012. By order of the Commission.
James R. Holbein, Secretary to the Commission. [FR Doc. 2012–1920 Filed 1–31–12; 8:45 am]
BILLING CODE 7020–02–P
INTERNATIONAL TRADE COMMISSION
[Investigation No. 337–TA–782]
Certain Liquid Crystal Display Devices and Products Containing the Same; Determination Not To Review Initial Determination Granting Joint Motion To Terminate Based on Settlement Agreement; Termination of the Investigation
AGENCY: U.S. International Trade Commission. ACTION: Notice. SUMMARY: Notice is hereby given that the U.S. International Trade Commission has determined not to review an initial determination (‘‘ID’’) (Order No. 10) of the presiding administrative law judge (‘‘ALJ’’) granting a joint motion to terminate the investigation based on a settlement agreement in the above-referenced investigation. FOR FURTHER INFORMATION CONTACT: Jia Chen, Office of the General Counsel, U.S. International Trade Commission, 500 E Street SW., Washington, DC 20436, telephone (202) 708–4737. Copies of non-confidential documents filed in connection with this investigation are or will be available for inspection during official business hours (8:45 a.m. to 5:15 p.m.) in the Office of the Secretary, U.S. International Trade Commission, 500 E Street, SW., Washington, DC 20436, telephone (202) 205–2000. General information concerning the Commission may also be obtained by accessing its Internet server at http://www.usitc.gov. The public record for this investigation may be viewed on the Commission’s electronic docket (EDIS) at http:// edis.usitc.gov. Hearing-impaired persons are advised that information on this matter can be obtained by contacting the Commission’s TDD terminal on (202) 205–1810. SUPPLEMENTARY INFORMATION: The Commission instituted this investigation on July 7, 2011, based on a complaint
filed by Samsung Electronics Co., Ltd. of Korea. 76 FR 39897 (Jul. 7, 2011). The complaint, as amended, alleges violations of section 337 of the Tariff Act of 1930 (19 U.S.C. § 1337) by reason of infringement of certain claims of U.S. Patent Nos. 6,771,344; 6,882,375; 7,535,537; 7,787,087; and RE41,363. The complaint names AU Optronics Corp. of Hsinchu, Taiwan; AU Optronics Corporation America of Houston, Texas; Acer America Corporation of San Jose, California; Acer Inc. of Taipei, Taiwan; BenQ America of Irvine, California; BenQ Corp. of Taipei, Taiwan; SANYO Electric Co., Ltd. of Osaka, Japan; and SANYO North America Corporation of San Diego, California as respondents. SANYO North America was subsequently terminated from the investigation.
On January 9, 2012, the parties filed a joint motion to terminate the investigation based on a settlement agreement. On July 21, 2011, the ALJ issued the subject ID granting the joint motion. No petitions for review were filed.
The Commission has determined not to review the subject ID.
The authority for the Commission’s determination is contained in Section 337 of the Tariff Act of 1930, as amended (19 U.S.C. 1337), and in section 210.42 of the Commission’s Rules of Practice and Procedure (19 CFR 210.42).
Issued: January 26, 2012. By order of the Commission.
James R. Holbein, Secretary to the Commission. [FR Doc. 2012–2145 Filed 1–31–12; 8:45 am]
BILLING CODE 7020–02–P
INTERNATIONAL TRADE COMMISSION
[Investigation Nos. 701–TA–442–443 and 731–TA–1095–1097 (Review)]
Certain Lined Paper School Supplies From China, India, and Indonesia; Scheduling of Full Five-Year Reviews
AGENCY: United States International Trade Commission. ACTION: Notice.
SUMMARY: The Commission hereby gives notice of the scheduling of full reviews pursuant to section 751(c)(5) of the Tariff Act of 1930 (19 U.S.C. 1675(c)(5)) (the Act) to determine whether revocation of the countervailing duty orders on certain lined paper school supplies from India and Indonesia and/ or the revocation of the antidumping duty orders on certain lined paper
school supplies from China, India, and Indonesia would be likely to lead to continuation or recurrence of material injury within a reasonably foreseeable time. The Commission has determined that these reviews are extraordinarily complicated, and will therefore exercise its authority to extend the review period by up to 90 days pursuant to 19 U.S.C. 1675(c)(5)(B). For further information concerning the conduct of these reviews and rules of general application, consult the Commission’s Rules of Practice and Procedure, part 201, subparts A through E (19 CFR part 201), and part 207, subparts A, D, E, and F (19 CFR part 207). DATES: Effective Date: January 26, 2012. FOR FURTHER INFORMATION CONTACT: Amy Sherman (202) 205–3289), Office of Investigations, U.S. International Trade Commission, 500 E Street SW., Washington, DC 20436. Hearing- impaired persons can obtain information on this matter by contacting the Commission’s TDD terminal on (202) 205–1810. Persons with mobility impairments who will need special assistance in gaining access to the Commission should contact the Office of the Secretary at (202) 205–2000. General information concerning the Commission may also be obtained by accessing its internet server (http:// www.usitc.gov). The public record for these reviews may be viewed on the Commission’s electronic docket (EDIS) at http://edis.usitc.gov. SUPPLEMENTARY INFORMATION:
Background.—On November 4, 2011, the Commission determined that responses to its notice of institution of the subject five-year reviews were such that full reviews pursuant to section 751(c)(5) of the Act should proceed (76 FR 72213, November 22, 2011). A record of the Commissioners’ votes, the Commission’s statement on adequacy, and any individual Commissioner’s statements are available from the Office of the Secretary and at the Commission’s Web site.
Participation in the reviews and public service list.—Persons, including industrial users of the subject merchandise and, if the merchandise is sold at the retail level, representative consumer organizations, wishing to participate in these reviews as parties must file an entry of appearance with the Secretary to the Commission, as provided in section 201.11 of the Commission’s rules, by 45 days after publication of this notice. A party that filed a notice of appearance following publication of the Commission’s notice of institution of the reviews need not file an additional notice of appearance.
VerDate Mar<15>2010 17:03 Jan 31, 2012 Jkt 226001 PO 00000 Frm 00075 Fmt 4703 Sfmt 4703 E:\FR\FM\01FEN1.SGM 01FEN1tkel
ley
on D
SK
3SP
TV
N1P
RO
D w
ith N
OT
ICE
S

5056 Federal Register / Vol. 77, No. 21 / Wednesday, February 1, 2012 / Notices
The Secretary will maintain a public service list containing the names and addresses of all persons, or their representatives, who are parties to the reviews.
Limited disclosure of business proprietary information (BPI) under an administrative protective order (APO) and BPI service list.—Pursuant to section 207.7(a) of the Commission’s rules, the Secretary will make BPI gathered in these reviews available to authorized applicants under the APO issued in the reviews, provided that the application is made by 45 days after publication of this notice. Authorized applicants must represent interested parties, as defined by 19 U.S.C. 1677(9), who are parties to the reviews. A party granted access to BPI following publication of the Commission’s notice of institution of the reviews need not reapply for such access. A separate service list will be maintained by the Secretary for those parties authorized to receive BPI under the APO.
Staff report.—The prehearing staff report in these reviews will be placed in the nonpublic record on May 22, 2012, and a public version will be issued thereafter, pursuant to section 207.64 of the Commission’s rules.
Hearing.—The Commission will hold a hearing in connection with the reviews beginning at 9:30 a.m. on June 12, 2012, at the U.S. International Trade Commission Building. Requests to appear at the hearing should be filed in writing with the Secretary to the Commission on or before June 6, 2012. A nonparty who has testimony that may aid the Commission’s deliberations may request permission to present a short statement at the hearing. All parties and nonparties desiring to appear at the hearing and make oral presentations should attend a prehearing conference to be held at 9:30 a.m. on June 8, 2012, at the U.S. International Trade Commission Building. Oral testimony and written materials to be submitted at the public hearing are governed by sections 201.6(b)(2), 201.13(f), 207.24, and 207.66 of the Commission’s rules. Parties must submit any request to present a portion of their hearing testimony in camera no later than 7 business days prior to the date of the hearing.
Written submissions.—Each party to the reviews may submit a prehearing brief to the Commission. Prehearing briefs must conform with the provisions of section 207.65 of the Commission’s rules; the deadline for filing is June 1, 2012. Parties may also file written testimony in connection with their presentation at the hearing, as provided in section 207.24 of the Commission’s
rules, and posthearing briefs, which must conform with the provisions of section 207.67 of the Commission’s rules. The deadline for filing posthearing briefs is June 21, 2012; witness testimony must be filed no later than three days before the hearing. In addition, any person who has not entered an appearance as a party to the reviews may submit a written statement of information pertinent to the subject of the reviews on or before June 21, 2012. On July 23, 2012, the Commission will make available to parties all information on which they have not had an opportunity to comment. Parties may submit final comments on this information on or before July 25, 2012, but such final comments must not contain new factual information and must otherwise comply with section 207.68 of the Commission’s rules. All written submissions must conform with the provisions of section 201.8 of the Commission’s rules; any submissions that contain BPI must also conform with the requirements of sections 201.6, 207.3, and 207.7 of the Commission’s rules. Please be aware that the Commission’s rules with respect to electronic filing have been amended. The amendments took effect on November 7, 2011. See 76 FR 61937 (Oct. 6, 2011) and the newly revised Commission’s Handbook on E-Filing, available on the Commission’s Web site at http://edis.usitc.gov.
Additional written submissions to the Commission, including requests pursuant to section 201.12 of the Commission’s rules, shall not be accepted unless good cause is shown for accepting such submissions, or unless the submission is pursuant to a specific request by a Commissioner or Commission staff.
In accordance with sections 201.16(c) and 207.3 of the Commission’s rules, each document filed by a party to the reviews must be served on all other parties to the reviews (as identified by either the public or BPI service list), and a certificate of service must be timely filed. The Secretary will not accept a document for filing without a certificate of service.
Authority: These reviews are being conducted under authority of title VII of the Tariff Act of 1930; this notice is published pursuant to section 207.62 of the Commission’s rules.
Issued: January 26, 2012. By order of the Commission.
James R. Holbein, Secretary to the Commission. [FR Doc. 2012–2146 Filed 1–31–12; 8:45 am]
BILLING CODE 7020–02–P
DEPARTMENT OF JUSTICE
[OMB Number 1105–0092]
Agency Information Collection Activities: Proposed Collection; Comments Requested: September 11th Victim Compensation Fund Claimant Eligibility and Compensation Form
ACTION: 60-Day Notice of information collection under review.
The Department of Justice (DOJ), Civil Division, September 11th Victim Compensation Fund, will be submitting the following information collection request to the Office of Management and Budget (OMB) for review and approval in accordance with the Paperwork Reduction Act of 1995. The proposed information collection is published to obtain comments from the public and affected agencies. Comments are encouraged and will be accepted for ‘‘sixty days’’ until April 2, 2012. This process is conducted in accordance with 5 CFR 1320.10.
Written comments concerning this information collection should be sent to the Office of Information and Regulatory Affairs, Office of Management and Budget, Attn: DOJ Desk Officer. The best way to ensure your comments are received is to email them to [email protected] or fax them to (202) 395–7285. All comments should reference the 8 digit OMB number for the collection or the title of the collection. If you have questions concerning the collection, please call Jonathan Olin at (202) 514–5585.
Written comments and suggestions from the public and affected agencies concerning the proposed collection of information are encouraged. Your comments should address one or more of the following four points: —Evaluate whether the proposed
collection of information is necessary for the proper performance of the functions of the agency, including whether the information will have practical utility;
—Evaluate the accuracy of the agency’s estimate of the burden of the proposed collection of information, including the validity of the methodology and assumptions used;
—Enhance the quality, utility, and clarity of the information to be collected; and
—Minimize the burden of the collection of information on those who are to respond, including through the use of appropriate automated, electronic, mechanical, or other technological collection techniques or other forms of information technology, e.g.,
VerDate Mar<15>2010 17:03 Jan 31, 2012 Jkt 226001 PO 00000 Frm 00076 Fmt 4703 Sfmt 4703 E:\FR\FM\01FEN1.SGM 01FEN1tkel
ley
on D
SK
3SP
TV
N1P
RO
D w
ith N
OT
ICE
S

EXPLANATION OF COMMISSION DETERMINATIONS ON ADEQUACY
in
Lined Paper School Supplies from China, India, and IndonesiaInv. Nos. 701-TA-442-443 and 731-TA-1095-1097 (Review)
On November 4, 2011, the Commission determined that it should proceed to full reviews in eachof the subject five-year reviews pursuant to section 751(c)(5) of the Tariff Act of 1930, as amended,19 U.S.C. § 1675(c)(5).1
The Commission received one response to the notice of institution filed by domestic interestedparties, which was filed by the Association of American School Paper Suppliers (“AASPS”), a tradeassociation whose membership consists of three U.S. producers of lined paper school supplies (“linedpaper”). These are MWV Consumer & Office Products, Norcom, Inc., and Top Flight, Inc. TheCommission found the individual response of AASPS to be adequate. Because the membership ofAASPS represents a substantial proportion of domestic production of lined paper, the Commission furtherdetermined that the domestic interested party group response was adequate with respect to all reviews.
With respect to the review of the antidumping duty order and countervailing duty order on linedpaper from India, the Commission received a response to the notice of institution jointly filed by eightfirms that identify themselves as producers and/or exporters of the subject merchandise from India. TheseIndian Respondents are FFI International, Lodha Offset Limited, Marisa International, NavneetPublications (India) Ltd., Pioneer Stationery Pvt. Ltd., Riddhi Enterprises, Sab International, and SGMPaper Products. The Commission found the response of each individual Indian Respondent to beadequate. Because the record in the adequacy phase of these reviews indicates that Indian Respondentscollectively accounted for a substantial share of 2010 exports of the subject merchandise from India, andthat the subject industry in India is highly fragmented, the Commission further determined that therespondent interested party group response for the reviews on subject merchandise from India wasadequate. The Commission accordingly determined to conduct full reviews of the orders on lined paperfrom India.
The Commission received no response to the notice of institution from respondent interestedparties with respect to the review of the antidumping duty order on subject merchandise from China andtherefore determined that the respondent interested party group response from China was inadequate. TheCommission nevertheless determined to conduct a full review of the order on lined paper from China inorder to promote administrative efficiency in light of its decision to conduct full reviews of the orders onlined paper from India.
1 Commissioner Charlotte R. Lane dissenting. Commissioner Lane found that the respondentinterested party group response for the reviews on subject merchandise from India was inadequatebecause the responding Indian producers did not account for a substantial portion of total Indianproduction. In the absence of an adequate respondent interested party group response or any othercircumstances warranting full reviews, she would have conducted expedited reviews of the orders onsubject merchandise from India. In the absence of an adequate respondent interested party groupresponse for the reviews concerning subject imports from China and Indonesia or any other circumstanceswarranting full reviews, she would have conducted expedited reviews of the orders on subjectmerchandise from China and Indonesia.

The Commission received no response to the notice of institution from respondent interestedparties with respect to the reviews of the antidumping duty order and countervailing duty order on subject merchandise from Indonesia and therefore determined that the respondent interested party groupresponse from Indonesia was inadequate. The Commission nevertheless determined to conduct fullreviews of the orders on lined paper from Indonesia in order to promote administrative efficiency in lightof its decision to conduct full reviews of the orders on lined paper from India.
A record of the Commissioners’ votes is available from the Office of the Secretary and theCommission’s web site (www.usitc.gov).

APPENDIX B
HEARING WITNESSES
B-1


CALENDAR OF PUBLIC HEARING
Those listed below appeared as witnesses at the United States International Trade Commission’shearing:
Subject: Certain Lined Paper School Supplies from China, India, andIndonesia
Inv. Nos.: 701-TA-442-443 and 731-TA-1095-1097 (Review)
Date and Time: June 12, 2012 - 9:30 a.m.
Sessions were held in connection with these investigations in the Main Hearing Room (room 101),500 E Street, S.W., Washington, D.C.
OPENING REMARKS:
In Support of Continuation of Orders (Alan H. Price, Wiley Rein LLP)
In Opposition to Continuation of Orders (Michael T. Shor,Arnold & Porter LLP and Mark D. Davis, Davis & Leiman P.C.)
In Support of the Continuation of the Antidumping and Countervailing Duty Orders:
Wiley Rein LLPWashington, D.C.on behalf of
The Association of American School Paper Suppliers (“AASPS”)
Neil A. McLachlan, Executive Vice President,Mead Products LLC
James Mitchell, Senior Vice President,Mead Products LLC
Hal A. Rahn, President, Norcom, Inc.
B-3

In Support of the Continuation of the Antidumping and Countervailing Duty Orders (continued):
George Y. Robinson, Vice President ofSales, Top Flight, Inc.
Leeann Foster, Assistant to the International President, United Steelworkers
Dr. Seth T. Kaplan, Senior Economic Advisor, Capital Trade, Inc.
Alan H. Price )Timothy C. Brightbill ) – OF COUNSELMaureen R. Thorson )
In Opposition to the Continuation of the Antidumping and Countervailing Duty Orders:Arnold & Porter LLPWashington, D.C.on behalf of
Pt. Pabrik Kertas Tjiwi Kimia, Tbk. (“Tjiwi Kimia”)
Martinus Alfian, Business Unit Head, Sales and Marketing Stationery Export, Tjiwi Kimia
Dr. Brian Kelly, Economist, Brian Kelly Incorporated
Arvind Gupta, Director, Tjiwi Kimia
Ferry Harijadi, Business Unit Manager, OfficeProducts Converting Division, Tjiwi Kimia
B-4

In Opposition to the Continuation of the Antidumping and Countervailing Duty Orders:
Tom Lawlor, Director of Sales and Marketing,Charta Global
Michael T. Shor )) – OF COUNSEL
Matthew Roessing )Davis & Leiman P.C.Washington, D.C.on behalf of
FFI International; Lodha Offset Limited;Marisa International; Navneet Publications (India) Ltd.;Pioneer Stationery Pvt. Ptd.; Riddhi Enterprises;Sab International and SGM Paper Products(“Indian Producers”)
Dilip Sampat, President, Navneet Publications (India) Ltd.
Bruce Malashevich, President, Economic Consulting Services, LLC
Lauren Visek, Staff Economist, Economic Consulting Services, LLC
Mark D. Davis ) – OF COUNSEL
REBUTTAL/CLOSING REMARKS:
In Support of Continuation of Orders (Timothy C. Brightbill,Wiley Rein LLP; and Dr. Seth T. Kaplan, Capital Trade, Inc.)
In Opposition to Continuation of Orders (Michael T. Shor,Arnold & Porter LLP and Mark. D. Davis,Davis & Leiman P.C.)
-END-
B-5


APPENDIX C
SUMMARY DATA
C-1


Table C-1Lined paper products (LPP): Summary data concerning the U.S. market, 2006-11
(Quantity=1,000 pieces, value=1,000 dollars, unit values, unit labor costs, and unit expenses are per piece; period changes=percent, except where noted)Reported data Period changes
Item 2006 2007 2008 2009 2010 2011 2006-11 2006-07 2007-08 2008-09 2009-10 2010-11
U.S. consumption quantity: Amount . . . . . . . . . . . . . . . . . . 1,135,979 1,218,248 1,213,736 1,086,690 1,206,771 1,113,877 -1.9 7.2 -0.4 -10.5 11.1 -7.7 Producers' share (1) . . . . . . . . 27.4 22.7 23.4 23.6 22.5 25.3 -2.1 -4.6 0.7 0.1 -1.1 2.7 Importers' share [CLPSS] (1): China . . . . . . . . . . . . . . . . . . . 14.0 10.5 11.7 11.9 10.7 10.8 -3.3 -3.5 1.2 0.2 -1.2 0.1 India . . . . . . . . . . . . . . . . . . . . 2.1 3.5 3.0 4.0 3.4 3.1 0.9 1.3 -0.4 1.0 -0.7 -0.3 Indonesia . . . . . . . . . . . . . . . . 0.3 0.4 0.4 0.8 0.4 0.4 0.1 0.1 0.0 0.4 -0.4 -0.0 Subtotal (subject) . . . . . . . . 16.5 14.4 15.1 16.8 14.5 14.2 -2.2 -2.1 0.8 1.6 -2.2 -0.3 All other sources . . . . . . . . . . 26.4 30.1 32.1 26.2 26.5 24.9 -1.5 3.8 2.0 -5.9 0.3 -1.6 Total . . . . . . . . . . . . . . . . . . 42.8 44.5 47.3 43.0 41.0 39.1 -3.7 1.7 2.8 -4.3 -2.0 -1.9 Importers' share [OLPP] (1) . . . 29.8 32.8 29.3 33.4 36.5 35.6 5.8 2.9 -3.5 4.2 3.1 -0.9 Importers' share (total) (1) . . . 72.6 77.3 76.6 76.4 77.5 74.7 2.1 4.6 -0.7 -0.1 1.1 -2.7
U.S. consumption value: Amount . . . . . . . . . . . . . . . . . . 740,577 833,782 846,942 710,466 754,675 736,103 -0.6 12.6 1.6 -16.1 6.2 -2.5 Producers' share (1) . . . . . . . . 32.8 28.3 27.8 33.0 29.6 32.0 -0.8 -4.4 -0.6 5.2 -3.3 2.4 Importers' share [CLPSS] (1): China . . . . . . . . . . . . . . . . . . . 14.8 13.5 14.6 13.8 15.7 15.2 0.4 -1.4 1.1 -0.8 1.9 -0.5 India . . . . . . . . . . . . . . . . . . . . 1.4 3.0 2.3 3.3 2.9 2.4 1.0 1.5 -0.7 1.0 -0.4 -0.5 Indonesia . . . . . . . . . . . . . . . . 0.1 0.2 0.2 0.4 0.3 0.2 0.1 0.0 0.0 0.2 -0.1 -0.1 Subtotal (subject) . . . . . . . . 16.4 16.6 17.1 17.5 18.9 17.8 1.4 0.2 0.5 0.4 1.5 -1.1 All other sources . . . . . . . . . . 27.1 29.8 32.2 29.5 29.1 26.6 -0.5 2.7 2.4 -2.7 -0.4 -2.5 Total . . . . . . . . . . . . . . . . . . 43.5 46.4 49.3 47.0 48.0 44.5 1.0 2.9 2.9 -2.3 1.1 -3.6 Importers' share [OLPP] (1) . . . 23.7 25.3 23.0 20.1 22.3 23.5 -0.2 1.5 -2.3 -2.9 2.2 1.2 Importers' share (total) (1) . . . 67.2 71.7 72.2 67.0 70.4 68.0 0.8 4.4 0.6 -5.2 3.3 -2.4
U.S. imports of CLPSS from: China: Quantity . . . . . . . . . . . . . . . . . 159,562 128,262 141,967 129,796 129,581 120,247 -24.6 -19.6 10.7 -8.6 -0.2 -7.2 Value . . . . . . . . . . . . . . . . . . . 109,795 112,295 123,715 98,172 118,835 111,941 2.0 2.3 10.2 -20.6 21.0 -5.8 Unit value . . . . . . . . . . . . . . . $0.69 $0.88 $0.87 $0.76 $0.92 $0.93 35.3 27.2 -0.5 -13.2 21.2 1.5 Ending inventory quantity . . . *** *** *** *** *** *** *** *** *** *** *** *** India: Quantity . . . . . . . . . . . . . . . . . 24,240 42,421 36,882 43,940 40,568 33,994 40.2 75.0 -13.1 19.1 -7.7 -16.2 Value . . . . . . . . . . . . . . . . . . . 10,659 24,680 19,401 23,370 21,970 17,774 66.7 131.5 -21.4 20.5 -6.0 -19.1 Unit value . . . . . . . . . . . . . . . $0.44 $0.58 $0.53 $0.53 $0.54 $0.52 18.9 32.3 -9.6 1.1 1.8 -3.5 Ending inventory quantity . . . *** *** *** *** *** *** *** *** *** *** *** *** Indonesia: Quantity . . . . . . . . . . . . . . . . . 3,207 4,415 4,956 8,315 4,933 4,369 36.2 37.7 12.3 67.8 -40.7 -11.4 Value . . . . . . . . . . . . . . . . . . . 1,034 1,560 1,651 2,628 2,169 1,672 61.7 50.9 5.8 59.2 -17.5 -22.9 Unit value . . . . . . . . . . . . . . . $0.32 $0.35 $0.33 $0.32 $0.44 $0.38 18.7 9.6 -5.7 -5.1 39.1 -13.0 Ending inventory quantity . . . *** *** *** *** *** *** *** *** *** *** *** *** Subtotal (subject): Quantity . . . . . . . . . . . . . . . . . 187,009 175,097 183,804 182,052 175,083 158,610 -15.2 -6.4 5.0 -1.0 -3.8 -9.4 Value . . . . . . . . . . . . . . . . . . . 121,489 138,535 144,768 124,171 142,974 131,387 8.1 14.0 4.5 -14.2 15.1 -8.1 Unit value . . . . . . . . . . . . . . . $0.65 $0.79 $0.79 $0.68 $0.82 $0.83 27.5 21.8 -0.5 -13.4 19.7 1.4 Ending inventory quantity . . . *** *** *** *** *** *** *** *** *** *** *** *** All other sources: Quantity . . . . . . . . . . . . . . . . . 299,506 367,145 390,036 285,059 319,606 277,336 -7.4 22.6 6.2 -26.9 12.1 -13.2 Value . . . . . . . . . . . . . . . . . . . 200,642 248,189 272,694 209,458 219,582 195,959 -2.3 23.7 9.9 -23.2 4.8 -10.8 Unit value . . . . . . . . . . . . . . . $0.67 $0.68 $0.70 $0.73 $0.69 $0.71 5.5 0.9 3.4 5.1 -6.5 2.8 Ending inventory quantity . . . (2) (2) (2) (2) (2) (2) (2) (2) (2) (2) (2) (2) Total U.S. imports [CLPSS]: Quantity . . . . . . . . . . . . . . . . . 486,515 542,243 573,840 467,111 494,688 435,947 -10.4 11.5 5.8 -18.6 5.9 -11.9 Value . . . . . . . . . . . . . . . . . . . 322,131 386,724 417,461 333,629 362,556 327,346 1.6 20.1 7.9 -20.1 8.7 -9.7 Unit value . . . . . . . . . . . . . . . $0.66 $0.71 $0.73 $0.71 $0.73 $0.75 13.4 7.7 2.0 -1.8 2.6 2.5 Ending inventory quantity . . . (2) (2) (2) (2) (2) (2) (2) (2) (2) (2) (2) (2)Total U.S. imports [OLPP]: Quantity . . . . . . . . . . . . . . . . . . 338,716 399,065 355,426 363,371 440,408 396,623 17.1 17.8 -10.9 2.2 21.2 -9.9 Value . . . . . . . . . . . . . . . . . . . . 175,776 210,797 194,451 142,597 168,370 173,099 -1.5 19.9 -7.8 -26.7 18.1 2.8 Unit value . . . . . . . . . . . . . . . . $0.52 $0.53 $0.55 $0.39 $0.38 $0.44 -15.9 1.8 3.6 -28.3 -2.6 14.2 Ending inventory quantity . . . . (2) (2) (2) (2) (2) (2) (2) (2) (2) (2) (2) (2)Total U.S. imports: Quantity . . . . . . . . . . . . . . . . . . 825,231 941,308 929,266 830,482 935,097 832,570 0.9 14.1 -1.3 -10.6 12.6 -11.0 Value . . . . . . . . . . . . . . . . . . . . 497,907 597,520 611,912 476,226 530,926 500,446 0.5 20.0 2.4 -22.2 11.5 -5.7 Unit value . . . . . . . . . . . . . . . . $0.60 $0.63 $0.66 $0.57 $0.57 $0.60 -0.4 5.2 3.7 -12.9 -1.0 5.9 Ending inventory quantity . . . . *** *** *** *** *** *** *** *** *** *** *** ***
Table continued on next page.
C-3

Table C-1--ContinuedLined paper products (LPP): Summary data concerning the U.S. market, 2006-11
(Quantity=1,000 pieces, value=1,000 dollars, unit values, unit labor costs, and unit expenses are per piece; period changes=percent, except where noted)Reported data Period changes
Item 2006 2007 2008 2009 2010 2011 2006-11 2006-07 2007-08 2008-09 2009-10 2010-11
U.S. producers': Average capacity quantity . . . . 547,915 540,808 555,892 561,910 569,482 601,280 9.7 -1.3 2.8 1.1 1.3 5.6 Production quantity . . . . . . . . . 305,048 290,428 279,511 222,102 260,753 330,475 8.3 -4.8 -3.8 -20.5 17.4 26.7 Capacity utilization (1) . . . . . . . 55.7 53.7 50.3 39.5 45.8 55.0 -0.7 -2.0 -3.4 -10.8 6.3 9.2 U.S. shipments: Quantity . . . . . . . . . . . . . . . . . 310,747 276,940 284,470 256,208 271,675 281,308 -9.5 -10.9 2.7 -9.9 6.0 3.5 Value . . . . . . . . . . . . . . . . . . . 242,670 236,262 235,031 234,240 223,749 235,657 -2.9 -2.6 -0.5 -0.3 -4.5 5.3 Unit value . . . . . . . . . . . . . . . $0.78 $0.85 $0.83 $0.91 $0.82 $0.84 7.3 9.2 -3.2 10.7 -9.9 1.7 Export shipments: Quantity . . . . . . . . . . . . . . . . . 10,136 10,558 9,917 7,401 9,020 8,495 -16.2 4.2 -6.1 -25.4 21.9 -5.8 Value . . . . . . . . . . . . . . . . . . . 8,998 9,562 9,313 5,976 7,052 7,618 -15.3 6.3 -2.6 -35.8 18.0 8.0 Unit value . . . . . . . . . . . . . . . $0.89 $0.91 $0.94 $0.81 $0.78 $0.90 1.0 2.0 3.7 -14.0 -3.2 14.7 Ending inventory quantity . . . . *** *** *** *** *** *** *** *** *** *** *** *** Inventories/total shipments (1) 23.4 31.8 30.0 22.1 17.3 34.0 10.6 8.4 -1.8 -8.0 -4.8 16.7 Production workers . . . . . . . . . 498 506 500 485 519 524 5.2 1.6 -1.2 -3.0 7.0 1.0 Hours worked (1,000s) . . . . . . 853 868 869 846 879 942 10.4 1.8 0.1 -2.6 3.9 7.2 Wages paid ($1,000) . . . . . . . . 24,385 24,675 24,172 24,177 25,712 26,392 8.2 1.2 -2.0 0.0 6.3 2.6 Hourly wages . . . . . . . . . . . . . . $28.59 $28.43 $27.82 $28.58 $29.25 $28.02 -2.0 -0.6 -2.2 2.7 2.4 -4.2 Productivity (pieces per hour) . 357.6 334.6 321.6 262.5 296.6 350.8 -1.9 -6.4 -3.9 -18.4 13.0 18.3 Unit labor costs . . . . . . . . . . . . $0.08 $0.08 $0.09 $0.11 $0.10 $0.08 -0.1 6.3 1.8 25.9 -9.4 -19.0 Net sales: Quantity . . . . . . . . . . . . . . . . . 320,883 287,499 294,387 263,608 279,577 290,696 -9.4 -10.4 2.4 -10.5 6.1 4.0 Value . . . . . . . . . . . . . . . . . . . 251,668 245,824 244,344 240,215 230,800 243,276 -3.3 -2.3 -0.6 -1.7 -3.9 5.4 Unit value . . . . . . . . . . . . . . . $0.78 $0.86 $0.83 $0.91 $0.83 $0.84 6.7 9.0 -2.9 9.8 -9.4 1.4 Cost of goods sold (COGS) . . . 191,350 189,892 182,644 170,775 162,736 179,048 -6.4 -0.8 -3.8 -6.5 -4.7 10.0 Gross profit or (loss) . . . . . . . . 60,318 55,932 61,700 69,440 68,064 64,228 6.5 -7.3 10.3 12.5 -2.0 -5.6 SG&A expenses . . . . . . . . . . . 25,992 24,141 23,662 25,298 25,016 26,842 3.3 -7.1 -2.0 6.9 -1.1 7.3 Operating income or (loss) . . . 34,326 31,791 38,038 44,142 43,048 37,386 8.9 -7.4 19.7 16.0 -2.5 -13.2 Capital expenditures . . . . . . . . *** *** *** *** *** *** *** *** *** *** *** *** Unit COGS . . . . . . . . . . . . . . . $0.60 $0.66 $0.62 $0.65 $0.58 $0.62 3.3 10.8 -6.1 4.4 -10.2 5.8 Unit SG&A expenses . . . . . . . . $0.08 $0.08 $0.08 $0.10 $0.09 $0.09 14.0 3.7 -4.3 19.4 -6.8 3.2 Unit operating income or (loss) $0.11 $0.11 $0.13 $0.17 $0.15 $0.13 20.2 3.4 16.9 29.6 -8.0 -16.5 COGS/sales (1) . . . . . . . . . . . . 76.0 77.2 74.7 71.1 70.5 73.6 -2.4 1.2 -2.5 -3.7 -0.6 3.1 Operating income or (loss)/ sales (1) . . . . . . . . . . . . . . . . . 13.6 12.9 15.6 18.4 18.7 15.4 1.7 -0.7 2.6 2.8 0.3 -3.3
(1) "Reported data" are in percent and "period changes" are in percentage points. (2) Not applicable.
Note.--Financial data are reported on a fiscal year basis and may not necessarily be comparable to data reported on a calendar year basis.Because of rounding, figures may not add to the totals shown. Unit values and shares are calculated from the unrounded figures.
Source: Compiled from data submitted in response to Commission questionnaires and from official Commerce statistics.CLPSS import data are based on HTS subheadings 4811.90.9050, 4811.90.9090, 4820.10.2030, 4820.10.2040, 4820.10.2050, and 4820.10.2060.
C-4
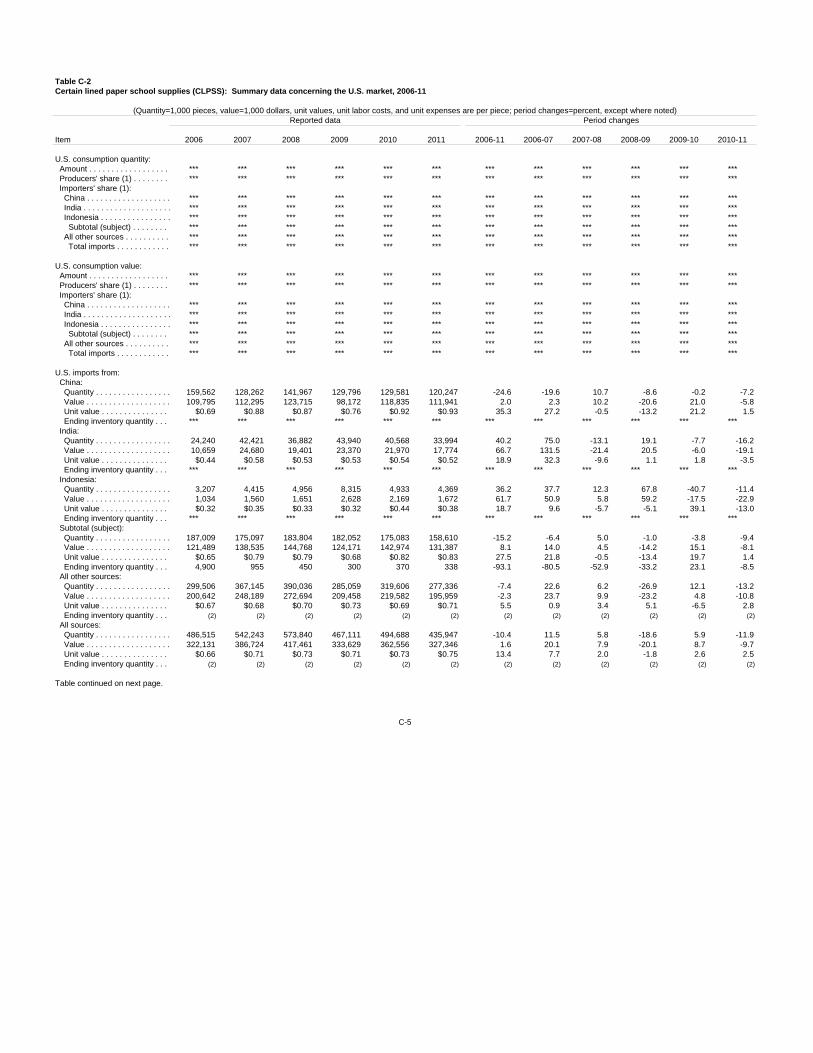
Table C-2Certain lined paper school supplies (CLPSS): Summary data concerning the U.S. market, 2006-11
(Quantity=1,000 pieces, value=1,000 dollars, unit values, unit labor costs, and unit expenses are per piece; period changes=percent, except where noted)Reported data Period changes
Item 2006 2007 2008 2009 2010 2011 2006-11 2006-07 2007-08 2008-09 2009-10 2010-11
U.S. consumption quantity: Amount . . . . . . . . . . . . . . . . . . *** *** *** *** *** *** *** *** *** *** *** *** Producers' share (1) . . . . . . . . *** *** *** *** *** *** *** *** *** *** *** *** Importers' share (1): China . . . . . . . . . . . . . . . . . . . *** *** *** *** *** *** *** *** *** *** *** *** India . . . . . . . . . . . . . . . . . . . . *** *** *** *** *** *** *** *** *** *** *** *** Indonesia . . . . . . . . . . . . . . . . *** *** *** *** *** *** *** *** *** *** *** *** Subtotal (subject) . . . . . . . . *** *** *** *** *** *** *** *** *** *** *** *** All other sources . . . . . . . . . . *** *** *** *** *** *** *** *** *** *** *** *** Total imports . . . . . . . . . . . . *** *** *** *** *** *** *** *** *** *** *** ***
U.S. consumption value: Amount . . . . . . . . . . . . . . . . . . *** *** *** *** *** *** *** *** *** *** *** *** Producers' share (1) . . . . . . . . *** *** *** *** *** *** *** *** *** *** *** *** Importers' share (1): China . . . . . . . . . . . . . . . . . . . *** *** *** *** *** *** *** *** *** *** *** *** India . . . . . . . . . . . . . . . . . . . . *** *** *** *** *** *** *** *** *** *** *** *** Indonesia . . . . . . . . . . . . . . . . *** *** *** *** *** *** *** *** *** *** *** *** Subtotal (subject) . . . . . . . . *** *** *** *** *** *** *** *** *** *** *** *** All other sources . . . . . . . . . . *** *** *** *** *** *** *** *** *** *** *** *** Total imports . . . . . . . . . . . . *** *** *** *** *** *** *** *** *** *** *** ***
U.S. imports from: China: Quantity . . . . . . . . . . . . . . . . . 159,562 128,262 141,967 129,796 129,581 120,247 -24.6 -19.6 10.7 -8.6 -0.2 -7.2 Value . . . . . . . . . . . . . . . . . . . 109,795 112,295 123,715 98,172 118,835 111,941 2.0 2.3 10.2 -20.6 21.0 -5.8 Unit value . . . . . . . . . . . . . . . $0.69 $0.88 $0.87 $0.76 $0.92 $0.93 35.3 27.2 -0.5 -13.2 21.2 1.5 Ending inventory quantity . . . *** *** *** *** *** *** *** *** *** *** *** *** India: Quantity . . . . . . . . . . . . . . . . . 24,240 42,421 36,882 43,940 40,568 33,994 40.2 75.0 -13.1 19.1 -7.7 -16.2 Value . . . . . . . . . . . . . . . . . . . 10,659 24,680 19,401 23,370 21,970 17,774 66.7 131.5 -21.4 20.5 -6.0 -19.1 Unit value . . . . . . . . . . . . . . . $0.44 $0.58 $0.53 $0.53 $0.54 $0.52 18.9 32.3 -9.6 1.1 1.8 -3.5 Ending inventory quantity . . . *** *** *** *** *** *** *** *** *** *** *** *** Indonesia: Quantity . . . . . . . . . . . . . . . . . 3,207 4,415 4,956 8,315 4,933 4,369 36.2 37.7 12.3 67.8 -40.7 -11.4 Value . . . . . . . . . . . . . . . . . . . 1,034 1,560 1,651 2,628 2,169 1,672 61.7 50.9 5.8 59.2 -17.5 -22.9 Unit value . . . . . . . . . . . . . . . $0.32 $0.35 $0.33 $0.32 $0.44 $0.38 18.7 9.6 -5.7 -5.1 39.1 -13.0 Ending inventory quantity . . . *** *** *** *** *** *** *** *** *** *** *** *** Subtotal (subject): Quantity . . . . . . . . . . . . . . . . . 187,009 175,097 183,804 182,052 175,083 158,610 -15.2 -6.4 5.0 -1.0 -3.8 -9.4 Value . . . . . . . . . . . . . . . . . . . 121,489 138,535 144,768 124,171 142,974 131,387 8.1 14.0 4.5 -14.2 15.1 -8.1 Unit value . . . . . . . . . . . . . . . $0.65 $0.79 $0.79 $0.68 $0.82 $0.83 27.5 21.8 -0.5 -13.4 19.7 1.4 Ending inventory quantity . . . 4,900 955 450 300 370 338 -93.1 -80.5 -52.9 -33.2 23.1 -8.5 All other sources: Quantity . . . . . . . . . . . . . . . . . 299,506 367,145 390,036 285,059 319,606 277,336 -7.4 22.6 6.2 -26.9 12.1 -13.2 Value . . . . . . . . . . . . . . . . . . . 200,642 248,189 272,694 209,458 219,582 195,959 -2.3 23.7 9.9 -23.2 4.8 -10.8 Unit value . . . . . . . . . . . . . . . $0.67 $0.68 $0.70 $0.73 $0.69 $0.71 5.5 0.9 3.4 5.1 -6.5 2.8 Ending inventory quantity . . . (2) (2) (2) (2) (2) (2) (2) (2) (2) (2) (2) (2) All sources: Quantity . . . . . . . . . . . . . . . . . 486,515 542,243 573,840 467,111 494,688 435,947 -10.4 11.5 5.8 -18.6 5.9 -11.9 Value . . . . . . . . . . . . . . . . . . . 322,131 386,724 417,461 333,629 362,556 327,346 1.6 20.1 7.9 -20.1 8.7 -9.7 Unit value . . . . . . . . . . . . . . . $0.66 $0.71 $0.73 $0.71 $0.73 $0.75 13.4 7.7 2.0 -1.8 2.6 2.5 Ending inventory quantity . . . (2) (2) (2) (2) (2) (2) (2) (2) (2) (2) (2) (2)
Table continued on next page.
C-5

Table C-2--ContinuedCertain lined paper school supplies (CLPSS): Summary data concerning the U.S. market, 2006-11
(Quantity=1,000 pieces, value=1,000 dollars, unit values, unit labor costs, and unit expenses are per piece; period changes=percent, except where noted)Reported data Period changes
Item 2006 2007 2008 2009 2010 2011 2006-11 2006-07 2007-08 2008-09 2009-10 2010-11
U.S. producers': Average capacity quantity . . . . *** *** *** *** *** *** *** *** *** *** *** *** Production quantity . . . . . . . . . *** *** *** *** *** *** *** *** *** *** *** *** Capacity utilization (1) . . . . . . . *** *** *** *** *** *** *** *** *** *** *** *** U.S. shipments: Quantity . . . . . . . . . . . . . . . . . *** *** *** *** *** *** *** *** *** *** *** *** Value . . . . . . . . . . . . . . . . . . . *** *** *** *** *** *** *** *** *** *** *** *** Unit value . . . . . . . . . . . . . . . *** *** *** *** *** *** *** *** *** *** *** *** Export shipments: Quantity . . . . . . . . . . . . . . . . . *** *** *** *** *** *** *** *** *** *** *** *** Value . . . . . . . . . . . . . . . . . . . *** *** *** *** *** *** *** *** *** *** *** *** Unit value . . . . . . . . . . . . . . . *** *** *** *** *** *** *** *** *** *** *** *** Ending inventory quantity . . . . *** *** *** *** *** *** *** *** *** *** *** *** Inventories/total shipments (1) *** *** *** *** *** *** *** *** *** *** *** *** Production workers . . . . . . . . . *** *** *** *** *** *** *** *** *** *** *** *** Hours worked (1,000s) . . . . . . *** *** *** *** *** *** *** *** *** *** *** *** Wages paid ($1,000) . . . . . . . . *** *** *** *** *** *** *** *** *** *** *** *** Hourly wages . . . . . . . . . . . . . . *** *** *** *** *** *** *** *** *** *** *** *** Productivity (pieces per hour) . *** *** *** *** *** *** *** *** *** *** *** *** Unit labor costs . . . . . . . . . . . . *** *** *** *** *** *** *** *** *** *** *** *** Net sales: Quantity . . . . . . . . . . . . . . . . . *** *** *** *** *** *** *** *** *** *** *** *** Value . . . . . . . . . . . . . . . . . . . *** *** *** *** *** *** *** *** *** *** *** *** Unit value . . . . . . . . . . . . . . . *** *** *** *** *** *** *** *** *** *** *** *** Cost of goods sold (COGS) . . . *** *** *** *** *** *** *** *** *** *** *** *** Gross profit or (loss) . . . . . . . . *** *** *** *** *** *** *** *** *** *** *** *** SG&A expenses . . . . . . . . . . . *** *** *** *** *** *** *** *** *** *** *** *** Operating income or (loss) . . . *** *** *** *** *** *** *** *** *** *** *** *** Capital expenditures . . . . . . . . *** *** *** *** *** *** *** *** *** *** *** *** Unit COGS . . . . . . . . . . . . . . . *** *** *** *** *** *** *** *** *** *** *** *** Unit SG&A expenses . . . . . . . . *** *** *** *** *** *** *** *** *** *** *** *** Unit operating income or (loss) *** *** *** *** *** *** *** *** *** *** *** *** COGS/sales (1) . . . . . . . . . . . . *** *** *** *** *** *** *** *** *** *** *** *** Operating income or (loss)/ sales (1) . . . . . . . . . . . . . . . . . *** *** *** *** *** *** *** *** *** *** *** ***
(1) "Reported data" are in percent and "period changes" are in percentage points. (2) Not available/not applicable.
Note.--Financial data are reported on a fiscal year basis and may not necessarily be comparable to data reported on a calendar year basis. Because of rounding, figures may not addto the totals shown. Unit values and shares are calculated from the unrounded figures.
Source: Compiled from data submitted in response to Commission questionnaires and from official Commerce statistics.CLPSS import data are based on HTS subheadings 4811.90.9050, 4811.90.9090, 4820.10.2030, 4820.10.2040, 4820.10.2050, and 4820.10.2060.
C-6

Table C-3Other lined paper products (OLPP): Summary data concerning the U.S. market, 2006-11
(Quantity=1,000 pieces, value=1,000 dollars, unit values, unit labor costs, and unit expenses are per piece; period changes=percent, except where noted)Reported data Period changes
Item 2006 2007 2008 2009 2010 2011 2006-11 2006-07 2007-08 2008-09 2009-10 2010-11
U.S. consumption quantity: Amount . . . . . . . . . . . . . . . . . . . *** *** *** *** *** *** *** *** *** *** *** *** Producers' share (1) . . . . . . . . *** *** *** *** *** *** *** *** *** *** *** *** Importers' share (1): China . . . . . . . . . . . . . . . . . . . *** *** *** *** *** *** *** *** *** *** *** *** India . . . . . . . . . . . . . . . . . . . . *** *** *** *** *** *** *** *** *** *** *** *** Indonesia . . . . . . . . . . . . . . . . *** *** *** *** *** *** *** *** *** *** *** *** Subtotal . . . . . . . . . . . . . . . . *** *** *** *** *** *** *** *** *** *** *** *** All other sources . . . . . . . . . . *** *** *** *** *** *** *** *** *** *** *** *** Total imports . . . . . . . . . . . . *** *** *** *** *** *** *** *** *** *** *** ***
U.S. consumption value: Amount . . . . . . . . . . . . . . . . . . . *** *** *** *** *** *** *** *** *** *** *** *** Producers' share (1) . . . . . . . . *** *** *** *** *** *** *** *** *** *** *** *** Importers' share (1): China . . . . . . . . . . . . . . . . . . . *** *** *** *** *** *** *** *** *** *** *** *** India . . . . . . . . . . . . . . . . . . . . *** *** *** *** *** *** *** *** *** *** *** *** Indonesia . . . . . . . . . . . . . . . . *** *** *** *** *** *** *** *** *** *** *** *** Subtotal . . . . . . . . . . . . . . . . *** *** *** *** *** *** *** *** *** *** *** *** All other sources . . . . . . . . . . *** *** *** *** *** *** *** *** *** *** *** *** Total imports . . . . . . . . . . . . *** *** *** *** *** *** *** *** *** *** *** ***
U.S. imports from: China: Quantity . . . . . . . . . . . . . . . . . 182,846 212,919 211,549 208,003 234,845 265,266 45.1 16.4 -0.6 -1.7 12.9 13.0 Value . . . . . . . . . . . . . . . . . . . 117,385 125,037 132,563 99,441 116,584 121,358 3.4 6.5 6.0 -25.0 17.2 4.1 Unit value . . . . . . . . . . . . . . . . $0.64 $0.59 $0.63 $0.48 $0.50 $0.46 -28.7 -8.5 6.7 -23.7 3.8 -7.8 Ending inventory quantity . . . . *** *** *** *** *** *** *** *** *** *** *** *** India: Quantity . . . . . . . . . . . . . . . . . 1,809 9,070 3,259 3,780 3,462 6,331 250.0 401.4 -64.1 16.0 -8.4 82.9 Value . . . . . . . . . . . . . . . . . . . 1,148 4,249 1,915 1,949 1,712 3,331 190.1 270.0 -54.9 1.8 -12.2 94.6 Unit value . . . . . . . . . . . . . . . . $0.63 $0.47 $0.59 $0.52 $0.49 $0.53 -17.1 -26.2 25.4 -12.2 -4.1 6.4 Ending inventory quantity . . . . *** *** *** *** *** *** *** *** *** *** *** *** Indonesia: Quantity . . . . . . . . . . . . . . . . . 59,289 59,620 26,556 6,023 10,729 10,925 -81.6 0.6 -55.5 -77.3 78.1 1.8 Value . . . . . . . . . . . . . . . . . . . 13,277 13,864 7,636 1,664 2,704 2,970 -77.6 4.4 -44.9 -78.2 62.6 9.8 Unit value . . . . . . . . . . . . . . . . $0.22 $0.23 $0.29 $0.28 $0.25 $0.27 21.4 3.8 23.7 -3.9 -8.8 7.9 Ending inventory quantity . . . . *** *** *** *** *** *** *** *** *** *** *** *** Subtotal: Quantity . . . . . . . . . . . . . . . . . 243,944 281,608 241,364 217,806 249,036 282,522 15.8 15.4 -14.3 -9.8 14.3 13.4 Value . . . . . . . . . . . . . . . . . . . 131,810 143,149 142,114 103,053 121,001 127,660 -3.1 8.6 -0.7 -27.5 17.4 5.5 Unit value . . . . . . . . . . . . . . . . $0.54 $0.51 $0.59 $0.47 $0.49 $0.45 -16.4 -5.9 15.8 -19.6 2.7 -7.0 Ending inventory quantity . . . . *** *** *** *** *** *** *** *** *** *** *** *** All other sources: Quantity . . . . . . . . . . . . . . . . . 94,772 117,457 114,062 145,566 191,372 114,101 20.4 23.9 -2.9 27.6 31.5 -40.4 Value . . . . . . . . . . . . . . . . . . . 43,965 67,647 52,337 39,544 47,369 45,439 3.4 53.9 -22.6 -24.4 19.8 -4.1 Unit value . . . . . . . . . . . . . . . . $0.46 $0.58 $0.46 $0.27 $0.25 $0.40 -14.2 24.1 -20.3 -40.8 -8.9 60.9 Ending inventory quantity . . . . (2) (2) (2) (2) (2) (2) (2) (2) (2) (2) (2) (2) All sources: Quantity . . . . . . . . . . . . . . . . . 338,716 399,065 355,426 363,371 440,408 396,623 17.1 17.8 -10.9 2.2 21.2 -9.9 Value . . . . . . . . . . . . . . . . . . . 175,776 210,797 194,451 142,597 168,370 173,099 -1.5 19.9 -7.8 -26.7 18.1 2.8 Unit value . . . . . . . . . . . . . . . . $0.52 $0.53 $0.55 $0.39 $0.38 $0.44 -15.9 1.8 3.6 -28.3 -2.6 14.2 Ending inventory quantity . . . . (2) (2) (2) (2) (2) (2) (2) (2) (2) (2) (2) (2)
Table continued on next page.
C-7

Table C-3--ContinuedOther lined paper products (OLPP): Summary data concerning the U.S. market, 2006-11
(Quantity=1,000 pieces, value=1,000 dollars, unit values, unit labor costs, and unit expenses are per piece; period changes=percent, except where noted)Reported data Period changes
Item 2006 2007 2008 2009 2010 2011 2006-11 2006-07 2007-08 2008-09 2009-10 2010-11
U.S. producers': Average capacity quantity . . . . *** *** *** *** *** *** *** *** *** *** *** *** Production quantity . . . . . . . . . *** *** *** *** *** *** *** *** *** *** *** *** Capacity utilization (1) . . . . . . . *** *** *** *** *** *** *** *** *** *** *** *** U.S. shipments: Quantity . . . . . . . . . . . . . . . . . *** *** *** *** *** *** *** *** *** *** *** *** Value . . . . . . . . . . . . . . . . . . . *** *** *** *** *** *** *** *** *** *** *** *** Unit value . . . . . . . . . . . . . . . . *** *** *** *** *** *** *** *** *** *** *** *** Export shipments: Quantity . . . . . . . . . . . . . . . . . *** *** *** *** *** *** *** *** *** *** *** *** Value . . . . . . . . . . . . . . . . . . . *** *** *** *** *** *** *** *** *** *** *** *** Unit value . . . . . . . . . . . . . . . . *** *** *** *** *** *** *** *** *** *** *** *** Ending inventory quantity . . . . . *** *** *** *** *** *** *** *** *** *** *** *** Inventories/total shipments (1) . *** *** *** *** *** *** *** *** *** *** *** *** Production workers . . . . . . . . . *** *** *** *** *** *** *** *** *** *** *** *** Hours worked (1,000s) . . . . . . . *** *** *** *** *** *** *** *** *** *** *** *** Wages paid ($1,000) . . . . . . . . *** *** *** *** *** *** *** *** *** *** *** *** Hourly wages . . . . . . . . . . . . . . *** *** *** *** *** *** *** *** *** *** *** *** Productivity (pieces per hour) . *** *** *** *** *** *** *** *** *** *** *** *** Unit labor costs . . . . . . . . . . . . *** *** *** *** *** *** *** *** *** *** *** *** Net sales: Quantity . . . . . . . . . . . . . . . . . *** *** *** *** *** *** *** *** *** *** *** *** Value . . . . . . . . . . . . . . . . . . . *** *** *** *** *** *** *** *** *** *** *** *** Unit value . . . . . . . . . . . . . . . . *** *** *** *** *** *** *** *** *** *** *** *** Cost of goods sold (COGS) . . . *** *** *** *** *** *** *** *** *** *** *** *** Gross profit or (loss) . . . . . . . . *** *** *** *** *** *** *** *** *** *** *** *** SG&A expenses . . . . . . . . . . . . *** *** *** *** *** *** *** *** *** *** *** *** Operating income or (loss) . . . *** *** *** *** *** *** *** *** *** *** *** *** Capital expenditures . . . . . . . . *** *** *** *** *** *** *** *** *** *** *** *** Unit COGS . . . . . . . . . . . . . . . . *** *** *** *** *** *** *** *** *** *** *** *** Unit SG&A expenses . . . . . . . . *** *** *** *** *** *** *** *** *** *** *** *** Unit operating income or (loss) *** *** *** *** *** *** *** *** *** *** *** *** COGS/sales (1) . . . . . . . . . . . . *** *** *** *** *** *** *** *** *** *** *** *** Operating income or (loss)/ sales (1) . . . . . . . . . . . . . . . . . *** *** *** *** *** *** *** *** *** *** *** ***
(1) "Reported data" are in percent and "period changes" are in percentage points. (2) Not available/not applicable.
Note.--Financial data are reported on a fiscal year basis and may not necessarily be comparable to data reported on a calendar year basis. Because of rounding, figures may not addto the totals shown. Unit values and shares are calculated from the unrounded figures.
Source: Compiled from data submitted in response to Commission questionnaires and from official Commerce statistics.CLPSS import data are based on HTS subheadings 4811.90.9050, 4811.90.9090, 4820.10.2030, 4820.10.2040, 4820.10.2050, and 4820.10.2060.
C-8

APPENDIX D
RESPONSES OF U.S. PRODUCERS, U.S. IMPORTERS, U.S. PURCHASERS,AND FOREIGN PRODUCERS CONCERNING THE SIGNIFICANCE OF THEANTIDUMPING DUTY AND COUNTERVAILING DUTY ORDERS AND THE
LIKELY EFFECTS OF REVOCATION
D-1


U.S. PRODUCERS’ COMMENTS REGARDING THE SIGNIFICANCE OF THEANTIDUMPING DUTY AND COUNTERVAILING DUTY ORDERS AND THE LIKELY
EFFECTS OF REVOCATION
The Commission requested U.S. producers to describe any changes in the character of theiroperations or organizations relating to the production of LPP in the future if the countervailingduty orders (India and Indonesia) and/or antidumping duty orders (China, India, and Indonesia)on CLPSS were to be revoked. (Question II-4). The following are quotations from the responses ofU.S. producers.
* * * * * * *
The Commission requested U.S. producers to describe the significance of the existing countervailingduty orders (India and Indonesia) and/or antidumping duty orders (China, India, and Indonesia)covering imports of CLPSS in terms of its effect on their firm’s production capacity, production,U.S. shipments, inventories, purchases, employment, revenues, costs, profits, cash flow, capitalexpenditures, research and development expenditures, and asset values. (Question II-15.) Thefollowing are quotations from the responses of U.S. producers.
* * * * * * *
The Commission requested U.S. producers to describe any anticipated changes in their productioncapacity, production, U.S. shipments, inventories, purchases, employment, revenues, costs, profits,cash flow, capital expenditures, research and development expenditures, and asset values relatingto the production of LPP in the future if the countervailing duty orders (India and Indonesia)and/or antidumping duty orders (China, India, and Indonesia) on CLPSS were revoked. (QuestionII-16.) The following are quotations from the responses of U.S. producers.
* * * * * * *
D-3

U.S. IMPORTERS’ COMMENTS REGARDING THE SIGNIFICANCE OF THEANTIDUMPING DUTY AND COUNTERVAILING DUTY ORDERS AND THE LIKELY
EFFECTS OF REVOCATION
The Commission requested U.S. importers to describe any anticipated changes to the character oftheir operations or organizations relating to the importation of CLPSS in the future if thecountervailing duty orders (India and Indonesia) and/or antidumping duty orders (China, India,and Indonesia) were to be revoked. (Question II-4.) The following are quotations from theresponses of U.S. importers.
* * * * * * *
The Commission requested U.S. importers to describe the significance of the existing countervailingduty orders (India and Indonesia) and/or antidumping duty orders (China, India, and Indonesia)covering imports of CLPSS in terms of its effect on their imports, U.S. shipments of imports, andinventories. (Question II-9). The following are quotations from the responses of importers.
* * * * * * *
The Commission requested U.S. importers to describe any anticipated changes in their imports,U.S. shipments of imports, or inventories of CLPSS in the future if the existing countervailing dutyorders (India and Indonesia) and/or antidumping duty orders (China, India, and Indonesia) wererevoked. (Question II-10). The following are quotations from the responses of importers.
* * * * * * *
D-4

U.S. PURCHASERS’ COMMENTS REGARDING THE SIGNIFICANCE OF THEANTIDUMPING DUTY AND COUNTERVAILING DUTY ORDERS AND THE LIKELY
EFFECTS OF REVOCATION
The Commission asked U. S. purchasers to comment on the likely effect of any revocation of thecountervailing duty orders (India and Indonesia) and/or antidumping duty orders (China, India,and Indonesia) covering CLPSS. They were asked to discuss the potential effects of revocation ofthe orders in terms of the future activities of their firm (Question III-28 (1)). Their responses are asfollows.
* * * * * * *
The Commission asked U. S. purchasers to comment on the likely effect of any revocation of thecountervailing duty orders (India and Indonesia) and/or antidumping duty orders (China, India,and Indonesia) covering CLPSS. They were asked to discuss the potential effects of revocation ofthe orders in terms of the U.S. market as a whole. (Question III-28 (2)). Their responses are asfollows.
* * * * * * *
D-5

FOREIGN PRODUCERS’ COMMENTS REGARDING THE SIGNIFICANCE OF THEANTIDUMPING DUTY AND COUNTERVAILING DUTY ORDERS AND THE LIKELY
EFFECTS OF REVOCATION
The Commission requested foreign producers to describe any changes in the character of theiroperations or organizations relating to the production of CLPSS in the future if the countervailingduty orders (India and Indonesia) and/or antidumping duty orders (China, India, and Indonesia)on CLPSS were to be revoked. (Question II-4). The following are quotations from the responses offoreign producers.
* * * * * * *
The Commission requested foreign producers to describe the significance of the existingcountervailing duty orders (India and Indonesia) and/or antidumping duty orders (China, India,and Indonesia) covering imports of CLPSS in terms of its effect on their firm’s production capacity,production, home market shipments, exports to the United States and other markets, andinventories. (Question II-12.) The following are quotations from the responses of foreignproducers.
* * * * * * *
The Commission requested foreign producers to describe any anticipated changes in theirproduction capacity, production, home market shipments, exports to the United States and othermarkets, or inventories relating to the production of CLPSS in the future if the countervailing dutyorders (India and Indonesia) and/or antidumping duty orders (China, India, and Indonesia) onCLPSS were revoked. (Question II-13.) The following are quotations from the responses of foreignproducers.
* * * * * * *
D-6

APPENDIX E
U.S. IMPORTS BY HTS NUMBER
E-1


Table E-1CLPSS: U.S. imports, by HTS number and source, 2006-11
Source
Calendar year
2006 2007 2008 2009 2010 2011
Value (1,000 dollars)1
China:
4811.90.9050 0 0 0 31,349 30,475 14,001
4811.90.9090 27,894 49,503 47,203 0 0 0
4820.10.2030 0 0 0 341 1,168 1,913
4820.10.2040 0 0 0 1,798 6,854 17,742
4820.10.2050 81,902 62,792 76,512 35,680 0 0
Total (5 HTS numbers) 109,795 112,295 123,715 69,168 38,496 33,656
4820.10.2060 0 0 0 29,004 80,339 78,286
Total (6 HTS numbers) 109,795 112,295 123,715 98,172 118,835 111,941
India:
4811.90.9050 0 0 0 4,965 5,737 942
4811.90.9090 1,877 2,125 3,554 0 0 0
4820.10.2030 0 0 0 867 4,305 5,542
4820.10.2040 0 0 0 1,078 7,564 6,029
4820.10.2050 8,782 22,554 15,848 13,515 0 0
Total (5 HTS numbers) 10,659 24,680 19,401 20,424 17,606 12,513
4820.10.2060 0 0 0 2,946 4,364 5,261
Total (6 HTS numbers) 10,659 24,680 19,401 23,370 21,970 17,774
Indonesia:
4811.90.9050 0 0 0 1,476 1,333 752
4811.90.9090 108 605 498 0 0 0
4820.10.2030 0 0 0 0 0 0
4820.10.2040 0 0 0 5 206 328
4820.10.2050 926 955 1,153 657 0 0
Total (5 HTS numbers) 1,034 1,560 1,651 2,138 1,539 1,081
4820.10.2060 0 0 0 490 630 591
Total (6 HTS numbers) 1,034 1,560 1,651 2,628 2,169 1,672
Table continued on next page.
E-3

Table E-1--ContinuedCLPSS: U.S. imports, by HTS number and source, 2006-11
Source
Calendar year
2006 2007 2008 2009 2010 2011
Value (1,000 dollars)1
Subject sources:
4811.90.9050 0 0 0 37,790 37,544 15,695
4811.90.9090 29,879 52,234 51,255 0 0 0
4820.10.2030 0 0 0 1,208 5,473 7,455
4820.10.2040 0 0 0 2,881 14,624 24,100
4820.10.2050 91,609 86,301 93,513 49,852 0 0
Total (5 HTS numbers) 121,489 138,535 144,768 91,730 57,641 47,250
4820.10.2060 0 0 0 32,441 85,333 84,137
Total (6 HTS numbers) 121,489 138,535 144,768 124,171 142,974 131,387
Other sources:
4811.90.9050 0 0 0 52,220 46,767 23,139
4811.90.9090 60,047 71,467 76,592 0 0 0
4820.10.2030 0 0 0 3,398 23,942 31,798
4820.10.2040 0 0 0 13,571 71,884 78,087
4820.10.2050 140,596 176,722 196,102 109,554 0 0
Total (5 HTS numbers) 200,642 248,189 272,694 178,742 142,593 133,025
4820.10.2060 0 0 0 30,716 76,989 62,935
Total (6 HTS numbers) 200,642 248,189 272,694 209,458 219,582 195,959
All sources:
4811.90.9050 0 0 0 90,009 84,311 38,835
4811.90.9090 89,926 123,701 127,847 0 0 0
4820.10.2030 0 0 0 4,605 29,415 39,253
4820.10.2040 0 0 0 16,451 86,508 102,187
4820.10.2050 232,205 263,023 289,614 159,406 0 0
Total (5 HTS numbers) 322,131 386,724 417,461 270,473 200,234 180,274
4820.10.2060 0 0 0 63,157 162,321 147,072
Total (6 HTS numbers) 322,131 386,724 417,461 333,629 362,556 327,346
1 Landed, duty-paid.
Note.--HTS item 4811.90.9050 effective 01/09-12/11; HTS item 4811.90.9090 effective 01/06-12/08; HTS items 4820.10.2030,4820.10.2040, 4810.10.2060 effective 07/09-12/11; HTS item 4820.10.2050 effective 01/06-06/09.
Source: Compiled from official Commerce statistics.
E-4

F-1
APPENDIX F
WEIGHTED-AVERAGE PRICES AND QUANTITIES OF PRODUCTS 4-5, PRODUCED AND IMPORTED BY DOMESTIC PRODUCERS ONLY, AND WEIGHTED-AVERAGE PRICES AND QUANTITIES OF PRODUCTS 4-5
IMPORTED BY NON-PRODUCER IMPORTERS ONLY, AND MARGINS OF UNDERSELLING/(OVERSELLING)


F-3
Table F-1 LPP: Weighted-average prices and quantities of CLPSS product 4, produced and imported by domestic producers only, and margins of underselling/(overselling), by quarters, January 2006-December 20011
* * * * * * * Table F-2 LPP: Weighted-average prices and quantities of CLPSS product 5, produced and imported by domestic producers only, and margins of underselling/(overselling), by quarters, January 2006-December 20011
* * * * * * * Table F-3 LPP: Summary of underselling/(overselling) for products 4-5, produced and imported by domestic producers only, January 2006-December 2011
* * * * * * * Table F-4 LPP: Weighted-average prices and quantities of CLPSS product 4, both domestic sales and imports imported by non-producer importers only, and margins of underselling/(overselling), by quarters, January 2006-December 20011
* * * * * * *
Table F-5 LPP: Weighted-average prices and quantities of CLPSS product 5, both domestic sales and imports imported by non-producer importers only, and margins of underselling/(overselling), by quarters, January 2006-December 20011
* * * * * * * Table F-6 LPP: Summary of underselling/(overselling) for products 4-5, imported by non-producer importers only, January 2006-December 20111
* * * * * * *

G-1
APPENDIX G
WEIGHTED-AVERAGE PRICES AND QUANTITIES OF PRODUCTS 1-4, JANUARY 2003-DECEMBER 2011


G-3
Table G-1 LPP: Weighted-average f.o.b. prices and quantities of domestic and imported CLPSS product 1,1 and margins of underselling/(overselling), by quarters, January 2003-December 2011
* * * * * * *
Table G-2 LPP: Weighted-average f.o.b. prices and quantities of domestic and imported CLPSS product 2,1 and margins of underselling/(overselling), by quarters, January 2003-December 2011
* * * * * * *
Table G-3 LPP: Weighted-average f.o.b. prices and quantities of domestic and imported CLPSS product 3,1 and margins of underselling/(overselling), by quarters, January 2003-December 2011
* * * * * * * Table G-4 LPP: Weighted-average f.o.b. prices and quantities of domestic and imported CLPSS product 4,1 and margins of underselling/(overselling), by quarters, January 2003-December 2011
* * * * * * * Figure G-1 LPP: Weighted-average quarterly f.o.b. selling prices and quantities of domestic and imported CLPSS product 1, by quarters, January 2003-December 2011
* * * * * * * Figure G-2 LPP: Weighted-average quarterly f.o.b. selling prices and quantities of domestic and imported CLPSS product 2, by quarters, January 2003-December 2011
* * * * * * * Figure G-3 LPP: Weighted-average quarterly f.o.b. selling prices and quantities of domestic and imported CLPSS product 3, by quarters, January 2003-December 2011
* * * * * * * Figure G-4 LPP: Weighted-average quarterly f.o.b. selling prices and quantities of domestic and imported CLPSS product 4, by quarters, January 2006-December 2011
* * * * * * *