Certain Investigations on Drowsiness Alert system · PDF fileCertain Investigations on...
12
Certain Investigations on Drowsiness Alert system based on Heart Rate Variability using LabVIEW R.SUKANESH Department of Electronics and Communication Engineering, Anna University Thiagarajar College of Engineering, Thiruparankundram, Madurai- 625015, Tamilnadu. INDIA [email protected] S.VIJAYPRASATH Department of Electronics and Communication Engineering, Anna University M.Kumarasamy College of Engineering, Thalavapalayam, Karur- 639113, Tamilnadu. INDIA [email protected] Abstract: - Monitoring of cardiac activity of post operating patients in a driving state is one of the emerging applications in bio medical research. The detection of QRS complexes in an Electrocardiogram (ECG) signal provides information about the heart rate within the heart as well as various abnormalities such as hyperkalemia, cardiac hypertrophy, etc. A system that detects drowsiness and heart attack of a driving person in advance would prevent major accidents. The emphasis is on QRS complex detection and analysis of heart rate variability and we have performed an analysis for detecting drowsiness of Post-operative patient through Heart rate variability using LabVIEW as a tool. Results with lower heart rate classify it as fatigue and increased heart rate as abnormality. Key-Words: -Active filters, Electrocardiogram (ECG), Heart rate, Signal processing, Vehicle safety. 1 Introduction Lack of concentration due to illness, drugs, sleepiness,drowsiness, fatigue and stress is the most common riskfactors for vehicle crash-related accidents [18]. According to theEuropean commission’s estimation, car accident related costin Europe is around 160 billion Euros on which 60- 80% canbe estimated due to the psychophysical condition of thedrivers [19]. Study shows that around 10-20% of all accidentsare caused by driver’s lack of attention [20].The National Sleep Foundation’s 2007 report ondrowsy driving finds fatigued driving to be under recognizedand underreported [14]. Drowsy driving causes more than 100,000 smashes, resulting in 1,550 deaths and 40,000 injuries annually. Speeding, drink driving, seat belt wearing, careless driving, inexperience and loss of controlling are the most common cause of accidents. All people need between 7 and 9 hours of uninterrupted sleep a night to feel well rested. Commercial truck drivers are especially susceptible to drowsy driving. A congressionally authorized learning of 80 long-haul truck drivers in the United States and Canada found that drivers averaged less than 5 hours of sleep per day. The total number of road accidents in India during 2011 was 4, 97,686 having declined by 0.4 percent over 2010 level. Growth in the number of persons killed in road accidents moderated from 7 per cent in 2010 to 5.9 per cent during 2011. Compared with other states, an accident is increased to 13.2% in Tamil Nadu. The Florida Department of Transportation (FDOT) reported that nearly 3,000 wrecks took place in 2011 due to drowsy drivers, which caused 21 deaths and WSEAS TRANSACTIONS on INFORMATION SCIENCE and APPLICATIONS R. Sukanesh, S. Vijayprasath E-ISSN: 2224-3402 368 Issue 11, Volume 10, November 2013
Transcript of Certain Investigations on Drowsiness Alert system · PDF fileCertain Investigations on...
Certain Investigations on Drowsiness Alert system based on Heart Rate Variability using LabVIEW
R.SUKANESH
Department of Electronics and Communication Engineering, Anna University Thiagarajar College of Engineering,
Thiruparankundram, Madurai- 625015, Tamilnadu. INDIA
S.VIJAYPRASATH Department of Electronics and Communication Engineering, Anna University
M.Kumarasamy College of Engineering, Thalavapalayam, Karur- 639113, Tamilnadu.
INDIA [email protected]
Abstract: - Monitoring of cardiac activity of post operating patients in a driving state is one of the emerging applications in bio medical research. The detection of QRS complexes in an Electrocardiogram (ECG) signal provides information about the heart rate within the heart as well as various abnormalities such as hyperkalemia, cardiac hypertrophy, etc. A system that detects drowsiness and heart attack of a driving person in advance would prevent major accidents. The emphasis is on QRS complex detection and analysis of heart rate variability and we have performed an analysis for detecting drowsiness of Post-operative patient through Heart rate variability using LabVIEW as a tool. Results with lower heart rate classify it as fatigue and increased heart rate as abnormality. Key-Words: -Active filters, Electrocardiogram (ECG), Heart rate, Signal processing, Vehicle safety. 1 Introduction Lack of concentration due to illness, drugs, sleepiness,drowsiness, fatigue and stress is the most common riskfactors for vehicle crash-related accidents [18]. According to theEuropean commission’s estimation, car accident related costin Europe is around 160 billion Euros on which 60-80% canbe estimated due to the psychophysical condition of thedrivers [19]. Study shows that around 10-20% of all accidentsare caused by driver’s lack of attention [20].The National Sleep Foundation’s 2007 report ondrowsy driving finds fatigued driving to be under recognizedand underreported [14]. Drowsy driving causes more than 100,000 smashes, resulting in 1,550 deaths and 40,000 injuries annually. Speeding, drink driving, seat belt wearing, careless driving, inexperience and
loss of controlling are the most common cause of accidents. All people need between 7 and 9 hours of uninterrupted sleep a night to feel well rested. Commercial truck drivers are especially susceptible to drowsy driving. A congressionally authorized learning of 80 long-haul truck drivers in the United States and Canada found that drivers averaged less than 5 hours of sleep per day. The total number of road accidents in India during 2011 was 4, 97,686 having declined by 0.4 percent over 2010 level. Growth in the number of persons killed in road accidents moderated from 7 per cent in 2010 to 5.9 per cent during 2011. Compared with other states, an accident is increased to 13.2% in Tamil Nadu. The Florida Department of Transportation (FDOT) reported that nearly 3,000 wrecks took place in 2011 due to drowsy drivers, which caused 21 deaths and
WSEAS TRANSACTIONS on INFORMATION SCIENCE and APPLICATIONS R. Sukanesh, S. Vijayprasath
E-ISSN: 2224-3402 368 Issue 11, Volume 10, November 2013

2,393 injuries. One analysis estimated the cost of automobile accidents attributed to sleepiness to be between $29.2 and $37.9 billion. (Leger, 1994). According to a report of the American National Highway Safety Traffic Administration (NHSTA) driver drowsiness is annually responsible for about 56,000 crashes which is the reason why more and more researches are made to build automatic detectors of this dangerous state [1].
Figure 1 Deaths due to heart problems
The National Highway Traffic Safety Administration (NHTSA) projected that annually around 2000 mortalities and 72000 damages are recognized to fatigue related crashes. The improvement of technologies for spotting or precluding drowsiness at the wheel is a foremost test in the field of accident avoidance systems [36]. Assiduous driving, driving in a poor meteorological conditions could also cause stress while driving a vehicle. The total number of road accidents in India during 2011 was 4, 97,686 having deteriorated to a very low percent over 2010 level. Growth in the number of persons killed in road accidents moderated from 7 percent in 2010 to 5.9 percent during 2011 which was provided through a technical report prepared by ministry of road transport and highways transport research wing in 2011.However, identification of driver’s state and generatingalarm due to stress is difficult while driving and is achallenging issue. So, it would be valuable both
forpassenger cars and heavy commercial and industrial vehiclesto develop a system that can diagnose this risk factorautomatically while driving. Moreover, it will be helpful ifthe system can alert the driver in a suitable way and ifnecessary, generate audible alarm or activate light when thedriver is inattentive. In a serious situation where the driverseems overwhelmed by stress, it can deactivate somecontrols and activate some predefined tasks or componentsto further support in the control of the vehicle or to alert anearby motor station or police station[18]. Since heart attack and drowsy feeling at the wheel are the leading cause for hike in the fatality rates due to accidents we have performed an analysis over ECG signal using LabVIEW as a simulation tool. The functional and anatomical congruity of the autonomic cardio-respiratory regulation and sleep-wake control have allowed us to use Heart Rate Variability (HRV) in the time and time-frequency domains to look into the process of normal sleep onset (SO) and sleep at night [15,16]. It is found that HRV varies during sleep stages [30, 31, 32, 33] and the same physiologic basis allows us to further develop HRV analysis techniques to look into realtime change patterns preceding falling asleep (FA) at the wheel and under sleep deprivation conditions. 1.2 Electrocardiogram features An ECG signal is a standard waveform. That contains P wave, QRS complex and T wave. It is the graphical record of the heart’s electrical activity. An ECG is the alternate contraction of atria and ventricular. Normally ECG signals are obtained by positioning electrical sensors on the body or on steering wheel. It is a non-invasive test that is used to reflect underlying heart states by measuring electrical motion of heart rate. X axis of the ECG waveform which is called as isoelectric line and that is denoted by seconds. Y axis is denoted by mill volts. Amplitudes of P, Q, R, S, T waves are 0.25 mv, 25% of R wave, 0.16 mv, 0.35 mv and 0.01 to 0.05 mv respectively. Duration of PR interval is from 0.12 to 0.22 s, QT segment interval is from 0.35 to 0.44 s, ST segment interval is from 0.05 to 0.15 s, P wave interval is 0.11 s and QRS complex wave interval is 0.09 s. Primarily, the right and left atria (also called auricles) are electrically stimulated to contract via the Sino atrial (SA) node located in the upper right atrium. The SA node is motivated through action
WSEAS TRANSACTIONS on INFORMATION SCIENCE and APPLICATIONS R. Sukanesh, S. Vijayprasath
E-ISSN: 2224-3402 369 Issue 11, Volume 10, November 2013

Fig. 2 Typical standard ECG waveform potentials to maintain a heart rate of approximately 70 beats/minute. This action potential travels across the nerves of the atria causing depolarization and contraction, resulting in the P wave. The electrical signal continues from the SA node to the Atrioventricular (AV) node where a brief delay (~0.15 seconds) allows for atrial emptying (into the ventricles). The AV node transmits the signal to the Purkinje fibers (also called the Bundle of His) to cause ventricular depolarization and contraction, depicted as the QRS complex. Specifically, the peak of the R segment denotes the beginning of ventricular contraction. Post contraction begins a phase of repolarization, the T wave, in which blood is pumped from the ventricle chambers to the lungs (r. ventricle) or body (l. ventricle). The T wave diffuses differently than the QRS complex, beginning in the outer segments of the ventricles and propagating inward thus creating a lower amplitude signal. Occurring shortly after the T wave, the U wave is the repolarization of the Purkinje fibers (rarely detectable due to low SNR).These contractions are a result of synchronized action potentials controlling all myofibrils (muscle fibers) to produce the electrical signals collectively called the cardiac cycle. P wave doesn’t change its amplitude and duration when mild heart attack occurs. T wave is only visible up to 50 to 75%. So our system focuses on QRS complex wave and RR interval since QRS complex wave is the most central, visual part and less affected by noise. RR interval is the time between QRS complexes. From RR interval, we are
going to calculate heart rate of the driver. Whether the heart rate of the driver is less than the lowest threshold value or more than the highest threshold value, it will be considered as drowsiness and heart abnormality respectively. 1.3 Heart rate Heart rate is the number of pulse per unit of time, typically expressed as beats per minute (bpm). It can vary as the body’s need to absorb oxygen and excrete carbon dioxide changes, such as during sleep and exercise. 1.4 Arrhythmia The term “arrhythmia” can describe a wide variety of conditions in which there is abnormal electrical activity in the heart. Many people who are affected do not know that they have an arrhythmic condition and are able to go into old age because it is passive. However, some arrhythmic conditions are life-threatening. With an increase in the number of middle-aged people exercising, it is presently more important to monitor for arrhythmias during exercise. Further, some arrhythmias only show up during exercise and therefore dormant conditions can be discovered by wearing a small arrhythmia detection device. Arrhythmias can be divided into two broad categories as fast slow heart rates. Two major types of arrhythmias are tachycardia (the heartbeat is too fast -- more than 100 beats per minute), and bradycardia (the heartbeat is too slow -- less than 60 beats per minute). Arrhythmias can be life-threatening if they cause a severe decrease in the pumping function of the heart. When the pumping function is severely decreased for more than a few seconds, blood circulation is essentially stopped, and organ damage (such as brain damage) may occur within a few minutes. Life threatening arrhythmias include ventricular tachycardia and ventricular fibrillation. Arrhythmia is identified by where they occur in the heart (atria or ventricles) and by what happens to the heart's rhythm when they occur. 1.4.1 Bradycardia Bradycardia is defined as a heart rate less than 60 beats per minute although it is seldom symptomatic until below 50 bpm when a human is at total rest. This number can vary as children and small adults tend to have faster heart rate than average adults.
WSEAS TRANSACTIONS on INFORMATION SCIENCE and APPLICATIONS R. Sukanesh, S. Vijayprasath
E-ISSN: 2224-3402 370 Issue 11, Volume 10, November 2013

Bradycardia may be associated with medical conditions such as hypothyroidism.
Fig .3 Sinus Bradycardia
1.4.1 Tachycardia Tachycardia is a resting heart rate more than 100 bpm[4]. This number can vary as smaller people and children have faster heart rate than average adults. Physiological conditions when tachycardia occurs are exercise, pregnancy and emotional conditions such as anxiety. Pathological conditions when tachycardia occurs are fever, anemia, hypoxia, hyperthyroidism, hyper secretion of catecholamine, cardiomyopathy and valvular heart diseases.
Fig .4 Sinus Tachycardia
2 System Concept The Overall concept is arranged in the following way where section 2 describes the method of acquiring the bio signal, filtering and then R peak detection. Section 3 describes the tools used for obtaining the design of the proposed system and Section 4 describes the implementations in real time strategy and future work. 2.1 Signal acquisition Normally the Bio-signals are taken by sensors. That Converts the bio signal into electrical signal to the
system. We can’t use electrodes to predict the signals because that makes more physical disturbances to driver. And one type of electrolyte gel is pasted on the skin before placing the electrodes. That gel makes allergies to patients. The main demerit of electrodes is more versatile. So our system uses a non-invasive method of picking up an ECG where each half of steering wheel is wrapped with electrically conductive fabric (ECF) as two ECG electrodes.
Fig.5 Flow diagram of proposed work For its tractability, it can be effortlessly mutilated to fit the curve of steering wheel deprived of causing discomposure to the drivers. These electrodes are bendable, biocompatible and do a waterless signal gaining without the use of any electrolyte gel or any bonding agent. Because of its flexibility, it can be easily deformed to fit the contour of steering wheel without causing discomfort to the drivers [2]. These electrodes are flexible, biocompatible, bio stable and do a dry signal acquisition without the use of any electrolyte gel or adhesive. Thereby no skin training is needed.
WSEAS TRANSACTIONS on INFORMATION SCIENCE and APPLICATIONS R. Sukanesh, S. Vijayprasath
E-ISSN: 2224-3402 371 Issue 11, Volume 10, November 2013
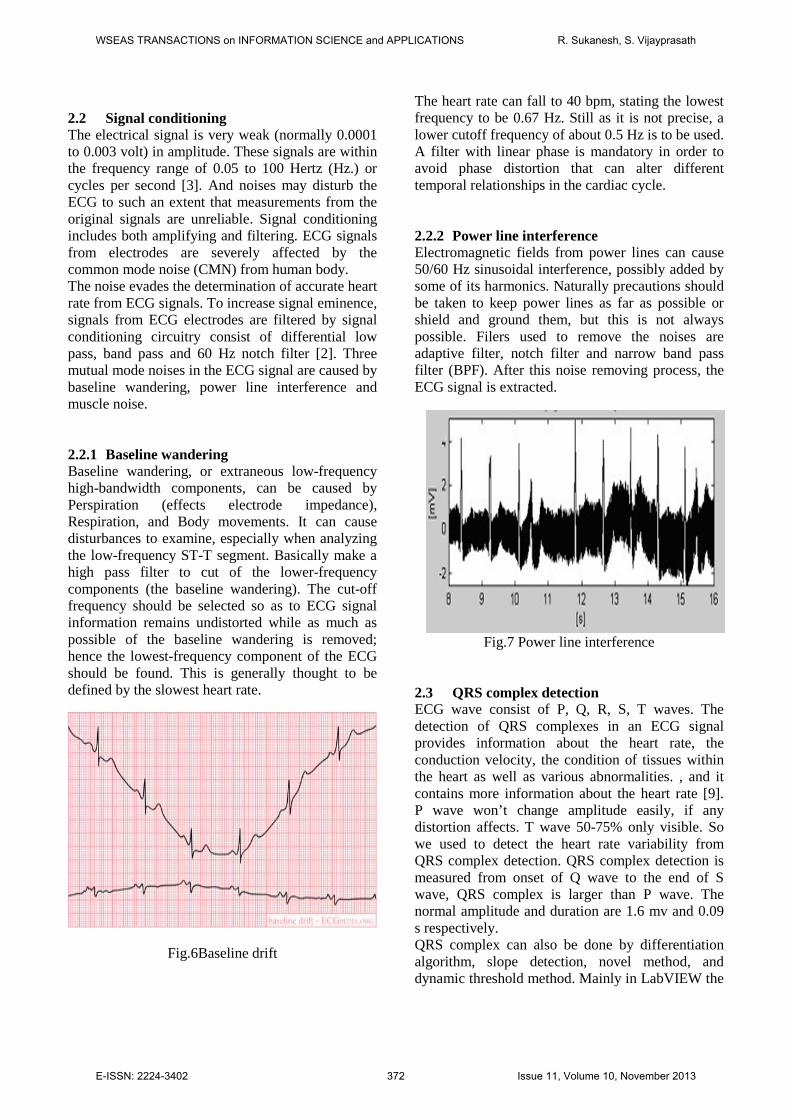
2.2 Signal conditioning The electrical signal is very weak (normally 0.0001 to 0.003 volt) in amplitude. These signals are within the frequency range of 0.05 to 100 Hertz (Hz.) or cycles per second [3]. And noises may disturb the ECG to such an extent that measurements from the original signals are unreliable. Signal conditioning includes both amplifying and filtering. ECG signals from electrodes are severely affected by the common mode noise (CMN) from human body. The noise evades the determination of accurate heart rate from ECG signals. To increase signal eminence, signals from ECG electrodes are filtered by signal conditioning circuitry consist of differential low pass, band pass and 60 Hz notch filter [2]. Three mutual mode noises in the ECG signal are caused by baseline wandering, power line interference and muscle noise. 2.2.1 Baseline wandering Baseline wandering, or extraneous low-frequency high-bandwidth components, can be caused by Perspiration (effects electrode impedance), Respiration, and Body movements. It can cause disturbances to examine, especially when analyzing the low-frequency ST-T segment. Basically make a high pass filter to cut of the lower-frequency components (the baseline wandering). The cut-off frequency should be selected so as to ECG signal information remains undistorted while as much as possible of the baseline wandering is removed; hence the lowest-frequency component of the ECG should be found. This is generally thought to be defined by the slowest heart rate.
Fig.6Baseline drift
The heart rate can fall to 40 bpm, stating the lowest frequency to be 0.67 Hz. Still as it is not precise, a lower cutoff frequency of about 0.5 Hz is to be used. A filter with linear phase is mandatory in order to avoid phase distortion that can alter different temporal relationships in the cardiac cycle.
2.2.2 Power line interference Electromagnetic fields from power lines can cause 50/60 Hz sinusoidal interference, possibly added by some of its harmonics. Naturally precautions should be taken to keep power lines as far as possible or shield and ground them, but this is not always possible. Filers used to remove the noises are adaptive filter, notch filter and narrow band pass filter (BPF). After this noise removing process, the ECG signal is extracted.
Fig.7 Power line interference 2.3 QRS complex detection ECG wave consist of P, Q, R, S, T waves. The detection of QRS complexes in an ECG signal provides information about the heart rate, the conduction velocity, the condition of tissues within the heart as well as various abnormalities. , and it contains more information about the heart rate [9]. P wave won’t change amplitude easily, if any distortion affects. T wave 50-75% only visible. So we used to detect the heart rate variability from QRS complex detection. QRS complex detection is measured from onset of Q wave to the end of S wave, QRS complex is larger than P wave. The normal amplitude and duration are 1.6 mv and 0.09 s respectively. QRS complex can also be done by differentiation algorithm, slope detection, novel method, and dynamic threshold method. Mainly in LabVIEW the
WSEAS TRANSACTIONS on INFORMATION SCIENCE and APPLICATIONS R. Sukanesh, S. Vijayprasath
E-ISSN: 2224-3402 372 Issue 11, Volume 10, November 2013

HRV FFT spectrum VI is used to detect the QRS complex which uses zero crossing detectors, cross analyzer. If there are more than 4 zero crossings that will classify as noise. Whether there are 2 to 4 crossings that will call as QRS complex. Before the QRS complex detection, we have to find the location of peaks and valleys by using waveform peak detection VI. The Waveform Peak Detection VI operates in the array-based Peak Detector VI. The difference is that this VI's input is a waveform data type, and the VI has error cluster input and output terminals. Locations display the output array of the peaks or valleys, which is still in terms of the indices of the input waveform. Peak detection is one of the most important time-domain functions performed in signal monitoring. Peak detection is the process of finding the locations and amplitudes of local maxima and minima in a signal that satisfies certain properties. 2.4 Detection of RR interval R waves were spontaneously detected from the ECG signal, and their occurrences as a function of time collected the RR interval series (RRI).The sudden heart rate can be calculated from the time between any two QRS complexes. The reason for selecting the RR intervals is less affected by noise for HRV analysis. The HRV analysis can be generally characterized into three classes. Those are time domain methods, frequency domain methods and nonlinear methods[11]. Time domain HRV indices are derived either unswervingly from normal RR intervals or from differences between adjacent normal RR intervals. Representative time domain HRV parameters include SDNN (standard deviation of normal RR intervals), SDANN (standard deviation of average normal RR intervals), RMSSD (root mean squared differences of normal RR intervals), pNN50 (percentage of successive normal RR intervals with difference longer than 50 ms), triangle index (a geometric measure derived from the density distribution of normal RR intervals), etc. [11]. Frequency domain measures express HRV as a function of frequency, and provide a better representation of the different functional sources of the heart beat generation [11]. For instance, it is generally accepted that variations in parasympathetic activity contribute to the high frequency component (HF, 0.15 – 0.4 Hz) whereas low frequency component (LF, 0.04 – 0.15 Hz) is mediated by both sympathetic and parasympathetic activities. From the LF/HF ratio, we can easily find
the heart rate of the driver. If the LF/HF ratio decreases, the driver will be in drowsy state. The above methods are more computationally complex. Moreover, they are not suitable for long-term HRV calculation [5]. It seems reasonable to postulate that the control of cardiac rhythm on a moment-by-moment basis is nonlinear and vigorous in nature. So we have to use the nonlinear methods. The range of heart rates is bounded. There is a clear relationship between the nth R-R interval and the immediately preceding one (nth – 1). Nonlinear methods for HRV including: 1/f scaling of Fourier spectrum, symbolic dynamics, correlation dimension, Lyapunov exponents entropy analysis, etc [6].The ECG Feature Extractor VI is used detect the beat which also detects all beats (RR interval) in the signal, and then extracts other features for every beat. Thus the accuracy of detecting R waves is very important. The ECG feature extractor uses windowing technique to recover the RR interval from the ECG signal. After extracting the features, we can perform heart rate variability (HRV) analysis on the R-R interval signal to demonstrate the state of the heart and nerve system. In HRV Analyzer of LabVIEW Biomedical Toolkit, we can directly synchronize the RR intervals from ECG Feature Extractor. 3 Software description From the previous research it is seen that LabVIEW can be effectively used for ECG research when compared with other tools.[21] LabVIEW is a data acquisition software package commonly used with hardware acquisition boards. LabVIEW has many features for data acquisition and processing of either measured data or simulated signals. LabVIEW is cohesivecompletely for communication with hardware such as GPIB, VXI and PXI, RS-232, RS-485 and Plug-in data acquisition boards. Using Lab VIEW, one can create 32 bit compiler programs that give fast execution speeds needed for custom data acquisition, test and measurement solutions. A complete test and measurement system to meet any need could be developed with LabVIEW software and PC compatible data acquisition cards or DAQ.The use of control and indicator buttons and their interconnection rules are intuitive and easy to learn.The foremost executable program is called the top-level VI and theprograms used as modular subroutines are called sub VI. Every VI consists of
WSEAS TRANSACTIONS on INFORMATION SCIENCE and APPLICATIONS R. Sukanesh, S. Vijayprasath
E-ISSN: 2224-3402 373 Issue 11, Volume 10, November 2013
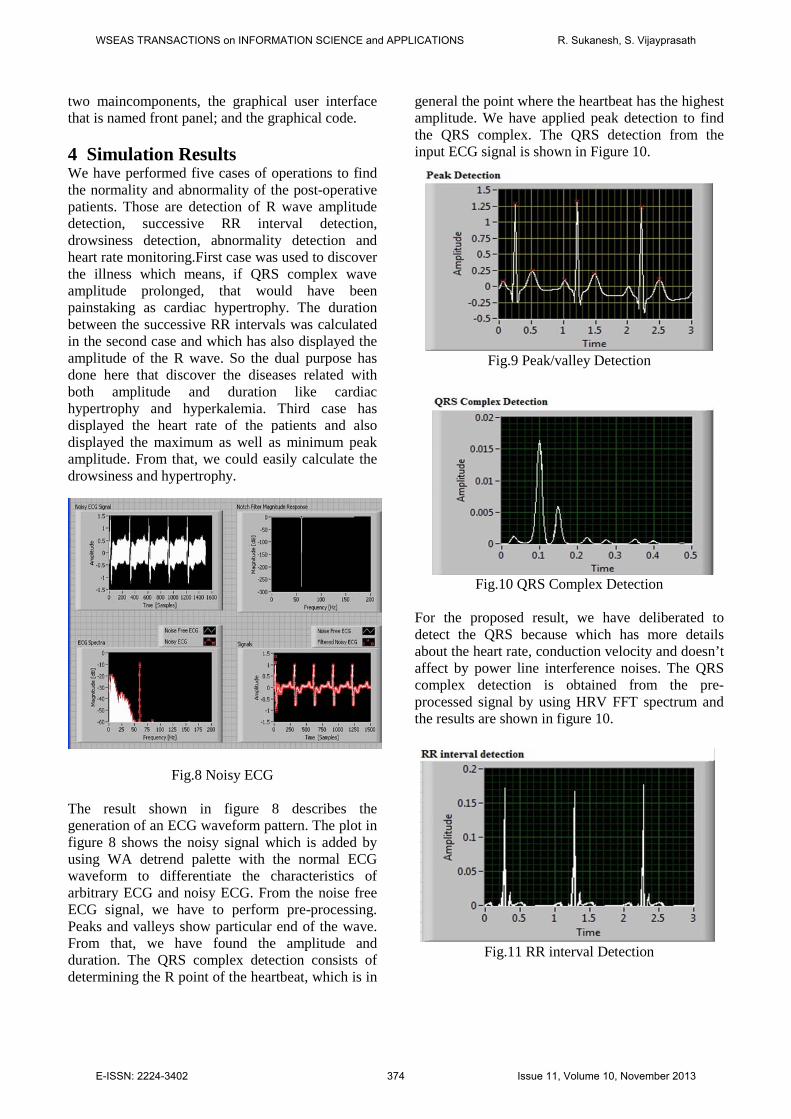
two maincomponents, the graphical user interface that is named front panel; and the graphical code. 4 Simulation Results We have performed five cases of operations to find the normality and abnormality of the post-operative patients. Those are detection of R wave amplitude detection, successive RR interval detection, drowsiness detection, abnormality detection and heart rate monitoring.First case was used to discover the illness which means, if QRS complex wave amplitude prolonged, that would have been painstaking as cardiac hypertrophy. The duration between the successive RR intervals was calculated in the second case and which has also displayed the amplitude of the R wave. So the dual purpose has done here that discover the diseases related with both amplitude and duration like cardiac hypertrophy and hyperkalemia. Third case has displayed the heart rate of the patients and also displayed the maximum as well as minimum peak amplitude. From that, we could easily calculate the drowsiness and hypertrophy.
Fig.8 Noisy ECG
The result shown in figure 8 describes the generation of an ECG waveform pattern. The plot in figure 8 shows the noisy signal which is added by using WA detrend palette with the normal ECG waveform to differentiate the characteristics of arbitrary ECG and noisy ECG. From the noise free ECG signal, we have to perform pre-processing. Peaks and valleys show particular end of the wave. From that, we have found the amplitude and duration. The QRS complex detection consists of determining the R point of the heartbeat, which is in
general the point where the heartbeat has the highest amplitude. We have applied peak detection to find the QRS complex. The QRS detection from the input ECG signal is shown in Figure 10.
Fig.9 Peak/valley Detection
Fig.10 QRS Complex Detection
For the proposed result, we have deliberated to detect the QRS because which has more details about the heart rate, conduction velocity and doesn’t affect by power line interference noises. The QRS complex detection is obtained from the pre-processed signal by using HRV FFT spectrum and the results are shown in figure 10.
Fig.11 RR interval Detection
WSEAS TRANSACTIONS on INFORMATION SCIENCE and APPLICATIONS R. Sukanesh, S. Vijayprasath
E-ISSN: 2224-3402 374 Issue 11, Volume 10, November 2013

RR intervals are less affected by noise. And every successive RR intervals are extracted by using digital IIR filter palette. From that we have calculated the heart rate. Based on heart rate values, bradycardia and tachycardia are detected. Here we have developed a threshold detector part for heart rate using LabVIEW. Results are shown in figure 12.
Fig.12 Threshold detection using LabVIEW
The corresponding outputs shown below indicate three different cases for normal, low and very high heart rate. Green LED will switch over between different threshold levels. When threshold indicator crosses 90 then LED will glow high indicating abnormal heart rate.
Fig.13Heart rate displayed by threshold detection Initially a text input for the patient’s name was created and the ECG chart is automatically updated with the name and live signal data. From this design the user can control the data acquisition periods. Input ECG signal obtained is passed through a set of filters to obtain noise free signal and program to detect any abnormality is created as a Math script file and loaded as shown in figure below. The warning lights to the left of the patient report relate to the present situation of the patient’s ECG. If entirety is normal, the green light is on and the
signal is green. If an arrhythmia is detected, the yellow light turns on and a warning message will appear in the patient report that indicates the type. Similarly, the orange light turns in case of low heart rate and a warning message appears in the report. A red light directs that no decipherable signal is being detected. This situation means that the patient has flat-lined, or sensors are not connected properly. As a result, the warning message will ask the user to check connections. This is achieved by adding math script into the front panel while loop structure that categorizes the different criteria for abnormality detection.
Fig.14 Abnormality detection using LabVIEW
Fig.15 Results showing the report of patient
4 Hardware description We have developed a prototype model in which we have tested the cognitive output provided by the medical devices against a DC motor connected with a wheel. The power supply section of the system which consists of transformer of output 12 voltage and current of 750mA, which is then trailed by the
WSEAS TRANSACTIONS on INFORMATION SCIENCE and APPLICATIONS R. Sukanesh, S. Vijayprasath
E-ISSN: 2224-3402 375 Issue 11, Volume 10, November 2013
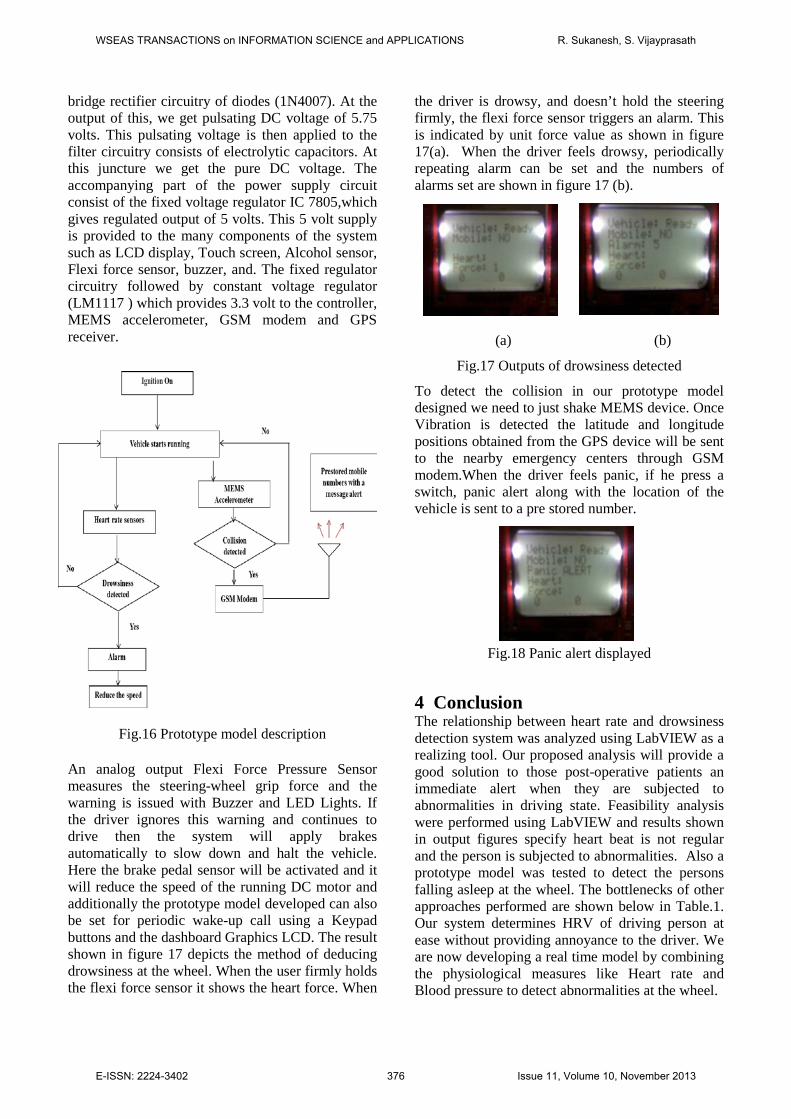
bridge rectifier circuitry of diodes (1N4007). At the output of this, we get pulsating DC voltage of 5.75 volts. This pulsating voltage is then applied to the filter circuitry consists of electrolytic capacitors. At this juncture we get the pure DC voltage. The accompanying part of the power supply circuit consist of the fixed voltage regulator IC 7805,which gives regulated output of 5 volts. This 5 volt supply is provided to the many components of the system such as LCD display, Touch screen, Alcohol sensor, Flexi force sensor, buzzer, and. The fixed regulator circuitry followed by constant voltage regulator (LM1117 ) which provides 3.3 volt to the controller, MEMS accelerometer, GSM modem and GPS receiver.
Fig.16 Prototype model description
An analog output Flexi Force Pressure Sensor measures the steering-wheel grip force and the warning is issued with Buzzer and LED Lights. If the driver ignores this warning and continues to drive then the system will apply brakes automatically to slow down and halt the vehicle. Here the brake pedal sensor will be activated and it will reduce the speed of the running DC motor and additionally the prototype model developed can also be set for periodic wake-up call using a Keypad buttons and the dashboard Graphics LCD. The result shown in figure 17 depicts the method of deducing drowsiness at the wheel. When the user firmly holds the flexi force sensor it shows the heart force. When
the driver is drowsy, and doesn’t hold the steering firmly, the flexi force sensor triggers an alarm. This is indicated by unit force value as shown in figure 17(a). When the driver feels drowsy, periodically repeating alarm can be set and the numbers of alarms set are shown in figure 17 (b).
(a) (b)
Fig.17 Outputs of drowsiness detected
To detect the collision in our prototype model designed we need to just shake MEMS device. Once Vibration is detected the latitude and longitude positions obtained from the GPS device will be sent to the nearby emergency centers through GSM modem.When the driver feels panic, if he press a switch, panic alert along with the location of the vehicle is sent to a pre stored number.
Fig.18 Panic alert displayed
4 Conclusion The relationship between heart rate and drowsiness detection system was analyzed using LabVIEW as a realizing tool. Our proposed analysis will provide a good solution to those post-operative patients an immediate alert when they are subjected to abnormalities in driving state. Feasibility analysis were performed using LabVIEW and results shown in output figures specify heart beat is not regular and the person is subjected to abnormalities. Also a prototype model was tested to detect the persons falling asleep at the wheel. The bottlenecks of other approaches performed are shown below in Table.1. Our system determines HRV of driving person at ease without providing annoyance to the driver. We are now developing a real time model by combining the physiological measures like Heart rate and Blood pressure to detect abnormalities at the wheel.
WSEAS TRANSACTIONS on INFORMATION SCIENCE and APPLICATIONS R. Sukanesh, S. Vijayprasath
E-ISSN: 2224-3402 376 Issue 11, Volume 10, November 2013
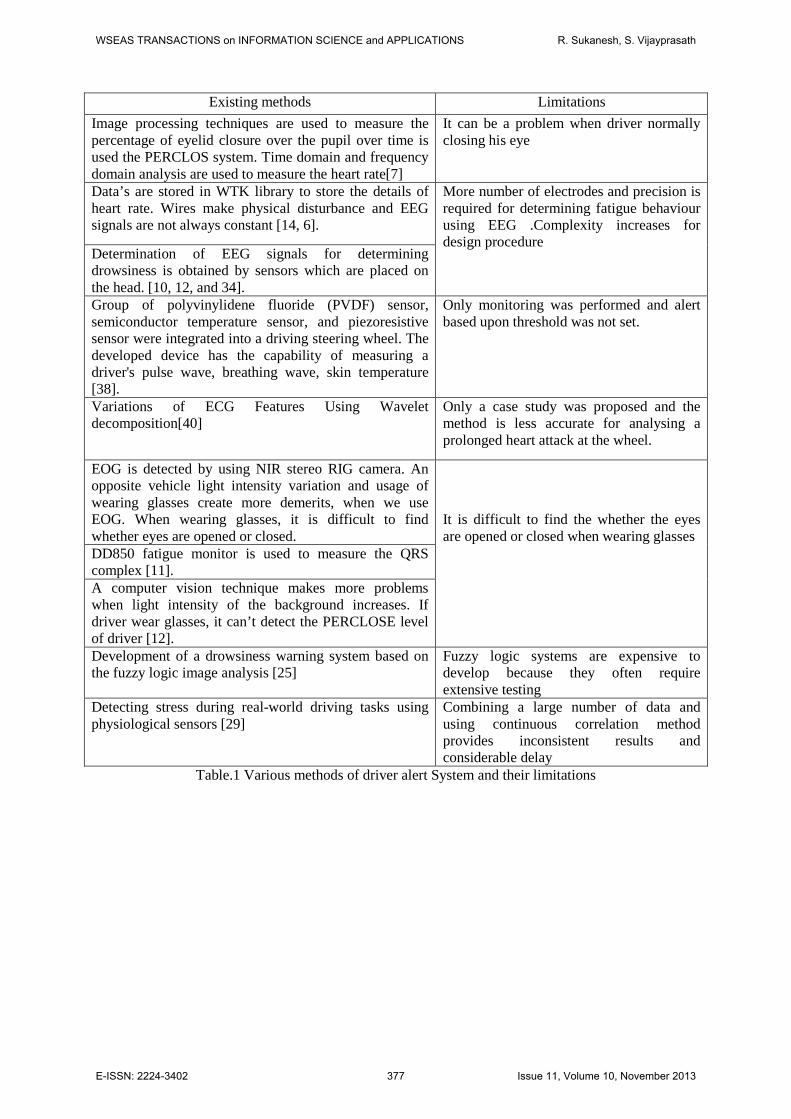
Existing methods Limitations Image processing techniques are used to measure the percentage of eyelid closure over the pupil over time is used the PERCLOS system. Time domain and frequency domain analysis are used to measure the heart rate[7]
It can be a problem when driver normally closing his eye
Data’s are stored in WTK library to store the details of heart rate. Wires make physical disturbance and EEG signals are not always constant [14, 6].
More number of electrodes and precision is required for determining fatigue behaviour using EEG .Complexity increases for design procedure
Determination of EEG signals for determining drowsiness is obtained by sensors which are placed on the head. [10, 12, and 34]. Group of polyvinylidene fluoride (PVDF) sensor, semiconductor temperature sensor, and piezoresistive sensor were integrated into a driving steering wheel. The developed device has the capability of measuring a driver's pulse wave, breathing wave, skin temperature [38].
Only monitoring was performed and alert based upon threshold was not set.
Variations of ECG Features Using Wavelet decomposition[40]
Only a case study was proposed and the method is less accurate for analysing a prolonged heart attack at the wheel.
EOG is detected by using NIR stereo RIG camera. An opposite vehicle light intensity variation and usage of wearing glasses create more demerits, when we use EOG. When wearing glasses, it is difficult to find whether eyes are opened or closed.
It is difficult to find the whether the eyes are opened or closed when wearing glasses
DD850 fatigue monitor is used to measure the QRS complex [11]. A computer vision technique makes more problems when light intensity of the background increases. If driver wear glasses, it can’t detect the PERCLOSE level of driver [12]. Development of a drowsiness warning system based on the fuzzy logic image analysis [25]
Fuzzy logic systems are expensive to develop because they often require extensive testing
Detecting stress during real-world driving tasks using physiological sensors [29]
Combining a large number of data and using continuous correlation method provides inconsistent results and considerable delay
Table.1 Various methods of driver alert System and their limitations
WSEAS TRANSACTIONS on INFORMATION SCIENCE and APPLICATIONS R. Sukanesh, S. Vijayprasath
E-ISSN: 2224-3402 377 Issue 11, Volume 10, November 2013

References: [1] D. Royal, “National Survey of Distracted and
Drowsy Driving Attitudes and Behaviour”, DOT HS 809 566, 2002, pp 41-53.
[2] Xun Yu, “Real-time Nonintrusive Detection of Driver Drowsiness”, CTS 09-15, May 2009.
[3] M. K. Islam, A. N. M. M. Haque, G. Tangim, “Study and Analysis of ECG Signal Using MATLAB & LABVIEW as Effective Tools”, International Journal of Computer and Electrical Engineering, Vol. 4, No. 3, June 2012.
[4] Meyerfeldt U. Wessel N, Sehutt H, et al. Heart rate variability before the onset of ventricular tachycardia: differences between slow and fast arrhythmia. Int J cardiol. 2002; 84: 141-151.
[5] Pallavi M Tekade, S. Gawali, “Investigation and New Method of Non-intrusive Detection of Driver Drowsiness “, International Journal of Engineering and Innovative Technology (IJEIT) , Volume 1, Issue 5, May 2012
[6] Pritchett,S.Zilberg, E,Zheng Ming Xu; Karrar, M, Burton , “Comparing accuracy of two algorithms for detecting driver drowsiness -- Single source (EEG) and hybrid (EEG and body movement) ”, Conference on broadband and biomedical communication ,6th national, 2011.
[7] Lawrence Barr, Stephen Popkin, and Heidi Howarth, “An Evaluation of Emerging Driver Fatigue Detection Measures and Technologies”, IEEE transactions on biomedical engineering, vol. 54, no. 11, June 2009
[8] Vural, E Cetin, Ercil A, Bartlett M, Movellan J.,” Detecting driver drowsiness using computer vision techniques ”, Conference on IEEE communication and signal processing, 16th national, 2008.
[9] Johannes VAN DEN BERG, “Sleepiness and Head Movements”, Conference on Industrial health and clinical, Sweden, March 2006.
[10] Chin-Teng Lin, Ruei-Cheng Wu, Sheng-Fu Liang, “EEG-Based Drowsiness Estimation for Safety Driving Using Independent Component Analysis”, IEEE transactions on circuits and systems, vol. 52, no. 12, December 2005.
[11] J.V.Olsen, J.lian, D.Mussig, V.Lang, “What can we learn from the RR intervals stored in ICDs?”, Vol 8, No 2, 2003
[12] Ming-ai Li, Cheng Zhang, Jin-Fu Yang, “An EEG-based Method for Detecting Drowsy Driving State”, Seventh International
Conference on Fuzzy Systems and Knowledge Discovery (FSKD) , 5, pp. 2164-2167, 10-12 Aug. 2010.
[13] Gan, W.S. &Kuo, S.M. “Embedded Signal Processing with the Micro Signal Architecture (1st edition)”, Wiley-IEEE Press, 2007.
[14] State of the States Report on Drowsy Driving. In:Foundation NS, editor.2007.
[15] Ogilvie RD, Wilkinson RT, Allison S. The detection ofsleep onset: behavioral, physiological, and subjective convergence. Sleep1989 Oct;12(5):458-74.
[16] Shinar Z, Akselrod S, Dagan Y, Baharav A. Autonomic changes during wake-sleep transition: a heart rate variability based approach. Auton Neurosci2006 Dec30;130(1-2):17-27.
[17] G Dorfman Furman, ABaharav, C Cahan, S Akselrod.Early Detection of Falling Asleep at theWheel: A Heart Rate Variability Approach, Computers in cardiology 2008; 35:1109-1112.
[18] Shahina Begum,Mobyen Uddin Ahmed,Peter Funk,Reno Filla. Mental State Monitoring System for the Professional Drivers Based on Heart Rate Variability Analysis and Case-based Reasoning, Proceedings of the Federated Conference onComputer Science and Information Systems pp. 35–42.
[19] Vivoli R., Bergomi M., Rovesti S., Bussetti P., Guaitoli G.M., Biological and Behavioral Factors Affecting Driving Safety, Journalof Preventive Medicine and Hygiene, 2006; vol. 47, pp. 69-73.
[20] Ambak k., Atiq R. and Ismail R., Intelligent Transport System for Motorcycle Safety and Issues. European Journal of ScientificResearch ISSN 1450-216X Vol.28 No.4, 2009, pp.600-611.
[21] MihaelaLascu and Dan Lascu, LabVIEW Electrocardiogram Event and Beat Dection, WSEAS Transactions on computer research, Issue 1, Volume 3, 2008, ,pp.9-18.
[22] Begum S., Ahmed M.U., Funk P., Xiong N., Folke M., Case-Based Reasoning Systems in the Health Sciences: A Survey on Recent Trends and Developments, International journal of IEEE Transactions on Systems, Man, and Cybernetics-Part C: Applications and Reviews, vol 41, Issue 4, 2011, pp 421 - 434.
[23] Lee T. C. and Chiu H. W., Frequency-domain Heart Rate Variability Analysis Performed by
WSEAS TRANSACTIONS on INFORMATION SCIENCE and APPLICATIONS R. Sukanesh, S. Vijayprasath
E-ISSN: 2224-3402 378 Issue 11, Volume 10, November 2013
Digital Filters. Computing in Cardiology,2010, pp. 589 – 592.
[24] Israel S.A., Irvine J.M., Cheng A., Wiederhold M.D. and. Wiederhold B.K., ECG to identify individuals. The Journal of Pattern Recognition.Vol. 38 pp. 133 – 142, 2005.
[25] Jian-Da W. and Tuo-Rung C., Development of a drowsiness warning system based on the fuzzy logic image analysis, Journal of ExpertSystem with Application, 34, 2008, pp.1556-1561.
[26] Chu J., Jin L., Tong B., Shi S., and Wang R., A Monitoring method of driver mouth behavior based on machine vision, IEEE IntelligentVehicles Symposium, Italy, 2004, pp.351 – 356.
[27] Thakor, N.V., Zhu, Y. S., “Application of adaptive filtering to ECG analysis: noise cancellation and arrhythmia detection.” IEEE Transaction on Biomedical Engineering, vol.38, pp.785-794, 1991.
[28] K, Jiao, Z. Y. Li, M. Cheng, and C. T. Wang, “Power spectral analysis of heart ratevariability of driver fatigue,” Journal of Dong Hua University, vol. 22, pp. 11-15, 2005.
[29] J. A. Healey, and R. W. Picard, “Detecting stress during real-world driving tasks using physiological sensors,” IEEE Transaction on Intelligent Transportation Systems, vol. 6, pp.156-166, 2005.
[30] E. Vanoli, P. B. Adamson, B. Lin, G. D. Pinna, R. Lazzara, and W. C. Orr, “Heart Rate Variability During Specific Sleep Stages - A Comparison of Healthy Subjects With PatientsAfter Myocardial Infarction,” Circulation, vol. 91, pp. 1918-1922, 1995.
[31] G. Calcagnini, G. Biancalana, F. Giubilei, S. Strano, and S. Cerutti, “Spectral analusis of heart rate variability signal during sleep stages,” Proceedings of the 16th Annual International Conference of the IEEE Engineering in Medicine and Biology Society, 1994.,vol. 2, pp.1252-1253, 1994.
[32] L. Toscani, P. F. Gangemi, A. Parigi, R. Silipo, P. Ragghianti, E. Sirabella, M. Morelli, L. Bagnoli, R. Vergassola, and G. Zaccara, “Human heart rate variability and sleep stages,” TheItalian Journal of Neurological Sciences, vol. 17, pp. 437-439, 1996.
[33] S. Elsenbruch, M. Harnish, and W. C. Orr, “Heart rate variability during waking and
sleepin healthy males and females,” Sleep, vol. 22, pp.1067-1071, 1999.
[34] H. J. Eoh, M. K. Chung, and S.-H. Kim, “Electroencephalographic study of drowsiness in simulated driven with sleep deprivation,” International Journal of Industrial Ergonomics,vol.35, pp.307-320, 2005.
[35] Q. Ji, Z. Zhu, and P. Lan, “Real-time nonintrusive monitoring and prediction of driverfatigue,” IEEE Transactions on Vehicular Technology, vol.53, pp.1052-1069, 2004.
[36] NCSDR/NHTSA Expert Panel on Driver Fatigue and Sleepiness, “Drowsy driving andautomobile crashes,” National Highway Traffic Safety Administration (NHTSA) report.
[37] X. Fan, B. Yin, and Y. Sun, “Nonintrusive driver fatigue detection,” in Proc. IEEE Int‟l Conf. on Networking, Sensing and Control (ICNSC2008), April 2008, pp. 905–910.
[38] Y. Lin, H. Leng, G. Yang, and H. Cai, “An intelligent noninvasive sensor for driver pulse wave measurement,” IEEE Sensors J., vol. 7, no.5, pp. 790–799, May 2007.
[39] S. Correia, J. Miranda, L. Silva, and A. Barreto, “Labview and Matlab for ECG Acquisition, Filtering and Processing,” 3rd International Conference on Integrity, Reliability and Failure, Porto/Portugal, pp.20-24, 2009.
[40] A. K. M. F. Haque, H. Ali1, M. A. Kiber, and Md. T. Hasan, “Detection of Small Variations of ECG Features Using Wavelet,” ISSN 1819-6608, ARPN Journal of Engineering and Applied Sciences, vol. 4, no. 6, pp27-30, 2009.
WSEAS TRANSACTIONS on INFORMATION SCIENCE and APPLICATIONS R. Sukanesh, S. Vijayprasath
E-ISSN: 2224-3402 379 Issue 11, Volume 10, November 2013