Cereals - pir.sa.gov.au€¦ · Cereals Triticale variety yield performance 2012 and long term...
22
Eyre Peninsula Farming Systems 2012 Summary 25 Cereals The 2012 production figures for Western Eyre Peninsula were approximately 431,500 t wheat, 77,000 t barley, 9,000 t oats, 1,050 t triticale. Eastern Eyre Peninsula 521,500 t wheat, 129,600 t barley, 4,000 t oats, 5,200 t triticale. Lower Eyre Peninsula 357,800 t wheat, 220,000 t barley, 5,440 t oats, 1,300 t triticale. [PIRSA Crop & Pasture Report SA, January 2013] Section Editor: Jessica Crettenden SARDI Minnipa Agricultural Centre Variety 2012 (as % of site average) Long term average across sites within region (2005-2012) as % site average Greenpatch Minnipa Streaky Bay Wharminda Lower Eyre Upper Eyre % sites av. # Trials % sites av. # Trials Abacus - - - - Berkshire 87 121 92 106 105 8 103 8 Bogong 100 89 105 99 110 12 106 11 Canobolas 99 94 100 112 105 12 102 11 Chopper 96 114 107 101 103 10 99 10 Endeavour 88 - - 89 85 6 Fusion 107 124 107 130 110 6 106 6 Goanna 100 77 94 100 97 4 90 4 Hawkeye 99 93 95 96 105 14 103 13 Jaywick 88 116 96 96 102 14 99 13 Rufus 100 86 100 110 97 12 95 12 Tahara 103 75 106 89 96 16 98 15 Tuckerbox 104 - - 83 93 8 Yowie 90 78 93 90 98 6 94 6 Yukuri 98 - - 78 90 8 Site av. yield t/ha 2.18 0.94 1.19 1.42 2.86 1.93 LSD (P=0.05 ) as % 7 18 9 14 Date Sown 13 June 27 May 7 June 22 May Soil Type L L LSCL NWS J-M/A-O rain (mm) 33/442 63/185 5/181 39/209 pH (water) 5.6 8.6 8.5 6.6 previous crop canola barley pasture pasture Stress factors de b,cr,dl dl, lb dl Section 1 Cereals Triticale variety yield performance 2012 and long term (2005-2012) expressed as % of site average yield and as t/ha Soil types: S=sand, C=clay, L=loam, NWS=non wetting sand Site stress factors: de=pre-anthesis moisture stress, b=boron toxicity, cr=crown rot, dl=dry post anthesis, lb=late break Data source: SARDI/GRDC & NVT (long term data based on weighted analysis of sites) Data analysis by GRDC funded National Statistics Group
Transcript of Cereals - pir.sa.gov.au€¦ · Cereals Triticale variety yield performance 2012 and long term...

Eyre Peninsula Farming Systems 2012 Summary 25
CerealsThe 2012 production figures for Western Eyre Peninsula were approximately 431,500 t wheat, 77,000 t barley, 9,000 t oats, 1,050 t triticale. Eastern Eyre Peninsula 521,500 t wheat, 129,600 t barley, 4,000 t oats, 5,200 t triticale. Lower Eyre Peninsula 357,800 t wheat, 220,000 t barley, 5,440 t oats, 1,300 t triticale. [PIRSA Crop & Pasture Report SA, January 2013]
Section Editor:Jessica CrettendenSARDIMinnipa Agricultural Centre
Variety
2012 (as % of site average) Long term average across sites within region (2005-2012) as % site average
Greenpatch Minnipa Streaky Bay Wharminda
Lower Eyre Upper Eyre
% sites av. # Trials % sites av. # Trials
Abacus - - - -
Berkshire 87 121 92 106 105 8 103 8
Bogong 100 89 105 99 110 12 106 11
Canobolas 99 94 100 112 105 12 102 11
Chopper 96 114 107 101 103 10 99 10
Endeavour 88 - - 89 85 6
Fusion 107 124 107 130 110 6 106 6
Goanna 100 77 94 100 97 4 90 4
Hawkeye 99 93 95 96 105 14 103 13
Jaywick 88 116 96 96 102 14 99 13
Rufus 100 86 100 110 97 12 95 12
Tahara 103 75 106 89 96 16 98 15
Tuckerbox 104 - - 83 93 8
Yowie 90 78 93 90 98 6 94 6
Yukuri 98 - - 78 90 8
Site av. yield t/ha 2.18 0.94 1.19 1.42 2.86 1.93
LSD (P=0.05 ) as % 7 18 9 14
Date Sown 13 June 27 May 7 June 22 May
Soil Type L L LSCL NWS
J-M/A-O rain (mm) 33/442 63/185 5/181 39/209
pH (water) 5.6 8.6 8.5 6.6
previous crop canola barley pasture pasture
Stress factors de b,cr,dl dl, lb dl
Section
1
Cer
eals
Triticale variety yield performance2012 and long term (2005-2012) expressed as % of site average yield and as t/ha
Soil types: S=sand, C=clay, L=loam, NWS=non wetting sandSite stress factors: de=pre-anthesis moisture stress, b=boron toxicity, cr=crown rot, dl=dry post anthesis, lb=late break
Data source: SARDI/GRDC & NVT (long term data based on weighted analysis of sites)
Data analysis by GRDC funded National Statistics Group

Eyre Peninsula Farming Systems 2012 Summary26
Up
per
, Eas
tern
and
Wes
tern
Eyr
e P
enin
sula
Mid
and
Lo
wer
Eyr
e P
enin
sula
Vari
ety
2011
(as
% s
ite a
vera
ge)
Long
Ter
m a
v. a
cro
ss s
ites
(08-
12)
2012
(as
% s
ite a
vera
ge)
Long
Ter
m a
v ac
ross
site
s (0
8-12
)
Kim
ba
Min
nip
aM
itch
elvi
lleN
unjik
om
pita
Pen
ong
Str
eaky
Bay
War
ram
bo
ot/
ha
as
% s
ite a
v.#
Tri
als
Cum
min
sR
udal
lU
ngar
rat/
ha
% s
ite a
v.#
Tri
als
AG
T K
atan
a95
112
113
9197
9896
2.24
108
2497
106
105
4.21
105
13
Axe
103
102
9693
111
9910
82.
1210
224
9110
210
54.
0710
113
Cat
alin
a92
8694
9199
9298
2.08
100
2495
9292
4.01
100
13
Cle
arfie
ld J
nz80
9494
8581
9494
1.95
9424
9789
873.
8997
11
Cob
ra96
9910
296
7496
100
2.27
110
1311
090
974.
2710
76
Cor
ack
106
119
127
101
111
105
114
2.40
116
1810
211
299
4.42
110
8
Cor
rell
9398
9998
9710
496
2.17
105
2410
094
964.
1510
313
Dar
t10
811
593
9410
892
982.
1110
27
104
102
103
4.06
101
4
Der
rimut
9710
811
494
100
9691
2.11
102
2499
9196
4.11
102
13
Em
u R
ock
108
117
120
109
128
102
105
2.29
110
1810
711
911
44.
2710
68
Esp
ada
104
111
101
114
108
111
100
2.25
108
2497
103
103
4.23
105
13
Est
oc99
104
104
9390
102
102
2.17
105
2410
010
196
4.15
103
13
Gla
dius
100
101
9310
210
094
101
2.16
104
2492
101
944.
1210
313
Gre
nade
CL
Plu
s10
811
010
011
410
810
892
2.08
101
1399
103
100
4.03
100
6
Just
ica
CL
Plu
s93
9210
010
195
9790
2.09
101
1894
9698
4.04
101
8
Kor
d C
L P
lus
2.13
103
114.
0110
05
Linc
oln
9370
7791
7592
962.
0699
2410
189
854.
0110
013
Mac
e11
111
011
410
611
811
311
42.
3911
524
106
117
107
4.36
109
11
Mag
enta
9195
106
9683
103
952.
2010
624
9810
210
14.
1510
313
Pea
ke10
110
911
310
210
496
102
2.12
103
2410
193
100
4.10
102
13
Pha
ntom
9790
8798
9510
688
2.14
103
1810
584
101
4.15
103
8
Sco
ut10
010
389
9199
9898
2.27
110
2410
392
101
4.38
109
11
Shi
eld
9998
105
111
118
104
962.
1710
513
101
9998
4.12
103
6
Wal
lup
2.18
105
696
103
974.
1110
37
Wya
lkat
chem
9294
100
9492
106
952.
2711
024
104
102
994.
2510
613
Youn
g99
9010
393
9689
100
2.20
106
1893
103
984.
1610
410
Yitp
i2.
0910
117
4.07
101
10
Site
av.
yie
ld (
t/h
a)1.
321.
712.
290.
610.
721.
241.
742.
072.
074.
712.
473.
094.
014.
01
LSD
(%
) (P
=0.
05)
58
108
89
78
56
Dat
e S
own
29 M
ay27
May
4 M
ay7
June
6 Ju
ne7
June
29 M
ay14
May
28 M
ay31
May
Soi
l Typ
eLS
LLS
LSC
LS
CL
LSC
LS
LC
LS
LS
L
J-M
/ A
-O r
ain
(mm
)99
/163
63/1
8558
/192
18/1
3622
/137
5/18
170
/234
28/2
5639
/203
30/2
50
pH (
Wat
er)
8.1
8.6
7.2
8.8
8.8
8.5
8.1
7.5
6.0
5.5
Pre
viou
s C
rop
cano
laba
rley
past
ure
past
ure
past
ure
past
ure
past
ure
cano
lapa
stur
eca
nola
Str
ess
Fact
ors
de, d
lb,
cr,
dlde
, dl,
tadl
dl, l
bdl
, lb
de, d
ldl
, es
dlde
, dl
SA
Wh
eat v
arie
ty y
ield
per
form
ance
201
2 an
d lo
ng te
rm (
2008
-201
2) e
xpre
ssed
as
t/ha
and
% o
f site
ave
rage
yie
ld
Soi
l typ
e: S
=sa
nd, L
=lo
am, C
=cl
ay, L
i=lig
ht, M
=m
ediu
m, H
=he
avy,
F=
fine
Site
str
ess
fact
ors:
de=
prea
nthe
sis
moi
stur
e st
ress
, es=
eye
spot
, b=
boro
n to
xici
ty, c
r=cr
own
rot,
dl=
dry
post
ant
hesi
s, ta
=ta
ke a
ll, lb
=la
te b
reak
Dat
a so
urce
: NVT
& S
AR
DI/
GR
DC
(lo
ng te
rm d
ata
bas
ed o
n w
eig
hte
d a
naly
sis
of s
ites,
200
0-20
10)
Dat
a an
alys
is b
y G
RD
C fu
nded
Nat
iona
l Sta
tistic
s G
roup

Eyre Peninsula Farming Systems 2012 Summary 27
LOW
ER
EY
RE
PE
NIN
SU
LA U
PP
ER
EY
RE
PE
NIN
SU
LA
Vari
ety
2012
(% s
ite a
vera
ge)
Long
Ter
m a
vera
ge
acro
ss s
ites
(200
8-20
12)
2012
(as
% s
ite a
vera
ge)
Long
Ter
m a
vera
ge
acro
ss s
ites
(200
8-20
12)
Cum
min
sW
anill
at/
ha
as
% s
ite a
v.#
Tri
als
Dar
ke P
eak
Elli
sto
nM
inni
pa
Str
eaky
Bay
Wh
arm
ind
at/
ha
as %
site
av.
# T
rial
sB
arqu
e93
113
3.72
9712
9497
102
113
103
2.53
107
17
Bas
s97
873.
8910
29
9298
101
9610
02.
3499
13
Bau
din
9710
03.
5593
1210
32.
1893
10
Bul
oke
102
107
3.85
101
1293
101
9610
110
92.
4410
317
Cap
stan
107
105
4.13
108
799
Com
man
der
9992
3.98
104
1296
9810
610
010
12.
5810
917
Fath
om10
411
64.
0610
69
118
105
127
133
113
2.78
118
10
Flag
ship
9010
23.
6997
1210
295
9499
103
2.42
102
17
Flee
t10
111
84.
0310
512
111
104
123
112
114
2.72
115
17
Flin
ders
9410
43.
9810
49
9110
386
8796
2.42
103
10
Gai
rdne
r10
010
03.
6796
1097
2.33
994
Gra
nge
105
103
102
112
9280
92
Hen
ley
104
914.
0410
611
992.
5110
79
Hin
dmar
sh10
193
4.14
108
1213
098
113
118
116
2.64
112
17
Kee
l97
983.
6896
1299
9511
512
510
02.
6111
016
Mar
itim
e96
104
3.70
9712
9998
9198
104
2.39
101
17
Oxf
ord
105
934.
2411
111
8095
7764
772.
5210
713
Sch
oone
r82
943.
4590
1210
076
9098
932.
2093
17
Sco
pe10
312
33.
8099
1198
106
9510
210
52.
3810
113
Slo
op S
A90
923.
5793
1210
095
9310
597
2.28
9717
Wes
tmin
ster
9678
3.94
103
777
Wim
mer
a10
210
04.
0510
69
102
Site
av.
yie
ld t
/ha
5.20
3.79
3.82
2.32
2.88
2.55
1.74
2.65
2.36
LSD
(P
=0.
05)
as %
413
118
89
11
Dat
e S
own
14 M
ay15
May
29 M
ay22
May
25 M
ay1
June
22 M
ay
Soi
l Typ
eC
LS
SL
SL
SL
NW
S
J-M
/A-O
rai
n (m
m)
28/2
5640
/391
60/1
8938
/328
63/1
8529
/177
39/2
09
pHw
ater
7.5
6.1
7.7
8.3
8.6
8.4
6.6
Pre
viou
s C
rop
cano
laca
nola
past
ure
past
ure
barle
ypa
stur
epa
stur
e
Site
Str
ess
Fact
ors
dlh?
de, d
l, rh
dib,
cr,
dldL
dL
SA
Bar
ley
vari
ety
yiel
d p
erfo
rman
ce 2
012
and
long
term
(20
08 -
2012
) ex
pres
sed
as t/
ha a
nd %
of s
ite a
vera
ge y
ield
Soi
l typ
e: S
= s
and,
L =
loam
, C =
cla
y, L
i = li
ght,
M =
med
ium
, H =
hea
vy, F
= fi
ne, N
W =
non
wet
ting,
/ =
sep
arat
es to
p so
il fro
m s
ub s
oil
Site
str
ess
fact
ors:
b=
boro
n to
xici
ty, c
r=cr
own
rot,
de=
dry
pre-
anth
esis
, dl=
dry
post
ant
hesi
s, h
=IM
I res
idue
s, r
=rh
izoc
toni
aD
ata
sour
ce: S
AR
DI/
GR
DC
& N
VT (
long
term
dat
a b
ased
on
wei
gh
ted
ana
lysi
s o
f site
s)D
ata
anal
ysis
by
GR
DC
fun
ded
Nat
iona
l Sta
tistic
s G
roup
Cer
eals

Eyre Peninsula Farming Systems 2012 Summary28
2012(as % site average)
Long Term average across sites within region (2005 - 2011) as % site average and number of
trials
Region Lower Eyre Upper Eyre Lower Eyre Upper Eyre
Variety Greenpatch Nunjikompita % sites av. # Trials % sites av. # Trials
Bannister 116 105
Dunnart 94 102 3.46 6 1.66 10
Euro 101 91 3.40 7 1.50 12
Mitika 90 90 3.46 7 1.57 12
Possum 94 103 3.44 7 1.59 12
Potoroo 96 107 3.44 7 1.66 12
Wombat 106 86 3.62 4 1.66 7
Yallara 99 106 3.35 7 1.53 12
Site av. yield (t/ha) 2.42 0.59 3.59 1.64
LSD (%) (P=0.05) 9 9
Date sown 13 June 20 June
Soil Type L LSCL
pH (water) 5.6 8.8
J-M/A-O rain (mm) 33/442 18/136
Previous crop canola pasture
Stress factors de de,dl,lb
SA Oat variety yield performance2012 and long term (2005-2012) expressed as % of site average yield and as t/ha
Soil types: S=sand, C=clay, L=loam, F=fineStress factors: lb=late break, de=dry early, dl=dry late
Data source: NVT, GRDC and SARDI Crop Evaluation and Oat Breeding Programs (long term data based on weighted analysis of sites)Data analysis by GRDC funded National Statistics Group

Eyre Peninsula Farming Systems 2012 Summary 29
Key messages• Yitpi and Mace performed well
in the Witera wheat trial.• The highest yields were
recorded in Hindmarsh, Fathom (WI4483) and Skipper in the Witera barley trial.
• Scout, Yitpi and Mace achieved 3 t/ha in the Elliston district wheat trial.
• Mace and Cobra show highest yields at Wharminda.
• Mace and Wyalkatchem perform well in Franklin Harbour trial.
Why do the trial?The wheat and barley variety demonstrations were identified as priorities by local agricultural bureaus to compare current varieties to potential new varieties in soil types and rainfall regions where wheat and barley National Variety Trials (NVT) are not conducted.
Witera District Wheat and Barley TrialsHow was it done?Fifteen wheat varieties and 12 barley varieties, replicated 3 times, were sown on 3 June with both trials receiving 63 kg/ha of 19:13:0:9.4 and 64 kg/ha of 46:0:0:0 (urea) fertiliser at seeding. On 15 August, 54 kg/ha of urea was applied to increase yield potential. 1 L/ha Roundup PowerMax, 1 L/ha Triflur X, 70 ml/ha Hammer and 1 L/ha Lorsban were applied to both trials pre seeding and 1.2 L/ha Bromicide MA was applied for broad-leaved weed control on 24 July.
What happened? Yitpi and Mace performed well at Witera in 2012 yielding 2.29 t/ha and 2.28 t/ha respectively (Table 1). Varieties in 2012 were tested under challenging conditions with a late start to the opening rains and
a short growing season due to lack of rain in spring. The average yield across all varieties in the trial was 2 t/ha. Test weights were exceptionally high and screenings low which was surprising considering the short season. The trial did not receive any fungicides and there was no disease in the wheat trial.
Hindmarsh, Fathom (WI4483) and Skipper produced the highest yields (Table 2). The barley trial did not receive any fungicide sprays and consequently there was some net blotch observed in the trial. Skipper was the best performing malting variety.
Elliston District Wheat TrialsHow was it done?Fifteen wheat varieties, replicated 3 times, were sown on 22 May with 100 kg/ha of DAP fertiliser and 3 L/ha of Zn, Mn and Cu foliar mix. The site received 1 L/ha glyphosate 570 g/L, 0.1 L/ha oxyfluorfen and 1 L/ha of trifluralin prior to sowing. 1.4 L/ha Bromicide MA, 0.25 L/ha Cloquintocet-Mexyl and 0.5 L/ha of an oil/wetter was applied mid-tillering in early July to control post emergent weeds. There were two applications of various fungicides to control rust on 9 August and 19 September. Bait was spread to control snails in September.
What happened?Scout, Yitpi and Mace produced over 3 t/ha at the Elliston District wheat trial in 2012 with the trial averaging 2.85 t/ha (Table 3). Protein levels were low in 2012 along with high screenings levels in some varieties which would have attracted a downgrade at the silos.
The long term yields, relative to Yitpi, (Table 4) show that over the last 7 years a trend towards longer season Yitpi types (Yitpi and Scout) performing well at Elliston.
Witera (Mt Cooper), Elliston, Wharminda and Cowell district wheat and barley trialsLeigh Davis1, Andrew Ware2, Brian Purdie2, Cathy Paterson1, Ashley Flint2 and Brenton Spriggs1
1 SARDI, Minnipa Agricultural Centre, 2 SARDI, Port Lincoln
Try this yourself now
t
Location: WiteraCraig KelshMt Cooper Ag Bureau
RainfallAv. Annual: 423 mmAv. GSR: 332 mm2012 Total: 332 mm2012 GSR: 294 mm
YieldPotential: 4.06 t/ha (W)Actual: 2.0 t/ha
Paddock History2012: Wheat (Scout)2011: Grass free pasture2010: Barley (Fleet)2009: Wheat (Wyalkatchem)2008: Grass free pasture
Soil TypeClay sandy clay loamYield Limiting FactorsSome weed competition
Location: EllistonNigel and Debbie MayElliston Ag Bureau
RainfallAv. Annual: 427 mmAv. GSR: 353 mm2012 Total: 375 mm2012 GSR: 328 mm
Yield
Potential: 4.36 t/ha (W)Actual: 2.85 t/ha (W)
Paddock History2011: Pasture2010: Barley2009: Grass free pasture
Soil TypeSand
Yield Limiting FactorsNone
Research
t
Cer
eals
t
t

Eyre Peninsula Farming Systems 2012 Summary30
Variety Yield(t/ha)
Test Weight(kg/hL)
Protein(%)
Screenings(%)
Yitpi 2.29 79.7 11.6 0.6
Mace 2.28 80.8 10.2 1.8
Estoc 2.18 81.8 11.7 0.9
Wyalkatchem 2.08 81.3 9.9 0.6
Justica 2.07 79.7 11.6 1.3
Corack 2.02 80.3 10.0 0.9
Espada 2.02 79.8 11.2 0.8
Gladius 2.00 81.2 11.2 0.8
Correll 1.98 78.7 11.1 1.4
Scout 1.94 83.3 10.4 0.7
Kord 1.91 80.5 11.6 0.7
Cobra 1.89 79.5 10.6 0.7
Axe 1.88 81.5 11.2 0.7
Lincoln 1.75 80.2 10.6 1.7
Mean 1.73 82.0 11.5 1.2
CV 7.33
LSD (P=0.05) 0.26
Table 1 Grain yield and quality of wheat varieties sown at Witera in 2012
Variety Yield(t/ha)
Protein(%)
Test Weight(%)
Screenings(%)
Hindmarsh 3.82 11.9 66 3.3
Fathom 3.79 12.7 63 2.2
Skipper 3.79 13.0 66 2.1
Fleet 3.65 13.0 63 1.9
Commander 3.48 12.2 66 4.8
Buloke 3.46 12.7 64 5.8
Scope 3.46 12.6 66 4.4
Keel 3.44 12.8 63 5.7
Sloop 3.32 12.8 65 3.5
Schooner 3.29 13.1 67 2.3
Flagship 3.22 12.4 68 3.0
Oxford 3.07 12.6 65 5.7
Mean 3.48 12.7 65 3.7
CV 4.63
LSD (P=0.05) 0.30
Table 2 Grain yield and quality of barley sown at Witera in 2012
Wharminda District Wheat Trials
How was it done?Fifteen wheat varieties, replicated 3 times were sown on 22 May with 100 kg/ha of DAP fertiliser. On 3 July 3 L/ha of Zn, Mn & Cu foliar mix was applied and urea @ 50 kg/ha was applied on 11 July. The trial chemical regime consists
of Paraquat, Diquat @ 1 L/ha, Flutriafol @ 0.4 L/ha, Trifluralin @ 1 L/ha, and Oxyfluorfen @ 0.1 L/ha at seeding. Carfentrazone-ethyl @ 0.09 L/ha and MCPA Amine @ 0.5 L/ha was applied for broadleaf control. Fungicides: Flutriafol @ 0.4 L/ha (applied on fertiliser), and Azoxystobin, Cyproconazol @ 0.50 L/ha were used for controlling leaf diseases.
What happened?Mace and Cobra recorded the highest yields in the district trial at Wharminda with yields of 1.95 t/ha and 1.81 t/ha respectively (Table 5). Protein levels were slightly low and some varieties had poor results with high screenings.
Location: WharmindaTim OttensWharminda Ag Bureau
RainfallAv. Annual: 337 mmAv. GSR: 252 mm2012 Total: 253 mm2012 GSR: 209 mm
YieldPotential: 2.37 t/ha (W)Actual: 1.51 t/ha
Paddock History2011: Grass free pasture2010: Wheat2009: WheatSoil TypeSandYield Limiting FactorsNone
Location: CowellMason, Bevan, Cindy and Scott SiviourFranklin Harbour Ag Bureau
RainfallAv. Annual: 300 mmAv. GSR: 256 mm2011 Total: 313 mm2011 GSR: 200 mm
Yield
Potential: 2.2 t/ha (W)Actual: 2.4 t/ha (Mace)
Paddock History2012: Wheat2011: Grassy pasture2010: Oats2009: Wheat2008: Pasture
Soil TypeRed clay loam
Yield Limiting FactorsNone

Eyre Peninsula Farming Systems 2012 Summary 31
Table 3 Grain yield and quality of wheat varieties sown at Elliston, 2012
Cer
eals
Variety Yield(t/ha)
% of Site Mean
Test Weight(kg/hL)
Protein(%)
Screenings(%)
Scout 3.26 114 84 8.2 5.4
Yitpi 3.08 108 82 8.3 5.5
Mace 3.06 107 83 8.2 2.9
Wyalkatchem 2.99 105 84 8.5 2.4
Cobra 2.96 104 82 8.6 4.6
Estoc 2.96 104 86 8.4 3.4
Correll 2.96 104 82 8.9 5.8
Corack 2.89 101 83 8.8 3.4
Katana 2.84 100 85 8.7 4.1
Axe 2.82 99 82 9.2 3.8
Espada 2.82 99 82 8.8 4.6
Justica 2.67 94 81 9.1 3.3
Gladius 2.66 93 82 9.1 4.8
Lincoln 2.49 87 83 9.7 7.0
Kord 2.30 81 83 9.5 7.6
Mean 2.85
CV 5.08
LSD (P=0.05) 0.37 13
Table 4 Long term yield of wheat varieties in Elliston trials as a percentage of Yitpi, 2006-2012
Variety 2012 2011 2010 2009 2008 2007 2006 Average
Axe 92 83 82 58 91 103 120 90
Corack 94 85 - - - - - 90
Correll 96 84 95 85 85 104 136 98
Espada 92 104 101 76 105 - - 96
Estoc 96 100 105 - - - - 101
Frame - - 94 88 94 83 95 91
Gladius 86 90 91 83 91 112 103 94
Justica 87 81 - - - - - 84
AGT Katana 92 100 - - - - - 96
Kord 75 100 - - - - - 88
Lincoln 81 102 96 78 - - - 89
Mace 99 99 89 80 - - - 92
Scout 106 103 102 - - - - 104
Wyalkatchem 97 85 87 78 88 102 115 93
Yitpi 100 100 100 100 100 100 100 100
Yitpi (t/ha) 3.08 4.04 4.01 4.10 2.48 2.21 0.98 2.99

Eyre Peninsula Farming Systems 2012 Summary32
Table 5 Grain yield and quality of wheat varieties sown at Wharminda, 2012
Variety Yield(t/ha)
% of Site Mean
Test Weight(kg/hL)
Protein(%)
Screenings(%)
Mace 1.95 129 81.9 9.4 2.7
Cobra 1.81 120 81.8 9.9 3.4
Yitpi 1.66 110 81.3 9.9 5.3
Katana 1.66 110 82.1 10.3 4.2
Correll 1.62 107 78.7 9.4 5.7
Espada 1.61 107 80.4 10.0 5.3
Wyalkatchem 1.56 103 81.0 9.9 2.6
Gladius 1.49 99 80.5 9.9 4.0
Lincoln 1.43 95 80.6 9.6 6.9
Kord 1.39 93 80.6 10.3 4.4
Scout 1.39 92 81.6 9.4 6.7
Corack 1.38 91 81.9 9.5 3.8
Axe 1.33 88 79.7 11.1 2.2
Estoc 1.21 81 80.2 10.3 5.9
Justica 1.12 74 79.1 10.2 4.2
Mean 1.51
CV 12.17
LSD (P=0.05) 0.32 21
Table 6 Grain yield and quality of wheat varieties sown at Franklin Harbour, 2012
Variety Yield(t/ha)
% of Site Mean
Test Weight (kg/hL)
Protein(%)
Screenings(%)
Mace 2.42 112 85.8 9.6 2.7
Wyalkatchem 2.19 102 85.1 9.8 1.9
Lincoln 2.17 100 85.2 10.0 4.1
Estoc 2.14 99 86.8 11.0 1.5
Gladius 2.11 98 84.8 10.9 3.4
Catalina 2.10 97 86.8 10.6 2.3
Scout 2.11 98 86.6 10.2 3.0
Axe 2.03 94 85.9 10.3 2.4
Mean 2.16
CV 6.1
LSD (P=0.05) 0.23
Franklin Harbour District Wheat Trials
How was it done?Eight wheat varieties, replicated 3 times were sown on 3 June with DAP @ 60 kg/ha. The site was worked up on 3 March and was sprayed on 1 June with Glyphosate @ 1 L/ha, Ester 680 @ 125ml/ha, Logran 750 WG @ 32 g/ha with 1% wetter.
What happened?Mace yielded 2.4 t/ha and led the way in the district trial at Wharminda (Table 6). Protein
levels were slightly low with only Estoc, Gladius and Catalina having levels above 10.5%. Test weights were excellent and screenings were below 5% for all varieties.
The varieties tested at Witera, Elliston, Franklin Harbour and Wharminda were selected to be the best bet options. For more extensive options and details on any variety characteristics visit the National Variety Trials (NVT) website at www.nvtonline.com.au or refer to the NVT Cereal Performance Tables and the Cereal Variety Disease Guide.
AcknowledgementsThanks to Craig Kelsh, Tim Ottens, Nigel and Debbie May and the Siviour family for the use of their land.
Roundup PowerMax – registered trademark of Nufarm,TriflurX – registered trademark of Nufarm, Lorsban – registered trademark of Dow Agrowsciences, BromicideMA – registered trademark of Nufarm, Lontrel – registered trademark of Dow Agrowsciences and Chemwet 1000 – registered trademark of Nufarm.

Eyre Peninsula Farming Systems 2012 Summary 33
Key messages• Fathom is well adapted to
the upper Eyre Peninsula and was bred using wild barley genetics.
• Today’s knowledge is tomorrow’s gain.
Why do the trial?The University of Adelaide (UA) barley program has a long history of breeding for low rainfall environments and conducting research to identify better yielding barley lines and the genetic basis of drought tolerance. This was reported over 10 years ago in the EPFS Summary 1999-2005, and the launch of Fathom barley
at the 2012 Minnipa Agricultural Centre field day was evidence that research outcomes integrated into a barley breeding program will produce beneficial varieties. So what is the Fathom story?
How was it done?A collaborative breeding project was initiated with the International Centre for Agricultural Research in Dry Areas (ICARDA) based in Syria to introduce material from the Middle East and evaluate this in national drought trials, of which trials at Minnipa were part of. It was identified that the sister line to the feed barley Fleet, called WI3806, was very well adapted to the upper EP (UEP) by combining yield and grain size traits from Mundah, Keel and Barque in its pedigree (EPFS Summary 2006, p 27). Parallel to this, a project was initiated to dissect the genetics of drought tolerance from a wild barley which is a weed type version of cultivated barley.
In order to ‘tame’ the wild barley genes, a new approach called Advanced Backcross QTL (ABQTL) analysis was initiated in 1998 that allowed the simultaneous identification of wild barley drought tolerance genes in a cultivated barley genetic background. An ABQTL population with Barque as the recurrent parent was evaluated in the national drought trials (2002-2004), including at Minnipa. One specific region of interest was a gene on chromosome 2H from wild barley that increased yields above Barque. This new technique allowed the identification of a specific line (13D-020) from the ABQTL population that had all the advantageous traits from Barque, in addition to the wild barley yield gene. This was immediately crossed with WI3806 which was identified earlier to produce a low rainfall barley variety.
This 13D-20/WI3806 cross was made in 2003. The best lines from the cross entered breeding yield trials in 2006, national breeding trials in 2008, and Fathom was selected for National Variety Trials (NVT) in 2010. In 2012 the variety Fathom was launched at the Minnipa Field Day. It took 14 years from the first cross of the ABQTL research population (1998) to the commercial release of Fathom (2012). Although a long time, this is fast for going from knowing nothing of the drought tolerance of the wild barley to integrating the wild barley gene for drought tolerance into a high yielding commercial feed barley. In 2012 the next generation barley drought mapping populations were run for their first year yield trials at Minnipa.
What happened?Presented are the results for Fathom between 2008 and 2012 during which time the variety has been in advanced yield trials with the UA barley program and in the NVT system. Currently the feed barley options in the UEP farming system are Keel, Barque, Maritime, Hindmarsh and Fleet.
Fathom has yielded very well in the seasons of 2008-2012. The average yield for Minnipa in 2010, a high decile growing season rainfall, was 4.38 t/ha. The past two seasons (2011 and 2012) have been lower decile seasons and represent a better test of the drought tolerance of Fathom. It is estimated from the 2013 SARDI Sowing Guide that Fathom out-yields Hindmarsh by 2% using the UEP NVT data. Grain size of Fathom is similar to Fleet. Fathom has test weights slightly better than Fleet, high retention values and screenings values similar to Fleet in NVT trials (Table 2).
Location: Minnipa Agricultural Centre North 4RainfallAv. Annual: 325 mmAv. GSR: 242 mm2012 Total: 253 mm2012 GSR: 185 mm
YieldPotential: 2.05 t/ha (B)Actual: 1.1 t/ha
Paddock History2012: Hindmarsh barley2011: Mace wheat2010: Mace wheat2009: Grass free pastureSoil TypeRed loamFertiliser19:13:0:S9.4 @ 96 kg/ha1.5L/ha Zn sulphate (liquid 16% Zn)
Management1.2 L/ha Bromicide MA + 80ml/ha Lontrel400ml/ha Amistar XtraPlot Size5 m x 1.6 m
Barley breeding for low rainfall environmentsStewart Coventry1, Leigh Davis2, Delphine Fleury3 and Jason Eglinton1 1 University of Adelaide Barley Breeding Program, 2 SARDI, Minnipa Agricultural Centre, 3 University of Adelaide, ACPFG
Searching for Answers
t
Research
Cer
eals

Eyre Peninsula Farming Systems 2012 Summary34
The agronomic features of Fathom make it favourable for the UEP; it has early maturity similar to Keel and Hindmarsh and a long coleoptile like Fleet which allows for better establishment on sandy soils or for deeper sowing. It has a semi-erect growth habit like Barque and vigorous early growth that makes it weed competitive. The plant height is medium-tall (similar to Fleet), good standability (equal to Hindmarsh) and better boron tolerance. Fathom is moderately resistant to all diseases except leaf rust, which is similar to the other varieties but much better than Keel, and is moderately susceptible to the Net Form of Net Blotch, but resistant to the race that attacks Maritime.
The next generation barley drought mapping populations have been run for the first year yield trials at Minnipa in 2012. There are 3 populations that segregate for drought tolerance traits; Fleet/Commander, Fleet/WI4304, and Commander/WI4304. These parents were chosen as they are varieties or elite breeding lines with different mechanisms of
drought tolerance.The aim is to evaluate these populations in low rainfall environments to identify the genetics of drought tolerance and will be evaluated in the field for a number of years, with parallel genotyping and genetic analysis occurring.These populations have been grown at Minnipa, Roseworthy and Swan Hill. The trial details for these experiments are displayed in Table 3.
Table 3 shows that there were a range of site mean yields with Minnipa having the lowest at 1.2 t/ha with the parental lines and Hindmarsh variety yielding around the trial average. At all sites there were lines from the populations that were significantly higher yielding than the parents Fleet, Commander and WI4304. The higher yielding lines at Minnipa indicate that there are drought tolerance genes conferring higher yields that can be explored further. If an interesting gene is identified in any of these populations then introducing these genes into the next generation barley may be a
possibility.
What does this mean?The time frame from research to commercial release of a variety is 15 or more years, so what genetic research is invested in now determines the long term future yield gains. New technology is used to speed up research outputs, however there is still a lag to commercialisation just because of the nature of commercial testing and acceptance of a new variety into a market, especially a malting variety. Given this though, investment into today’s knowledge is tomorrow’s gain.
AcknowledgementsThe authors wish to acknowledge the financial support of GRDC, Viterra and SAGIT.
Table 1 2008-2012 yield of Fathom from UA barley program trials and UEP NVT sites*
UA National 2008*
UA National 2009**
UEP NVT 2010
UEP NVT2011
UEP NVT2012
UA MRC2012
Fathom 127 128 119 169 132 128
Fleet 108 118 117 154 126 113
Hindmarsh 123 122 115 152 127 122
Keel 122 119 126 101 119 122
*all traits are from a multi-locational analysis. Retention is expressed as a % of Keel. Test weight is in kg/hl and screenings is expressed as a percentage.
Site Mean Site Yield (t/ha)
Site CV (%)
Fleet (t/ha)
Commander (t/ha)
WI4304 (t/ha)
Hindharsh (t/ha)
Yield Range (t/ha)
Seeding Date 2012
Minnipa 1.2 14.7 1.3 1.2 1.2 1.2 0.2-1.6 11 June
Roseworthy 3.2 10.7 3.0 3.3 3.4 3.7 0.5-4.8 27 June
Swan Hill 2.7 8.8 2.8 2.8 2.4 2.9 0.5-3.4 13 June
Table 3 Site summary of 2012 drought trials for the population Fleet/Commander
* mean grain yield is expressed as a % of Schooner**2008 and 2009 yield is from a multi-location analysis and expressed as a % of Schooner
UA National Retention 2008
UA National 2009**
NVT National Screenings 2010
NVT National Screenings 2011
NVT 2010-2011 Test Weight
Fathom 133 118 1.9 2.9 66.4
Fleet 125 113 2.6 2.7 66.1
Hindmarsh 104 100 3.5 6.7 67.5
Keel 100 100 4.2 12.4 65.8
Table 2 2008-2012 physical grain quality of Fathom in UA barley program trials and NVT*

Eyre Peninsula Farming Systems 2012 Summary 35
Key messages • Seed size was the most
consistent seed trait that influenced growth and yield.
• Sowing larger seed increased plant establishment compared with medium size seed, increased early vigour and improved yield by 3%.
• Varieties with greater early vigour also tended to produce higher yields.
• Wheat seed source had no effect on plant density or percent plant establishment and had an inconsistent effect on yield.
Why do the trial? Good quality seed is an important foundation of productive crops. Seed quality relates to the size and mineral composition of seed.
Large seed has a bigger embryo and provides more nutrients for early growth, which can lead to good establishment and vigorous growth. The source of seed is can also be important since location influences seed nutrient content. However, there have been mixed reports of the effects of these seed characteristics on wheat yield. This trial was conducted to examine the influence of seed size and seed source on growth and wheat yield. The trial was repeated at Minnipa and Turretfield, but the focus of the article will be on the results from Minnipa.
How was it done? Seven wheat varieties (AGT Katana, Emu Rock, Estoc, Gladius, Mace, Magenta and Scout) were selected from the 2011 NVT trials from diverse locations across SA (Booleroo, Mitchellville, Nangari, Nunjikompita, Turretfield, Wanbi and Wolseley). Site selection was based on an analysis of grain of the variety Mace (Table 1) and aimed to identify sites with a range in grain protein, grain phosphorus (P) and trace elements.
The seed was sieved into large and medium size fractions, either greater than 2.8 mm diameter (47 g/1000 seeds) or 2.5 to 2.8 mm diameter (38 g/1000 seeds) and sown at the Minnipa Agricultural Centre. The trial was sown on 11 June at a rate of 150 plants/m2 in plots 5 m x 6 rows (9.5 inch row spacing). Nitrogen, P and S were supplied as 63 kg/ha of 19:13:0:9. Measurements of plant establishment, early vigour (using a Greenseeker® on 6 and 27 August) and grain yield were made. The Normalized Difference Vegetation Index (NDVI) measurements were calibrated against biomass estimates from the border plots. Crown rot was present and the severity was
estimated by assessing the number of white heads in each plot.
What happened?Sowing larger seed increased the plant population from 117 to 127 plants/m2. Scout and Estoc had the highest establishment, and Emu Rock and AGT Katana the lowest. A similar effect of seed size and variety was observed at Turretfield suggesting that the differences were directly associated with seed characteristics rather than conditions during germination and emergence. Seed source did not influence establishment.
Although the effects were small, large seed produced greater early growth and improved yields by 3% (Table 2). At Turretfield (mean yield = 3200 kg/ha) there was also a 3% yield increase from large seed. A yield increase of about 60 kg/ha would be required to cover the cost of grading (assuming grading costing $18/t and wheat at $295/t).
Seed source influenced growth and yield during the growing season but the response depended on seed size and variety. Table 3 shows an example for seed from Nunjikompita and Turretfield. Significant increase in yield from using large seed only occurred with seed from Nunjikompita and then only in the varieties Gladius and Scout.
Emu Rock produced the highest average yields and Gladius and Scout the lowest (Table 4). Gladius and Scout were the least vigorous varieties, while Emu Rock was relatively vigorous. The differences in grain yield among the varieties were positively correlated with the NDVI values measured on 27 August (r = 0.66, P = 0.10).
Location: Minnipa Agricultural CentreRainfallAv. Annual: 325 mmAv. GSR: 242 mm2012 Total: 253 mm2012 GSR: 185 mm
YieldPotential: 1.65 t/ha (W)Actual: 1.34 t/ha
Paddock History2011: Scout barley2010: Scout barley2009: PastureSoil TypeBrown loamDiseasesCrown rotYield Limiting FactorsEarly finish and Crown rot
Wheat seed source and seed size effects on grain yield Shafiya Hussein1 and Glenn McDonald2
1SARDI, Waite Campus, 2University of Adelaide
Searching for Answers
t
Research
Cer
eals

Eyre Peninsula Farming Systems 2012 Summary36
Table 1 Grain protein and nutrient concentrations of ungraded seed of Mace from the 7 seed sources used in the experiment
Seed source GPC P S Mn Zn Cu
(%) (mg/kg)
Booleroo 12.9 2800 1650 49 15 4.6
Mitchellville 8.7 2700 1300 39 17 4.1
Nangari 9.3 2000 1430 35 12 4.1
Nunjikompita 10.8 2100 1440 37 15 4.7
Turretfield 13.0 3200 1620 47 16 5.0
Wanbi 10.6 3000 1380 33 11 1.4
Wolseley 11.6 3000 1610 36 29 4.5
Seed Size Plants/m2 NDVIA Grain yield(kg/ha)6 August 27 August
Medium 117 0.291 (1370) 0.420 (1760) 1323
Large 127 0.308 (1420) 0.439 (1820) 1361
LSD (P=0.05) 5 0.0045 0.0044 38
Table 2 The average effect of seed size on plant number, early growth (assessed as NDVI) and grain yield at Minnipa in 2012. The estimated crop biomass (kg/ha) equivalent to the NDVI value is shown in brackets.
Variety Seed Source Grain yeild (kg/ha) Yield change(kg/ha)Medium seed Large Seed
AGT KatanaNunjikompita
Turretfield12971275
13751494
78219
Emu RockNunjikompita
Turretfield15831653
16901475
107-178
EstocNunjikompita
Turretfield12601186
14381435
178249
GladiusNunjikompita
Turretfield10191271
13461123
327-148
MaceNunjikompita
Turretfield14041364
12491472
-155108
MagentaNunjikompita
Turretfield12941420
13271316
33-104
ScoutNunjikompita
Turretfield940
127513231442
383167
LSD (P=0.05) Within the same Variety. Source combination 266Other comparisons: 272
Table 3 The interaction effect of variety, seed source and seed size on grain yield at Minnipa in 2012
A full canopy closure occurs when the NDVI is around 0.8

Eyre Peninsula Farming Systems 2012 Summary 37
Gladius and Scout also had the higher severity of crown rot and Emu Rock the least, and there was a general negative relationship between the severity of crown rot and yield among the variety and seed size treatments (r = -0.71, P<0.05).
What does this mean?Seed size was the trait that was most consistently associated with yields. Large seeds promoted better crop establishment, early crop vigour and yield. A similar effect was observed at Turretfield, suggesting plump grain may also be advantageous under more favorable seasons.
The work highlighted the importance of early vigour to yield, even in a year with a dry spring. Vigorous growth associated with large seed or with varieties promoted early growth and yield.
In this experiment, seed source did not have a consistent effect on yield. There was evidence that it may influence early vigour but the influence of site was also depended on the variety and seed size.
Maturity was an important influence on the yields of varieties in 2012. Emu Rock is an early season maturing wheat; its very large grain size and Minnipa’s early dry
finish provided a competitive edge over mid season varieties such as Gladius, Magenta, Scout and mid-late varieties such as Estoc and Mace.
AcknowledgementsWe would like to thank SAGIT for funding this project. Thanks to Leigh Davis and Brenton Spriggs for sowing and managing the trial and Willie Shoobridge for helping with field assessments.
Variety NDVI Grain yield (kg/ha)6 August 27 August
Emu Rock 0.304 (1410) 0.455 (1870) 1542
Mace 0.303 (1410) 0.419 (1760) 1390
Magenta 0.312 (1440) 0.467 (1910) 1366
AGT Katana 0.293 (1380) 0.445 (1840) 1337
Estoc 0.300(1400) 0.407 (1720) 1318
Scout 0.292 (1370) 0.397 (1690) 1225
Gladius 0.297(1390) 0.417 (1750) 1218
LSD (P=0.05) 0.0136 0.0259 75
Table 4 Mean grain yields of 7 wheat varieties grown at Minnipa in 2012. The estimated crop biomass (kg/ha) equivalent to the NDVI value is shown in brackets
Cer
eals

Eyre Peninsula Farming Systems 2012 Summary38
Key messages• Even under dry seasonal
conditions, wheat and barley responded strongly to P fertiliser.
• The yield response to P in barley was linear between 0 and 16 kg P/ha.
• Wheat showed a curvilinear response but the economic optimum was close to 16 kg P/ha.
• Although barley yielded more than wheat, the P use efficiency of wheat and barley were comparable.
• The DGT test for soil P was more sensitive to the spatial variation in soil P than Colwell P and was able to predict the optimum P rate for wheat.
• Even in the relative small area of the experiments, DGT P varied 7-fold, highlighting the importance of appropriate sampling to achieve reliable results for soil tests.
Why do the trial? The imperative for efficient use of phosphorus (P) in broad acre agriculture has been highlighted recently due to concerns about the finite amount of P fertiliser resources and the likelihood of increased fertiliser prices contributing to greater production costs in the future. Maximising yields on the basis of providing adequate P nutrition can be achieved by applying sufficient amounts of P fertiliser on soils where P is limited. The overall contribution to P uptake of the P fertiliser is small (5-30%) and therefore the rest of the crop’s P requirements needs to be supplied from existing soil P reserves. Wheat and barley are the two major crops grown in southern Australia but the phosphorus use efficiency (PUE) of specific varieties of each is relatively unknown. McDonald et al. (EPFS Summary 2011, p 127) reported results on the overall response of wheat and barley varieties to an application of P, but efficiency in terms of amounts of P required to maximise yields wasn’t assessed due to a single addition of P. Information relating to both the overall response of each variety to P application and actual fertiliser P requirements of each variety would be invaluable.
How was it done? Two replicated field trials (wheat and barley) were established at Minnipa Agricultural Centre in the Airport paddock. The DGT test for available P indicates the soil to be P deficient (20 μg/L, critical – 50 μg/L) but the Colwell P test did not indicate deficiency (28 mg/kg, PBI – 82, critical Colwell P – 26 mg/kg).
Six varieties of wheat and barley (Table 1) were sown at 5 rates of P: 0, 2, 4, 8 and 16 kg P/ha. The varieties sown were selected from a range of current commercial
varieties and some old varieties that have been reported to show differences in P responses. The P was applied as triple superphosphate, drilled with the seed at sowing. Early crop growth was assessed by taking a biomass sample on 26 August when the plants were at early stem elongation. At the same time, a soil sample was taken from between the rows in each plot to measure Colwell P and DGT P.
The PUE is defined as the yield at zero P (0P) relative to the maximum yield. The P requirement was assessed by fitting a curve through the yield response data and estimating the P rate that gave 95% maximum yield. The economic optimum P rate for wheat (i.e. when the marginal return = costs of the additional P) was calculated based on a price of wheat (H1-H2) of $293/t, and a fertilizer price of $650/t (MAP).
What happened? The DGT test was more sensitive to the spatial variation in topsoil P in both experiments and the variation in DGT values was about twice that of Colwell P (Table 1).
Responses to P applications were obtained in biomass production and in grain yield. There was no significant difference in the yields among the wheat and barley varieties, nor was there a Variety by P interaction. In other words, for both wheat and barley the yield differences among the 6 varieties were too small to pick up significant differences in their responsiveness to P. Therefore only the average responses in wheat and barley are considered.
Barley yielded more than wheat and but had a similar PUE (Table 2). The yield advantage of barley tended to be greater at the lower P rates.
Efficiency of wheat and barley varieties in a P deficient soilSean Mason1, Glenn McDonald1, Bill Bovill2, Willie Shoobridge3 and Rob Wheeler3
1 School of Agriculture, Food and Wine University of Adelaide, 2 CSIRO Land and Water, Canberra, 3 SARDI New Varieties Agronomy
Searching for answers
t
Location: Minnipa Agricultural CentreRainfallAv. Annual: 325 mmAv. GSR: 242 mm2012 Total: 253 mm2012 GSR: 185 mm
YieldPotential:1.7 t/ha (W)Paddock History2011: Peas2010: Wheat2009: WheatSoil TypeRed sandy loam over light clay
Research

Eyre Peninsula Farming Systems 2012 Summary 39
Overall, growth and yield responded up to the highest rate of P and there was little evidence of a plateau in growth and yield. The average responses (Figure 1) show that the yield response to P was lower than the response in early biomass, especially in wheat, and that barley was more P efficient than wheat in this experiment because its relative biomass production and yield at 0P was greater than wheat.
Wheat showed a linear response to P in early biomass production and an optimum P rate was not detected. The optimum P rate for early biomass production in barley was more than 16 kg P/ha. At maturity the P rate in wheat that produced 95% of the maximum yield was 17 kg P/ha, while the response in barley was linear. From the wheat DGT database, the predicted relative yield for this
site was 67% with a required P rate of 17 kg P/ha. The economic optimum rate was estimated to be 15-18 kg P/ha.
What does this mean?The DGT test was more sensitive to the spatial variation in soil P and was better able to predict the P response at the site than Colwell P.
Intensive sampling of both trials demonstrated the large degree of spatial variation that can occur, with a 7-fold difference in DGT P in both the wheat and barley trials. This highlights the importance of appropriate sampling methods to provide a representative sample for soil analysis.
There was a strong response to P and the yields did not plateau. Highest yields were achieved at the highest rate of P. The observation that the economic optimum P rate
for wheat was close to the highest rate of P used suggests that under fertilisation with P may be a false economy in a highly responsive soil.
On average wheat and barley showed similar levels of P efficiency. This agrees with past work that has indicated that there is more variation among varieties of wheat and barley than there is between wheat and barley.
The extended periods of dry conditions in 2012 would have restricted the movement of P through the soil to the roots by diffusion and this may have contributed to the strong response to P.
Acknowledgements The experiments were run with the financial support of SAGIT (UA1201).
Cer
eals
Crop Colwell P (mg/kg) DGT (µg/L)
Mean CV (%) Mean CV (%)
Wheat (Correll, Gladius, Mace, RAC875,
Scout, Wyalkatchem)
25.1 (16-45) 19 18.8 (6-43) 39
Barley (Barque73, Commander, Fleet,
Galleon, Hindmarcsh, Yarra)
30.1 (17-50) 22 21.3 (10-67) 44
Table 1 Comparison of the spatial variation in Colwell P and DGT P in the wheat and barley trials, MAC 2012. The mean and the range in values and the coefficient of variation (CV) are shown
Crop P rate (kg P/ha) PUE(%)0 2 4 8 16
Wheat 1.91 1.97 2.12 2.20 2.37 80
Barley 2.12 2.20 2.17 2.33 2.55 83
Relative yield (%) 111 112 102 106 107
0
20
40
60
80
100
0 4 8 12 16
Rela
tive D
M o
r gra
in yi
eld
P rate (kg/ha)
(a) Wheat
DM
GY
0
20
40
60
80
100
0 4 8 12 16
Rela
tive D
M o
r gra
in yi
eld
P rate (kg/ha)
(b) Barley
DM
GY
Table 2 The mean grain yield (t/ha) and the PUE of wheat and barley at Minnipa in 2012 and the yield of barley relative to that of wheat at each P rate
Figure 1 The average responses to P in (a) wheat and (b) barley for crop dry matter at stem elongation and for grain yield. The data is shown as a relative response (expressed as %) where biomass or yield at 16 kg P/ha =100%

Eyre Peninsula Farming Systems 2012 Summary40
Key messages• High yielding wheat
varieties that have recently been adopted by growers in South Australia are better at accumulating protein than older, lower yielding varieties.
• Although new varieties produce more protein per hectare, their higher yield means that grain protein content (expressed as a % of grain weight) is actually lower.
• As growers are paid more for grain yield than protein content, the newer wheat varieties have been, on average, a higher gross margin option.
• Mace seems to respond very positively to N application, perhaps providing growers the option to improve their profits by increasing N supply to the crop.
Why do the trial? With the adoption of new high yielding wheat varieties, farmers have been reporting lower grain protein percentage when compared to older varieties that have previously been grown. This research was conducted to find out how big this difference in protein percentage is, what financial impact it has, and help growers maximise the return on nitrogen (N) application.
Why is this important? Slipping just one grade from AH2 to APW over the past 10 years would have cost growers an average $16/t or 6% of their gross income. However, new varieties are also higher yielding, leading to an increase in income. So we need to know how growers can best manipulate N inputs to manage both grain yield and grain protein in these new varieties. To do this,
it is important that we understand if the underlying cause of this reduction in grain protein content is due to a change in the genetics of the new varieties, or can also be manipulated through interactions with management practices.
How was it done? The quantity of protein in wheat grain is largely determined by N (a key constituent of protein) supply and availability to the plant. Within the plant there are actually 3 components that drive grain protein percentage; (1) the plant’s ability to uptake N (2) the plant’s ability to remobilise N from its vegetative tissues and store it in the grain (3) the ratio of starch to N that is finally loaded into the grain. For example, in drought stressed environments, starch deposition is much slower than protein formation, which leads to an increase in the percentage of the grain which is made of protein. The opposite is also true in seasons and locations that experience a more favourable finish to the season. To investigate the N use efficiency (NUE) and N response of South Australian wheat varieties, two sets of data were used. Firstly, the National Variety Trials (NVT) grain yield and protein data from 2008-2011, and secondly, a set of NUE trials conducted by AGT.
NVT grain yield and protein dataA study was also performed using grain yield and grain protein percentage from 2009-2011 NVT data in South Australia. Trials affected by severe rust infection were removed from the dataset prior to the analysis. The average grain yield, grain protein, screenings and hectolitre weights (HLW) were calculated for varieties that were present in all of the South Australian NVT trials during
the 2009-2011 period.
AGT NUE trialsEight NUE field experiments were run by AGT from 2009-2012. These experiments included between 24 and 37 entries that consisted of important varieties and advanced breeder’s lines, with a core group of 8 varieties common to each experiment. The experiments had 3 replicates and either 3 (16, 39, 85 kg N/ha) or 4 (16, 39, 62, 85 kg N/ha) N treatments. The N was applied in furrow at seeding time with an additional 42 kg N/ha of N applied, prior to the initiation of stem elongation, to all treatments in 2 of the experiments which had sufficient moisture available. All other aspects of experimental management followed local best practice. Experiments were run at Cummins, Rudall, Mintaro, Pinnaroo and Roseworthy.
What happened?Highest yielding = lowest protein (The NVT story)Figure 1 illustrates that varieties with the highest average grain yields also had the lowest grain protein contents. Conversely, varieties with the lowest grain yield achieved the highest grain protein. This result strongly supports the hypothesis that N supply had not been sufficient to ensure that grain protein content was maintained for the higher yielding varieties.
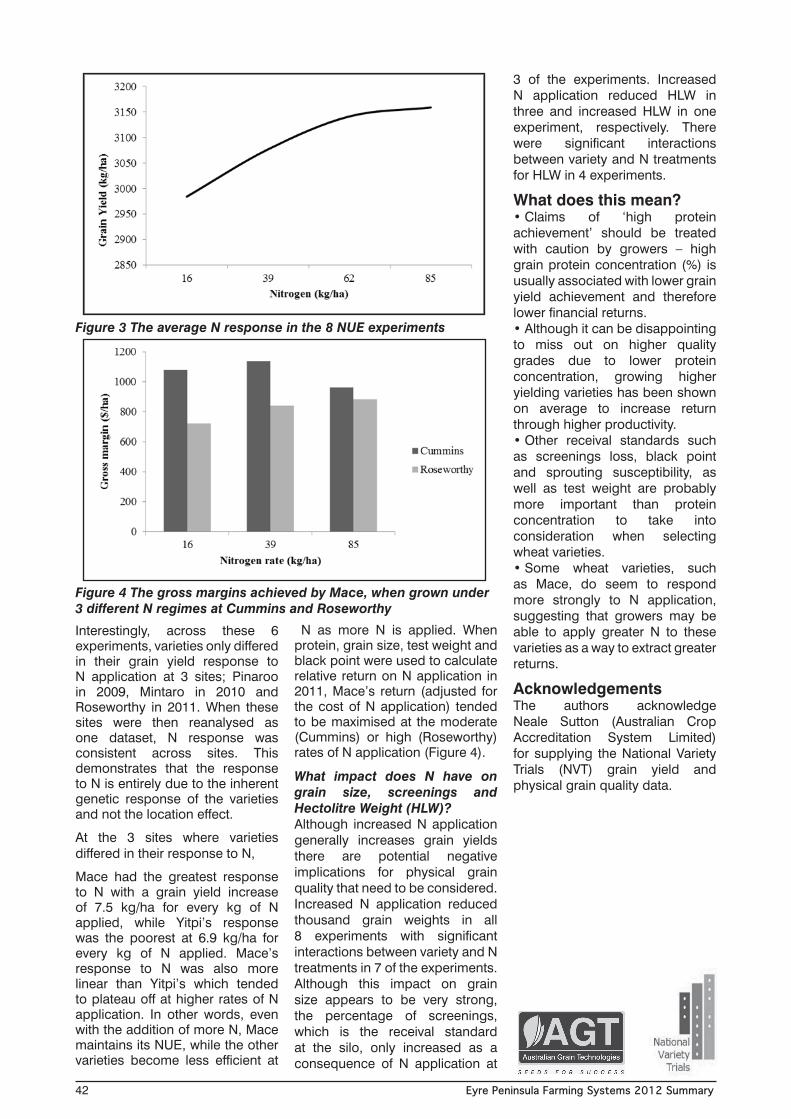
Rather, for these elite varieties, protein content was diluted by higher levels of starch deposition during grain fill. This hypothesis can be confirmed further by comparing the protein yields (kg/ha of protein) of each of the varieties. The protein yield of each variety can be calculated by multiplying the grain yield of each variety by its corresponding protein percentage (Figure 2).
Protein achievement and grain yield in new wheat varietiesJames Edwards, Haydn Kuchel and the AGT Roseworthy breeding teamAustralian Grain Technologies, Roseworthy Campus, SA
Research
Eyre Peninsula Farming Systems 2012 Summary 41
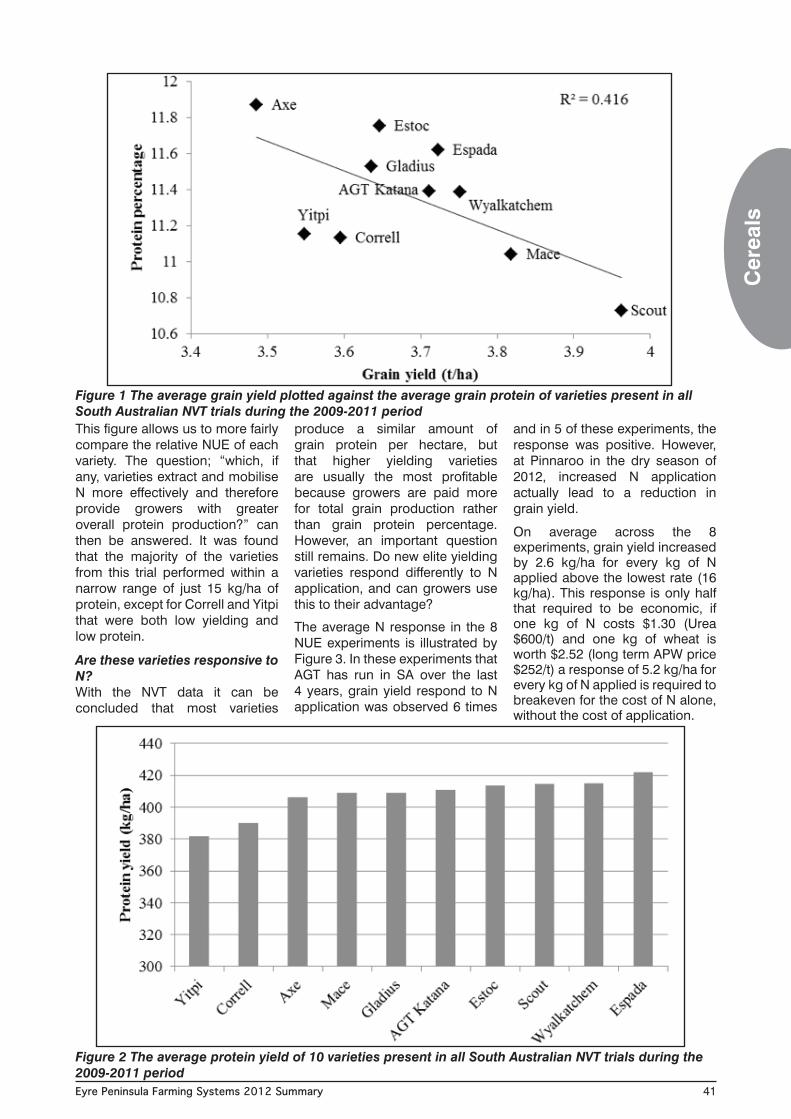
Figure 1 The average grain yield plotted against the average grain protein of varieties present in all South Australian NVT trials during the 2009-2011 periodThis figure allows us to more fairly compare the relative NUE of each variety. The question; “which, if any, varieties extract and mobilise N more effectively and therefore provide growers with greater overall protein production?” can then be answered. It was found that the majority of the varieties from this trial performed within a narrow range of just 15 kg/ha of protein, except for Correll and Yitpi that were both low yielding and low protein.
Are these varieties responsive to N?With the NVT data it can be concluded that most varieties
produce a similar amount of grain protein per hectare, but that higher yielding varieties are usually the most profitable because growers are paid more for total grain production rather than grain protein percentage. However, an important question still remains. Do new elite yielding varieties respond differently to N application, and can growers use this to their advantage?
The average N response in the 8 NUE experiments is illustrated by Figure 3. In these experiments that AGT has run in SA over the last 4 years, grain yield respond to N application was observed 6 times
and in 5 of these experiments, the response was positive. However, at Pinnaroo in the dry season of 2012, increased N application actually lead to a reduction in grain yield.
On average across the 8 experiments, grain yield increased by 2.6 kg/ha for every kg of N applied above the lowest rate (16 kg/ha). This response is only half that required to be economic, if one kg of N costs $1.30 (Urea $600/t) and one kg of wheat is worth $2.52 (long term APW price $252/t) a response of 5.2 kg/ha for every kg of N applied is required to breakeven for the cost of N alone, without the cost of application.
Figure 2 The average protein yield of 10 varieties present in all South Australian NVT trials during the 2009-2011 period
Cer
eals
Eyre Peninsula Farming Systems 2012 Summary42
Figure 3 The average N response in the 8 NUE experiments
Interestingly, across these 6 experiments, varieties only differed in their grain yield response to N application at 3 sites; Pinaroo in 2009, Mintaro in 2010 and Roseworthy in 2011. When these sites were then reanalysed as one dataset, N response was consistent across sites. This demonstrates that the response to N is entirely due to the inherent genetic response of the varieties and not the location effect.
At the 3 sites where varieties differed in their response to N,
Mace had the greatest response to N with a grain yield increase of 7.5 kg/ha for every kg of N applied, while Yitpi’s response was the poorest at 6.9 kg/ha for every kg of N applied. Mace’s response to N was also more linear than Yitpi’s which tended to plateau off at higher rates of N application. In other words, even with the addition of more N, Mace maintains its NUE, while the other varieties become less efficient at
using
N as more N is applied. When protein, grain size, test weight and black point were used to calculate relative return on N application in 2011, Mace’s return (adjusted for the cost of N application) tended to be maximised at the moderate (Cummins) or high (Roseworthy) rates of N application (Figure 4).
What impact does N have on grain size, screenings and Hectolitre Weight (HLW)?Although increased N application generally increases grain yields there are potential negative implications for physical grain quality that need to be considered. Increased N application reduced thousand grain weights in all 8 experiments with significant interactions between variety and N treatments in 7 of the experiments. Although this impact on grain size appears to be very strong, the percentage of screenings, which is the receival standard at the silo, only increased as a consequence of N application at
3 of the experiments. Increased N application reduced HLW in three and increased HLW in one experiment, respectively. There were significant interactions between variety and N treatments for HLW in 4 experiments.
What does this mean? • Claims of ‘high protein achievement’ should be treated with caution by growers – high grain protein concentration (%) is usually associated with lower grain yield achievement and therefore lower financial returns.• Although it can be disappointing to miss out on higher quality grades due to lower protein concentration, growing higher yielding varieties has been shown on average to increase return through higher productivity.• Other receival standards such as screenings loss, black point and sprouting susceptibility, as well as test weight are probably more important than protein concentration to take into consideration when selecting wheat varieties. • Some wheat varieties, such as Mace, do seem to respond more strongly to N application, suggesting that growers may be able to apply greater N to these varieties as a way to extract greater returns.
AcknowledgementsThe authors acknowledge Neale Sutton (Australian Crop Accreditation System Limited) for supplying the National Variety Trials (NVT) grain yield and physical grain quality data.
Figure 4 The gross margins achieved by Mace, when grown under 3 different N regimes at Cummins and Roseworthy
Eyre Peninsula Farming Systems 2012 Summary 43
Key messages• This study has identified
some regions, such as Agzone 1 in WA, the upper Eyre Peninsula in SA and the Wimmera in Victoria, are more likely to suffer from high screenings than others, such as the lower Eyre Peninsula or the York Peninsula.
• Over the 3 years of the study, low hectolitre weight appeared to be more consistently related to the region, rather than the variety, with Agzone 1 suffering the lowest and the Eyre Peninsula the highest hectolitre weights.
• Of the environmental characteristics studied, high temperatures and growing season rainfall had the biggest effect on screenings and hectolitre weight, respectively.
• Varieties with a genetic predisposition to either low hectolitre weights or high screenings loss were more affected by stressful growing conditions than their superior physical grain quality counter parts.
Why do the trial? Grain size and shape related defects can be devastating to farm profitability. Slipping from AH1 to GP over the 3 years of this study
cost growers an average $71/t. With cliff face pricing, this may have occurred simply because a load of wheat had 6% rather than 5% screenings, or a hectolitre of 73 kg/hL rather than 74 kg/hL. In real terms, this represents a 24% reduction in income for a single unit change in grain size or shape. Therefore, as a key determinant of on-farm profitability, receival characteristics such as screening loss (ScrnL) and low hectolitre weight (LoHLW) are an important target for manipulation through both breeding and agronomic improvement.
Consequently, growers have adopted agronomic strategies that reduce the likelihood of downgrading at receival through high ScrnL or LoHLW. Adjusting seeding rate, timing and quantity of fertiliser application and sowing rate along with variety selection are all strategies that can be used to reduce ScrnL and maximize HLW. Although selection of varieties with large grain and good hectolitre weight is a successful risk minimisation strategy, for other unrelated reasons (i.e. disease resistance, quality classification, yield performance) this is not always feasible. Additionally, it is likely that the minimum receival standards for HLW will increase from 74 kg/hL to 76 kg/hL in the near future, increasing the frequency of downgrading at point of delivery. Consequently, whilst the development of varieties with improved HLW and ScrnL is paramount, there is also a need to better understand the environmental drivers of ScrnL and LoHLW and the regional risks of growing varieties with a propensity for lower HLW or higher ScrnL.
How was it done? A desktop study was performed using physical grain quality data (screenings over a 2 mm sieve
and HLW) from the 2008 to 2010 National Variety Trials (NVT) in Western Australia, South Australia and Victoria. Environmental characterisation data was derived from Bureau of Meteorology records for each trial. Trials determined, from the performance of a selection of probe genotypes, to be affected by severe rust infection were removed from the dataset prior to the analysis.
In total 258 location-year combinations were used to investigate the environmental impacts on screenings and 253 for HLW. Each environment was classified with respect to 13 variables relating to rainfall, temperature and radiation during 4 growth stages: vegetative, flowering, grain fill and ripening. The average screenings and HLW, plus averages for 5 different subgroups of probe genotypes, with specific tendency for high or low screenings and HLW, were also calculated for each trial (Table 1).
What happened?Regional risks of growing varieties with poor physical grain qualityAs expected, physical grain quality (PGQ) was affected by both regional and seasonal variation in growing conditions. For HLW, the NVT region had the single largest effect (23% of between trial variation), and the year effect was the smallest (3.1% of between trial variation). The relative importance of the sources of variation was very similar for the 3 HLW groups (HLW, LoHLW and HiHLW), suggesting that the drivers of HLW are likely to be similar regardless of the variety being grown. A similar observation was made for the ScrnL groups, although region did not explain as much of the variation between sites for the Janz related lines as for the other ScrnL groups.
The environmental drivers of high screenings and low hectolitre weightJames Edwards and Haydn KuchelAustralian Grain Technologies, Roseworthy Campus, SA
Cer
eals
Research
Searching foranswers

Eyre Peninsula Farming Systems 2012 Summary44
Over the 3 years of this study, WA Agzone1 achieved the lowest average HLW and second highest ScrnL. Interestingly, the upper Eyre Peninsula in SA achieved the highest average HLW, but suffered from a relatively high ScrnL (Table 2). Overall, the environmental correlation between HLW and ScrnL was 12%, indicating that although they respond to some similar environmental variables, they need to be considered as independent PGQ attributes.
Of particular interest in this study, is the response of genotypes with known PGQ problems. We asked the question: do these lines respond to environmental stresses differently than lines known to be superior for PGQ? This study showed that for both HLW and ScrnL, lines with poor PGQ are likely to be relatively worse than their superior PGQ counterparts at sites where average PGQ is poor. In other words, where ScrnL is already high, varieties carrying the Cre1 gene or derived from Janz
suffered their worst relative ScrnL. This genetics by environment (GxE) pattern is often described as a scale effect and highlights the importance of variety selection. The relationship for HLW was not as strong as that observed for ScrnL. Although LoHLW lines performed relatively worse at sites where the average HLW was low, other factors appear to be acting on these lines as compared to their higher HLW counterparts.
Table 1 A description of the physical grain quality attributes assessed for each of the NVT sites
Quality Attribute Description
HLW The average hectolitre weight of varieties in the trial
LoHLW The average hectolitre weight of varieties with a known tendency for low hectolitre weight (Axe, Correll, Espada, Gladius, Westonia)
HiHLW The average hectolitre weight of varieties with a known tendency for high hectolitre weight (AGT Katana, Frame, Wyalkatchem, Yitpi)
ScrnL The average screenings loss of varieties in the trial
LoScrnL The average screenings loss of varieties with a known tendency for low screenings loss (Frame, Yitpi, Wyalkatchem)
Cre1ScrnL The average screening loss of varieties that carry Cre1 (a CCN resistance gene linked to small grain) (Annuello, Bullet, Derrimut, Guardian, Peak)
JnzScrnL The average screening loss of varieties with small grain derived from Janz (Janz, CF JNZ, Carinya)
Table 2 The average HLW and ScrnL performance at NVT regions in WA, SA and Vic from 2008 to 2010
State Region HLW ScrnL
WA Agzone1 73.2 8.1
WA Agzone2 76.2 4.4
WA Agzone3 75.8 2.7
WA Agzone4 74.2 8.4
WA Agzone5 76.2 2.5
WA Agzone6 74.2 2.0
SA Lower EP 79.3 2.4
SA Mallee 78.5 1.5
SA Mid North 76.7 2.9
SA South East 76.4 4.4
SA Upper EP 79.3 4.1
SA Yorke Peninsula 78.6 2.1
Vic Murray Mallee 77.7 4.5
Vic North Central 75.6 1.5
Vic North East 75.4 1.5
Vic Wimmera 73.5 5.6
Eyre Peninsula Farming Systems 2012 Summary 45
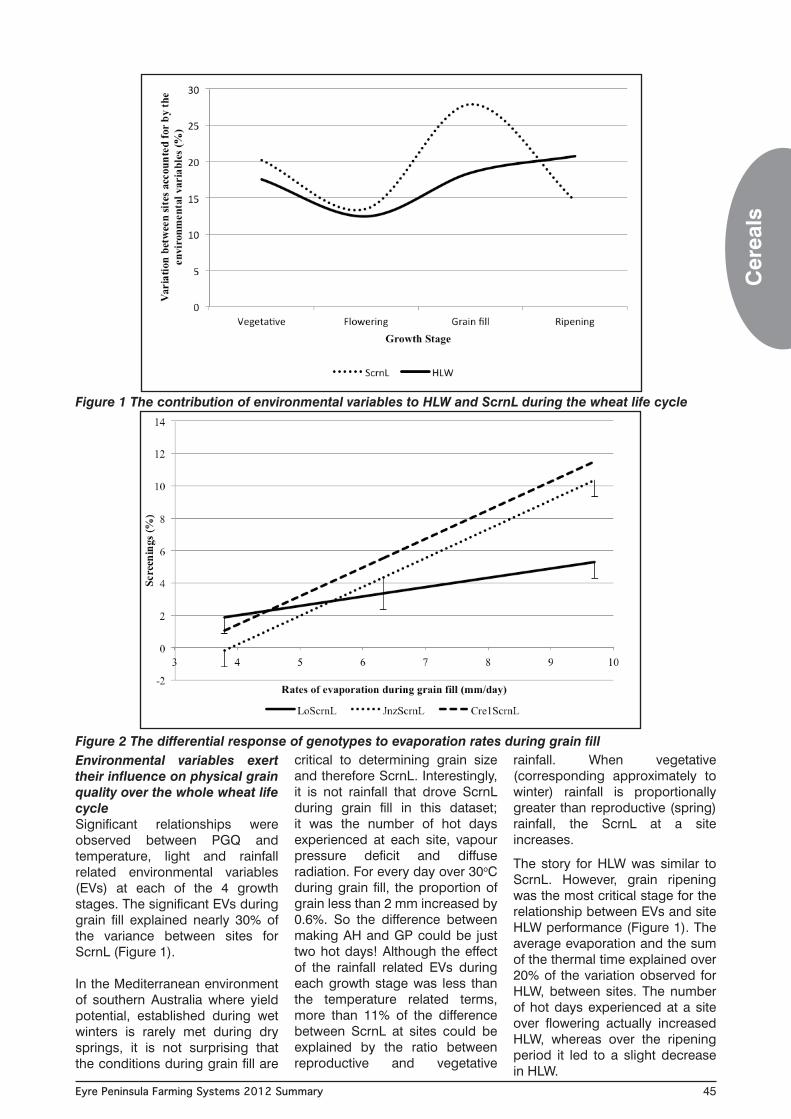
Figure 1 The contribution of environmental variables to HLW and ScrnL during the wheat life cycle
Figure 2 The differential response of genotypes to evaporation rates during grain fillEnvironmental variables exert their influence on physical grain quality over the whole wheat life cycleSignificant relationships were observed between PGQ and temperature, light and rainfall related environmental variables (EVs) at each of the 4 growth stages. The significant EVs during grain fill explained nearly 30% of the variance between sites for ScrnL (Figure 1).
In the Mediterranean environment of southern Australia where yield potential, established during wet winters is rarely met during dry springs, it is not surprising that the conditions during grain fill are
critical to determining grain size and therefore ScrnL. Interestingly, it is not rainfall that drove ScrnL during grain fill in this dataset; it was the number of hot days experienced at each site, vapour pressure deficit and diffuse radiation. For every day over 30oC during grain fill, the proportion of grain less than 2 mm increased by 0.6%. So the difference between making AH and GP could be just two hot days! Although the effect of the rainfall related EVs during each growth stage was less than the temperature related terms, more than 11% of the difference between ScrnL at sites could be explained by the ratio between reproductive and vegetative
rainfall. When vegetative (corresponding approximately to winter) rainfall is proportionally greater than reproductive (spring) rainfall, the ScrnL at a site increases.
The story for HLW was similar to ScrnL. However, grain ripening was the most critical stage for the relationship between EVs and site HLW performance (Figure 1). The average evaporation and the sum of the thermal time explained over 20% of the variation observed for HLW, between sites. The number of hot days experienced at a site over flowering actually increased HLW, whereas over the ripening period it led to a slight decrease in HLW.
Cer
eals

Eyre Peninsula Farming Systems 2012 Summary46
Varieties with higher inherent screenings loss have a larger response to environmental variablesA comparison of the responses of the subgroups for ScrnL showed that genotypes derived from Janz, or genotypes with the Cre1 CCN resistance gene had a much greater response to the level of evaporation at a site during grain fill (Figure 2).
During flowering, genotypes with the Cre1 CCN resistance gene also suffered a greater increase in ScrnL than the LoScrnL and JanzScrnL groups as the average maximum temperature increased. During the vegetative and ripening growth stages, there was no difference in the response of the genotypic subgroups. For HLW there were no significant differences in the response of the LoHLW and HiHLW groups to the EVs.
What does this mean? • Small changes in the inherent
PGQ of a wheat variety can have a big impact on on-farm profitability.
• Not surprisingly, growing conditions during grain fill have the largest impact on PGQ, although the impacts of these conditions on PGQ are not the same for all wheat varieties.
• The largest driver of ScrnL during grain fill was the number of hot days (>30oC).
• Some regions are more prone to down grading through screenings loss or low HLW. In particular Agzones 1, 2 and 4 in WA and intriguingly the South East of SA and Victorian Wimmera suffer from either elevated screenings loss or low HLW.
• At sites where HLW is low, the difference between high and low HLW wheat varieties is greatest; increasing the relative risk of growing a variety with inherently low HLW.
• Varieties derived from Janz, and those carrying the Cre1 CCN resistance gene, had a greater negative response to high evaporation rates during grain fill than varieties with inherently low screenings loss.
AcknowledgementsThe authors acknowledge Neale Sutton (Australian Crop Accreditation System Limited) for supplying the National Variety Trials (NVT) physical grain quality data and Bangyou Zheng and Scott Chapman (CSIRO Plant Industry, St. Lucia) for supplying the environmental characterisation data (derived from Bureau of Meteorology records) used in this study. This study was funded by GRDC.
A more comprehensive version of this article is available at: www.ausgraintech.com