
CEPAL Review 105
16
CEPAL REVIEW 105 • DECEMBER 2011 87 KEYWORDS Exports Industry Manufactures Industrial productivity Factories Evaluation Statistical data Trade statistics Chile Dissecting the Chilean export boom Raphael Bergoeing, Alejandro Micco and Andrea Repetto C hilean exports have boomed since 1975, growing at an average annual rate of 6% per year in real terms. In this paper, we use Chilean manufacturing data at the plant level for the years from 1990 to 2007 to investigate the relationship between exports, plant dynamics and productivity. Our findings are consistent with the predictions of the new theories of heterogeneous firms and trade. First, 64.4% of the total increase in exports is accounted for by new exporters net of failed exporters. This effect is a combination of a larger proportion of plants exporting, a rising proportion of output sold abroad and a higher level of total sales. Second, productivity and exports co-moved over the course of the Chilean boom, exports being positively correlated with both within- plant productivity growth and the productivity-enhancing reallocation of output between plants. Raphael Bergoeing Academic, Department of Economics, University of Chile ✒ [email protected] Alejandro Micco Academic, Department of Economics, University of Chile ✒ [email protected] Andrea Repetto Academic, School of Government, Adolfo Ibáñez University ✒ [email protected]
Transcript of CEPAL Review 105

C E P A L R E V I E W 1 0 5 • D E C E M B E R 2 0 1 1
87
K E Y W O R D S
Exports
Industry
Manufactures
Industrial productivity
Factories
Evaluation
Statistical data
Trade statistics
Chile
Dissecting the Chileanexport boom
Raphael Bergoeing, Alejandro Micco and Andrea Repetto
Chilean exports have boomed since 1975, growing at an average
annual rate of 6% per year in real terms. In this paper, we use Chilean
manufacturing data at the plant level for the years from 1990 to 2007
to investigate the relationship between exports, plant dynamics and
productivity. Our findings are consistent with the predictions of the new
theories of heterogeneous firms and trade. First, 64.4% of the total
increase in exports is accounted for by new exporters net of failed
exporters. This effect is a combination of a larger proportion of plants
exporting, a rising proportion of output sold abroad and a higher level of
total sales. Second, productivity and exports co-moved over the course
of the Chilean boom, exports being positively correlated with both within-
plant productivity growth and the productivity-enhancing reallocation of
output between plants.
Raphael Bergoeing
Academic, Department of
Economics, University of Chile
Alejandro Micco
Academic, Department of
Economics, University of Chile
Andrea Repetto
Academic, School of Government,
Adolfo Ibáñez University

88
DIssECtIng tHE CHILEAn ExPoRt BooM • RAPHAEL BERgoEIng, ALEjAnDRo MICCo AnD AnDREA REPEtto
C E P A L R E V I E W 1 0 5 • D E C E M B E R 2 0 1 1
Recent empirical research based on plant-level data has consistently shown that there is considerable heterogeneity in productivity across units even within narrowly defined sectors in any given period of time. Thus, as several studies document, the reallocation of inputs and factors of production is a crucial element of aggregate productivity gains and growth.1
New models based on firm heterogeneity have analysed these intra-industry effects in the context of international trade. Melitz (2003) and Bernard and others (2003) developed alternative models of international trade which predict that only the most productive firms export and that industry’s exposure to trade induces aggregate productivity gains through reallocation —an effect that is ignored by the standard representative firm framework. At the same time, a growing body of empirical literature has studied the extent and causes of productivity differentials between exporters and non-exporters.2 Little evidence exists on the importance of trade-driven reallocation effects.
In the light of these new theoretical developments, this paper analyses the sources of the Chilean export boom and its relationship to productivity heterogeneity at the microeconomic level. Using a sample of Chilean manufacturing plants for the years from 1990 to 2007, we decompose observed aggregate export growth into two complementary sets of margins: net entry into foreign markets versus resource reallocation effects, and export intensity changes versus sales growth. We also consider
We are grateful to the National Institute of Statistics (ine) for providing the manufacturing plant-level data used in this paper. We are also grateful to the cepal Review referee and to participants at a number of seminars for helpful comments and suggestions. Excellent research assistance was provided by Pablo Muñoz. We acknowledge financial support from the Inter-American Development Bank (idb) and from the National Fund for Scientific and Technological Development (fondecyt) (grant no. 1070805).1 For Chile, see Bergoeing, Hernando and Repetto (2010).2 See Wagner (2007 and 2008) and Eaton, Kortum and Kramarz (2008) for recent surveys. The evidence indicates that the most productive firms self-select as export market entrants. Although there is mixed evidence on export-driven learning effects, Álvarez and López (2005) confirm this hypothesis using plant-level data for Chile.
the role of efficiency by correlating export growth with both within-plant productivity growth and between-plant productivity-enhancing reallocation effects.
The Chilean experience is interesting for several reasons. First, the economy underwent a deep and far-reaching trade liberalization reform starting in the mid-1970s. During the 30 years that followed, Chilean exports grew at an average real annual rate of 6%. This export boom dramatically changed the level of trade as well as its composition and the productive structure of the economy. Although there was a partial reversal of the unilateral tariff reduction process after the early 1980s crisis, trade liberalization continued after 1985. Since 1992, furthermore, trade policy has moved towards bilateral agreements. In fact, Chile has signed trade agreements with more than 50 countries over the last two decades, including the United States, Canada, Mexico, the European Union, China and the Republic of Korea. Thus, the data considered in this study cover a period that came after more than a decade of major reforms, but that was also characterized by active negotiation of preferential trade agreements. Consequently, this time period provides a rich environment for research in pursuit of a better understanding of the link between trade and industrial and plant dynamics.
Our findings are consistent with the predictions of the new theories of heterogeneous firms and trade. First, 64.4% of the increase in exports came from larger and highly intensive new exporters, rather than being the result of rising export intensity at existing exporters. Second, productivity and exports have co-moved over the Chilean boom. Finally, the export expansion has been associated with a productivity-enhancing reallocation of resources towards more efficient plants.
The remainder of the paper is organized as follows. Section II provides an overview of trade reforms and the recent trade boom in Chile. Section III describes the data we use and presents a number of plant-level facts that characterize manufacturing exports. Section IV dissects exports to explore the main sources of growth. We also study the link between export growth and productivity. The final section concludes.
Iintroduction

89
DIssECtIng tHE CHILEAn ExPoRt BooM • RAPHAEL BERgoEIng, ALEjAnDRo MICCo AnD AnDREA REPEtto
C E P A L R E V I E W 1 0 5 • D E C E M B E R 2 0 1 1
In June 2002, Chile signed a free trade agreement with the European Union; a year later, a similar agreement was signed with the United States. These negotiations marked the culmination of three decades of free-trade policies that have consolidated Chile’s position as one of the most open economies in the world.
Today, few question the significance of the trade liberalization programme initiated in the mid-1970s in shaping the economic transformation of Chile.3 The situation was very different four decades ago, however. By the late 1960s, trade restrictions had practically isolated the Chilean economy from the rest of the world, exacerbating its dependence on copper exports and confining imports to intermediate and capital goods. The structure of relative prices was drastically distorted in favour of industrial goods at the expense of agricultural, mining and other tradable activities. Differential import duties exempted capital goods, and high taxes were levied on final goods, creating a generally inefficient capital-intensive industrial sector. Import tariffs ranged from 0% for capital goods to 750% for luxury goods, a 90-day non-interest-bearing deposit of 10,000% of the cif value of imported goods was required, and all import operations required administrative approval. In addition, a system of multiple exchange rates was in operation, with a 52 to 1 ratio having been reached by the time the economy collapsed in 1973.
In the years that followed the 1973 crisis, trade liberalization policies were to be the cornerstone of the transformation of the inward-oriented Chilean economy into a dynamic export-oriented one. The initial set of trade reforms were intended to simplify the structure of the economy. Consistently, exchange markets were unified, most non-tariff barriers (quotas and prohibitions) were eliminated, and tariffs were drastically reduced to a uniform 10% by 1979.
The economy recovered at great speed during the years from 1976 to 1980, with gross domestic product
3 The Chilean economic transformation has been extensively documented by Edwards and Edwards (1992) and Corbo and Fischer (1994), among others.
(gdp) growing at an annual rate of 7%. Moreover, the availability of foreign goods expanded markedly and the government deficit turned into a surplus. In addition, a large number of reforms were initiated to complement and reinforce the change in relative prices induced by trade deregulation. Among them, a large number of public enterprises were privatized, labour markets were deregulated, a defined contribution social security system was set up to replace the pay-as-you-go system, and health and public education responsibilities were transferred from the ministries to the municipality level.
Although reforms advanced on several fronts, two major problems remained unsolved: unemployment did not decline significantly, and inflation remained stubbornly high. Among the instruments used to control inflation, the fixing of the nominal exchange rate in June 1979 proved devastating in its effects. The highly indexed nature of the economy, in combination with the fixed exchange rate, induced an increasing real overvaluation of the currency, fostering imports and discouraging exports, and leading to large current account deficits. In 1981, the external deficit reached 14.5% of gdp. Large amounts of foreign loans entered the country to finance the trade imbalance and, as a consequence, the foreign debt increased from US$ 6 billion in 1977 to US$ 14.8 billion in 1981. Two additional elements also helped induce the observed rise in indebtedness: the resistance of the real interest rate to convergence on world levels and the deregulation of the financial market in 1981. The former induced a continuous flow of short-term lending; the lack of adequate supervision of bank portfolio quality in the latter led to a general miscalculation of risk levels and imprudent domestic lending (Barandiarán and Hernández, 1999).
With such a large trade imbalance, confidence in the Chilean economy faltered, and foreign lending ceased. In June 1982 the authorities were forced to devalue the peso by 19%, but “it was too little and too late” (Edwards and Edwards, 1992). The economy fell into a deep recession as gdp dropped by 13.4% in 1982 and a further 3.5% in 1983; unemployment, already high, skyrocketed to 34% of the labour force (including emergency employment programmes). The government
IITrade reforms and the Chilean export boom:
an overview

90
DIssECtIng tHE CHILEAn ExPoRt BooM • RAPHAEL BERgoEIng, ALEjAnDRo MICCo AnD AnDREA REPEtto
C E P A L R E V I E W 1 0 5 • D E C E M B E R 2 0 1 1
deficit increased to almost 9% of gdp, and the central bank had to rescue the financial sector from bankruptcy. Foreign debt reached 130% of gdp by 1983.
This recession led the authorities to partially reverse trade opening policies. In particular, the mean tariff was raised to 26% by 1985. After that, however, the reduction in tariffs resumed. In 1990, with the
return to democracy, the commitment to openness was not modified. In fact, average tariffs continued to be reduced in a gradual manner from nearly 15% in 1988 to about 3% in 2010. Figure 1 reports the evolution of mean tariffs since 1975.
One important change defined trade policy during the 1990s: bilateral agreements were incorporated into
FIGURE 1
Chile: Average nominal tariffs, 1975-2010(Percentages)
Source: Authors’ calculations.
0
10
20
30
40
50
1975
1976
1977
1978
1979
1980
1981
1982
1983
1984
1985
1986
1987
1988
1989
1990
1991
1992
1993
1994
1995
1996
1997
1998
1999
2000
2001
2002
2003
2004
2005
2006
2007
2008
2009
2010
Perc
enta
ge
FIGURE 2
Chile: gdp and total exports, 1975-2010(Index 1975 = 100)
Source: Authors’ calculations.
gdp: Gross domestic product.
0
100
200
300
400
500
600
700
800
1975
1976
1977
1978
1979
1980
1981
1982
1983
1984
1985
1986
1987
1988
1989
1990
1991
1992
1993
1994
1995
1996
1997
1998
1999
2000
2001
2002
2003
2004
2005
2006
2007
2008
2009
2010
1975
= 1
00
GDP Exports

91
DIssECtIng tHE CHILEAn ExPoRt BooM • RAPHAEL BERgoEIng, ALEjAnDRo MICCo AnD AnDREA REPEtto
C E P A L R E V I E W 1 0 5 • D E C E M B E R 2 0 1 1
Since Bernard and Jensen (1995), a growing literature has described various regularities characterizing exporters’ behaviour. In particular, this literature finds that only a small fraction of firms sell their output in foreign markets. Moreover, exporting firms tend to be more productive and larger, and they usually sell only a small proportion of their output abroad. For instance, Bernard and others (2003) use data for United States plants to find three sets of facts. First, only 21% of plants in the United States Census of Manufacturers report some exports. Of those, most sell less than 10% of their total output abroad, while fewer than 5% of exporting plants export more than 50% of their production. Second, exporters are larger, shipping on average 5.6 times more than non-exporters. Finally, the productivity of exporters is substantially higher than that of non-exporting firms. Eaton and others (2008) show a similar pattern using French manufacturing firm-level data.5
Recently developed theoretical models of international trade with heterogeneous firms and fixed and variable costs are able to account for these facts. In Melitz (2003), the economy is characterized by heterogeneous firms producing in monopolistic markets and by intra-industry selection through productivity. Firms face initial uncertainty concerning their future productivity when making an irreversible investment decision that allows them to enter the domestic market. In addition
5 For additional results, see Bernard and Jensen (1999), Bernard and others (2007), Clerides, Lach and Tybout (1988) and Melitz (2008).
to this sunk entry cost, firms face both fixed and per-unit export costs. Arkolakis (2008) also develops a model with heterogeneous firms. In this model, firms face market penetration costs. Similarly, Bernard and others (2003) develop a model of Ricardian differences in technological efficiency and imperfect competition with variable mark-ups. This class of models predicts that only a subset of relatively productive firms export, whereas the remaining, less productive firms serve the domestic market only.
In this section we analyse these exporter facts. In the next section we look into the dynamics of export growth. We use data from the National Annual Manufacturing Industry Survey (enia), an annual survey of manufacturing conducted by the Chilean statistics agency, the National Institute of Statistics (ine). The enia covers all manufacturing plants employing at least 10 individuals. Thus, it includes all newly created and existing plants with 10 or more employees, and it excludes plants that have ceased activities or reduced their payroll below the survey’s threshold. We observe plants and not firms in our data set and thus are unable to distinguish single-plant firms from multi-plant firms.6
The data available extend from 1979 to 2007 and contain detailed information on plant characteristics such as manufacturing subsector at the four-digit International Standard Industrial Classification of All Economic Activities (isic) level, sales, employment, investment,
6 According to information provided by Central Bank of Chile statisticians, about 3.5% of plants in our data set belong to a multi-plant firm.
IIIExporter facts
the overall liberalization strategy. A decade later Chile had signed trade agreements with many of the world’s economies. Today, more than 90% of Chilean exports are subject to a trade agreement.
Summing up, it was only from the late 1980s that the Chilean economy was able fully to reap the benefits of the changes in economic incentives and the new productive structure that came with trade reforms. Overall, exports evolved consistently, booming during most of the period. Figure 2 shows that total exports
increased sevenfold from 1975 to 2010 —much faster than gdp, which increased fivefold. Manufacturing exports followed a similar pattern, almost doubling as a share of manufacturing sales, as the proportion increased from 12.3% to 21.1% over the 1990-2007 period.4
4 In our analysis we have considered all manufacturing sectors except copper. See below for a discussion.

92
DIssECtIng tHE CHILEAn ExPoRt BooM • RAPHAEL BERgoEIng, ALEjAnDRo MICCo AnD AnDREA REPEtto
C E P A L R E V I E W 1 0 5 • D E C E M B E R 2 0 1 1
intermediate inputs and location. Data on plant-level exports have been collected since 1990, and accordingly our analysis covers the 1990-2007 period.7
All nominal variables were deflated at the three-digit isic level, using deflators constructed from the wholesale price indices compiled by ine. Capital series were constructed using information on investment and depreciation, following the strategy of Bergoeing and others (2005). Our analysis considers all 29 three-digit isic sectors except copper production (sector 372), since the national accounts include copper in the mining sector and not in manufacturing. Moreover, copper has been a major export commodity since long before trade was liberalized. Over the 18 years considered, sector 372 represents an average of 22% of total value added in the enia.
The data show that Chilean plants display many similarities to their United States counterparts as described by the literature, as well as some differences. Table 1 summarizes our basic findings. First, the proportions of
7 The ine changed the plant identification method in the 1996 survey. Fortunately, we had access to three databases that allowed us to match up almost all the surveyed plants over time. The 1979-1996 data set and the 1995-2007 set do not have a common identifier, but a third survey covering the years from 1995 to 2007 had both identifiers for the year 2000. To match up plants that were not in the 2000 survey, we looked for plants that in any given year reported identical values for relevant variables such as wages, number of days in operation, isic code, electricity consumed, value added tax (vat) paid, number of employees, gross output and machinery and equipment investment.
manufacturing plants that export are almost the same. According to the enia, 78.9% of plants sell all their production in domestic markets, whereas 21.1% sell some output abroad. Export intensity, i.e., the share of total output exported, is much higher in Chile, however. For instance, over 25% of Chilean plants that export sell more than 50% of their output abroad, whereas only 5% of such plants in the United States do (Bernard and others, 2003). This fact suggests that local market size might play a role in shaping the distribution of export intensity.
Second, just as in the United States, the labour productivity of Chilean exporters is much higher than that of non-exporters. Figure 3 shows that the distribution of exporters’ plant-level productivity (sector/year averages) is located to the right of their non-exporting counterparts. According to the results in table 1, the productivity of plants that export is 38% higher, on average, than the productivity of the typical plant producing in the same three-digit sector, whereas the productivity of those that do not export is 10% lower. This 48 percentage point gap is much larger than the one described for the United States by Bernard and others (2003), which amounts to 33%. This difference is consistent with the existence of cross-country variability in export market entry costs.
Table 1 also shows that exporters are larger than non-exporting plants when characterized by the number of employees (89% on average). Moreover, exporters average higher capital/labour ratios and lower shares of wages in total value added. Chile is a low-wage country,
TABLE 1
Chile: Plant-level export data in Chile, 1990-2007 (Percentages)
Sectors Plants
Labourproductivity
Capitalper employee
Labourshare
Size(employees)
Gap relative to sector simple average (three-digit isic)
No exports 78.9 –10 –15 3 –19Positive exports 21.1 38 58 -12 70
Export intensity of exporters (percentage)
Percentageexporting
Gap relative to sector simple average
0 to 10 48.8 42 54 -12 7610 to 20 11.0 36 58 -9 7020 to 30 5.8 37 65 -10 7630 to 40 5.0 25 42 -5 5540 to 50 4.2 36 65 -14 7250 to 60 4.2 27 51 -8 6960 to 70 4.5 44 68 -17 5770 to 80 5.0 30 53 -14 6080 to 90 5.4 38 55 -12 6190 to 100 6.1 37 57 -19 54
Source: Authors’ calculations.

93
DIssECtIng tHE CHILEAn ExPoRt BooM • RAPHAEL BERgoEIng, ALEjAnDRo MICCo AnD AnDREA REPEtto
C E P A L R E V I E W 1 0 5 • D E C E M B E R 2 0 1 1
and one would thus expect exporters to be more labour-intensive. Several explanations may account for this seeming anomaly. First, manufactured goods are sold mostly to other Latin American countries. Therefore, it is not necessarily the case that Chile can be defined as a labour-abundant country in this context. Second, non-exporters are more likely to be liquidity-constrained and thus might face higher capital costs. Third, as explained by Trefler (1993), labour should be measured in effective units. If not, human capital, a scarce resource
in Chile relative to developed economies, is included in total labour.
Finally, the table shows that these characteristics are not necessarily correlated with plant export intensity, i.e., there is no clear tendency for plants that export a larger share of their sales to be more productive, larger or more capital-intensive.
In what follows, we further analyse the role of plant-level heterogeneity on exports and productivity, this time looking at the mechanisms underlying their dynamics.
FIGURE 3
Chile: Distribution of plant-level productivity(Percentages)
Source: Authors’ calculations.
0-0.
25
0.25
-0.3
0.3-
0.35
0.35
-0.4
2
0.42
-0.5
0.5-
0.59
0.59
-0.7
1
0.71
-0.8
4
0.84
-1
1-1.
2
1.2-
1.4
1.4-
1.7
1.7-
2
2-2.
4
2.4-
2.8
2.8-
3.4
3.4-
4
4-00
Average productivity range, by sector and year
Perc
enta
ge
0
2
4
6
8
10
12
14
16
Non-exporter Exporter
IVThe microdynamics of Chilean exports
Recent international trade theories predict that increasing exposure to foreign markets due, for instance, to a fall in transport costs leads to a reallocation of inputs and production towards the most productive firms. As the cost of entering export markets falls, firms that used to sell their output in domestic markets only now find it profitable to pay the costs of selling abroad. If variable costs fall, then old exporters increase their export intensity, whereas if fixed costs fall, these firms do not change their sales patterns. In any case, the least productive firms
are forced to exit as the increased demand for domestic inputs bids up real production costs. The reallocation driven by the increased exposure to trade delivers gains in terms of aggregate productivity growth.
A number of recent papers have looked at the effects of trade on productivity dynamics. Bernard and others (2007) show that productivity growth is faster in industries with falling trade costs. Low-productivity plants in these industries are more likely to exit, whereas high-productivity non-exporters are more likely to

94
DIssECtIng tHE CHILEAn ExPoRt BooM • RAPHAEL BERgoEIng, ALEjAnDRo MICCo AnD AnDREA REPEtto
C E P A L R E V I E W 1 0 5 • D E C E M B E R 2 0 1 1
start selling abroad. In the aggregate, their results are consistent with productivity-enhancing reallocation effects associated with trade growth.8
Bernard and Jensen (2004) study the recent export boom in the United States by examining the role of entry, firm expansion and export intensity. The paper finds that most of the increase in manufacturing exports came from rising export intensity at existing exporters rather than from new entrants into exporting. They also find that changes in exchange rates and rises in foreign income drove most of the export boom, while within-plant productivity increases played a smaller role.
Other papers suggest a major role for entry into exporting, however. For example, Kehoe and Ruhl (2009) examine the bilateral trade patterns by commodity of countries involved in significant trade liberalization processes, finding a striking relationship between a good’s pre-liberalization share of trade and its subsequent growth. The goods that were traded the least before liberalization account for a disproportionate share of trade following the reduction of trade barriers. They interpret this evidence as supporting the role of the new goods margin as a source of trade expansion.
Plant-level data for Chile have also been used to study the connection between trade liberalization and firm dynamics by Pavcnik (2002), Irarrázabal and Opromolla (2007) and Álvarez and Vergara (2010). Using a difference-in-differences approach and data for the 1979-1986 period, Pavcnik (2002) shows that plants in export-oriented and import-competing sectors became more productive by the end of the sample period. An important caveat of this work is that, as figure 1 shows, tariffs were much higher in 1986 than in 1979: the actual direction of trade openness is opposite to that assumed by the study.
Irarrázabal and Opromolla (2007) use the Bernard and others (2003) model to simulate the effects of the Chilean liberalization. The model predicts that a 50% reduction in trade barriers leads to a 24% change in aggregate productivity. About 72% of the gains are due to within-plant gains and 26% to the exit of less efficient plants. Reallocation and entry effects are quantitatively unimportant. Their simulation results do not single out the effects due to entry into export markets, however, or reallocation towards the most productive exporters; they focus on aggregate market effects without distinguishing
8 It is worth noting that Bernard and others (2007) use United States import cost measures rather than export cost measures in their analysis. The correlation between these trade cost measures is not necessarily positive.
exporter from non-exporter behaviour. Thus, one of the predicted channels of productivity gains, entry into export markets, cannot be accounted for from their results.9 Álvarez and Vergara (2010) do study how trade liberalization, among other market reforms, could affect exit decisions. Using data for Chilean manufacturing plants during the period from 1979 to 2000, they find that exit is more likely in export-oriented industries.
Table 2 suggests that heterogeneity has in fact played a major role in Chile’s export boom. The table shows that 78.5% of the total change in the real level of exports is accounted for by new exporters. That is, plants that were either not in the market or not exporting in 1990 contributed greatly to the total increase in exports. By way of comparison, Bernard and Jensen (2004) report that entry accounted for a 67% share of the United States export boom.10 Continuing plants contributed the remaining 35.6% of this increase. Finally, since exiting plants reduced the rise in exports by 14.1%, net entry contributed 64.4% of total growth, a larger share than reported for the United States (39%).
In this section, we use Chilean plant data to further analyse the role of this micro level heterogeneity in explaining the recent export boom. We perform three main exercises, each focusing on different aspects of plant behaviour and its consequences for aggregate growth. In the first, we ask whether the aggregate export boom is mostly explained by changes in export intensity (the fraction of total output that is sold abroad) or by a growing fraction of plants exporting. Second, we examine whether there are differences in this export intensity across new, continuing and failing exporters that can account for the aggregate dynamics. In the third and final exercise we look into aggregate productivity behaviour and how it correlates with the evolution of exports.
9 Moreover, the model is calibrated for exporter facts as of 1992 (productivity and sales advantage of exporters relative to non-exporters). Thus, it is implicitly assumed that the 1992 productivity structure is representative of the pre-liberalization structure. The model is then simulated to study the effects of reducing trade barriers, mimicking falling trade costs between 1975 and early 1980, so their results might underestimate the true gains from the reallocation of resources among firms that was driven by the liberalization of Chilean trade. The authors had to calibrate the model on the basis of 1990s data, as the enia covers export behaviour only since then.10 Bernard and Jensen (2004) report that the United States export boom is mostly explained by existing exporters rather than by entry. However, the paper defines new exporters as plants that were exporting in 1992 and were not producing in 1987, even for the domestic market. We believe that classifying new exporters that were previously producing as continuers understates the scale of entry into export markets. Once we relax this restriction, entry accounts for 67% of the United States export boom, instead of 29% as reported in the paper.

95
DIssECtIng tHE CHILEAn ExPoRt BooM • RAPHAEL BERgoEIng, ALEjAnDRo MICCo AnD AnDREA REPEtto
C E P A L R E V I E W 1 0 5 • D E C E M B E R 2 0 1 1
1. Export entry and intensity effects
Figure 4 depicts the evolution of aggregate manufacturing exports in the enia over our sample period. The graph shows that exports rose steadily over most of the sample period.
The figure also shows the evolution of the fraction of plants that export and of aggregate export intensity. The fraction of exporting plants grew steadily until 1995. It then dropped slightly until the early 2000s, when it started to increase again. By 2002 it had returned to the 1995 level, with about 21.8% of plants selling output abroad. By 2007, the share had increased to 24.8%.
Total exports and the proportion of sales made abroad evolved similarly over the sample period. Table 3 presents the evolution at the three-digit isic level. The
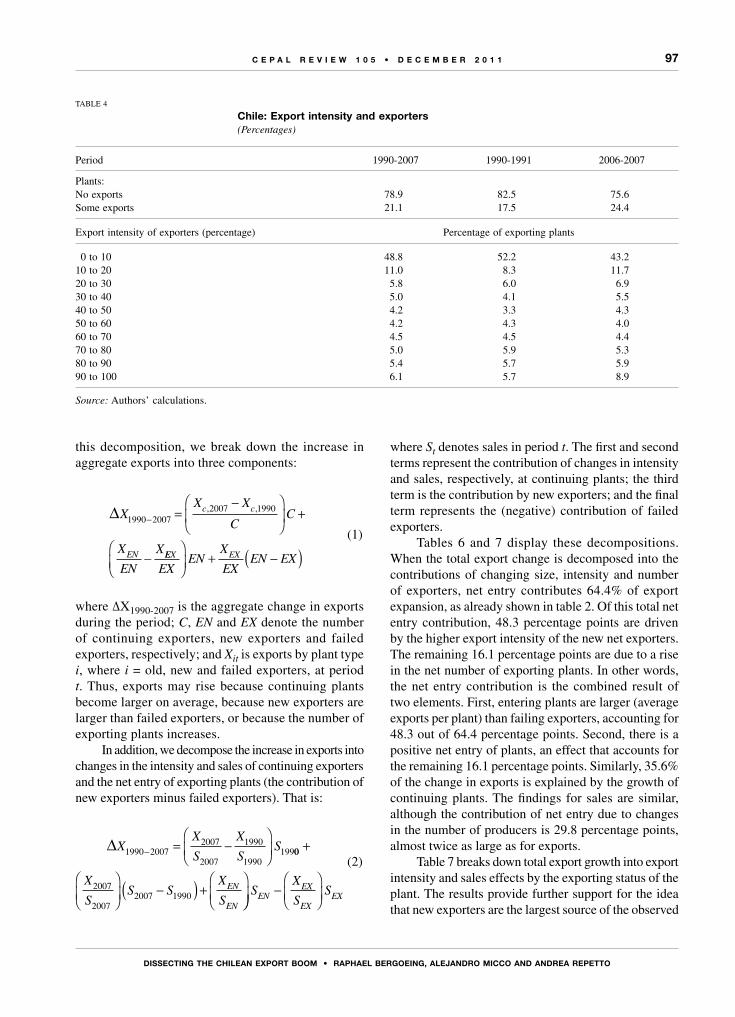
table shows that exports grew much faster than sales in most sectors, leading to a rise in export intensity. For the full sample, the ratio of manufacturing exports over sales grew from 0.12 to 0.21 in just 10 years. Similarly, table 4 presents the evolution of the export intensity distribution. The distribution had shifted clearly to the right by the end of the sample period. The fraction of total plants that exported also rose over the period, from 17.5% in 1990-1991 to 24.4% in 2006-2007.
Table 5 separates out total export growth into the percentage growth in the number of exporters and the growth of average exports per plant. Columns (2) to (4) present this decomposition for total real sales, while columns (5) to (7) show the real export figures, both in thousands of 2000 United States dollars. Total sales (both
TABLE 2
Chile: Export decomposition
1990(billions of 2000 dollars)
2007(billions of 2000 dollars)
Difference(billions of 2000 dollars)
Contribution (percentage)
All sectors All 2 720 12 113 9 392 100.0 Continuing 1 391 4 736 3 344 35.6 Entering 7 377 7 377 78.5 Exiting 1 329 –1 329 –14.1 Net entry 1 329 7 377 6 048 64.4
Source: Authors’ calculations.Notes: Exports and sales divided by nominal exchange rate and deflated by United States gdp deflator. Only plants with export and sales data are included. Total sales for exporters only.
FIGURE 4
Chile: Proportion of plants exporting and export intensity(Percentages and natural logarithms)
Source: Authors’ calculations.
Proportion exporting
0
5
10
15
20
25
30
1990
1991
1992
1993
1994
1995
1996
1997
1998
1999
2000
2001
2002
2003
2004
2005
2006
2007
Perc
enta
ge
14.0
14.5
15.0
15.5
16.0
16.5
In (
US$
200
0)
Share exported Exports

96
DIssECtIng tHE CHILEAn ExPoRt BooM • RAPHAEL BERgoEIng, ALEjAnDRo MICCo AnD AnDREA REPEtto
C E P A L R E V I E W 1 0 5 • D E C E M B E R 2 0 1 1
TABLE 3
Chile: Dynamics of total exports and export intensity
SITC code
Export growth(annual rate)a
Export intensity
Percentage of sales exported Difference
1990/1991-2006/2007 1990-1991 2006-2007 Percentage points Percentage
311 1.78 18.81 28.28 9.47 50.3312 3.45 3.16 4.85 1.68 53.2313 8.39 7.95 21.34 13.39 168.4314 –1.00 3.15 0.00 –3.15 –100.0321 0.49 4.85 13.15 8.30 171.1322 –0.49 5.73 2.35 –3.38 –59.0323 18.84 1.08 26.13 25.05 2 329.0324 –0.93 9.27 0.81 –8.46 –91.3331 3.61 30.14 46.07 15.93 52.9332 –0.37 6.33 5.19 –1.14 –18.0341 3.77 29.88 53.71 23.82 79.7342 0.18 3.41 3.06 –0.35 –10.3351 6.58 34.63 12.90 –21.73 –62.8352 1.10 6.49 8.02 1.53 23.6353 –1.00 3.26 0.00 –3.26 –100.0354 –0.89 2.62 0.49 –2.14 –81.4355 2.80 13.52 29.54 16.02 118.5356 13.35 1.47 7.40 5.94 405.2361 3.66 14.20 24.36 10.16 71.6362 9.11 2.14 7.15 5.01 234.3369 1.94 1.23 1.35 0.12 9.5371 5.81 31.39 45.48 14.09 44.9381 2.74 2.71 4.88 2.17 80.3382 12.34 1.33 9.44 8.12 611.6383 8.63 1.87 9.31 7.43 396.8384 3.33 5.82 15.43 9.62 165.3385 30.17 2.90 15.75 12.84 442.5390 13.10 2.65 13.17 10.52 396.4All 3.17 12.26 21.08 8.81 71.9
Mean 5.4 9.0 14.6 5.6 62.525th percentile 0.4 2.6 4.4 1.8 66.350th percentile 3.4 4.1 9.4 5.2 126.975th percentile 8.5 10.3 22.1 11.8 113.8
Source: Authors’ calculations.
a Nominal Chilean pesos were converted into 2000 dollars deflated by the annual average nominal exchange rate and the United States gdp deflator.
domestic and foreign) grew by 96% over the period. This growth is mostly explained by changes in average sales per plant, as the number of plants decreased during the period. Interestingly, the results for export growth are significantly different. First, total exports grew by much more, with a rise of 149%. Second, more than 80% of this growth is explained by the expansion of exports per plant, whereas less than 20% is due to the number of plants exporting. The rapid growth of exports per plant relative to sales per plant confirms the fact that exporters are much larger than average.
These figures, however, do not reveal differences across plants in terms of their export status (new, old and failing exporters). To estimate their relative contribution, we measure the significance of each margin by plant type as a source of the export boom. That is, we look not only at the number of plants and the fraction of sales exported, but also at the contribution of continuers, exiters and new exporters. For instance, if new exporters export a larger share of their sales than existing exporters, even a small entry of plants may end up contributing greatly to export growth. To examine
97
DIssECtIng tHE CHILEAn ExPoRt BooM • RAPHAEL BERgoEIng, ALEjAnDRo MICCo AnD AnDREA REPEtto
C E P A L R E V I E W 1 0 5 • D E C E M B E R 2 0 1 1
TABLE 4
Chile: Export intensity and exporters(Percentages)
Period 1990-2007 1990-1991 2006-2007
Plants:No exports 78.9 82.5 75.6Some exports 21.1 17.5 24.4
Export intensity of exporters (percentage) Percentage of exporting plants
0 to 10 48.8 52.2 43.210 to 20 11.0 8.3 11.720 to 30 5.8 6.0 6.930 to 40 5.0 4.1 5.540 to 50 4.2 3.3 4.350 to 60 4.2 4.3 4.060 to 70 4.5 4.5 4.470 to 80 5.0 5.9 5.380 to 90 5.4 5.7 5.990 to 100 6.1 5.7 8.9
Source: Authors’ calculations.
this decomposition, we break down the increase in aggregate exports into three components:
∆XX X
CC
X
EN
X
c c
EN
1990 20072007 1990
− =−
+
−
, ,
EEX EX
EXEN
X
EXEN EX
( )+ −
(1)
where ∆X1990-2007 is the aggregate change in exports during the period; C, EN and EX denote the number of continuing exporters, new exporters and failed exporters, respectively; and Xit is exports by plant type i, where i = old, new and failed exporters, at period t. Thus, exports may rise because continuing plants become larger on average, because new exporters are larger than failed exporters, or because the number of exporting plants increases.
In addition, we decompose the increase in exports into changes in the intensity and sales of continuing exporters and the net entry of exporting plants (the contribution of new exporters minus failed exporters). That is:
∆X
X
S
X
SS1990 2007
2007
2007
1990
1990199− = −
00
2007
20072007 1990
+
−( ) +
X
SS S
X
SEN
EN −
S
X
SSEN
EX
EXEX
(2)
where St denotes sales in period t. The first and second terms represent the contribution of changes in intensity and sales, respectively, at continuing plants; the third term is the contribution by new exporters; and the final term represents the (negative) contribution of failed exporters.
Tables 6 and 7 display these decompositions. When the total export change is decomposed into the contributions of changing size, intensity and number of exporters, net entry contributes 64.4% of export expansion, as already shown in table 2. Of this total net entry contribution, 48.3 percentage points are driven by the higher export intensity of the new net exporters. The remaining 16.1 percentage points are due to a rise in the net number of exporting plants. In other words, the net entry contribution is the combined result of two elements. First, entering plants are larger (average exports per plant) than failing exporters, accounting for 48.3 out of 64.4 percentage points. Second, there is a positive net entry of plants, an effect that accounts for the remaining 16.1 percentage points. Similarly, 35.6% of the change in exports is explained by the growth of continuing plants. The findings for sales are similar, although the contribution of net entry due to changes in the number of producers is 29.8 percentage points, almost twice as large as for exports.
Table 7 breaks down total export growth into export intensity and sales effects by the exporting status of the plant. The results provide further support for the idea that new exporters are the largest source of the observed

98
DIssECtIng tHE CHILEAn ExPoRt BooM • RAPHAEL BERgoEIng, ALEjAnDRo MICCo AnD AnDREA REPEtto
C E P A L R E V I E W 1 0 5 • D E C E M B E R 2 0 1 1
TABLE 5
Chile: sales, exports and exporters(Millions of 2000 dollars)
YearTotal sales
Salesper plant
Totalplants (no.)
Totalexports
Exportsper plant
Exporting plants (no.)
1990 21 876.062 4.810 4 548 2 720.005 3.671 7411991 24 176.018 5.112 4 729 2 927.437 3.282 8921992 28 062.938 5.724 4 903 3 342.719 3.468 9641993 29 274.228 5.854 5 001 3 601.731 3.477 1 0361994 31 495.799 6.237 5 050 4 467.098 4.072 1 0971995 38 376.925 7.168 5 354 6 353.077 5.444 1 1671996 40 262.537 7.088 5 680 6 262.309 5.271 1 1881997 40 930.461 7.498 5 459 6 585.138 5.696 1 1561998 37 872.972 7.268 5 211 5 850.343 5.348 1 0941999 35 032.950 7.182 4 878 6 090.689 6.171 9872000 36 476.860 7.773 4 693 5 328.199 5.693 9362001 31 574.216 7.414 4 259 6 066.539 6.623 9162002 31 596.902 6.946 4 549 6 547.966 6.601 9922003 35 851.179 7.911 4 532 6 925.204 6.776 1 0222004 43 035.311 8.984 4 790 9 397.054 8.899 1 0562005 55 024.890 12.357 4 453 10 768.812 10.121 1 0642006 54 779.590 12.865 4 258 11 445.921 10.901 1 0502007 57 034.922 14.202 4 016 12 112.502 12.186 994∆1990-2007 (%) 96 108 –12 149 120 29
Source: Authors’ calculations.Note: Exports and sales divided by the nominal exchange rate and deflated by the United States gdp deflator.
TABLE 6
Chile: Contribution of average exports and exporters
Exports Sales
Continuing exportersTotal change (millions of 2000 dollars) 3 344 414 10 308 396Amount per firm (millions of 2000 dollars) 1990 6 562 27 066 2007 22 338 75 690
Number of firms 212 212
net entry into export marketsTotal change (millions of 2000 dollars) 6 048 083 24 850 464Amount per firm (millions of 2000 dollars) Entering 9 433 52 415 Exiting 2 512 30 507
number of firms
Entering 782 782 Exiting 529 529
Contribution (percentage of total change)
Continuers 35.6 29.3Net entry 64.4 70.7 Due to ∆ in average exports and sales 48.3 40.9 Due to ∆ in number of exporters 16.1 29.8
Source: Authors’ calculations.
∆: Change or difference.

99
DIssECtIng tHE CHILEAn ExPoRt BooM • RAPHAEL BERgoEIng, ALEjAnDRo MICCo AnD AnDREA REPEtto
C E P A L R E V I E W 1 0 5 • D E C E M B E R 2 0 1 1
rise in exports, because almost the whole of the export expansion is associated with new exporting plants. Meanwhile, the continuing plants’ 35.6 percentage point contribution is explained by a 6.1 percentage point rise in export intensity and a 29.5 point rise in sales.
2. Productivity gains
New trade theories stress that exposure to foreign competition induces productivity-enhancing resource reallocation across economic units. In this section, we analyse the importance of reallocation in generating productivity gains during the Chilean export boom. This hypothesis is contrasted with the role of within-plant productivity gains that may result from international competition. Flows of knowledge from international markets and exposure to more intense competition may induce exporting plants to become more productive.11
To this end, we construct aggregate industry measures of labour productivity as the weighted average of plant-level labour productivity, i.e.:
∑=∈
prod f prodts
jstj S
jst (3)
where prodts is aggregate labour productivity in period
t in sector S, and fjst is the share of plant j’s output in the total output of sector S in period t. Finally, prodjst is the labour productivity at time t of plant j producing in sector S.
We quantify changes in this aggregate productivity measure due to reallocation of production factors across plants and within-plant productivity gains by using the
11 In a complementary study, Álvarez and López (2008) analyse whether there are spillover effects from exporting plants, finding a positive impact on the productivity of local suppliers.
cross-sectional decomposition of Olley and Pakes (1996). That is, we can write prodst as:
prod prod
f f prod prod
s s
jst st jst ts
j
J
1∑ ( )= ( )− −
= +t t (4)
The first term of the decomposition is the (unweighted) average cross-sectional mean of productivity across all plants in sector S and year t. The second term describes whether production is disproportionately located at plants with higher productivity. In other words, the first term is associated with within-plant productivity gains, whereas the second term is a covariance term that indicates whether the largest share of output is being produced by the most productive plants.
Table 8 depicts the evolution of prodt averaged at the sectoral level in manufacturing, with prod normalized to 1 in 1990. The table also shows the relative importance of the evolution of the simple average and the cross term as described in the decomposition above. The figures indicate that reallocation towards more productive plants has become more substantial over the last two decades. That is, not only is this covariance term positive, but its contribution to aggregate productivity has become larger over time. In what follows we examine whether the observed total growth in productivity and each of its components is associated with export behaviour. Although we are not able to identify causal effects, the regressions below can be interpreted as describing the correlation between aggregate productivity growth, reallocation effects and exports.
To do this, we estimate models such as:
ln * ln *prod X trendst s s st= +α β δ ε+ +t t (5)
TABLE 7
Chile: Contribution of export intensity and exporters
Export intensity (Percentages)
Sales (Millions of 2000 dollars)
Contribution to export rise (Percentages)
1990 2007 1990 2007 ∆ intensity ∆ sales Total
Continuing exporters 24.2 29.5 5 737 916 16 046 312 6.11 29.50 35.6New exporters 18.0 40 988 610 78.5Failed exporters 8.2 16 138 146 –14.1Net entry –8.2 18.0 –16 138 146 40 988 610 64.4
Source: Authors’ calculations.
∆: Change or difference.

100
DIssECtIng tHE CHILEAn ExPoRt BooM • RAPHAEL BERgoEIng, ALEjAnDRo MICCo AnD AnDREA REPEtto
C E P A L R E V I E W 1 0 5 • D E C E M B E R 2 0 1 1
where Xst denotes exports in sector S at period t, αs is a sector fixed effect, prodst is a measure of productivity, and trendt is a time trend.
Regression results are displayed in table 9. The left-hand panel of the table uses ordinary least squares (ols) as the estimation method. The first column of the table estimates an elasticity of aggregate productivity to exports equal to 0.052. Thus, growth in exports is correlated with growth in aggregate labour productivity. The effect is statistically significant and economically relevant, especially given that exports doubled over the sample period.
The second column uses the simple average of labour productivity as the endogenous variable to find an elasticity of 0.04. This finding indicates that export growth is indeed correlated with plants’ productivity gains. The third column replicates the first exercise, now controlling for the natural log of the simple average of productivity. Thus, the estimated elasticity of weighted productivity to exports captures the covariance term in the decomposition. Our result shows that this reallocation term is indeed significantly correlated with export growth; that is, as exports grow, output increasingly comes from the most productive plants. The fourth column uses the relative importance of the covariance term directly as the dependent variable. Now we find no evidence of significant elasticity, although the estimated effect is positive.
The right-hand panel of the table repeats these exercises using a robust regression framework to downweight outliers. We now find that all estimated elasticities are positive and statistically significant.
TABLE 8
Chile: olley-Pakes decomposition of labour productivity (Simple averages by sector)
Year Total Simple average Cross term
1990 1.00 0.85 0.151991 1.08 0.83 0.171992 1.17 0.81 0.191993 1.26 0.80 0.201994 1.27 0.82 0.181995 1.40 0.81 0.191996 1.55 0.79 0.211997 1.60 0.80 0.201998 1.65 0.79 0.211999 1.71 0.81 0.192000 1.82 0.78 0.222001 1.96 0.77 0.232002 2.08 0.81 0.192003 2.09 0.82 0.182004 2.16 0.75 0.252005 2.40 0.76 0.242006 2.52 0.77 0.232007 2.74 0.80 0.20
Source: Authors’ calculations.
TABLE 9
Chile: Exports and labour productivity
Labour productivity (deflated) Cross term Labour productivity (deflated) Cross term
Weighted Unweighted Weighted fraction Weighted Unweighted Weighted fraction
Exports (ln) 0.052 0.040 0.025 0.004 0.026 0.052 0.017 0.011(3.70)** (2.73)** (2.46)* (0.41) (2.20)* (4.94)** (2.44)* (2.39)*
lp unweighted 0.679 0.809(17.72)** (29.89)**
Year 0.049 0.041 0.021 0.007 0.051 0.039 0.013 0.004 (18.51)** (14.94)** (8.51)** (3.61)** (22.75)** (19.64)** (7.73)** (4.62)**Observations 336 336 336 336 336 336 336 336R-squared 0.98 0.98 0.99 0.76 0.98 0.99 0.99 0.93Regression ols Robust regression
Source: Authors’ calculations.Absolute value of t-statistics in parentheses.
* significant at 5%; ** significant at 1%.lp: Labour productivity
Summing up, our results suggest that productivity and exports have co-moved over the Chilean boom. Moreover, as exports have expanded, there has been a productivity-enhancing reallocation of resources towards the most efficient plants. These trends are consistent with the predictions of the new theories of heterogeneous plants and trade.

101
DIssECtIng tHE CHILEAn ExPoRt BooM • RAPHAEL BERgoEIng, ALEjAnDRo MICCo AnD AnDREA REPEtto
C E P A L R E V I E W 1 0 5 • D E C E M B E R 2 0 1 1
This paper uses almost two decades of Chilean plant-level manufacturing data to empirically investigate the relationship between exports, plant dynamics and productivity. We find that 64.4% of the increase in exports over the years from 1990 to 2007 was due to the net entry of new exporters. About two thirds of this net entry contribution is associated with the larger size (average exports per plant) of new exporters; only a third is related to the increase in the number of exporters. Additionally, the export intensity (exports over sales) of new exporters was more than double that of failing exporters. Overall, even though exporters in Chile remain a minority among domestic producers and usually sell only a small fraction of their output abroad, as reported by Bernard and Jensen (1995) for developed economies, figures have increased during the last two decades. The bilateral trade agreements that came to supplement the previous unilateral liberalization strategy in the early 1990s may have favoured new and more intensive exporters by reducing foreign market penetration costs.
We also show that productivity and exports have co-moved over the Chilean boom. Moreover, the export expansion has been associated with a productivity-enhancing reallocation of resources towards more efficient plants.
The aggregate effect on productivity is a topic that requires further research, however, as other margins not analysed here may be affected. For instance, Atkenson and Burstein (2010) suggest that there may be countervailing effects, since increases in exporters’ innovative activity might diminish productivity innovation undertaken by smaller companies primarily serving domestic markets.
Finally, future research should address the role of natural resources as a driver of Chile’s export boom. Although non-copper exports have shown increasing diversification in terms of markets and products (Berthelon, 2011), natural resources still predominate in Chile’s export expansion as compared to other liberalization experiences.
(Original: English)
VConcluding remarks
Bibliography
Arkolakis, C. (2008), “Market penetration costs and the new consumers margin in international trade”, nber Working Paper, No. 14214, Cambridge, Massachusetts.
Álvarez, R. and R.A. López (2008), “Is exporting a source of productivity spillovers?”, Review of World Economics (Weltwirtschaftliches Archiv), vol. 144, No. 4, New York, Springer.
(2005), “Exporting and performance: evidence from Chilean plants”, Canadian Journal of Economics, vol. 38, No. 4, Quebec, Canadian Economics Association.
Álvarez, R. and S. Vergara (2010), “Exit in developing countries: economic reforms and plant heterogeneity”, Economic Development and Cultural Change, vol. 58, No. 3, Chicago, Chicago University Press.
Atkenson, A. and A. Burstein (2010), “Innovation, firm dynamics, and international trade”, Journal of Political Economy, vol. 118, No. 3, Chicago, University of Chicago Press.
Barandiarán, E. and L. Hernández (1999), “Origins and resolution of a banking crisis: Chile 1982-86”, Working Paper, No. 57, Santiago, Chile, Central Bank of Chile.
Bergoeing, R., A. Hernando and A. Repetto (2010), “Market reforms and efficiency gains in Chile”, Estudios de Economía, vol. 37, No. 2, Santiago, Chile, University of Chile.
(2005), “Deflators and capital series in the enia: technical appendix”, Santiago, Chile, Center of Applied Economics, University of Chile, unpublished.
Bernard, A.B. and J.B. Jensen (2004), “Entry, expansion, and intensity in the U.S. export boom, 1987-1992”, Review of International Economics, vol. 12, No. 4, Wiley Blackwell.
(1999), “Exceptional exporter performance: cause, effect, or both?”, Journal of International Economics, vol. 47, No. 1, Amsterdam, Elsevier.
(1995), “Exporters, jobs and wages in U.S. manufacturing: 1976-1987”, Brookings Papers on Economic Activity, Microeconomics 1995, Washington, D.C., Brookings Institution.
Bernard, A.B. and others (2007), “Firms in international trade”, Journal of Economic Perspectives, vol. 21, No. 3, Nashville, Tennessee, American Economic Association.
(2003), “Plants and productivity in international trade”, American Economic Review, vol. 93, No. 4, Nashville, Tennessee.
Berthelon, M. (2011), “Chilean export performance: the role of intensive and extensive margins”, Working Paper, No. 615, Santiago, Chile, Central Bank of Chile.
Clerides, S., S. Lach and J. Tybout (1988), “Is learning-by-exporting important?”, Quarterly Journal of Economics, vol. 113, No. 3, Cambridge, Massachusetts, The mit Press.
Corbo, V. and S. Fischer (1994), “Lessons from the Chilean stabilization and recovery”, The Chilean Economy: Policy Lessons and Challenges, B. Bosworth, R. Dornbusch and R. Labán (eds.), Washington, D.C., The Brookings Institution.

102
DIssECtIng tHE CHILEAn ExPoRt BooM • RAPHAEL BERgoEIng, ALEjAnDRo MICCo AnD AnDREA REPEtto
C E P A L R E V I E W 1 0 5 • D E C E M B E R 2 0 1 1
Eaton, J., S. Kortum and F. Kramarz (2008), “An anatomy of international trade: evidence from French firms”, nber Working Papers, No. 14610, Cambridge, Massachusetts, National Bureau of Economic Research.
Edwards, A. and S. Edwards (1992), Monetarismo y liberalización: el experimento chileno, Santiago, Chile, Fondo de Cultura Económica.
Irarrázabal, A. and L.D. Opromolla (2007), “Trade reforms in a global competition model: the case of Chile”, Lisbon, Bank of Portugal, unpublished.
Kehoe, T. and K. Ruhl (2009), “How important is the new goods margin in international trade?”, Staff Report, No. 324, Minneapolis, Federal Reserve Bank of Minneapolis,.
Melitz, M.J. (2008), “International trade and heterogeneous firms”, The New Palgrave Dictionary of Economics, S.N. Durlauf and L.E. Blume (eds.), Palgrave Macmillan.
(2003), “The impact of trade on intra-industry reallocations
and aggregate industry productivity”, Econometrica, vol. 71, No. 6, New York, Econometric Society.
Olley, S. and A. Pakes (1996), “The dynamics of productivity in the telecommunication equipment industry”, Econometrica, vol. 64, New York, Econometric Society.
Pavcnik, N. (2002), “Trade liberalization, exit, and productivity improvements: evidence from Chilean plants”, The Review of Economic Dynamics, vol. 69, No. 1, Wiley Blackwell.
Trefler, D. (1993), “International factor price differences: Leontief was right!”, Journal of Political Economy, vol. 101, No. 6, Chicago, University of Chicago Press.
Wagner, J. (2008), “Exports, imports, and productivity at the firm level: an international perspective: introduction by guest editor”, Review of World Economics, vol. 144, No. 44, Springer.
(2007), “Exports and productivity: a survey of the evidence from firm level data”, The World Economy, vol. 30, No. 1, Wiley Blackwell.