CEPA Working Paper No. 18-10 · portfolio of courses that students choose, ... Study 1 revealed...
11
How a data-driven course planning tool affects college students’ GPA: Evidence from two field experiments College students rely on increasingly data-rich environments when making learning-relevant decisions about the courses they take and their expected time commitments. However, we know little about how their exposure to such data may influence student course choice, effort regulation, and performance. We conducted a large-scale field experiment in which all the undergraduates at a large, selective university were randomized to an encouragement to use a course-planning web application that integrates information from official transcripts from the past fifteen years with detailed end-of-course evaluation surveys. We found that use of the platform lowered students’ GPA by 0.28 standard deviations on average. In a subsequent field experiment, we varied access to information about course grades and time commitment on the platform and found that access to grade information in particular lowered students’ overall GPA. Our exploratory analysis suggests these effects are not due to changes in the portfolio of courses that students choose, but rather by changes to their behavior within courses. ABSTRACT AUTHORS VERSION May 2018 Suggested citation: Chaturapruek, S., Dee, T.S, Johari, R., Kizilcec, R.F., & Stevens, M.L. (2018). How a data-driven course planning tool affects college students’ GPA: Evidence from two field experiments (CEPA Working Paper No.18-10). Retrieved from Stanford Center for Education Policy Analysis: http://cepa.stanford.edu/wp18-10 CEPA Working Paper No. 18-10 Sorathan Chaturapruek Stanford University Thomas Dee Stanford University Ramesh Johari Stanford University René F. Kizilcec Stanford University Mitchell L. Stevens Stanford University
Transcript of CEPA Working Paper No. 18-10 · portfolio of courses that students choose, ... Study 1 revealed...
How a data-driven course planning tool affects collegestudents’ GPA: Evidence from two field experiments
College students rely on increasingly data-rich environments when making learning-relevant
decisions about the courses they take and their expected time commitments. However, we
know little about how their exposure to such data may influence student course choice, effort
regulation, and performance. We conducted a large-scale field experiment in which all the
undergraduates at a large, selective university were randomized to an encouragement to use
a course-planning web application that integrates information from official transcripts from the
past fifteen years with detailed end-of-course evaluation surveys. We found that use of the
platform lowered students’ GPA by 0.28 standard deviations on average. In a subsequent field
experiment, we varied access to information about course grades and time commitment on
the platform and found that access to grade information in particular lowered students’
overall GPA. Our exploratory analysis suggests these effects are not due to changes in the
portfolio of courses that students choose, but rather by changes to their behavior within
courses.
ABSTRACTAUTHORS
VERSION
May 2018
Suggested citation: Chaturapruek, S., Dee, T.S, Johari, R., Kizilcec, R.F., & Stevens, M.L. (2018). How a data-driven course planning tool affects college students’ GPA: Evidence from two field experiments (CEPA Working Paper No.18-10). Retrieved from Stanford Center for Education Policy Analysis: http://cepa.stanford.edu/wp18-10
CEPA Working Paper No. 18-10
Sorathan ChaturapruekStanford University
Thomas DeeStanford University
Ramesh JohariStanford University
René F. KizilcecStanford University
Mitchell L. StevensStanford University

How a data-driven course planning tool affects collegestudents’ GPA: Evidence from two field experiments
Sorathan Chaturapruek, Thomas S. Dee, Ramesh Johari, René F. Kizilcec and Mitchell L. StevensStanford University
Stanford, CA{sorathan, tdee, rjohari, kizilcec, mitchell.stevens}@stanford.edu
ABSTRACTCollege students rely on increasingly data-rich environmentswhen making learning-relevant decisions about the coursesthey take and their expected time commitments. However,we know little about how their exposure to such data mayinfluence student course choice, effort regulation, and perfor-mance. We conducted a large-scale field experiment in whichall the undergraduates at a large, selective university were ran-domized to an encouragement to use a course-planning webapplication that integrates information from official transcriptsfrom the past fifteen years with detailed end-of-course eval-uation surveys. We found that use of the platform loweredstudents’ GPA by 0.28 standard deviations on average. In asubsequent field experiment, we varied access to informationabout course grades and time commitment on the platform andfound that access to grade information in particular loweredstudents’ overall GPA. Our exploratory analysis suggests theseeffects are not due to changes in the portfolio of courses thatstudents choose, but rather by changes to their behavior withincourses.
ACM Classification KeywordsK.3.m. Computers and Education: Miscellaneous.
Author KeywordsInformation platform; higher education; dashboard;randomized field experiment; GPA.
INTRODUCTIONEnabling informed decisions is the fundamental incentive fortransparency in the face of consequential choices. Yet collegestudents routinely face the task of choosing courses and invest-ing effort in their studies under conditions of informationalopacity. Universities are famously anarchic organizations [7],whose myriad intramural units are typically only loosely coor-dinated with one another [18], creating chronic information
Permission to make digital or hard copies of all or part of this work for personal orclassroom use is granted without fee provided that copies are not made or distributedfor profit or commercial advantage and that copies bear this notice and the full citationon the first page. Copyrights for components of this work owned by others than theauthor(s) must be honored. Abstracting with credit is permitted. To copy otherwise, orrepublish, to post on servers or to redistribute to lists, requires prior specific permissionand/or a fee. Request permissions from [email protected].
L@S’18, June 26–28, 2018, London, UK
© 2018 Copyright held by the owner/author(s). Publication rights licensed to ACM.ISBN 123-4567-24-567/08/06. . . $15.00
DOI: http://dx.doi.org/10.475/123_4
problems for students who seek to thoughtfully plan their in-vestments of attention, effort and time. Since schools rarelyprovide accessible information describing prior cohorts’ aca-demic choices and outcomes, current students source whatthey know from peers and form opinions in light of theirbeliefs about those peers–an inherently biased sampling proce-dure [10, 20, 5]. Official records might provide representativesummary of selected course outcomes that can be distributedacross all students independent of their social network ties.Yet while the publication of performance data may yield bene-fits of efficiency and equity of information access, it may alsoproduce deleterious consequences, such as myopic choicesand attempts to game the system [16].
Only a handful of studies offer empirical insight into howstudents respond to summaries of official course outcomes.Cornell University began publishing median course grades on-line in 1998, which yielded a natural experiment for studyingthe effects of exposure to course information. The findingsindicate that students, especially lower-performing ones, weresubsequently drawn to leniently graded courses [4, 3]. Thismove toward grade-driven course selection contributed to asteady rise in average GPA at the school. Grade inflation is aconcerning trend for universities if it is the result of reward-driven behavior by students or faculty, rather than a reflectionof enhanced student learning [11]. Nevertheless, the extent towhich students are influenced by grade information remainscontested in the literature. In a recent quasi-experiment, Mainand Ost [13] found no evidence that letter grades influenceundergraduate students’ course-taking behavior or decision tomajor in economics, only a positive effect on student effortwithin courses.
Thus the current empirical evidence paints an ambiguous pic-ture of the effect of making course outcome data availableon subsequent student performance. The research presentedhere offers new evidence on the consequences of publishingcourse outcome data based on a pair of randomized exper-iments at a large, private research university. Our researchutilized a course information platform we created that providesaggregate statistics from official university enrollment, coursedescriptions, course evaluations, and grade distributions de-rived from official transcripts (for details, see Section Carta: Acourse exploration platform). The platform is maintained bothto serve students and enable research. It launched officially inAugust of 2016 and is available to all students enrolled at the
1

university. Although use of the platform is fully voluntary, ithas enjoyed widespread adoption by the undergraduate studentbody. Over 80% of undergraduate students interact with theplatform during each academic quarter.
We leverage this use to investigate three research questionsabout the impact of exposure to course outcome information.First, we ask about impact on student performance:
RQ1. Does exposure to course outcome information influencestudents’ subsequent overall GPA?
Presuming there is some effect of course outcome informationon GPA, we are led to consider potential mechanisms. Courseoutcome information may affect students’ grades by alteringthe portfolio of courses they choose. In fact, prior researchfound anticipated grades to be the most important factor inundergraduate course selection [14]. There are myriad waysin which such effects might manifest: for example, a systemwith rich course outcome information might enable studentsto engage in strategic planning over a much larger choiceset, encouraging exploration into domains of knowledgethat are new to them. If these choices challenge students toventure into courses outside their comfort zones, we mightexpect that students’ course performance will deteriorate withthe availability of richer course information. Alternatively,students may forgo “challenging” courses for which they areless well prepared in favor of “safe” courses that historicallyhave conferred high marks. They may receive higher gradesby choosing a less demanding portfolio of courses than theywould have otherwise, consistent with the findings at CornellUniversity [4]. Students may also use information aboutcourse outcomes to strategically maximize their grades byselecting courses that others report as “easy.” Taken together,it is unclear whether and how the revelation of course outcomedata affects a student’s course portfolio, and ultimately theirsubsequent course performance. Hence our second researchquestion:
RQ2. Does exposure to course outcome information influencethe portfolio of courses students choose?
Next, consider how course outcome information mayaffect students’ grades given a particular course portfolio.Exposure to course outcome information may cause studentsto modulate their effort within individual courses. If astudent finds that prior outcome data suggests a particularcourse is relatively leniently graded or requires a low timecommitment, then she may decrease the effort devoted tothe course. It is therefore possible for grades to be affectedin the absence of any course portfolio changes, due tothese adjustments in students’ effort allocation: grades maygo up if students correct planned misallocations of effort,or they may go down if students become overconfidentand exert too little effort in classes. (Nevertheless, inreturn for lower grades, students may experience less stressand more well-being—a likely desirable trade-off in ahigh-pressure academic environment.) We therefore pose
a third research question about within-course effects on grades:
RQ3. Does exposure to course outcome information influencestudents’ GPA within a particular course?
In the first experiment (Study 1), we explicitly encouraged arandomly chosen group of students to use the Carta systemwhile most of them were unaware of its existence at launch.We found that platform usage caused a significant reduction inGPA during the subsequent academic term (RQ1). We did notfind evidence of changes in course portfolios (RQ2), but didfind evidence of within-course effects (RQ3). In a follow-upexperiment (Study 2), we manipulated the ease of access tospecific course outcome information: grade information andself-reported time commitment data. We found that accessto grade information caused a significant reduction in GPA(RQ1), and again did not find evidence of changes in courseportfolios (RQ2) but did find evidence of within-course effects(RQ3). In this study we also found that there are subtle inter-actions between grade and time commitment information thatinfluence students’ subsequent performance.
Our field studies reveal that the public provision of courseinformation has a significant impact on student course perfor-mance, and thus raise questions for future research into theeffect’s causal pathways and best practices for the design ofcourse information systems. We offer an interpretation of ourfindings through through the lens of an established learningtheory [15], and conclude by specifying key normative andpedagogical questions that accompany any systematic displayof academic information.
CONTEXTThis section describes the context of the university in whichthis study is set and the Carta platform which serves as thesubstrate for the inquiries described below.
The UniversityThe study site is a highly selective private research universityin the US. It offers courses during three ten-week quarters ofeach academic year and during a summer quarter. During theperiod of our investigation, the university enrolled roughly7,000 undergraduate students, with approximately equal num-bers of women and men. Like most selective institutions in theUS, this university’s curriculum is largely elective. Studentsare obliged to fulfill certain academic requirements, but theyretain discretion over which particular courses they choose tomeet those requirements. Students are encouraged to declaremajors (one or more) before the beginning of their third year.Official campus literature advocates wide exploration of thecurriculum, especially in the first and second years beforedeclaring majors.
The university maintains a fairly elaborate program of aca-demic advising that includes full-time professional advisorsserving all students, coupled with department-based facultyadvising for those with declared majors, and a program offaculty and staff volunteers who provide consultation to stu-dents who have yet to declare majors. The research team madeCarta available to students as an additional and fully voluntary
2

Figure 1. A screenshot of the Carta platform. Examples of information shown are grade and time commitment distributions of prior students
resource. It became one component of a complicated intramu-ral information ecosystem that includes professional advisors,official university documentation about course offerings, andthe experiential and reputational information on which col-lege students have long relied to weigh academic options andmake decisions. The analysis presented here represents aninitial step in an ongoing effort to understand how variationin information supply influences student behavior within thatecosystem.
Carta: A course exploration platformCarta is a novel web application for course exploration andplanning that visualizes data from registrar records and studentcourse evaluations (see Fig. 1). It provides an interface forstudents to search for classes, as well as to “pin” (or save)classes for further consideration. By making prior students’choices available in aggregated form to current students, Cartaexpands students’ knowledge of course offerings and providesa support tool as students construct their academic schedules.Carta is made available to students under the full knowledgeof the university’s professional advising staff, some of whomuse the platform in their consultations with students.
At the course level, Carta provides students with several typesof information: basic descriptive information about coursesfrom the university’s course bulletin; formal student evalua-tions of instructors; sequencing information (i.e., when coursesare taken relative to others in students’ careers); and textualcourse reviews from the student course evaluations. Cartaprovides information on prior students’ academic outcomes,grouped under the heading “Performance”: the distribution ofgrades received, and the percentage of students who droppedor withdrew from prior offerings of the same course. Finally,Carta provides information on the number of hours per week
students report spending on courses, a measure presented un-der the heading “Intensity.”
The platform has become a popular campus resource. Since itsofficial launch in August 2016, Carta has served approximately5,500 undergraduates representing over 80% of undergradu-ate enrollment, with comparable usage rates among studentsacross all academic divisions. Carta is explicitly presented tousers as a research project.
STUDY 1: ENCOURAGEMENT DESIGNThis first study investigates whether and how access toinformation about historical course outcomes affects students’academic performance and behavior. We employed arandomized encouragement design because we deemed it bothimpractical and unethical to compel or prevent use of Carta.Randomized encouragement is a standard tool in econometricsto establish causal effects when a fully randomized controlledtrial is not feasible.1 Our confirmatory analysis tests ifthe encouragement to use Carta and Carta usage itself hasany discernible effect on three primary academic outcomemeasures: GPA, course drops, and course withdrawals.2 Wetest two hypotheses:
H1. Carta usage affects students’ GPA at the end ofthe subsequent quarter.H2. Carta usage affects students’ likelihood of dropping orwithdrawing from courses.1It can be viewed as a special case of an instrumental variables (IV)approach to causal inference, where in our case the encouragementto use the platform is the instrument for use.2Students can drop a course until the add/drop deadline (three weeksinto the quarter) and it does not appear on their transcript. In contrast,students can withdraw from a course until eight weeks into the quarterbut this action is recorded on their transcript.
3

Rejection of the null hypotheses in favor of H1 or H2 wouldprovide evidence that the platform influences student courseperformance. After testing for the hypothesized effects, weconduct exploratory analyses to investigate potential mecha-nisms. Specifically, we attempt to disentangle the extent towhich changes in GPA are due to either portfolio effects orwithin-course effects by examining the degree of diversity anddifficulty of classes taken by students.
MethodParticipantsStudy participants are all undergraduate students at the uni-versity who enrolled in classes in Fall 2016-17. Participantsinclude the new cohort of incoming first-year students. Thestudy retains co-terminal Master’s students if they remainmatriculated in their first four years of study. We excludeany students matriculated at year five or above. We excludetransfer students and those who do not have a GPA in the fallquarter (e.g., those who do not take any letter-grade courses).Accounting for all these features, our total study sample isN = 6516.
ProcedureStudy participants were randomly assigned to a treatment orcontrol condition with equal probability. We confirmed thatrandomization was balanced on observable covariates (e.g.,students’ class year and declared major). Students in thetreatment condition were encouraged to use Carta via twomechanisms: an e-mail from the university Registrar (sent onAugust 1) and a link prominently displayed in students’ Fall“to-do list” in the university’s official administrative course en-rollment system. Both encouragements described the platformas a course exploration tool populated with official historicaldata from the university. Students in the control conditionreceived neither the Registrar’s e-mail nor the link.
Outcome and covariate measuresThe primary outcome measure in our confirmatory analysisis the grade point average (GPA) of a student in the coursestaken in the Fall quarter. For this measure and all other GPAs,we standardize by subtracting the mean GPA for the popula-tion and dividing by the standard deviation (i.e., z-scoring).This outcome measure is labeled FALLGPA. Two additionaloutcomes in our confirmatory analysis are drops of courses,and withdrawals from courses.
Predictors in our regression analyses include a binary treat-ment indicator (ENCOURAGED) and the following covariates:
1. USECARTA: Binary indicator for whether (1) or not (0) thestudent used Carta before the add/drop deadline at the endof the third week of classes.
2. CLASSYEAR: Categorical variable for student’s year (fresh-man, sophomore, junior, senior).
3. MAJOR: Categorical variable for students’ major(s).3
3Some students had more than one major. To accommodate thesecases, we introduced additional values by concatenating the two (ormore) major names.
4. MAJORCATEGORY: Categorical variable for the school-level categorization of students’ major (e.g., engineering,humanities, social sciences).
5. PRIORGPA: Cumulative GPA across all classes taken by astudent prior to Fall quarter.4
PreregistrationFor this study, we followed an internal registration protocolto ensure that we committed to the confirmatory hypothesesabove prior to the start of the study, separate from any ex-ploratory analysis conducted post hoc. After conclusion ofthe first study, we became aware of the Open Science Frame-work (https://osf.io); we subsequently used this platform topreregister our second study (see below).
ResultsDescriptive statistics of Carta usageTable 1 provides descriptive statistics for multiple indicatorsof Carta usage for students in the treatment and control condi-tion. Indicators include the number of students who sign intoCarta, active days on Carta, searching, and pinning. From thedescriptive statistics we observe that there were many morestudents in the treatment condition that used Carta, and thatthese students also had higher activity levels. This is consistentwith the fact that active users in the treatment condition weremore likely to have begun using Carta earlier in the treatmentperiod (since they learned of it right at the start). Figure 2 addi-tionally shows the total number of Carta users over time. (Forthe purposes of our study, we defined USECARTA in terms ofusage status at the add/drop deadline.)
Average number ofN Active
Group N used days on Searches PinsCarta Carta
Freshman Control 865 727 16.0 (14.8) 58 (85) 23.3 (33.7)Freshman Treatment 870 847 19.6 (13.7) 61 (82) 28.7 (28.9)
Sophomore Control 827 354 7.1 (11.6) 26 (62) 4.5 (10.3)Sophomore Treatment 860 659 9.9 (11.9) 32 (60) 8.0 (13.7)
Junior Control 802 336 4.9 (8.2) 16 (35) 3.4 (10.1)Junior Treatment 775 559 7.7 (10.1) 23 (42) 5.9 (11.1)
Senior Control 733 277 3.5 (7.9) 11 (29) 2.3 (7.8)Senior Treatment 784 554 5.1 (6.5) 14 (25) 5.0 (9.2)
Total Control 3227 1694 8.1 (12.2) 28 (61) 8.8 (21.1)Total Treatment 3289 2619 10.8 (12.3) 33 (60) 12.2 (20.4)
Table 1. Activity levels of students by the encouragement condition be-tween the official Carta launch on August 1, 2016 and December 16,2016, the undergraduate housing closing date of the Fall quarter. Stu-dents can pin courses to save them on the left-hand panel (see Figure 1).The numbers in parentheses indicate standard deviations.
Confirmatory analysisWe begin the confirmatory analysis by estimating the first-order effect to check if assignment to the encouragement in-creased the likelihood of Carta usage. Figure 2 plots Carta4Freshman are missing a PRIORGPA because Carta was introducedbefore their first quarter. In our analysis, we impute PRIORGPA =−1 for Freshmen and use the interaction term PRIORGPA ×CLASSYEAR to account for this imputation.
4

adoption over time among students in different class years,showing a large increase in adoption among encouraged stu-dents. The percentage of Carta users was significantly higheramong students in the treatment than in the control condition(80% vs. 52%, χ2 = 534.7, p < 0.001). This suggests that theencouragement was both effective and notably strong.
Car
ta's
offi
cial
laun
ch
Und
ergr
adua
te h
ousi
ng o
pens
Last
day
to a
dd o
r dr
op a
cla
ss
0
250
500
750
Aug Sep Oct Nov Dec
Tota
l num
ber
of C
arta
use
rs
FreshmanTreatment
FreshmanControl
SophomoreTreatment
SophomoreControl
JuniorTreatment
JuniorControl
SeniorTreatment
SeniorControl
Figure 2. Total number of Carta users over time in 2016 by the encour-agement condition and class year.
Next, we estimated the intent-to-treat effect (ITT) of the en-couragement on GPA. This analysis focuses on the effect ofthe encouragement independent of whether students actuallyused Carta. We find that the encouragement significantly re-duced GPA by 0.05 standard deviations (t =−2.81, p= 0.005)adjusting for covariates to increase precision (see regressionoutput in Table 2). This provides strong evidence in support ofH1. By contrast, we found the ITT effect for course drops andwithdrawals not to be significant (t = 0.25, p = 0.803). Thuswe cannot reject the null hypotheses of no change in drops orwithdrawals (H2).
(1) (2)
ENCOURAGED −0.03 (0.02)* −0.05 (0.02)***
YEAR 3 0.04 (0.03)YEAR 2 −0.06 (0.05)YEAR 1 −0.19 (0.14)***
PRIORGPA 0.77 (0.13)***
PRIORGPA ×YEAR 3 0.01 (0.06)PRIORGPA ×YEAR 2 0.05 (0.10)PRIORGPA ×YEAR 1 −0.83 (0.08)***
Intercept 0.14 (0.02)*** −0.22 (0.30)
Robust standard errors shown in parentheses; * p < 0.1, ** p < 0.05, *** p < 0.01
Table 2. Regression output for the intention-to-treat analysis estimatingthe effect of the encouragement on FALLGPA. Model (1) does not adjustfor covariates; model (2) adjusts for covariates, and includes fixed effectsfor MAJOR and MAJORCATEGORY, as well as interactions of those fixedeffects with PRIORGPA.
Finally, we estimate the effect of Carta usage itself on GPAusing the two-stage least squares (2SLS) estimator. Carta us-age is defined by whether a student logs into Carta before theadd/drop deadline (USECARTA = 1; 0 otherwise). Note that
the exclusion restriction5 appears reasonable in this context,because the encouragement to use Carta (i.e., the email andlink in the course enrollment system) is unlikely to influencestudents’ grades except through exposure to information onCarta. Using 2SLS, we find that Carta usage reduced GPA by0.28 standard deviations (t =−2.67, p = 0.008), thus provid-ing strong support for H1. (Again, similar analysis revealed noeffect on drops or withdrawals (−0.024 standard deviations,t =−0.10, p = 0.921), thus not offering any support for H2.)
Exploratory analysisWe conduct further analyses to explore how Carta usagecaused a drop in GPA. We begin by noting that the GPA dropwas primarily concentrated among underclassmen. In par-ticular, if we employ the same 2SLS procedure, but subsetfor underclassmen (freshmen and sophomores) and upper-classmen (juniors and seniors), the GPA drop is significantfor underclassmen (−0.47 standard deviations, t = −2.35,p = 0.019), but not for upperclassmen (−0.16 standard devi-ations, t = −1.46, p = 0.145). In other words, the effect ofthe encouragement was concentrated among students whowere relatively “new” to the university. We also test forperformance-based heterogeneity in the observed effect ofCarta usage on GPA using the same 2SLS procedure for twosubgroups.6 Students with low prior GPA (i.e., below median)showed a significant drop in GPA (−0.35 standard deviations,t = −2.37, p = 0.018). In contrast, students with high priorGPA (i.e., equal to or above median) had a small and not sta-tistically significant drop in GPA (−0.07 standard deviations,t =−0.64, p = 0.523).
Next, we investigate two mechanisms described in our RQsabove. We first examine if the portfolio of courses selectedby students changed as a consequence of Carta usage (i.e. aportfolio effect; RQ2). We then examine if students’ behaviorwithin the same course changed as a consequence of Cartausage (i.e. a within-course effect; RQ3).
Portfolio effect. To check for portfolio effects, we devise mul-tiple metrics to capture the difficulty and familiarity of a givencourse portfolio (described below). The focus on difficultyand familiarity is motivated by prior research suggesting thatstudents may gravitate towards easier, more familiar courses.Using OLS regression, we estimate the treatment effect oneach of these metrics using the same regressors as in the confir-matory analysis (see Table 2) plus corresponding pre-treatmentcovariates to increase precision. None of the portfolio-levelmetrics exhibited a statistically significant difference betweenthe experimental conditions (all p > 0.3), providing strongevidence that Carta usage caused no substantial changes instudents’ course portfolios.
The following target metrics served as proxies for course port-folio difficulty:
Prior fraction of A’s. The fraction of “A” and “A+” gradesgiven in a course over the past five years averaged over the
5The exclusion restriction is a necessary assumption for obtainingcredible causal estimates from encouragement designs.6This analysis excludes freshmen for whom prior GPA informationis unavailable.
5
course portfolio of a student. We additionally adjust for thesame metric but averaged over prior courses last Fall quarter astudent took.7
Enrolled course units. The number of course units a studentenrolls during Fall quarter. We additionally adjust for the priornumber of course units a student took.
Hours per week. The average number of hours per weekstudents report (on course evaluations) spending on a courseover the past five years averaged over the course portfolioof a student. We additionally adjust for the same metric butaveraged over prior courses a student took.
Class year. The average class year of students in the course(coding freshman = 1, sophomore = 2, junior = 3, senior = 4,others = 5) averaged over the course portfolio of a student.We additionally adjust for the same measure but averaged overprior courses a student took.
Class level. The average class level8 of a student’s courseportfolio. We additionally adjust for the same measure butaveraged over prior courses a student took.
The following target metrics served as proxies for the degreeto which students selected unfamiliar or “exploratory” courseportfolios:
Number of departments. The number of distinct departmentsin which a student enrolled in courses in Fall quarter. Weadditionally adjust for the same measure but for prior courseportfolios a student selected.
Major category. The fraction of courses a student took ineach of the major categories (i.e., humanities and arts, socialsciences, natural sciences, interdisciplinary, engineering) inFall quarter. We additionally adjust for the same measure butfor prior course portfolios a student selected.
General education requirements. The the number of courses astudent took in Fall quarter that satisfy at least one generaleducation requirement (GER).
Within-course effect. To evaluate if students’ behavior withinthe same course changed as a consequence of Carta usage,we check if student performance in the same course differedbetween the control and treatment conditions. As there wasno evidence for portfolio effects on eight different metrics, weassume in the following analyses that any course selection biasis small or negligible. We perform the within-course analysisfor freshmen and sophomores, given that underclassmen were
7Analogous to PRIORGPA, the prior fraction of A’s metric over priorcourses for Freshmen is imputed as −1 and accounted for by theinteraction term. We use the same methodology across all metrics inthis section.8At this university, every course is identified by a department anda three digit numeric code, that is either below 100-level, 100-level,200-level, 300-level, or above; these encodings broadly indicate theintended audience of the course, with below 100-level and 100-levelas undergraduate courses and 200- and 300-level courses or abovetypically graduate courses.
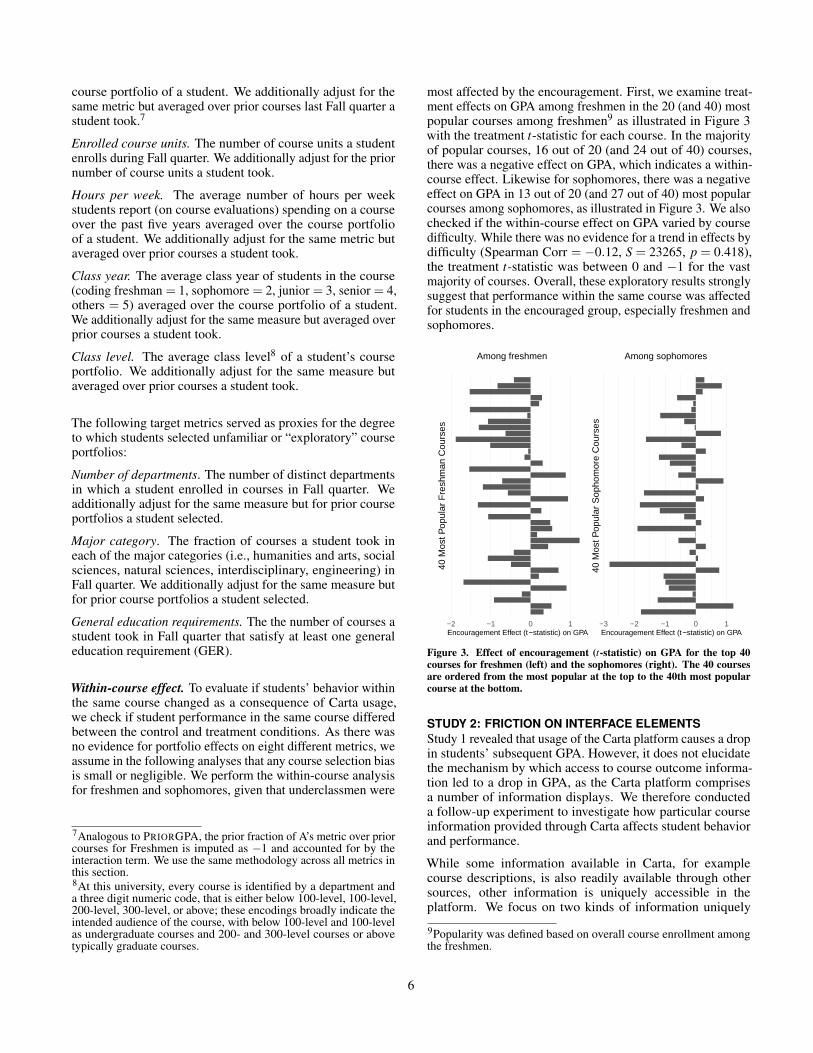
most affected by the encouragement. First, we examine treat-ment effects on GPA among freshmen in the 20 (and 40) mostpopular courses among freshmen9 as illustrated in Figure 3with the treatment t-statistic for each course. In the majorityof popular courses, 16 out of 20 (and 24 out of 40) courses,there was a negative effect on GPA, which indicates a within-course effect. Likewise for sophomores, there was a negativeeffect on GPA in 13 out of 20 (and 27 out of 40) most popularcourses among sophomores, as illustrated in Figure 3. We alsochecked if the within-course effect on GPA varied by coursedifficulty. While there was no evidence for a trend in effects bydifficulty (Spearman Corr = −0.12, S = 23265, p = 0.418),the treatment t-statistic was between 0 and −1 for the vastmajority of courses. Overall, these exploratory results stronglysuggest that performance within the same course was affectedfor students in the encouraged group, especially freshmen andsophomores.
−2 −1 0 1Encouragement Effect (t−statistic) on GPA
40 M
ost P
opul
ar F
resh
man
Cou
rses
Among freshmen
−3 −2 −1 0 1Encouragement Effect (t−statistic) on GPA
40 M
ost P
opul
ar S
opho
mor
e C
ours
es
Among sophomores
Figure 3. Effect of encouragement (t-statistic) on GPA for the top 40courses for freshmen (left) and the sophomores (right). The 40 coursesare ordered from the most popular at the top to the 40th most popularcourse at the bottom.
STUDY 2: FRICTION ON INTERFACE ELEMENTSStudy 1 revealed that usage of the Carta platform causes a dropin students’ subsequent GPA. However, it does not elucidatethe mechanism by which access to course outcome informa-tion led to a drop in GPA, as the Carta platform comprisesa number of information displays. We therefore conducteda follow-up experiment to investigate how particular courseinformation provided through Carta affects student behaviorand performance.
While some information available in Carta, for examplecourse descriptions, is also readily available through othersources, other information is uniquely accessible in theplatform. We focus on two kinds of information uniquely
9Popularity was defined based on overall course enrollment amongthe freshmen.
6

accessible in Carta that are particularly relevant for students’motivation, ability to self-regulate, and ultimately courseoutcomes: the Performance card containing information onthe grade distribution of a course, and the Intensity cardcontaining information on the number of hours per week spenton the course that students self-reported on end-of-courseevaluations. In our second experiment, we introduce “friction”for students to be able to access the Performance and Intensitycards in Carta. Our goal is to understand the influencethat access to information in these panels has on students’subsequent GPA. We therefore registered the followingconfirmatory hypotheses for this study, consistent with RQ1as well as H1 in the encouragement design:
H3. Increased friction in accessing prior grade informationaffects students’ GPA at the end of the subsequent quarter.H4. Increased friction in accessing prior intensity informationaffects students’ GPA at the end of the subsequent quarter.
As in Study 1, we carry out an extensive exploratory analysisafter testing these hypotheses. Once again, we attempt todisentangle the extent to which changes in GPA are due toeither portfolio effects or within-course effects for either of thetwo treatments in this study. We are also able to examine theinteraction effect of providing different combinations of gradeand intensity information because we designed the experimentwith a 2 × 2 factorial structure.
MethodParticipantsParticipants in this study were all undergraduate students at theuniversity who enrolled in classes in Fall 2017-18, applyingthe same exclusions as in Study 1: for instance, we includeincoming first-year students, but exclude students matriculatedat year five or above. Additionally, we exclude students whoremained unexposed to the experimental manipulation becausethey never logged into Carta in Fall 2017-2018. The total studysample was N = 5989 students.
ProcedureOur study used a 2 × 2 design, such that participants wererandomly assigned to one of the three treatment conditions ora control condition with equal probability. We confirmed thatrandomization was balanced on observable covariates (e.g.,students’ class year). The experiment was launched on July26, 2017, and conducted through the end of the Fall quarteron December 16, 2017.
To enable the experiment we added a feature to the Carta inter-face to collapse and expand information cards; see Figure 1.Recall that the Performance card contains information on priorgrade outcomes, while the Intensity card contains informationon the hours per week students self-reported spending on thecourse (from end-of-quarter course evaluations). In the controlcondition, both the Performance card and Intensity card in theCarta interface were collapsed by default on every course pagethe student visited. We compare the control against three treat-ment conditions with the following default presentations: (i)Performance card expanded and Intensity card collapsed; (ii)
Performance card collapsed and Intensity card expanded; and(iii) both cards expanded. If a card was collapsed by design, astudent would need to click anew on every page visit to expandthe card. All other cards defaulted to being expanded on pagevisits.
Throughout our analysis, we refer to an expanded Performancecard as grade visibility, and an expanded Intensity card as in-tensity visibility. Note that with our definitions, the controlcondition in this study is a natural analog to the control condi-tion in the encouragement design: in both controls, the defaultexperience is that students have less exposure to prior courseoutcome information than in the treatment conditions.
Outcome and covariate measuresThe measures are identical to those in Study 1, except that ourtreatment indicators in this study are GRADEVISIBILITY, abinary variable denoting whether grades are visible by default(1) or not (0), and INTENSITYVISIBILITY, a binary variabledenoting whether intensity information is visible by default(1) or not (0).
PreregistrationWe preregistered our study on OSF (https://osf.io/shkcn/).We note that in our preregistration, we registered hypothesistests with the binary outcome measure indicating whether thefinal Fall quarter GPA of a student is greater than versus lessthan or equal to the previous year’s median Fall GPA at theuniversity. However, to maintain consistency with our priorstudy results as well as our exploratory analysis, we reportresults from linear regression in the main text. Importantly,logistic regression with the preregistered binary outcome vari-able yields identical significance results to the linear regressionresults we present here. Results of the logistic regression arereported in a footnote in the confirmatory analysis section.
Results
Descriptive statisticsAnalogous to the encouragement design, Table 3 providesdescriptive statistics for multiple indicators of Carta usage forstudents across the treatment condition. Indicators include thenumber of students who sign into Carta, active days on Carta,searching, and pinning. We observe that all groups were fairlysimilar on these basic descriptive statistics.
This table also provides information on the rates at which thevarious cards were expanded by students. In the control condi-tion, students expanded the Performance card more frequentlythan the Intensity card. The same remains true even if wecompare across conditions: students with a collapsed Perfor-mance card opened it more frequently than students with acollapsed Intensity card. However, students expanded bothcards in substantial numbers in the relevant conditions. Thisobserved behavior suggest that students saw value in the datacontained within these cards.
Confirmatory analysisWe use OLS regression with and without covariate-adjustmentfor observables such as major and class year (same as in Study
7

Average number ofFraction Fraction
Group N Active Search- Pins of grade of intensitydays on es cards cards
Carta opened opened
Control 1508 14.0 49.0 11.4 0.47 0.32Group (12.2) (66.2) (17.7) (0.32) (0.27)
Grade 1495 14.5 52.4 11.7 − 0.23Visibility (13.6) (75.2) (20.0) − (0.25)
Intensity 1496 13.8 49.2 12.4 0.43 −Visibility (12.3) (65.7) (22.0) (0.42) −
Both 1490 14.3 51.9 12.3 − −Treatments (13.1) (82.6) (27.2) − −
Table 3. Activity levels of students by the experimental condition be-tween the enrollment opening on August 1, 2017 and December 16, 2017,the undergraduate housing closing date of the Fall quarter. The num-bers in parentheses indicate standard deviations.
(1) (2) (3)
GRADEVISIBILITY −0.02 (0.02) −0.05 (0.02)** −0.01 (0.03)INTENSITYVISIBILITY 0.01 (0.02) 0.03 (0.02) 0.06 (0.03)**
GRADEV×INTENSITYV −0.07 (0.04)*
YEAR 3 0.09 (0.04)** 0.09 (0.04)**
YEAR 2 0.03 (0.05) 0.03 (0.05)YEAR 1 0.36 (0.11) 0.36 (0.11)***
PRIORGPA 0.84 (0.07)*** 0.84 (0.07)***
PRIORGPA ×YEAR 3 −0.45 (0.08)*** −0.45 (0.08)**
PRIORGPA ×YEAR 2 −0.55 (0.07)*** −0.55 (0.07)***
PRIORGPA ×YEAR 1 −0.82 (0.07)*** −0.82 (0.07)***
Intercept 0.17 (0.02)*** 0.33 (0.04)*** 0.29 (0.05)***
Robust standard errors shown in parentheses; * p < 0.1, ** p < 0.05, *** p < 0.01
Table 4. Linear regression output for estimating the grade visibil-ity effect and intensity visibility on FALLGPA without adjusting forcovariates (1) and with covariate-adjustment and fixed effects forMAJOR (2); added in (3) is the interaction term GRADEVISIBIL-ITY×INTENSITYVISIBILITY.
1). For our confirmatory analysis, we do not include an inter-action term between the treatment indicators GRADEVISIBIL-ITY and INTENSITYVISIBILITY, since our hypotheses involveeach of these effects on their own (cf. H3 and H4). (In ourexploratory analysis, we also study the interaction betweenthese treatment indicators.)
We find that grade visibility caused a significant decrease inGPA (t =−2.31, p = 0.021), whereas intensity visibility hadno significant effect on GPA (t = 1.38, p = 0.166). Thus wefind evidence in support of H3 but not H4.10 Table 4 presentslinear regression outputs for each of these effects in detail.
Exploratory analysisPortfolio effect. We use the same set of eight metrics as inStudy 1 to measure “difficulty” and “familiarity” in a student’scourse portfolio. We also use the same regression specification,except that we now have two treatment indicators: GRADE-VISIBILITY and INTENSITYVISIBILITY. Just as in the en-couragement design, none of the metrics exhibited statistically
10Similarly, using logistic regression controlling for covariates, thegrade visibility treatment led to a significant decrease in GPA (z =−2.09, p = 0.037), but not the intensity visibility treatment (z =−0.077, p = 0.938).
significant differences between the experimental conditions(all p > 0.3) with a handful of weak effects (p > 0.1) for theINTENSITYVISIBILITY treatment on enrolled course units,hours per week of enrolled courses, the distinct number ofdepartments of courses, and the fraction of courses satisfyinggeneral requirements.
Within-course effect. We carry out a parallel analysis to that ofthe within-course analysis of the encouragement design. As inFigure 3, we examine the grade visibility treatment t-statisticfor each course in the most popular 20 (and 40) courses amongeach class year. In the majority of popular freshman courses,13 out of 20 (and 28 out of 40), there was a negative effect onGPA among freshmen, which indicates a within-course effect.Likewise for sophomores, there was a negative effect on GPAin 16 out of 20 (and 28 out of 40) courses among sophomores.As for the intensity visibility treatment, analogous within-course analysis of t-statistics among popular courses yieldsbalanced positive and negative values. This result is to beexpected given that the intensity visibility treatment did notsignificantly affect overall GPA.
Treatment interaction. Our 2 × 2 factorial design allows usto study the interaction between grade visibility and intensityvisibility. We consider the same regression specification asabove, but now include the interaction term GRADEVISIBIL-ITY × INTENSITYVISIBILITY (see Table 4 and Figure 4).Including the interaction term yields several intriguing results.First, relative to the pure control condition (no grade or in-tensity visibility), adding grade visibility does not affect GPA(t = −0.35, p = 0.727), but adding intensity visibility has apositive effect on GPA (t = 2.31, p = 0.021). However, if bothgrade and intensity information are made visible, the negativeinteraction term (t =−2.96, p = 0.003) effectively cancels outthe positive main effect of intensity visibility (see Fig. 4).
0.00
0.05
0.10
0.15
0.20
NeitherVisible
GradeVisible
IntensityVisible
Grade & IntensityVisible
Nor
mal
ized
GPA
Figure 4. Covariate-adjusted normalized GPA estimates from model (3)in Table 4 by experimental condition. Error bars are ±1 robust stan-dard error. Visible course information was expanded in the interface bydefault.
Taken together, the effects paint a subtle picture. First, theresults suggest that much of the explanation for the overalleffect of grade visibility comes from the effect of grade vis-ibility among those students who also experienced intensityvisibility by default. Second, the results suggest that intensity
8
visibility has a positive effect on subsequent GPA, but thatthis positive effect is countervailed by the additional inclusionof grade visibility. Overall, the effect of the full treatment(both grade and intensity visibility) relative to the full control(neither grade nor intensity visibility) is negative albeit notstatistically significant.
DISCUSSIONStudents actively seek information about courses and courseoutcomes as they consider and choose among their academicoptions. Institutional provision of systematic information de-scribing how prior students fared in similar offerings is apotentially powerful tool for influencing academic choice sets,work expectations, study activity, and grade outcomes. Thisstudy was designed as an initial inquiry into this potential.
Our results consistently suggest that exposure to prior courseoutcome information influences student behavior and subse-quent course performance (cf. RQ1). Further, there is no evi-dence such exposure materially alters the portfolio of courseschosen by students (cf. RQ2), while we do find evidence thatthe behavior of students within courses is altered (cf. RQ3).Our finding that course outcome information influences coursegrades without substantially changing course selection addsfurther support to the conclusion reached by Main and Ost [13],who also did not observe portfolio effects, and stands in con-trast to the observed impact on course choice at Cornell [3,4].
One lens through which we may interpret this result is Pin-trich and Zusho’s [15] conceptual model of motivation andself-regulated learning in college classrooms. The provisionof access to systematic course outcome data can be conceptu-alized as expanding students’ grasp of the classroom contextby inducing information about historical grade distributions,time investment, and other factors. This may affect motiva-tional processes such as students’ efficacy beliefs about theirperformance in a course [2]. For example, knowing that acourse is leniently graded could raise students’ confidence intheir ability to earn a high grade. Official course informationmay also affect self-regulation via meta-cognitive processesinvolved in goal setting and strategic planning [21, 19]. Forexample, knowing how much time a course demands can helpstudents allocate their time to achieve personal goals. Together,motivational and self-regulatory processes affect choice, effort,and achievement outcomes, such as course selection, spendingmore or less time on homework, and ultimately GPA.
While expanding students’ grasp of the classroom context byinducing historical course information may have triggeredboth motivational and self-regulatory processes, it evidentlyonly changed effort regulation and achievement within courses.Results from Study 2 indicate that grade information has astronger influence on student achievement than time inten-sity information. This suggests that motivational processesshaping students’ sense of self-efficacy [2] with respect toparticular courses were dominant in the observed GPA effect;by contrast, time intensity information would be expected todirectly support self-regulatory planning processes [21, 19].To formally disentangle the role of these processes in shap-ing student behavior within courses, future research might
directly measure student perceptions using surveys and assessself-regulatory behavior from behavioral trace data collectedby learning management systems.
While our findings are robust and consistent, data limitationsmoderate the reach of our claims in several ways. First, ourstudy design prevents us from identifying the psychologicalmechanisms through which information about official courseoutcomes is translated into changed academic behavior andperformance. Course outcome information could influencebehavior through a variety of pathways, such as motivationalor self-regulatory processes. Our instruments in the present re-search are not granular enough to distinguish these pathways.
Second, our study observes the effects of access to outcomeinformation in the aggregate. Prior research suggests thatthere may be heterogeneity in responses to information bygender, race, and social class, because these social identitiesimplicate how students make sense of cues in the academicenvironment [12, 17]. An essential next step for this researchwill be to observe whether the magnitude, and perhaps eventhe direction, of effects of prior information on academicoutcomes varies with student demographic characteristics.
Third, we note the peculiarity of our case university, in whichmost students arrive with very strong academic preparation,enjoy a wealth of academic support services, and almost uni-formly graduate in a timely fashion. The effects of tools suchas Carta on student behavior may be quite different at schoolsserving students from a wider range of academic backgroundsor campuses with very different intramural information ecosys-tems.
Finally, in its current form our inquiry is unique to the U.S.academic world, in which students are expected to explorea wide variety of courses and decide on concentrations ofstudy midway through their undergraduate careers. The inter-play between received information about prior and subsequentacademic behavior may be different in systems that oblige stu-dents to commit to set programs of study upon matriculation.
CONCLUSIONOur two studies offer consistent evidence that knowledge ofthe distribution of prior students’ academic experiences causeschanges in behavior that, in the aggregate, produce lowerearned grades. This is a powerful insight for educators, be-cause it suggests that the presentation of currently availableinstitutional information can influence students’ academic be-haviors. Just how educators might use this insight to inform in-stitutional policy is ultimately a normative question. Educatorsmight decide that equity goals compel provision of informa-tion about course outcomes to all students because, without it,information access will vary substantially by students’ positionin peer networks [6] and likely exacerbate information dispar-ities by race and class [1]. At the same time, recognition thataccess to the grade attainments of prior students can depresssubsequent grade attainments might encourage educators to bevery thoughtful about how information is displayed on digitalplatforms and officially defined by campus leaders. Candiddiscussion of the presentation and interpretation of academicinformation might itself become a worthy pedagogical project:
9
an object lesson in the promise and risk inherent in any kindof systematic academic measurement [8, 9].
ACKNOWLEDGMENTSWe thank Michael S. Bernstein, Thomas Black, Sara Cina, Per-sis S. Drell, Harry J. Elam, Jr., Patricia J. Gumport, Monique H.Harrison, Arik Lifschitz, John C. Mitchell, Andreas Paepcke,Marissa E. Thompson, and Jennifer Widom for helpful feed-back and support, and student members of the Carta team fortheir substantial assistance.
REFERENCES1. Elizabeth A Armstrong and Laura T Hamilton. 2013.
Paying for the Party. Harvard University Press.
2. Albert Bandura. 1977. Self-efficacy: Toward a unifyingtheory of behavioral change. Psychological Review 84, 2(1977), 191.
3. Talia Bar, Vrinda Kadiyali, and Asaf Zussman. 2008.Quest for knowledge and pursuit of grades: information,course selection, and grade inflation. Available at SSRN:https://ssrn.com/abstract=1019580 orhttp://dx.doi.org/10.2139/ssrn.1019580 (2008).
4. Talia Bar, Vrinda Kadiyali, and Asaf Zussman. 2009.Grade information and grade inflation: The Cornellexperiment. The Journal of Economic Perspectives 23, 3(2009), 93–108.
5. Elizabeth Bruch and Fred Feinberg. 2017.Decision-making processes in social contexts. Annualreview of sociology 43 (2017), 207–227.
6. Daniel F Chambliss. 2014. How college works. HarvardUniversity Press.
7. Michael D Cohen, James G March, and Johan P Olsen.1972. A garbage can model of organizational choice.Administrative science quarterly (1972), 1–25.
8. Wendy Nelson Espeland and Michael Sauder. 2007.Rankings and reactivity: How public measures recreatesocial worlds. American journal of sociology 113, 1(2007), 1–40.
9. Wendy Nelson Espeland and Mitchell L Stevens. 2008. Asociology of quantification. European Journal ofSociology/Archives Européennes de Sociologie 49, 3(2008), 401–436.
10. Martin Fishbein. 1979. A theory of reasoned action:some applications and implications. (1979).
11. Valen E Johnson. 2006. Grade inflation: A crisis incollege education. Springer Science & Business Media.
12. René F Kizilcec, Glenn M Davis, and Geoffrey L Cohen.2017. Towards Equal Opportunities in MOOCs:Affirmation Reduces Gender & Social-ClassAchievement Gaps in China. In Proceedings of the ACMConference on Learning at Scale. ACM, 121–130.
13. Joyce B Main and Ben Ost. 2014. The impact of lettergrades on student effort, course selection, and majorchoice: A regression-discontinuity analysis. The Journalof Economic Education 45, 1 (2014), 1–10.
14. Ivana Ognjanovic, Dragan Gasevic, and Shane Dawson.2016. Using institutional data to predict student courseselections in higher education. The Internet and HigherEducation 29 (2016), 49–62.
15. Paul R Pintrich and Akane Zusho. 2007. Studentmotivation and self-regulated learning in the collegeclassroom. In The scholarship of teaching and learning inhigher education: An evidence-based perspective.Springer, 731–810.
16. Peter Smith. 1995. On the unintended consequences ofpublishing performance data in the public sector.International Journal of Public Administration 18, 2-3(1995), 277–310.
17. Claude M Steele. 1997. A threat in the air: Howstereotypes shape intellectual identity and performance.American psychologist 52, 6 (1997), 613.
18. Karl E Weick. 1976. Educational organizations as looselycoupled systems. Administrative science quarterly (1976),1–19.
19. Philip H Winne. 1995. Inherent details in self-regulatedlearning. Educational Psychologist 30, 4 (1995),173–187.
20. Wendy Wood. 2000. Attitude change: Persuasion andsocial influence. Annual Review of Psychology 51, 1(2000), 539–570.
21. Barry J Zimmerman and Dale H Schunk. 2001.Self-regulated learning and academic achievement:Theoretical perspectives. Routledge.
10