CENTURY PROPERTIES GROUP, INC. Analysts Presentation …€¦CENTURY PROPERTIES GROUP, INC. Analysts...
31
CENTURY PROPERTIES GROUP, INC. Analysts Presentation Q1 2013 Results 17 May 2013
Transcript of CENTURY PROPERTIES GROUP, INC. Analysts Presentation …€¦CENTURY PROPERTIES GROUP, INC. Analysts...
CENTURY PROPERTIES GROUP, INC. Analysts Presentation Q1 2013 Results
17 May 2013
1
These materials have been prepared by Century Properties Group Inc. (together with its subsidiaries,
the "Company” or “Century”), and have not been independently verified. No representation or warranty,
expressed or implied, is made and no reliance should be placed on the accuracy, fairness or
completeness of the information presented in these materials.
Neither the Company nor any of its affiliates, advisers or representatives accepts any liability
whatsoever for any loss howsoever arising from any information presented in these materials. The
information presented or contained in these materials is subject to change without notice and its
accuracy is not guaranteed. These materials contain statements that constitute forward-looking
statements. These statements include descriptions regarding the intent, belief or current expectations
of Century or its officers with respect to the consolidated results of operations and financial condition of
Century. These statements can be recognized by the use of words such as "targets", "believes",
"expects", "aims", "intends", "will", "may", "anticipates", "would", "plans", "could", "predicts", "projects",
"estimates", "foresees," or words of similar meaning. Such forward-looking statements are not
guarantees of future performance and involve risks and uncertainties, and actual results may differ
from those in the forward-looking statements as a result of various factors and assumptions. Century
has no obligation and does not undertake to revise forward-looking statements to reflect future events
or circumstances.
Representative examples of these factors and assumptions include (without limitation) general industry
and economic conditions, interest rate trends, cost of capital and capital availability, availability of real
estate properties, competition from other companies and venues for sale of projects, shifts in customer
demands, customers and partners, changes in operating expenses, including employee wages,
benefits and training, governmental and public policy changes and continued availability of financing in
the amounts and the terms necessary to support future business.
IMPORTANT NOTICE AND DISCLAIMER
1 INTRODUCTION 3
2 RESULTS OVERVIEW 4
3 FINANCIAL PERFORMANCE
& CAPITAL MANAGEMENT 6
4 CONSTRUCTION UPDATES 13
5 Q & A 19
6 ANNEX 20
CONTENTS
INTRODUCTION 1

RESULTS OVERVIEW 2
5
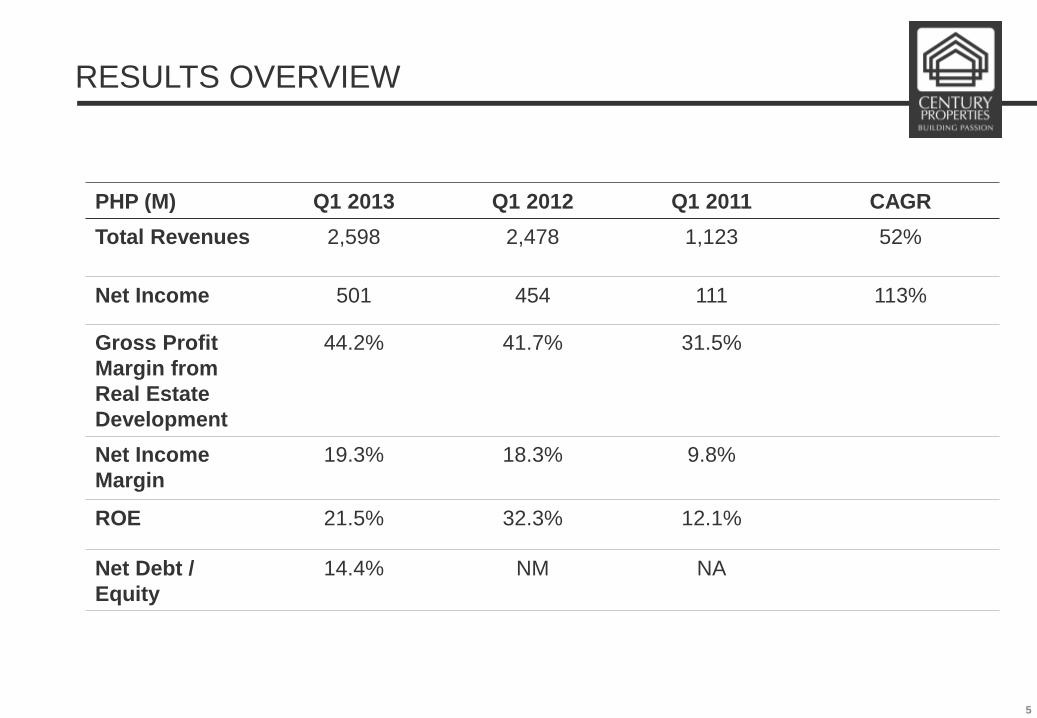
RESULTS OVERVIEW
PHP (M) Q1 2013 Q1 2012 Q1 2011 CAGR
Total Revenues 2,598 2,478 1,123 52%
Net Income 501 454 111 113%
Gross Profit
Margin from
Real Estate
Development
44.2% 41.7% 31.5%
Net Income
Margin
19.3% 18.3% 9.8%
ROE 21.5% 32.3% 12.1%
Net Debt /
Equity
14.4% NM NA
FINANCIAL PERFORMANCE AND CAPITAL MANAGEMENT
3
7
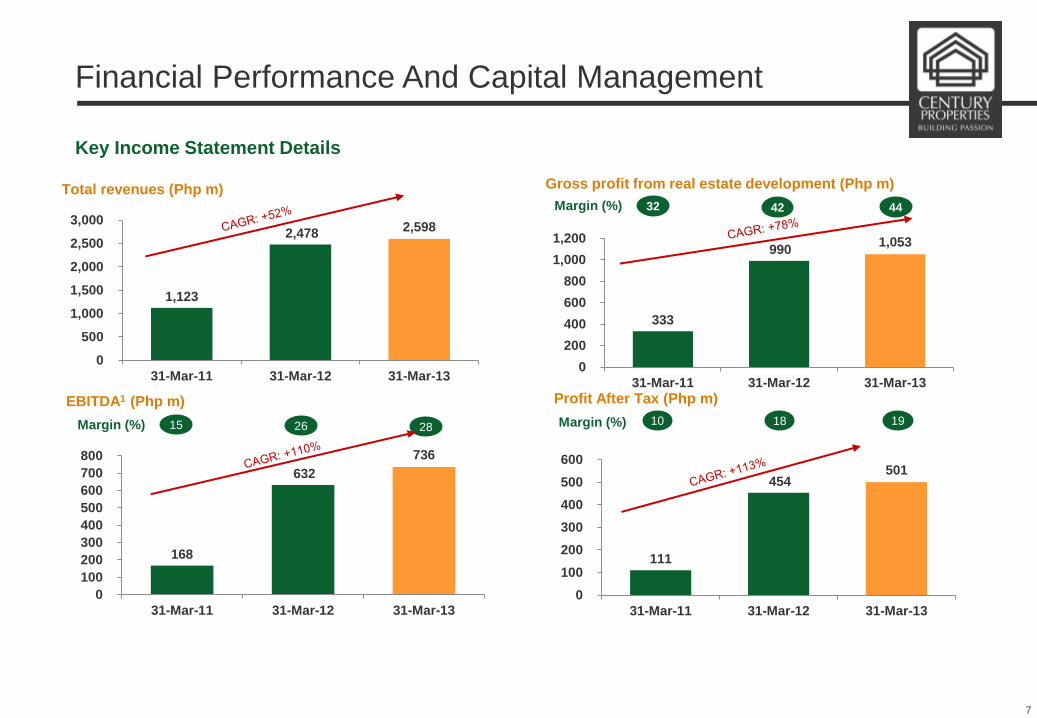
Financial Performance And Capital Management
Key Income Statement Details
Total revenues (Php m) Gross profit from real estate development (Php m)
Margin (%)
EBITDA1 (Php m)
Margin (%)
Profit After Tax (Php m)
Margin (%)
1,123
2,478 2,598
0
500
1,000
1,500
2,000
2,500
3,000
31-Mar-11 31-Mar-12 31-Mar-13
168
632
736
0
100
200
300
400
500
600
700
800
31-Mar-11 31-Mar-12 31-Mar-13
15 28 26
333
990 1,053
0
200
400
600
800
1,000
1,200
31-Mar-11 31-Mar-12 31-Mar-13
32 44 42
111
454 501
0
100
200
300
400
500
600
31-Mar-11 31-Mar-12 31-Mar-13
10 19 18
8
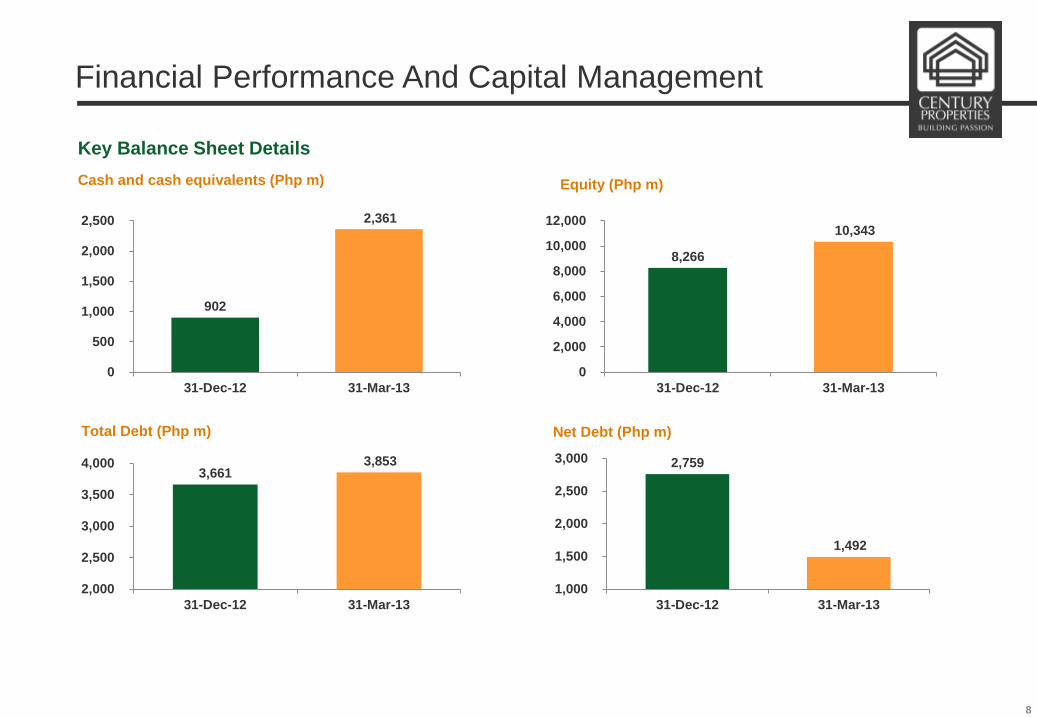
Financial Performance And Capital Management
Key Balance Sheet Details
Cash and cash equivalents (Php m) Equity (Php m)
Total Debt (Php m) Net Debt (Php m)
902
2,361
0
500
1,000
1,500
2,000
2,500
31-Dec-12 31-Mar-13
8,266
10,343
0
2,000
4,000
6,000
8,000
10,000
12,000
31-Dec-12 31-Mar-13
2,759
1,492
1,000
1,500
2,000
2,500
3,000
31-Dec-12 31-Mar-13
3,661 3,853
2,000
2,500
3,000
3,500
4,000
31-Dec-12 31-Mar-13
9
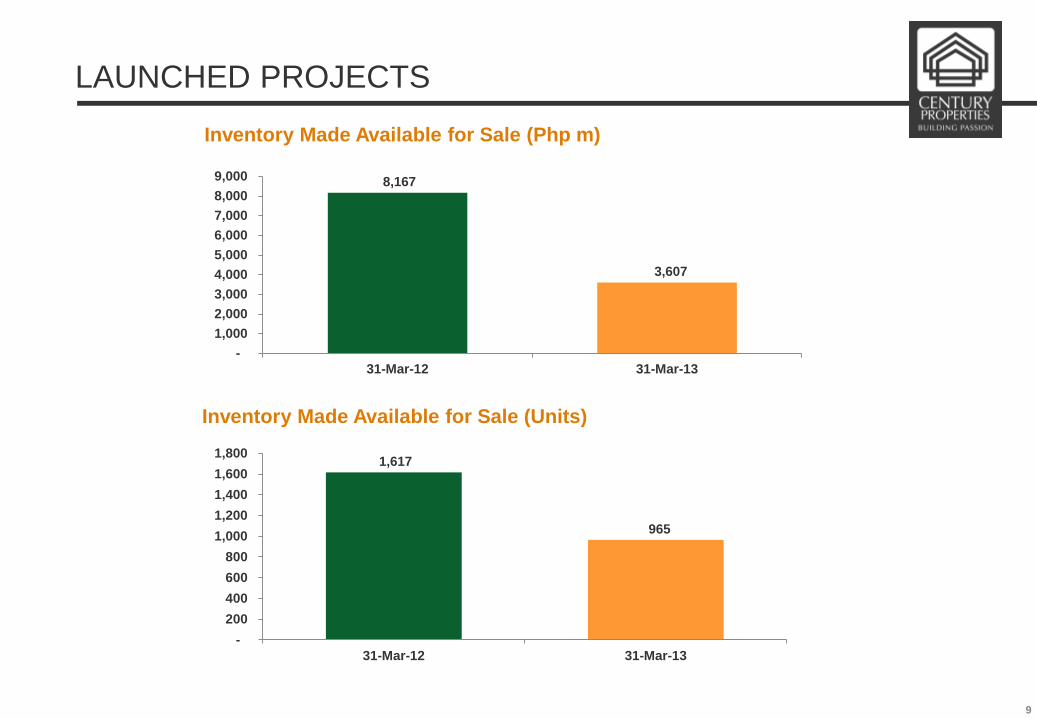
LAUNCHED PROJECTS
Inventory Made Available for Sale (Units)
Inventory Made Available for Sale (Php m)
8,167
3,607
-
1,000
2,000
3,000
4,000
5,000
6,000
7,000
8,000
9,000
31-Mar-12 31-Mar-13
1,617
965
-
200
400
600
800
1,000
1,200
1,400
1,600
1,800
31-Mar-12 31-Mar-13
10
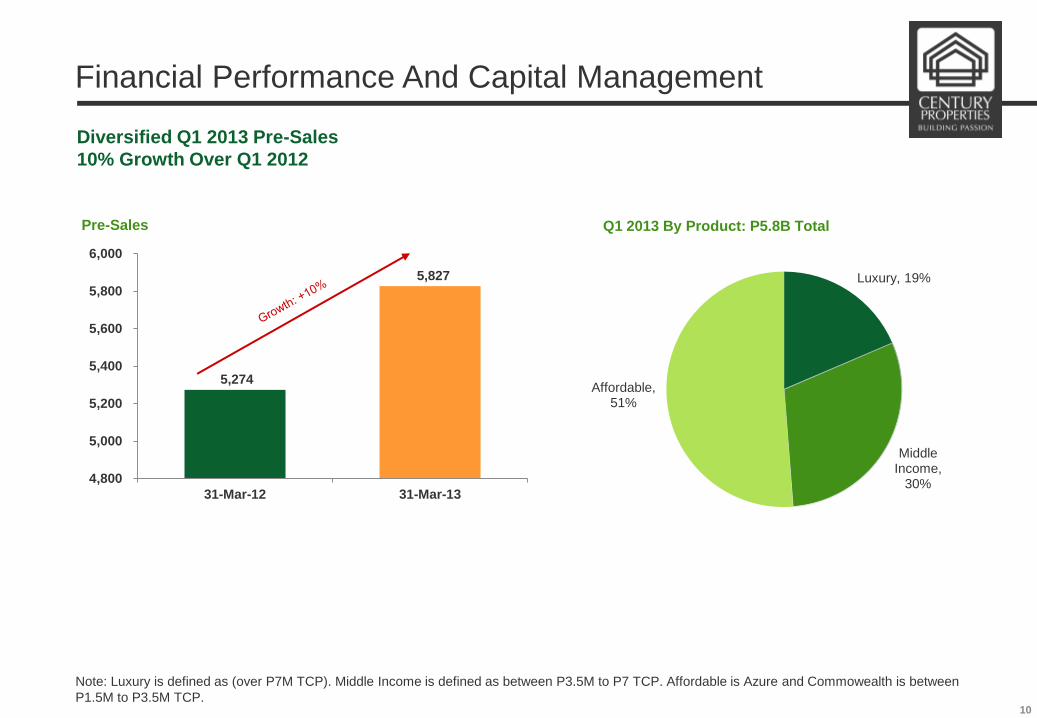
Diversified Q1 2013 Pre-Sales
10% Growth Over Q1 2012
Financial Performance And Capital Management
Q1 2013 By Product: P5.8B Total
Note: Luxury is defined as (over P7M TCP). Middle Income is defined as between P3.5M to P7 TCP. Affordable is Azure and Commowealth is between
P1.5M to P3.5M TCP.
Pre-Sales
5,274
5,827
4,800
5,000
5,200
5,400
5,600
5,800
6,000
31-Mar-12 31-Mar-13
Luxury, 19%
Middle Income,
30%
Affordable, 51%
11
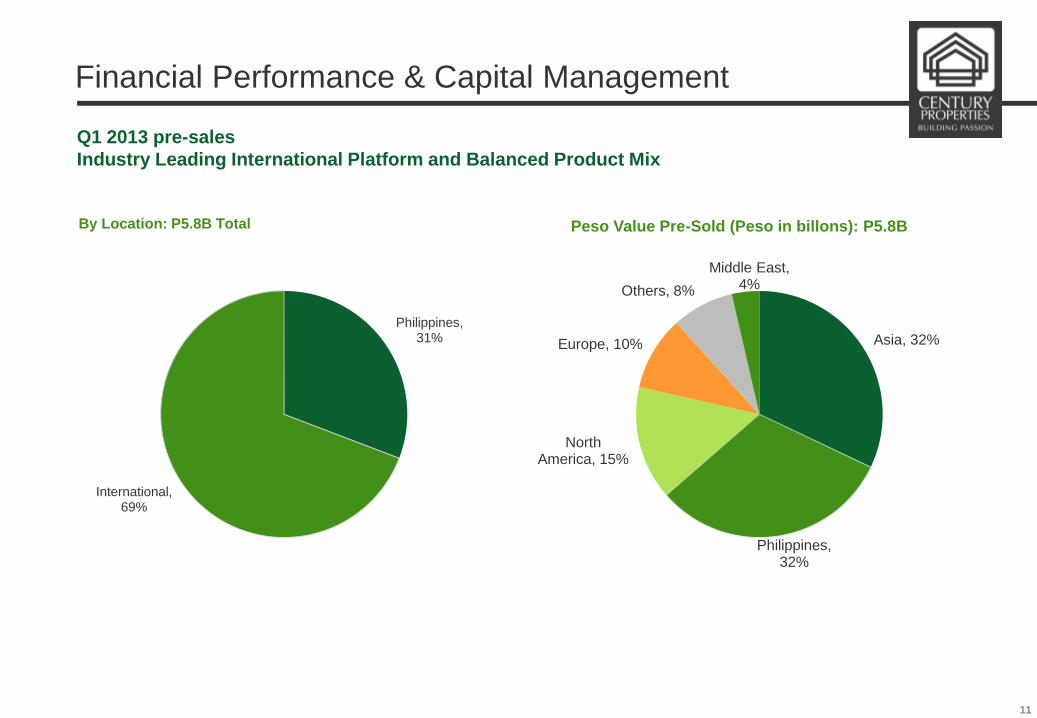
Q1 2013 pre-sales
Industry Leading International Platform and Balanced Product Mix
Financial Performance & Capital Management
By Location: P5.8B Total Peso Value Pre-Sold (Peso in billons): P5.8B
Philippines, 31%
International, 69%
Asia, 32%
Philippines, 32%
North America, 15%
Europe, 10%
Others, 8%
Middle East, 4%
12
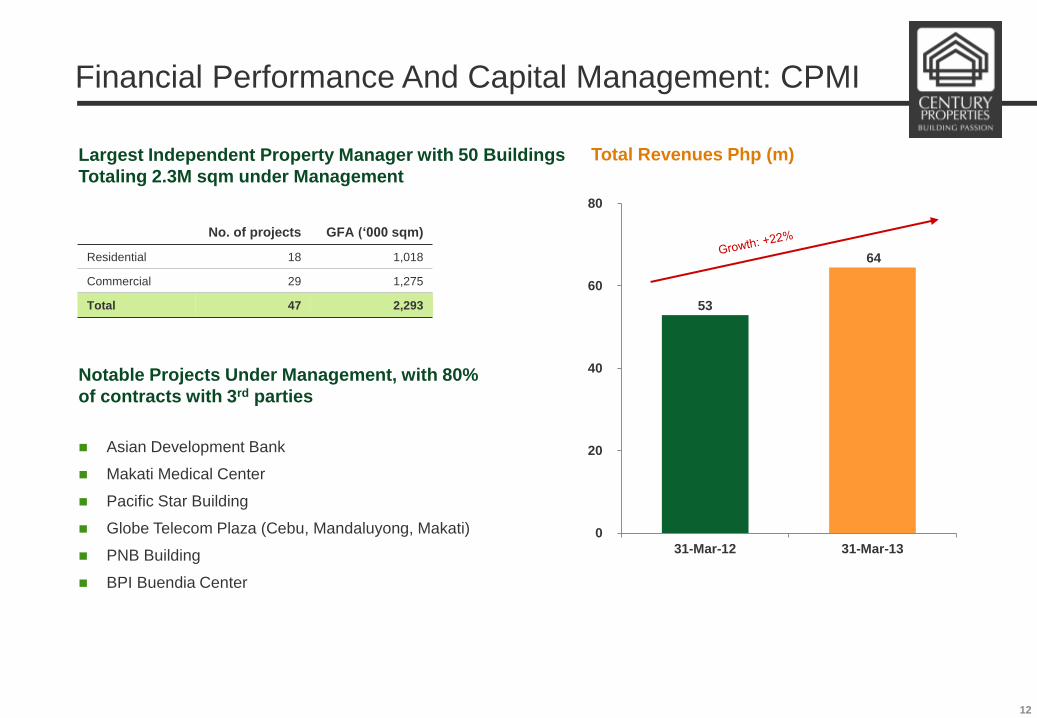
Financial Performance And Capital Management: CPMI
No. of projects GFA („000 sqm)
Residential 18 1,018
Commercial 29 1,275
Total 47 2,293
Asian Development Bank
Makati Medical Center
Pacific Star Building
Globe Telecom Plaza (Cebu, Mandaluyong, Makati)
PNB Building
BPI Buendia Center
Largest Independent Property Manager with 50 Buildings
Totaling 2.3M sqm under Management
Notable Projects Under Management, with 80%
of contracts with 3rd parties
Total Revenues Php (m)
53
64
0
20
40
60
80
31-Mar-12 31-Mar-13
13
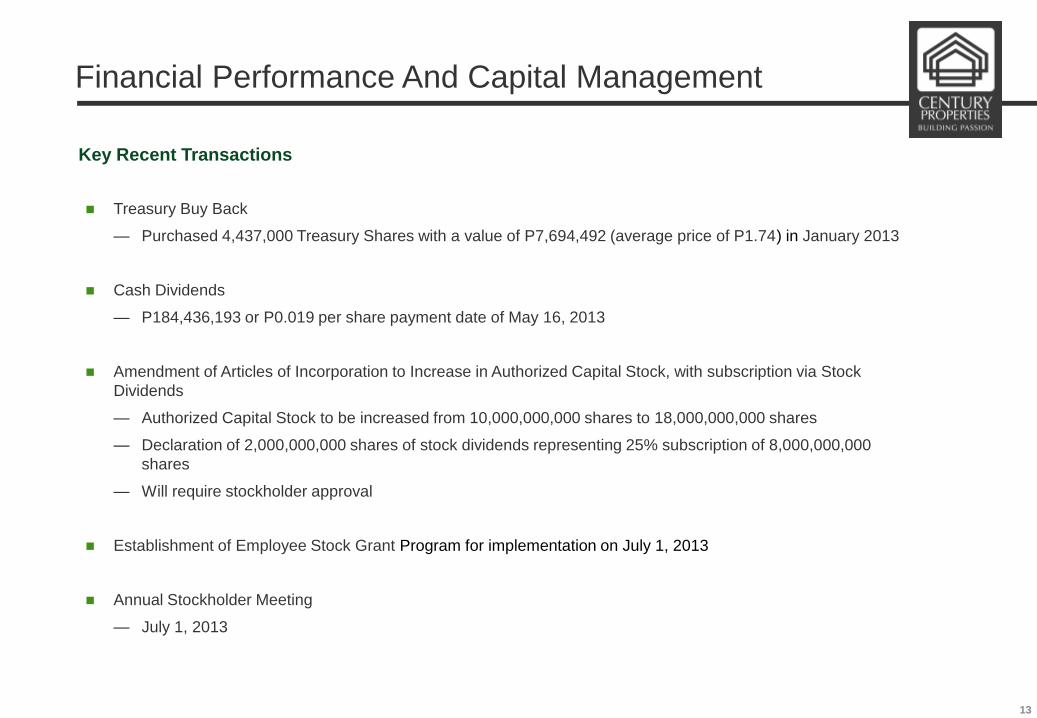
Financial Performance And Capital Management
Treasury Buy Back
— Purchased 4,437,000 Treasury Shares with a value of P7,694,492 (average price of P1.74) in January 2013
Cash Dividends
— P184,436,193 or P0.019 per share payment date of May 16, 2013
Amendment of Articles of Incorporation to Increase in Authorized Capital Stock, with subscription via Stock
Dividends
— Authorized Capital Stock to be increased from 10,000,000,000 shares to 18,000,000,000 shares
— Declaration of 2,000,000,000 shares of stock dividends representing 25% subscription of 8,000,000,000
shares
— Will require stockholder approval
Establishment of Employee Stock Grant Program for implementation on July 1, 2013
Annual Stockholder Meeting
— July 1, 2013
Key Recent Transactions
14
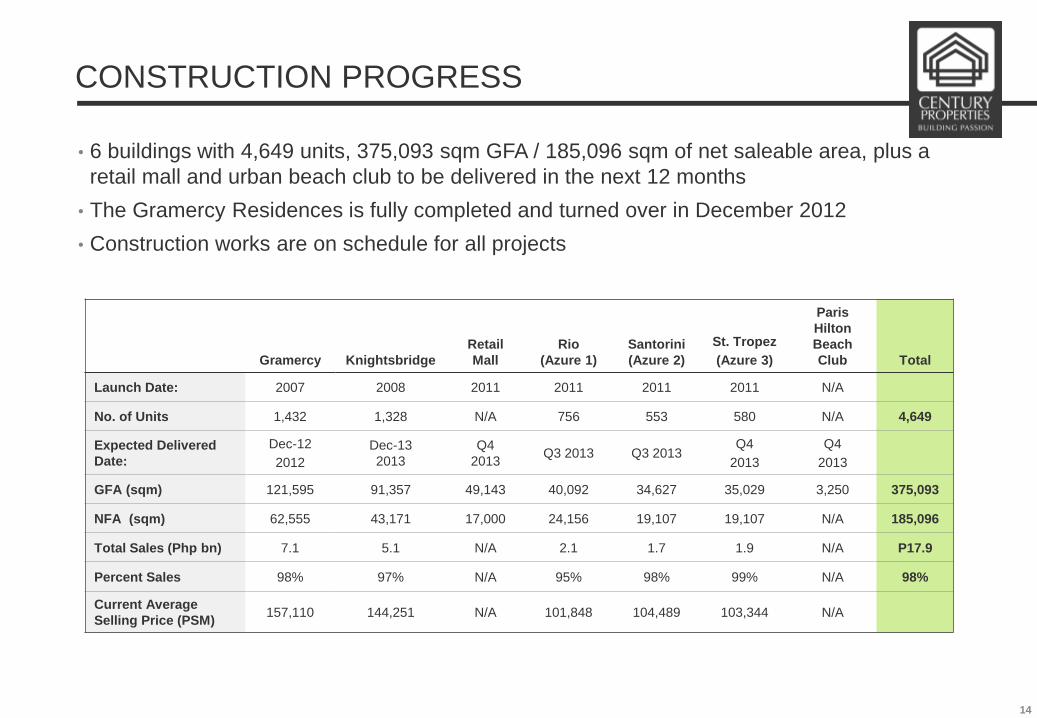
• 6 buildings with 4,649 units, 375,093 sqm GFA / 185,096 sqm of net saleable area, plus a
retail mall and urban beach club to be delivered in the next 12 months
• The Gramercy Residences is fully completed and turned over in December 2012
• Construction works are on schedule for all projects
CONSTRUCTION PROGRESS
Gramercy Knightsbridge
Retail
Mall
Rio
(Azure 1)
Santorini
(Azure 2)
St. Tropez
(Azure 3)
Paris
Hilton
Beach
Club Total
Launch Date: 2007 2008 2011 2011 2011 2011 N/A
No. of Units 1,432 1,328 N/A 756 553 580 N/A 4,649
Expected Delivered
Date:
Dec-12
2012
Dec-13
2013
Q4
2013 Q3 2013 Q3 2013
Q4
2013
Q4
2013
GFA (sqm) 121,595 91,357 49,143 40,092 34,627 35,029 3,250 375,093
NFA (sqm) 62,555 43,171 17,000 24,156 19,107 19,107 N/A 185,096
Total Sales (Php bn) 7.1 5.1 N/A 2.1 1.7 1.9 N/A P17.9
Percent Sales 98% 97% N/A 95% 98% 99% N/A 98%
Current Average
Selling Price (PSM) 157,110 144,251 N/A 101,848 104,489 103,344 N/A
CONSTRUCTION UPDATES
5
16
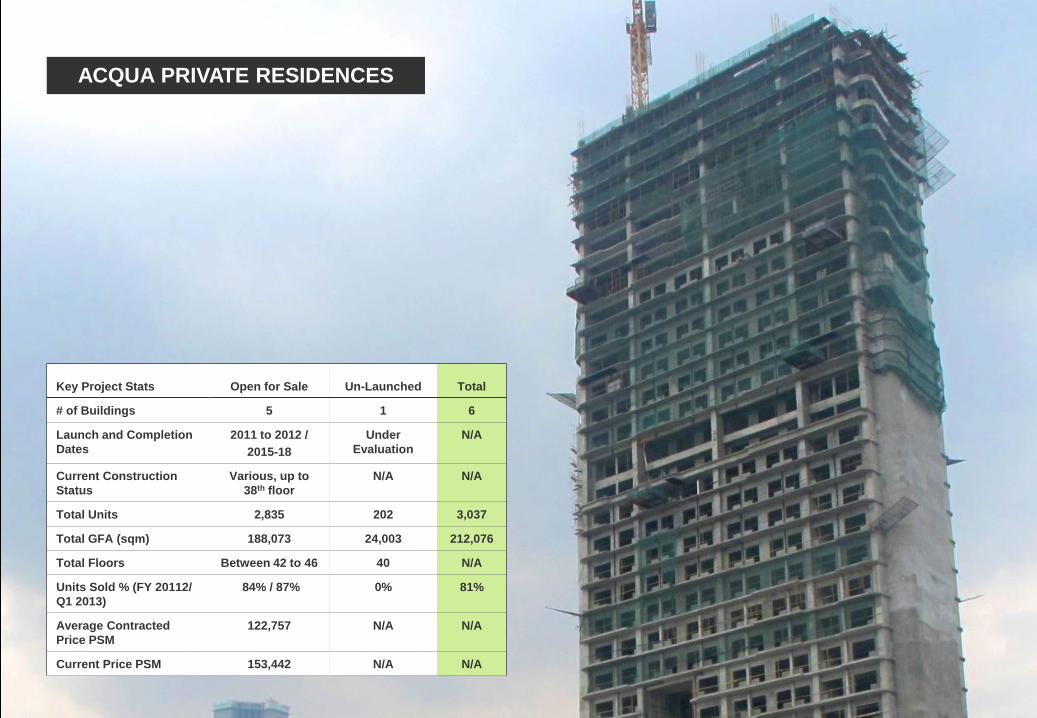
ACQUA PRIVATE RESIDENCES
Key Project Stats Open for Sale Un-Launched Total
# of Buildings 5 1 6
Launch and Completion
Dates
2011 to 2012 /
2015-18
Under
Evaluation
N/A
Current Construction
Status
Various, up to
38th floor
N/A N/A
Total Units 2,835 202 3,037
Total GFA (sqm) 188,073 24,003 212,076
Total Floors Between 42 to 46 40 N/A
Units Sold % (FY 20112/
Q1 2013)
84% / 87% 0% 81%
Average Contracted
Price PSM
122,757 N/A N/A
Current Price PSM 153,442 N/A N/A
17
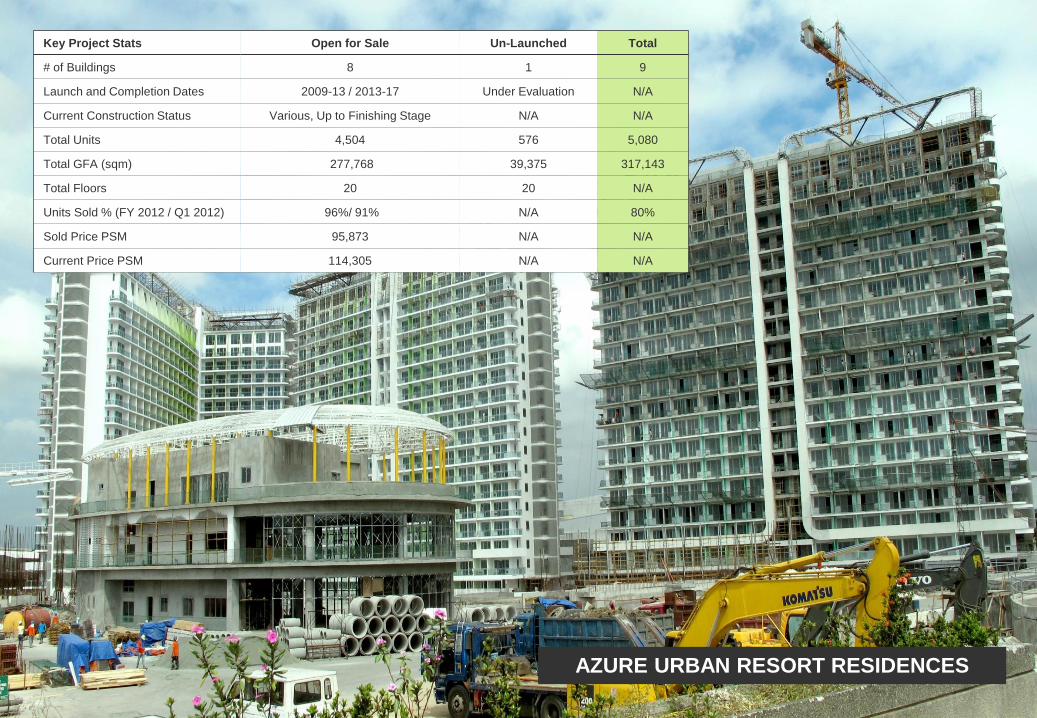
Key Project Stats Open for Sale Un-Launched Total
# of Buildings 8 1 9
Launch and Completion Dates 2009-13 / 2013-17 Under Evaluation N/A
Current Construction Status Various, Up to Finishing Stage N/A N/A
Total Units 4,504 576 5,080
Total GFA (sqm) 277,768 39,375 317,143
Total Floors 20 20 N/A
Units Sold % (FY 2012 / Q1 2012) 96%/ 91% N/A 80%
Sold Price PSM 95,873 N/A N/A
Current Price PSM 114,305 N/A N/A
AZURE URBAN RESORT RESIDENCES
18
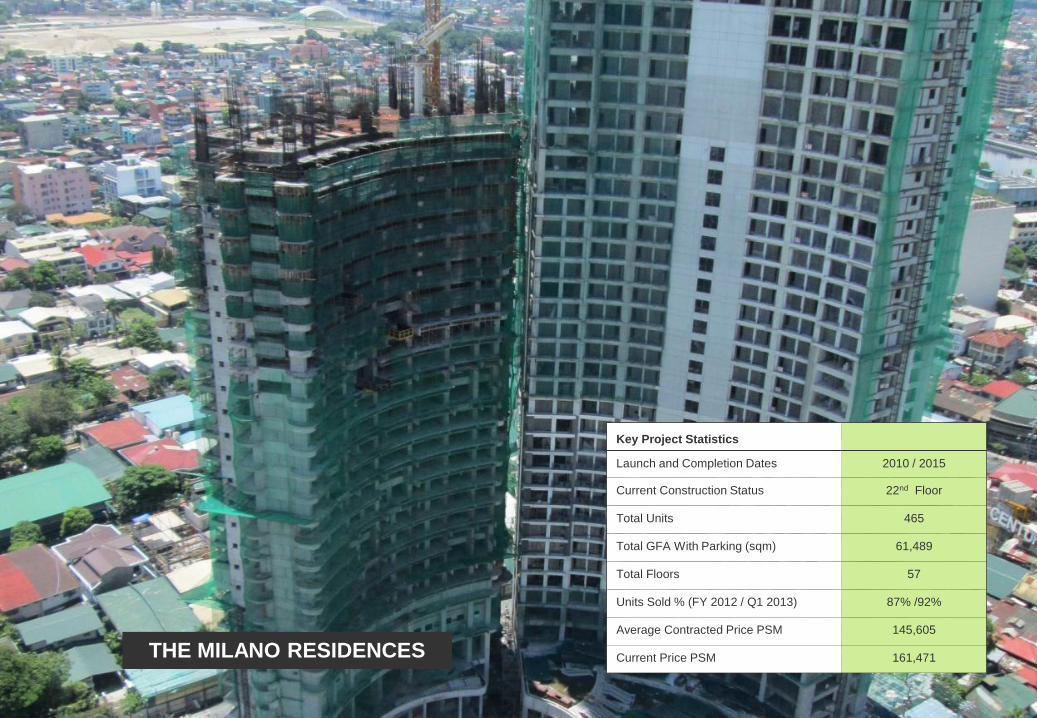
THE MILANO RESIDENCES
Key Project Statistics
Launch and Completion Dates 2010 / 2015
Current Construction Status 22nd Floor
Total Units 465
Total GFA With Parking (sqm) 61,489
Total Floors 57
Units Sold % (FY 2012 / Q1 2013) 87% /92%
Average Contracted Price PSM 145,605
Current Price PSM 161,471
19
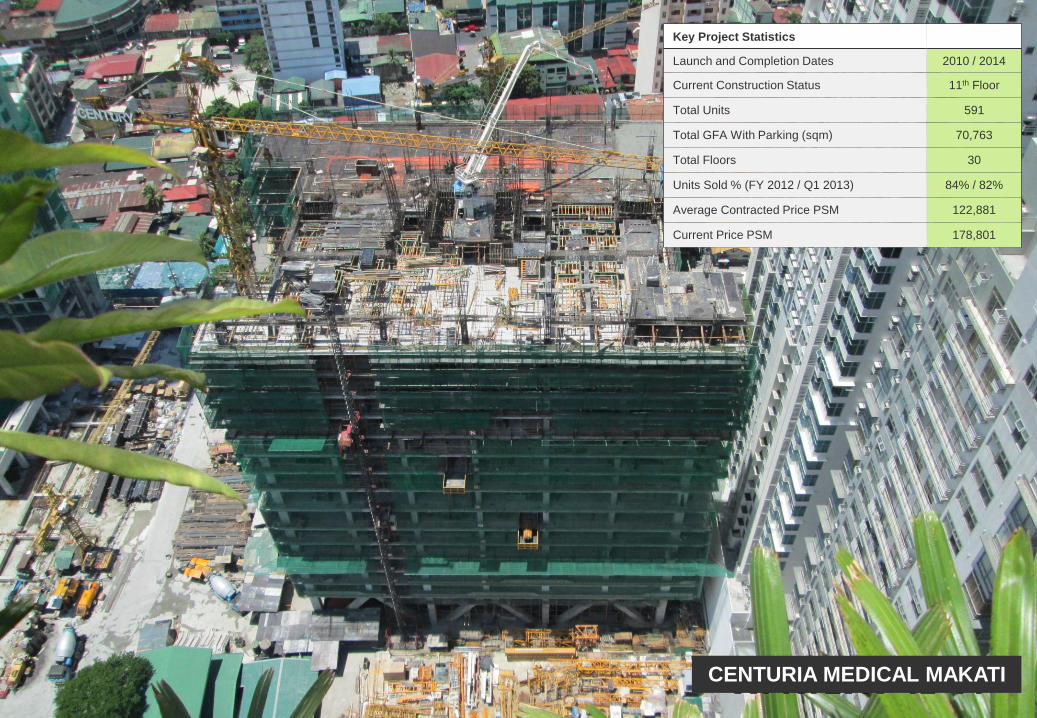
CENTURIA MEDICAL MAKATI
Key Project Statistics
Launch and Completion Dates 2010 / 2014
Current Construction Status 11th Floor
Total Units 591
Total GFA With Parking (sqm) 70,763
Total Floors 30
Units Sold % (FY 2012 / Q1 2013) 84% / 82%
Average Contracted Price PSM 122,881
Current Price PSM 178,801
20
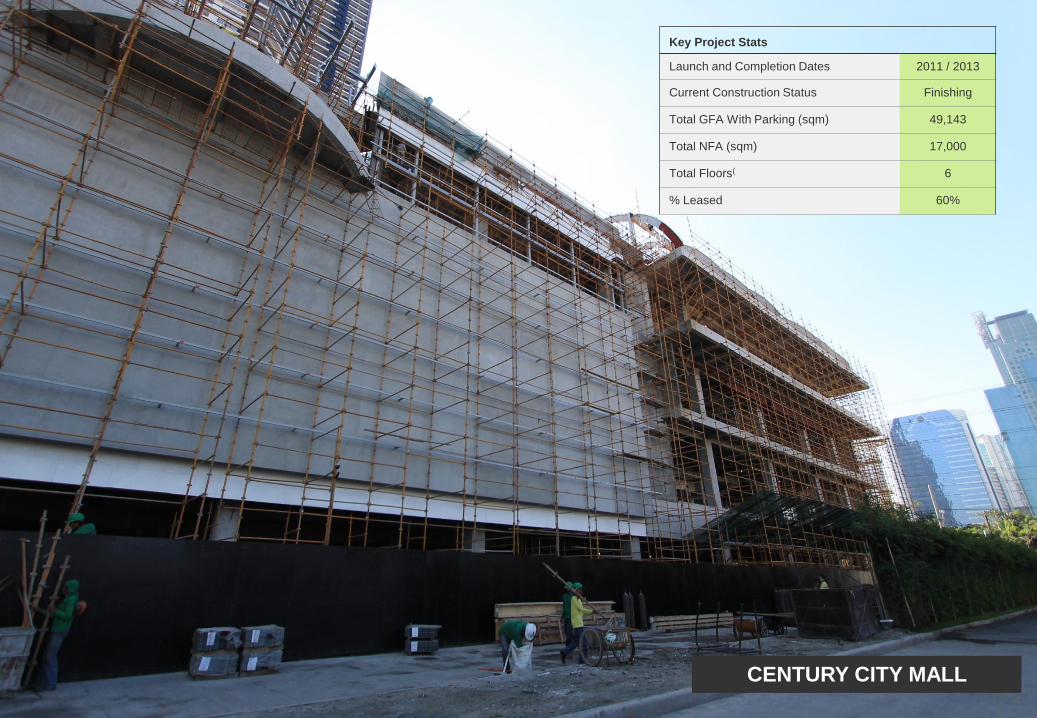
CENTURY CITY MALL
Key Project Stats
Launch and Completion Dates 2011 / 2013
Current Construction Status Finishing
Total GFA With Parking (sqm) 49,143
Total NFA (sqm) 17,000
Total Floors( 6
% Leased 60%
Q & A
5
ANNEX
6
23
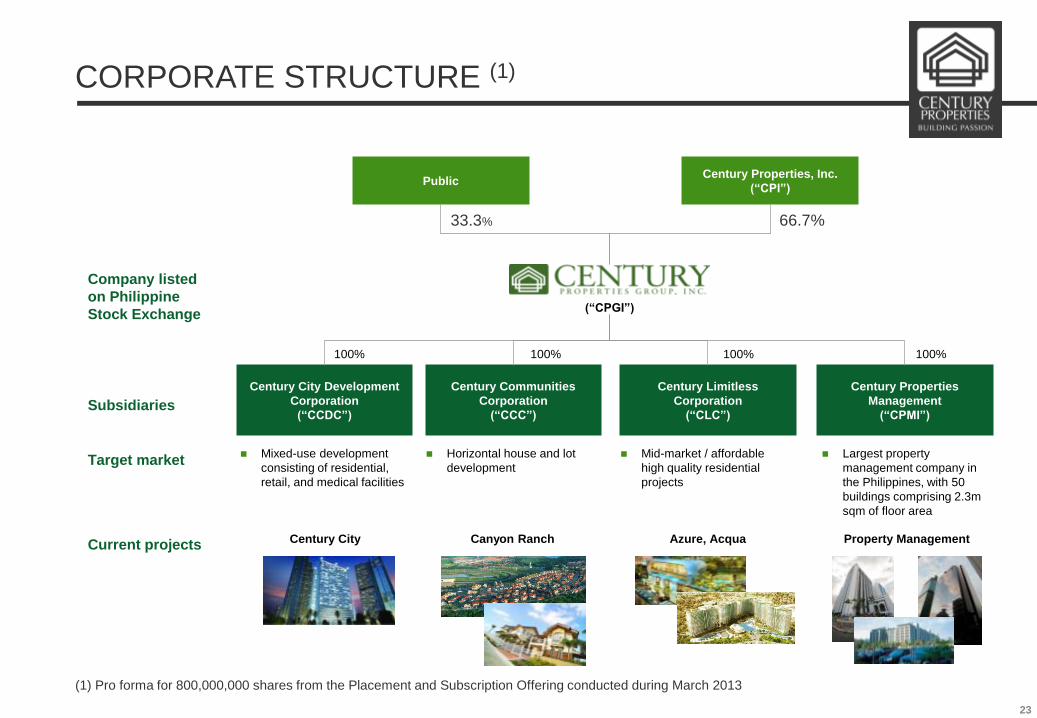
CORPORATE STRUCTURE (1)
Subsidiaries
Current projects
Century City Development
Corporation
(“CCDC”)
Century Communities
Corporation
(“CCC”)
Century Limitless
Corporation
(“CLC”)
Century Properties
Management
(“CPMI”)
Century City Canyon Ranch Azure, Acqua Property Management
33.3% 66.7%
Company listed
on Philippine
Stock Exchange
Public Century Properties, Inc.
(“CPI”)
(“CPGI”)
Target market Mixed-use development
consisting of residential,
retail, and medical facilities
Horizontal house and lot
development
Mid-market / affordable
high quality residential
projects
Largest property
management company in
the Philippines, with 50
buildings comprising 2.3m
sqm of floor area
100% 100% 100% 100%
(1) Pro forma for 800,000,000 shares from the Placement and Subscription Offering conducted during March 2013
24
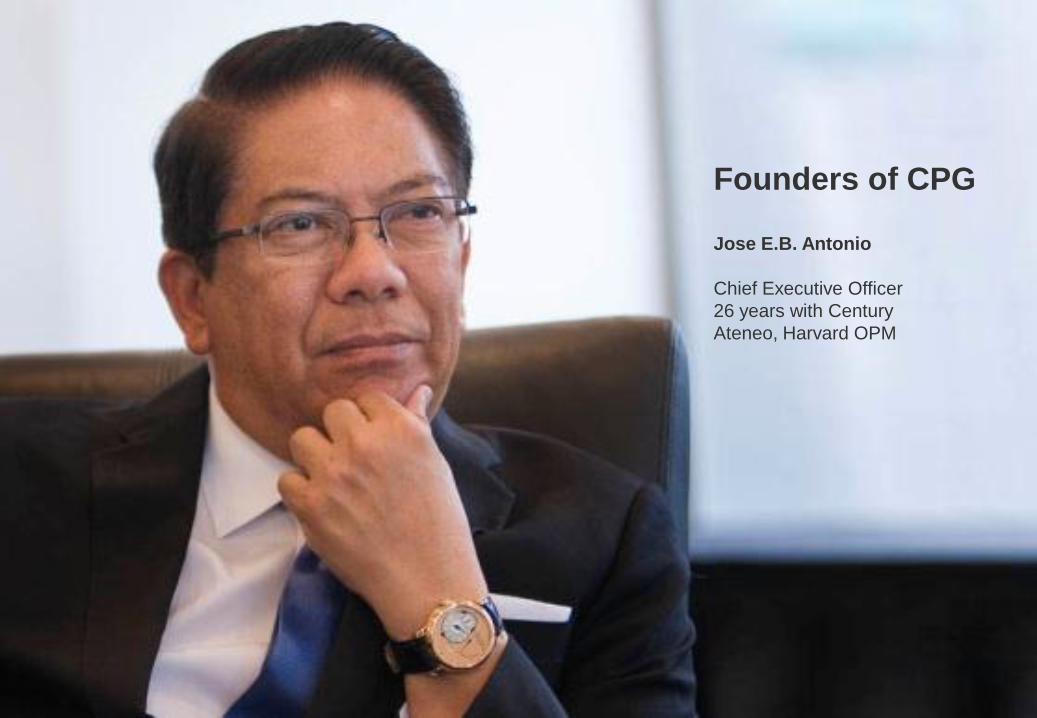
Founders of CPG
Founders of CPG
Jose E.B. Antonio
Chief Executive Officer
26 years with Century
Ateneo, Harvard OPM
25
Founders of CPG
Ricardo P. Cuerva
President of Century Project
Management Construction
(CPMCC), Director
26 years with Century
San Beda, Ateneo
26
Founders of CPG
Rafael G. Yaptinchay
Treasurer, Director
26 years with Century
Ateneo, AIM
27
2nd Generation of CPG
John Victor R. Antonio
Co-Chief Operating Officer
14 years with the Company
Wharton
BS & MBA
Projects:
Azure
Gramercy
Markets:
Middle East, Asia` Jose Marco R. Antonio
Co-Chief Operating Officer
13 years with the Company
Wharton
BS & MBA
Projects:
Knightsbridge, Canyon Ranch,
Acqua, Commonwealth
Markets:
Europe, UK, Australia
28
Jose Carlo R. Antonio
Chief Finance Officer
6 years with the
Company
Wharton BS
Jose Roberto R. Antonio
Managing Director
13 years with the Company
Northwestern & Stanford
MBA
Projects:
Milano & Trump
Markets:
North America
2nd Generation of CPG
29
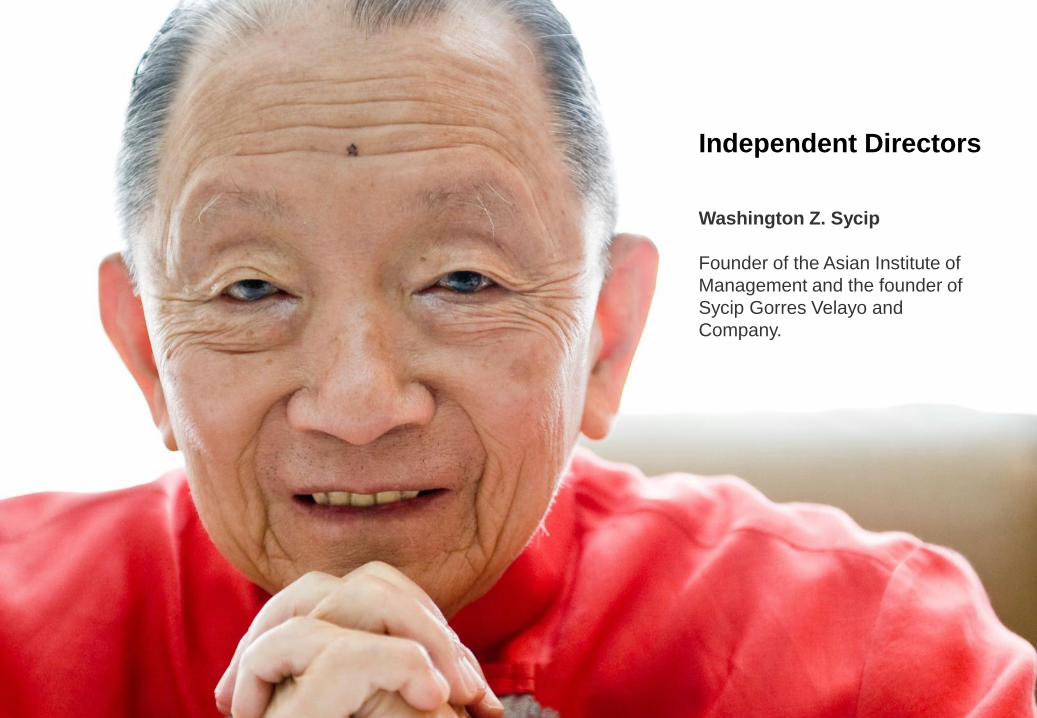
Independent Directors
Washington Z. Sycip
Founder of the Asian Institute of
Management and the founder of
Sycip Gorres Velayo and
Company.
30
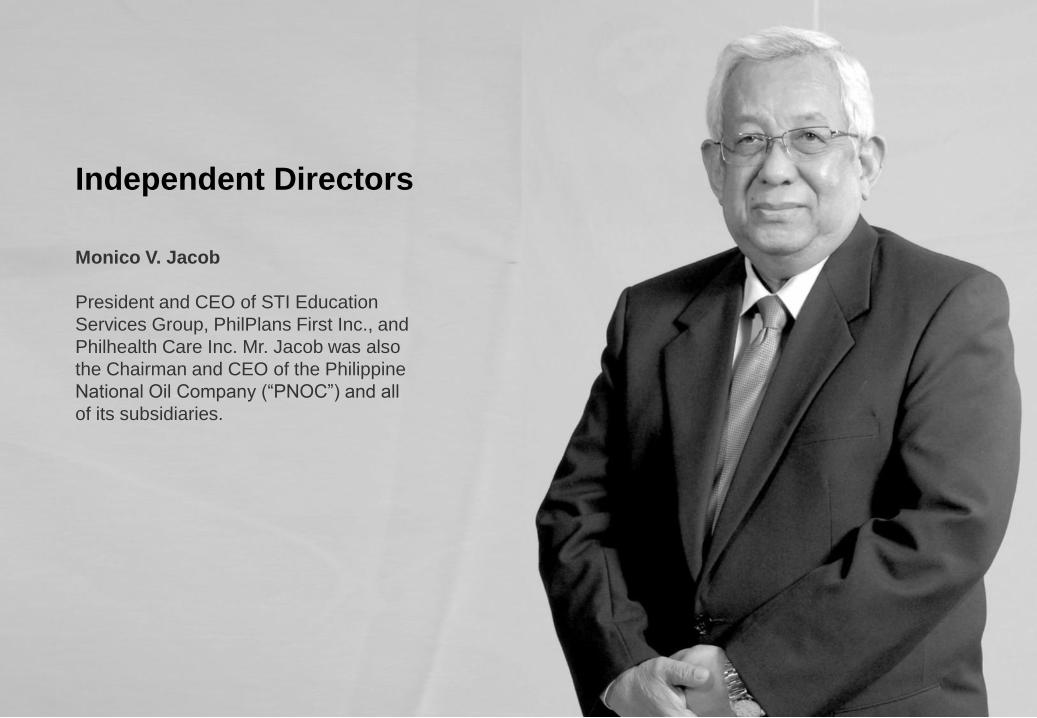
Independent Directors
Monico V. Jacob
President and CEO of STI Education
Services Group, PhilPlans First Inc., and
Philhealth Care Inc. Mr. Jacob was also
the Chairman and CEO of the Philippine
National Oil Company (“PNOC”) and all
of its subsidiaries.