
Centralizer Selection and Placement Basis for … placement basis to determine a centralizer...
19
Volant Products Inc. t +1 780.490.5185 4110 56 Avenue NW f +1 780.437.2187 Edmonton AB T6B 3R8 [email protected] Canada www.volantproducts.ca URTeC Control I.D. Number: 2460231 Centralizer Selection and Placement Basis for Overcoming Liner Running Challenges in Extended-Reach Horizontal Three Forks Shale Completions Authors: Jordan Long, Volant Products Inc.; Tyree Abshire, Enerplus Corporation; Dan Dall’Acqua, Volant Products Inc. Official version published online by URTeC is available at onepetro.org https://www.onepetro.org/conference-paper/URTEC-2460231- MS?sort=&start=0&q=centralizer+selection+and+placement&from_year=&peer_reviewed=&published_betwe en=&fromSearchResults=true&to_year=&rows=10 Unconventional Resources Technology Conference (URTeC) © 2016, reprinted by permission of URTeC, whose permission is required for further use.
Transcript of Centralizer Selection and Placement Basis for … placement basis to determine a centralizer...
Volant Products Inc. t +1 780.490.5185 4110 56 Avenue NW f +1 780.437.2187 Edmonton AB T6B 3R8 [email protected] Canada www.volantproducts.ca
URTeC Control I.D. Number: 2460231
Centralizer Selection and Placement Basis for Overcoming Liner Running Challenges in Extended-Reach Horizontal Three Forks
Shale Completions
Authors: Jordan Long, Volant Products Inc.; Tyree Abshire, Enerplus Corporation; Dan Dall’Acqua, Volant Products Inc.
Official version published online by URTeC is available at onepetro.org
https://www.onepetro.org/conference-paper/URTEC-2460231-MS?sort=&start=0&q=centralizer+selection+and+placement&from_year=&peer_reviewed=&published_betwe
en=&fromSearchResults=true&to_year=&rows=10
Unconventional Resources Technology Conference (URTeC) © 2016, reprinted by permission of URTeC, whose permission is required for further use.
URTeC: #2460231
Centralizer Selection and Placement Basis for Overcoming Liner Running Challenges in Extended-Reach Horizontal Three Forks Shale Completions Jordan Long*, Volant Products Inc.; Tyree Abshire, Enerplus Corporation; Dan Dall’Acqua, Volant Products Inc.
Copyright 2016, Unconventional Resources Technology Conference (URTeC) DOI 10.15530/urtec-2016-2460231
This paper was prepared for presentation at the Unconventional Resources Technology Conference held in San Antonio, Texas, USA, 1-3 August 2016.
The URTeC Technical Program Committee accepted this presentation on the basis of information contained in an abstract submitted by the author(s). The contents of this paper
have not been reviewed by URTeC and URTeC does not warrant the accuracy, reliability, or timeliness of any information herein. All information is the responsibility of, and, is
subject to corrections by the author(s). Any person or entity that relies on any information obtained from this paper does so at their own risk. The information herein does not
necessarily reflect any position of URTeC. Any reproduction, distribution, or storage of any part of this paper without the written consent of URTeC is prohibited.
Abstract
Increased focus on extending the reach of horizontal shale completions has led to new challenges that must be
overcome by technological advancements in the drilling and completion process. Longer laterals are contributing to
liner running challenges which can cause significant NPT and ultimately decrease the economic viability of wells
through increased costs or reductions in the extent of reservoir accessed. This paper presents a field case history
demonstrating the role of centralizers in successfully overcoming a liner running issue, and highlights an
opportunity for enabling longer-reach wells.
Enerplus had encountered liner running issues with one of its long-reach Three Forks shale wells, resulting in a
much longer-than-anticipated run time. One measure taken to address this challenge was to revisit centralization
practices for cemented horizontal liners. Two specific aspects of Enerplus’ liner configuration were reconsidered:
the centralizer selected and the placement of the centralizers along the length of the liner. Whereas centralizer
placement is typically based on pipe-to-borehole standoff considerations for zonal isolation after cementing, an
augmented engineering basis that also considered mitigation of buckling-induced side loads during running was
adopted. In a first field trial using this solution, torque-and-drag predictions were used together with this advanced
centralizer placement basis to determine a centralizer distribution.
Although only a modest increase in centralizer quantity was used compared to the prior offset well, the field trial
was very successful, and post-run analysis indicates significantly less drag and lockup potential relative to the prior
well as TD was reached. Significant savings in liner running time (on the order of 50%) were achieved relative to
the prior completion where issues were encountered.
Data gathered for comparison of these two very similar wells in the same field with different centralization solutions
provides an excellent basis for assessing Enerplus’ future centralizer configurations, and for assessing reach
limitations should there be a desire to extend future wells of this type beyond the 4,500 m horizontal length achieved
in this trial.
Introduction
Extended-reach drilling (ERD) wells are becoming more common in the industry in order to produce reservoirs in a
more economical way. However, there are numerous challenges associated with design and construction of these
wells, such as directional drilling optimization, equivalent circulation density (ECD) limitations, and casing running
issues. There is ongoing work to address these challenges and enable longer laterals through technological
advancement. This paper describes the development and field application of an advanced centralizer placement basis
for facilitating liner running in extended-reach completions by mitigating buckling-induced side loads during
installation. The paper begins by describing the liner running challenge in one well and then the development of the

URTeC 2460231 2
advanced centralizer placement basis. The field application of this basis for the liner run in the next well is then
described, followed by a comparison of the liner run performance characteristics between the first and second wells.
Description of Application and Associated Running Challenge
In 2013 and 2014, Enerplus carried out the construction of three ERD wells with three-mile laterals in the Williston
Basin in North Dakota. The drilling for these wells has previously been described by Nair, Bitzan, and McRobbie
(2016). During the production liner installation in the second of these three wells (referred to in this paper as the
“Pride” well), Enerplus encountered significant running challenges, which resulted in substantial non-productive
time (NPT) accumulated by the time the Total Depth (TD) was reached.
A schematic depicting the tubular geometries and lengths for the Pride well is shown in Figure 1. For installation,
the production liner string consisted of about 4,500 m of 114.3 mm 20.1 kg/m liner, 800 m of 101.6 mm 44.0 kg/m
HWDP above the liner, and 2,450 m of 101.6 mm 20.8 kg/m drill pipe above the HWDP. Phenolic solid-body
centralizers with an OD of 146.1 mm were used on the full length of the liner, at a spacing of 1 per joint (about 13.5
m spacing) from the liner hanger to the toe.
Figure 1. Well schematic for Pride well.
The measured hook load and depth history for the liner run on the Pride well is shown in Figure 2. The liner
progressed as expected until the 34 hour mark (at about 7,000 m MD), at which point significant running challenges
were encountered. The liner run progress slowed and the remaining run length of about 700 m required
approximately 60 hours to complete, a running pace more than ten times slower than the earlier parts of the run.

URTeC 2460231 3
After the 34 hour mark, reciprocation was required to work the pipe in the hole, which is illustrated by the wide span
in hook load measurements during this period. Rotation was not used to work the pipe as the anticipated torque to
rotate the string was larger than the liner string equipment torque limits.
Figure 2: Hook load and measured depth over time during liner run in Pride well.
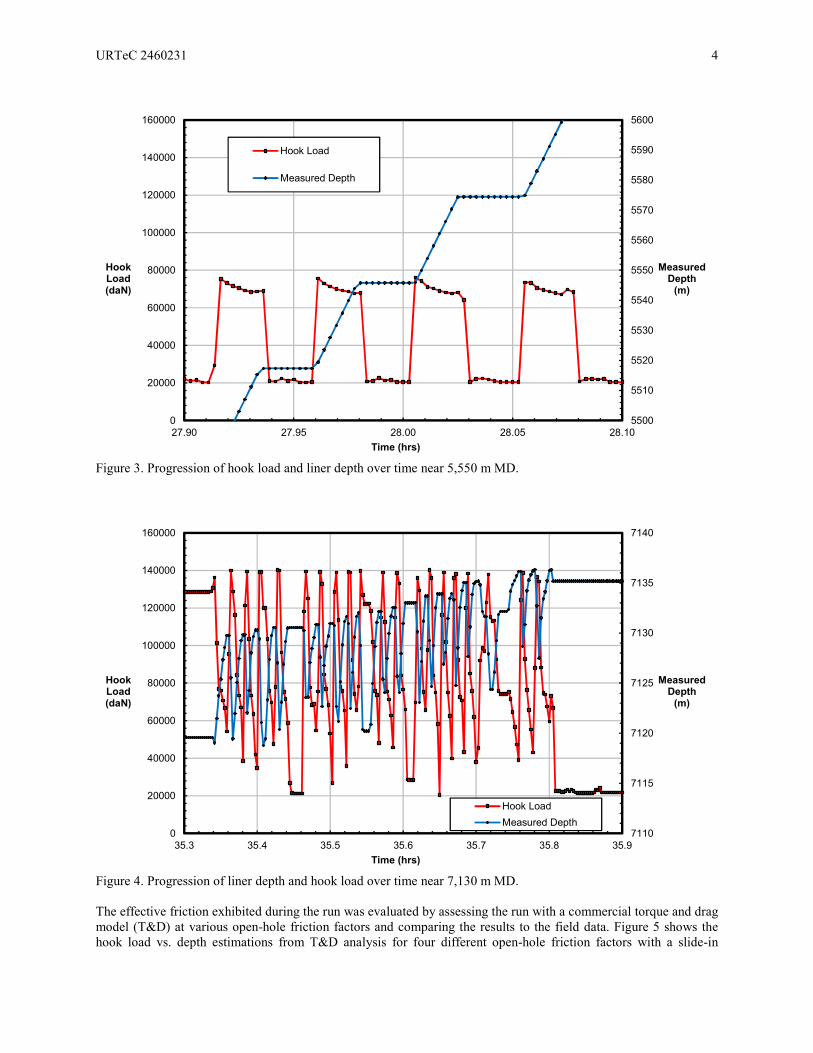
Figure 3 and Figure 4 show the features of the operating loads before and after the running challenges were
encountered. Figure 3 shows the hook load and depth vs. time near 28 hours of run time, where the liner installation
was smooth and marked by steady depth progression and stable hook load during running. Figure 4 illustrates the
characteristic loading pattern during liner reciprocation after about 7,000 m MD when liner running challenges were
encountered.
0
1000
2000
3000
4000
5000
6000
7000
8000
0
20000
40000
60000
80000
100000
120000
140000
160000
0 10 20 30 40 50 60 70 80 90 100
MeasuredDepth(m)
HookLoad(daN)
Time (hrs)
Hook Load
Measured Depth
URTeC 2460231 4
Figure 3. Progression of hook load and liner depth over time near 5,550 m MD.
Figure 4. Progression of liner depth and hook load over time near 7,130 m MD.
The effective friction exhibited during the run was evaluated by assessing the run with a commercial torque and drag
model (T&D) at various open-hole friction factors and comparing the results to the field data. Figure 5 shows the
hook load vs. depth estimations from T&D analysis for four different open-hole friction factors with a slide-in
5500
5510
5520
5530
5540
5550
5560
5570
5580
5590
5600
0
20000
40000
60000
80000
100000
120000
140000
160000
27.90 27.95 28.00 28.05 28.10
MeasuredDepth(m)
HookLoad(daN)
Time (hrs)
Hook Load
Measured Depth
7110
7115
7120
7125
7130
7135
7140
0
20000
40000
60000
80000
100000
120000
140000
160000
35.3 35.4 35.5 35.6 35.7 35.8 35.9
MeasuredDepth(m)
HookLoad(daN)
Time (hrs)
Hook Load
Measured Depth

URTeC 2460231 5
scenario (i.e., no rotation applied) and a cased-hole friction factor of 0.15. The solid lines indicate the estimated
hook load when additional side forces due to buckling are not considered, and the dashed lines indicated the
estimated hook load when additional side forces due to buckling are considered. The T&D model was a soft-string
model based on Johancsik, Friesen and Dawson (1984), and it was deemed that this was suitable model for this
application based on the string stiffness, wellbore geometry, and trajectory. The buckling initiation load prediction
methods in the T&D software used for the analysis are based on Wu and Juvkam-Wold (1993, 1995), and the
additional contact force caused by helical buckling is based on Mitchell (1986).
Figure 5. Progression of hook load vs. casing depth estimated from T&D analysis and compared with the running
data for Pride liner installation.
The T&D results suggest the effective open-hole friction factor during the run was between 0.30 and 0.35 up to
about 7,000 m MD. After 7,000 m MD the running resistance increased substantially as sufficient hook load could
not be sustained during running, and reciprocation was required to continue liner progress. By comparing the
differences between the solid and dashed curves of the same colour in Figure 5, it is apparent that buckling could
have contributed to challenges maintaining hook load while running.
There are a number of possible contributing factors to the liner running challenges. During the run, pieces of the
phenolic centralizers that were used on the liner were discovered in the fluid returns at surface, indicating that the
centralizers were degrading downhole. Enerplus also observed that the phenolic centralizers swelled up in the oil-
based mud while running in the hole, which might have increased the effective drag and contributed to the liner
running problems. During drilling, a formation fault was detected near the toe of the well at 7,730 m MD with about
5 m of upward throw, however this was only 22 m from TD.
It was acknowledged that the degraded and swollen centralizers could have contributed to the increase in running
resistance after 7,000 m MD, however it was not easy to reconcile how much each of these factors contributed to the
running difficulties. The increased running resistance would lead to increased compression in the production liner
and drill pipe during running. This in turn would lead to more severe pipe buckling and less efficient axial load
transfer which would exacerbate the running challenges.
0
20000
40000
60000
80000
100000
120000
140000
160000
0 1000 2000 3000 4000 5000 6000 7000 8000
HookLoad(daN)
Measured Depth (m)
0.25 0.30
0.35 0.40
Dashed - with additional side forces due to bucklingSolid - without additional side forces due to buckling
Reciprocation to workpipe into hole
Cased-hole friction factor: 0.15
Open-hole friction factors:

URTeC 2460231 6
Relevant Background for Advanced Centralizer Placement Basis and ERD Liner Running
with Centralizers
Many factors influence the resistance to running liner in horizontal sections, and as ERD well technology advances,
industry will need to establish practices and select equipment that will enable success within a suitable cost
framework. Candidate centralization solutions that may enable longer reach should have a technical foundation, and
should be validated against field data, which is inherently difficult to interpret. This section aims to provide the
relevant background for liner running in ERD wells with centralizers, which is focused on buckling and other drag
considerations.
Drag Considerations Related to Standoff
Maintaining casing or liner standoff using centralizers is often an important design goal for achieving adequate mud
removal and cement coverage for zonal isolation and well integrity in cemented completions. However, there are
some advantages to using centralizers strategically to reduce drag in ERD casing and liner installations and enable
better axial load transfer. Centralizers can be used to provide standoff near couplings on a casing string as the flat
faces of couplings can potentially hang up on borehole ledges, while the geometry of many available centralizer
products provides some lead-in angle to help guide the connection over the ledge smoothly. Maintaining casing
standoff in the open hole also limits the amount of contact between the casing and the wellbore, which can help to
reduce the risk of differential sticking.
Tubular Buckling
During casing and liner installation in long lateral sections, high compressive forces can build up in sections of the
pipe, resulting in buckling of varying severity. The most critical section of buckling is typically near the heel of
ERD wells, where compression is the highest and consequentially buckling effects are most problematic, resulting in
additional side forces and drag associated with buckling.
Characterization of buckling behavior of pipe in directional wells has been the focus of many other industry efforts
and academic studies. Hajianmaleki and Daily (2014a) and Gao and Huang (2015) have recently published reviews
on a vast amount of literature associated with tubular buckling inside vertical, inclined, horizontal, and curved
wellbores. Most of the work on formulating relationships for buckling initiation loads and post-buckling side load
responses have been focused on continuous pipes. Common buckling force relationships used in industry and T&D
models are based on work involving continuous pipes by Dawson and Paslay (1984), Wu and Juvkam-Wold (1993,
1995), and other authors.
The impacts of external-upsets and connectors in continuous pipes on buckling have been studied mostly in the
drillstring mechanics field, which provides some pertinent technical background for the advanced centralizer
placement basis presented herein.
• Sanchez, Brown and Adams (2012) acknowledged that centralizers affect the tubular buckling behavior and
identified that installing centralizers at key points of compressive load can delay the onset of buckling.
However, the impacts of the centralizers on the buckling mechanics were not described in detail.
• In an FEA study on the effects of stabilizers on the critical buckling load in BHA’s, Akgun (1999) concluded
that the critical buckling load of drill collars can be increased by using stabilizers, and that the location of
stabilizers in the BHA is important.
• An experimental study on buckling of drill pipe with tool joints was performed by Duman, Miska and Kuru
(2003). In this study, it was concluded that the presence of tool joints can increase the critical load required
to initiate helical buckling load by up to 20%, and axial force transfer efficiency along the drill pipe can be
improved by up to 40% with tool joints. The configurations tested in this work were scaled-down relative
to typical drill string applications, with the maximum pipe and tool joint diameters considered in testing
being 19 mm and 35 mm, respectively.
URTeC 2460231 7
• Mitchell and Weltzin (2011) studied lateral buckling and lockup behavior in a test well, which included the
impacts of connectors. The results from this testing indicated that the lateral mode of buckling is the
primary mode of buckling behavior, and tool joints are of primary significance in drill pipe buckling
behaviour.
• Mitchell, Moore, Franks, Liu and Xiang (2011) developed a new semi-empirical buckling model and
discussed methods of reducing buckling effects. The work demonstrated how nonrotating drill pipe
protectors on drill pipe can reduce the incremental drag caused by buckling and reduce the amount of
overall deformation due to buckling in pipe sliding situations. The work also suggested that buckling
initiated at lower axial compressive loads than predicted by the existing buckling models, possibly due to
the initial deformation of the pipe.
• The impact of connectors on pipe stability and buckling limits in a horizontal wellbore was the subject of
study with numerical analysis by Gao, Di, Miska and Wang (2012). This work described a relationship for
non-dimensional critical buckling load of a pipe with connectors in a horizontal orientation as a function of
dimensionless distance between connectors and the dimensionless radius difference (associated with pipe
and centralizer clearance in the borehole). The results demonstrated that both the clearance and distance
between connectors have a significant impact on the critical buckling load. The work also indicated that
connectors can either increase or decrease the critical buckling force depending on the distance between the
connectors and the dimensionless radius difference. The work presented results up to a dimensionless
radius difference up to 0.7, although in most casing and liner centralizer applications the dimensionless
radius difference will be higher, in the range of 0.8 - 0.9.
• Hajianmaleki and Daily (2014b) described an approach to calculating the buckling loads using explicit finite
element method, which included consideration of the effect of tool joints in both horizontal and curved
wells. It was concluded that the effect of tool joints was dependent on both the distance between connectors
and the radial differences, and similar to Gao et al. (2012) that the effects of tool joints on tubular buckling
can be stabilizing or destabilizing.
Advanced Centralizer Placement Basis
The concepts illustrated in drillstring buckling research characterizing connector impacts on buckling behavior have
been further developed to assess the potential impact of centralizer configuration on buckling behavior and
associated load transfer efficiency in open hole sections. The results available in the literature are not directly
applicable to the casing and liner running situation, particularly where smaller centralizer-wellbore clearances are
employed. This potential solution was recognized by the authors while diagnosing running issues in numerous other
ERD applications prior to the completion of the Williston Basin wells discussed herein. Enerplus’ application
offered a perfect opportunity to compare prior and new centralization strategies on offset wells in the same
formation with similar trajectories and liner equipment configurations.
The advanced centralizer placement basis was developed by formulating a non-dimensionalized engineering basis
for characterizing buckling behavior between centralizers for any casing/centralizer/borehole configuration in a
range typically seen in industry. This initially consisted of finite element analysis work to quantify both the critical
loads for buckling initiation and the side loading response after buckling had initiated. Ultimately, the goal was to
obtain a reasonable estimate of the relationship between side loading as a function of compressive loading in the
liner, with a focus on understanding the effects of centralizer clearance and spacing on this relationship. A matrix of
analysis cases was executed to assess the sensitivity of buckling behavior to other parameters such as tubular size
and weight, wellbore size, and well inclination. As part of this process, we compared predictions from the analysis
to the relationships used in commercial torque and drag software to describe impacts of centralizers, and found the
commercial software did not adequately capture the salient features of the response the more detailed FEA
predicted.
We generally anticipated a reduction in critical buckling load with longer spacing between centralizers, subject to
some of the gravitationally-induced stability behavior identified by Gao et al. (2012) for horizontally-oriented
tubulars due to initial radial deflection of the pipe and contact with the wellbore between connectors. We also

URTeC 2460231 8
expected a more severe side load increase with incremental axial load, which was founded in the general
understanding that there is more potential force at the contact points between the pipe and borehole at larger helix
diameters, and that larger spacing between centralizers would permit more deflection between the support points.
For the same reason, our expectation was that a tighter-clearance centralizer would diminish the incremental side
loading relative to a high-clearance centralizer. In practice, sufficient clearance must be employed to ensure
centralizers can pass through local tight spots without incremental running resistance.
The finite element modelling work validated our original hypotheses and afforded the opportunity to quantify the
post-buckling response, which we did not find elsewhere in sufficient detail to incorporate into a practical placement
basis. The character of the FEA results is illustrated in the schematic below (Figure 6) for a vertically-oriented
section of casing with centralizers, which illustrates the change in buckling initiation load and side force relationship
as additional axial compressive load is applied for cases with different centralizer spacing. Critical buckling loads
predicted using our model were in general agreement with those published by Gao et al. (2012), once the same non-
dimensional strategy was employed with our results. As in Gao et al. (2012), we noted some situations where
critical buckling loads decreased at smaller axial centralizer spacing for inclined and horizontal wellbore
orientations. A reversal of this trend occurred once buckling had commenced and less incremental side load
developed with additional axial load at smaller centralizer spacing.
Figure 6. Schematic illustrating the trend in side load between the pipe and borehole wall as compressive axial load
is increased and buckling is initiated in a vertically-oriented wellbore.
Two key results in the FEA analysis were that the clearance between the centralizer and borehole had a significant
impact on the side force response, and that centralizer spacing had a significant impact on the buckling initiation and
side force response. These results suggested that centralizer spacing and clearance could be optimized to mitigate
buckling during casing and liner installations. Furthermore, the results generally indicated that the ability of
centralizers to mitigate side forces due to buckling is reduced significantly as the centralizer clearance is increased.
In practical application of the centralizer placement basis for buckling mitigation, T&D analysis is used with
appropriate friction factor assumptions to estimate the axial load distribution along the casing or liner string during
installation assuming there are no additional side forces due to buckling. The non-dimensional relationship between
critical buckling force and centralizer spacing is then used to evaluate the required centralizer spacing of centralizers
to limit the side force effects of pipe buckling during running.
SideLoad
Axial Compressive Load
Increasing spacing, fewer centralizers
Buckling initiation loads

URTeC 2460231 9
Other considerations beyond buckling mitigation need to be taken into account for a centralizer placement
configuration, such as pipe standoff for cementation and flow area. It is also acknowledged that adding centralizers
to a casing or liner string for installation in a tortuous borehole can contribute to additional side forces during
running in situations where potential for geometric interference exists between the casing string and borehole (due to
flexural stiffness of the pipe). The centralizer clearance, spacing, borehole tortuosity and consistency, hole
condition, formation, and pipe stiffness will all have some bearing on this. While tortuosity is difficult to
characterize with field measurements commonly taken, it should be factored into the centralization strategy. It is
important that a balanced approach be taken to customize the centralizer placement for the application.
Honor Well Liner Run and Centralizer Placement
In February 2014, Enerplus finished drilling the lateral section of the Honor well. The characteristics of the Honor
well plan were similar to those of the Pride well, and a well schematic for the Honor well is shown in Figure 7. The
production liner string consisted of about 4,561 m of 114.3 mm 20.1 kg/m liner, 1,190 m of 101.6 mm 44.0 kg/m
HWDP above the liner, and 2,070 m of 101.6 mm 20.8 kg/m drill pipe above the HWDP. A precautionary reamer
run was executed on the Honor Well prior to the liner run in an attempt to smooth the wellbore prior to running.
Figure 7. Schematic for Honor well.
For the Honor well, 146.1 mm OD rigid hydroformed steel centralizers were selected for the liner to improve
centralizer integrity relative to the liner run in the Pride well and avoid issues with centralizer swelling during

URTeC 2460231 10
running. With regard to standoff, Enerplus had been satisfied with the level of standoff for cementation purposes
provided by the one 146.1 mm OD centralizer per liner joint configuration employed in the Pride well. Therefore,
the primary consideration for adjusting the centralizer placement from the Pride well was for buckling mitigation
and drag reduction.
Placement for Buckling Mitigation and Drag Reduction
To assess the centralizer placement on the liner for buckling mitigation and drag reduction, a T&D evaluation was
conducted for a slide-in scenario in the Honor well to estimate the trend in hook load during the run (Figure 8).
Modelling results indicated that buckling would contribute to significant running issues if open-hole friction only
slightly above the expected range of 0.30 to 0.35 was encountered, and thus there would be little tolerance for
additional resistance during running. The advanced centralizer placement basis was employed to aid in selecting a
centralizer placement for buckling mitigation and enhanced axial load transfer during the run. The advanced basis
provided an initial optimal centralizer distribution which was marked by a higher density of centralizers near the
heel of the well for the most effective buckling mitigation. With practical considerations in mind we simplified the
distribution, arriving at the following centralizer placement plan for the liner run:
• Top 600 m of liner – two 146.1 mm OD centralizers per 13.5 m joint, with a stop collar placed mid-joint; and
• Bottom 3,900 m of liner – one 146.1 mm OD centralizer per 13.5 m joint.
We anticipated that the above centralizer placement would mitigate the bulk of buckling-induced side loads and drag
from the expected nominal running friction, which would enable better axial load transfer for the slide-in
installation.
Figure 8. Hook load vs measured depth progression estimated with T&D analysis for Honor liner run.
0
20000
40000
60000
80000
100000
120000
140000
160000
0 1000 2000 3000 4000 5000 6000 7000 8000
HookLoad(daN)
Measured Depth (m)
0.25 0.3
0.35 0.4
Open-hole friction factor:
Cased-hole friction factor: 0.15
Solid curves: no additional side forces due to bucklingDashed curves: with additional side forces due to buckling
TD
URTeC 2460231 11
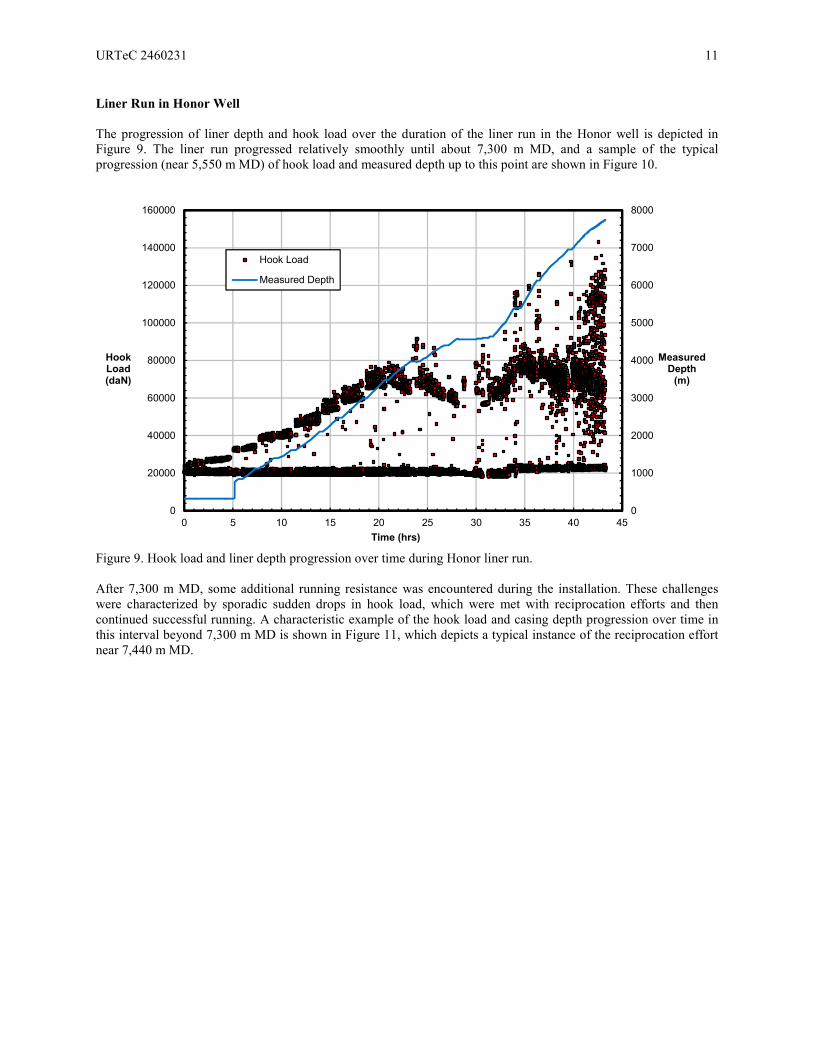
Liner Run in Honor Well
The progression of liner depth and hook load over the duration of the liner run in the Honor well is depicted in
Figure 9. The liner run progressed relatively smoothly until about 7,300 m MD, and a sample of the typical
progression (near 5,550 m MD) of hook load and measured depth up to this point are shown in Figure 10.
Figure 9. Hook load and liner depth progression over time during Honor liner run.
After 7,300 m MD, some additional running resistance was encountered during the installation. These challenges
were characterized by sporadic sudden drops in hook load, which were met with reciprocation efforts and then
continued successful running. A characteristic example of the hook load and casing depth progression over time in
this interval beyond 7,300 m MD is shown in Figure 11, which depicts a typical instance of the reciprocation effort
near 7,440 m MD.
0
1000
2000
3000
4000
5000
6000
7000
8000
0
20000
40000
60000
80000
100000
120000
140000
160000
0 5 10 15 20 25 30 35 40 45
MeasuredDepth(m)
HookLoad(daN)
Time (hrs)
Hook Load
Measured Depth

URTeC 2460231 12
Figure 10. Progression of hook load and measured depth vs. time near 5,550 m MD.
Figure 11. Progression of hook load and measured depth over time near 7,440 m MD.
5500
5510
5520
5530
5540
5550
5560
5570
5580
5590
5600
0
20000
40000
60000
80000
100000
120000
140000
160000
34.80 34.85 34.90 34.95 35.00 35.05 35.10
MeasuredDepth(m)
HookLoad(daN)
Time (hrs)
Hook Load
Measured Depth
7410
7415
7420
7425
7430
7435
7440
7445
7450
7455
7460
0
20000
40000
60000
80000
100000
120000
140000
160000
41.46 41.48 41.50 41.52 41.54 41.56 41.58 41.60
MeasuredDepth(m)
HookLoad(daN)
Time (hrs)
Hook Load
Measured Depth

URTeC 2460231 13
A comparison between the T&D results previously shown in Figure 8 and the measured hook load data during the
run is shown in Figure 12. Overall, the effective friction during the run was assessed to be in the range of 0.30 to
0.35 before 7,300 m MD. After 7,300 m MD, the sporadic instances of increased running resistance occurred, which
were characterized by sudden, irregular drops in hook load. The presence of these events causes difficulty in
assessing the effective friction after 7,300 m MD.
It was not clear what caused these sporadic instances of increased running resistance. Enerplus noted that a probable
fault was encountered at 7,030 m with about 1.5 m of upward throw, and another fault was encountered at 7,196 m
with about 6 m of upward throw.
Figure 12. Comparison of field data with hook load estimations from T&D analysis for Honor liner run.
0
20000
40000
60000
80000
100000
120000
140000
160000
0 1000 2000 3000 4000 5000 6000 7000 8000
HookLoad(daN)
Measured Depth (m)
0.25 0.3
0.35 0.4
Reciprocation to work pipe into hole
Open-hole friction factor:
Cased-hole friction factor: 0.15
Solid curves: no additional side forces due to bucklingDashed curves: with additional side forces due to buckling
URTeC 2460231 14
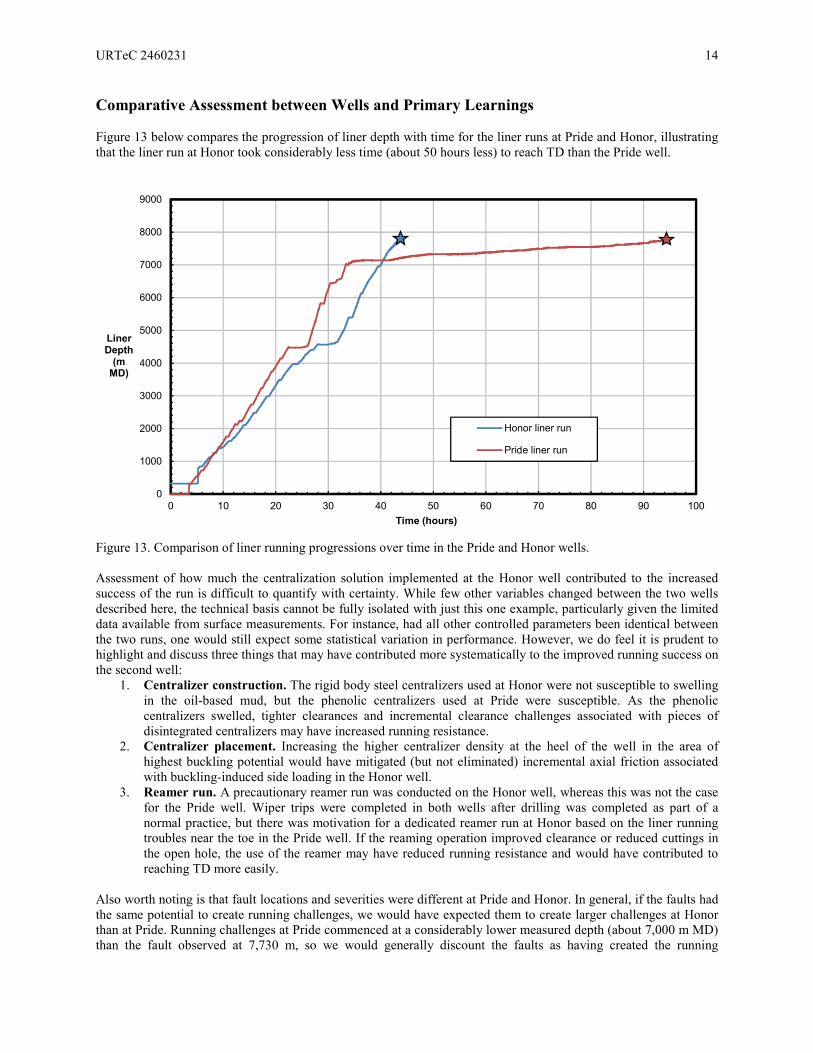
Comparative Assessment between Wells and Primary Learnings
Figure 13 below compares the progression of liner depth with time for the liner runs at Pride and Honor, illustrating
that the liner run at Honor took considerably less time (about 50 hours less) to reach TD than the Pride well.
Figure 13. Comparison of liner running progressions over time in the Pride and Honor wells.
Assessment of how much the centralization solution implemented at the Honor well contributed to the increased
success of the run is difficult to quantify with certainty. While few other variables changed between the two wells
described here, the technical basis cannot be fully isolated with just this one example, particularly given the limited
data available from surface measurements. For instance, had all other controlled parameters been identical between
the two runs, one would still expect some statistical variation in performance. However, we do feel it is prudent to
highlight and discuss three things that may have contributed more systematically to the improved running success on
the second well:
1. Centralizer construction. The rigid body steel centralizers used at Honor were not susceptible to swelling
in the oil-based mud, but the phenolic centralizers used at Pride were susceptible. As the phenolic
centralizers swelled, tighter clearances and incremental clearance challenges associated with pieces of
disintegrated centralizers may have increased running resistance.
2. Centralizer placement. Increasing the higher centralizer density at the heel of the well in the area of
highest buckling potential would have mitigated (but not eliminated) incremental axial friction associated
with buckling-induced side loading in the Honor well.
3. Reamer run. A precautionary reamer run was conducted on the Honor well, whereas this was not the case
for the Pride well. Wiper trips were completed in both wells after drilling was completed as part of a
normal practice, but there was motivation for a dedicated reamer run at Honor based on the liner running
troubles near the toe in the Pride well. If the reaming operation improved clearance or reduced cuttings in
the open hole, the use of the reamer may have reduced running resistance and would have contributed to
reaching TD more easily.
Also worth noting is that fault locations and severities were different at Pride and Honor. In general, if the faults had
the same potential to create running challenges, we would have expected them to create larger challenges at Honor
than at Pride. Running challenges at Pride commenced at a considerably lower measured depth (about 7,000 m MD)
than the fault observed at 7,730 m, so we would generally discount the faults as having created the running
0
1000
2000
3000
4000
5000
6000
7000
8000
9000
0 10 20 30 40 50 60 70 80 90 100
LinerDepth(mMD)
Time (hours)
Honor liner run
Pride liner run

URTeC 2460231 15
challenge, at least in isolation. On the other hand, the need for reciprocation at Honor closely correlates with the first
fault encountered at 7,030 m MD, suggesting that the fault might have created additional challenges for running.
Given the above uncertainties, we are left to establish indicators that point to the true sources of the more successful
liner run at Honor, and this is not a trivial task. A more fundamental comparison of the running characteristics
indicates that there are only slight variations in the calculated open hole friction factor away from the zones where
running was not smooth. The average effective open-hole friction factors for each run were in the range of 0.30 to
0.35, but unfortunately the large variations observed in surface loads as TD was approached are not amenable to
very accurate calculation later. Nonetheless, results farther from TD suggest that the strings were responding in a
similar way, which could be interpreted as an indication that the centralizer style, centralizer placement, and reamer
run did not have a substantial impact until later in the run. Of these three changes, the centralizer placement basis is
most focused on facilitating progress towards TD at the end of the run when compressive loads and buckling
potential would be the highest, whereas the others would be expected to have a more consistent influence along the
horizontal section.
The nature of the issue encountered at Pride seemed to be quite sudden in its onset. Again, this leaves us with some
ambiguity, as it may have been the result of a barrier being encountered by the string, but it is also what we might
expect to see as a string begins to encounter substantial incremental friction from buckling-induced side loads and a
possible lockup condition. The onset of running challenges at Honor was limited, in that there were only sporadic
instances where reciprocation was used to encourage forward progress in the last 500 m of the well; otherwise, the
rate of casing running was maintained. Torque and drag analysis for both Pride and Honor indicates substantial
buckling risk in the last 1000 m of the well at friction factors exceeding about 0.35, which is not significantly higher
than that observed prior to the initiation of running challenges. Ultimately, if centralizer placement optimization is
used in areas most likely to be subjected to buckling, downhole load transfer efficiency will be higher, and this
should enable the string to more easily clear any points of higher resistance.
In an attempt to reconcile differences in running behaviour for future wells, we reviewed local loading “signatures”
that indicate the relationship between hook load and block height for stands of pipe at various stages of both liner
runs. We would expect this relationship to vary significantly as a function of the nature of the running resistance (for
example, a pipe running smoothly with a relatively even distribution of friction along the liner will have a different
load signature than a pipe approaching a buckling lockup condition). Reductions in hook load correspond to
increases in compressive force at the top of the liner or drill string.
Figure 14 shows four loading signatures typical of what was seen in the Pride and Honor liner runs. Broadly, we
identify four example signatures in the data that may provide insight into the situation downhole:
1. Smooth running. Hook load diminishes a small amount as running of the casing stand initiates, and
reaches or approaches a steady running load as the stand is progressed into the hole.
2. Choppy running with good progress. Hook load measurements are not smooth as a function of depth,
but the casing stand progresses into the hole without large-scale changes in hook load.
3. Increasing friction. Casing progresses into the hole, but a substantial reduction in hook load is required to
keep the casing moving towards TD. This indicates a significant change in overall friction factor as the
stand is being run.
4. Stuck. The casing may move forward some distance, but reaches a point where it does not progress further
even with significant reductions in hook load. Increasing the hook load puts the pipe into tension and
mobilizes it out of the hole so that the process can be repeated.

URTeC 2460231 16
Figure 14. Comparison of typical loading signatures observed in Pride and Honor liner runs.
In both wells, smooth running was observed as the liner entered and progressed through the first part of the
horizontal. In the Pride well, a relatively sudden onset of the “stuck” scenario was observed, and subsequent
reciprocation resulted in very slow progress of the casing into the remainder of the hole. Interestingly, the Honor
well commonly exhibited the “choppy” characteristic later in the liner run after about 6,500 m MD, but this
behaviour did not slow running progress. In the latter part of the Honor run, “increasing friction” was observed, but
relatively fewer reciprocation cycles enabled continued progress into the hole without substantial changes in running
rate. While these observations are not sufficient to deduce the primary contributors to running issues, they do
indicate a very different character between the two wells, and the sudden onset of a change in loading signature at
Pride indicates contributors other than a gradually increasing total friction factor.
Ideally, the following focus points would allow us to more clearly distinguish between beneficial effects of each
mitigating strategy undertaken:
• Back-analysis of torque and drag from other similar wells with phenolic centralizers, with a specific focus on
the nature of any challenges encountered.
• Analysis of future wells that use rigid centralizers not susceptible to swelling, to establish whether sudden-
onset of running resistance (like that observed at Pride) is ever encountered, or whether a more gradual
resistance is typical for this type of centralizer.
• Other examples of offset wells with similar completion strategies with and without dedicated reamer runs, to
establish how much of the difference between the Pride and Honor runs is likely due to reaming benefits.
• Other comparisons of running performance between liners with uniform centralizer placement and placement
using the optimization strategy described herein to mitigate buckling-induced friction.
• Development of a more general understanding of loading signatures, based on readily-available surface
loading and block height information. This is perhaps idealistic, but should not be ignored, as there were
obvious differences between the smooth running signatures and the signatures in challenging regions in
these wells.
We must ultimately again acknowledge that this is an area where the benefits of different strategies are difficult to
quantify and models are difficult to calibrate. The gradual accumulation of a larger dataset that can be referenced
more broadly would perhaps give more evidence of practices that contribute most strongly to successful running.
0
20000
40000
60000
80000
100000
120000
140000
160000
0 5 10 15 20 25 30
HookLoad(daN)
Measured Depth (m)
Smooth Running
Choppy with Good Progress
Increasing Friction
Stuck/Reciprocating - RIH
Stuck/Reciprocating - POOH

URTeC 2460231 17
Conclusions
The case history in this paper has described the liner running challenges Enerplus faced on one ERD well, and how
the selection and placement of centralizers contributed to a successful liner run in a subsequent well with similar
characteristics. The liner run in the earlier well (Pride) exhibited significant challenges during running in the latter
stages of the installation, resulting in substantial NPT accumulated by the time TD was reached. Although the source
of the troubles could not be clearly discerned, it was acknowledged that the swelling and degrading of centralizers
might have contributed adversely to the loading situation created in the liner which would exacerbate buckling-
induced side loads and drag during the run in the long lateral section. For the next well (Honor), a robust steel
centralizer was selected to avoid the potential concerns associated with centralizer swelling and degrading
downhole, and the placement strategy was supplemented beyond standoff considerations by the use of an advanced
centralizer placement basis with the goal of mitigating buckling-induced side loads and drag to facilitate the liner
installations in the challenging lateral section. This basis suggested that placing additional centralizers in the heel
region of the liner subjected to the highest compressive loads and buckling potential would help to reduce the side
loads and drag associated with buckling. This basis forms part of the process of centralizer selection and placement
for casing and liners, which should also consider relevant factors such as standoff for cementation and flow area.
The run in the Honor well encountered significantly less challenge towards the end of the run with a substantial
improvement in run performance, marked by a significant reduction in NPT.
This case history represents one application of the advanced centralizer placement basis in a successful field trial,
however it is acknowledged that more work needs to be done to continue benchmarking this strategy. Statistical
variation in field conditions from well to well, even in the same formation, and uncertainty in the downhole
environment due to the limitations of surface measurements ultimately contribute to uncertainties in the
interpretations of the field behavior and contributing factors. For example, the fact that a precautionary reamer run
was conducted on the Honor well and not the Pride well, combined with the location of the faults crossed in the
Honor well, tends to cloud the ability to make firm conclusions. Further study of field data and characteristic load
signature responses during installation will help to further our understanding of liner running mechanics, the
advanced centralizer placement basis, and optimization of liner performance in future wells.
References
Akgun, F. 1999. Optimum Spacing of Multiple Stabilizers to Increase Critical Buckling Load of BHA in Slim Hole
Drilling. SPE 54322 presented at SPE Asia Pacific Oil and Gas Conference and Exhibition, Jakarta, Indonesia (April
20-22 1999).
Dawson, R. and Paslay, P.R. 1984. Drillpipe Buckling in Inclined Holes. SPE 11167 presented at SPE Annual
Technical Conference and Exhibition, New Orleans, Louisiana, U.S.A. (Sept 26-29 1982).
Duman, O.B., Miska, S., and Kuru, E. 2003. Effect of Tool Joints on Contact Force and Axial-Force Transfer in
Horizontal Wellbores. SPE 85775 first presented at IADC/SPE Middle East Drilling Technology Conference,
Bahrain (Oct 22-24 2001).
Gao, D. and Huang, W. 2015. A Review of Down-hole Tubular String Buckling in Well Engineering. Petroleum
Science 12 (3) 443-457.
Gao, G., Di, Q., Miska, S., and Wang, W. 2012. Stability Analysis of Pipe with Connectors in Horizontal Wells.
SPE 146959 presented at SPE Annual Technical Conference and Exhibition, Denver, Colorado, U.S.A. (Oct 30 –
Nov 2 2011).
Hajianmaleki, M. and Daily, J.S. 2014a. Advances in Critical Buckling Load Assessment for Tubulars inside
Wellbores. Journal of Petroleum Science and Engineering 116 (April 2014) 136-144.
URTeC 2460231 18
Hajianmaleki, M. and Daily, J.S. 2014b. Critical-Buckling-Load Assessment of Drillstrings in Different Wellbores
by Use of the Explicit Finite-Element Method. SPE 166592 presented at SPE Offshore Europe Oil and Gas
Conference and Exhibition, Aberdeen, Scotland (Sept 3-6 2013).
Johancsik, C.A., Friesen, D.B., and Dawson, R. 1984. Torque and Drag in Directional Wells – Prediction and
Measurement. SPE 11380 presented at IADC/SPE Drilling Conference, New Orleans, Louisiana, U.S.A. (Feb 20-23
1983).
Mitchell, S., Moore, N.B., Franks, J., Liu, G., and Xiang, Y. 2011. Comparing the Results of a Full-Scale Buckling-
Test Program to Actual Well Data: New Semiempirical Buckling Model and Methods of Reducing Buckling
Effects. SPE 144535 presented at SPE Western North American Regional Meeting, Anchorage, Alaska, U.S.A.
(May 7-11 2011).
Mitchell, R.F. 1986. Simple Frictional Analysis of Helical Buckling of Tubing. SPE 13064 presented at SPE Annual
Technical Conference and Exhibition, Houston, Texas, U.S.A. (Sept 16-19 1984).
Mitchell, R.F. and Weltzin, T. 2011. Lateral Buckling – The Key to Lockup. SPE 139824 presented at SPE /IADC
Drilling Conference and Exhibition, Amsterdam, The Netherlands (March 1-3 2011).
Nair, V.N., Bitzan, P. and McRobbie, N. 2016. Planning, Collaboration and Optimized Drilling Performance for
Drilling Extended Reach Wells in the Bakken/Three Forks. SPE 178801 presented at IADC/SPE Drillign
Conference and Exhibition, Fort Worth, Texas, U.S.A (March 1-3 2016).
Sanchez, A., Brown C.F., and Adams, W. 2012. Casing Centralization in Horizontal and Extended Reach Wells.
SPE 150317 presented at SPE/EAGE European Unconventional Resources Conference and Exhibition, Vienna,
Austria (March 20-22 2012).
Wu, J. and Juvkam-Wold, H.C. 1993. Study of Buckling of Pipes in Horizontal Wells. SPE 25503 presented at
Production Operations Symposium, Oklahoma City, Oklahoma, U.S.A. (March 21-23 1993).
Wu, J. and Juvkam-Wold, H.C. 1995. Coiled Tubing Buckling Implication in Drilling and Completing Horizontal
Wells. SPE 26336 presented at SPE Annual Technical Conference and Exhibition, Houston, Texas, U.S.A. (Oct. 3-6
1993).