Centralized Milling of Newfoundland Base Metal Deposits ... · potential, compliance with market...
46
Centralized Milling of Newfoundland Base Metal Deposits Process Flowsheet Development Newfoundland and Labrador Mineral Resources Review 2017 © Copyright 2017 Thibault & Associates Inc. All rights reserved. REV 00 November 02, 2017
Transcript of Centralized Milling of Newfoundland Base Metal Deposits ... · potential, compliance with market...

Centralized Milling of Newfoundland Base Metal Deposits
Process Flowsheet DevelopmentNewfoundland and Labrador Mineral Resources Review 2017
© Copyright 2017 Thibault & Associates Inc. All rights reserved. REV 00 November 02, 2017

2
Forward‐looking StatementsAlthough the forward‐looking statements contained in this Presentation are based upon whatmanagement and professionals believe to be reasonable assumptions, Thibault & Associates Inc. cannotassure that actual results will be consistent with these forward‐looking statements. These forward‐looking statements are made as of the date of this Presentation, and Thibault & Associates Inc. assumesno obligations to update or revise them to reflect new events or circumstances.
Certain statements in this Presentation may constitute “forward‐looking” statements which involveknown and unknown risks, uncertainties and other factors which may cause the actual results,performance or achievements of Thibault & Associates Inc., or the industry in which it operates, to bematerially different from any future results, performance or achievements expressed or implied by suchforward looking statements.
New risk factors may arise from time to time and it is not possible for management and professionals ofThibault & Associates Inc. to predict all of those risk factors or the extent to which any factor orcombination of factors may cause actual results, performance or achievements of Thibault & AssociatesInc. to be materially different from those contained in forward‐looking statements. Given these risks anduncertainties, the reader should not place undue reliance on forward‐looking statements as a predictionof actual results.
This document is of exclusive rights of Thibault & Associates Inc. ©2017No use, copy, change or disclosure is permitted without written consent.

3
Project Objectives
Conceptual study to assess the technical and economic viability of a Centralized Concentrator for the production of copper, lead and zinc concentrates from multiple base metal deposits.
Assess amenability of pre‐concentration using Dense Media Separation (DMS) to reduce mining or transport costs to central mill.
Define a common flotation flowsheetand reagent scheme for processing all deposits.
Mine plan, process simulation and a relative conceptual economic evaluationto compare various centralized milling production scenarios.

4
Project Management
Collaborative study.
Canadian Zinc Corporation (CZN) Buchans Resources Limited (BRL)
Lundberg (2 samples)
Boomerang
Lemarchant Massive Sulfide (MS)
Lemarchant Footwall (FW)
Daniels Pond
Bobbys Pond
In central Newfoundland, CZN and BRL collectively have Indicated and Inferred Resources at 28.9 million tonnes at 2.2% Zn, 0.81% Pb, 0.40% Cu (NI 43‐101 Compliant). [approximately 0.5 million tonnes of recoverable zinc].
Study completed March 27, 2017 (16 month study). Co‐funding by CZN, BRL and RDC.

5
Speciality ‐ Resource Based Production Strategies
Thibault & Associates Inc. has provided process engineering and project management services to the resource based industries since 1987 / 1988 (30 years).
In‐house capabilities for process development (bench scale and pilot facilities) and process design services.
Independent technical ‐ economic assessment of production strategies ‐ based on AACE and NI 43‐101 guidelines.
Plant design, equipment procurement, construction documentation, coordination of multi‐discipline plant design and in‐plant optimization (process intensification studies / after‐care).
Antimony Trioxide Indium Tin Oxide
Electrolytic Zinc Plates

Technical and Economic Viability of Technology
6
Define process technology based on earning potential, compliance with market specifications and environmental protocol.
Identify “innovative solutions” to support business plans and development of test programs to quantify technical parameters.
Preparation of an economic model that define earning power relative to technical and economic parameters.
Integrated plant design and economic studiesbased on process chemistry, equipment selection, plant layout, process control, construction and operating practices.

Process Simulation and Economic Evaluation Models
7
Use of process simulation models to assess production strategies, technical demands and constraints that occur during the life span of the project.
Economic modelling provides a logical template to help organize resource development strategies and defines the relative impact of production technology on earning potential.
Our dynamic models are fully integrated process simulation and economic models.How is the product made and what is the production cost?

8
Process Simulation – Mass and Energy Balance

ProSEETMProcess Simulation Economic Evaluation
9
Revised Flowsheet / Product Opportunity
Flowsheet Design
Ore Delination
Mass and Energy Balance Simulation
Mine Plan Design
Ore Grade and Tonnage
Equipment Sizing / Cost Estimation
CAPEX / OPEX Cash Flow Model
Revenue Generator
Economic Viability
Process Definition
Return on Investment
Project Life
Simulation of process chemistry
Process mass and energy balance
Equipment sizing / energy loads
Capital cost estimates (CAPEX)
Operating cost estimates (OPEX)
Cash flow – sensitivity assessment
“Loaded model” includes:
resource / feedstock definition; revenue generation; mining, processing costs; infrastructure and administrative costs; owners costs; sustaining capital, taxation, depreciation and; risk assessment .

10
Immediate Challenges ‐ Zinc
Zinc is defined as the primary economic driver for base metal feedstocks (run‐of‐mine ore).
Approximately 50% of base metal revenue is from zinc concentrates and zinc has a relatively low NSR.
Projected zinc supply deficit – gap for zinc demand and supply for 2020 is significant.
Increased demand for smelting lower grade dirty zinc concentrates .
Sulfuric acid co‐production and marketing –competing with sulfur pricing.
High smelter production cost ‐ higher energy costs, higher transportation costs and higher unplanned maintenance outage.

11
Base Metal Resource Development Directives
Zinc global demand around 14.0 million tonnes annually (2016) with galvanizing 50% and zinc alloying around 17% of demand.
Alternatives to zinc metal production include zinc chemicals with zinc oxide global demand around 1.3 million tonnes annually (Technavio, 2016).
Search for “profitable overall production strategies” from mine to metal. No single mine can supply global zinc demand.
Economy of scale for zinc metal supply chain as an alternative to smelter production.
Ability to process lower grade run‐of‐mine ore with fine grain mineralization and high impurity content (As, Cd, Se, Hg, etc.).
Demonstrate fully integrated process viability based on product purity and recovery.

12
Base Metal Potential for Central Newfoundland
13
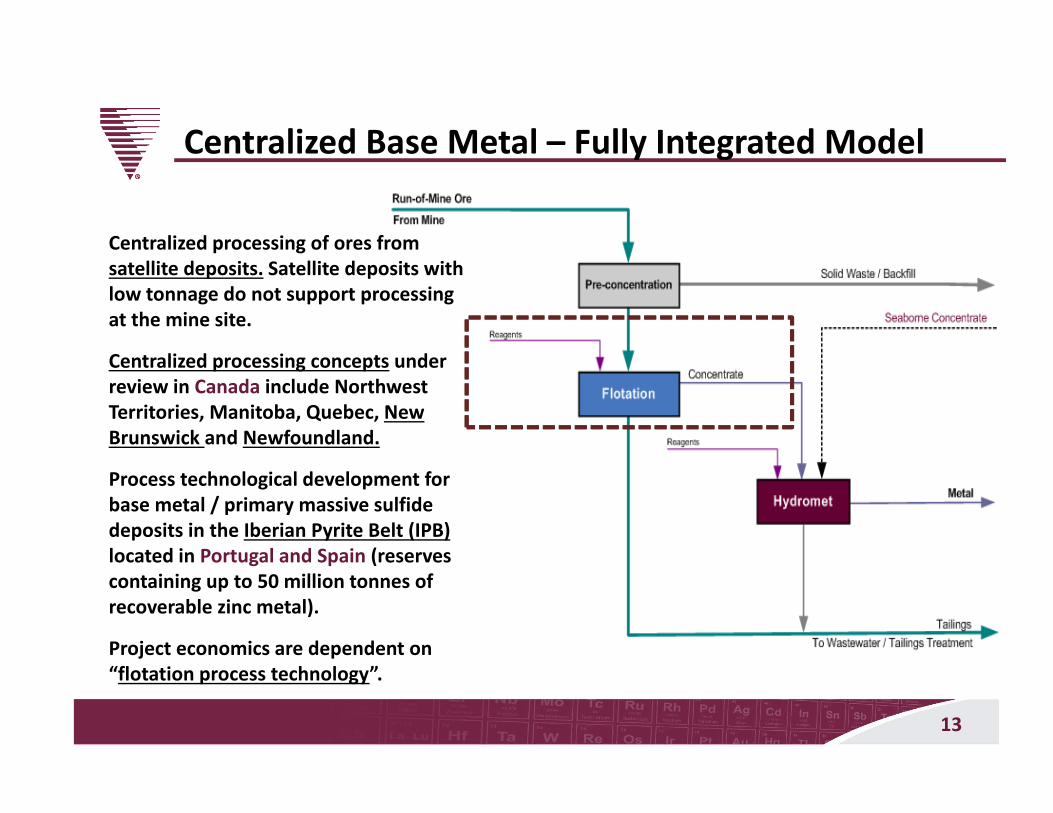
Centralized Base Metal – Fully Integrated Model
Centralized processing of ores from satellite deposits. Satellite deposits with low tonnage do not support processing at the mine site.
Centralized processing concepts under review in Canada include Northwest Territories, Manitoba, Quebec, New Brunswick and Newfoundland.
Process technological development for base metal / primary massive sulfide deposits in the Iberian Pyrite Belt (IPB) located in Portugal and Spain (reserves containing up to 50 million tonnes of recoverable zinc metal).
Project economics are dependent on “flotation process technology”.

14
Resource Location

15
Canadian Zinc and Buchans Resource (2016)
Canadian Zinc Resources:
High grade, low tonnage
Potential underground
No economic studies to date
Buchans Resources:
Lundberg open pit potential, 2011 stand‐alone PEA study
Bobbys and Daniels:o High grade, low tonnageo Potential undergroundo No economic studies to date
Deposit NI 43‐101 Category Tonnes Zn (%) Pb (%) Cu (%)
BoomerangIndicated 1,364,600 7.07 3.00 0.51Inferred 278,100 6.72 2.88 0.44
Domino Inferred 411,200 6.30 2.80 0.40
LemarchantIndicated 1,240,000 5.38 1.19 0.58Inferred 1,340,000 3.70 0.86 0.41
Deposit NI 43‐101 Category Tonnes Zn (%) Pb (%) Cu (%)
LundbergIndicated 23,440,000 1.41 0.60 0.35Inferred 4,310,000 1.29 0.54 0.27
Bobbys PondIndicated 1,095,000 4.61 0.44 0.86Inferred 1,177,000 3.75 0.27 0.95
Daniels PondIndicated 1,160,000 4.44 2.12 0.31Inferred 450,000 3.88 1.74 0.27
16
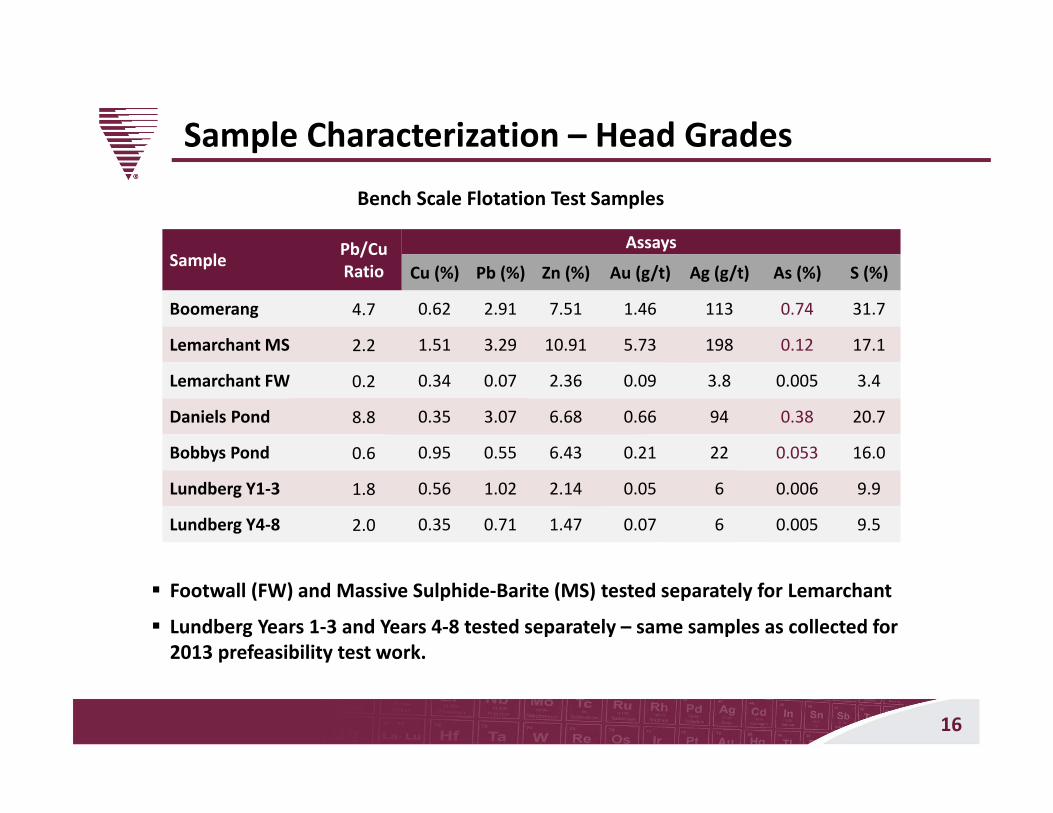
Sample Characterization – Head Grades
Sample Pb/Cu Ratio
Assays
Cu (%) Pb (%) Zn (%) Au (g/t) Ag (g/t) As (%) S (%)
Boomerang 4.7 0.62 2.91 7.51 1.46 113 0.74 31.7
Lemarchant MS 2.2 1.51 3.29 10.91 5.73 198 0.12 17.1
Lemarchant FW 0.2 0.34 0.07 2.36 0.09 3.8 0.005 3.4
Daniels Pond 8.8 0.35 3.07 6.68 0.66 94 0.38 20.7
Bobbys Pond 0.6 0.95 0.55 6.43 0.21 22 0.053 16.0
Lundberg Y1‐3 1.8 0.56 1.02 2.14 0.05 6 0.006 9.9
Lundberg Y4‐8 2.0 0.35 0.71 1.47 0.07 6 0.005 9.5
Footwall (FW) and Massive Sulphide‐Barite (MS) tested separately for Lemarchant
Lundberg Years 1‐3 and Years 4‐8 tested separately – same samples as collected for 2013 prefeasibility test work.
Bench Scale Flotation Test Samples

17
Sample Characterization – Mineralogy
SampleGangue Grain Size Secondary
CuAs/Sb with
CuSulphide Barite Silicate Coarser Med. Finer
Boomerang X X Minor X
Lemarchant MS X X X Major X
Daniels Pond X X X Major X
Bobbys Pond X X X Minor
Lundberg X X
Bobbys Pond and Lundberg: most straightforward mineralogy for flotation
Secondary copper (bornite, covellite, chalcocite, tetrahedrite, tennantite) can be slightly soluble in water – copper ions cause zinc to float with copper concentrate
Tetrahedrite/tennantite (As and Sb bearing Cu minerals) float with the copper concentrate – potential As/Sb penalties

18
Sample Characterization – Mineralogy
60.0
65.0
70.0
75.0
80.0
85.0
90.0
95.0
100.0
0 10 20 30 40 50 60 70
Percen
t Liberated
Mineral (>
80%)
Particle 80% Passing Size (microns)
Bobbys Pond
Sphalerite
Copper Sulphides
60.0
65.0
70.0
75.0
80.0
85.0
90.0
95.0
100.0
10 20 30 40 50 60
Percen
t Liberated
Mineral (>
80%)
Particle 80% Passing Size (microns)
Boomerang
Sphalerite
Copper Sulphides
Use of mineralogy to identify target grind to liberate minerals for flotation

19
Centralized Processing Overview – Pre‐concentration

20
Pre‐concentration by Dense Media Separation
Not all ores are amenable to upgrading by dense media separation – grade, recovery and mass rejection defined by bench scale tests.
Principles of upgrading are based on specific gravity of base metal mineralization relative to gangue mineralization and control of the media specific gravity.
Fines are removed from crusher ore and fine particles of ferrosilicon (dense media) are used to alter the specific gravity of the slurry.
DMS operations in the mine are used to upgrade ore and reduce the amount of ore transported to the surface or to a centralized processing facility.

21
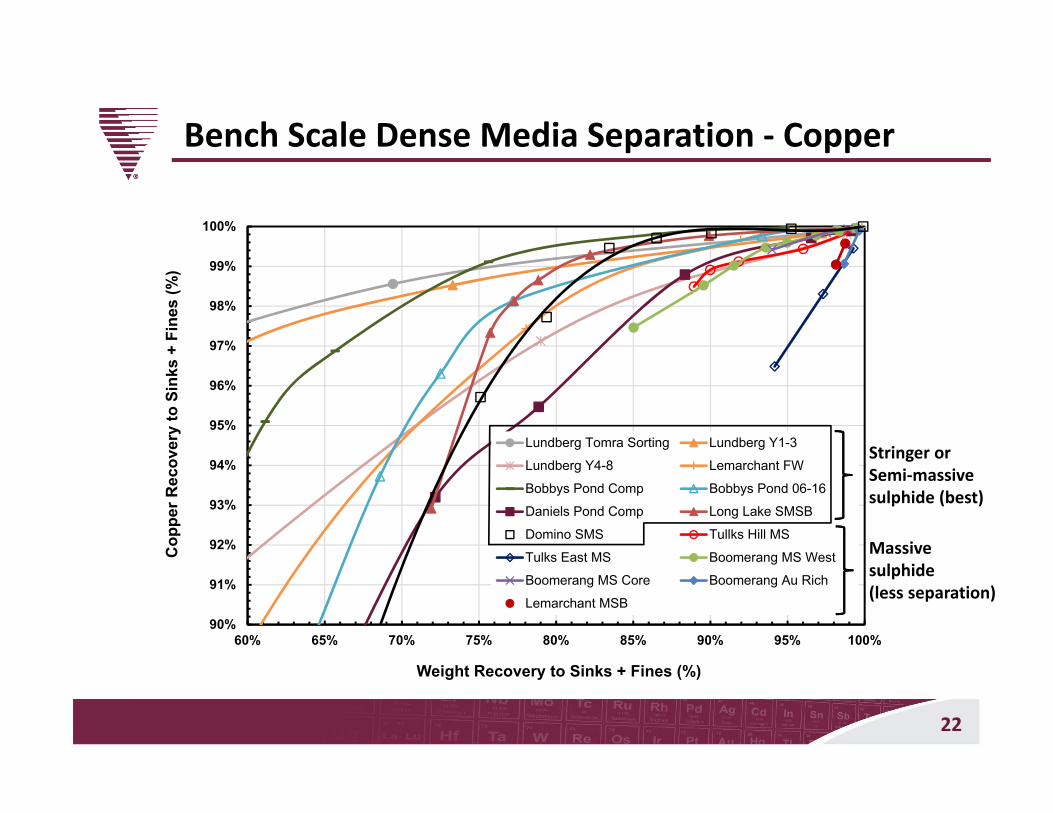
Bench Scale Dense Media Separation
DMS used for pre‐concentration ahead of typical grinding and flotation process
Density‐based separation for base metals:
o Light waste mineralso Heavy valuable minerals
Ore mineralogy must allow crushing to liberate light and heavy minerals
DMS best suited to stringer sulphide deposits
Massive sulphide deposits difficult to upgrade by DMS
15 samples tested
Separation specific gravity: 2.70 to 3.30
22
Bench Scale Dense Media Separation ‐ Copper
90%
91%
92%
93%
94%
95%
96%
97%
98%
99%
100%
60% 65% 70% 75% 80% 85% 90% 95% 100%
Cop
per R
ecov
ery
to S
inks
+ F
ines
(%)
Weight Recovery to Sinks + Fines (%)
Lundberg Tomra Sorting Lundberg Y1-3
Lundberg Y4-8 Lemarchant FW
Bobbys Pond Comp Bobbys Pond 06-16
Daniels Pond Comp Long Lake SMSB
Domino SMS Tullks Hill MS
Tulks East MS Boomerang MS West
Boomerang MS Core Boomerang Au Rich
Lemarchant MSB
Stringer or Semi‐massive sulphide (best)
Massive sulphide(less separation)

23
Bench Scale Dense Media Separation ‐ Lead
90%
91%
92%
93%
94%
95%
96%
97%
98%
99%
100%
60% 65% 70% 75% 80% 85% 90% 95% 100%
Lead
Rec
over
y to
Sin
ks +
Fin
es (%
)
Weight Recovery to Sinks + Fines (%)
Lundberg Tomra Sorting Lundberg Y1-3
Lundberg Y4-8 Lemarchant FW
Bobbys Pond Comp Bobbys Pond 06-16
Daniels Pond Comp Long Lake SMSB
Domino SMS Tullks Hill MS
Tulks East MS Boomerang MS West
Boomerang MS Core Boomerang Au Rich
Lemarchant MSB
Stringer or Semi‐massive sulphide (best)
Massive sulphide(less separation)

24
Bench Scale Dense Media Separation ‐ Zinc
90%
91%
92%
93%
94%
95%
96%
97%
98%
99%
100%
50% 55% 60% 65% 70% 75% 80% 85% 90% 95% 100%
Zinc
Rec
over
y to
Sin
ks +
Fin
es (%
)
Weight Recovery to Sinks + Fines (%)
Lundberg Tomra Sorting Lundberg Y1-3Lundberg Y4-8 Lemarchant FWBobbys Pond Comp Bobbys Pond 06-16Daniels Pond Comp Long Lake SMSBDomino SMS Tullks Hill MSTulks East MS Boomerang MS WestBoomerang MS Core Boomerang Au RichLemarchant MSB
Stringer or Semi‐massive sulphide (best)
Massive sulphide(less separation)

25
Bench Scale Dense Media Separation ‐ Recoveries
Sample Overall Metal Recovery to Sinks + FinesCu (%) Pb (%) Zn (%) Au (%) Ag (%)
Lemarchant FW 94.6 97.7 95.4 97.4 96.4
Bobbys Pond SMS Comp 98.3 98.6 99.1 95.6 95.6
Bobbys Pond SMS 06‐16M 94.8 92.1 93.3 92.5 97.8
Daniels Pond SMS Comp 91.7 96.3 96.0 84.4 94.3
Domino SMS 91.4 93.7 95.3 91.1 92.6
Lundberg Y1‐3 98.3 96.6 96.5 89.6 95.3
Lundberg Y4‐8 94.7 94.2 93.9 84.8 90.1
Metal recoveries with 30% rejection of waste material

26
Centralized Processing Overview ‐ Flotation

27
Bench Scale Flotation Flowsheet Development
Boomerang Cu, Pb, Zn concentrates
Lemarchant MS Cu, Pb, Zn concentrates
Common challenges in previous test work:
Inefficient separation between Cu, Pb, Zn
Zn contamination of Cu, Pb concentrates
Low Zn recoveries
Low grade Cu concentrates
Current study focussed on better separation of Cu, Pb and Zn by:
Alternative flowsheets
More selective reagent schemes
Finer grinds to improve liberation

28
Bench Scale Flotation Flowsheet Selection
Bulk Cu/Pb Flowsheet:
Cu and Pb floated together
Bulk con. then cleaned and Cu/Pbare separated
Zn float same as sequential

29
Bench Scale Flotation Flowsheet Selection
Sequential Flowsheet:
Fine grind to liberate Cu, Pb, Zn minerals
Cu, Pb, Zn floated in order of natural floatability

30
Bulk Cu/Pb vs. Sequential Flowsheet
0.0
5.0
10.0
15.0
20.0
25.0
30.0
35.0
Cu Pb Zn Fe
Gra
de (w
t%)
Bulk Sequential
Boomerang Final Copper Concentrate Grades

31
Bulk Cu/Pb vs. Sequential FlowsheetBoomerang Grade‐Recovery Relationships
0
20
40
60
80
100
0 10 20 30 40 50 60 70
Rec
over
y (w
t%)
Grade (wt%)
Copper Sequential
Lead Sequential
Zinc Sequential
Copper Bulk
Lead Bulk
Zinc Bulk
Cu
PbZn

32
Sequential Flowsheet Test Program Sequential flowsheet selected based on better flotation selectivity
More detailed tests for selection of grind size, regrind size, reagent dose and operating conditions to improve performance
Outcome: Each deposit responds well to the sequential flowsheet and the same reagent scheme, with reagent dose adjustments
Test program included 166 batch open circuit flotation tests on 7 samples

33
Sequential Flowsheet Copper Concentrate GradesOpen Circuit Bench Test Results
Sample Cu (%) Pb (%) Zn (%) Ag (g/t) Au (g/t) As (%) Sb (%)
Boomerang 27.38 5.65 1.46 1318 7.65 0.28 0.56
Lemarchant MS 34.59 1.29 4.74 1578 15.46 3.14 0.89
Lemarchant FW 31.00 0.61 1.11 112 1.63 0.02 0.006
Daniels Pond 18.82 26.75 8.08 1487 8.15 0.76 0.44
Bobbys Pond 30.92 1.90 1.44 125 0.58 0.28 0.03
Lundberg Y1‐3 32.06 2.10 1.43 29 0.16 0.007 0.003
Lundberg Y4‐8 30.93 0.85 0.81 19 0.68 0.003 0.002
Cu concentrates improved over previous testing
Daniels Pond most challenging for making a copper concentrate
Good Cu grades other than Daniels Pond
Zn rejection good except for Daniels Pond
Elevated As, Sb in Boomerang, Lemarchant MS and Daniels Pond
Pb elevated for Boomerang, Bobbys Pond, Lundberg and Daniels Pond

34
Sequential Flowsheet Lead Concentrate Grades
Good open circuit Pb grades, good Zn rejection
As elevated only in Boomerang
Clean concentrates
Open Circuit Bench Test Results
Sample Cu (%) Pb (%) Zn (%) Ag (g/t) Au (g/t) As (%) Sb (%)
Boomerang 0.67 63.78 2.93 751 5.16 0.47 0.13
Lemarchant MS 0.21 80.88 3.23 344 344 0.007 0.01
Lemarchant FW ‐ ‐ ‐ ‐ ‐ ‐ ‐
Daniels Pond 1.06 77.51 4.87 599 5.55 0.08 0.05
Bobbys Pond 0.68 80.58 5.14 318 1.68 0.09 0.008
Lundberg Y1‐3 0.31 74.76 3.56 260 0.55 0.05 0.002
Lundberg Y4‐8 0.38 75.93 2.80 263 1.13 0.03 0.003

35
Sequential Flowsheet Zinc Concentrate GradesOpen Circuit Bench Test Results
Sample Cu (%) Pb (%) Zn (%) Ag (g/t) Au (g/t) As (%) Sb (%)
Boomerang 0.17 0.64 55.96 39 0.43 0.23 0.008
Lemarchant MS 0.15 0.57 64.29 35 0.23 0.0004 0.004
Lemarchant FW 0.28 0.91 59.89 19 0.13 0.009 0.002
Daniels Pond 0.14 1.27 67.02 46 0.18 0.03 0.007
Bobbys Pond 0.16 0.27 64.81 18 0.21 0.01 0.02
Lundberg Y1‐3 0.60 0.71 62.52 18 0.11 0.003 0.003
Lundberg Y4‐8 0.98 0.75 60.64 24 0.15 0.001 0.004
Clean, high grade concentrates

36
Sequential Flowsheet Copper RecoveriesClosed Circuit METSIM Simulation
0%
10%
20%
30%
40%
50%
60%
70%
80%
90%
100%
Boomerang Lemarchant MS Lemarchant FW Bobbys Pond Daniels Pond Lundberg Y1-3 Lundberg Y4-8
Cop
per R
ecov
ery
(wt%
)

37
Sequential Flowsheet Lead RecoveriesClosed Circuit METSIM Simulation
0%
10%
20%
30%
40%
50%
60%
70%
80%
90%
100%
Boomerang Lemarchant MS Bobbys Pond Daniels Pond Lundberg Y1-3 Lundberg Y4-8
Lead
Rec
over
y (w
t%)

38
Sequential Flowsheet Zinc RecoveriesClosed Circuit METSIM Simulation
0%
10%
20%
30%
40%
50%
60%
70%
80%
90%
100%
Boomerang Lemarchant MS Lemarchant FW Bobbys Pond Daniels Pond Lundberg Y1-3 Lundberg Y4-8
Zinc
Rec
over
y (w
t%)

39
Sequential Flowsheet Gold Overall RecoveriesClosed Circuit METSIM Simulation – Gold Recovered to All Three Concentrates
0%
10%
20%
30%
40%
50%
60%
70%
80%
90%
100%
Boomerang Lemarchant MS Lemarchant FW Bobbys Pond Daniels Pond Lundberg Y1-3 Lundberg Y4-8
Gol
d R
ecov
ery
(wt%
)

40
Sequential Flowsheet Silver Overall RecoveriesClosed Circuit METSIM Simulation – Silver Recovered to All Three Concentrates
0%
10%
20%
30%
40%
50%
60%
70%
80%
90%
100%
Boomerang Lemarchant MS Lemarchant FW Bobbys Pond Daniels Pond Lundberg Y1-3 Lundberg Y4-8
Silv
er R
ecov
ery
(wt%
)

41
Centralized Processing Overview ‐ Hydromet

42
Hydrometallurgical Processing of Concentrates
Use of hydromet to process selective flotation Cu/Pb and Zn concentrates.
Zinc hydromet based on selective leaching of zinc, purification by solvent extraction and electrowinning of zinc metal in a sulfuric acid circuit.
Leaching of copper in a sulfuric acid media such that lead is insoluble and use of solvent extraction purification and copper metal recovery by electrowinning.
Recovery of lead using a chloride hydromet and solution is purified by removal of impurities and lead carbonate is recovered by precipitation.

43
Hydrometallurgical Processing of Zinc Concentrates
To improve on the overall economic viability of the project, copper and lead hydromet is eliminated.
Based on the current NSR for both copper and lead concentrates (at the scale of operation) smelting has a higher earning potential relative to a copper and lead hydromet.
Based on the current NSR for zinc concentrates, use of a zinc hydromet has economic potential as an add‐on to a selective flotation process.
The viability of a zinc hydromet is very dependent on impurities in concentrate, transport costs, electrical power costs and economy of scale.

44
Centralized “Bulk Concentrate” Hydromet ConceptDevelopment option defined for low metal recovery with selective flotation.
Process based on operating flotation to achieve a lower grade concentrate with a high recovery.
Early process development phase for deposits in Spain and Mexico based on low lead ores.
Economics of hydromet are based on economy of scale. Risk associated with supply of bulk concentrates for life of project at high tonnages.
Ability to treat dirty concentrates. Proven technologies for solution purification using zinc and copper solvent extraction (SX) and impurity removal by ion exchange (IEX).
45
Summary
Sequential flotation flowsheet was defined as a technically viable technology, that provides flexibility for the production of copper, lead and zinc concentrates from central Newfoundland satellite deposits – using a common flotation reagent scheme with a specific reagent dose to improve on selectivity for each deposit.
An economic model was developed for the centralized milling – production of concentrates, to assess the earning potential sensitivity to i) pre‐concentration by dense media separation, ii) location of the centralized mill, iii) effect of impurity and impact on net smelter return (unique to each deposit), iv) recovery, v) production tonnage and vi) sequential development / mine plan for each deposit.
Added value production of metal by hydrometallurgical processing of concentratescould improve on the project’s earning potential, however, is dependent on economy of scale. Based on 100,000 tonne of zinc metal production annually and a 25 year project life, a multi‐deposit resource definition should target run‐of‐mine feedstock in the range of 60 to 150 million tonnes (at 2% to 5% Zn and 85% recovery).

330 Alison Blvd.,Fredericton, New BrunswickCanada, E3C 0A9
T: 506.454.2359F: 506.454.2349E: d.thibault@thibault‐process‐engineering.ca
www.thibault‐process‐engineering.ca
30Years of Innovative Process Engineering
1988 to 2018