CENTRAL OAHU COMMUNITY MENTAL HEALTH NEEDS …
201
Management Planning & Administration Consultants, Inc. CENTRAL OAHU COMMUNITY MENTAL HEALTH NEEDS ASSESSMENT SURVEY PART III. A SURVEY OF THE GENERAL POPULATION April 1977 Suite 3182 / 2828 Paa St. / Honolulu. Hawaii 96819 / Phone: (808) 839-9971
Transcript of CENTRAL OAHU COMMUNITY MENTAL HEALTH NEEDS …

Management Planning & Administration Consultants, Inc.
CENTRAL OAHU COMMUNITY
MENTAL HEALTH NEEDS ASSESSMENT SURVEY
PART III. A SURVEY OF THE GENERAL POPULATION
April 1977
Suite 3182 / 2828 Paa St. / Honolulu. Hawaii 96819 / Phone: (808) 839-9971

CENTRAL OAHU COMMUNITY
MENTAL HEALTH NEEDS ASSESSMENT SURVEY
PART III. A SURVEY OF THE GENERAL POPULATION
by
Ross Prizzia, Ph.D. and
Odette Villanueva-King, M.ED.
Contributors: George Warfel wrote Chapter 17 and assisted in editing of the final report; Dr. David Bremer assisted in the editing of the final report and made useful suggestions throughout the report-writing phase; Edeane Matsumoto assisted in compiling and locating data from the print-outs; Dr. Chuck Portwood assisted in the preliminary phase of data analysis; and Phil King provided a preliminary outline of the report.

TABLE OF CONTENTS
Page
Acknowledgements ............................................................................................ iv
Survey Participants .................................................................................... v
Members of the Central Oahu Mental Health Advisory Board .................. vi
List of Tables....................................................................................................vii
I. Introduction ..................................................................................... 1
II. Sampling Procedure .......................................................................... 5
III. Survey Methodology Procedure ........................................................ 13
IV. Description of the Population........................................................ 33
V. Scale Analysis................................................................................. 42
VI. Awareness and Use of Social Services (Scale 1)....................... 47
VII. Importance of Counseling Services and Modes of Counseling(Scale 2)............................................................................................ 59
VIII. Levels of Comfort and Convenience of DOH CounselingCenters (Scale 3)............................................................................. 70
IX. Preferred Mental Health Professionals and Types ofCounseling Services (Scale 4) ....................................................... 83
X. Family Relations and Family Stress (Scale 5) 98
XI. Personal Health (Scale 6) ............................................................... 108
XII. Job Quality and Satisfaction (Scale 7) 117
XIII. Personal Contact (Scale 8) 124
XIV. Self-Esteem and Life Satisfaction (Scale 9)...................................130
XV. Coping With Stress (Scale 10).............................................................138

i i i
Page
XVI. Discussion of the Statistical Analyses Applied to theFamily Sample ................................................................................. 149
XVII. Implications for Planning........................................................... 152
Appendix...................................................................................................... 164

1 V
ACKNOWLEDGEMENTS
This survey was the product of the cooperation and ingenuity of a
good many people. Management Planning and Administration Consultants
would like to thank Larry Jack Wong and Dorene Loso of the Region IX
Office and Shirley Hayashi of the State Department of Health for their
support of efforts to base health services on community needs which has
preceeded this particular project and extends far beyond it. We thank
Mrs. Hoaliku Drake, Director of the Office of Human Resources of Honolulu
and Jerry Mann and Bob Graham of the Data Systems office for their
assistance in the sampling procedure.
To the Advisory Board of the Central Oahu Mental Health Center
goes a special thanks for their advice during the development of the
questionnaire and for their unflagging support during the 6 months of
the project.

V
SURVEY PARTICIPANTS
Mr. Sunao Murata, Acting Chief, Central Oahu Mental Health Center,State Department of Health
Dr. David Bremer, Liaison & Project Director, Central Oahu Mental Health Center, State Department of Health
Dr. Ross Prizzia, Project Coordinator, MPAC, Inc.
Dr. Chuck Portwood, Computer Programmer & Data Analyst, MPAC, Inc.
Mr. George Warfel, Training Supervisor, MPAC, Inc.
Ms. Odette Villanueva-King, Field Supervisor, MPAC, Inc.
Mr. Phil King, Field Supervisor, MPAC, Inc.
Ms. Edeane Matsumoto, Field Supervisor, MPAC, Inc.
Ms. Evelyn Adams, Interviewer, MPAC, Inc.
Ms. Gwen Akiyama, Interviewer, MPAC, Inc.
Mr. Alfred Jodar, Interviewer, MPAC, Inc.
Ms. Debra Jordan-El, Interviewer, MPAC, Inc.
Mr. Steven Kelsey, Interviewer, MPAC, Inc.
Ms. Ofelia Lim, Interviewer, MPAC, Inc.
Ms. Luz Marquez, Interviewer, MPAC, Inc.
Ms. Noreen Mokuau, Interviewer, MPAC, Inc.
Ms. Jan Mosier, Interviewer, MPAC, Inc.
Mr. Brian Nakamura, Interviewer, MPAC, Inc.
Ms. Marion Poirier, Interviewer, MPAC, Inc.
Mr. Kaio Salanoa, Interviewer, MPAC, Inc.
Ms. Nancy Sugimura, Interviewer, MPAC, Inc.
Mr. Alvin Tachibana, Interviewer, MPAC, Inc.
Mr. Peter Yanagawa, Interviewer, MPAC, Inc.

VI
MEMBERS OF THE CENTRAL OAHU MENTAL HEALTH ADVISORY BOARD
Aiea
Mrs. Doris Bulosan Dr. Noel S. Howard Mrs. Glenn Kowal Mrs. Janet Mosier Mr. Edward Wong
Pearl City
Reverend Marc Acosta Mr. Don Domondon Mrs. Eleanor Florendo Mrs. Wanita Willinger Mrs. Sandra Timko
Wahiawa
Mrs. Phyllis Dano Mrs. Reiko Kimura LTC Augustine Momiyama Mrs. Sherry Montgomery Reverend Norito Nagao
Waialua/Haleiwa
Mrs. Evelyn Adams Mrs. Marilyn Alper Mr. Joseph Leong Mrs. Shirley Matutino Reverend Timothy Morita

LIST OF TABLES
Table Page
1. Summary of Scale Statistics ............................................................... 43
2. Awareness Ranking of Services ........................................................... 49
3. Social Services Available in the Area--Awareness & Use ... 51
4. Importance of Various Educational, Counseling and Therapeutic Services that the Community CounselingCenter Can Provide......................................................................... 61
5. Types of Counseling Services ....................................................... 68
6. Comfortableness About Having a Mental Health Center,Half-Way House or Licensed Care Home in the Neighborhood(by Percent).................................................................................... 77
7. Convenient Appointment Times at the Counseling Center(by Percent).................................................................................... 78
8. Convenience of Locations of Counseling Services ...................... 79
9. Community Involvement and Feelings Toward the Community ... 80
9a. Recreation and Leisure................................................................... 82
10. Ethnic Preference by Professional Differences ......................... 87
11. Comfortableness in Seeking Services from Professionaland Lay Persons (by Percent) ....................................................... 88
12. Importance of Availability of 24-Hour Treatment Service ... 92
13. Confidence in Receiving Counseling or Psychiatric Servicesat these Hospitals and Types of Emergency Services ............... 95
14. Confidence in Types of Emergency Services .................................. 97
15. Problems in Causing Family Stress ................................................ 99

vi i i
Table Page
16. Family Stress.................................................................................... 101
17. Ways Family Members Relate and Solve Problems .......................... 107
18. Personal Health................................................................................ Ill
19. Related Items.................................................................................... 112
20. Ethnic Differences in Personal Health ..................................... 113
21. Job Quality and Job Adjustment................................................... 118
22. Ethnic Differences on Job Satisfaction ..................................... 121
23. Personal Contact (by Percent) ....................................................... 125
24. Ethnic Differences in Level of Personal Contact(by Percent) .................................................................................... 127
25. Self-Esteem and Life Satisfaction (by Percent) ........................ 132
26. Ethnic Differences in Self-Esteem and Life Satisfaction . . . 133
27. Seeking Help from Others as a Coping Strategy(by Percent).................................................................................... 140
28. Propensity to Relate Stressful Feelings to Others(by Percent) .................................................................................... 141
29. Diversion in Other Activities (by Percent) ................................. 142
30. Other Strategies in Dealing With Stress ......................................... 143
31. Several Coping Strategies .............................................................. 144
32. Ethnic Differences in Frequency of Use of CopingMechanisms (by Percent) .................................................................. 145
33. Family Similarity (Mean Differences Between Family Pairsand Unrelated Pairs) ..................................................................... 150

I. INTRODUCTION
Purpose of this Report
The general purpose of this report was to provide data for the
planning of mental health services based on a determination of Central
Oahu resident opinions regarding mental health, characteristics of resi
dents which have implications for planning for needed services, and
differences in characteristics and opinions as a function of cultural,
racial, income, age, education and other demographic variables.
Parties to the Survey
The survey of Central Oahu residents involved a process marked by
the interdependence and cooperation of several groups of persons asso
ciated with the needs assessment project. These included members of the
Central Oahu Advisory Board, administrators and other staff of the Central
Oahu Mental Health Center who represented the Mental Health Division of
the Department of Health for the State of Hawaii, consultants and staff
of MPAC, Inc., the interviewers, the majority of whom were residents of
Central Oahu, and the interviewees who comprised a broad representative
cross-section of the ethnic, age, and sex distribution in the Central
Oahu population. The interviewers included persons from a variety of
cultural backgrounds which corresponded with those racial and ethnic
groups residing in the Central Oahu area, including Caucasian, Japanese,
Filipino, Hawaiian, Samoan, and Chinese. The overlap among members on
the Advisory Board, interviewers, and interviewees in being representative

2
and ethnic groups in Central Oahu greatly facilitated the overall survey
process and provided necessary insight and cultural sensitivity in the
questionnaire development phase of the project.
General Background
For a general discussion on the background, origins and develop
ment of Federal and State supported mental health programs in Hawaii
the reader should refer to Central Oahu Mental Health Needs Assessment
Survey, Part I. Knowledgeable Resources*. For a general description of
the Central Oahu Mental Health Catchment Area, the reader should see The
1976 Central Oahu Comniuni ty Mental Health Pl an prepared by Dr. David
Bremer. A detailed analysis of recipients of mental health services in
the Central Oahu Catchment Area is available in Part II: Client Satis
faction , also prepared by Dr. David Bremer in 1976.
General Problems and Questions Addressed by the Survey
A major theme of the survey was to get feedback from previous,
present and potential users of mental health services in the Central Oahu
area regarding the types of services needed, where, how and when they should
be delivered, and who (e.g., professional, para-professional, etc.) is most
preferred in the delivery of these services. Moreover, the data gathered
by the survey was designed to address specific problems associated with
*Note: A report prepared by Dr. Anthony J. Marsella, Lida Chase, Larry Since, and Carol Perron of the Psychology Dept., University of Hawaii, as part of a survey of knowledgeable resources conducted in Central Oahu in the spring of 1976.

3
mental health factors, such as stress, personal satisfaction, family
dynamics and other important socio-psychological factors which may
have important implications both for counseling needs and desired serv
ices. The survey also sought to address the problems associated with the
demographic differences among the Central Oahu residents which are
related to counseling needs and delivery methods.
Overall Approach to the Survey and the Benefits and Limitations of theSurvey Methodology
The consultants who conducted the survey designed a process which
provided a grassroots, decentralized, non-bureaucratic approach to the
survey and which maximized resident community participation throughout the
survey process. The effort was particularly successful in the question
naire development phase and provided a basis for decentralized decision
making on all aspects of the survey project. This strategy was designed
to instill, on a small scale, community input and decentralization in
the planning for mental health services.
This scheme and its effect on those who participated was clearly
one of the benefits of the decentralized survey approach and may have
important implications in the planning of the overall project.
Other benefits generally associated with the survey methodology
included those advantages of wide sampling of a representative sample of
the residents of Central Oahu and an opportunity to see the residents in
the context of their own homes and lifestyles. Moreover, as the survey
method gathered the opinions of the people, it reflected a certain respon
siveness consistent with a participatory democratic philosophy. This type
of survey method also educates the interviewees about mental health and
increases their awareness of the services available.

4
It is necessary also to mention some of the limitations of this
method. In a one-hour survey with a stranger, the interviewee may not
reveal deep feelings or sensitive information--especially about his
problems or other negative factors. Moreover, the lay public is largely
uninformed about mental health; hence, some opinions might be off-the-
cuff and not thoroughly considered. Other limitations are those caused
by the many distractions of the home situation which may cause low con
centration level and hence, hasty answers.
While there are limitations to the survey approach, in the last
analysis, when compared to most other available forms of research which
might be employed in gathering data for the planning of services, face-
to-face interviews with randomly selected interviewees responding to a
standardized and wel1-constructed survey instrument is still considered
the best overall method of gathering information on a community need
for services.
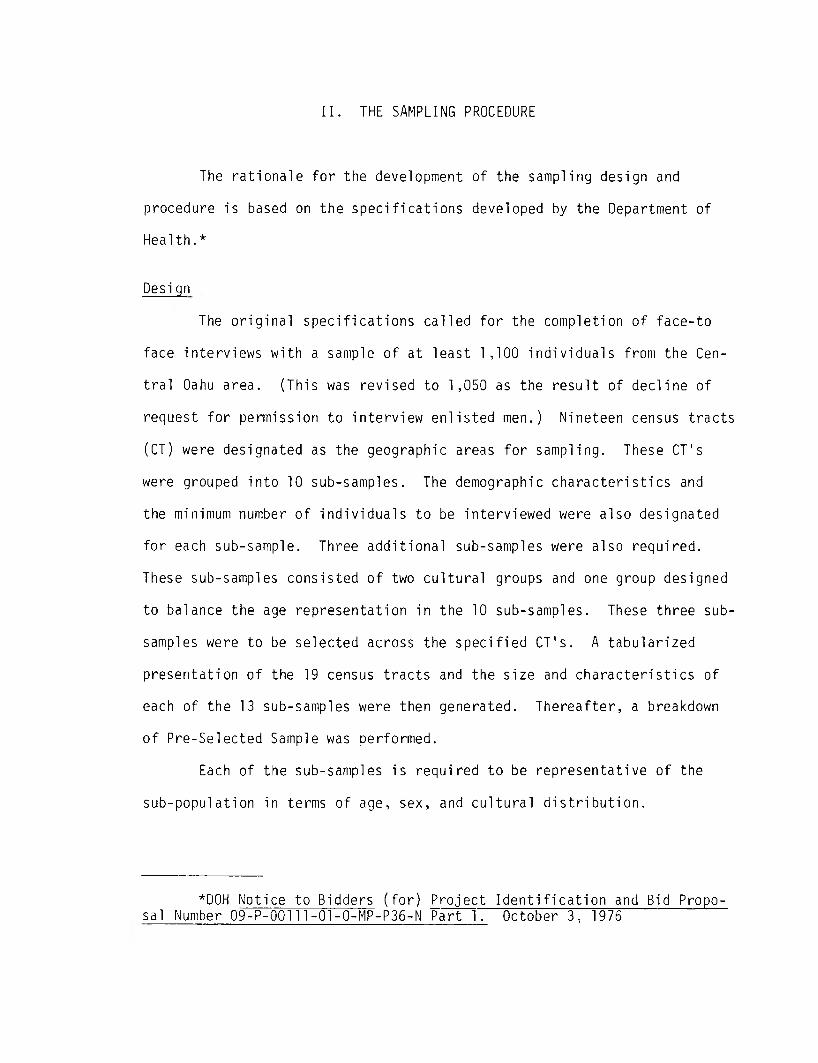
II. THE SAMPLING PROCEDURE
The rationale for the development of the sampling design and
procedure is based on the specifications developed by the Department of
Health.*
Desi gn
The original specifications called for the completion of face-to
face interviews with a sample of at least 1,100 individuals from the Cen
tral Oahu area. (This was revised to 1,050 as the result of decline of
request for permission to interview enlisted men.) Nineteen census tracts
(CT) were designated as the geographic areas for sampling. These CT's
were grouped into 10 sub-samples. The demographic characteristics and
the minimum number of individuals to be interviewed were also designated
for each sub-sample. Three additional sub-samples were also required.
These sub-samples consisted of two cultural groups and one group designed
to balance the age representation in the 10 sub-samples. These three sub
samples were to be selected across the specified CT's. A tabularized
presentation of the 19 census tracts and the size and characteristics of
each of the 13 sub-samples were then generated. Thereafter, a breakdown
of Pre-Selected Sample was performed.
Each of the sub-samples is required to be representative of the
sub-population in terms of age, sex, and cultural distribution.
*D0H Notice to Bidders (for) Project Identification and Bid Propo- sal Number 09-P-00111-01-0-MP-P36-N Part 1. October 3, 1976

6
Procedure
The specifications called for the notification of each prospective
interviewee prior to interviewing them personally, whenever possible,
about the scope and purpose of the interview, and that their participation
be voluntary. In order for this requirement to be met, a list of specific
individuals, their addresses, and telephone numbers within the selected
sub-samples was generated.
The specifications called for the notification of the prospective
interviewees by mail prior to contacting them personally, whenever possible.
Due to the difficulty of promptly responding to the prospective interviewee's
questions regarding the survey and his/her most convenient time for the
interview, it was originally decided that the purpose of pre-notification
could be best accomplished through the telephone. It was decided that the
notices for prospective interviewees who do not have telephones or who have
unlisted numbers would be mailed. However, it was later decided after
consultation with the Central Oahu Community Mental Health Center staff
and the Central Oahu Mental Health Advisory Board that the entire ran
domized list of 3,000 potential respondents should be contacted by mail.
This was done to insure the legitimacy of the survey as perceived by the
respondent.
A. Generation of List of Prospective Interviewee Names, Addresses and Telephone Numbers
A reasonably comprehensive and up-to-date listing of addresses of
residences in the Central Oahu area can come from a variety of sources.
These are the State Board of Water Supply and Sewer Division listings, the
City Department of Data Systems listing of building permits, and the
Hawaiian Electric Company listing of subscribers. The most up-to-date,
comprehensive and accessible (workable) list is that of the City Data

7
Systems. The address of each building is stored in computer tapes and
can be accessed by Tax Key Number (TKN) rather than by Census Tract (CT)
number. Unlike phone subscribers, electrical meter holders, etc., this
listing is not biased toward the higher socio-economic levels. The City
Department of Data Systems graciously provided a random list of 3,000
addresses.
The steps involved in the generation of a list of names, addresses,
and telephone numbers are listed below:
1. Map-out TKN's with CT's.
2. Generate a comprehensive TKN list.
3. Generate a random list of addresses per TKN from the City
Building Permit Tape. (The minimum number of addresses per
CT included an oversample of 25 for every 100. The ratio of
the sub-sample size to the sub-population size will depend on
the number of addresses for each Tax Plot.)
4. For each address, obtain the name and telephone numbers from
the Reverse Telephone Listing.
B. Generation of List of Actual Interviewees
The list of actual interviewees consists of individuals who passed
the screening procedure during the notification process. The questions
involved in the screening procedure are standardized except for the mili
tary barracks sub-sample. However, the need to follow a separate procedure
for the military barracks sub-sample proved to be unnecessary. After a
long and very involved process of formal requests which reached the
Commander of U.S. Forces in the Pacific, permission to survey the military
barracks at Schofield Barracks was denied. Therefore, 50 interviews were
deleted from the project total. This does not mean that military persons
living on base were completely left out of our sample. Several turned up

8
inadvertently from other areas and one interviewer had access to persons in
the Navy barracks who were subsequently interviewed.
C. System of Address-Name Sheet Distribution to Interviewers
The purpose of the system devised was to insure that the interviewers
would be distributed evenly by geographic area, so that any differences
in responses between the various areas would reflect characteristics of
the area and not characteristics of the interviewers. The consultants
wanted to accomplish this while minimizing the amount which interviewers
had to travel all around the island (which tends to increase travel costs
and affect morale).
The system devised involved assigning each interviewer to five or
six geographic sub-areas. The sub-areas were randomly distributed through
out the entire geographic area of the survey, and the assignment of parti
cular sub-areas to interviewers was likewise random. The way this was
accomplished was simply to assign each page of sample household addresses
in the survey to consecutive interviewers. For example, a particular
interviewer might receive pages 1, 10, 18, 28, and the next interviewer
receives pages 2, 11, 20, 29, etc. Since each page represented a particular
geographic sub-area, the effect was to give several district sub-areas,
e.g., several continuous blocks in Aiea--to each interviewer. This was
convenient for the interviewers, as they could count on scheduling and
conducting many interviews in the same neighborhood. It saved them the
incredible amount of travel time that would have been necessary had the
households themselves been randomly assigned to interviewers for the entire
Central Oahu area. Yet randomness was preserved since there were 56 sub-
areas utilized. For example, Pearl City was divided into nine sub-areas,
each assigned to a different interviewer. Hence, any differences between
9
the Pearl City findings and those from other communities will reflect
real differences in the opinions of the Pearl City residents, not
peculiarities of the interviewers.
D. Interviewer Teams
Interviewers were given the option of working in teams, rather than
singles, if the team method was more convenient or otherwise desirable
to them.
The idea behind the team was that for reasons of transportation,
convenience, emotional support, and safety (especially during the night
interviews), interviewers may prefer to go out into the field with one
another rather than by themselves.
One group of three interviewers and another of two exercised this
team option. They did this simply by pooling their individual lists of
names, and coordinating their scheduling of interviews, travel and
administering of interviews with one another.
The team approach proved successful. Randomness of assignment of
interviewers to geographic area was not only maintained but increased,
since each interviewer on a team went not only into his or her pre-assigned
geographic sub-area but also into the sub-areas of his or her team partners
as wel1.
The success of this approach was evidenced in the lack of unpleasant
incidents experienced by the team members, by their savings in transporta
tion costs, and by the high level of productivity (number of interviews
conducted) by the team members (all other factors taken into account).
E. Maintenance of Randomness (Interviewer assignation, etc.)
We were able to maintain the randomness of assignments of inter
viewer to geographic sub-area throughout the study. The four new

10
interviewers who came on the job subsequent to the initial group were
given sub-areas in the same manner as the first group (pages of names
having been held in reserve and not assigned to the first group). Also,
two interviewers interviewed Filipino and Samoan immigrant groups,
respectively throughout Central 0ahu--not only in certain sub-areas.
Towards the end of the survey, interviewers were permitted to solicit
interviews from anyone in Central Oahu, not only in the assigned sub-areas.
The number (46) of interviews obtained in this manner was small compared to
the number obtained from the lists, hence no significant bias was intro
duced into the study. The stability of the data from lists names to list
and solicitation names was verified by inspection of printouts of interim
data tabulations.
F. Interviewing Family Members of Interviewees
The process of interviewing other family members of one hundred of
the interviewees involved several sets which included interviewing a
second person in the household. As part of the survey we wanted to inter
view 100 persons who are members of families where someone else was also
interviewed: e.g., interviewing the husband of a family where we have
also interviewed the wife.
Each interviewer was instructed to do these interviews in either
of two ways: 1) by scheduling two members of the same family at the
same time for interviews, and interview them separately (consecutively,
or on separate days); or 2) by scheduling interviews with persons in
households where they had already conducted an interview with someone
else.
G. Instructions/Guidelines for Scheduling Second Interviews in Households
To insure randomness, the interviewers were instructed as follows:

11
--Going back to previously interviewed household:
a. Call (or go in person to home, if no phone) household previously interviewed.
b. Talk to the person you previously interviewed.
1) Reintroduce yourself--establish contact, make sure he/she remembers you and the interview.
2) Thank them for their participation. Tell them the survey is going along well; try to make them feel a part of the survey process.
3) Tell them that as part of the survey design we are interviewing two persons in the same family or household, for 100 households in Central Oahu. Tell them the purpose of interviewing more than one member of a household is to get a more complete picture of the opinions of a household than we could get just by talking to one person (the wife, husband, etc.). Tell them we are interested in families as well as in the individual members of the communi ty.
4) Ask them: Since they were so helpful in giving us their time and views before, is there another (adult) member of their household whom they think might agree to give you some time for an interview.
5) If yes, contact and schedule the second household member, giving the explanation in #3 above.
6) Always attempt first to talk to the person already interviewed, as a courtesy, before scheduling a second person in the household. If you cannot reach the person already interviewed, refer to the first interview (as in #1, 2, and 4 above) when talking to (and attempting to schedule) the second person.
--New Households (not previously contacted)
a. Use your judgement as to whether to attempt to schedule interviews with two members of newly contacted households (vs. going back to a previuosly interviewed hosuehold). If you do schedule two interviews at new households, conduct these interviews separately, e.g., do not interview a husband and wife together. Their answers will influence each other's answers and we want independent answers. Instead, conduct two separate interviews, either on different days or on the same day (successively or with a break in between). Try if at al1 possible not to have the second person present at the first person'_s^ interview, or visa-versa. [Tell them we need independent answers and get them to agree to this.)

12
b. In attempting to schedule the interviews, use your standard telephone or door-to-door approach, with the addition of steps 3, 4, and 5 above and the request for independent interviews.
c. The goal of independent interviews also applies to the cases in which you return to a previously interviewed house. Avoid having the previously interviewed person sitting in and coaching the new interviewee on the appropriate answers. Again, cite to the person our need for independent answers as a reason
H. Coding Instructions for Second Person in Household Interviews
Use the code number given to the first person you interviewed in that household, and write "2" in column number 6 (six) of the identification code number...
e.g., If your interviewer number is 09, and you previously interviewed Mr. Smith, and his code number was 09025; now you are going back to interview Mrs. Smith, then her code number will be 090252.
e.g., If your interviewer number is 12, and you are going out to interview both Mr. Kakehashi and his daughter, you first interview the father, and the code number for Mr. Kakehashi is 12060, then the code number for his daughter is 120602.
In every case, the second person interviewed in the household receives the identical code number as the fi rst person interviewed in that household, with the addition of "2" in column six.
Although required by the specifications, this was a somewhat debat
able requirement from the consultant's perspective. Interviewing more
than one member of the same family provides little more than some data on
the consistency of perceptions of family members on how the family re
solves their tensions. This information is mildly intriguing from a theo
retical viewpoint, but it applies to only a few questions on the question
naire and does not seem to bear on the main purpose of the analysis.

III. SURVEY METHODOLOGY AND PROCEDURE
It is important to note the survey methodology employed in this
report was not intended to test any theory of mental health. Rather,
this survey is at a more general level. Basically, we are measuring
opinions, circumstances, conditions and background factors in people's
lives--on an aggregate, sociological level. However, we still must assume
some model of the factors related to mental health problems in order to
structure the questions we ask. The model below is general and sufficient
for this purpose.
Model
These factors are predictive of Mental Health/Mental Health
Problems:
1) genetic--constitutional
2) past life experience, especially early experience in the family.
3) quality of present life as an adult--material well-being, activity, status, sense of meaning and purpose
4) acute stresses--circumstances in the present
5) quantity and quality of interpersonal support and emotional contact
6) stability of the society and culture in which the person lives (established values)
7) expressiveness of feelings
The survey design from this general theoretical perspective indicates
that we are not measuring factors #1 and #2 above since our methodology and
considerations of privacy do not permit it, nor would #1 and #2 be meaning
ful on an aggregate level. It should be emphasized that the survey

14
questions cover opinions, factors related to mental health of the residents,
and demographic characteristics of the residents, and their interrelation-
ships. This is adequate, given the purpose and methodological and ethical
considerations.
Questionnaire Development Process
The questionnaire utilized in the survey was a product of the
cooperative effort of many individuals: The MPAC staff put the question
naire together, including input from the Mental Health Center Staff, from
the Mental Health Community Advisory Board, from the community members
themselves, and (to a lesser degree) from other survey instruments. This
process enabled us to come up with a questionnaire that reflected the
interests of the various groups involved (the professional mental health
staff, the consultants, and the community). The questionaire was theo
retically balanced, encompassing likely causal antecendents to mental
health needs and opinions from both the medical and largely psychological
perspective of the professional mental health center staff and the
largely sociological, social psychological and social planning perspective
of the MPAC consultants. Finally, the input of the survey interviewers
gave the questionnaire a thorough "cultural screening" such that content
and phrasing which might have been either meaningless, offensive, or
biased vis-a-vis the many cultural groups was detected and corrected or
deleted.
The first step in the questionaire development involved a critique
of other survey instruments related to mental health or used in the area of
Central Oahu. This included a critique of the survey instrument used for
the survey of "knowledgeable sources" in Central Oahu which was cited pre
viously in the introduction (Chase, Sine, Perron, and Marsella, 1977). A

15
preliminary analysis of the results of this survey was useful in the
selection of several individual items for our questionnaire (i.e., those
that emerge with .05 level of significance or better). Other survey
instruments critiqued included those used by the State Department of
Health, the City and County Commission on Aging, Kaiser Permanente in
Hawaii, and several other public and private agencies. The first draft
was then presented to various members of the Central Oahu Mental Health
Center staff and the Central Oahu Mental Health Advisory Board for comment
and revision. Thereafter, a second draft of the questionnaire was written
based on the critique and revision of the first draft. The second draft
went through a process similar to that of the first draft with an item
by item analysis by the Center staff and the Advisory Board. It should
be noted that the Advisory Board members who were non-paid but concerned
residents were particularly conscientious in the critique of the question
naire. Mr. Sunao Murata and Dr. David Bremer of the Central Oahu Mental
Health Center were helpful in this phase of the survey process. The
valuable comments made by members of the Advisory Board and Mental Health
Center were incorporated in the writing of the third draft of the survey
instrument.
The third draft was then critiqued by the interviewers during their
training sessions. This involved three types of screening of the survey
questions by the interviewers: for content...did the questions faithfully
tap concepts related to their understanding of mental health problems; for
wording...was the wording of the questions clear, and understandable when
asked verbally in the interview context; and for cultural bias and sensi-
tivity...were the questions ethnocentric or did they adequately mirror
the perspectives and life experiences of the different cultural groups
in the community?

16
Considerable time was spent on obtaining the interviewers' opinions. It
was important to get their feedback in the context of the interview pro
cess itself, since there can be a great difference between how a question
naire reads on paper and how it comes across when the quesions are asked
verbally during the face-to-face interview itself.
The questionnaire was revised based on the interviewers' critique and
continued through several revisions with additional input from the Center
and the Advisory Board. The seventh and final draft was then tested in
the field.
Training and the Field Test
Generally, all the interviewers trained were well prepared to go into
the field. All interviewers indicated in their training evaluations that
they,themselves, felt well-trained and ready. The MPAC interviewer-trainer
concurred with this evaluation. As a group their strengths were:
1) High level of motivation.
2) Good grasp of both the principals and techniques of interviewing.
3) Good personal qualities and styles for interviewing in this community.
4) Excellent demographic match (ethnicity, age, sex, background) to the community to be surveyed.
5) Above average in general intelligence and specific knowledge of community mental health services, health planning and survey research theory and technique.
Overall, the training sessions provided additional evidence of vali
dity of some assumptions and practices about training particularly the
community-based approach and the use of the group itself as the primary
actor in the training situation. The de-emphasis of lecturing and the
extensive use of role-playing, video tape feedback, group critique, and

1/
other participatory exercises prove to be the preferred training methodo
logy. The instrument was perfected to a degree that could not have been
attained in any other way. The changes made in the instrument (especially
in its format and in the method of administering it) by the trainees con
tributed to creating an extremely smooth, incisive, and accurate question
naire. The format of back-to-back 5-hour sessions divided by a week dur
ing which trial interviews and debriefings by the Field Coordinator were
held proved most satisfactory. (For a detailed discussion on the train
ing techniques employed and the evaluation by the interviewers, see
Appendix M.)
Practice Interviews, Pre-test and Reliability Check
The Field Coordinator reviewed the interview procedure and question
naire wording and telephone and door-to-door contact and solicitation pro
cedures to make them consistent with each other and with the sampling pro
cedures prior to the practice test. He then worked individually with each
interviewer in monitoring his or her practice interviews (conducted with
any person, using an interim version of the questionaire) and pretest
interviews (conducted with Central Oahu residents solicited by telephone
and previously unknown to interviewer). It was determined that each inter
viewer was ready to do actual interviews by inspection of the data
sheets from their practice, pretest interviews and by talking with them
about their interviews, as well as by observing them in training. No
interviewer was permitted to conduct actual interviews until judged
capable. All interviewers trained were judged capable, some after only
one or two practice and pretest interviews, some after five or six. The
requirement that each interviewer complete at least five practice inter
views and observe other interviewers during at least five interviews was

18
completed through a combination of the training along with the practice
and pre-test interviews.
The questionnaire was then in its final stage of development, the
"fine tuning" stage in which subtle flaws detected in the field test were
corrected based on feedback from interviewers' pre-test and practice
interviews.
After discussions with the Center staff, it was decided to do a
reliability test, as originally planned, on the questionnaire even though
the questionnaire items had a high face validity with largely straight
forward information-seeking items, and required little inference in their
interpretation. To this end, it was arranged to have an experimental
control group comprised of Central Oahu residents respond to the question
naire. A Spearman non-parametric sub-program was run to test the reli
ability of the questionnaire. The original sample was 36 persons in the
experimental control group which were tested and then retested two weeks
later (total of 72 interviews). The test for reliability produced an
average item correlation of .86 through the Spearman non-parametric pro
gram and a slightly higher correlation (.88) using the Product-Moment
correlation. There was no significant difference in the mean (average)
of the pre-test and post-test. (As might be expected the demographic
items produced higher correlation in the reliability test than those
items dealing with stress, comfortableness, etc.).
As an alternative or complement to the item by item before-after
correlation we also looked at the stability of the sample group results,
before and after, for each item. The rationale for this is that we were
interested in aggregate level opinion and characteristic data, not in indi
vidual level data. Therefore, the kind of reliability we wanted was group
stability over time (e.g., if we had taken the same sample at a different

19
time, would we have gotten similar results).
After employing several group means comparison tests (e.g., t-test
for matched groups on the before-after data) the results indicated a high
before-after group stability even for several variables with a Kendall's
tau value on the low side.
Structure and Content of the Questionnaire
The questionnaire was somewhat lengthy containing 234 separate
items but was structured to maximize clarity of response and use of sta
tistical analysis. To this end, three and five point scales were used and
a copy of each scale was given to the respondent during the interview to
maximize the communication process. The items were distributed among
three main areas in structuring the questionnaire: demographic character
istics of the respondents, social characteristics of the respondents with
implications for mental health needs, and opinions about counseling and
other public services. In general, the primary questions addressed by the
three main areas in the questionnaire sought to provide information
regarding:
1) characteristics of the persons interviewed
2) their current mental health--insofar as we can infer it from our general, sociological level survey questions (i.e., we did not do clinical interviews)
3) their opinions about mental health services
4) the relationship between characteristics and mental health (do different groups differ on mental health?)
5) the relationship between characteristics and opinions about mental health services
6) the relationship between mental health and opinions about mental health services
7) the validity of the data, the major substantive themes in the data and the degree of utility of the data for planning

20
The demographic items of the questionnaire included:
1) sex
2) age
3) place of birth
4) religious preference
5) marital status
6) residence in Hawaii
7) residence in Central Oahu
8) number of people living in the home
9) evidence of extended families, loners, etc.
10) nature of living quarters
11) occupation
12) ethnic/racial identification
13) educational level
14) types of schools attended
15) civi1ian/mi1itary
16) income level of household
17) residence by particular community within the Central Oahu area
(For further discussion on these demographic variables, see items B66-B94
in the questionnaire in Appendix A.)
Specific factors associated with the social characteristics of
residents with implications for mental health needs in the questionnaire
included:
1) ways family members relate to each other
2) how disagreements are resolved within the family
3) sources of stress within the family
4) physical health of respondent
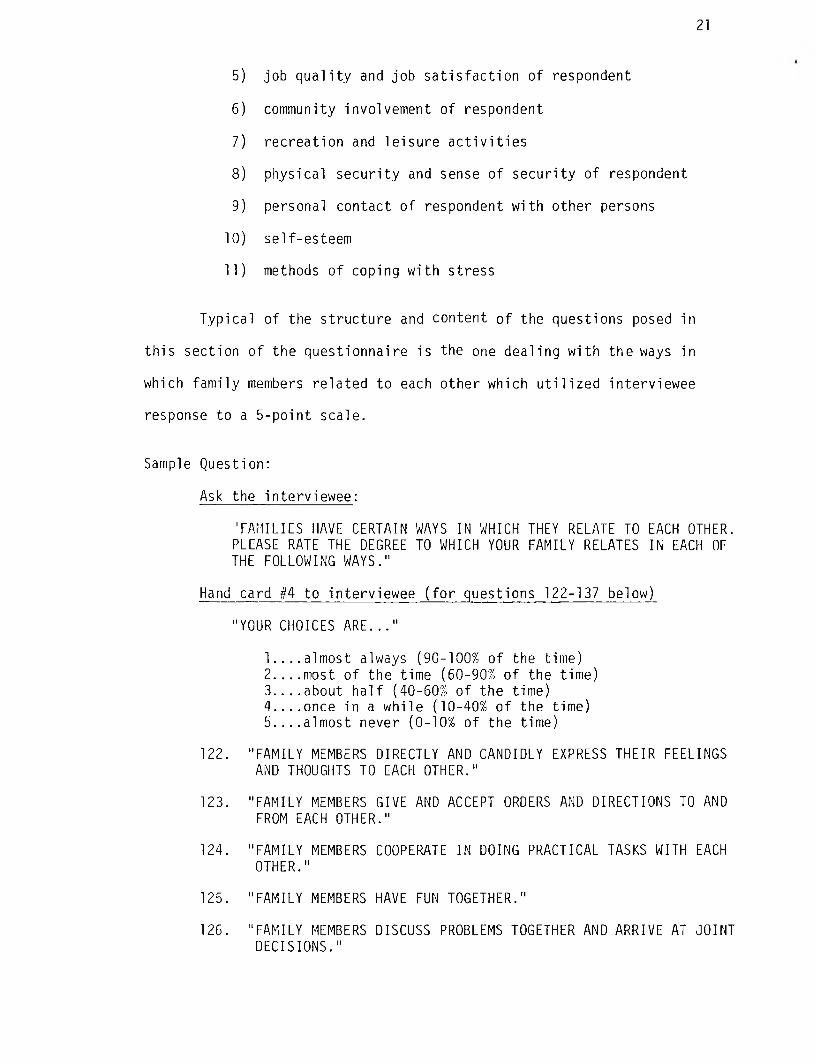
21
5) job quality and job satisfaction of respondent
6) community involvement of respondent
7) recreation and leisure activities
8) physical security and sense of security of respondent
9) personal contact of respondent with other persons
10) self-esteem
11) methods of coping with stress
Typical of the structure and content of the questions posed in
this section of the questionnaire is the one dealing with the ways in
which family members related to each other which utilized interviewee
response to a 5-point scale.
Sample Question:
Ask the interviewee:
"FAMILIES HAVE CERTAIN WAYS IN WHICH THEY RELATE TO EACH OTHER. PLEASE RATE THE DEGREE TO WHICH YOUR FAMILY RELATES IN EACH OF THE FOLLOWING WAYS."
Hand card #4 to interviewee (for questions 122-137 below)
"YOUR CHOICES ARE..."
1.. ..almost always (90-100% of the time)2.. ..most of the time (60-90% of the time)3.. ..about half (40-60% of the time)4.. ..0.ce in a while (10-40% of the time)5.. ..almost never (0-10% of the time)
122. "FAMILY MEMBERS DIRECTLY AND CANDIDLY EXPRESS THEIR FEELINGSAND THOUGHTS TO EACH OTHER."
123. "FAMILY MEMBERS GIVE AND ACCEPT ORDERS AND DIRECTIONS TO ANDFROM EACH OTHER."
124. "FAMILY MEMBERS COOPERATE IN DOING PRACTICAL TASKS WITH EACHOTHER."
125. "FAMILY MEMBERS HAVE FUN TOGETHER."
126. "FAMILY MEMBERS DISCUSS PROBLEMS TOGETHER AND ARRIVE AT JOINTDECISIONS."

22
127. "FAMILY MEMBERS ARE SENSITIVE TO EACH OTHER'S NEEDS AND FEELINGS."
(For further information on this section, please see items 122-140, and
B1-B63 in the questionnaire in Appendix A.)
Specific questions in the questionnaire related to opinions about
counseling services included:
1) awareness of social services (also usage and duration of usage--it was felt that awareness is a necessary condition for usage, regardless of "need".)
2) preferred location of counseling services
3) importance of various kinds of counseling services (should the state provide them?)
4) preferred formats of service delivery (individual vs. group counseling, regular vs. intermittent schedule, structured vs. unstructured)
5) felt degree of comfort in going for counseling services
6) opinion regarding counseling center location in own vs. other community, in own neighborhood
7) convenience of various counseling center service times and locations
8) comfortableness with mental health professionals and other helping agent roles
9) importance of different 24-hour services
10) confidence in obtaining in-patient mental health counseling at various hospitals
11) preferences for different emergency counseling methods
A typical question dealing with this section of the questionnaire
is the following one on preferences for different emergency counseling
methods which utilized a 3-point scale.

23
Sample Question:
Ask the interviewee:
"IF YOU OR A MEMBER OF YOUR FAMILY OR A FRIEND HAD NEED FOR EMERGENCY COUNSELING SERVICES (e.g., IF THE PERSON WAS FEELING VERY BAD, ANXIOUS, ETC.), HOW CONFIDENT WOULD YOU FEEL ABOUT THIS PERSON GETTING THE HELP THEY NEEDED IN THE FOLLOWING WAYS:
"YOUR CHOICES ARE..."
1.. ..would feel confident2.. ..would have mixed feelings3.. ..would not feel confident
117. "THROUGH A HOSPITAL EMERGENCY ROOM"
118. "AT THEIR HOME--A COUNSELOR VISITING THE HOME" (COUNSELORCOMING TO YOUR HOME RATHER THAN YOU HAVING TO GO TO A HOSPITAL OR CENTER)
119. "VIA THE TELEPHONE"
120. "AT A LOCAL COUNSELING CENTER"
121. "AT A COUNSELING CENTER IN ANOTHER COMMUNITY"
(For further information on this section, see items 1-121 in questionnaire
in Appendix A.)
The relationship and interdependence of these three types/kinds
of variables used in the questionnaire is depicted in the figure below:
A: opinions--regarding mental health services
B: reports on subject's life--family patterns, experiences, circumstances, etc. related to mental health = mental health indicators
C: demographic variables

24
The results of the use of cross-tabulation and other statistical
techniques used in explaining the various relationships of these three
groups of variables is discussed in chapters 4-16.
Questionnaire Translations
The translation process for both the Samoan and Ilocano language
versions of the questionnaire was carefully prepared. It was decided for
the purpose of relevance and utility that the first translation of the
questionnaire for both the Filipino and Samoan respondents would be done
by the Filipino and Samoan interviewers themselves.
The Filipino and Samoan version of the questionnaire was checked
thoroughly and "back-translated" into English by two persons other than
the two interviewers. These other two native speakers were chosen on
their demonstrated ability and experience involving other bilingual
bicultural projects. These other persons also assisted in the checking
of the results of the practice interviews and pre-tests of the translated
questionnaires.
Ms. Luz Marquez, the interviewer who worked with the Filipino
community had considerable experience in the bilingual bicultural pro
grams at the University of Hawaii and is a resident of the Central
Oahu area. The MPAC staff was also especially fortunate to have Mr. Kaio
Salanoa as our Samoan interviewer. In addition to being committed to
the needs of the Samoan community, Mr. Salanoa was selected to be High
Chief, and is widely respected by the Samoan people throughout the
Hawaiian Islands. Having these two people greatly facilitated the re
sponse rate among two culturally isolated groups in Hawaii.

25
Quality of Interviews
The quality of interviews was considerably high. Interviewers
were asked to rate each interview at its completion on a five point scale:
(1) poor; (2) fair; (3) average; (4) good; (5) excellent. Only the
"good" (30%), "excellent" (53%), and average (10%) interviews were used in
the analysis as "good data" while the below average and "poor" interviews
were rejected in the monitoring process. Moreover, interviewers were
asked to comment in a brief narrative on the quality of the interview,
the interview situation and the condition of the interviewee. This pro
vided the staff with an additional criteria in judging the quality of
the interview.
Typical of the comments by the interviewers on the quality of inter
view are as follows:
"Interviewee is a very salient, person. As interview progressed, he marked that he had never been through a study and was impressed with the in-depth but personal questions. He further expressed that he felt such a survey could be very valuable after all the data was compiled...I had the feeling that he had had some thoughts in the past that he was not certain that others could identify with in his life but because certain questions were asked, he felt others had similar concerns...Another plus was that he not only turned down the stereo but later turned it off.He spoke of growth along the dimensions of liking himself..." (rating: excellent)
"A very good person to interview. She is a lonely, rather shy, military wife. She was most cooperative and seemed to enjoy having "callers". Frankly, I feel that she benefited from the interview for she learned of the resources where she could spend her time and could find enjoyment." (rating: excellent)
"A young girl (18) that is happily (now) going to high school. Also working at the only employment she could find as a topless waitress. The home environment was very much a family together (not all are related)--there was an underlying feeling toward an elderly person that lives elsewhere. The house is in a very remote area. She has been to the Counseling Center for help. Also, she has been a volunteer for the preschool." (rating: good)

26
"He was interested in the survey and expressed his feeling as to the importance of such a survey and its implementation for many that need help. He has a very responsible position in the community. He considers his position a challenge. He is very instrumental in directing the course of many young people's lives." ( rating : excellent)
"Interviewee seemed drugged. Did not have estimate of income." (rating: fair to below average)
"She has 2 children, divorced, not able to work due to sickness. They're under welfare and have lots of problems. She stated that this survey is very important because she and her family have many problems. It could help very much if some of this stated in the questionnaire will be provided for the people by the State. She stated that she's looking forward to these services so she could use-- or her friends and neighbors." (rating: good)
"The interviewee was cooperative but the interview was poor because she just finished grade 4 and was only in Hawaii for four years and it took a long time. She has several questions about her own sickenss and health with where to go. Interview was difficult even in Ilocano because she doesn't know the types of services or is very ignorant of what's happening in Hawaii." (rating: poor)
"Understood some of the questions although in the first part of the questionnaire there are some that she can't get the meaning. She's a high school graduate but only one year in Hawaii. She related so many problems about her family that they are encountering. Also, she relates the problems of her neighbors that she can observe and she commented that even if these services were present, the people don't know it...so she suggested that there should be outreach programs to go out to the community to help people or to explain to the people about these services. She cited her family as an example that she didn't know most of these services." (rating: average)
"Said this is a good project 'cause they want to know the opinions of the people before they plan these services'.Felt it was very good idea to have this translated version because other people like her father (whom she referred for another interview) would not understand what this means without translation." (rating: average)

27
"Had difficulty understanding the questions. Lost her husband 2 years ago and has four chi 1dren--the youngest less than 4 years old. She confesses that she almost lost her mind. She needed counseling at that time but because it was not available in their place she just waited for time to heal her sorrows. She said these services should be good if it should be available in their area because its quite hard for the people to go to another community. She said if she had to encounter another sorrow in life she would be able to endure it more. She also suggested that if these services should be available, there should be a bi-lingual person to work to help the Filipino people." (rating: fair)
"Went to high school, drinks alcohol every day. Suffering from enlargement of the heart and kidney trouble. He doesn't realize or believe in some of the doctor's advice. His thoughts is the one right for himself. Observed that he doesn't accept other's ideas. Made little comments, was just grateful to be accepted to be interviewed. He was very reluctant at first because he was so scared that he might get in trouble for this interview. He even asked if he was going to be charged for this but I explained to him there was no obiigation... just his opinion is important." (rating: average)
"Over 65 years of age living back in Waiamea Bay in an isolated place. Seldom go to cities like Honolulu. The environment is a rural life, a very simple community. Elementary school education. Stated this is helpful for people if these services should be provided in the near future 'cause they feel that even if they stayed for a short while, lots of people need this help." (rating: average)
"Commented that sanitation of restaurants was not enough, inspection of employees was needed; old-age homes not taken care enough; many can't pay their Medicare--especially plantation workers who don't have insurance (1st generation). Should make it easier to get these services--too much red tape. There's a language barrier (Filipino, Japanese - 1st generation) of Asian people--they need services." (rating: good)
"Generally satisfied with Hale Mohalu Hospital. Counseling necessary especially due to high incidence of military (Navy) dependents--father is gone for long periods." (rating: good)

28
"Activity center for mentally retarded as well as mental health patients urgently needed. Gratifying to see elderly mentally retarded people accepted into Parks &Recreation elderly programs. Need to provide transition for staff of places like Waimano as clientele decreases as well as follow-up on clients who leave. Need to plan for patients' and employees' futures for effective system." (rating: average)
The interviewers were also required to record the starting and
completion time of the interview. The results from the over 900 completed
"good data" interviews showed an average length of 50 minutes for each
interview. This average time remained rather stable when compared across
interviewer, geographic location and ethnic group (i.e., interviews con
ducted in other languages) and over time throughout the 2^ month inter
view period. These comparisons were able to be made on an incremental
basis throughout the interview process due to the monitoring scheme and
process of collecting and storing the data.
The use of optical scanning procedure involved the direct coding
of respondents' answers to the questionnaire on the IBM 503 scanner sheet.
This resulted in the cost-efficient production of data cards since it
eliminated the need for the labor intensive manual keypunching operation.
After the coding of responses on the IBM 503 there were two additional
steps involved in the process. The first was the construction of scanner
master sheet, control sheet and drum card. These materials gave instruc
tion to the optical scanner on how to read the IBM 503 and how to punch
the cards in "scanner" notation. The second involved the adoption of
a translation program which enabled the IBM 360 computer to translate the
data cards in "scanner" language to ordinary notation for conventional
statistical package analysis.

29
Data Handling Procedure
The following system was used for handling the data once it was
turned in by the interviewers:
--Check code numbers on IBM and supplementary data sheets for accuracy.
--Scan IBM sheets for accuracy, completeness and neatness.
--Check supplementary data sheets: codings, accuracy, interview validity and quality.
--Check completed interview form for name and address of interviewee against code number.
--Record, by interviewer, the code number of the interview, the interview quality, supplementary data, and comments.
--Xerox a copy of the IBM data sheets for retention in the offi ce.
--Give the original IBM sheets to the computer programmer for computer analysis.
Computer and Statistical Procedures
After the practice set of questionnaire responses was received
and run on a scanner, a few minor problems in filling the IBM sheets were
noted--such as improper identification numbers, more than one answer
given to one question, and bending of the IBM sheets. The interviewers
were informed of these errors and subsequent problems were avoided.
The scanner punched the data on cards in a special cryptic format.
This deck was then read into the computer and processed by the TRANUH
program and the reformated data was stored on a disk.
A FORTRAN program was written to correct questions which possessed
more than five possible responses. The disk data was then read by this
FORTRAN program; corrections were made and the final form data was
returned to the disk. The data was then in a form amenable to statistical
analysis. Also listings of the data were printed out at each stage of

30
the above manipulation for checking and control.
Interview Monitoring
The system adopted for monitoring interviewer performance and
interview quality consisted of six procedures:
1. checking returned completed data sheets for completeness and accuracy;
2. checking quality of interview, as recorded by interviewer on supplementary data sheet;
3. checking time sheets for interviewer efficiency ($ cost per completed interview, etc.)
4. conversations with each interviewer on at least a once-a-week basis to ask them about their work (quantity, problems);
5. spot check with persons who had been interviewed to verify that the interview had been conducted;
6. accompanying each interviewer in the field on an interview.
Procedures (1) through (4) were carried out during the entire
interview process, and indicated consistent competent interviewer per
formance. Step (5) was carried out during the week of January 24th - 31st
and on a continual basis thereafter. Step (6) was carried out during the
weeks of January 24th - February 7th, and March 1st - March 7th.
In addition, the Field Coordinator provided technical and personal
support to the interviewers via periodic memos, telephone calls, and
meetings, and maintained records of completed interviews.
Accompaniment of Interviewers and Field Coordinator1s View of the Interview Situation
After accompanying the interviewers, the Field Coordinator reported
the interview situation including all the distractions one would expect due
to the interviews being conducted in the person's home, e.g., kids, dogs,
telephone interruptions, spouse sitting in, etc. Judgment from the

31
accompaniments and from interviewer comments on other interviews was that
these distractions did not in the vast majority of instances, invalidate
the data gathered. The questions asked were not so deep or delicate as
to be susceptible to invalidation due to these distractions. The survey
was a sociological opinion survey of the community as a group, not a
psychological diagnostic test for individuals.
Some of the comments typical of those recorded during the accom
paniment of the interviews are presented below:
1. The interviewee was a Caucasian woman, middle-aged, living in a house in Aiea Heights. Her husband was present for the interview. The interviewer did an excellent job. I became aware of the possible effect of having a spouse present, sitting in on the interview--the effect being not so much to induce false responses as to (perhaps) "tone down" the degree of response more towards a "neutral" or "everything's okay" position.
2. The interviewee was a young Cosmopolitan male living in a duplex apartment in Pearlridge. His wife was present during the interview. The interview was conducted in English. The interviewer did a fine job: I was gratified and impressedto see her develop so well as a professional interviewer, and told her so.
3. The interviewee was a Caucasian male, living in a house in Foster Village. He was a military veteran, permanently disabled--a paraplegic. The interviewer did an excellent job in a somewhat sensitive' situation. I noted the strength and support this man derived from his daughter and thought how important family relations are to the mental health of their family members.
4. The interviewee was a Japanese housewife living in a house on Halawa Heights. There was a baby in the house who caused occasional distractions. The interviewer did a smooth, fine job. The distractions did not invalidate the data, although I can see how sufficient distractions could cause interviewees to lose their train of thought.
While the above comments reflect a relative smooth interview process,
the project did have a few isolated incidents, such as the case where one
of the interviewers was bitten by two dogs while standing on the street
in preparation for an interview. He was not seriously injured, but

32
sustained a torn shirt as well as a couple of bites. He received a
tetanus shot, and remained in good spirits about the incident and even
went out to conduct more interviews on the same day. (He was paid the
cost of his shot plus his shirt plus a $15.00 bonus for "combat zone"
work.)
It was quite surprising given the great distances between some of
the interview locations that more problems did not occur. However, the
overall success of the survey process and completion rate was due to
the general maturity, sensitivity, and dedication of the interviewers
nurtured during the training sessions and remained intact throughout the
project.

IV. DESCRIPTION OF THE POPULATION
Of the 928 respondents in the survey, the distribution of males
and females was fairly even:
Not recorded .9% 8100.1% 928
Ethnic Group Percent Number
Caucasians 32.3% 300Japanese 27.0% 251Filipino 13.9% 129
*Samoans 8.9% 83Cosmopolitan 7.8% 72Hawai i ans 2.9% 27Chi nese 2.3% 21BIacks .9% 8Others 2.6% 24No response 1.4% 13
*The Samoans were purposely over-represented in the contracted specifications, the rationale behind this being that Samoans have been traditionally under represented in previous surveys and also because this group would be likely to require special approaches to service delivery.
Over 70% of the respondents had lived in Hawaii for 6 years or more
and 60% of these long-time residents had lived in Central Oahu for 6 years
or more.
Length of residence in Hawaii Central Oahu District
26 years or more 35.9% 333 14.2% 13215-25 years 21 .0% 195 23.0% 2136-14 years 16.2% 150 25.1% 2332-5 years 19.3% 179 25.1% 2331 year or less 6.1% 57 10.1% 94
No response 1.5% 14 2.5% 23
The ethnic and racial backgrounds in the sample were relatively
representative of the population as a whole except for the Samoan group.*

34
The distribution of highest education level attained showed that
86% of the sample surveyed had reached the high school level with 11%
completing college and 12% doing post graduate work.
were statistically significant.
In addition, approximately 50% of the 928 had attended other types
of schools such as adult education, trade or technical school, business
or commercial school.
A breakdown of mean educational level attained by race/ethnic group
is as follows:
Rank-order Race/ethnic background
Mean Educational Level Category
(see above scale'
1 Chinese 4.232 Caucasi ans 4.173.5 Japanese 3.873.5 Blacks 3.875 Cosmopolitan 3.746 Others 3.617 Hawai i ans 3.578 Filipinos 2,909 Samoans 2.87
The differences in educational levels among racial/ethnic groups
Highest Level of Education Attained Percent Number
1 Elementary (grades 1-6) 4.3 402 Junior High (grades 7-9) 5.4 503 High School (grades 10-12) 38.8 3604 Col 1ege (1-3 years) 24.5 2275 College graduate 11.0 1026 Post graduate work 12.3 114

35
Race/ethnic backgroundMean Income Category
(See above scale)
Caucasians 5.38Japanese 6.14Chinese 5.80Hawai ians 5.07Filipinos 4.79Samoans 4.57Cosmopolitans 5.23Blacks 3.87Others 5.36No response 5.81
The differences in income among racial/ethinc groups were statistically
signi ficant.
The percent of respondents currently in the labor force was 72.3%.
Those not counted in that classification were the housewives (16.8%), the
retired persons (6.8%), and the unemployed (2.6%). Listed below is the
The median household income of the sample was between $10,000 and
$15,000. The State's poverty guidelines for an average family is $6,000.
In the sample, 15% or 139 respondents reported income falling below
$7,500.
Scale Household IncomePercent of Respondents
Number of Respondents
1 Below $3,000 2.8 222 $ 3,001 - $ 5,000 4.8 453 $ 5,001 - $ 7,500 7.8 724 $ 7,501 - $10,000 8.8 825 $10,001 - $15,000 15.7 1466 $15,001 - $22,000 23.7 220
Over $22,001 4.8 45Not reported 32.0 340
For ethnic/racial groups the mean household income distribution was
as follows:

36
number of respondents in each occupation category:
Occupation CategoriesPercent
of RespondentsNumber of
Respondents
Professional/Managerial 20.0 186Housewives 16.8 156Sales/clerical 12.3 114Skilled labor 11.0 102Other occupations 9.4 87Retired persons 6.8 63Mid-management 6.3 58Semi-skilled 4.7 , 44Unemployed 2.6 24Unskilled 2.0 19No response 8.1 75
When respondents were asked about their marital status, who they
lived with and how many they lived with, it was noted that over 90% of
the respondents lived with other people. Only 3.2%, or 30, respondents
lived alone. Respondents who were married made up 74.7% (693) of the
sample, followed by 16.6% (154) single persons, and 3.7% divorced/
separated. A majority of the respondents, 63.9%, lived with 2-5 other
people, followed by 14.5% living with only one another. Ten percent
lived with 6 or more people. People the respondents reported living
with were as follows: spouse and children - 42%; extended family,
with spouse, children, grandparents and/or other relatives, etc. - 14.2%;
spouse only - 12%; aunt, uncles and other relatives - 6.6%; friends -
6.1%; grandchildren only - 4.2%; and alternate living quarters - 1.4%.
The religious preferences expressed were: Protestant - 36.2%;
Catholic - 25.6%; Buddhist - 11.6%; and other religions - 16.4%. Ten
percent did not respond to this question.

37
Respondents identifying with the military community comprised 20%
of the sample while the other 75% were civilians (5% did not respond).
Of the 48.5% answering the question on military status, 15.3% were
active military persons, 5.5% were military dependents, 19.5% were
civilians identifying with the military community, 3.3% were veterans,
3.3% were retired military persons, and 1.5% were military reserves.
Close to one-third or 30% (278) reported being eligible for counseling
services from the military.
Location by Residence
The original questionnaire had eight possible responses which were
the eight sub-areas of the Central Oahu Catchment Area. In the analysis
of the data and for purposes of aggregation, several of the areas were
combined. Aiea and Pearl City combined to form the most populous and
most urbanized area; Mililani Town represents a high growth sub-division
which is ordinarily a suburban community. Wahiawa is what might be con
sidered a semi-rural area with some suburbs and a military enclave encom
passing Schofield Barracks and Wheeler Air Force Base. Haleiwa, Wailua,
Kunia (which is actually in the Leeward Mental Health Center Catchment
area) and Waipio represent rural settings with large tracts of agricul
tural lands and very sparsely populated and somewhat isolated rural com
munities. The specific breakdown of the number of respondents by loca
tion is represented below:
Area Number Percent
Aiea - Pearl City 449 48Mililani 196 21Wahiawa 104 11Haleiwa/Wailua 141 15Kunia/Waipio 38 5
928 100%

38
Military Services: Eligibility & Convenience
Several questions dealing with the convenience of receiving ser
vices from existing military counseling centers revealed some interest
ing results. (See B90-B93 in questionnaire.)
Of the 331 respondents who answered the question on eligibility,
278 or 30% were eligible for the various counseling services provided by
the military. Interestingly enough, approximately 70% of those eligible
for military provided services found neither the need or inclination to
use these services. Of those who were eligible and did use the services,
approximately 62% felt they could expect relatively prompt service once
requested (i.e., one day to one week), while 38% of those who used the
services were of the opinion that it took anywhere from 2 weeks to 3 months
to receive mi 1itary-provided services after an official request was made.
In responding to the question, "How comfortable would you feel
receiving counseling services from the military dispensary?", nearly 20%
of those who responded to the question stated that they would feel "uncom
fortable" or "very uncomfortable".
This relatively high percentage of those people who perceived the
military dispensary as an uncomfortable counseling environment, coupled
with the 32% of the users of this service who felt they had to usually wait
anywhere from two weeks to three months to receive services once requested,
may help to explain why such a high percentage (70%) of those eligible do
not take advantage of military provided services. This seemed to be the
case even among those eligible persons who found the military services to
be relatively convenient. Of those who answered the question, 81% found
the services to be conveniently located. Approximately 13% of those eli
gible for services found the dispensary to be "slightly inconvenient" while
only 6% felt that the dispensary was clearly "inconvenient" to get to.

39
Therefore, it would seem that location is not the main reason why persons
who are eligible for military-provided services are inclined not to use
these services.
A breakdown of the respondents by ethnic group failed to show any
significance in the inclination to use the services. However, there are
distinctions in the distribution among the specified ethnic groups in
terms of eligibiity for services.
As shown in the table below, of the 278 persons eligible for ser
vices provided by the military, 180 (65%) of these persons were Caucasian
and 28 (10.1%) were Japanese. Interestingly enough, the next two largest
groups were the Filipino (7.6%) and Samoan (7.29%) immigrants. This may
be due to the large number of Filipinos and Samoans who achieved citizen
ship through military service in the U.S. Armed Forces.
Housing
The vast majority of the respondents (75.3%) live in single family
dwellings. This might be expected in an area like Central Oahu which has
numerous sub-divisions and suburban communities.
Ethnic Group EligibilityPercent of
Those Eligible
Percent of those Eligible from Total
Sample of Ethnic Group
Caucasian 180 64.7 60.0Japanese 28 10.1 11.2Filipi no 21 7.6 16.3Samoan 20 7.2 24.1Cosmopoli tan 10 3.6 13.9Hawaii an 2 .7 7.4Chinese 2 .7 9.5Black 8 2.9 100.0Others 6 2.2 25.0No response 8 0.4 7.7
Counseling Services for the Military

40
Type of Living Quarters
Type of Housing Number Percent
Single Family Dwelling 699 75.3Duplex or Townhouse 132 14.2Apartment or condominium 30 3.2(of 3 floors or less)Hi gh-ri se 22 2.4Military Barracks 20 2.2
A secondary analysis of the data on living quarters included a break
down by ethnic group. The single-family dwelling was the most common among
the Japanese(90%), Chinese (85%) and Caucasian (72%). However, the Samoans
(71%) were more commonly found living in duplexes and townhouses. It is
not surprising that the Samoans seem to prefer duplex housing with multi
family living arrangements. Apparently, this type of housing allows the
Samoans to more appropriately accommodate their extended families and Poly
nesian life-styles.
Age by Ethnic Group
Ethnic GroupTotalNumber
Percent Age Rangeof Total 18-26 27-38 39-54 55 & over
Caucasi an 300 32.3 25.7 36.9 24.3 13.0Japanese 251 27.0 28.3 21.9 37.1 11.0Chinese 21 2.3 23.8 23.8 33.3 19.1Hawaiian 27 2.9 37.0 14.8 40.7 3.7Filipino 129 13.9 18.5 24.8 20.9 27.1Samoan 83 8.9 8.4 21.7 54.2 6.0Cosmopolitan 72 7.3 27.8 37.5 23.6 11.1Black 8 0.9 62.5 25.0 12.5 0.0Other 24 2.6 12.5 25.0 37.5 25.0
Total Number 224 267 283 129
Percent of Total (by age group)
24.1% 28.8% 30.3% 13.9%

41
Age
In general, the age groups of the respondents were fairly repre
sentative of those of the Central Oahu population as a whole. The respon
dents were rather evenly distributed among the four age categories: 18-26
(24.1%); 27-38 (28.8%); 39-54 (30.3%); and 55 & over (13.9%). The dis
tribution among the age categories, even when compared by ethnic group,
remains rather even and representative. The few exceptions are the
Samoans which tended to be largely a 39 and over sample (60%); and the
Filipinos, which were well-representated by the 55 & over age group
(27%). The Samoan sample may be somewhat skewed in the 55 and over age
group compared to this age group's representation in the total Samoan
population in Central Oahu. However, this is not the case for the Fili
pinos.The disproportionate number of Blacks in the 18-26 age group (62.5%)
may be misleading due to the small number in the total sample (8). How
ever, it should be noted that the relatively small percentage of Blacks
in Central Oahu and Hawaii as a whole are primarily servicemen and their
dependents which fall in this age category.

V. SCALE ANALYSIS
In order to summarize some response trends, questionnaire items
which covered similar ground were grouped together into "scales" and the
average response to each of the scales was determined. For example, all
of the items regarding awareness of social services (Items 1, 4, 7, 10,
13, 16, 19, 22, 25, 28, 31, 34, and 37) were combined to form an Awareness
of Social Services scale. A single score for each respondent was obtained
by averaging the total of his score for all items in the scale.
The score for each item was the number of the choice selected by
the respondent. For example, the response choices to the awareness items
were:
1 - Aware of it and know about it pretty well
2 - Aware of it and know a little about it
3 - Aware of it, but don't know anything about it
4 - Never heard of it before
The overall average score for each scale is, therefore, the average
of the total of all the respondents' score. Therefore, in the scale called
Awareness of Social Services, the average scale score was 2.3 which indi
cates that in general, the respondents say they are aware of social ser
vices but do not know anything about them.
The results of ten such "scale" analyses are summarized in Table 1.

Table 1. Summary of Scale Statistics
Interpretation of Response
AverageScaleScore
Selected Independent Variables
Ethnicity Civilian-Military Income Residency
F
AmountVarianceExplained F
AmountVariance Explai ned F
AmountVarianceExplained F
AmountVarianceExplained
Scale 1. Awareness of Social ServicesQ. #1, 4, 7, 10, 13, 16,
19, 22, 25, 28, 31,34, 37.
1 Very Aware2 Somewhat Aware3 Mostly Unaware4 Very Unaware
2.3 51.35 33% 7.2 4% 8.6 6% 4.3 2%
Scale 2. Importance of Couseling ServiceQ. #41 to 70.
1 Very necessary2 Somewhat necessary3 Private Sources only4 No service
1.7 • 24.1 19% 3.4 2% 6.6 5% 2.7 1%
Scale 3. Comfortableness in Going to a DOH Counseling Center
Q. #76.
1 Very Comfortable2 Comfortable3 Neither4 Uncomfortable5 Very Uncomfortable
2.7 32.9 27% 3.2 2% 7.8 6% 1.9 1%
Scale 4. Comfortableness with Mental Health Professionals
Q. #93, 94, 96, 97.
1 Very Comfortable2 Comfortable3 Neither4 Uncomfortable5 Very uncomfortable
2.2 14.4 12% 2.5 2% 2.4 2% 2.4 2%
Scale 5. Tendency of Problems to Cause Stress in Family
Q. #138-140, BI - B9
1 No Stress2 A Little Stress3 Some Stress4 A Lot of Stress5 Extreme Stress
1.7 3.4 3% 5.4 3% 3.9 3% 3.1i
2% 1ii
GO
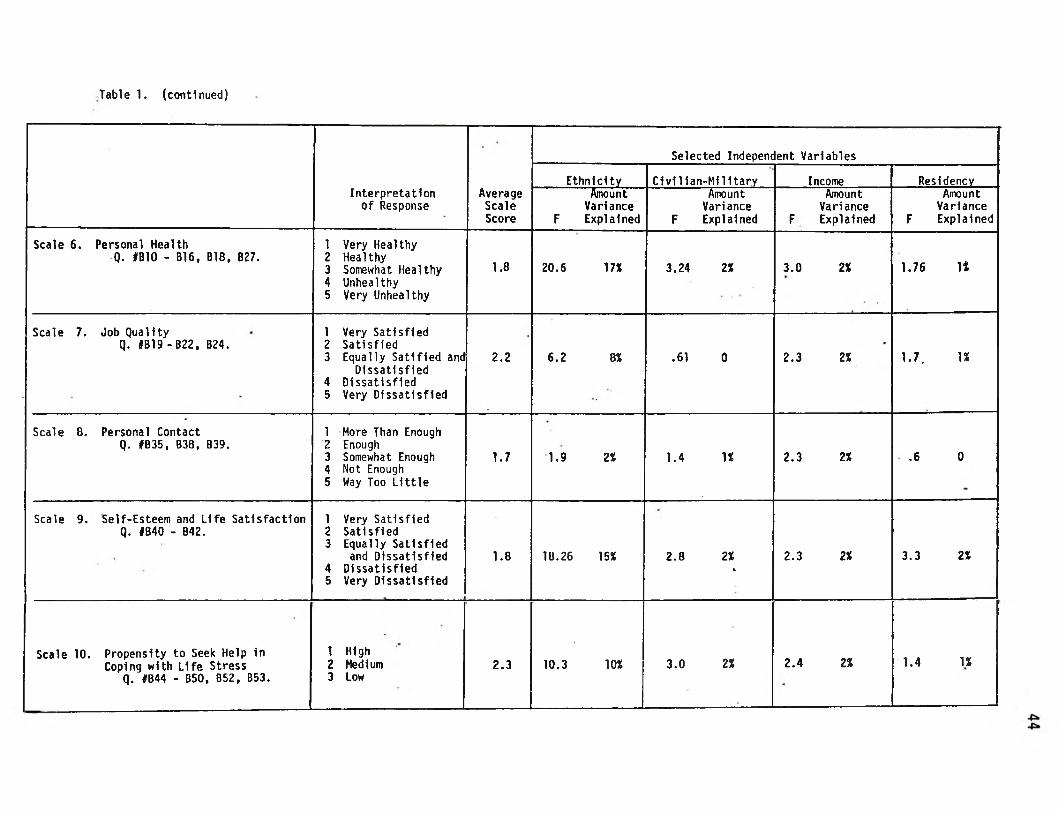
Table 1. (continued)
Interpretation of Response
AverageScaleScore
Selected Independent Variables
Ethnicity Civilian-Military Income Residency
F
AmountVarianceExplained F
AmountVarianceExplained F
AmountVarianceExplained F
AmountVarianceExplained
Scale 6. Personal HealthQ. #B10 - B16, B18, B27.
12345
Very HealthyHealthySomewhat Healthy UnhealthyVery Unhealthy
1.8 20.6 17X 3,24 2X 3.0 2X 1.76 It
Scale 7. Job Qualityq. JB19-B22, B24.
123
45
Very Satisfied SatisfiedEqually Satlfied and
DissatisfiedDissatisfiedVery Dissatisfied
2.2 6.2 8X .61 0 2.3 2X 1.7. IX
Scale 0. Personal ContactQ. #B35, B38, B39.
12345
More Than Enough EnoughSomewhat EnoughNot EnoughWay Too Little
1.7 1.9 2X 1.4 IX 2.3 2X .6 0
Scale 9. Self-Esteem and Life Satisfaction Q. IB40 - B42.
123
45
Very Satisfied SatisfiedEqually Satisfied
and Dissatisfied DissatisfiedVery Dissatisfied
1.8 18.26 15X 2.8 2%»
2.3 2X 3.3 2X
Scale 10. Propensity to Seek Help inCoping with Life Stress
Q. #B44 - B50, B52, B53.
123
HighMediumLow
2.3 10.3 10X 3.0 2X 2.4 2X 1.4 U

45
The discussion of the overall scale response is followed by a
presentation and discussion of the response to individual items which
make up the scale.
To determine if people from different backgrounds responded dif
ferently on these scales, the scale scores of various groups of people
were compared. The types of groupings considered were ethnic, military-
civilian, income levels, and area of residence. Differences found among
ethnic groups, income groups, civilian-mi1itary groups and residency
groups are discussed. The summary of scale statistics in Table 1 shows
that most of the group differences were statistically significant except
in two cases. An attempt to determine the practical significance of
these differences is included in the section. The practical significance
of group differences had to take into consideration the tendency of the
Samoan group to respond in a socially desirable manner, particularly in, 1 some scales.
The Samoan group was found to respond quite differently than any other ethnic group on some of the scales. The Samoan group was interviewed by a single interviewer utilizing a translated version of the questionnaire, so it is not possible to know whether there are real differences due to ethnic background or if the differences were artifacts of the survey method. Whatever the reason, the Samoans did report substantially greater awareness of social services than any other group. They also tended to respond in what might be termed a "socially desirable" direction on nearly every item of the questionnaire. For example, 83% of the Samoans said they "never smoked" compared to 46% of the total survey sample; 84% said they felt "great" physically compared to 28% of the total sample, and whereas 58% of the total sample reported spending no time in voluntary community activities, 95% of the Samoans reported volunteer acti vities. It should be noted that the Samoan group was over-represented in the total sample relative to their representation in the Central Oahu population and that this ethnic group may have responded in an idiosyncratic manner.

46
The amount of differences among groups varied from one scale to 2
another. Specific ethnic, income, residency and civilian-military groups
showed patterns of responses across scales which need further considera
tion than the one provided in the report.
The scale analysis could be improved for later use by separating the
Samoan and Black groups from the rest of the sample. Separate analysis
can then be made on the Samoan and Black groups. The use of multivariate
approaches for the statistical analysis of the scale data is an improve- 3
ment over the univariate approach which was used.
There are items which were not included in the scale analysis.
However, these items are covered following the discussion of the relevant
scale results.
2The grouping which showed the most difference was the ethnic
grouping. Ethnic group differences were greatest in Scale 1 - Awareness of Social Services; Scale 3 - Comfortableness in Going to a DOH Counseling Center; Scale 2 - Importance of Counseling Service; and Scale 6 - Personal Health. Ethnicity was least related to Scale 3 - Personal Contact and Scale 5 - Tendency of Problems to Cause Family Stress. Of the other three independent variables, “Income" which was much less relevant then "Ethnicity", was more related to more scales than "Civilian-Military Status" and still more than "Residency Location".
3A recurring difficulty in the interpretation of results was that
while each of the predictor variables accounted significantly for the variance in the responses even in the best instance, two-thirds of the total variance could not be accounted for. Critical interaction effects, which become evident only after close inspection, could not be accounted for with certainty. The present analysis, however, provides very useful information on how to proceed using multivariate approaches.

VI. AWARENESS & USE OF SOCIAL SERVICES
Scale 1
Awareness of Social Services
Scale 1 measured the degree to which respondents were aware of
social services available to them. Thirteen items made up the scale, one
for each type of service.* The services included welfare, counseling,
health care, and others.
The question asked was, "There are many social services available
in this area. I would like to know which ones you are familiar with and
have used, either for yourself or for someone in your family." The break
down of responses according to the choices available to the respondents
are shown below:
Choice Interpreted Choice Percent
1 Aware and Know Pretty Well Very Aware 14
2 Aware and Know a Little Somewhat Aware 49
3 Aware and Don't KnowAnything Slightly Aware 36
4 Never Heard Very Unaware 1
TOTAL 100
*The questions were numbers 1, 4, 7, 10, 13, 16, 19, 22, 25, 28, 31 34, and 37.

48
Although an impressive percentage of respondents, 99%, reported
some degree of awareness of the social services available in the area,
only 63% could be considered to have reported knowing what the services
were about. Futhermore, only 14% indicated knowing the services pretty
well. The average scale score of the sample (all respondents) was 2.3.
This score fell between the choices "Somewhat Aware" and "Slightly Aware"
and was closer to the former.
These results might have a profound implication upon the public
education efforts of agencies in Central Oahu. For example, if one of
the goals of the public education aspect of the Central Oahu Mental Health
Services Program was to enable residents to be well aware of social ser
vices, the results obtained through Scale 1 might provide a conservative
estimate of the educational need in the area.
Item Analysis: Awareness with Use Data
The awareness level of respondents differed according to the type
of services surveyed. In addition to awareness, use of the services will
also be discussed in this section.
The degree to which one service was better known to the respon
dents in relation to other services could be determined by ranking the
sample average awareness score for each service or ranking the percentage
of respondents who were either aware or unaware. The results or ranking
using these two procedures are in Table 2. It should be noted that the
two methods gave highly similar item rankings with the exception of a
few. Since the average score is a more valid basis for ranking, it will
be used whenever comparisons among items are made in subsequent scales.
The results of ranking showed that the professional mental health
service facilities such as Community Counseling Centers, Licensed Care and

Table 2. Awareness Ranking of Services
Type of Service Seal e Score Very AwareMostly Unaware!
or Unaware |Avg. Rank % Rank % Rank !---------------- 1
"State/City Recreation Facilities and Parks" 1.38 1 69 1 5 1
"State Unemployment Insurance" 1.76 2 48 2 20 4
"Veteran's Benefits (GI Bill, Federal HousingAssociation, Home Loans" 1.78 3 44 3 18 3
"Welfare, Food Stamps, Medicare" 1.81 4 37 4 17 2
"Voluntary Services such as Alcoholic Anonymous" 2.07 5 28 5 27 5
"Legal Services (Legal Aid Society of Hawaii)" 2.27 6 25 6 37 7.5
"Pre-School and Day Care Center such as Salvation Army 2.28 7 24 7 37 7.5
"Psychiatric Services at In-Patient Counseling facilities (e.g., Queen's Hospital, Kaneohe State Hospital,Leahi Hospital, or Privately Owned Clinics")
2.40 8 20 8.5 35 6
Department of Vocational Rehabilitation or otherVocational Rehabilitation Services 2.49 9 18 11.5, 47 9
"Adult Day Care for the Elderly & Handicapped" 2.54 10 20 8.5 49 10
"Licensed Care & and Boarding House (offering Care for Formerly Hospitalized Adults who have EmotionalProblems) 2.73 11 13 11.5 58 11
"Community Counseling Center" 2.74 12 18 11.5 59 12
"Alternative Education Schools e.g., Rainbows Storefront" 3.06 13 18 11.5 66 13

50
Boarding Home for the formerly hospitalized adults with emotional problems
and Psychiatric Service in In-Patient Counseling Facilities were less
known. The awareness and use data shown in Table 3 give additional infor
mation. Only 40% of the respondents reported that they were aware of
Community Counseling Centers while 59% reported that they did not know
what the centers were about. More importantly, only 6% of the respon
dents reported that they used the centers. One-half of the 6% reporting
use also reported the period of use as one year or longer. This finding
would have particular relevance in the program planning phase in terms of
public education and relations efforts.
What has been said about Community Counseling Centers would also
apply to Licensed Care and Boarding Home for formerly hospitalized adults
with emotional problems and Psychiatric Service in In-Patient Counseling
Faci1i ties.
Alternative Education Schools such as Rainbow or Storefront were the
least known of the services. Only 32% of the respondents reported that
they knew about these schools, and only 3% reported using them.
The best known of the social services were State and County
Recreation Facilities and Park with 95% reporting that they knew about
them and a smaller percentage, 87%, reporting use.
The next better known services were "guaranteed" public assistance
programs. Unemployment Insurance was known to 80% and used by 29% for
varying lengths of time. The median period of use was between two months
to less than a year. Veterans' Benefits were known to 81% and used by 29%
usually for a period of one year or longer. Welfare Payments, Food Stamps , &
Medicaid were known to 83% and used only by 16% usually for a period of
one year or longer.

Table 3. Social Services Available in the Area--Awareness & Use
Type of Social Service ■0
Awareness (%)3 4
J1
0Use-(%)
1 21 2
Welfare payments, Food Stamps, Medicaid 0 37 46 16 1 3 16 80
Community Counseling Centers 1 18 22 27 32 ■ 23 6 71
State Unemployment Insurance 1 48 32 14 6 7 29 64
Alternative Education Schools 2 18 14 12 54 31 3 64
Voluntary Services 2 28 42 20 7 8 4 87
Legal Services 1 23 38 24 13 13 6 80
Department of Vocational Rehabilitation 1 18 33 29 18 17 3 80
Veteran's Benefits 2 44 37 13 4 6 29 64
Adult Day-care for Elderly & Handicapped 2 20 29 27 22 18 3 78
Pre-School & Day-Care Centers (e.g., Salvation Army)
3 25 35 22 14 18 8 73
State & City Recreaction Facilities & Parks 0 67 27 4 1 3 82 16
Licensed Care & Boarding Homes 2 18 22 27 31 19 3 78
Psychiatric Services at In-Patient Counseling Facilities
2 20 33 30 14 14 5 81
Awareness Key:0 - No Response1 - Aware of it and know about it pretty well2 - Aware of it and know a little about it3 - Aware of it but don't know anything about4 - Never heard of it before
it
Use Key:0 - No Response1 - Yes2 - No

52
The next better known service was Voluntary Services such as
Alcoholics Anonymous The awareness level probably did not reflect aware
ness of self-help programs in general as intended by the item but probably
reflected the popularity of the example used which was Alcoholics Anonymous
Ethnic Group Differences in the Total Scale
Ethnic groups differed in their reported average level of aware
ness of social service. In a one-way analysis of variance, ethnicity
accounted for 33% of the total difference found in the responses of all
those surveyed. Caution in the use of the variance explained by ethnicity
should be stated at this point. While 33% was statistically significant
(F = 5.14), it was probably inflated.
What inflated the statistical significance of ethnicity as an inde
pendent variable seemed traceable to two factors. The first is the modifi-4
cation of interview procedures by the Samoan interviewer. This variation
might have led to the highly different response of the Samoans oriented
toward responding in a socially desirable manner. The Samoan results
were different since 93% of the Samoans reported that they were "Very
Aware" of the social services. When compared with the percentages of
other groups which reported "Very Aware", particularly those groups 5
which were found closest to the Samoans in socio-economic indices, the
When the Samoan interviewer was confronted with respondents who seemed unaware of the social services, particularly when the English terminology was used, the interviewer explained the services. It was thought that due to this explanation, the respondents chose "aware" responses.
5In terms of Income of Household, the rank order of the average
income bracket reported by ethnicity was: 1-Japanese; 2-Chinese; 3-Cauca- sian; 4-0ther; 5-Cosmopolitan; 6-Hawaiian; 7-Filipino; 8-Samoan; 9-Black.

53
validity of the Samoan percentage appeared to be somewhat untenable.
Among the proximate groups on the socioeconomic dimension, the percentage
who responded "Very Aware" were 30% (Cosmopolitan), 13% (Hawaiian), 12%
(Filipino) and 9% (Black).
Although the validity of the Samoan response to the items in this
scale was questionable, the small number of the Samoan respondents, 9%
of 928 should not alter the ordinal relationship among ethnic groups. The
same rationale was applicable to the second factor which could reduce the
significance of the amount of variance explained by ethnicity. This
factor was the very select and small number of Blacks in the sampleg
(n = 8 or less than 1% of 928).
The difference among the ethnic groups on level of awareness of
social services could be graphically illustrated by plotting the average
Scale 1 score of each ethnic group on the awareness continuum. The plot
is shown in the Figure 1.
In subsequent analyses, it should be advisable to determine the . presence of differences among ethnic groups by separating the Black and Samoan sub-samples from the statistical analysis on the amount of variance explained by ethnicity.
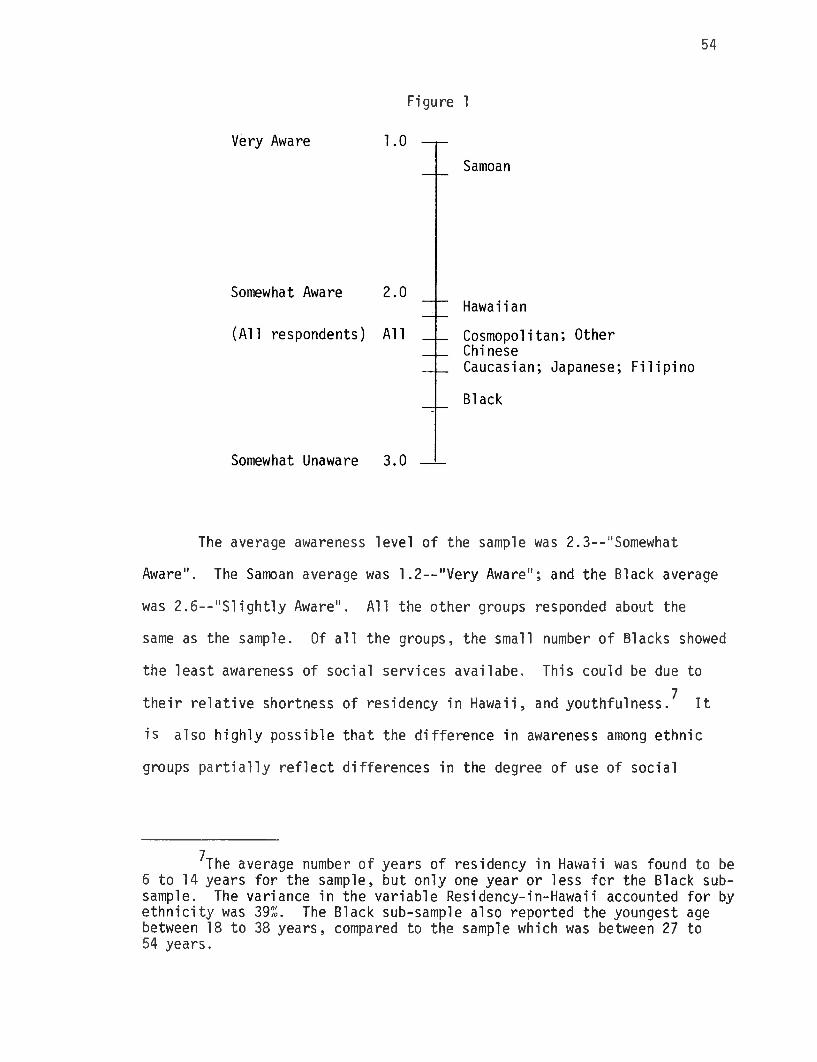
54
Figure 1
The average awareness level of the sample was 2.3--"Somewhat
Aware". The Samoan average was 1.2--"Very Aware"; and the Black average
was 2.6--"Slightly Aware". All the other groups responded about the
same as the sample. Of all the groups, the small number of Blacks showed
the least awareness of social services availabe. This could be due to
their relative shortness of residency in Hawaii, and youthfulness/ It
is also highly possible that the difference in awareness among ethnic
groups partially reflect differences in the degree of use of social
?The average number of years of residency in Hawaii was found to be 6 to 14 years for the sample, but only one year or less for the Black subsample. The variance in the variable Residency-in-Hawaii accounted for by ethnicity was 39%. The Black sub-sample also reported the youngest age between 18 to 38 years, compared to the sample which was between 27 to 54 years.

55
services by these groups. Therefore, with this reasoning the groups
which showed greater awareness, Hawaiian and Samoan (although biased)
might be groups which use the services more.
Ethnic Group Differences in Items
Ethnic differences in level of awareness were more evident in some
services and not in others. They were more evident in Licensed Care and
Boarding Homes, Alternative Schools, Adult Day-Care for Elderly and Handi
capped, and Community Counseling Centers. For these services, ethnicity
explained between 30% to 38% of the variance in awareness. However, since
these services were also ranked as the four least known of the services
surveyed, the differences might be explained by ethnicity in combination
with other factors such as length of residency in Hawaii and school
attainment since these factors reflect urbanization. In other words,
the ethnic groups which had the longest residence in Hawaii and highest
educational attainment were the Japanese, Chinese, Cosmopolitan, and
Other. By virtue of longer residency, these groups might have greater
sohpistication with socialized services, a characteristic of an urban
society The Caucasians from the U.S. Mainland who were mobile enough
to come to Hawaii, possess this characteristic even though as a group
they showed one of the shorter lengths of residency in Hawaii, second
only to the Blacks. Their generally high level of education and fami
liarity with social institutions might explain their awareness of social
services.
Civilian-Military Status Differences
The Civilian-Military variable accounted for only 4% of the vari
ance in responses (F = 7.2). It should be noted from the plot of the

56
8The interaction effect of income with other demographic character's
tics of the respondents on responses will be statistically determined in subsequent analysis, i The same is true with ethnicity, civilian-military, age and others.
Figure 2
average scale scores for the Civilian and military groups shown below,
that the Civilian group tends to have slightly more awareness about social
services than all the military sub-groups.
Income Differences
Income accounted for 6% of the variance in responses (F = 8.6). The
income sub-groups "Less Than $3,000" showed the least awareness. Respon
dents whose households earned $7,500 to $10,000 reported more awareness
than both higher and lower income groups.The average scale score of
the income subgroups are shown below.

57
Figure 3
The pattern exhibited by the $3,000 -$7,500 and $10,000 - $22,000
sub-groups would be repeated in other scales. One possible source of
explanation might be the correlation of income with age, residency and
ethnicity. Individuals from households in the $7,500 to $10,000 category
could feel relatively more deprived than individuals in lower categories
since they were closest to the State median household income which should
be between $10,000 to $15,000. Relative deprivation might induce them to
seek public and/or free social services to augment their relatively (to
the State median) low household income.
Also, the newcomers to the State would probably take some time to
reach the $7,500 to $10,000 category, particularly those who come from
foreign Asian countries and Samoa were probably less disposed for lack of
information or for real and perceived legal constraints to seek public
and/or free social services.

58
The young in single households who are only part-time employees
might be less disposed to be aware of social services.
It should also be noted that another partial explanation might be
because Samoans, who indicated that they were "Very Aware", had a mean
income in the $7,500 to $10,00. The plausibility of these explanations,
and other alternatives might be determined statistically through appro
priate multivariate statistical analysis in a secondary analysis of the
data.
Residency Differences
Location of residence accounted for only 2% of the variance in 9
response (F = 4.3). The rural versus urban-suburban dichotomy did not
appear in the plot of average awareness scores of the residency subgroups
Figure 4
This dichotomy was used to reduce the original numbers of residency location categories.

VII. IMPORTANCE OF COUNSELING SERVICES AND MODES OF SERVICES
Scale 2
Importance of Counseling Services
Scale 2 measured the level of importance ascribed by the respondents
to thirty types of counseling services. The question asked was, "There
are many kinds of educational, counseling and therapeutic services that
the community counseling center can provide. I would like your opinion as
to the importance of various services which I will describe. Which of
these would you like to have available for you, your family, friends and
neighbors provided by the State through your counseling center?"
The numerical equivalent of choices was converted from the actual
questionnaire choice coding to another coding for the statical analysis of
scale scores. This change is shown as follows.^
An error in including "No Opinion" choices in averaging scores forced the scale average scores and percentages breakdown toward the lower numerical equivalents. In order to present an overall scale picture, another method of analysis was used. This method involved the following steps: (1) for each response choice and across all the thirty items, the percentage of respondents who selected the particular response choice was arranged according to their magnitude; and (2) the percentages in the 15th and 16th position was taken to be somewhat indicative of the typical (median) percentage of the overall scale response in this particular category.
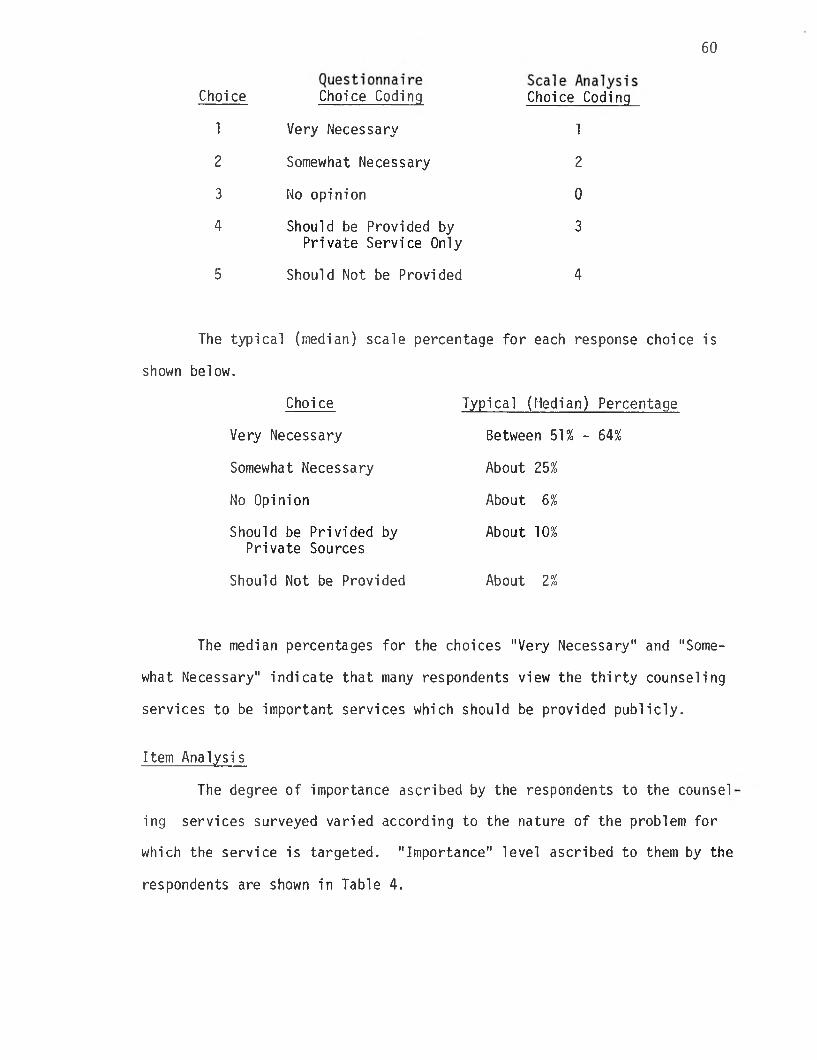
60
The median percentages for the choices "Very Necessary" and "Some
what Necessary" indicate that many respondents view the thirty counseling
services to be important services which should be provided publicly.
Item Analysis
The degree of importance ascribed by the respondents to the counsel
ing services surveyed varied according to the nature of the problem for
which the service is targeted. "Importance" level ascribed to them by the
respondents are shown in Table 4.
Choice Choice Coding Choice Coding
1 Very Necessary 1
2 Somewhat Necessary 2
3 No opinion 0
4 Should be Provided by Private Service Only
3
5 Should Not be Provided 4
Choi ce Typical (Median) Percentage
Very Necessary Between 51% - 64%
Somewhat Necessary About 25%
No Opinion About 6%
Should be Privided by Private Sources
About 10%
Should Not be Provided About 2%
The typical (median) scale percentage for each response choice is
shown below.

Table 4. Importance of Various Educational, Counseling & Therapeutic Services That the Community Counseling Center Can Provide (by %)
Kinds of Services & Counseling Average RankVery
NecessarySomewhatNecessary
NoOpinion
Provide Privately
Should Not Provide
For Parents who have Physically Abused their Children 1.27 1 81 12 2 3 0
For Narcotic Drug Addicts 1.44 2 73 16 2 5 2
Day Treatment Program for Children Too Disturbed for SpecialClasses in Public Schools 1.46 3 69 19 3 7 0
For Persons Who Have Been Raped 1.49 4.5 74 12 2 10 1
Mental Health Education in School 1.49 4.5 63 27 4 2 1
Alcohol Abuse Counseling 1.54 6 67 20 3 7 1
Programs for Elderly with Little to do During the Day 1.55 7.5 60 31 3 4 1
Programs for Very DepressedElderly Persons 1.55 7.5 61 27 3 7 1
Residential Programs for Children i from Very Disturbed Families 1.56 9 62 25 5 5 1
Temporary Shelters for ChildrenWho have Run Away from Home 1.70 10.5 57 27 6 4 4
For People who Have Attempted Suicide 1.70 10.5 66 17 3 11 1

Table 4. (continued)
Kinds of Services & Counseling Average RankVery
NecessarySomewhatNecessary
NoOpinion
ProvidePrivately
Should Not Provide
Drop-in Programs for Children Who Want to Talk with Someone About Their Special Problems . 1.71 12 54 31 3 9 1
Outreach Programs for People Who Are Unable to Come to the Clinic 1.75 13.5 59 22 4 12 2
For Children who are OverlyAfraid to Attend School 1.75 13.5 59 22 4 12 2
For Rapists 1.84 15.5 64 10 8 9 7
Personal Problem Counseling 1.84 15.5 51 28 5 14 1
A House to Live in TemporarilyAfter a Nervous Breakdown orAfter Release from a Hospital Before Setting Out on Their Own (Half-Way House) 1.94 17 43 33 10 9 3
Absent Spouse-Single ParentCounseling 1.95 18 43 33 9 11 2
A House for Disabled People toLive in Permanently to Maximize their Independence 1.99 19 44 29 13 8 5
For Parents Who Critize Their Children Too Much 2.06 20 39 34 10 10 5
Divorce Counseling 2.08 21 45 26 6 20 2
For Children Who Are Shy andKeep to Themselves 2.17 22 45 26 6 20 2

Table 4. (continued)
Kinds of Services & Counseling Average RankVery
NecessarySomewhatNecessary
NoOpi nion
ProvidePri vately
Should Not Provide
To Prevent a Marriage FromBreaking Up 2.22 23 40 27 4 24 3
For Couples who Want to HaveA Better Marriage 2.46 24 32 26 6 30 4
For People Who are Afraid toLeave Their Homes 2.55 25 27 25 20 18 8
For People Who Would Like toStop Smoking 2.71 26 24 29 9 24 13
For Persons Who Are Unable to Enjoy Sexual Relations 2.78 27 24 29 9 24 13
Outreach Programs for People Who Prefer Not to Come to the Clinic 2.87 28 23 25 15 11 24
For People Who Have Difficulty Sleeping 2.95 29 17 25 15 26 14
For People Who Are Afraid toTalk in Front of Groups 2.96 30 18 25 11 29 14
CTiGO
64
The results of ranking of the importance of services based on their
average scores as shown in Table 4 met conventional expectations with the
exception of a few items. They indicated that the services which the
respondents rated as the five most important services which should be
provided by the State were counseling for parents who have physically
abused their children, counseling for narcotic drug addicts, day treat
ment program for children too disturbed to attend special classes in
public schools, mental health education in the school, and counseling for
persons who have been raped- These items had average scores (1.27 - 1.49)
which were equivalent to "Very Necessary".
Other programs for children whose problems are attributed to the
family, programs for the elderly, and for individuals who have attempted
suicide were considered as next most important. These items had average
scores equal to "Somewhat Necessary", but the majority rated them "Very
Necessary".
Services targeted toward the problems experienced by husband and
wife couples which are associated with marriage, divorce and sex rela
tions were not considered as important as the others discussed earlier.
Somewhat of an exception to this rule was the higher rank received by
counseling for absent spouse or single parent. This might be due to the
importance ascribed to this service by military dependents.
Of the 30 programs surveyed, only six had average scores which
were equivalent to "Should be Provided Privately". These were counseling
for people with the less serious problems of fear when talking in front
of groups, difficulty in sleeping and inability to enjoy sexual relations
Counseling for those who want to stop smoking and are afraid to leave thei
homes were similarly considered less important and should be provided
privately.

65
It should be noted that while outreach program for people who are
unable to come to the clinic was considered a needed public service by
85% of the respondents, outreach programs for people who prefer not to
come to the clinic received similar consideration from only 58%. Another
interesting result was the differential importance ascribed to counseling
for rape victims (86%) from that ascribed to counseling for rapists (74%)
Since the importance of services probably reflect citizen need,
the results discussed above have implications for the planning for mental
health services.
Ethnic Differences
Ethnicity accounted for 19% of the variance in Scale 2 (F = 24.1).
The plot of the ethnic group average scale scores is shown below in
Figure 5.
Figure 5

66
The differences among the ethnic groups seemed to group the Chinese,
Japanese and Caucasian on the lower end of the scale with the other ethnic
groups slightly above the sample average. This differentiation might be
indicative of the tendency of the more affluent to view counseling serv
ices slightly less importantly (in terms of State sponsorship) than less
affluent groups.
Income Differences
Income accounted for only 5% of the variance in importance of
counseling services (F = 6.6) reported by the respondents. There appear
ed from a gross plotting of average income group scores as in Scale 1,
a curvilinear association between income and assessment of importance of
services. The use of more appropriate analysis and, perhaps a secondary
look at the data might supply reasonable explanations.
Figure 6
Civilian-Military Status Differences
Although the civilians tend to give greater importance to counseling
services than all the Military Subgroups, the dichotomy was not pronounced.

67
This variable only accounted for 2% of the variance (F = 3.4).
Figure 7
Residency Differences
Residency location accounted for only 1% of the variance
(F = 2.7), although there seemed to be a very slight tendency for Urban-
Suburban respondents to report a lower level of importance of services
than rural area residents. The explanation for this slight difference
may. be similar to that given previously regarding ethnic differences.
Figure 8

68
Related Items: Types of Couseling Modes
Respondents were also asked to rate the importance of five dif
ferent types of counseling modes. These were (1) Individual counseling
on a regular basis; (2) Group counseling with a trained counselor or
therapist; (3) Individual counseling on a single time or irregular basis;
(4) Group counseling or therapy on a now and then or irregular basis; and
(5) Rap center with volunteer staff. The breakdown of responses to
counseling modes are shown in Table 5.
Table 5. Types of Couseling Services
Type of Servicei No Response Important
SIightly Important
NotImportant
Individual Counseling (regular basis) 1 74 21 3
Group Counseling (TrainedCounselor/Therapist) 2 62 31 5
Individual Counseling (single time or irregular basis) 4 35 36 24
Group Counseling or Therapy (now and then basis, not regular)
3 25 42 30
Place to go or call where there will always be someone to talk with and lend a sympathetic ear. (Rap Center with Volun^ teer Staff.)
1 78 16 4
Counseling on an irregular basis, or both group counseling and
individual formats was the least preferred by the respondents. Generally,
the respondents preferred a counseling on a regular basis and perceived
the individual counseling mode to be more important than the group counsel
ing mode. Interestingly enough, the most preferred type of counseling by

69
the respondents in terms of importance was the informal format (e.g., rap
center with volunteer staff). As the table above shows, 78% of the res
pondents preferred a "place to go or call where there will always be
someone to talk with and lend a sympathetic ear".

VIII. LEVELS OF COMFORT AND CONVENIENCE OF DOH COUNSELING CENTERS
Scale 3
Comfortableness for Going to a Department of Health Counseling Center
Scale 3 consisted of only one item, question number 76. It
measured the degree to which respondents would feel comfortable in going
to a Department of Health Counseling Center. The question asked was:
"If you wanted counseling service, how comfortable would you feel in go
ing to a Department of Health Counseling Center?" The breakdown of the
responses is shown below:
2 Comfortable 24
3 Neither Comfortable Nor Uncomfortable 22
4 Uncomfortable 22
5 Very Uncomfortable 8
Slightly less than 50% of the respondents said they would be com
fortable going to the DOH Centers, while over one-fifth said they would
be very comfortable. However, about one-third of the respondents reported
that they would feel some degree of discomfort in going to the Department
of Health Counseling Center. Since counseling center services tended

71
not to be as well known to the respondents, a finding which was clearly
shown by Scale 1, it was not surprising that a large percentage of respon
dents (22%) indicated that they would neither feel uncomfortable nor com
fortable. Lack of familiarity with counseling centers might also explain
why a relatively large segment of the sample would feel some degree of
discomfort in going to the Department of Health Counseling Center.
The average Scale 3 score (2.7) indicated that respondents as a
whole tended to feel either "comfortable" or had no feeling either way
toward going to the DOH counseling center. The average scale score fell
closer to the neutral category.
Ethnic Differences
Ethnic differences in the response to Scale 3 were very noticeable.
In Scale 3, ethnicity explained 27% of the variance (F = 32.9), an effi
ciency rate only surpassed by ethnicity in Scale 1. The noticeable dis
persion of ethnic groups was partially due to the absence of averaging
across items since the Scale 3 only consisted of one item.
It could be noted that Samoans were most comfortable about the
DOH Counseling Center. They were followed by Filipinos and Hawaiians and
Chinese. The Chinese, Japanese, and Cosmopolitans tended to feel neutral
while the Blacks reported that they would feel uncomfortable. Length of
residency in Hawaii, income and educational attainment did not seem to
explain these differences. Degree of urbanization in, or accommodation to
a Western society might provide partial explanation. It might also be
the case that the propensity of Japanese and Caucasians and possibly, also
Cosmopolitans to transact business with public institutions would predispose
them to be neutral toward another, albeit relatively unknown public
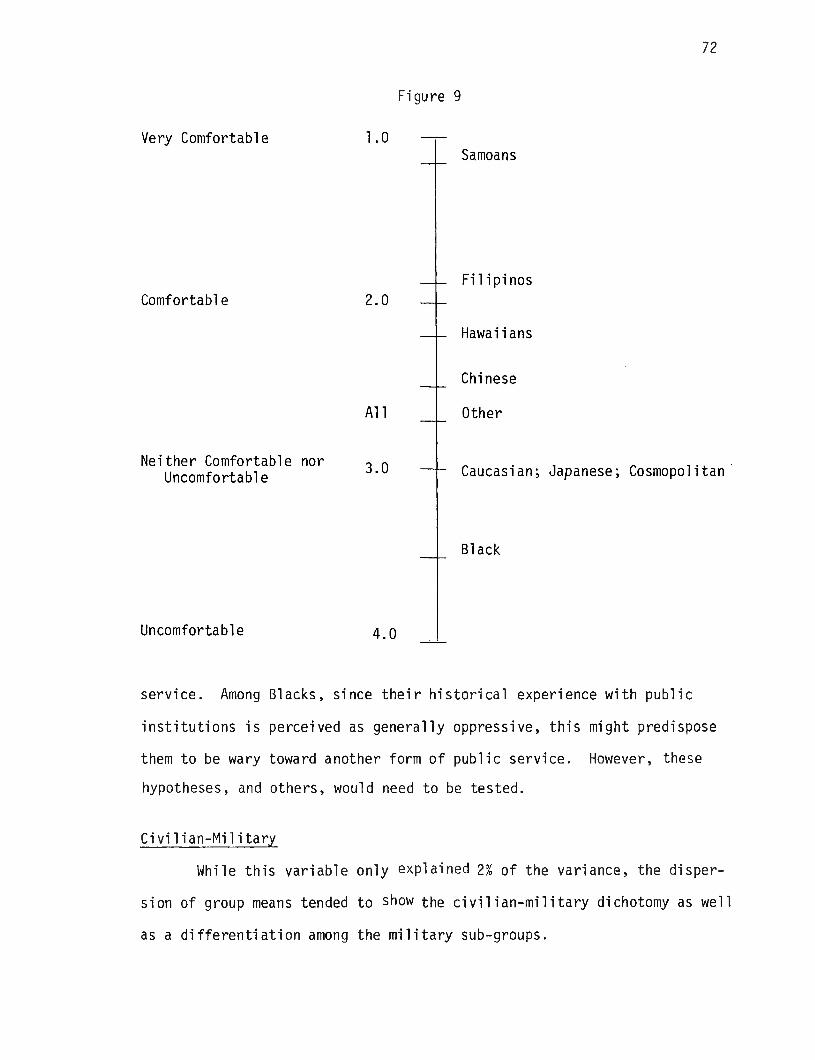
72
Figure 9
service. Among Blacks, since their historical experience with public
institutions is perceived as generally oppressive, this might predispose
them to be wary toward another form of public service. However, these
hypotheses, and others, would need to be tested.
Civi1ian-Military
While this variable only explained 2% of the variance, the disper
sion of group means tended to show the civilian-military dichotomy as well
as a differentiation among the military sub-groups.

73
Figure 10
Lack of knowledge of, or exposure to, extra-military services might
explain the tendency for military sub-groups to feel neither way about the
DOH Counseling Center; whereas, the civilian group would be more familiar
and therefore, comfortable with this service or facility. However, this
rationale did not seem to provide probable adequate explanation as to why
the Reserves would tend to feel uncomfortable.
Income Differences
Income explained 6% of the variance in the scale responses. An
inspection of the plot of scale scores of income groups show that lower
income groups, less than $3,000 to $15,000, tended to report that they
would be comfortable, while higher income groups, greater than $15,000
tended to report that they would feel neither way.

74
Figure 11
Relative to other scales, income was most efficient in terms of
the percent of variance it accounted for in Scale 3 and Scale 1.
Residency Differences
As shown in Figure 12, there seems to emerge a slight difference
in comfort among the rural, suburban and urban areas. Respondents from
primarily the rural areas of Kunia/Waipio, Haleiwa, and Wailua seemed to
be slightly more comfortable in going to the DOH Counseling Center than
the residents of primarily the urban area of Pearl City and Aiea. Respon
dents of the suburban areas of Mililani Town and Wahiawa were the least
comfortable with the DOH Couseling Centers of the three geographically
grouped areas. However, the differences are not significant and an
exploration of other factors related to various areas need to be explored
before any definitive inferences could be drawn which might be relevant
to program planning.

75
Figure 12
Related Items
Although Scale 3 consisted of only one item, there were other
questions which dealt with the level of comfortableness and convenience.
These items pertained to location, hours of operation and appointment,
community involvement and recreation and leisure. The results of the
analyses of these items follows.
Ideal Location of Counseling Center
When asked about the ideal location for a counseling center
respondents seemed to be generally favorably inclined to having the center
in their own community (46%). However, only 7% of the respondents wanted
one near their own house. This reflects a general and prevailing attitude
toward mental health services which people might be inclined to support and
even use but not on their own street. Nearly one-fifth of the respondents
(18%) wanted the counseling center near a shopping center. This could be
for the purposes of convenience, but also may be for reasons of anonymity

76
in the case they ever chose to use these services.
Ideal Location for a Counseling Center
Location Percent
Close to your house 7
In your own community 46
Somewhere within Central Oahu Area 24
Close to a shopping center 18
Don't see any need for a counseling center at all
2
No response 2TOTAL 99
Comfortableness About Location of Counseling Center
As the results below show, about 40% of the respondents would feel
comfortable going to a counseling center located in their own community.
This compares favorably with the 46% which reported that the ideal location
of a counseling center would be in their own community, as shown in the
results of the previous item. The fact that almost one-fourth of the
respondents preferred another community to their own in terms of comfort
in going to a DOH Counseling Center may also be for the reason of preferred
anonymity.

77
Level of Comfortableness Percent
Would feel much more comfortable in 13another community
Would feel somewhat more comfortable 11in another community
Would feel equally comfortable in my 34own community or in another community
Would feel much more comfortable in 39my own community
No response 2
Comfortableness about location seem to vary with the type of
facility as indicated in Table 6.
Table 6. Comfortableness About Having a Mental Health Center, Half-Way House or Licensed Care Home in the Neighborhood (by Percent)
Mental Health Center
NoResponse
2
StronglyFavor
23
Favor
27
Don11 Care
27
Oppose But Not Strongly
14
StronglyOppose
8
Half-Way House 1 19 25 22 19 13
Licensed Care Home 1 27 27 28 10 6
Overall, roughly one-half of the respondents were in favor of having
all three facilities in their neighborhood, while about one-fourth opposed
these facilities in their neighborhood, and one-fourth didn't care.
When compared with half-way houses or licensed care-homes, respon
dents felt most comfortable with half-way houses. However, the table
above shows the differences in level of comfort were not that significant,
with about one-fourth of the respondents feeling equally comfortable in
the "favor" category for all three types of facilities. The differences

78
are more pronounced in the "strongly favor" category, with 27% of the
respondents "strongly in favor" of licensed care-homes, and 23% "strongly
in favor of" having a mental health center in their neighborhood.
Appointment Times
Preferred appointment times in terms of convenience varied consider
ably from appointment times presently available at the DOH counseling
centers. The preferred times are shown in Table 7.
Table 7. Convenient Appointment Times at the Counseling Center (by %)
TimesNo
Response ConvenientSI ightly
Inconvenient Inconvenient
During the weekA.M. (Morning) 1 42 18 38
Noon 1 34 26 39
P.M. (Afternoon) 1 41 23 34
Evening (After 5:00 P.M.) 3 58 15 24
WeekendsA.M. (Morning) 2 61 18 19
P.M. (Afternoon) 1 58 19 22
When respondents were asked about the most convenient appointment
times, evenings (after 5:00 PM) and weekends emerged as the most preferred
times. The least convenient times were during the week at noon, in the
morning, and in the afternoon, in that order. This is an interesting find
ing considering that the normal operating hours of the centers .fall within
a time period that over almost 60% of the respondents found slightly
inconvenient or inconvenient.

79
Convenience of Location by Area
The preliminary results of the convenience of location by area is
shown in Table 8.
Table 8. Convenience of’Locations of Counseling Services
NoResponse
VeryConvenient Convenient
Not So Convenient Inconvenient
VeryInconvenient
Aiea 3 43 25 179
8 4
Mililani 4 11 23 36 19 7
Pearl City 2 31 36 21 6 4
Waialua 2 10 8 20 38 22
Wahiawa 5 16 18 20 29 12
Overall, Aiea and Pearl City were considered to be the most con
venient locations to receive counseling services. However, this finding
has meaning only after a secondary analysis of the residents by area is
completed, since the pattern of convenient locations in the table above
may be more of a reflection of the number of respondents from each area
than a real preference from the population as a whole (e.g., 48% of the
respondents reside in the Aiea-Pearl City area).
Community Involvement and Feelings Toward the Community
Among the proposed indicators related to personal health was a
person's general level of community involvement (i.e., activity) and their
feelings of security and trust regarding their immediate neighbors and
community an a whole.
As the table which follows this discussion shows, there seems to be
a general lack of community involvement among the respondents as a whole.

Table 9. Community Involvement and Feelings Toward the Community
No Response 20+ Hours 10-20 Hours 4-8 Hours 1-3 Hours 0 Hours
Hours Spent on Voluntary Community Activities & Organizations 3 3 4 11 21 58
No 'Response
Very High Importance
HighImportance
Medi urn Importance
LowImportance
NoImportance
Importance of Community Work & Involvement 2 18 22 34- 15 9
NoResponse
VerySecure Secure
SlightlyInsecure Insecure
VeryInsecure
Physical Security & Safety of Self, Family & Property 1 29 44 21 3 2
NoResponse Very Much Mostly^ Somewhat Slightly Not at All
Trust in People in Neighborhood 2 38 40 13 5 2
NoResponse
FeelVery Good Feel Good
Feel Mixed or Neutral Feel Bad
FeelVery Bad
General Feeling About Neighborhood & Community 2 38 43 14 2 1
NoResponse
Feel LikeI Belong
Very MuchFeel LikeI Belong
FeelMixed or Neutral
Feel LikeI Don't Belong
Feel Like IDon't Belong
At All
Sense of Belonging to the Neighborhood & Community 1 31 39 24 3 2
coo

81
While over 60% of the respondents considered community involvement
important, 58% reported they spend no time at all in community affairs.
Of those who did spend time in community work, over half spend less than
three hours a week in these such endeavors.
However, this rather modest level of community involvement did not
appear to be a reflection of the respondent's attitude toward his commu
nity, his neighbors, nor his perceptions of his own family's security or
sense of belonging to his neighborhood. As Table 9 shows, the respondents
were in general favorably disposed to trusting their neighbors, and over
three-fourths of those questioned reported that they felt secure, had a
good feeling about their neighborhood, felt a sense of belonging to their
own community.
Recreation and Leisure
Another general indicator related to a person's personal health
is time spent in recreation and leisure. As Table 9a..shows, a relatively
large number of respondents (46%) felt they were spending less time than
they wanted on recreation activities. Almost 60% reported spending less
than eight hours a week in recreation activities. Twenty-six percent
reported that they spend less than three hours a week in recreational acti
vities. Of those who did find time for recreation, only slightly more
than half (54%) found that these activities made them "satisfied, relaxed,
and refreshed."

Table 9a. Recreation and Leisure
tii Time Spent on Recreation Activitiesi
No Response
1
Less Time Than You Want
46
About t Amount
he Right of Time
49
1More Time
Than You Want
3
No Response 0-3Hours
4-8Hours
9-17Hours
18-30Hours
1!
Over 30 Hours !
Hours per Week Spent Resting & Relaxing 4 26 33 23 10 4
!Ii1i
No Response SatisfiedRelaxed
RefreshedSomewhatSatisfied
iii
Dissatisfied !
Level of Satisfaction with Leisure 2 54 38I
6
00ro

IX. PREFERRED MENTAL HEALTH PROFESSIONALS AND TYPES OF COUNSELING SERVICES
Scale 4
Comfortableness with Mental Health Professionals
Scale 4 measured the degree to which respondents would feel com
fortable in talking with mental health professionals in general. Four
iternsmade up the scale, one for each professional: psychiatrists,
psychologists, counselors and nurses.
The question asked was, "Some people are comfortable and trust
getting advice and psychological counseling from professionals and some
are more comfortable getting advice and counseling from lay-person
members of the community like themselves. If you had a personal problem,
how comfortable would you feel talking it over with each of the following
persons?:"
The response breakdown is shown below.
l^These were items 93, 94, 96 and 97. Other mental health personnel who were non-professionals were excluded from Scale 4. These were social workers (95), paramedical assistants (98) and others.
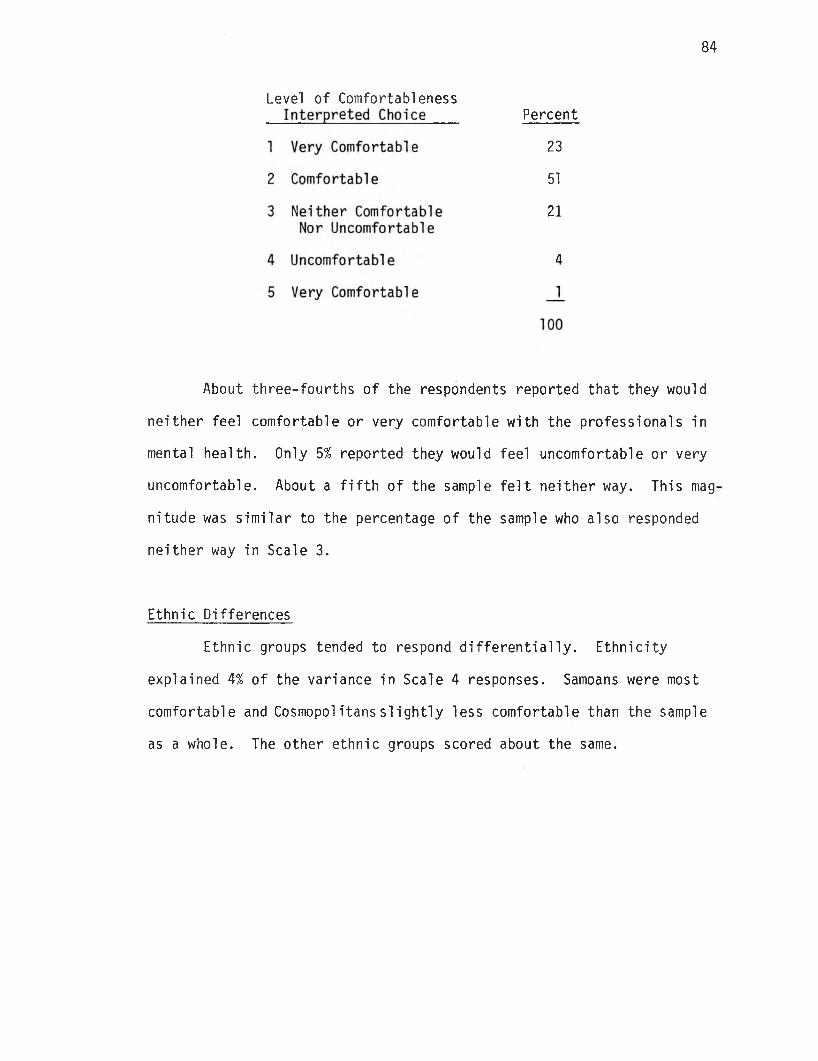
84
About three-fourths of the respondents reported that they would
neither feel comfortable or very comfortable with the professionals in
mental health. Only 5% reported they would feel uncomfortable or very
uncomfortable. About a fifth of the sample felt neither way. This mag
nitude was similar to the percentage of the sample who also responded
neither way in Scale 3.
Ethnic Differences
Ethnic groups tended to respond differentially. Ethnicity
explained 4% of the variance in Scale 4 responses. Samoans were most
comfortable and Cosmopolitanssiightly less comfortable than the sample
as a whole. The other ethnic groups scored about the same.
Level of ComfortablenessPercent
23
51
21
4
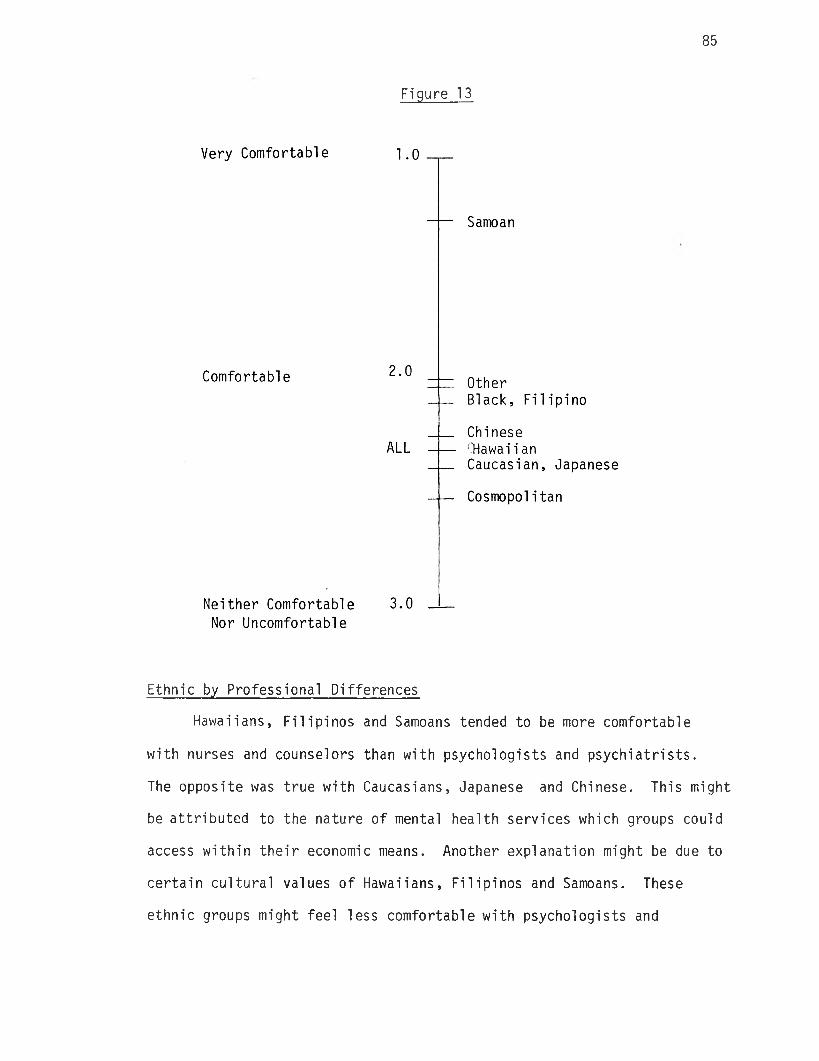
85
Figure 13
Ethnic by Professional Differences
Hawaiians, Filipinos and Samoans tended to be more comfortable
with nurses and counselors than with psychologists and psychiatrists.
The opposite was true with Caucasians, Japanese and Chinese. This might
be attributed to the nature of mental health services which groups could
access within their economic means. Another explanation might be due to
certain cultural values of Hawaiians, Filipinos and Samoans. These
ethnic groups might feel less comfortable with psychologists and

86
psychiatrists since the services of these professionals were probably
less accessible to them due to factors related to status and income.
The ethnic by professional interaction is illustrated in the cross
tabulation of average scores in Table 10.
The implications of these differences on style of mental health
services delivery should be of critical importance (also see Table 11).

Table 10. Ethnic Preference by Professional Differences
AverageScore Rank Caucasian Japanese Chi nese Hawaiian Filipino Samoan Cosmopolitan Black Other f
2.17 3 Psychiatri sts 2.21 2.31 2.00 2.59 2.08 1.62 (; 2.30 2.37.. 1.79
2.13 2 Psychologist 2.13 2.30 2.05 2.37 2.20 1.47 2.16 2.25 1.83
2.26 5 Social Worker 2.59 2.32 2,40 2.11 1.82 1.23 . 2.59 2.75 2.12
2.19 4 Counselors 2.45 2.22 2.30 1.95 1.93 1.33 2.49 1.75 2.04
2.32 6 Nurses (RN) 2.58 2.46 2.47 2.08 1.98 1.22 2.51 2.25 2.36■
2.79 9 PMA (Nurses Aide) 3.07 2.95 2.95 2.55 2.35 1.50 3.14 3.12 2.92i
2.57 8 Relati ve 2.88 2.83 2.85 2.11 2.16 1.32 2.68 2.25 2.87
1.83 1 Family Doctor 1.94 2.01 2.05 1.89 2.64 1.30 1.74 2.25 1.50
2.38 7 Clergyman 2.44 2.67 2.68 2.37 2.01 1.84 2.52 2.12 1.87
3.03 10 Layworker and Community Volunteers 3.31 3.31 3.15 2.70 2.62 1.74 3.18 2.87 3.08
co
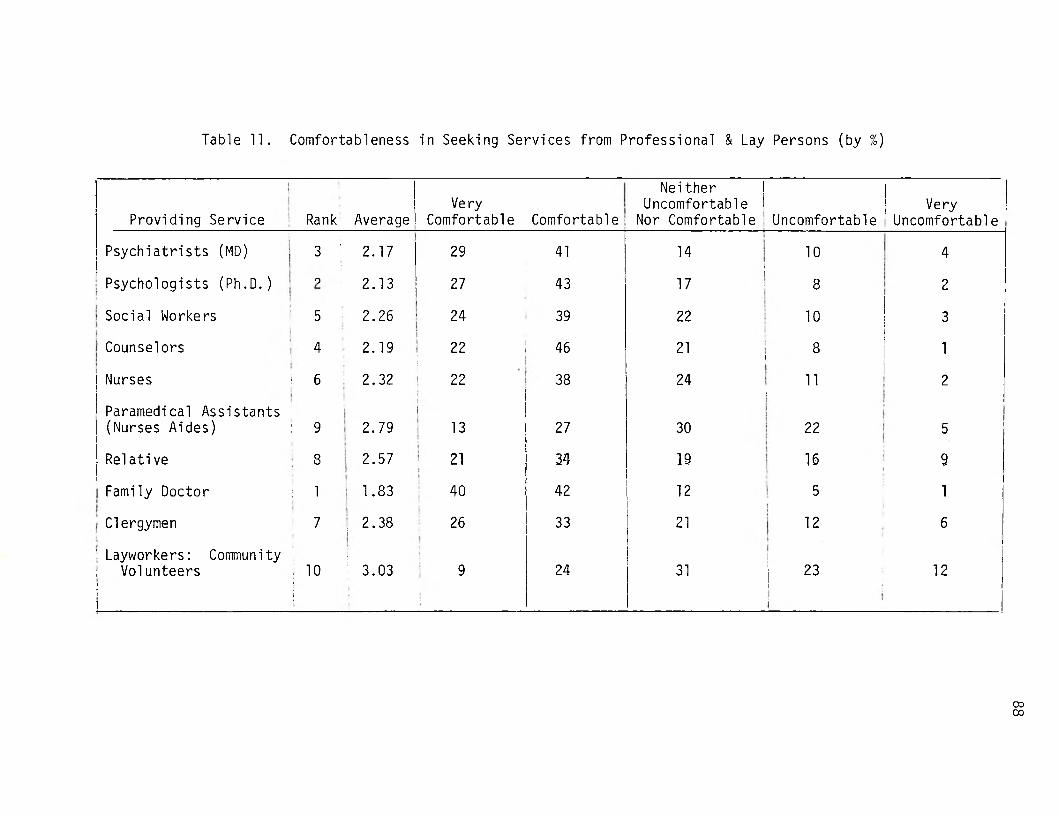
Table 11. Comfortableness in Seeking Services from Professional & Lay Persons (by %)
Providing Service Rank AverageVe ry
Comfortable Comfortable •
Neither i Uncomfortable i
Nor Comfortable ■ UncomfortableVery
Uncomfortable
Psychiatrists (MD) 3 '•
2.17 29 41■
14 10 4
Psychologists (Ph.D.) o 2.13 27 431
17 8 2
Social Workers 5 2.26 24 39 22 10 3
Counselors 4[ :
2.19 22S
46 21 i 8 1
Nurses * 6 2.32 22 38 24i
11 2
Paramedical Assistants (Nurses Aides) : 9i 2.79
i13 27 30 22 5
Relativei: 8 2.57 21 34 19 16 9
Family Doctor : 1 1.83 40 42 12 5 1
; Clergymen 7 2.38i 26 33 21 12 6
' Layworkers: Community ; Volunteers!i!
: 10•i
! 3.03 9[ 24 31 23
i
12
oo00

89
Civil ian-Military, Income, and Residential Differences
These variables accounted for only 2% of the variance in Scale 4.
Although the differences were slight, civilians tended to be more com
fortable and those from households earning less than $3,000 per year
least comfortable. Furthermore, there seemed to be a slight tendency
of the percentage of individuals who reported that they would feel
uncomfortable or very comfortable to be greater at both ends of the
income spectrum. For individuals with incomes less than $5,000 and over
$20,000, the percentages were 8% and 6% compared to 0% for the middle
income categories. In terms of the average scale score, the differences
are not large but the curvilinearity of the relationship was, nonethe
less, apparent. The plot of group average Scale 4 scores using Civilian
Military, Income and Residential differences are shown in Figures 14,
15, and 16.
Figure 14

90
Figure 15
Income
Comfortable 2.o ----- $5,000-$10,000
----- $3,000-$5,000ALL----- $10,000 and over
----- Less Than $3,000
Neither Comfortable Nor Uncomfortable
3.0
Comfortable
Figure 16
Residency
ALL
Wahiawa; Haleiwa-Waialua
Pearl City/Aiea; Mililani; Kunia/Waialua
Neither Comfortable Nor Uncomfortable

91
Related Items
Since Scale 4 included an analysis of only the five professional
groups discussed above, it is interesting to note that where persons
providing the services category is expanded to include other profession
als, the family doctor ranks first with 82% of the respondents feeling
comfortable (see Table 11). Also interesting to note is that more
respondents reported that they would feel more uncomfortable with lay-
workers and volunteers (35%) than with any of the nine other groups.
This finding would need some further investigation in view of the large
number (75%) of persons feeling that a rap type center manned by a lay
volunteer is important as indicated in the previous chapter. A plaus
ible explanation here might be that lay volunteers are preferred when
perceived in terms of a general response to importance and/or a problem
is of a general and non-serious type. However, professionals of the
type they are most familiar with (i.e., "family doctor") are preferred
when they are personally seeking the service which might be per
ceived to require a "qualified" professional. This is a finding which
has planning implications. Either family doctors would have to be
trained in methods of counseling which they probably would not have time
for - or a program designed to promote acceptance of mental health
professionals to a level commensurate with family doctors would have to
be considered. Another approach would be to encourage mental health
referrals from family doctors who might be expected to be the first
professional contact of a person with a problem.
Importance of Availability of 24-Hour Treatment Services
As Table 12 shows, all the services presented were considered

92
important or at least slightly important by the respondents. Only the
trained volunteer on call and the psychologist on call were perceived
as not important by more than 15% of the sample, while about 80% per
ceived these same two types of services as at least slightly important.
As might be expected, the emergency hospital room ranked first with 92%
of the respondents reporting its availability "important."
Respondents apparently perceived a qualitative difference
between a trained counselor on call and a trained volunteer on call.
The availability of the former emerged as third in overall importance
while the latter was last (sixth). Having a psychiatrist (ranked fourth)
and psychologist (ranked fifth) on call were perceived to be compara
tively less important than most of the other 24-hour treatment services.
TreatmentServices
AverageScore Rank Important
SIightly Important
NotImportant
Emergency Hospital Room 1.10 1 92 6 2
Psychiatrist on Call 1.67 4 46 40 13
Psychologist on Call 1.81 5 36 43 17
Talking to Someone on the Phone 1.60 2 51 34 13
Trained Counselor on Call 1.62 3 49 39 11
Trained Volunteer on Call 1.82 6 37 43 19
Table 12. Importance of Availability of 24-Hour Treatment Services

93
Other Services
The availability of day and partial/hospitalization programs for
clients with a history of psychological problems, transitional living
homes, and boarding and care homes was seen at about the same level of
importance by the respondents.
NoResponse Important
SIightly Important
NotImportant
Day Care/PartialHospitalization Program for Clients with a History of PsychologicalProblems 3 52 37 8
Boarding and CareHomes 2 52 35 10
Transition LivingHome (e.g., Half- Way Houses) 1 50 38 12
Level of Confidence in Counseling Services at Hospitals and OtherTypes of Emergency Services
As Table 13 shows, most of the respondents felt more confident at
Queen's Hospital in Honolulu when compared to the other hospitals pre
sented. Wahiawa was ranked second, but it should be noted that only
33% said they felt confident going there, while 43% had "mixed feelings"
and 14% revealed that they "would not feel confident going there."
Slightly more than one-third of those asked said they would feel confi
dent at Tripler, while 18% stated they would feel uncomfortable, and 35%
said they would have mixed feelings about receiving services there.
Kaneohe State Hospital was clearly the least likely place the

94
respondents would like to receive services, with only 14% saying they
would feel confident with the services, while 37% said they feel uncom
fortable and 40% expressed that they would have mixed feelings. It is
interesting to note that even though Leeward, Tri pier, and Wahiawa
Hospitals are in the Central Oahu Catchment Area, most respondents
preferred Queen's. Part of the reason for this might be explained by the
fact that forsome of the Aiea-Pearl City residents, getting to Queen's
might be easier than getting to Wahiawa. However, this is not the case
for Leeward Hospital and Tripler Army Hospital. Therefore, one is
inclined to believe the reason is more explained in terms of a per
ceived qualitative difference by the Central Oahu respondents.

Table 13. Confidence in Receiving Counseling or Psychiatric Services at These Hospitals
and Types of Emergency Services
HospitalsAverage
Score Rank No ResponseWould Feel Confident
Would Have Mixed Feelings
Would NotFeel Confident
Leeward Hospital 1.99 4 10 26 38 25
Tripler Army Hospital 1.79 3 11 36 35 18
Kaneohe State Hospital 2.25 5 9 14 40 37
Queen's Hospital in Honolulu 1.34 1 4 67 25 3
Wahiawa General Hospital
ij--- — - -
1.78 2 10 33 43 14
ert

96
Confidence in Types of Emergency Services
As Table 14 shows, the respondents felt most confident when the
emergency services were provided by a counselor in the respondents'
own home or at a local counseling service.
Going to the local counseling center was perceived by respon
dents (61%) as about the same as having a counsel or visit their home
(62%). Counseling services over the telephone were perceived to be
the least likely type preferred by the respondents of those presented.
Interestingly enough, only 42% of the respondents said they would
feel confident with the services received through a hospital emergency
room (ranked fourth) even though in a previous discussion 92% ranked
it highest in importance.
A possible explanation for this apparent discrepancy between
level of importance and level of confidence regarding the hospital emer
gency rooms may be that respondents as previously indicated generally
do not feel confident about the present emergency room facilities and
lack confidence in the services provided by the emergency rooms of the
hospitals in the Central Oahu area. Apparently, the respondents feel
more confident of the "outreach" approaches to their homes, going to
local counseling centers and going to counseling centers in other com
munities than in going to the hospital for emergency types of counseling
services.

Table 14. Confidence in Types of Emergency Services
Types of Emergency ServicesAverage
Score RankWould Feel Confident
Would Have Mixed Feelings
Would NotFeel Confident
Through a hospital emergency room 1.76 4 42 39 18
At home - counselor visiting home 1.43 2 63 29 6
Via the telephone 2.05 5 19 55 23
Local counseling center 1.42 1 61 33 4
Counseling center in another community 1.76 3 37 44 14
'-■J

X. FAMILY RELATIONS AND FAMILY STRESS
Scale 5
Problems Causing Family Stress
Scale 5 measured the degree of stress caused by problems encoun
tered by families in general. Twelve items were included in the scale
one per problem: money, unemployment, children behavior, crowding,
school, job pressures, within-family interpersonal relationships,
drinking, drugs, cultural differences, and desire to return to home
country or state.
The question was: "Most families have stress on them--problems
that cause tension among its members. To what degree, if any do the
following factors cause stress in your family?"
The breakdown of the average choices of all respondents across
all the problems were:
Level of StressInterpreted Choice Percent
1 Causes no stress 46
2 Causes a little stress 38
3 Causes some stress 5
4 Causes a lot of stress 1
5 Causes extreme stress _0
TOTAL 100

Table 15. Problems Causing Family Stress
Problem
Level of Stress
0None
1Little
2Some
3Lot
4Extensive
5 Average Rank
Money Problems 2 27 33 29 6 3 2.2 1
Children Behavior 3 30 36 23 7 2 2.1 2.5
Job Pressures 2 32 33 23 7 2 2.1 2.5
Unemployment 2 60 20. 12 5 2 1.7 5
Intra-FamilyRelations (the way we talk to each other) 3 45 38 12 2 0 1.7 5
School Problems 2 53 27 14 3 1 1.7 5
In-Law Problems 2 61 22 11 3 1 1.6 7.5
Crowding 1 63 22 10 3 1 1.6 7.5
Drinking 2 66 21 7 3 1 1.5 9
Drugs 1 85 6 3 2 3 I-3. 11
Cultural Differences 2 74 16 6 1 1 1.3 11
Homesickness 2 76 15 4 2 1 1.3 11

100
The results showed that 46% of the respondents reported that the
problems surveyed caused no stress, while 53% of the respondents reported
that the problems surveyed in general cause "some" or a "little" stress
in their families. Only 1% indicated problems to cause "a lot" of
stress. The average scale score of all respondents is 1.7, which was
closest to the choice "causes a little stress."
Item analysis
Different problems were reported to cause different amounts of
stress. The ranking of the average score for each problem is shown
in the last column of Table 15.
Money problems caused the most stress while problems with use
of drugs, cultural differences, and desire to return to former home or
state caused the least stress. The mean score and collective rank of
the problems in the descending orders of stress caused are shown in
Table 16.

Table 16. Family Stress
AverageScore Rank
Causes No Stress
Causes a Little Stress
CausesSome
Stress
Causes a Lot of Stress
CausesExtremeStress
Money Problems 2.24 1 27 33 29 6 3
Unemployment Problems 1.67 6 60 20 12 5 2
Children's Behavior 2.11 3 30 36 23 7 2
In-Law Problems 1.58 7 61 22 11 3 1
Crowding 1.56 8 63 22 10 3 1
School Problems 1.70 5 53 27 14 3 1
Job Pressures 2.12 2 32 33 23 7 2
The Way We Talk toEach Other 1.72 4 45 38 12 2 0
Drinking Alcoholic Beverages 1.50 9 66 21 7 3 1
Drugs 1.29 12 85 6 3 2 3
Cultural Differences in the Family 1.34 10 74 16 6 1 1
Desire to Return toHome Country or State 1.33 11 76 15 4 2 1

102
Causes of Stress Ranked by Percent
When the causes of stress items are ranked by % as shown in
Table 16, "job pressures" emerges as a relatively important cause of
stress (ranked 3rd); "children's behavior," interestingly enough, seems
to also be an important cause of stress, ranked 2nd only to "money
problems." It would seem that the desire to return to one's own country
or state is generally not significant, ranking last among those causes
presented. However, this ranking must be seen in view of the fact that
53% of the respondents reported having been born in Hawaii and about
the same number (57%) stated that they lived here 15 years or more (see
Chapter 4). The "desire to return to home country or state" as a cause
of stress may be applicable to only about 45% of the sample. Within
this context the 22% which reported this reason as a cause of stress
would actually represent around half of the combined immigrant and
in-migrant sample.
Ethnic Differences
The differences among ethnic groups were significant (F = 3.4)
but only accounted for 3% of the total variance. Ethnicity was least
efficient in explaining variance in two scales. Scale 5 was one of the
scales. Of the few respondents in the Black sample (n = 8) and "other"
(n = 24) ethnic groups, 13% reported that the problems caused "a lot"
of stress in the family. This percentage was high compared to 1% for
all respondents. In terms of the mean scale score, the differences among
the ethnic groups are shown in Figure 17.

103
Figure 17
Relative to the responses of Samoans in previous scales which
tended toward the ideal end of the response continuum, the Samoan group
response to Scale 5 differs from the pattern established earlier.
Ethnic-Problem Interaction
The stress quality of one problem relative to other problems
showed a lot of variation across ethnic groups. However, due to the
large amounts of problems surveyed in Scale 5, it would be difficult to
present a simple cross-tabulation which would give a visual illustration
of ethnicity and problem interaction.
Civilian-Military Status Difference
The significance of the civilian-military variable was of the
same magnitude as ethnicity. The Reserve and Military Retired as groups
tended to report these problems as causing stress (scale score = 1.4)
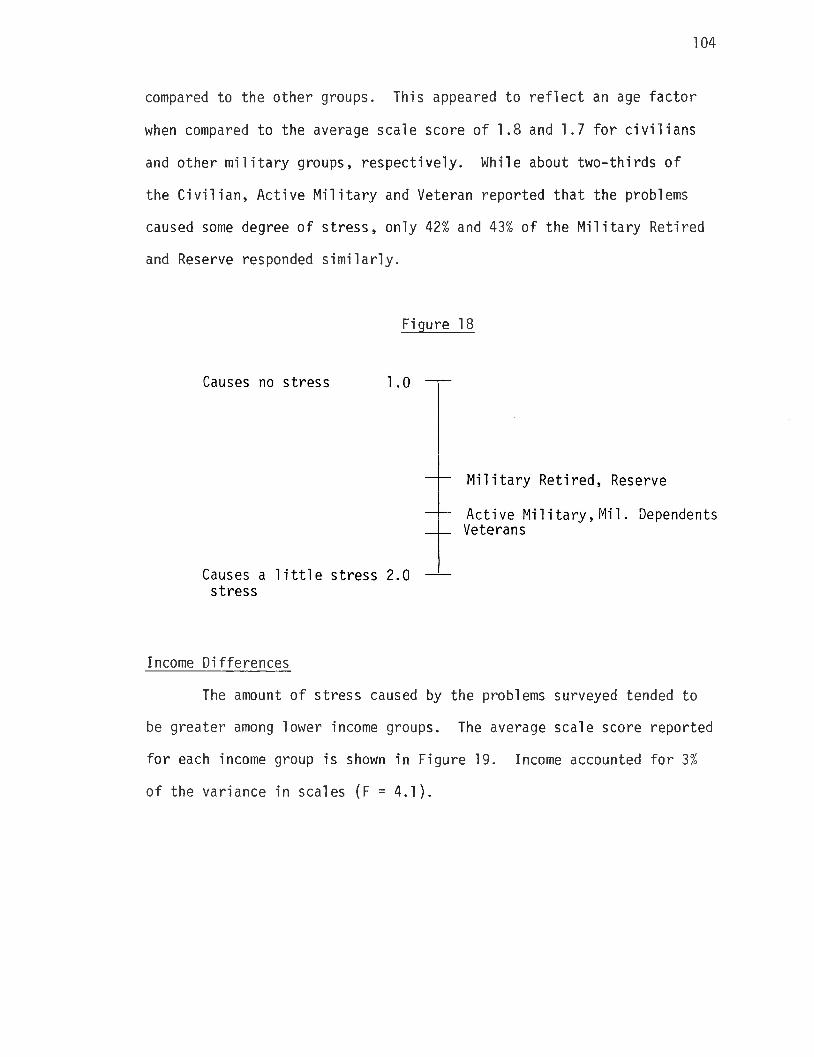
104
compared to the other groups. This appeared to reflect an age factor
when compared to the average scale score of 1.8 and 1.7 for civilians
and other military groups, respectively. While about two-thirds of
the Civilian, Active Military and Veteran reported that the problems
caused some degree of stress, only 42% and 43% of the Military Retired
and Reserve responded similarly.
Income Differences
The amount of stress caused by the problems surveyed tended to
be greater among lower income groups. The average scale score reported
for each income group is shown in Figure 19. Income accounted for 3%
of the variance in scales (F = 4.1).
Figure 18

105
Figure 19
Residency Differences
There was a slight difference between urban-suburban (Pearl City/
Aiea, Mililani) and rural (Wahiawa, Haleiwa/Waialua, Kunia/Waipahu) loca
tions. The urban-suburban respondents tended to judge the problems
surveyed as causing a little more stress than rural respondents.
Figure 20

106
Related Items
The items which measure the ways family members relate and resolve
their problems are discussed in this section. As Table 17 shows, res
pondents gave a family ideal of the way in which they related to each
other. "Having fun together" was the most commonly mentioned way in
which their family members related to each other. Over 80% of the respon
dents reported that they had fun with their family "almost always" or
"most of the time." Eighty percent of the respondents also reported
that they "directly and candidly express their feelings and thoughts
about each other" "almost always" or "most of the time." This is
apparently a rather ideal appraisal by the respondents in view of the
fact that over 30% reported that about half the time or more they
resolved family disagreements by "keeping their feelings to themselves
and waiting until it blows over."
Also, interestingly in this regard is the fact that 53% of the
respondents reported that their "father had the last say" in resolution
of disagreements "almost always" or "most of the time," while 33%
reported their mother "has the last say."
Fighting with each other physically was considered the least
frequent way of resolving family conflict (ranked 10). However, it is
interesting to note that more respondents reported that they "argue
and yell" as a means to resolve conflict rather than talk to their minis
ter or to professional counselors. The respondents seemed to be gener
ally more disposed to resolving conflict within their immediate family
through either a concensus, their father or their mother. The next best
means of resolving conflict seemed to be either keeping it to themselves
(ranked 5th) or talking to relatives (ranked 6th).

Table 17. Ways Family Members Relate and Solve Problems
Ways Family Members RelateAverage
Score RankAlmostAlways
Most of the Time
AboutHalf
the Time
Once • in a While
AlmostNever.
Family Members:
Directly and candidly express their feelings and thoughts to each other 1.81 2 43 37 11 6 1.
Give and accept orders and directions to and from each other 1.99 4 29 48 14 5 1
Cooperate 1n doing practical tasks with each other 1.88 38 41 12 5 1
Have fun together 1.74 1 48 34 8 6 1
Discuss problems together and arrive at joint decisions 2.11 6 34 36 15 10 3
Are sensitive to each other's needs and feelings 2.03 5 34 40 14 8 2
Resolution of Disagreements
Father has the last say 2.34 2 24 29 26 11 4
Mother has the last say 2.92 4 6 25 36 21 4
Everybody expresses their opinions fully 2.10 1 30 40 16 9 2
We keep our feelings to ourselves and wait until 1t blows over 3.79 5 4 12 16 36 30
We argue and yell 4.03 7 3 6 10 43 35
We fight with each other physically 4.85 10 1 0 1 7 84
We reason things out calmly 2.36 3 18 43 23 11 3
We talk to our minister, priest, rabbi 4.45 8 3 4 6 14 68
We talk to our friends or relatives 3.87 6 4 12 14 31 36
We talk to professional counselors 4.65 9 1 3 4 13 74

XI. PERSONAL HEALTH
Scale 6 measured the respondents' assessment of the state of
their personal health through items which dealt with their sleeping,
eating, smoking, drinking and other habits and their physical health.
Unlike other scales wherein a single question with the same answer
choices were used for all the items covered by the scale, Scale 6 con
sisted of different items with unique answer choices. The answer
choices for all Scale 6 items were then transformed into one common set
of choices. These choices and the breakdown of responses are shown
below.
Scale 6
Level of Personal HealthInterpreted Choice Percent
1 Very Health 28
2 Health 66
3 Somewhat Healthy 6
4 Unhealthy 0
5 Very Unhealthy _0
TOTAL 100
The respondents' assessment of their personal health was rather
high. Two-thirds reported responses which were interpreted as "healthy,"
and 28% reported responses which were interpreted as "very healthy."
Responses which might indicate some degree of personal health problems

109
will be found among the 6% whose responses were interpreted as "somewhat
healthy." The average Scale 6 score was 1.7, which indicates that the
respondents' assessment of their eight items of personal health was
"healthy."
Item Analysis
The items where a relatively large number of respondents'
responses were interpreted as "unhealthy" were on physical exercise and
smokers' habits.
The results from Table 18 show that 16% get vigorous physical
exercise only "once a month or less," while 11% get "none."
Another problem area was smoking. The results show that 17%
reported smoking "one pack a day," while 6% reported smoking "two
packs a day."
Relative to the other personal health items in Scale 6, the
respondents in general have the lowest health score for vigorous physi
cal exercise and smoking habits. The average scores obtained by the
respondents were 2.62 and 2.19 for exercise and smoking respectively.
The question (B15) which dealt with drinking habits also
deserves attention since 6% of respondents reported that they drank any
where "between 11 to 20 times per week," and 2% reported drinking "3
or more times a day."
While relatively unhealthy habits in smoking, drinking and physi
cal exercise were noted, only 2% of the respondents reported that their
physical being was "not so good." Apparently, smoking, drinking, and
not getting enough exercise are not perceived as seriously hampering
health.
no
Related Items
Two items which were related to the items included in Scale 2
measured the degree to which the respondents attempted to stop smoking
and the ability of the respondents to cope with trouble in sleeping. A
majority, 52%, did not give a response to the item on smoking which
might indicate that many of those who smoke and thought themselves able
to stop or were actually successful in doing so chose this response cat
egory. Only 4% of the respondents reported that they would like to
stop and would need help to do so.
A majority of the respondents, 54%, reported that they did not
have a problem in sleeping. Of those who have problems, 27%, only 1%
reported that they were unable to cope with the problem and only 3%
reported that they take medication.

Table 18. Personal Health
Health FactorsAverage
Score Rank
Interpreted Choice
Very Healthy HealthySomewhatHealthy Unhealthy
VeryUnheal thy •
APPETITE 1.56 3
Very good
57
Good
31
Fair
9'
Poor
1 *
Very poor
0
DIET 1.26 1 .
Regular meals
76
Irregularmeals
21
Junk food diet
2
VIGOROUSPHYSICAL EXERCISE 2.62 8
4+ times/week
25
2-3 times/ week
25
Once a week
21
Once/month or less
16
None
11
TROUBLE SLEEPING 1.48 2
Rarely or never
71
Once or twice a month
16
Once or twice a week
7
Often
3
Almostalways
2 * •
« •
HOW MUCH DO YOU DRINK? 1.62 4
None or hardly any
63
1-5/week
20
6-10/week
8
11-20/week ’
6
3+/day
2.
IF YOU SMOKE, HOW MUCH? 2.19 7
Never smoked
46
Smoked but quit
17
Occasionalcigarette
12
1 pack/day
17
2 packs or more
6
PHYSICAL WELL-BEING 1.91 5
Great
28
Good
53
Fair
15
Not so good
2
Terrible
0
ENERGY 2.11 6
Very energetic and active
25
Generally energetic and active
40
Of medium energy
29
Inactive and low energy
3
Very Inactive and low energy

Table 19. Related Items
ro
QUITTINGSMOKING
Noresponse
Never smoked Tried to quit, can't
Never tried, don't care to
Would like to stop
Would like to stop, need help
52 17 8 9 10 4
COPING WITHTROUBLESLEEPING
Noresponse
Don't have a sleeping
problemNot able to
cope with it
Just lie in bed or get up
and read or tai k
Take medication non-RX drug
Take medi ca- tion/Rxdrug
18 54 1 23 1 2

e
Table 20. Ethnic Differences in Personal Health
Responses Caucasian Japanese Chinese Hawai ian Filipino Samoan Cosmopolitan Black Other
Very Healthy 26 19 38 30 17 83 19 37 25
Heal thy 67 74 57 67 78 17 77 25 58
Somewhat Healthy 4 6 5 4 5 0 4 37 17
Unhealthy 0 0 0 0 0 0 0 0 0
Very Unhealthy 0 0 0 0 0 0 0 0 0
GO

114
Ethnic Differences
With the exception of the Samoans, which as a group reported a
"very healthy" assessment of their personal health, the other ethnic
groups did not differ that much in their average Scale 6 scores. The
amount of variance explained by ethnicity was 17% (F = 20.6). The plot
of the average ethnic group Scale 6 scores is shown in Figure 21.
An interesting difference among the groups seemed to lie in the
percentage who indicated "very healthy" responses. The percentage of
Japanese, Filipinos and Cosmopolitan-Mixed were about half of those of
the other ethnic groups reporting "very healthy" response. The ethnic
breakdown for Scale 6 is shown in Table 20.
Figure 21

115
Civilian-Military, Income, and Residency Differences
The civilian group showed a slightly higher personal health
assessment than the military group. The less than $3,000 a year group
showed the least assessment of all the income groups. The residence
of urban-suburban areas reported a slightly lower physical health
assessment than residents of rural areas.
The plot of the average scores of the civilian-military, income
and residency groups is shown in Figures 22, 23, and 24.
Figure 22

116
Figure 24

XII. JOB QUALITY & SATISFACTION
Scale 7
Job Quality
Scale 7 measured the degree to which respondents were satisfied
with their job conditions. Like Scale 6, this scale consisted of 5
different questions with different response choices. These response
choices were then interpreted with a common set of choices. The break
down of the responses is shown below.
Level of Satisfaction:Interpreted Choice Percent
331 Very Satisfactory
2 Somewhat Satisfactory 48
3 Neutral 18
4 Somewhat Unsatisfactory 1
5 Very Unsatisfactory 0
TOTAL 100
About three fourths of the respondents reported that they were
"Somewhat Satisfied" or "Very Satisfied" with their job condition in
general. Only 1% reported general dissatisfaction and 18% reported that
the conditions were neither satisfying nor unsatisfying. The average
Scale 7 score was 2.2. Therefore, on the average, respondents felt satis
fied with their work conditions.

Table 21. Job Quality and Job Adjustment
Work Satisfaction
Rank
3
AverageScores
1.67
No Response
28
VerySatisfying
39
SomewhatSatisfying
24
. Neutral
5
Somewhat Unsati sfactory
3
VeryUnsati sfactory
1
How Well Do You Get Along With Co-Workers? 1 1.57
No Response
29
Very Well
49
Well
22
11
VOo|
111
SomewhatPoorly
0
Very Poorly
0
Salary Level 4 2.14
No Response
30
VerySatisfying
23
SomewhatSatisfying
28
Neutral
7
Somewhat Unsati sfactory
8
VeryUnsatisfactory
3
Do You Work Fewer, About the Right Number or More Hours Than You Would Like? 2 1.65
No Response
29
Fewer Hours
10
About theright no. of hours
46
More Hours
15
Proximity of Work to Home 5 3.17
No Response
30
Wi thinWalking
Distance
9
5 minute Drive
9
6-15 minute Drive
22
16-30 minute Dri ve -
18
• More thanHalf an Hour
11
oo

119
Item analysis
The breakdown of the responses for each item are shown in Table 21.
Distance traveled to work from home was one of the job conditions
wherein a substantial percentage of respondents reported these conditions
to be "Somewhat Unsatisfactory". There were 18% who reported that it
took 16-30 minutes to work, while 11% reported that it took them more
than 30 minutes.
Where salary level is concerned, 8% reported that their salary
was "Somewhat Unsatisfactory" while 3% reported "Very Dissatisfactory".
Regarding numbers of hours worked, 15% reported that they worked
more hours than they would like, while 11% reported working less hours
than they would like.
An item which was not included in the scale was work shift. About
half of the respondents, 48%, worked the regular shift, whereas 22% worked
late, graveyard and mixed shifts or on their own hours.
Work Hours
Hours Percent
Day Shift 48
Late Shift only (3-11 PM) 5
Graveyard Shift Only (11PM - 7AM)
1
Mixed Shift (Sometimes day,sometimes late and/or graveyard, and/or weekends)
13
Own Hours 6
No response 30

120
In response to a general job satisfaction question (B19), only
4% reported their job satisfaction to be "Unsatisfactory" or "Very Unsatis
factory". There was, however, a rather high percentage (28%) who did not
respond to the question. This finding is interesting considering the
fact that "job pressures" ranked second as a cause of stress (see Family
Stress Table in Chapter 10).
Ethnic Differences
The Filipinos, Cosmopolitans, and other groups tended to have
slightly higher percentages of respondents with satisfactory categories
and slightly lower percentages in the neutral categories. This is shown
in Table 22.
This pattern was also evident in the plot of average scores of each
ethnic group as shown in Figure 25.
Figure 25

Table 22. Ethnic Differences on Job Satisfaction
Responses Caucasian 1 Japanese|
Chinese!|
Hawai ian; Filipino1
Samoan! Cosmopoli tan Black Other
Very Satisfactory 35I
28 43. 26 43 16 42 12 42
SomewhatSatisfactory 43 50 29 52 41 82 42 50 42
Neutral 21 21 24 22 16 2 17 37 .17
SomewhatUnsatisfactory 1 2 5 0 0 0 0 0 0
VeryUnsatisfactory 0 0
1
0 0 0
L- ----------
0 0 0 0
ro

122
Civilian-Military, Income and Residency Differences
In the previous scale, the civilian group tended to have slightly
better scale scores than the military groups. On Scale 7, however, the
Military Retired and Reserved groups tended to show slightly greater job
satisfaction than both the civilian and other military groups. This might
be indicative of the Military Retired to report greater satisfaction over
their second careers or other retirement situation. This condition may
disprove the stereotype regarding retired individuals in general.
Where income was concerned, the lower income groups of Less than
$3,000 to $5,000 had slightly lower satisfaction level with their work
conditions.
The urban-suburban rural dichotomy was clearly not observable
from the plots of residency groups scores.
The plot of the civilian-military, income and residency groups
are shown in Figure 26, 27, and 28.
Fiqure 26

123
Figure 27
Figure 28

XIII. PERSONAL CONTACT
Scale 8
Scale 8 measured the amount of interpersonal contact the respon
dents had with their family and friends. Like Scales 6 and 7, this
scale consisted of three items which were worded differently and which
had different response choices. The response choices were translated
into a common set of choices. The breakdown of responses is shown
below.
The item tabulation is shown in Table 23.
Level of Adequacy Interpreted Choice Percent
1 More than Enough 36
2 Enough 44
3 Somewhat Enough 18
4 Not Enough 1
5 Way Too Little _0
100
Across the three personal contact items, 99% of the respondents
reported varying degrees of satisfaction. Only 1% reported not having
enough personal contact. The average Scale 7 score was 1.7, "Enough."
Item Analysis

Table 23. Personal Contact (by Percentage)
AverageScore 1 2 3 4 55
Hours spent talking25 or more
hours15-24hours
8-14hours
4-7hours
0-3hours
with family or friends each week. 2.4 29 23 29 13 4
General feeling aboutVery
satisfiedSomewhatsatisfied
Neither satisfied nor dissatisfied
Somewhatsatisfied
Verydissatisfied
contact with family and friends. 1.5 53 38 5 1 0
Getting the amount of • contact, conversation and good feeling from family and friends as needed. 1.2
I get just the amount
I need
81
I get less than I need
17
I get much less thanI need
1
nocn

126
On the average, the respondents spent 8 to 24 hours talking with
family or friends each week. Only 21% reported spending less than 8
hours of contact with friends and family per week.
Two items which were not included in Scale 8 but which were
relevant to the discussion were those which dealt with hours spent
watching TV and reading. On the average, the respondents seemed to
spend less time watching TV or reading for entertainment than talking
with their friends and family. While 52% spent 15 hours or more with
friends and family, only 34% spent the same time watching TV, and only
28% spent the same time reading.
Respondents also reported that they were "very satisfied" (53%)
or "satisfied" (38%) with their contact with family and friends.
Although 91% reported the satisfactory quality of interpersonal
contact, 17% indicated that they get less than they need.
Ethnic Differences
Ethnic groups tended to respond more similarly (again with the
exception of the Samoan group in terms of percentage breakdown) in
Scale 8 than in other scales. Ethnicity only accounted for 2% (F = 1.9)
of the variance in Scale 7, the lowest amount in all ten scales. In
terms of percentage and average scores, Filipinos and, to a larger
extent, those who fell into the category "other", tended to have lower
levels of personal contact than the other groups. This can be seen
in Table 24 and the average score plots in Figure 29.

Table 24. Ethnic Differences in Level of Personal Contact (by Percentage)
Caucasian Japanese Chinese Hawaiian Fil i pi no Samoan Cosmopoli tan Black Other
More than enough 42 39 48 41 33 18 42 . 50 37
• Enough 49 55 43 52 • 55 82 54 50 42
Somewhat enough 9 6 9 7 11 0 4 0 21
Not enough 1 0 0 0 1 0 0 0 ' 0
, Way too. little 0 0 0 0 0 0 0 0 0

128
Figure 29
Civilian-Military, Income and Residency Differences
As Figure 30 shows, the military veterans reported a slightly
lower average level of personal contact than the other military groups
and the civilian group. Those from households who earned less than
$3,000 a year also showed a lower average level of personal contact
than all other income groups. All other income groups responded in
a highly similar manner as can be seen in Figure 31.
As Figure 32 shows, the residents of the more rural areas
reported slightly lower levels of personal contact than the resi
dents of more urban-suburban areas.

129
Figure 30(Civilian-Military)
Figure 31
Figure 32

XIV. SELF-ESTEEM AND LIFE SATISFACTION
Scale 9
Scale 9 measured how respondents felt about themselves and their
lives. Like Scales 6, 7, and 8, the three items intended in this scale
(B41 to B42) had different response choices which were interpreted into
a common scale.
The question asked was, "The next group of questions asks about
how you view yourself and the changes, if any, you would like to see
in your life."
The response breakdown is shown below.
Level of Satisfaction Interpreted Choice Percent
Very Satisfied 28
Satisfied 60
Neutral 12
Dissatisfied 0
Very Dissatisfied J)
TOTAL 100
Eighty-eight percent of the respondents showed positive assess
ment of themselves and their lives. The average Scale 9 score was 1.8,
"Satisfied."

131
Item Analysis
The percentage breakdown of the three items which comprised
Scale 9 is shown in Table 25.
There seemed a remarkable similarity in the response pattern
among the items. None of the respondents felt that they were disliked
by others nor that they disliked themselves. Only 3% reported dissatis
faction with their lives.
Ethnic Differences
The percentage breakdown by ethnic groups showed some differences
in the response pattern. The Cosmopolitan group showed a higher percen
tage, 17%, that reported "Very Satisfied" compared to other groups. The
Cosmopolitan and Other groups had higher percentages of respondents who
answered in a neutral manner as shown in Table 26.

Table 25. Self-Esteem & Life Satisfaction (by Percentage)
> Average> Scale ! Score
i
!1
How other people view you. 1.8
Like me very much
25
Like me for the
most part
61
Like meDi sii ke me
Feel Neutral
13
Dislike me for the most part
0
Dislike me very much
0
■ *Truly Equally good Di si ike Di si ike myself
content Okay or bad myself very much
Feelings about self 1.7 37 46 14 0 0
Satisfaction with your life 1.9
Verysatisfied
33
Satisfied
45
About equally satisfied &
dissatisfied
17
Dissatisfied
2
Verydissatisfied
1
COro

Table 26. Ethnic Differences in Self-Esteem and Life Satisfaction (by Percent)
Responses Caucasian Japanese Chinese Hawai ian Filipino Samoan Cosmopolitan Black Other
Very Satisfied 22 23 33 30 24 74 19 25 29
Satisfied 63 66 52 59 68 22 64 75 50
Neutral 14 11 14 11 8 0 17 0 21
Dissatisfied 1 0 0 0 0 0 0 0 0
Very Dissatisfied 0 0 0 0 0 0 0 0 0
coco

134
The pattern shown in Table 26 could also be depicted as a plot of
the average scores of the different ethnic groups (see Figure 33).
Ethnicity accounted for 15% (F = 18.26) of the variance.
Figure 33 (Ethnicity)
Very Satisfactory 1.0 -----
Samoan
All
BlackHawai ianChineseFilipinoJapanese; Caucasian Cosmopolitan; Other
Satisfactory 2.0
Civilian-Military, Income and Residency Differences
As Figure 34 shows, the civilian group reported slightly higher
satisfaction levels than the military groups. Among the military groups
the Veterans group showed lower satisfaction toward life and self.

135
Figure 34
Those from households which earned less than $3,000 reported the
lowest level of satisfaction toward themselves and their lives as shown
in Figure 35. For the other income groups, there appeared to be two
distributions, both showing a direct relationship between level of satis
faction and income.

136
Fiaure 35

137
As shown in Figure 36, rural area residents reported a slightly
higher level of satisfaction, with self than did suburban and urban
residents.
Figure 36

XV. COPING WITH STRESS
Scale 10
Propensity to Seek Help in Coping with Life Stress
Scale 6 measured the degree to which individuals seek help from
other individuals (Question Nos. B44-50) or find diversion in other acti
vities (Question Nos. B55-58).
The question asked was, "We are interested in how you handle
the stresses of the various family, personal and community problems
which come up in everyone's life from time to time. What do you do to
relieve the stress of the unpleasant situations and feelings which
accompany the problems of life?" The response breakdown is shown below.
Most of the respondents, 81% reported a medium propensity to seek
help from other individuals and to find a diversion in other activities.
However, a noteworthy percentage, 17%, reported a low propensity to
ChoiceLevel of Propensity Interpreted Choice Percent
1 Often 1 High Propensity 1
2 Sometimes 2 Medium Propensity 81
3 Never 3 Low Propensity 17
No Response
TOTAL 100

139
seek help from others and find diversion in other activities. The
average Scale 10 score is 2.3, "Medium Propensity."
Item Analysis
The item analysis has three discussion sections. Each section
corresponds to a group of items.
Group 1. Seeking Help From Others
The breakdown of responses for Question Nos. B44 and B50 is shown
in Table 27. The seven types of human resources included in Scale 10
are also shown in Table 27.

Table 27. Seeking Help from Others as a Coping Strategy (by Percentage)
AverageScore Rank Often Sometimes Never
Seek advice from members of my immediate family 1.7 1 34 56 9
Seek advice from my relatives 2.3 3 5 52 39
Seek advice from my friends 2.1 2 11 64 23
Talk to my minister, priest or other religious counselor 2.6 5 4 24 71
Seek professional help from public sources 2.7 6 2 19 78
Seek help from psychiatrists 2.8 7 1 11 84
Seek help from private sources (family doctor) 2.5 4 2 41 55
o

141
It should be noted that the respondents more frequently sought
help from members of their immediate family than others. They showed
least the propensity to seek help from psychiatrists and professional
help from public sources. The rank order of human assistance sought
by respondents was as follows: immediate family members first, followed
in descending order by friends, relatives, family doctor, minister/
priest/religious counselor, professional help from public sources, and,
lastly, psychiatrists.
The tendency never to seek help from others outside of the
confines of the family, relations and friends was very pronounced.
Three items which were not included in the scale dealt with the
propensity to relate stressful feelings to others in general. The
breakdown of response for Question Nos. 51 to 53 is shown in Table 28.
No3esp-?nse
Often Sometimes NeverAverage
Score
Express my feelings to no one in particular 1 8 56 34 2.27
Express my feelings to other people 2 16 65 17 2.01
Seek the comfort and support of other people 5 15 61 19 2.04
The respondents showed only a medium propensity to seek to relate
their feelings to, or seek comfort from, other people.
Table 28. Propensity to Relate Stressful Feelings to Others (by Percentage)

142
Group 2. Seeking Diversion in Other Activities
There were five activities included in Scale 10. The breakdown
of the responses is shown in Table 29.
Table 29. Diversion in Other Activities (by Percentage)
NoResponse Often Sometimes Never
AverageScore Rank
Eat 0 16 42 41 2.25 4
Drinkalcohol 1 3 29 66 2.65 5
Read or think a lot 3 39 47 11 1.70 1
Involve myself in my hobbies 2 25 57 17 1.92 2
Exercise or play sports 1 16 51 32 2.17 3
When faced with problems which cause stress, the respondents
showed greater propensity to either think or read and involve themselves
in hobbies. They only showed medium propensity to resort to physical
exercise or sports and very low propensity to eating and, much less,
drinking.
Other items which were not included in the scale dealt with other
strategies. These are shown in Table 30.

143
Table 30. Other Strategies in Dealing with Stress
NoResponse Often Sometimes Never
AverageScore
Take prescription drugs 3 3 17 77 2.76
Take non- prescri ption drugs 2 1 20 76 2.77
Take a walk or drive 1 12 59 27 2.15
Respondents were more apt to take a walk and less likely to take
either prescribed or unprescribed drugs in coping with problems or
stress.
Group 3. Several Coping Strategies
There were three items which were not included in Scale 10 which
measured the general approach of the respondents in coping with stress.
The breakdown of responses is shown in Table 31.

144
Table 31. Several Coping Strategies
AverageScore Often Sometimes Never
Attack the problem that caused the stress head- on, to solve it. 1.6 43 51 5
Keep my feelings to myself (I wait until I feel better) 2.0 15 62 21
Pretend it doesn't exist or deny that it is a problem. 2.5 2 41 54
Many of the respondents, 43%, reported that they often attack the
stress-causing problems head-on in order to solve them. For 51%, this
strategy was used only sometimes and for 5%, never. Conversely, 54%
never pretended the problems do not exist, while 41% sometimes did pre
tend. Keeping feelings to themselves sometimes was reported by 62%.
Ethnic Differences
As a group, the Filipinos, Chinese and Cosmopolitans showed less
propensity to resort frequently to using the coping mechanisms included
in Scale 10 and those included in the survey. This can be seen in the
breakdown of response by ethnicity as shown in Table 32.

Table 32. Ethnic Differences in Frequency of Use of Coping Mechanisms (by Percentage)
Response Caucasian Japanese Chinese Hawaiian Filipino Samoan Cosmopolitan Black Other
High 1 0 0 0 0 1 3 25 0
Med i urn 85 86 81 85 58 99 71 75 92
Low 14 14 19 15 41 0 26 0 8
-p>CP

146
The same conclusions are obtained from an inspection of the plot
of the average Scale 10 score of the different ethnic groups as shown in
Figure 37. Ethnicity accounted for 10% of the variance (F = 10.3) in
Scale 10.
Figure 37 (Ethnicity)
Civilian-Military, Income and Residency Differences
The civilian group reported a slightly greater propensity toward
the coping mechanisms included in Scale 10 than the military groups (see
Figure 38). Individuals from households earning less than $3,000 yearly
reported a slightly lower propensity to use the coping mechanism in
Scale 10 as shown in Figure 39. Residents of both rural and urban-
suburban areas tended to have the same levels of propensity toward cop
ing mechanisms (see Figure 40).

147
Medium
Low
Medium
Low
Figure 38(Civilian-Military)
2.0 ——r—
Civilian
All
3.0 ------
Active Military; Mil. Dependent; Vet. Military Retire; Reserve
Figure 39 (Income)
2.0 ------
All
3.0
$5,000-$10,000
$3,000-$5,000
$10,000-$15,000; $15,000-$22,000
Less Than $3,000

148
Figure 40 (Residency)
Medium 2.0 ------
AllMililaniPearl City/Aiea; Haleiwa/Waialua;
Kunia/Waipio; Wahiawa
Low 3.0

XVI. DISCUSSION OF THE STATISTICAL ANALYSES APPLIED TO THE FAMILY SAMPLE
For 79 of the cases, we sampled another member in the same family
We were interested in determining the similarities among the perceptions
of members of the same family on all 10 scales.
As a comparison, we selected 79 people at random from the
remainder of the 928 in the total sample and paired them, again random
ly. The intra-family pairs were called the family group, and the random
or unrelated pairs were called the unrelated group. Each group and each
scale or question was handled identically, i.e., subjected to the same
calculation procedures.
First, the difference in scores between the members of each pair
was calculated and expressed as a positive number for each scale. Then
the average difference score was determined for both groups on each
scale. The mean difference scores on each scale within the family group
and within the unrelated group are presented in Table 33 (Family Simi
larity). On six of the ten scales the difference in responses between
family members was significantly less than the difference in responses
between unrelated pairs. This is what we would expect, more similarity
between family members than unrelated pairs.
The Family Similarity table shows family members having signifi
cant similarity in responses regarding Awareness of Services (Scale 1),
Importance of Counseling Services (Scale 2), Comfortableness in Going to
a DOH Counseling Center (Scale 3), Family Stress (Scale 5), Self-Esteem

150
and Life Satisfaction (Scale 9), and Propensity to Seek Help in Coping
with Life's Stress (Scale 10). This alone does not necessarily indicate
family cohesion. However, it does reveal that there is generally greater
agreement among family members than unrelated respondents for those
scales mentioned.
Table 33. Family Similarity
(Mean Differences Between Family Pairs and Unrelated Pairs)
FamilyPai rs
UnrelatedLevel of
Significance
Awareness of Services .34 .67 <.001
Importance of Counseling Services .33 .49 <.01
Comfortableness inGoing to a DOHCounseling Center 1.09 1.65 <.01
Comfortableness withMental HealthProfessionals .73 .69 n/s
Family Stress .34 .52 <.01
Personal Health .42 .49 n/s
Job Quality Seale 1.01 1.14 n/s
Personal Contact .46 .56 n/s
Self-Esteem & Life Satisfaction .43 .57 < .05
Propensity to Seek Help inCoping with Life Stress .24 .35 <.05

151
Note: 1) "Family represents mean difference between members of same family.
2) "Unrelated" represents mean difference between randomly selected members of other families compared with members of same family.
3) Anything below .05 is considered statistically significant in this analysis where the levels of significance were the results of a t-test on each scale.
4) N^ (Family) = 79; N^ (Unrelated) = 79.
A more specific analysis of the extent of family response simi
larity within ethnic groups (B80) revealed no significant difference
among Caucasians, Samoans, Hawaiians, etc. Also, no significant
differences in family response similarity were found to be associated
with location (Pearl City, Aiea, etc.).
XVII. IMPLICATIONS FOR PLANNING
The Mental Health Needs Assessment survey is intended to provide
data from which to plan mental health services. It is important that
the information be read as descriptive rather than as evaluative. A
finding that, for example, only 40% of the residents of the area were
aware of the Mental Health Clinic is neither a "good" nor "bad" finding.
It says nothing about the clinic or about the success or failure of its
efforts to inform the community of its presence and purpose. Only if a
baseline on this item, taken prior to the implementation of an effort
to inform the community, is compared with an evaluation measure taken
after that effort has been given an opportunity to have an effect on the
community would it be possible to judge success or failure. One thing
that this survey does is establish such baselines. Future surveys, if
constructed to solicit comparable responses from a comparable sample,
will be able to reflect the effects over time of the efforts of the
clinics and the center. Readers are cautioned to avoid jumping to con
clusions that a certain service is or is not doing its job, or that
certain areas are being served better or worse than others based on
this survey data. To make such conclusions, it is necessary to compare
the information in this survey with either information from another
comparable source or, ideally, with the results of a follow-up survey
taken after some programming changes are made.
Statistical data have a primary and proscribed role to play in

153
the overall information-gathering process. They have the unique attri
bute of being numerical. They lend themselves to easy use in most of
the accepted analysis and planning techniques embraced by the techno
cracy of our culture. An additional advantage is that they can be
displayed in a variety of graphic depictions. Statistical data can
even be converted to words and made available in narrative form, such
as this report. Thus, three modes of presentation are possible. Equipped
with these data and with an understanding of which presentation formats
are best equipped for different audiences and for a different decision
making process, the mental health planner has at hand a relatively
efficient short-hand picture of the community, from which to build the
planning process. Statistical data, however, are limited, especially
in the area of social service planning. Survey instruments cannot
handle some types of inquiry which require the investigator to engage
in a deep probing conversation with the informant. The survey format
just doesn't allow the time or the intimacy necessary. On the return
channel, the inability of the mathematical coding required for survey
work limits the ability of the instrument to catch the meaning of the
respondent. Some important subtleties are lost in converting human
feelings to numbers and scales. These limitations are not meant to
suggest that surveying be abandoned but rather that planners be careful
to use survey data in context. As a part, probably the major part, of
the mosaic, the statistical data have a crucial role to play. But the
other input channels must be utilized also. It is recommended that the
data and conclusions in this report be mixed into a total information
gathering process to maximize the accuracy of the final planning
decisions.

154
Methodology
The method employed in drawing planning implications from the
survey is relatively simple and straightforward. The report is read
with an eye kept open for items that are significant in one of five
ways:
- Statistically, in comparison with national norms
- Statistically, in comparison with local norms
- Statistically, in comparison with other items in the survey
- Functionally, in the role the item holds in the surveyprocess
- Important in terms of face content.
For each item that stands out in one or more of these ways, the
analysts must attempt to understand why this should be so. Alterna
tive implications are developed and the most plausible is chosen for
presentation.
A second reading is conducted in which each answer is tested
against the following questions:
- Who is this? (Demographic Information)
- What problem is here? (Needs Statements)
- What desires, preferences, or expectations are shown here?(Goals and Objectives)
- What responses and answers are proposed here? (Program Plans)
From these two readings a list is developed of information items
that would be good to know but which aren't contained in this first gene
ration of the data. These can be run on subsequent analysis. A second
list, hopefully smaller, of questions that should have been asked is
also developed. These can be put into subsequent questionnaires.

155
Finally, all of this is condensed into a series of recommenda
tions or implications for planning.
Implications for Planning
The most important finding in the demographic data (pages 33-37)
is the education level of the population. While this data is
available in the census, the survey provided a replication and updating
of this basic source of demographic data. With almost 40% high school
graduates and 24% having had some college, it is quite apparent that
this community can take advantage of those therapeutic modes which
require a high level of verbal interaction. Traditional counseling
therapies and verbal group processes should both find available popula
tions. The education level also supports the use of printed media for
informing the population about the clinics and the services. In targeting
both publicity and service actions, however, the inter-relation of
ethnicity and education level should be attended to (see Chapter 4 for
the specific breakdown by ethnic group).
The fact that only 3.2% of the population lives alone indicates
that those problems associated with isolation are not as likely to be
major problems in this community. Some of the mental health services
and delivery models developed in inner city areas which tend to have
higher numbers of people living in isolation are not indicated for this
community. Results of the survey indicate that the Samoan population of Cen
tral Oahu tend to 1 ive in multiple-unit dwellings. This has strong
implications for the use of outreach workers. A worker assigned to a
building or group of buildings can, if he/she uses the structure of the
community property, handle three or four times the client load of a

156
worker covering a large area of single family dwellings with no natural
groupings.
A number of items about the accessibility of the military coun
seling services and the high number of persons who are eligible indicate
a definite need for close interaction between the military sources of
mental health services and the Center. Perhaps no other single organiza
tion affects so large a percentage of the total catchment area popula
tion as the military services do.
On the Awareness of Social Services Scale (Scale 1) it was found
that with the exception of the Samoan sample, ethnicity did not affect
awareness drastically. Income and military status was not particularly
interrelated with degrees of awareness taken as a whole. The overall
awareness rate of 40% means that if 10 out of every 100 people could
benefit from counseling services at any given time, the odds are that
6 out of the 10 do not know that the service is available. The Center's
public information and community relations programs can use this figure
as a baseline. It seems reasonable to target a 60% awareness goal for
a one-year publicity effort with a 70% final goal after three years.
Geographic location did not seem to affect overall awareness nor did
there appear to be any urban/rural split on this matter. Thus, any
public information effort can be mounted at the catchment-wide level
without the necessity for individually community-targeted campaigns as
have been necessary in some less homogeneous communities.
Scale 2 looks at the importance of counseling services to the
population. The finding that 95% consider the service to be either
important or very important should give some confidence to the planning
and programming effort. Of more interest is the differentiation

157
between types of services. What emerges from Table 4, which ranks the
30 types of service, is a definite bias in favor of those services
which treat the chronic, the victim and the seriously disturbed. Of
much less interest are those services which the layman puts in the cate
gory of self-improvement. Thus, services for narcotic drug addicts,
for the victims of rape, for the very depressed, elderly, and for
alcohol abusers are all considered very high priorities by the community.
Programs, however, aimed at helping people to stop smoking or to sleep
more easily or to have a better marriage receive the least support.
These unsupported items are in most instances indicated as properly in
the domain of the private practitioner.
In the setting up of services, attention should be given to
these indications of community priorities. It would be wise to establish
first those services which the community supports and feels its tax
dollars ought to be going to. Even though good mental health theory
would stress the establishment of preventative types of services, the
community has a strong preference for "treatment."
Another clear implication of this ranking is the creation of an
active education program. Many of the responses, such as the one on
rape (where victims rated 4th priority but perpetrators are 14th), can
best be dealt with through education of the public to the logic of
prevention as well as the necessity of treatment.
The respondents had preferences not only for the type of
services to be offered but for the method of delivery. Counseling
services should be offered on regular schedules rather than on an
irregular basis; would be preferred in an individual rather than a
group mode, but, surprisingly, would be more to the preference of more

158
individuals if conducted informally rather than formally. (Table 5)
The single most highly ranked mode of counseling service was the
"sympathetic listener" type.
With regard to the location of counseling services, the findings
can best be summed up as "near but not too close." Most people want
the counseling clinics in their own community, but only 7% wanted it
actually near their house. Most people indicated they would feel most
comfortable if the clinic were in their own community. (Scale 3)
This argues for a dispersed, decentralized delivery system. The present
arrangement, or even a more diffused pattern employing the time
sharing of facilities with other agencies (e.g., conducting counseling
in DOE classrooms or offices after school hours or in other government
and semi-public agencies on weekends is indicated here.
In the fact of the demand for evening and weekend hours (Table 7),
it would be hard to justify the continuation of the clinic's present
schedules. Although it will require serious negotiation with the depart
ment and the unions, the finding that over 60% of the residents find
the present hours of operation inconvenient cannot be set aside lightly.
With respect to the types of mental health professionals that
the community would like to see staffing these decentralized, evening
and weekend treatment-focused clinics, the usual finding that the family
doctor would be the ideal deliverer of mental health services is again
supported. No other professional comes close to the doctor's rating
wherein 82% of the respondents would feel comfortable with him/her as
the source of mental health services. Unfortunately, most doctors
practice in a specialty other than psychiatry out of choice, an under
standing of their own temperament,and a life-long investment in

159
specialized training. Although a few doctors do "re-tool" from a
surgical or other specialty to psychiatry, it is unlikely that the
community's preference for the family doctor to become the family mental
health professional is going to be met. Among the cluster of psycho
logists, psychiatrists, professional counselors, social workers and
nurses, the variation of preference is not great. However, strong
disapproval of lay counselors and volunteers is indicated (see Table 11)
For program planning, several strategies are suggested. The
high score given the family doctor can be capitalized on not by con
verting him or her to a mental health worker but by recruiting these
people into the network or front-line diagnosticians and referral makers
Through the medical association, and especially through the family
practice physicians who presently work with the Center, an effort can
be launched to encourage family practitioners to be on the look-out
for possible symptoms of mental health problems among their patients
and their patients' families. Most doctors are relatively trained at
this. What may be most necessary is simply to let the community's
doctors know that the clinics exist, that they are professionally
staffed and will provide excellent service to the doctors' referrals
and will provide the doctor and his/her office staff with the informa
tion needed to make good referrals.
The strong negative rating given to the layworkers/community
volunteers may require some deeper analysis. No major effort to train
and use lay volunteers should be started unless this item is answered
satisfactorily.
Ethnic preferences among the various helping professionals are
shown in Table 10. These can be useful in the establishment of staffing

160
patterns at clinics located in various ethnic enclaves.
Of the possible 24-hour emergency services, a hospital emergency
room was considered the most important. However, only 42% of the people
expressed confidence in emergency rooms, compared to 61-63% confidence
in counselors on house calls or at the clinic. Psychiatrists and psycho
logists on call, however, were relatively lowly rated. Given the expense
of maintaining these professionals on call 24 hours a day, alternative
coverage should be explored by the planners. Not only was the preference
for an emergency room high, but a particular hospital, Queen's, got a
very high rating in comparison to other hospitals that were closer.
Apparently, Queen's has established a very positive reputation. If
services are to be centered in other area hospitals, an intensive
community information and trust-building effort is needed. At the other
end of the spectrum, Kaneohe State received the lowest confidence rating.
Its image as the hospital of last resort for the seriously disturbed, for
court referrals, etc., has given it a definite stigma. Programs and
personnel should eschew identifying themselves with this institution or
else should be aware of the negative connotation and take steps to
counteract it.
Several items give information of direct relevance to service
planning in that they describe characteristics of the population asso
ciated with mental health problems. A detailed reading of these tables
is recommended. Some of the highlights include the finding that money
and job problems rate high as sources of family stress. Services tied
to the client's work place, possibly offered in conjunction with his/her
union, seem to be indicated. The lowest ranking stress sources were
items that recently were very much a part of the literature of mental

161
health, drug abuse and inter-cultural differences. The data do not
support these as high stress sources in this community. The expected
correlation between family stress and family income holds up with the
lower income brackets experiencing proportionatly more stress. There
is also some indication that the urban and suburban communities, which
are not necessarily low income, have higher incidences of family stress
than the rural areas.
The various coping strategies employed by the population are
analyzed in Chapter 15. In rank order, the following are turned to
most often for the solution of personal problems: family members,
friends, relatives, family doctor, minister, professional in a public
clinic, psychiatrist. The order is an exact inverse function of the
degree of training possessed by the potential helper. Those with the
most expertise are turned to last and least, and those with no formal
training at all are the front-line "workers" of mental health. Two pro
grams are strongly suggested here: A public education and training
program to help the average citizen become equipped to handle, at least
by appropriate referral, the problems of his/her family and friends and
efforts to make the professional helpers better known, more accessible
to and more useful to the community. Although this finding of an
inverse proportion of ability to use is not unique to this community, it
is somewhat peculiar to the mental field. For broken bones no one goes
first to his family, then to his friends and only last to an orthopedist
Although the possible responses to this finding can get overwhelming,
and while the information itself has been repeated so much that many are
blase about it, this final ranking is perhaps the most significant of
all the tables in the survey. It has implications for planning that go

162
far beyond the simple location and delivery of services. On these
"how do you cope" items, also the ethnic and military/civilian
cross-tabulations are significant and must be included in the creation
of service patterns in different communities. The Filipino, Chinese
and Cosmopolitan groups all showed a lower propensity to utilize any of
the coping strategies included in the scale. The civilians showed a
slightly higher propensity than the military. What this means is that
since we have already recommended that services be decentralized, it is
important to decentralize the right service to the right community.
The different ways that different communities (ethnic, military, etc.)
think one "ought" to cope with a problem indicate which type of thera
peutic strategy is called for. For example, for a group who thinks that
one should not talk with others about one's problems but bear them in
silence or seek diversion in physical activity, it makes little sense
to try and start T-groups.
Planning
The planning tasks that should be tackled first by the planning
team included the further pursuit of important items in this data. Each
of the items lifted out for its planning implications should be re-run
against each ethnic group and against each geographical area. There
is justification, in fact a commitment in Phase II, for running a
massive cross-tabulation of all items by geographic area as part of the
planning. At this point, it does not seem necessary to do the same by
income or by military/civilian status as these two factors have not
proven to be as efficient in accounting for variations on the majority
of items. However, select items will be re-run in this context to

163
support the planning effort as the need arises.
Planning should proceed to draw up community demographic pro
files, community problem profiles and community service profiles by
combining the data in this report with other input from the advisory
board, from knowledgeable sources in the community and from expert
analysis and opinion.
The survey, which included 247 separate items administered to
over 900 people has been stored in raw form at a zero level of aggre
gation on computer disc. The complexing of separate items into scales
has allowed for an overall analysis from which areas of planning interest
have been identified. The planners can, however, re-run the data in a
variety of formats to generate additional findings and are likely to do
so.
Conclusion
The survey, one of the most thorough ever conducted in the State
for the planning of mental health services, has generated a large amount
of data which is accurate, useful and recorded and stored in an easily
accessible manner. The initial analysis has identified a number of
specific planning implications and pointed the way towards the investi
gation of further findings. The mental health services which are planned
on this foundation of accurate, comprehensive information should be of
maximum benefit to the community and to the State.

164
APPENDIX
(Note: All other references to appendices are compiled as a supplement to this report and is available for review at the Central Oahu Mental Health Center.)

APPENDIX A ENGLISH VERSION OF THE QUESTIONNAIRE

Introduction
"FIRST, I WOULD LIKE TO STATE THAT WE REALLY APPRECIATE YOUR COOPERATION IN
THIS PROJECT. THE INFORMATION WE GATHER THROUGH THIS SURVEY WILL PROVIDE THE
BASIS FOR FUTURE PLANNING FOR HEALTH NEEDS IN OUR COMMUNITY. MOREOVER, THE
RESULTS OF THIS INTERVIEW WILL HELP THE PEOPLE OF OUR COMMUNITY PLAN THE KINDS
OF COUNSELING AND OTHER SERVICES THAT WE WANT PROVIDED. IN ORDER TO DO THIS,
WE NEED TO KNOW THE KINDS OF PROBLEMS AND STRESSES FACED BY PEOPLE IN OUR
COMMUNITY, THE KINDS OF OUTSIDE SUPPORT WHICH THEY RELY ON IN THEIR LIVES, AND
THE DIFFERENT WAYS THEY GO ABOUT DEALING WITH THESE PROBLEMS. WE HAVE A SERIES
OF QUESTIONS ABOUT YOUR OPINIONS AND ABOUT COMMUNITY NEEDS FOR A VARIETY OF
SERVICES. IN AGREEING TO BE INTERVIEWED YOU ARE GIVING THE DEPARTMENT OF HEALTH
PERMISSION TO REPRESENT THE INFORMATION YOU PROVIDE IN THIS INTERVIEW AS
STATISTICAL DATA ONLY. YOUR NAME WILL NOT BE USED IN ANY WAY. ... WE WOULD
GREATLY APPRECIATE IT IF YOU WOULD ANSWER ALL THE QUESTIONS, AS IT IS IMPORTANT
FOR THE STUDY. HOWEVER, IF THERE ARE ANY QUESTIONS THAT YOU REALLY DON'T WANT
TO ANSWER, TELL ME AND WE CAN MOVE TO THE NEXT QUESTION. MAHALO."

Ask the interviewee:
"THERE ARE MANY SOCIAL SERVICES AVAILABLE IN THIS AREA. I WOULD LIKE TO KNOW WHICH ONES YOU ARE FAMILIAR WITH AND HAVE USED, EITHER FOR YOURSELF OR FOR SOMEONE IN YOUR FAMILY."
Hand Card #1 to interviewee (for questions 1 - 39 below)
"YOUR CHOICES FOR THESE QUESTIONS WILL BE..."
1. . . . aware of it and know about it pretty well2. . . . aware of it and know a little about it3. . . . aware of it but don't know anything about it4. . . . never heard of it before
If "aware of it" ask the interviewee:
"HAVE YOU EVER USED IT?"
1. . . . yes2. ... no
If J'yes" ask the interviewee:
"FOR HOW LONG A PERIOD OF TIME DID YOU USE THE SERVICES?" Don't read scale.* 1 2 3 4 5 * 71. . . . one year or longer2. . . . over six months, but less than one year3. . . . over two months but less than six months4. . . . from one week to two months5. . . . one time only--for only a day or a few days
Questions
1, 2, 3, "WELFARE PAYMENTS/FOOD STAMPS/MEDICAID"
4, 5, 6, "COMMUNITY COUNSELING CENTERS"
7, 8, 9, "STATE UNEMPLOYMENT INSURANCE"
10, 11, 12, "ALTERNATIVE EDUCATION SCHOOLS (e.g., STOREFRONT, RAINBOW)"
13, 14, 15, "VOLUNTARY SERVICES SUCH AS ALCOHOLICS ANONYMOUS"
16, 17, 18, "LEGAL SERVICES '(LEGAL AIDE SOCIETY OF HAWAII)"
19, 20, 21, "DEPARTMENT OF VOCATIONAL REHABILITATION (OR OTHER VOCATIONAL REHABILITATION SERVICES)"
22, 23, 24, "VETERANS BENEFITS (G.I. BILL, FEDERAL HOUSING ASSOCIATION, HOME LOANS)"
25, 26, 27, "ADULT DAY-CARE FOR ELDERLY AND HANDICAPPED"

28, 29, 30, "PRE-SCHOOL AND DAY-CARE CENTER SUCH AS SALVATION ARMY"
31, 32, 33, "STATE AND CITY RECREATION FACILITIES AND PARKS"
34, 35, 36, "LICENSED CARE AND BOARDING HOMES (OFFERING CARE FOR FORMERLY HOSPITALIZED ADULTS WHO HAVE EMOTIONAL PROBLEMS)"
37, 38, 39, "PSYCHIATRIC SERVICES AT IN-PATIENT COUNSELING FACILITIES (e.g., QUEEN'S HOSPITAL, KANEOHE STATE HOSPITAL, LEAHI HOSPITAL, OR PRIVATELY OWNED CLINICS)"
Ask the interviewee:
40. "WHAT DO YOU CONSIDER TO BE AN IDEAL LOCATION FOR A COUNSELING CENTER?"
1. . . . close to your house2. ... in your own community3. . . . somewhere within Central Oahu area4. . . . close to a shopping center5. . . . don't see any need for a counseling center at all
Ask the interviewee:
"THERE ARE MANY KINDS OF EDUCATIONAL, COUNSELING AND THERAPEUTIC SERVICESTHAT THE COMMUNITY COUNSELING CENTER CAN PROVIDE. I WOULD LIKE YOUR OPINION AS TO THE IMPORTANCE OF VARIOUS SERVICES WHICH I WILL DESCRIBE. WHICH OF THESE WOULD YOU LIKE TO HAVE AVAILABLE FOR YOU, YOUR FAMILY, FRIENDS AND NEIGHBORS PROVIDED BY THE STATE THROUGH YOUR LOCAL COUNSELING CENTER?"
Hand Card #2 to interviewee (for questions 41 - 70 below)
"YOUR CHOICES ARE..."
1. . . . very necessary2. . . . somewhat necessary3. ... no opinion
. 4. . . . should be provided privately5. . . . should not be provided
41. "PERSONAL PROBLEM COUNSELING (e.g., DEPRESSION, ANXIETY, ETC.)"
42. "ABSENT SPOUSE-SINGLE PARENT COUNSELING (PARENTS WITHOUT PARTNERS PROBLEMS)"
43. "DIVORCE COUNSELING (EMOTIONAL AND SOCIAL PROBLEMS ASSOCIATED WITH THEENDING OF A MARRIAGE)"
44. "ALCOHOL ABUSE COUNSELING (GETTING FREE AND STAYING FREE OF RELIANCE ONALCOHOL; HELPING FAMILY MEMBERS WITH ALCOHOL PROBLEMS)"

(continue: Choices for questions 41 - 70 below)
1. . . . very necessary2. . . . somewhat necessary3. ... no opinion4. . . . should be provided privately5. . . . should not be provided
45. "MENTAL HEALTH EDUCATION IN THE SCHOOL" (HUMAN RELATIONS AND EMOTIONALOR BEHAVIORAL SCIENCE EDUCATION IN THE SCHOOLS)
46. "COUNSELING FOR PARENTS WHO HAVE PHYSICALLY ABUSED THEIR CHILDREN"
47. "COUNSELING FOR PARENTS WHO CRITICIZE THEIR CHILDREN TOO MUCH"
48. "COUNSELING FOR PEOPLE WHO HAVE ATTEMPTED SUICIDE"
49. "COUNSELING FOR PEOPLE WHO HAVE DIFFICULTY SLEEPING"
50. "COUNSELING TO PREVENT A MARRIAGE FROM BREAKING UP"
51. "COUNSELING FOR COUPLES WHO WANT TO HAVE A BETTER MARRIAGE"
52. "COUNSELING FOR PEOPLE WHO ARE AFRAID TO LEAVE THEIR HOMES"
53. "COUNSELING FOR PEOPLE WHO ARE AFRAID TO TALK IN FRONT OF GROUPS"
54. "PROGRAMS FOR VERY DEPRESSED ELDERLY PERSONS"
55. "PROGRAMS FOR ELDERLY WITH LITTLE TO DO DURING THE DAY"
56. "COUNSELING FOR PERSONS WHO HAVE BEEN RAPED"
57. "COUNSELING FOR RAPISTS"
58. "COUNSELING FOR PERSONS WHO ARE UNABLE TO ENJOY SEXUAL RELATIONS"
59. "COUNSELING FOR CHILDREN WHO ARE OVERLY AFRAID TO ATTEND SCHOOL"
60. "COUNSELING FOR CHILDREN WHO ARE SHY AND KEEP TO THEMSELVES"
61. "DAY TREATMENT PROGRAM FOR CHILDREN TOO DISTURBED FOR SPECIAL CLASSESIN PUBLIC SCHOOLS"
62. "DROP-IN PROGRAMS FOR CHILDREN WHO WANT TO TALK WITH SOMEONE ABOUT THEIRPERSONAL PROBLEMS"
63. "TEMPORARY SHELTERS FOR CHILDREN WHO HAVE RUN AWAY FROM HOME"
64. "RESIDENTIAL PROGRAMS FOR CHILDREN FROM VERY DISTURBED FAMILIES"
65. "COUNSELING FOR NARCOTIC DRUG ADDICTS"
66. "COUNSELING FOR PEOPLE WHO WOULD LIKE TO STOP SMOKING"

(continue: Choices for questions 41 - 70 below)
1. . . . very necessary2. . . . somewhat necessary3. ... no opinion4. . . . should be provided privately5. . . . should not be provided
67. "OUTREACH PROGRAMS FOR PEOPLE WHO ARE UNABLE TO COME TO THE CLINIC"
68. "OUTREACH PROGRAMS FOR PEOPLE WHO PREFER NOT TO COME TO THE CLINIC"
69. "A HOUSE TO LIVE IN TEMPORARILY AFTER A NERVOUS BREAKDOWN OR AFTER RELEASEFROM A HOSPITAL BEFORE SETTING OUT ON THEIR OWN" (HALF-WAY HOUSE)
70. "A HOUSE FOR DISABLED PEOPLE TO LIVE IN PERMANENTLY TO MAXIMIZE THEIRINDEPENDENCE"
Ask the interviewee:
"WE HAVE TALKED ABOUT SERVICES THAT COULD BE GIVEN. ALSO IMPORTANT ARE THE WAYS IN WHICH THE SERVICE IS GIVEN. HOW IMPORTANT ARE THE FOLLOWING
' TYPES OF POSSIBLE WAYS OF HELPING PEOPLE THROUGH COMMUNITY COUNSELING PROGRAMS."
"YOUR CHOICES ARE...".
1. . . . important2. . . . slightly important 3.. . . . not important
71. "INDIVIDUAL COUNSELING: ONE-TO-ONE ASSISTANCE FROM A TRAINED COUNSELOR ORTHERAPIST ON A REGULAR BASIS"
72. "GROUP COUNSELING" (ASSISTANCE FROM A TRAINED COUNSELOR OR THERAPIST INA GROUP CONTEXT WHERE MEMBERS SHARE THEIR THOUGHTS AND FEELINGS WITH EACH OTHER, ON A REGULAR BASIS)
73. "INDIVIDUAL COUNSELING ON A SINGLE TIME OR IRREGULAR BASIS" (YOU SHOW UPONLY WHEN YOU WANT TO)
74. "GROUP COUNSELING OR THERAPY ON A ‘NOW AND THEN* * 1 2 . BASIS, NOT REGULAR"
75. "A PLACE TO GO OR CALL WHERE THERE WOULD ALWAYS BE SOMEONE TO TALK WITH ANDLEND A SYMPATHETIC EAR" (RAP CENTER WITH VOLUNTEER STAFF)

Ask the interviewee:
76. "IF YOU WANTED COUNSELING SERVICES, HOW COMFORTABLE WOULD YOU FEEL IN GOING TO A DEPARTMENT OF HEALTH COUNSELING CENTER FOR THEM?"
"YOUR CHOICES ARE..."
1. . . . very comfortable2. . . . comfortable3. . . . neither uncomfortable nor comfortable4. . . . uncomfortable5. . . . very uncomfortable
Ask the interviewee:
77. "IF YOU WANTED COUNSELING SERVICES, WOULD YOU FEEL MORE COMFORTABLE GOINGTO A COUNSELING CENTER IN YOUR OWN COMMUNITY OR ,WOULD YOU FEEL MORE COMFORTABLE GOING TO A CENTER IN ANOTHER COMMUNITY?"
"YOUR CHOICES ARE..."
1. . . . would feel much more comfortable in another community2. . . . would feel somewhat more comfortable in another community3. . . . would feel equally comfortable in my own community or in
another community4. . . . would feel much more comfortable in my own community
Ask the interviewee:
78. "HOW WOULD YOU FEEL ABOUT THE PRESENCE OF A MENTAL HEALTH CENTER IN YOURNEIGHBORHOOD, LET'S SAY WITHIN A FEW BLOCKS OF YOUR HOME?"
"YOUR CHOICES ARE..."
1. . . . would strongly favor it2. . . . would favor it but not strongly3. . . . don't care4. . . . would oppose it but not strongly5. . . . would strongly oppose it
Ask the interviewee:
79. "HOW WOHID YOU FEEL ABOUT A HALF-WAY HOUSE IN YOUR NEIGHBORHOOD , WITHIN A FEW BLOCKS OF YOUR HOME (RESIDENCE FOR PERSONS WITH EMOTIONAL AND OTHER PROBLEMS MAKING ADJUSTMENTS)?"
"YOUR CHOICES ARE..."
1. . . . would strongly favor it2. . . . would favor it but not strongly3. . . . don't care4. . . . would oppose it but not strongly5. . . . would strongly oppose it

Ask the interviewee:
80. "HOW WOULD YOU FEEL ABOUT A LICENSED CARE HOME IN YOUR NEIGHBORHOOD?
"YOUR CHOICES ARE..."
1. . . . would strongly favor it2. . . . would favor it but not strongly3. . . . don't care4. . . . would oppose it but not strongly5. . . . would strongly oppose it
Ask the interviewee:
81. "A STATE COUNSELING CENTER IS WHERE PERSONS CAN GET HELP WITH THEIRPERSONAL AND EMOTIONAL PROBLEMS. THE NEAREST CENTRAL OAHU COUNSELING CENTER TO WHERE YOU LIVE IS LOCATED AT ...(WAIALUA-HALEIWA: ACROSS FROM HALEIWA ELEMENTARY SCHOOL, DOWN FROM HALEIWA BEACH PARK; PEARL CITY: AT HALE MOHALO HOSPITAL, NEAR PEARL CITY SHOPPING CENTER, OFF OF KAM HIGHWAY; AIEA: AIEA SHOPPING CENTER, AT MOANALUA HIGHWAY AND AIEA HEIGHTS DRIVE; WAHIAWA: WAHIAWA CIVIC CENTER, CALIFORNIA AVENUE) ... IF YOU WANTED TO GO THERE, HOW DIFFICULT WOULD IT BE FOR YOU TO GET THERE?"
"YOUR CHOICES ARE..."
1. . . . easy2. . . . slightly difficult3. . . . somewhat difficult4. . . . very difficult5. . . . impossible
Ask the interviewee:
"IF YOU WANTED AN APPOINTMENT AT A COUNSELING CENTER, HOW CONVENIENT WOULD THESE TIMES BE FOR YOU?"
"YOUR CHOICES ARE..."
T. . . . convenient2. . . . slightly inconvenient3. . . . inconvenient
"DURING THE WEEK..."
82. A.M. (MORNING)
83. NOON
84. P.M. (AFTERNOON)
85. EVENINGS (AFTER 5:00 P.M.)

’’DURING THE WEEKEND...”
86. A.M. (MORNING)
87. P.M. (AFTERNOON)
88. "I AM GOING TO MENTION SEVERAL LOCATIONS WHERE YOU MIGHT GET COUNSELINGSERVICES. I WOULD LIKE YOU TO TELL ME HOW CONVENIENT IT WOULD BE FOR YOU TO GET TO THE FOLLOWING LOCATIONS."
"YOUR CHOICES ARE...”
1. . . . very convenient2. . . . convenient3. . . . not so convenient4. . . . very inconvenient5. . . . almost impossible
88. Aiea
89. Mililani
90. Pearl City
91. Waialua
92. Wahiawa
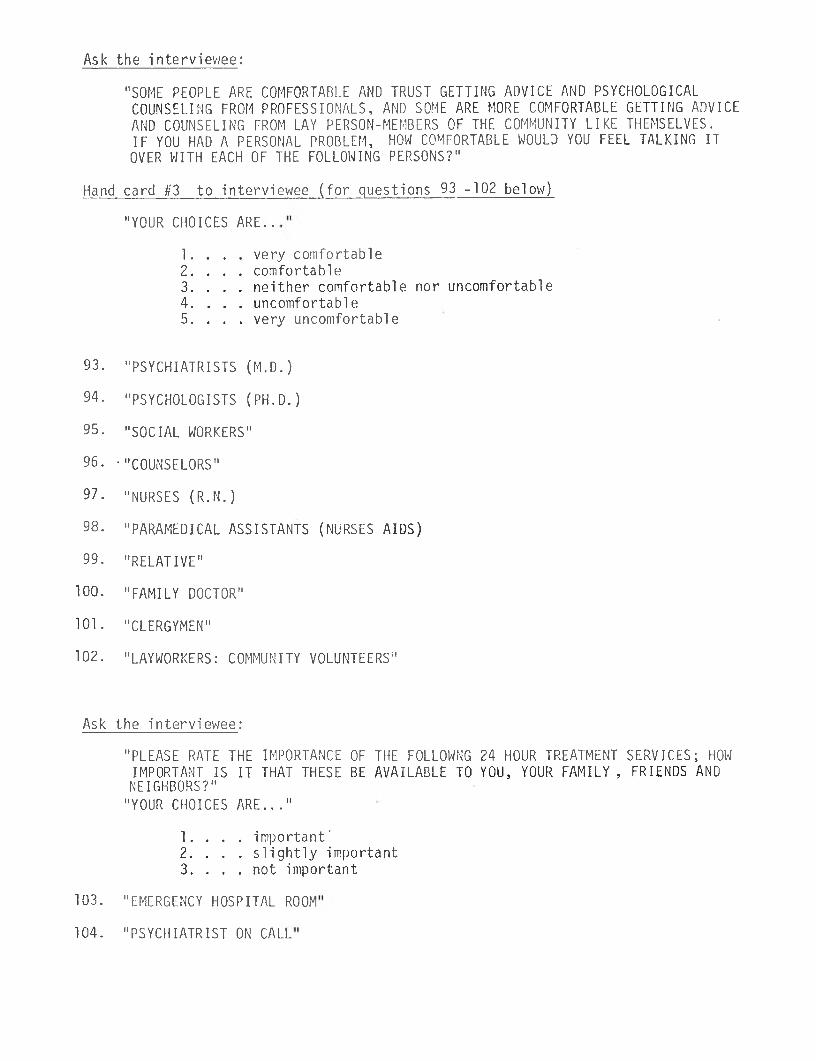
Ask the interviev/ee:
"SOME PEOPLE ARE COMFORTABLE AND TRUST GETTING ADVICE AND PSYCHOLOGICALCOUNSELING FROM PROFESSIONALS, AND SOME ARE MORE COMFORTABLE GETTING ADVICE AND COUNSELING FROM LAY PERSON-MEMBERS OF THE COMMUNITY LIKE THEMSELVES.IF YOU HAD A PERSONAL PROBLEM, HOW COMFORTABLE WOULD YOU FEEL TALKING IT
OVER WITH EACH OF THE FOLLOWING PERSONS?"
Hand card #3 to interviewee (for questions 93 -102 below)
"YOUR CHOICES ARE..
1. . . . very comfortable2. . . . comfortable3. . . . neither comfortable nor uncomfortable4. . . . uncomfortable5. . . . very uncomfortable
93. "PSYCHIATRISTS (M.D.)
94. "PSYCHOLOGISTS (PH.D.)
95. "SOCIAL WORKERS"
96. •"COUNSELORS"
97- "NURSES (R.N.)
98. "PARAMEDICAL ASSISTANTS (NURSES AIDS)
99. "RELATIVE"
100. "FAMILY DOCTOR"
101. "CLERGYMEN"
102. "LAYWORKERS: COMMUNITY VOLUNTEERS"
Ask the interviev/ee:
"PLEASE RATE THE IMPORTANCE OF THE FOLLOWNG 24 HOUR TREATMENT SERVICES; HOW IMPORTANT IS IT THAT THESE BE AVAILABLE TO YOU, YOUR FAMILY , FRIENDS AND NEIGHBORS?"
"YOUR CHOICES ARE..."
1. . . . important’2. . . . slightly important3. . . . not important
103. "EMERGENCY HOSPITAL ROOM
104. "PSYCHIATRIST ON CALL

(continue: Choices for questions 101 - 107 below)
1. . . . important2. . . . slightly important3. . . . not important
105. "PSYCHOLOGIST ON CALL"
106. "TALKING TO SOMEONE ON THE TELEPHONE"
107. "TRAINED COUNSELOR ON CALL"
108. "TRAINED VOLUNTEER ON CALL"
109. "DAY CARE/PARTIAL HOSPITALIZATION PROGRAM FOR CLIENTS WITH A HISTORY OFPSYCHOLOGICAL PROBLEMS"
110. "BOARDING AND CARE HOMES"
111. "TRANSITIONAL LIVING HOME (e.g. , HALF-WAY HOUSES)"
Ask the interviewee:
"IF YOU OR A MEMBER OF YOUR FAMILY OR A FRIEND HAD NEED FOR IN-PATIENT COUNSELING OR PSYCHIATRIC SERVICES AT A HOSPITAL, HOW CONFIDENT WOULD YOU FEEL ABOUT THIS PERSON BEING A PATIENT AT:
"YOUR CHOICES ARE..."
1. . . . would feel confident2. . . . would have mixed feelings3. . . . would not feel confident
112. "LEEWARD HOSPITAL"
113. "TRIPLER ARMY HOSPITAL"
114. "KANEOHE STATE HOSPITAL"
115. "QUEEN'S HOSPITAL IN HONOLULU"
116. "WAHIAWA GENERAL HOSPITAL"

Ask the interviewee:
"IF YOU OR A MEMBER OF YOUR FAMILY OR A FRIEND HAD NEED FOR EMERGENCYCOUNSELING SERVICES (e.g., IF THE PERSON WAS FEELING VERY BAD, ANXIOUS, ETC.), HOW CONFIDENT WOULD YOU FEEL ABOUT THIS PERSON GETTING THE HELP THEY NEEDED IN THE FOLLOWING WAYS:
"YOUR CHOICES ARE..."
1. . . . would feel confident2. . . . would have mixed feelings3. . . . would not feel confident
117. "THROUGH A HOSPITAL EMERGENCY ROOM"
118. "AT THEIR HOME--A COUNSELOR VISITING THE HOME" (COUNSELOR COMING TO YOURHOME RATHER THAN YOU HAVING TO GO TO A HOSPITAL OR CENTER)
119. "VIA THE TELEPHONE"
120. "AT A LOCAL COUNSELING CENTER"
121. "AT A COUNSELING CENTER IN ANOTHER COMMUNITY"
Ask the interviewee:
"IN THE NEXT SECTION OF THIS INTERVIEW I WILL ASK QUESTIONS ABOUT PROBLEMS,STRENGTHS, SUPPORT AND WAYS OF SOLVING PROBLEMS. WE WOULD GREATLY APPRECIATE IT IF YOU WOULD ANSWER ALL THE QUESTIONS, AS IT IS IMPORTANT FOR THE STUDY. HOWEVER, IF THERE ARE ANY QUESTIONS THAT YOU REALLY DON'T WISH TO ANSWER, TELL ME AND WE CAN MOVE ON TO THE NEXT QUESTION. MAHALO"
"FAMILIES HAVE CERTAIN WAYS IN WHICH THEY RELATE TO EACH OTHER. PLEASERATE THE DEGREE TO WHICH YOUR FAMILY RELATES IN EACH OF THE FOLLOWING WAYS,"
Hand card #4 to interviewee (for questions 122 - 137 below)
"YOUR CHOICES ARE..."
1. . . . almost always ( 90-100% of the time)2. . . . most of the time (60-90% of the time)3. . . . about half of the time (40-60% of the time)4. . , . once in a while (10-40% of the time)5. . . . almost never (0-10% of the time)
122. "FAMILY MEMBERS DIRECTLY AND CANDIDLY EXPRESS THEIR FEELINGS AND THOUGHTS TOEACH OTHER."
123. "FAMILY MEMBERS GIVE AND ACCEPT ORDERS AND DIRECTIONS TO AND FROM EACH OTHER."
124. "FAMILY MEMBERS COOPERATE IN DOING PRACTICAL TASKS WITH EACH OTHER."

(continue: Choices for questions 122 -137 below)
1. . . . almost always (90-100% of the time)2. . . . most of the time (60-90% of the time)3. . . . about half (40-60% of the time)4. . . . once in a while (10-40% of the time)5. . . . almost never (0-10% of the time)
125. "FAMILY MEMBERS HAVE FUN TOGETHER."
126. "FAMILY MEMBERS DISCUSS PROBLEMS TOGETHER AND ARRIVE AT JOINT DECISIONS
127. "FAMILY MEMBERS ARE SENSITIVE TO EACH OTHER'S NEEDS AND FEELINGS."
Ask the interviewee:
"IN GENERAL, WHEN THERE ARE DISAGREEMENTS IN YOUR FAMILY, HOW ARE THEY HANDLED OR RESOLVED?"
128. "THE FATHER HAS THE LAST SAY"
129.. "THE MOTHER HAS THE LAST SAY"
130. "EVERYBODY EXPRESSES THEIR OPINIONS FULLY"
131. "WE KEEP OUR FEELINGS TO OURSELVES AND WAIT UNTIL IT BLOWS OVER"
132. "WE ARGUE AND YELL"
133. "WE FIGHT WITH EACH OTHER PHYSICALLY"
134. "WE REASON THINGS OUT CALMLY"
135. "WE TALK TO OUR MINISTER, PRIEST OR RABBI"
136. "WE TALK TO OUR FRIENDS OR RELATIVES"
137. "WE TALK TO PROFESSIONAL COUNSELORS"

Ask the interviewee:
"MOST FAMILIES HAVE STRESS ON THEM--PROBLEMS THAT CAUSE TENSIONS AMONG ITSMEMBERS. TO WHAT DEGREE, IF ANY, OF THE FOLLOWING FACTORS CAUSE STRESS IN YOUR FAMILY?"
Hand Card #5 to interviewee (for questions 138 - B9 below)
YOUR CHOICES ARE..."
1. . . . causes no stress2. . . . causes a little stress3. . . . causes some stress4. . . . causes a lot of stress5. . . . causes extreme stress
138. "MONEY PROBLEMS"
139. "UNEMPLOYMENT PROBLEMS"
140. "CHILDREN BEHAVIOR"
BI "IN-LAW PROBLEMS"
B2 ' "CROWDING (e.g., NOT ENOUGH SPACE: EITHER WITHIN HOME, OR NEIGHBORS ARE TOO CLOSE)"
B3 "SCHOOL PROBLEMS"
B4 "JOB PRESSURES"
B5 "THE WAY WE TALK TO EACH OTHER"
B6 "DRINKING ALCOHOLIC BEVERAGES"
B7 "DRUGS"
B8 "CULTURAL DIFFERENCES IN THE FAMILY"
B9 "DESIRE TO RETURN TO HOME COUNTRY OR STATE"
Ask the interviewee:
"THANK YOU FOR ANSWERING THESE QUESTIONS ABOUT YOUR FAMILY. NOW WE HAVE SOME QUESTIONS ABOUT YOURSELF."
"OUR NEXT SET OF QUESTIONS HAVE TO DO WITH YOUR PHYSICAL HEALTH--DIET, EXERCISE, ILLNESS AND INJURY, HOW YOU FEEL."

Ask the interviewee:
BIO "IN GENERAL, WOULD YOU SAY YOUR APPETITE IS VERY POOR, FAIR, GOOD OR VERY GOOD?"
"YOUR CHOICES ARE..."
Ask the interviewee:
Bll "IN GENERAL, WHAT KIND OF DIET DO YOU HAVE?"
"YOUR CHOICES ARE..."
1. ... a diet with regular meals2. ... a diet with irregular meals3. . . . a junk food diet
Ask the interviewee:
312 "HOW OFTEN DO YOU GET VIGOROUS PHYSICAL EXERCISE (THE KIND OF EXERCISE THAT LEAVES YOU PHYSICALLY TIRED AND RELAXED?"
Don't read scale!
Ask the interviewee
B13 "HOW OFTEN DO YOU HAVE TROUBLE SLEEPING?"
Don't read scale!
1. . . . very good2. . . . good3. . . . fair4. . . . poor5. . . . very poor
1. . . . 4 or more time a week2. . . . 2 or 3 times a week3. . . . about once a week4. . . . once a month or less5. . . . none
1. . . . rarely of never2. . . . once or twice a month3. . . . once or twice a week4. . . . often5. . . . almost always

If answer to question B13 is "rarely or never,11 record "1" for question B14and proceed to question BI5.
Ask the interviewee:
B14 "IF YOU DO HAVE TROUBLE SLEEPING, HOW DO YOU COPE WITH IT?"
Don't read scale!
1. . . . don't have a sleeping problem2. . . . I'm not able to cope with it3. . . . just lie in bed or get up and read} or talk4. . . . take medication/non-prescription drugs5. . . . take medication/prescription drugs
Ask the interviewee:
BI5 "HOW MUCH ALCOHOLIC BEVERAGES DO YOU DRINK?"
Don't read scale!
1. . . . none or hardly any (0-3 drinks per month)2. . . . from 1-5 drinks per week3. . . . from 6-10 drinks per week4. . . . from 11-20 drinks per week (2 or 3 drinks per day)5. . . . more than 3 drinks per day
Ask the interviewee:
B16 "IF YOU SMOKE, HOW MUCH DO YOU SMOKE?"
Don't read scale!
1. . . . never smoked2. . . . smoked but quit3. . . . occasional cigarette4. . . . one pack a day5. ... 2 packs or more
If the answer to B16 is "4" or "5"...ask the interviewee:
BI 7 "IF YOU SMOKE, HOW DO YOU FEEL ABOUT QUITTING?"
Don't read scale.'
1. . . . never smoke2. . . . tried to quit but can't3. . . . never tried and don't care to stop4. . . . would like to stop5. . . . would like to stop but need help

Ask the interviewee:
BIS "IN GENERAL, HOW DO YOU FEEL PHYSICALLY FROM DAY TO DAY?"
Ask the interviewee:
"THE NEXT GROUP OF QUESTIONS IS ABOUT YOUR JOB AND WORK SITUATION."
B19. "IF YOU ARE EMPLOYED, IS THE WORK YOU ARE DOING SATISFYING TO YOU?"
"YOUR CHOICES ARE..."
1. . . . very satisfying2. . . . somewhat satisfying3. . . . not satisfying but not negative either; just a job4. . . . somewhat dissatisfying5. . . . very dissatisfying
If not employed, skip to B25
Ask the interviewee:
B2O. "HOW WELL DO YOU GET ALONG, IN GENERAL, WITH THE PEOPLE YOU WORK WITH
"YOUR CHOICES ARE..."
1. . . . very well (like them a lot)2. . . . wel1 (like them)3. . . . O.K. (feel neutral toward them)4. . . . somewhat poorly (feel bad towards them)5. . . . very poorly (feel very bad towards them)
Ask the interviewee:
B21. "ARE YOU SATISFIED WITH YOUR SALARY LEVEL?"
"YOUR CHOICES ARE..."
1. . . . very satisfied2. . . . somewhat satisfied3. . . . not satisfied or dissatisfied; feel neutral4. . . . somewhat dissatisfied5. . . . very dissatisfied

Ask the interviewee:
B22. "DO YOU WORK MORE HOURS THAN YOU WOULD LIKE TO WORK, OR ABOUT THERIGHT AMOUNT OF HOURS, OR FEWER HOURS THAN YOU WOULD LIKE?"
"YOUR CHOICES ARE..."
1. . . . fewer hours2. . . . about the right number 3 . . . more hours
Ask the interviewee:
B23. "WHAT HOURS DO YOU WORK?"
Don't read scale!
1. . . . day shift only (morning - afternoon) e.g., 7-9 AM to 3-5 PM.2. . . . late shift only (afternoon) e.g., 3 PM to 11 PM3. . . . grave yard shift only (night) e.g., 11 PM to 7 AM4. . . . mixed shift (sometimes day, sometimes late and/or grave-yard
and/or, weekends.5. . . . own hours
Ask the interviewee:
B24. "HOW CLOSE DO YOU LIVE TO YOUR PLACE OF WORK?"
"YOUR CHOICES ARE..."
Ask the interviewee:
"THE NEXT QUESTIONS ARE ABOUT YOUR INVOLVEMENT IN THE COMMUNITY."
B25. "ABOUT HOW MANY HOURS PER WEEK DO YOU SPEND IN VOLUNTARY COMMUNITY ACTIVITIES AND ORGANIZATIONS?"
Don't read scale!
1. . . . more than 20 hours2. ... 10 to 20 hours3. ... 4 to 8 hours4. ... 1 to 3 hoursr n u
1. . . . within easy walking distance2. ... 5 minute drive3. . . . 6-15 minute drive4. . . . 16-30 minute drive5. . . . more than half an hour

Ask the interviewee:
B26. "HOW IMPORTANT TO YOU IS INVOLVEMENT AND WORK IN COMMUNITY ORGANIZATIONS?"
"YOUR CHOICES ARE..."
1. . . . very high importance2. . . . high importance3. . . . medium importance4. ... low importance5. ... no importance
Ask the interviewee:
B27. "DO YOU CONSIDER YOURSELF TO BE....
1. . . . very energetic and active2. . . . generally energetic and active3. ... of medium energy4. . . . inactive and low energy5. . . . very inactive and very low energy
Ask the interviewee:
"THE NEXT QUESTIONS ARE ON RECREATION AND LEISURE."
B28. "HOW MUCH TIME DO YOU SPEND ON RECREATION ACTIVITIES? DO YOU SPEND..."
1. . . . less time than you want2. . . . about the right amount of time3. . . . more time than you want
Ask the interviewee:
B29. "ABOUT HOW MANY HOURS A WEEK DO YOU SPEND JUST RESTING AND RELAXING DOING NOTHING IN PARTICULAR?"
Don't read scale!
1.... 0 to 3 hours2. ... 4 to 8 hours3. ... 9 to 17 hours4. . . . 18 to 30 hours5. . . . over 30 hours

Ask the interviewee:
B30. "HOW SATISFIED ARE YOU WITH YOUR LEISURE TIME? DOES IT MAKE YOU FEEL..."
1. . . . satisfied, relaxed and refreshed2. . . . somewhat satisfied3. . . . dissatisfied
Ask the interviewee:
"THE NEXT QUESTIONS ARE ABOUT YOUR SENSE OF PHYSICAL SECURITY AND PUBLIC SAFETY IN YOUR COMMUNITY."
B31. "HOW DO YOU, LIVING IN THIS COMMUNITY, FEEL ABOUT THE PHYSICAL SECURITY AND SAFETY OF YOURSELF, YOUR FAMILY AND YOUR PROPERTY?
"YOUR CHOICES ARE..."
1. . . . very secure2. . . . secure3. . . . slightly insecure4. . . . insecure5. . . . very insecure
B32. "HOW MUCH DO YOU TRUST PEOPLE IN YOUR NEIGHBORHOOD?"
"YOUR CHOICES ARE..."
1. . . . very much2. . . . mostly3. . . . somewhat4. . . . slightly5. . . . not at all
B33. "IN GENERAL, HOW DO YOU FEEL ABOUT YOUR NEIGHBORHOOD AND COMMUNITY?"
Don't read scale!
1. . . . feel very good2. . . . feel good3. . . . feel mixed or neutral4. . . . feel bad5. . . . feel very bad

Ask the interviewee:
B34. "DO YOU FEEL LIKE YOU ARE A PART OF YOUR NEIGHBORHOOD OR COMMUNITY?"
"YOUR CHOICES ARE..."
Ask the interviewee:
"THIS NEXT SET OF QUESTIONS IS ABOUT THE CONTACT YOU GET IN YOUR LIFE."
B35. "ABOUT HOW MANY HOURS EACH WEEK ON THE AVERAGE DO YOU SPEND JUST TALKING WITH FAMILY MEMBERS OR FRIENDS?"
1. . . . 25 or more hours2. . . . 15 to 24 hours3. ... 8 to 14 hours4. . . . 4 to 7 hours5. ... 0 to 3 hours
B36. "ABOUT HOW MANY HOURS EACH WEEK ON THE AVERAGE DO YOU WATCH TELEVISION?"
1. . . . 30 or more hours2. ... 15 to.29 hours3. . . . 6 to 14 hours4. ... 1 to 5 hours5. ... 0 hours
B37. "ABOUT HOW MANY HOURS EACH WEEK WOULD YOU SAY YOU SPEND READING NEWSPAPERS, MAGAZINES, OR BOOKS?"
1.... 30 or more hours2. ... 15 to 29 hours3. ... 6 to 14 hours4. ... 1 to 5 hours5. ... 0 hours •

Ask the interviewee:
ItB38. IN GENERAL, HOW DOES THE CONTACT YOU HAVE WITH YOUR FAMILY AND FRIENDS LEAVE YOU FEELING?
1. . . . very satisfied2. . . . somewhat satisfied3. . . . neither satisfied nor dissatisfied4. . . . somewhat dissatisfied5. . . . very dissatisfied
Ask the interviewee:
B39. "DO YOU GET AS MUCH CONTACT, CONVERSATION, AND GOOD FEELING FROM YOUR FAMILY AND FRIENDS AS YOU FEEL YOU NEED?"
1. ... I get just the amount I need2. ... I get less than I need3. ... I get much less than I need
Ask-the interviewee:
"THE NEXT GROUP OF QUESTIONS ASKS ABOUT HOW YOU VIEW YOURSELF AND THE CHANGES, IF ANY, YOU WOULD LIKE TO SEE IN YOUR LIFE,"
B40. "IN GENERAL, HOW DO YOU THINK THE PEOPLE WHO KNOW YOU FEEL ABOUT YOU?"
1. . . . they like me very much2. . . . for the most part they like me3. . . . they like me, dislike me and feel neutral about evenly4. . . . for the most part they dislike me5. . . . they dislike me very much
Ask theinterviewee:
B41. "OVERALL, HOW DO YOU FEEL ABOUT YOUR SELF?"
1. . . . truely content, I like myself2. . . . okay3. . . . equally good and bad4. . . . I dis 1 ike myself5. ... I dislike myself very much

Ask the interviewee
B42. "OVERALL, HOW SATISFIED ARE YOU WITH YOUR LIFE?"
1. . . . very satisfied2. . . . satisfied3. . . . about equally satisfied and dissatisfied4. . . . dissatisfied5. . . . very dissatisfied
Ask the interviewee:
"WE ARE INTERESTED IN HOW YOU HANDLE THE STRESSES OF THE VARIOUS FAMILY PERSONAL AND COMMUNITY PROBLEMS WHICH COME UP IN EVERYONE’S LIFE FROM TIME TO TIME. WHAT DO YOU DO TO RELIEVE THE STRESS OF THE UNPLEASANT SITUATIONS AND FEELINGS WHICH ACCOMPANY THE PROBLEMS OF LIFE?"
"I AM GOING TO READ YOU A LIST OF DIFFERENT WAYS IN WHICH PEOPLE HANDLETHE STRESS."
Hand Card #6 to interviewee (for questions B43 - B63 below)
"YOUR CHOICES ARE..."
1. . . . often2. . . . sometimes3. . . . never
B43. "I ATTACK THE PROBLEM THAT CAUSED THE STRESS HEAD-ON, TO SOLVE IT."
B44. "I SEEK ADVICE FROM MEMBERS OF MY IMMEDIATE FAMILY."
B45. "I SEEK ADVICE FROM MY RELATIVES."
B46. "I SEEK ADVICE FROM MY FRIENDS."
B47. "I TALK TO MY MINISTER, PRIEST OR OTHER RELIGIOUS COUNSELOR."
B48. "I SEEK PROFESSIONAL HELP FROM PUBLIC SOURCES."
B49. "I SEEK HELP FROM PSYCHIATRISTS."
B5O. "I SEEK HELP FROM PRIVATE SOURCES (MY FAMILY DOCTOR)."
B51. I EXPRESS MY. FEELINGS BUT TO NO ONE IN PARTICULAR."
B52. "I EXPRESS MY FEELINGS TO OTHER PEOPLE."
B53. "I SEEK THE COMFORT AND SUPPORT OF OTHER PEOPLE."
B54. "I KEEP MY FEELINGS TO MYSELF (I WAIT UNTIL I FEEL BETTER)."

(continue: Choices for questions B43 - B63 below)
Ask the interviev/ee:
"THE LAST GROUP OF QUESTIONS INVOLVE BACKGROUND INFORMATION."
Observe interviewee
B64. Sex. 1) Male 2) Female
B65. "WHICH OF THE FOLLOWING AGE CATEGORIES ARE YOU IN?" 1) 18-26, 2) 27-38, 3) 39-54, 4) 55 & over.
B66. "WHERE WERE YOU BORN?" 1) Oahu; 2) Other Island; 3) Mainland U.S.,4) Samoa; 5) Philippines; 6) Other Country (Specify)______________________
B66.1. (Interviewer: If "other" record answer on open-ended code sheet.)
B68. RELIGIOUS PREFERENCE. 1) Prostestant; 2) Catholic; 3) Buddhist; 5) Other (specify)_______
B68.1. (Interviewer: If "other" record answer on open-ended code sheet.)
B69. "MARITAL STATUS." 1) Single; 2) Married; 3) Divorced; 4) Separated; 5) Widowed; 6) Common Law
1. . . . often2. . . . sometimes3. . . . never
B55. "I EAT."
B56. "I DRINK ALCOHOL."
B57. "I READ OR THINK A LOT"
B58. "I INVOLVE MYSELF IN MY HOBBIES."
B59. "I EXERCISE OR PLAY SPORTS"
B60. "I PRETEND IT DOESN'T EXIST OR DENY THAT IT IS A PROBLEM"
B61. "I TAKE PRESCRIPTION DRUGS"
B62. "I TAKE NON-PRESCRIPTION DRUGS"
B63. "I TAKE A WALK OR A DRIVE"

B71. "HOW LONG HAVE YOU LIVED IN HAWAII?" 1) One year or less; 2) 2-5 years;3) 6-14 years; 4) 15-25 years, 5) 26 years and over.
B72. "HOW LONG HAVE YOU LIVED IN CENTRAL OAHU (FROM AIEA TO PEARL CITY, NOTINCLUDING WAIPAHU, TO WAHIAWA TO WAIMEA)?" 1) One year or less; 2) 2-5 years 3) 6-14 years; 4) 15-25 years; 5) 26 years and over.
B73. "HOW MANY PEOPLE ARE LIVING AT THIS RESIDENCE WITH YOU?" 1) live alone;2) live with one other; 3) live with 2-5 others; 4) live with 6-10 others;5) with 11 and over.
B74. "WHO LIVES WITH YOU?"1. . . . live alone2. . . . live with friends3. . . . live with "aunt," "uncle," and/or other relatives4. . . . live with sisters and/or brothers5. . . . live with spouse only6. . . . live with children only7. . . . live with spouse and children only8. . . . live with spouse, children, grandparents and/or other
relatives, calabash cousins, etc.9. . . . live with grandchildren
10. . . . alternate living quarters
B76. "HOW MANY CHILDREN ARE LIVING AT HOME?" 1) none; 2) one; 3) 2-3; 4) 4-6; 5) 7 and over.
B77. "WHAT IS THE NATURE OF YOUR LIVING QUARTERS?" 1) single family dwelling; 2) duplex or townhouse; 3) apartment or condominium of 3 floors or less; 4) hi-rise (4 floors or more); 5) military barracks
B78.1. (Interviewer: If "other" record answer on open-ended code sheet.)
B80. "WITH WHAT ETHNIC/RACIAL GROUP DO YOU IDENTIFY? 1) Caucasian;2) Japanese; 3) Chinese; 4) Hawaiian; 5) Filipino; 6) Samoan;7) Cosmopolitan (mixed); 8) Black; 9) Other (Specify)_____________________
B80.1. (Interviewer: If "other" record answer on open-ended code sheet.)
B78. WHAT IS YOUR OCCUPATION?"1. . . . professional or managerial2. . . . mid-management3. . . . sales distribution and service, or clerical4. . . . housewife
” 5. . . . skilled6. . . . semi-skilled7. . . . unskilled8. . . . unemployed9. . . . retired
10. . . . other (specify)

B82. "WHAT IS THE HIGHEST LEVEL OF EDUCATION YOU HAVE ACHIEVED?" 1) elementary (grades 1-6); 2) Junior High (grades 7-9); 3) High School (grades 10-12); 4) college (1-3 years); 5) college completed; 6) post-graduate work.
B84. "HAVE YOU ATTENDED ANY OF THESE OTHER TYPES OF SCHOOLS?" 1) Correspondence School; 2) Adult Education; -3) Business and Commercial; 4) Trade and/or Technical School; 5) Apprenticeship Program.
B85. "DO YOU CONSIDER YOURSELF A CIVILIAN OR A MEMBER OF THE MILITARY COMMUNITY?" 1) civilian; 2) military.
If military, go to question #86. If civilian, skip question #86.
B86. "MILITARY STATUS." 1) civilian; 2) active military; 3) military dependent; 4) veteran; 5) military retiree; 6) reserves
B88. "APPROXIMATELY WHICH OF THE FOLLOWING INCOME GROUPS IS YOUR HOUSEHOLD IN?Hand Card #7 to interviewee
1. . . under $3,0002. . . $3,001 - $5,0003. . . $5,001 - $7,5004. . . $7,501 - $10,0005. . . $10,001 - $15,0006. . . $15,001 - $22,0007. . . $22,001 and over.
B90. "ARE YOU ELIGIBLE FOR COUNSELING SERVICES FROM THE MILITARY?"1) Yes; 2) No
If "YES" ask interviewee:
B91. "HOW PROMPTLY CAN YOU EXPECT TO RECEIVE SERVICES, ONCE REQUESTED?"
1. . . one day to one week2. . . two to three weeks3. . . three weeks to a month4. . . one to three months5. . . more than three months
B92. "HOW COMFORTABLE WOULD YOU FEEL RECEIVING COUNSELING SERVICES FROM THE MILITARY DISPENSARY?"
1. . . very comfortable2. . . comfortable3. . . neither comfortable nor uncomfortable4. . . uncomfortable5. . . very uncomfortable

B93 "HOW CONVENIENT IS IT FOR YOU TO GET TO YOUR MILITARY DISPENSARY FOR COUNSELING SERVICES?
1.. .convenient2.. .slightly inconvenient3.. .1.convenient
B94 Residence of Interviewee
1) Aiea2) Pearl City3) Mililani Town4) Wahiawa5) Haleiwa6) Waialua7) Kunia8) Waipio
"THIS ENDS THE INTERVIEW. THANK YOU VERY MUCH FOR YOUR COOPERATION."

LETTER SENT TO CENTRAL OAHU RESIDENTS
GEORGE R. ARIYOSHI GOVERNOR OF HAWAII
STATE OF HAWAIIDEPARTMENT OF HEALTH MENTAL HEALTH DIVISION
GEORGE A. L. YUEN DIRECTOR OF HEALTH
AUDREY W. MERTZ. M.D.. M.P.H. DEPUTY DIRECTOR OF HEALTH
HENRY N. THOMPSON. M.A. DEPUTY DIRECTOR OF HEALTH
CENTRAL OAHU MENTAL HEALTH CENTER BRANCH
HALE MOHALU HOSPITAL PEARL CITY. HAWAII 96 7 82
JAMES J. KUMAGAI. Ph.D., P.E. DEPUTY DIRECTOR OF HEALTH
IN REPLY. PLEASE REFER TO: FILE: MH
December 15, 1976
Dear Central Oahu Resident:
A survey is being conducted for the Department of Health to find out what kinds of personal counseling services the people of Central Oahu need and want the Department of Health to provide for them.
Some time in the next few weeks, you or someone in your household may be contacted by an interviewer from Management Planning and Administration Consultants, the people who are conducting the survey for us. If you are asked to participate, we would appreciate your cooperation in the survey, but you are under no obligation to participate.
All answers will be kept strictly confidential and names of participants will not be used in any way.
If you have any guestions, please feel free to call me at 455-1051 or the office of Management Planning and Administration Consultants (839-9971).
*—Sunao Murata, ACSW Chief, Central Oahu Community Mental Health Center
SM:bn