
Central Marine Fisheries Research Institute, CocAw-682...
15
/. mar. biol. Ass. India, 1990, 32 (1 & 2) : 10-24 BIOLOGY AND POPULATION DYNAMICS OF THE SILVERBELLY SECUTOR mSWIATOR (BLOCtt) FROM KAKINADA V. SRIRAMACHANDRA MURTY* Central Marine Fisheries Research Institute, CocAw-682 031 ABSTRACT The biology and population dynamics of Secutor insidiator from the trawling grounds off Kakinada were studied. The estimated length at iirst maturity is 90 mm and the spawning season is protracted with a peak during January-March period. The von Bertalanffy parameters of growth in length are estimated as £oe-123 mm, /f=1.2 per year and ?o=0.01 year. The estimated lengths on the com- pletion of first and second years are 86 and 112 mm respectively. The length-weight relationship can be described by the equation : log W{^= —5.73713 +3.43654 log L (nun). The instantaneous rate of total mortality during the period is estimated as 6.1 and the values of natural mortality rate, by different methods, are estimated as ranging from 1.8 to 2.6. Length and age at first capture are 80 mm and 0.87 year respectively. Under the present value of tc, yield increases with increased F without reaching a maximum ; highest yield, however, can be obtained at tc ranging from 0.5 to 0.7 with the present Zand different value of Af considered. INTRODUCTION iSiLVERBELUES oT slipmcuths (Family: Leiogtiathidae) are exploited in considerable quantities and form one of the major demersal fishery reasources of India. Though some information on the fisheries and biology of silverbellies from India is available (Arora, 1951; Balan, 1967 ; James, 1973 ; James and Badrudeen, 1975 ; 1982; Venkataraman and Badrudeen, 1974 ; Venkataraman et al, 1982 ; Annam and Dharmaraja, 1982 ; Murty, 1983), there is no information on the biology of Secutor insidiator from the Indian Coast, excepting a brief account on spawning from Tuticorin (Pillai, 1972). Since this is one of the most dominant species in the trawl catches at Kakinada, a detailed study of its biology was taken up in 1979 and the results are pre- sented in this paper. An attempt is also made to estimate the mortality rates and yield of this * Present address: Kakinada Research Centre of CMFRI, Kakinada.533 002, India. species from the trawling grounds off Kakinada. The author is grateful to Dr. E. G. Silas, former Director and Dr. P. S. B. R. James, present Director of CMFRI for encourage- ment and to Mr. 0. Mukundan for suggesting improvements in the manuscript. MATERIAL AND METHODS The study is based on data collected during 1979-83 from the catches of the commercial trawlers operating off Kakinada. Data on catch and effort were collected for 18-20 days in a month. Samplesfor studies on the species composition and biology were collected at weekly intervals. The data on species com- position of siverbellies and length of S. insidiator collected on each observation day were weighted to get the day's and then the monthly estimates. Three types of boats are operated in the area under study (CMFRI, 1981). As the
-
Upload
nguyencong -
Category
Documents
-
view
213 -
download
0
Transcript of Central Marine Fisheries Research Institute, CocAw-682...
/. mar. biol. Ass. India, 1990, 32 (1 & 2) : 10-24
BIOLOGY AND POPULATION DYNAMICS OF THE SILVERBELLY SECUTOR mSWIATOR (BLOCtt) FROM KAKINADA
V. SRIRAMACHANDRA MURTY*
Central Marine Fisheries Research Institute, CocAw-682 031
ABSTRACT
The biology and population dynamics of Secutor insidiator from the trawling grounds off Kakinada were studied. The estimated length at iirst maturity is 90 mm and the spawning season is protracted with a peak during January-March period. The von Bertalanffy parameters of growth in length are estimated as £oe-123 mm, /f=1.2 per year and ?o=0.01 year. The estimated lengths on the completion of first and second years are 86 and 112 mm respectively. The length-weight relationship can be described by the equation : log W{^= —5.73713 +3.43654 log L (nun). The instantaneous rate of total mortality during the period is estimated as 6.1 and the values of natural mortality rate, by different methods, are estimated as ranging from 1.8 to 2.6. Length and age at first capture are 80 mm and 0.87 year respectively. Under the present value of tc, yield increases with increased F without reaching a maximum ; highest yield, however, can be obtained at tc ranging from 0.5 to 0.7 with the present Zand different value of Af considered.
INTRODUCTION
iSiLVERBELUES oT slipmcuths (Family: Leiogtiathidae) are exploited in considerable quantities and form one of the major demersal fishery reasources of India. Though some information on the fisheries and biology of silverbellies from India is available (Arora, 1951; Balan, 1967 ; James, 1973 ; James and Badrudeen, 1975 ; 1982; Venkataraman and Badrudeen, 1974 ; Venkataraman et al, 1982 ; Annam and Dharmaraja, 1982 ; Murty, 1983), there is no information on the biology of Secutor insidiator from the Indian Coast, excepting a brief account on spawning from Tuticorin (Pillai, 1972). Since this is one of the most dominant species in the trawl catches at Kakinada, a detailed study of its biology was taken up in 1979 and the results are presented in this paper. An attempt is also made to estimate the mortality rates and yield of this
* Present address: Kakinada Research Centre of CMFRI, Kakinada.533 002, India.
species from the trawling grounds off Kakinada.
The author is grateful to Dr. E. G. Silas, former Director and Dr. P. S. B. R. James, present Director of CMFRI for encouragement and to Mr. 0. Mukundan for suggesting improvements in the manuscript.
MATERIAL AND METHODS
The study is based on data collected during 1979-83 from the catches of the commercial trawlers operating off Kakinada. Data on catch and effort were collected for 18-20 days in a month. Samplesfor studies on the species composition and biology were collected at weekly intervals. The data on species composition of siverbellies and length of S. insidiator collected on each observation day were weighted to get the day's and then the monthly estimates.
Three types of boats are operated in the area under study (CMFRI, 1981). As the

BIOLOGY AND POPULATION DYNAMICS OF SILVERBELLY II
Pomfret-Royya category of boats is most dominant in the fleet (CMFRI, 1981), this was considered as the standard unit and effort Sitandardisation was made following GuUand (1969), by considering all the demersal group landed as one group since the trawl fishery is a multispeciesone.
For biological studies the specimens in fresh condition were examined. Maturation stages were fixed following Murty (1983). Only females were considered for estimating length at first maturity and spawning. Fishes in stages IV-VI of maturation were taken as mature for estimating length at first maturity and fishes of and above length at first maturity only were considered to determine spawning season.
To examine whether the monthly sex ratio is 1 :1 or not, the chi-square test was applied. A test of variance for homogeneity (Snedecor and Qjchran, 1967) was used to find whether the sex ratio over a period of one year is uniform.
The length data were grouped into 5 mm class intervals and the mid points in these jproups were considered to study growth. Parameters of growth in length were estimated 1^ the ' integrated method ' of Pauly (1980 a) and using the well-known von Bertalanflfy equation for growth :
Lf=LQc(l—e-Jf(f—?„)
Estimates of Loc and K were obtained using t |e Ford-Walford plot (Ford. 1933 ; Walford, 1946) as adapted by ^fenze^ and Taylor (1947).
Since Beverton-Holt yield equation assumes growth in weight with length to be isometric, computation of yield following this method results in erroneous estinaates of absolute yield in species in which growth in weight with length does not follow cube law. Hence, Rttulik and Gales (1964, as cited by Clark 1978) have recommended that ' a von
Bertalanfiy curve be fitted to the cube root of weight at each agie and this fictitious length schedule used in computations [of yield] by the method of Beverton and Holt'. Hence, in the present study, the parameters of growth in weight were also estimated: the values of lengths at half yearly intervals, obtained by the integrated method were converted into weights at ages with the help of the length-weight relationship and the cube roots of these values were taken for fitting the von Bertalanfiy equation.
Weight of each fish was taken to an accuracy of 0.5 g. The length-weight relationship was calculated with the help of the formula : log W=\o% a+b Log L, where W'=weight of fish in grams, Z,=total length in mm, H=a constant and 6=exponent (Le Cren, 1951).
Instantaneous rate of total mortality (Z) was estimated by length-converted catch curve method of Pauly (1982), cumulative catch curve method of Jones (1981) and Jones and van Zalinge (1981), Ssentongo and Larkin (1973) method and Beverton and Holt (1956) method.
The estimation of natural mortality rate (M) was attempted by the relation :Z=Af+9/where g is the catchability coefficient and /=fishing effort, but the plot of Z against effort showed that the points are not well-represented by a straight lino. The value of M, therefore, was estimated assuming that 99% of the fish by numbers would die, if there was no exploitation, by the time they attained tmax and by taking toax as corresponding to Zmax in the catch (Sekharan, 1976), or to LQC-0.5 cm (Alagaraja, 1984) or to 95% of Loc (Pauly, 1983). It was also estimated with the help of the empirical relationship (Puly, 1980 b) :
log M=—0.0066-0.279 log Loc+0.6543 log Jf+0.4634 log T where Loc is in cm, K per year and T is mean water temperature in "C. For the purpose of this equation the value of T
12 V. SRIRAMACHANDRA MLrRlT
was taken as 27.2°Cfrom Ganapati and Murthy (1954) and La Fond (1958). Length at first capture {L^ was estimated following Navaluna (1982).
Expbitation rate (U) was estimated by the equation of Sekharan (1976) and the total annual stock {YlU) and average standing crop (y/F) were estimated by taking the average annual catch of the species (F) during 1979-'83. The value of 7/F thus obtained was taken as the average biomass 1(B) during the exploited phase of the species in the trawling grounds.
The yield in weight per recruit (g) was estimated from the equation of Beverton and Hoh (1957). Since growth in weight with length in S. insidiator is not isometric, yield per recruit was also estimated following the method recommended by Paulik and Gales (1964j.
The biomass per recruit {BIR) was estimated from the formula; BlR={^YWlR)lF and recruitment in numbers (R) was estimated by the relation R=BI iB[R). Since the estimation of biomass was made under the present level of fishing mortality rate (considering different values of M) and age at first capture, recruitment was also estimated taking these values into account. The values of recruitment thus obtained were assumed to be constant.
The expected yield at different levels of fishing mortality was estimated by the relation : yield in weight—Recruitment (,Nos) X yield in weight per recruit (g).
MATURATION, SPAWNING AND SEX RATIO
Length at first maturity ; The data of the three-year period (l980-'82) were pooled for the purpose. Fishes of 72 mia and above showed mature gonads and the percentage of mature fish in each length group showed increase with increased length. It was observed that at 92 mm length, about 50% of the fish were mature. Hence the lower limit of this
length group at 90 mm was taken as the length at first maturity at Kakinada.
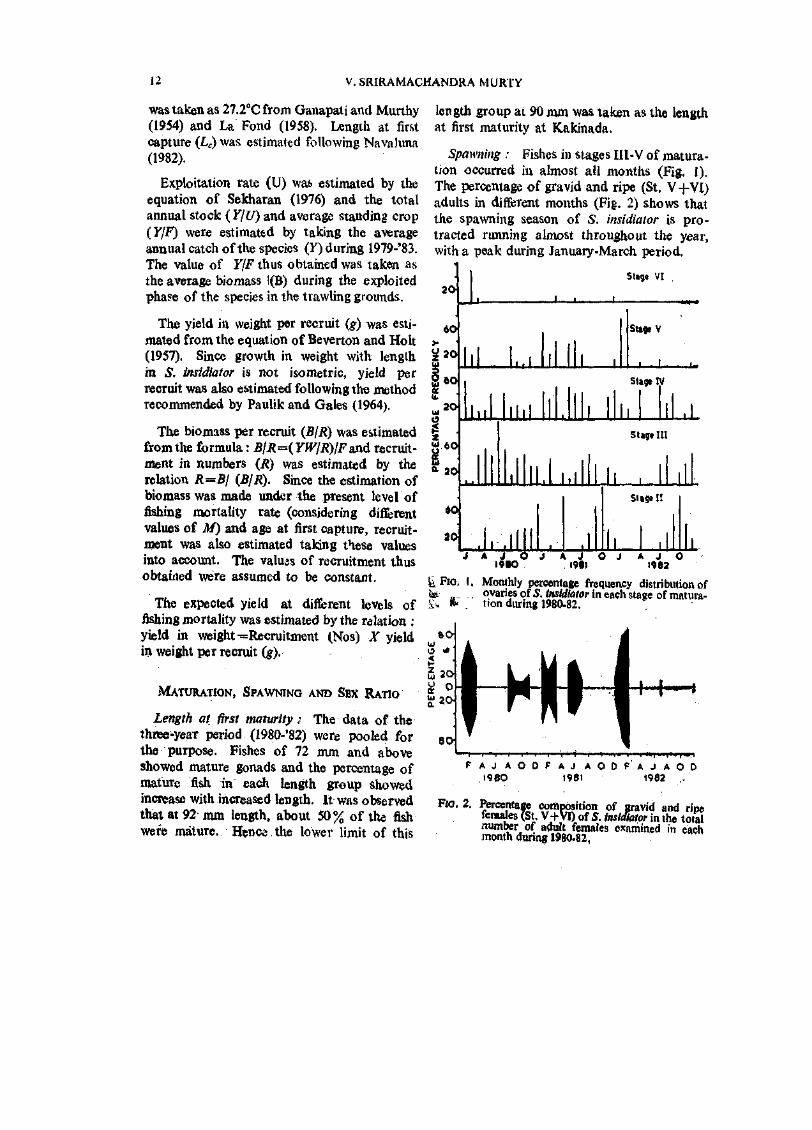
Spawning : Fishes in stages HI-V of maturation occurred in almost all months (Fig. 1). The percentage of gravid and ripe (St. V+VI) adults in different months (Fig. 2) shows that the spawning season of S. insidiator is protracted running almost throughout the year, with a peak during January-March period.
20
60
^ 3 0 {
60
20 ui
t !̂ 60j
ao
60
stage VI
Sug* V
JiJ ih
Slag* IV
Stag* in
l l . l i . i l l l l i Stage n
l l l l l I llllll J A J O J A J O J A J O
I9B0 I9BI 1982
g,Fio. I, Monthly percentage frequeacy distribution of fe 1, o.variesof5./iwWtotor in each stage of matura-Sv, 16' . tion during 1980-82.
80i hi O *
5 20i ^ 0 ^2W
80
I -I"" I
F A J A O D F A J A O D F A J A O D I960 1981 1982
FJO, 2. Percentage coiijpbsition of gravid and rine fem^es (St. V+VI) of S. insidiator in the total number of adult females examined in each month durmg 1980-82,

BIOLOGY AND POPULATION DYNAMICS OF SILVERBELLY 13
Sex ratio: 1374 specimens (606 iixales, 768 females) ranging from 72 to 112 mm were examined. Females outnumbered males in majority of the months (Table 1) while the reverse was true in January, June and October 1980; April, September and October 1981 and January, September and November 1982. In the annual total, females outnumbered males in all years.
that the X^ values are significant at 5% in 1980 and 1981, but in 1982 it is not significant. It may be noted that data were available only for 9 months in 1982. It was felt that the nonuniform nature of sex ratio in 1980 and 1981 could be due to greater predominance of females in one or two months as mentioned above. When the test of variance for homogeneity was applied after eliminating the data
TABLE 1. Monthly sex ratio in S. insidiator
January February March April May June July August September October November December
Pooled
cJ
28 7*
24 7
27 10 8
13 32 34 46
7
243
1980
$
24 28* 24 13 44
5 17 13 41 20 46 16
291
a 24 43 10 23
5* 12 18 9
10 7
44 17*
222
0 /
1981
?
30 55 12 20 24* 17 21 11 7 6
44 45*
292
c?
12 7
— 16 — — 28* 13 7 7
20 31
141
1982
?
10 14 — 16 — — 49* 20 6
10 17 43
185
At 5% probability level, the ratios are not significantly different from 1 :1 in all months except February 1980, May and Decemberl981 and July 1982 (Table 1). The test of variance for homogeneity of sex ratio (Table 2) reveals
TABLE 2 .
Year
Test of variance for homogeneity of sex ratio in S. insidiator
1980 1981 1982 1980-1982 Pooled .
* Significant at 5%.
Df
11 11 8
32
ar«
27.83* 20.13* 6.23 55.13*
of those months (February 1980, May and December 1981) where the sex ratio was significantly different from 1:1, the chi-square value did not show significant diflference.
The data on sex ratio in difierent length groups (Table 3) showed predominance of males upto 87 mm group and of females from and above 92 mm. The mean lengths of fishes in the sexes over the period did not show marked differences.
ESTIMATION OF GROWTH PARAMETERS
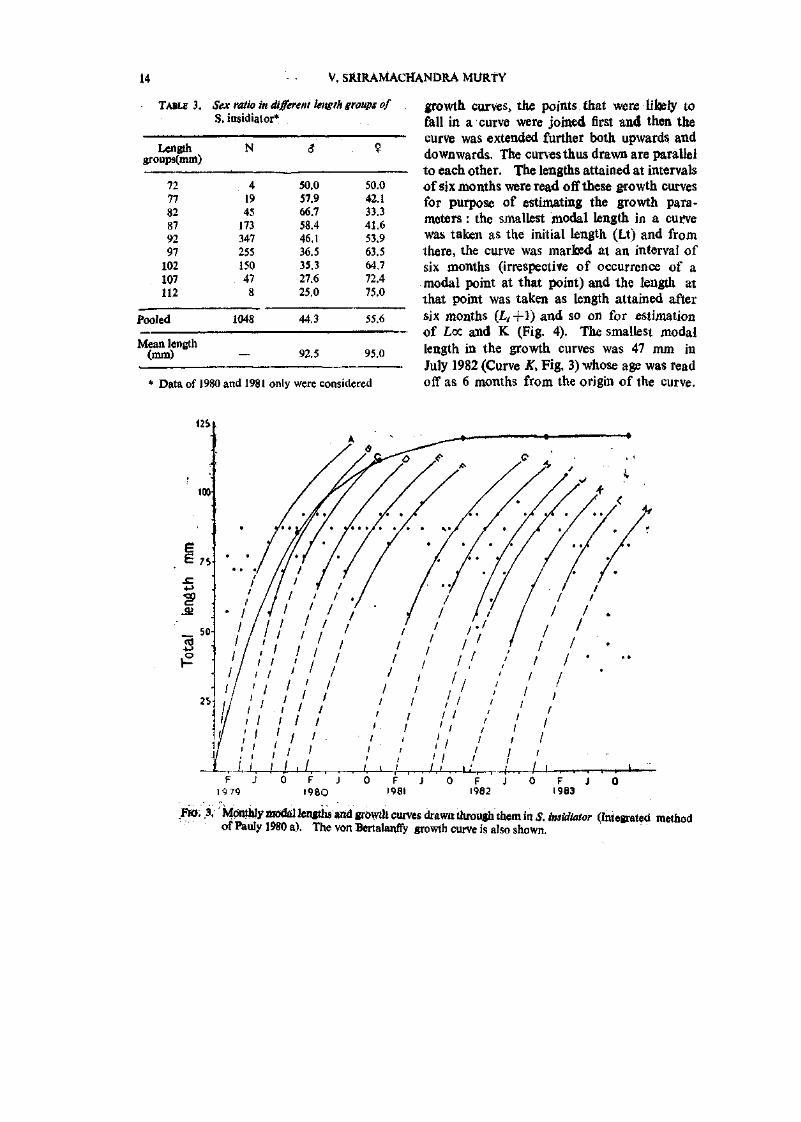
The monthly modal lengths durmg 1979-83 are plotted in Fig. 3. While drawing the
14 V. SRIRAMACHANDRA MURtY
TABLE 3. Sex rath in different length groups of S. insidiator*
Length groups(mm)
Pooled
Mean length (mm)
N
72 77 82 87 92 97 102 107 112
4 19 45 173 347 255 150 47 8
50,0 57.9 66.7 58.4 46.1 36.5 35.3 27.6 25.0
50.0 42.1 33.3 41.6 53.9 63.5 64.7 72.4 75.0
1048 44.3
92.5
55.6
95.0
* Data of 1980 and 1981 only were considered
growth curves, the points that were likely to fall in a curve were joined first and then the curve was extended f\irther both upwards and downwards. The curves thus drawn are parallel to each other. The lengths attained at intervals of six months were read off these growth curves for purpose of estimating the growth parameters : the smallest modal length in a cuifve was taken as the initial length (Lt) and from there, the curve was mar bed at an interval of six months (irrespective of occurrence of a modal point at that point) and the length at that point was taken as length attained after six months {L,-\-\) and so on for estimation of Loc and K (Fig. 4). The smallest modal length in the growth curves was 47 mm in July 1982 (Curve K, Fig, 3) whose age was read off as 6 months from the origin of the curve.
mv
Fia. .3. MOtttUy modal lengths and growth curves diawn through them in S. insidiator (Integrated method of Pauly 1980 a). The von Bertalanffy growth curve is also shown.
BIOLOGY AND POPULATION DYNAMICS OF SILVERBELLY 15
i3or
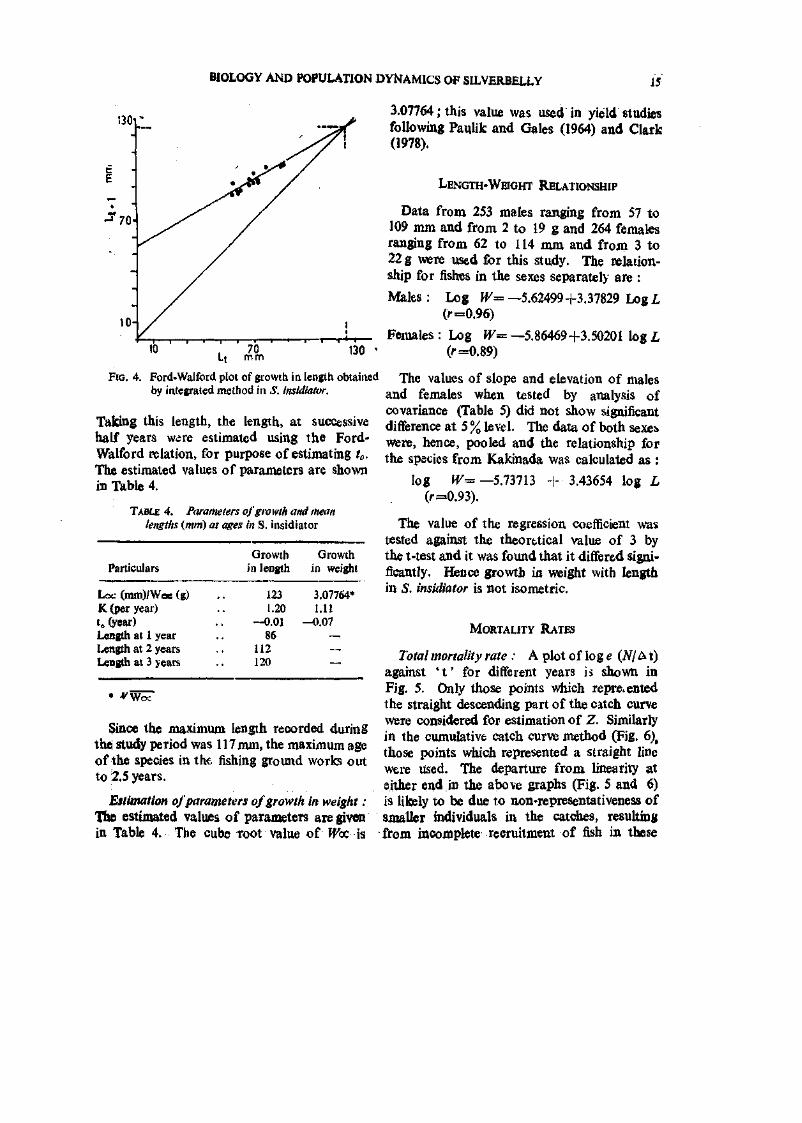
Fro. 4. Ford-Walford plot of growth In length obtained by integrated method in S. insidiator.
Taking this length, the length, at successive half years were estimated using the Ford-Walford relation, for purpose of estimating /<,. The estimated values of parameters are shown in Table 4.
TABLE 4. Parameters of growth and mean lengths {mm) at ages in S. insidiator
3.07764; this value was used in yield studies following Paulik and Gales (1964) and Clark (1978).
LENGTH-WHGHT RELATIONSHIP
Data from 253 males ranging from 57 to 109 mm and from 2 to 19 g and 264 females ranging from 62 to 114 mm and from 3 to 22 g were used for this study. The relationship for fishes in the sexes separately are :
Males: Log PF=—5.62499+3.37829 LogL tr=0.96)
Females : Log W= —5.86469+3.50201 log L (r=0.89)
The values of slope and elevation of males and females when tested by analysis of covariance (Table 5) did not show significant difference at 5 % level. The data of both sexes were, hence, pooled and the relationship for the species from Kakinada was calculated as :
Particulars Growth
in length Growth
in weight
Loc (mm)/Wae (g) K (per year) t„ fyear) Length at 1 year Length at 2 years Length at 3 years
123 1.20
—0.01 86
112 120
3.07764* 1.11
—0.07 —. — —
Since the maximum length recorded during the study period was 117 mm, the maximum age of the species in the fishing ground works out to ;2.5 years.
Estimation of parameters of growth in weight : The estimated values of parameters are given in Table 4. The cube root value of Wcc is
log iV== —5.73713 (r=0.93).
1- 3.43654 log L
The value of the regression coefficient was tested against the theorttical value of 3 by the t-test and it was found that it differed significantly. Hence growth in weight with length in S. insidiator is not isometric.
MORTALITY RATES
Total mortality rate : A plot o f lo g e (iV/ A t) against ' t ' for different years ij shown in Fig. 5. Only those points which represented the straight descending part of the catch curve were considered for estimation of Z. Similarly in the cumulative catch curve method (Fig. 6), those points which represented a straight Une were used. The departure from linearity at either end in the above graphs (Fig. 5 and 6) is likely to be due to non-representativeness of smaUei individuals in the catches, resulting from incomplete recruitment of fish in these

16 V. SRIRAMACHANDRA MURTY
TABLE 5. Analysis of Covariance to test the significance of difference between regression lines of sexes in the length-weight relationship ofS. insidiator
Source of variation Df Deviation from regression
Sum of squares Mean squares
Due to regression within sexes 513 Due to difference between regression coeflScients 1 Residual due to regression pooled within 514 Difference between adjustmented means .. 1
Total: . . 515
2.024169 0.003972 2.028141 0.000801 2.028942
0.003946 0.003972 0.003946 0.000801
Comparison of slopes : ?•= 1.0066, df 1,513 : not significant. Comparison of elevations: F=0,2029, df 1,514 ; not significant.
r '• r • I — I — ' ~ - i — I — I — r -VOO 1-75
Age Y e a r s
Fia. 5. Estimation of Z by length-converted catch curve method of Pauly (1982) in S. insidiator.
BIOLOGY AND POPULATIOM DYNAMICS OF SILVERBELLY 17
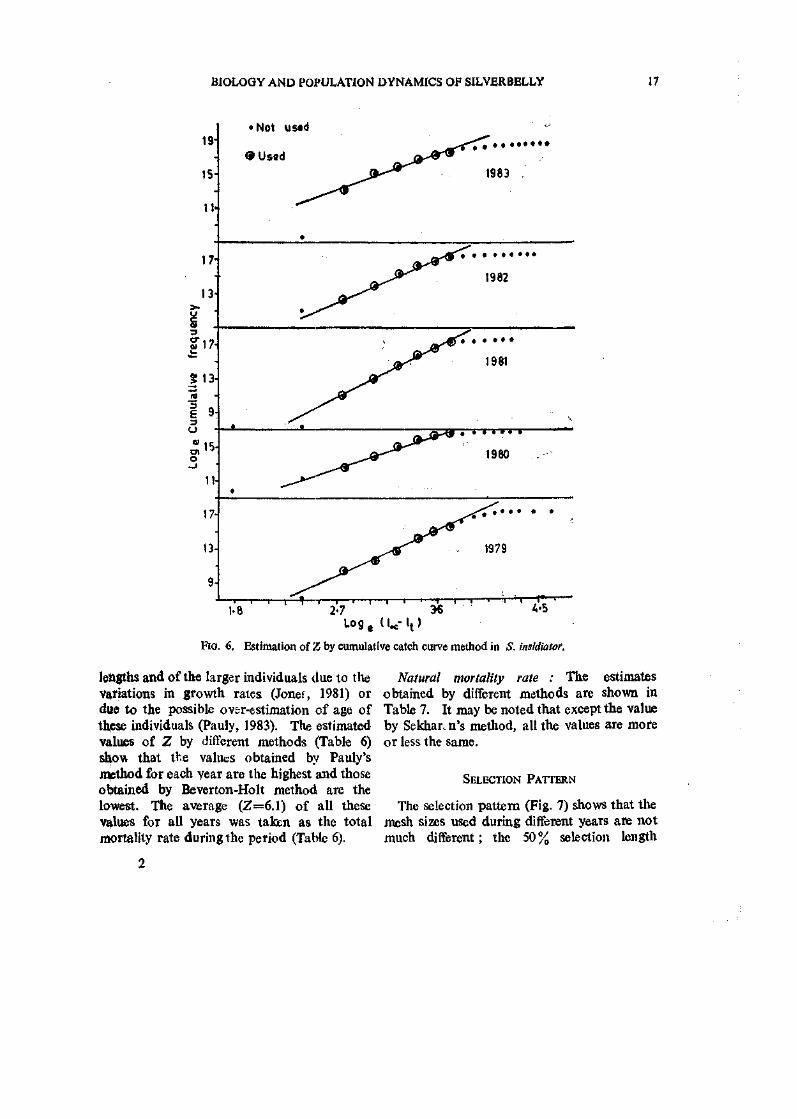
Fio. 6. Estimation of Z by cumulative catch curve method in S. insldiatof.
lengths and of the larger individuals due to the variations in growth rates (Jonet, 1981) or due to the possible ov&r-estimation of age of thiese individuals (Pauly, 1983). The estimated values of Z by different methods (Table 6) show that the values obtained by Pauly's method for each year are the highest and those obtained by Beverton-Holt method are the lowest. The average (Z=6.1) of all these values for all years was taken as the total mortality rate during the period (Table 6).
Natural mortality rate : The estimates obtained by different methods are shown in Table 7. It may be noted that except the value by Sekhar. n's method, all the values are more or less the same.
SELECTION PATTERN
The selection pattern (Fig. 7) shows that the mesh sizes used during different years are not much different; the 50% selection length

18 V. SRIRAMACHANDRA MURTY
TABU 6. Estimated values ofZ in S. insidiator by different methods in different years
Year Pauly's method
Cumulative catch curve
method
Ssentongo-Larkin method
Beverton-Holt
method
Average
1979 1980 1981 1982 1983
8.0329 6.1908 9.1357 7.1845 6,2143
7.0856 5.1765 8.0029 6.4493 5.8505
6.6093 4.5160 5.7397 5.4458 5.5254
6.0274 3.9425 5.1606 4.8678 4.9471
6.9388 4.9565 7.0097 5.9869 5.6343
Average
TABLE 7.
7.3516 6.5130 5.5672
Estimation of M Following different methods and estimation of F, and R in S. insidiator (Z=6 , l and annual average catch : 3311)
4.9891
U, YlU, YlF,
6.1052
YwlR, Bl R
Method of estimation of M
Sekharan, 1976 Alagaraja, 1984 Pauly, 1983 Pauly, 1980 b
M
1.8 2.3 2.4 2,6
F
4.3 3.8 3.7 3.5
U
0.70 0.62 0.61 0.57
Y/U (t)
473 534 543 581
Y/F (t)
77 87 89 95
YW/R (g)
0.19671 0.124975 0.113915 0.094432
B/R (g)
0.045746 0.032889 0.030788 0.026981
Recruitment (Nos)
1682704499 2648453890 2905673370 3505161135
groups
Fio. 7. Selection pattern in 5. insidiator.
fanges from 77 to 87 nun in different years and theif average works out to 84 mm. Henoe the lower limit of this length class (80-84 mm) was taloen as length at first capture {Lc) whose estimated age (fc) is 0.86 year.
CATCHES OF SILVERBELLIES
The estimated catches of silverbelUes and S. insidiator during the period 1979-83 (Table 8) show continuous increase in successive years and an annual average of 904 tonnes of silverbellies was landed at Kakinada, with 331 tonnes of S. insidiator, contributing to about 37% of silverbelly landings.
EXPLOITATION RATE AND STOCK SIZE
Taking the Z value as 6.1 and different values of M, the exploitation rate {U) was estimated as ranging from 0.57 to 0.70 (Table 7). The corresponding values of total annual stock (F/C/) and average standing crop {YjF) are also shown in Table ,7.
BIOLOGY AND POPULATION DYNAMICS OF SILVERBELLY 19
TABLE: 8 Estimated effort {Trawling hours) and catch {tonnes) of Silverbellies in different years
Year
1979 1980 1981 1982
r 1983
Average
Effort
396864 322655 384436 459599 328461
378403
Total Silverbelly
catch
535 569 605 969
1843
904
YoOiS.insidiator in silverbelly catch
34.3 29.5 41.7 33.4 39.3
36.6
ESTIMATION OF YIELD PER RECRUIT
Beverton and Holt method: The value of ffoc corresponding to Loz was calculated as 28 gon the basis of the length-weight relationship ; the value of tr was estimated as 0.2 taking 27 mm (the smallest length in the catch) asthe length at recruitment. As stated earlier,
80 mm was taken as length at first capture, whose estimated age {t^ is 0.87 year.
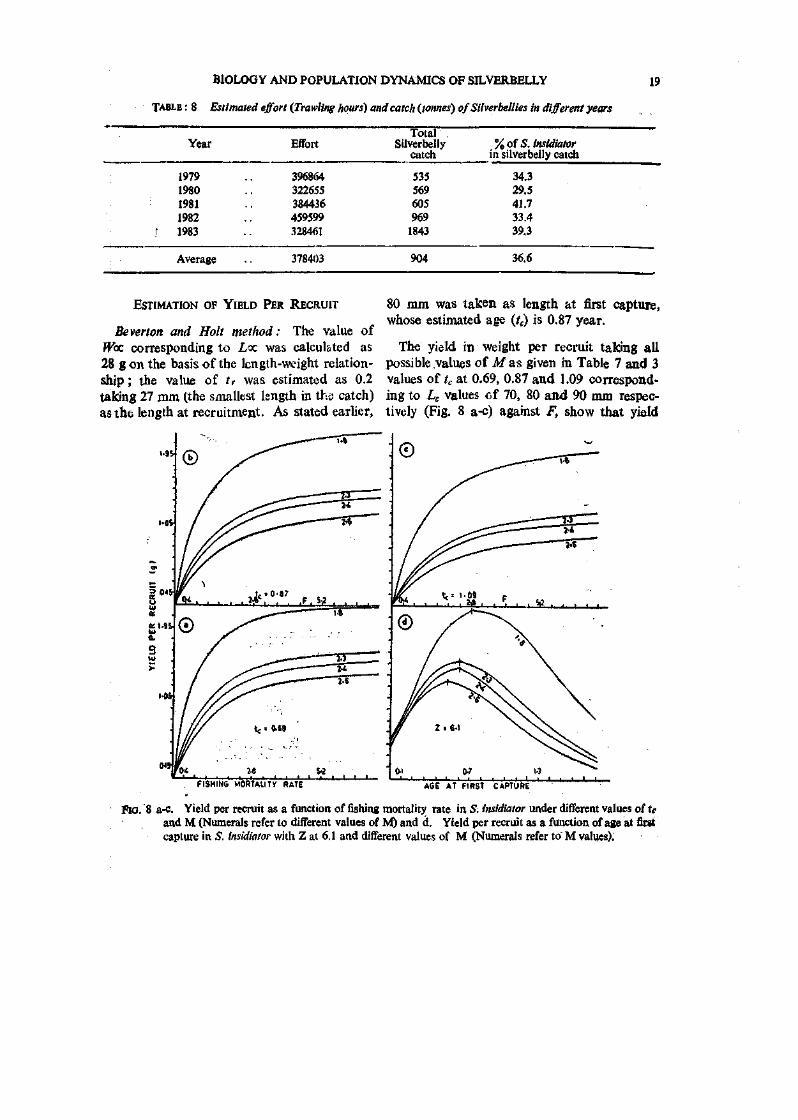
The yield in weight per recruit taking all possible values of M as given in Table 7 and 3 values of to at 0.69, 0.87 and 1.09 corresponding to Le values cf 70, 80 and 90 mm respectively (Fig. 8 a-c) against F, show that yield
FISHINS MORIAIITV RATE AGE AT FIRST CAPTURE
Fio. 8 a-c. Yield per recruit as a function of fishing mortality rate in S. insidiator under different values of te and M (Numerals refer to different values of NO and d. Yield per recruit as a funrtion of age at first capture in 5. insidiator with Z at 6.1 and different values of M (Numerals refer to' M values).

•10 V. SRlRAMACHANDRA M U R T Y
per recruit increases with increased F without reaching a maximum; the curves also show that yield per recruit increases by decreasing the age at first capture.
The yield per recruit as a function of age at first capture (Fig. 8 d) with the present value of Z at 6.1 and different values of M shows that raaximumyield per recruit can be obtained at f,=0.5 if M is 2.6 ; at 0.6 if M is 2.3 or 2.4 and at 0.7 if Mis 1.8. The observations, thus, suggest that the cod end mesh size has to be reduced because the present estimated value of ?,=0.87.
Paulik and Gales method: The curves of yield per recruit against F (Fig. 9) taking the present value of tc at 0.76, corresponding to
ESTIMATION OF RECRUITMENT AND YIELD
Recruitment and yield were estimated taking YWIR values obtained by Paulifc and Gales (1964) method.
At the present values of tc and Z and taking different values of M the estimates of yield per recruit, bio mass per recruit and recruit, ment were obtained (Table 7). The expected yield (Fig. 10) at different levels of fishing mortality with the present cod end mesh size
FISHING MORTALITY RATE
••—•••==^:s:;^ Fio. 10.
• ^4 u FISHIN6 MORTALITY RATE
FIG. 9. Yield per recruit and Biomass per recruit as functions of fishing movt&lhy in S.insidkttor following Paulik and Gales method. (Numerals refer to M, values.)
the cube root of weight of fishes of the present Lc value of 80 mm, show trends comparable to those obtained by assuming isometric growth (Fig. 8 b) though the absolute values of yield per recruit are different.
Estimated yield of S. imidiator as a function of fishing mortality rate (Numerals refer to M values).
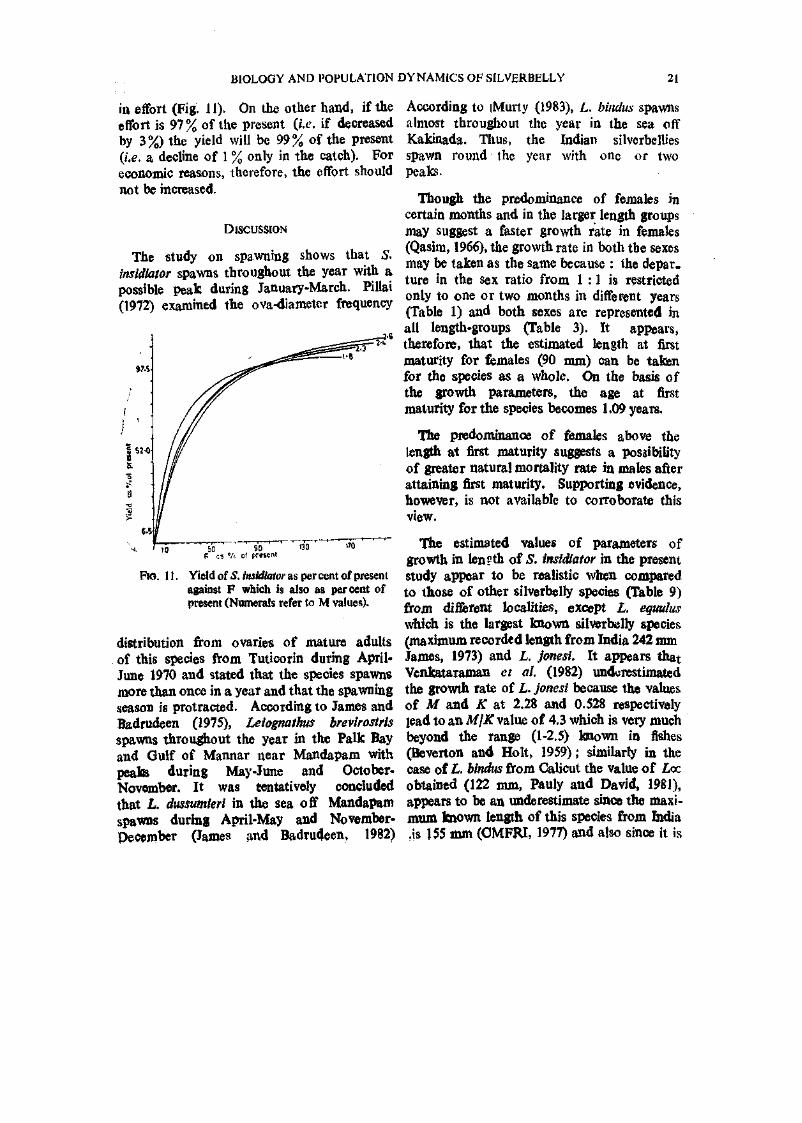
shows that the yield increases with increased F without reaching maximum, suggesting, that the yield can be increased by increasing the effort. Though it is possible to increase the yield by increasing the effort, the increased yield will not be remunerative because, for example, when ^=2.6 , a yield of 115% of the present can be obtained by expending an effort equivalent to 200% of the present \i.e.) only 15% increase in catch with 100% increase
BIOLOGY AND POPULATION DYNAMICS OF SILVERBELLY 21
in eflfort (Fig. 11). On the other hand, if the effort is 97% of the present (i.e. if decreased by 3%) the yield will be 99% of the present {i.e. a decline of 1 % only in the catch). For economic reasons, therefore, the effort should not be increased.
DISCUSSION
The study on spawning shows that S. insidiator spawns throughout the year with a possible Peak during January-March. Pillai (1972) examined the ova-diameter frequency
60 90 '30 F c3 % ot present
Ro. 11. Yield of 5. teirf/awr as per cent of present against F which is also as percent of present (Numerals refer to M values).
distribution from ovaries of mature adults of this species from Tuticorin during April-June 1970 and stated that the species spawns mote than once in a year and that the spawning season is protracted. According to James and Badrudeen (1975), Leiogmthus brevirostris spawns throughout the year in the Palk Bay and Gulf of Mannar near Mandapam with peaks during May-June and October-November. It was tentatively concluded that L. dussumieri in the sea off Mandapam spawns during April-May and November-Pecember (James and Badrudeen, 1982)
According to iMurty (1983), L. bindus spawns almost throughout the year in the sea oif Kakinada. Thus, the Indian silverbellies spawn round the year with one or two peaks.
Thougjh the predominance of females in certain months and in the larger length groups may suggest a faster growth rate in females (Qasim, 1966), the growth rate in both the sexes may be taken as the same because : the depar. ture in the sex ratio from 1 :1 is restricted only to one or two months in different years (Table 1) and both sexes are represented in all length-groups (Table 3). It appears, therefore, that the estimated length at first maturity for females (90 mm) can be taken for the species as a whole. On the basis of the growth parameters, the age at first maturity for the species becomes 1.09 years.
The predominance of females above the length at first maturity suggests a possibility of greater natural mortality rate in males after attaining first maturity. Supporting evidence, however, is not available to corroborate this view.
The estimated values of parameters of growth in lenpth of .S. insidiator in the present study appear to be realistic when compared to those of other silverbelly species (Table 9) from different localities, except L. equulus which is the largest known silverbelly species (maximum recorded length from India 242 mm James, 1973) and L. jonesi. It appears that Venkataraman et al. (1982) underestimated the growth rate of L. Jonesi because the values of M and K at 2.28 and 0.528 respectively lead to an MIK value of 4.3 which is very much beyond the range (1-2.5) known in fishes (Beverton and Holt, 1959); similarly in the case of i . bindus from Calicut the value of Loc obtained (122 mm, Pauly and David, 1981), appears to be an underestimate since the maximum known length of this species from India .is 155 nun (OMFRI, 1977) and also since it is
22 V. SRIRAMACHANDRA MURTV
known that the flsh ' will not grow ' beyond Loc also be very high, which too would have contri-(Guliand, 1983). buted to a greater Z.
An examination of values of Z estimated by different methods reveals that the value obtained by Pauly's method is the highest followed by Cumulative catch curve, Ssentong)-Larkin and Btverton-Holt methods (Table 6). According to Pauly (1983) the equation of Ssentongo and Larkin ' Produces estimates of Z which are higher than those obtained using equation * of Beverton and Holt, and Per Sparre (in lift, to Dr. Pauly, 1983) suggests that Ssentongo-Larkin equation
Since the trawl fishery is a multispecies one, apportioning of fishing effort with reference to a particular species is not possible (Pauly, 1983) and apparently this resulted in the lack of good correlation between effort and Z. The M values obtained by different methods are close to each other except the one obtained by S^kharan's method (Table 7); the M/K value in all the four cases is within the known range in fishes. In this connection it is worthwhile to quote Gushing (1981) : ' . . . . a precise
TABLE : 9 Parametres of.von Bertalanffy growth formula of different species of silverbellies
Species
S. insidiator L.bindus LJonesi L. splendens L. equidus
Locality
Kakinada Calicut Mandapam Philippines Madagascar
Source
Present work Pauly & David, 1981 Venkataranian etal., 1982 Pauly, 1983 Pauly. 1983
Loc mm
123.0 122.0 161.2 143.0 212.0
K per year
1.20 1.30 0.53 1.04 1.75
to year
—0.01 —
0.111 — —
is ' biassed upward'. There is, thus, an indication that the Beverton-Holt equation is not a biassed one. There is no indication in the literatnre whether the other two methods (Pauly's and Jones and van Zalinge's) are not biassed and presently it is not possible to explain the disparity between the Z values obtained ; hence it was preferred to consider the average value.
Though the value of Z at 6.1, considered in the present work, appears to be very high, it could be a reasonable estimate because, the bulk of silverbellies (including S. insidiator) occur in shallow waters (Pauly, 1977) where intensive trawling takes place for prawns, thus resulting in high fishing mort iity. Further, since the maximum length and lifespan are observed to be small, mortality due to predation and other natural causes could
separation of fishing and natural mortality remains inaccessible, and yet is one of the central problems of fisheries research.'
The yield per recruit analysis at the three values of t̂ against F (Fig. 8 a-c and 10) and the yield per recruit against t̂ (Fig. 8 d) show that maximum yield can be obtained by increasing F greatly, but with a maximum to of 0.7 only, thus indicating that t̂ has to be aductd from the present 0.87 (thus reduction in mesh size) and that Fcan be increased to get higher yield. Decreasing the mesh size results in increased produaion of smaller fishes. Since the adult size of the fish under study is itself a small one, the increase in yield so obtained will not be of consequence to the industry. Further, the present age at first capture is close to the age at first maturity and it is not desirable to have the age first
BIOLOGY AND POPULATION DYNAMICS OF SILVERBELLY 23
capture Idss than the age at first maturity, as otherwise the fishery takes away prospective spawners and increased effort in such a situation can result in the collapse of the fishery due to recruitment overfishing (Ursin, 1984) at certain hi^er effort level. Since at higher values of tc also, the yield did not show a fell with increase in F, it is desirable to have the current t̂ retained, if not increased a little, to avoid possible fall in the stock size and to gat increased yield of S. insidiator by increasing the effort. The analysis has also shown that though theoretically it is possible to increase yield by increasing effort increased effort will not be remunerative (Fig. 11).
Since the trawl fishery is a multispecies one«
regulation of effort including mesh regulation has to take into account other species takten by the fishery, as otherwise any change in the number of units or mesh size is likely to result in the loss of a particular resource for the fishery or in overexploitation of another resource. Still, such a study as the present one on the yield of any one component species is not an exercise in futility, for it must be stressed, in addition to enabling an understanding of the state of a particular single species resource in a multispecies fishery, such studies when conducted an all or most of the dominant species, will help in arriving at more meaningful decisions for the management of a multispecies fishery.
R E F E R E N C E S
AiAOARAJA, K. 1984. Simple methods for estima* tion of parameters for assessing exploited fish stocks. Indian J. Fish., 31 : 177-195.
ANNAM, V. P. AND S. K. DHARMARAJA 1982. Trends in the catch of silverbellies by mechanised boats in Tamil Nadu during 1971-75. Indian J. Fish., 28: 86-95 (1981).
ARORA, H . L. 1951. A contribution to the biologj of the silverbelly Leiogmthus splendens (Cuv.). Proc. IndoJ'acif. Fish. Com. 3rd Meeting, Madras, Sec. U : 75-80.
BALAN, V. 1967. Biology of the silverbelly Leiognathus bindus (Val.) of the Calicut Coast. Indian J. Fish.. 10 :118-134 (1963).
BEVERTON, R. J. H. AND S. J. HOLT 1956. A review of methods for estimating mortality rates in exploited iish j^pulations, with special reference to sources of bias m catch sampling. R(9>. P-v. Rem. Cons. Perm, int. Explor. Mer., 140 (1): 67-83.
_ _ AND 1957. On the Dynamics of Exploited Fish Populations. Fishery Invest., London, 19 : (2) 533 pp.
_ AND 1959. A review of lifespans and mortality rates of fish in nature and their relation to growth and other physiological characteiis-
Itia. Ciba Foundation CoUoquia on ageing. In: 1 Q. E. W. Wolsenhohny and M. O. Connor (Ed.) Jhe life-
ofantmals, 5:142-177.
: CLARK. W. G. 1978. Dynamic pool models. In: Models for Fish stock assessment, F40 fish. Circ. 701:17-30.
CMFRT 1977. Annual report. Central Marine Fisheries Research Institute, Cochin. 148 pp.
1981. Commercial trawl fisheries off Kakinada during 1969-1978. Mar. Fish. Infor. Ser. T. & E. Ser., 31:1-6.
CusHiNG, D. H. 1981. Fisheries Biology: A study in population Dynamics. Second Edhion. The University of Wisconsin Press, 295 pp.
FoRD, E. 1933. An account of hening investigations conducted at Plymouth during the years 1924-1933. J. Mar. Biol. Ass. U.K., 19: 305-384.
GANAPATHI, P. N . AND V. S. R. MXJRTHY 1954. Salinity and temperature variations of the surface waters off Visakhai»tnam Coast. Andhra Univ. Mem. Oceanogr., 1:125-142.
GutLAND, J. A. 1969. Manual of Methods for fish stock assessment. Part 1. Fish Population analysis. FAO Man, Fish. Sd., 4 : 154 pp.
1983. Fish stock assessment: A manual of basic methods. FAO/Wiley Series on food and Agriculture, 1:223 pp.
JAMES. P. S. B. R. 1973. The fishery potential of silverbellies. Proc. Symp. Living. Resources of the seas around India, Spl. Pub. Central Marine Fisheries Research Institute, Cochin, pp. 493-444.
AND M. BADRUDEEN 1975. Biology and fishery of Leiognathus brevirottris (Val.) from Palk Bay and Oulf of Mannar, Indian J, Mar. Set., A: 50-59.
V. SRIRAMACHANDRA MURTY
—-' . . ' . AND —• - ^ 1982. Biology and fishery of silverbelly Leiognathus flussumieri (Valenciennes) from Gulf of Mannar. Indian J. Fish., 28 : 154-182 (1981).
JONES, R . 1981. The use of length composition data in fish stock assessment (with notes on VPA and Cohort analysis). FAO Fish. Circ, 734: 60 pp.
AND P. N. VAN ZAUNOE. 1981. Estimation of mortality rate and population size of shrimps in Kuwait waters. Kuwait Bull. Mar. Sci., 2 : 273-288.
LA FOND, E . C. 1958. Seasonal cycle of sea surface temperature and salinity along the east coast of India. Andhra Univ. Mem. Oceanogr., 2 : 12-21.
LE CREN, E . D . 1951. Length-weight relationship and seasonal cycle in gonad weight and condition of the perch (Perca fluviatilis). J. Anim. Ecol, 20 : 201-219.
•MANZER, J. L AND F. H. C. TAYLOR 1947. The rate of growth in lemon sole in the Strait of Georgia. Prog. Rep. Fish Res. BoardPac. Coast Stn., 72 : 24-27.
MuRTY, V. SRIRAMACHANDRA 1983. Observations on some aspects of biology of the silverbelly Leiognathus, bindus (Valenciennes) from Kakinada. Indian J. Fish. 30:61-68.
NAVALTJNA, N . A . 1982. Morphometries, biology and population dynamics of the Croaker fish Otolithes ruber. In: Pauly D. and A. N. MinM (Ed.) Small scale fisheries of San Miguel Bay, Phil^pines : biology and stock assessment. ICLARM Technical Reports, 7:124 pp.
•PAtiuK, G. J. AND L. E . GALES 1964. AUometric grovnh and Beverton-Holt yield equation. Trans. Amer. Fish. Soc, 93: 369-381.
PAULY, D . 1977. The Leiognathidae (Teleostei): their species, stocks and fisheries in Indonesia, with notes on the biology of Leiognathus splendens (Cuvier). Marine Research in Indonesia, 19: 73-93.
1980 a. A selection of simple methods for the assessment of tropical flsh stocks. FAO Fish. Ore, 729 : 54 pp.
1980 b. On the interrelationships between natural mortality, growth parameters and mean environmental temperature in 175 fish stocks. / . cons, int. Explor. Mer., 39 : 175-192.
Not referred to in original,
1982. Studying single-species dynamics in a tropical multispecies context. In: D. Pauly and G. I. Murphy (Ed.) Theory and management of tropical fisheries. ICLARM conference Proc. 9, 360 pp. ICLARM, Manila; Philippines and CSIRO, Cronulla, Australia.
— 1983. Some simple methods for the assessment of tropic^ fish stocks. FAO Fish. Tech. Pap., 234 : 52 pp.
AND N . DAVID 1981. ELEFAN I, a BASIC program for the objective extraction of growth parameters from length frequency data. Meeresforsch., 28:205-211.
PiLLAi, p. K., MAHADEVAN 1972. Fecundity and spawning habits of some silverbellies. Indian J. Fish, 19 :196-199.
QASIM, S. Z . 1966. Sex ratio in Fish populations as a function ofsexual difference in growth rate. Curr. Sci., 35:140-142.
RiCKER, W. E. 1975. Computation and interpretation of biological statistics of flsh populations. Bull. Fish. Res. Bd. Canada, 191: 382 pp.
SEKHARAN, K . V. 1976. Estimates of stocks of oil sardine and mackerel in the fishing grounds off the west coast of India. Indian J. Fish., 2 1 : 177-182 (1974).
SNEDECOR, G . W. AND W. G . COCHRAN 1967. Statistical Methods. Sixth Edition, Oxford and IBH Publishing Co., New Delhi, 593 pp.
SSENTONOO, G . W. AND P. A. LARKIN 1973. Some simple methods of estimating mortality rates of exploited fish populations. / . Fish. Res. Bd. Canada, 30: 695-698.
VENKATARAMAN, G . AND M . BADRUDEEN 1974. On the diurnal variation in the catches of silverbellies in Palk Bay. Indian J. Fish., 2 1 : 254-265.
, AND R . THIAOARAJAN 1982. Population dynamics of silverbelly Leiognathus jonesi in Palk Bay. Ibid., 28 : 65-86 (1981).
URSIN, E . 1984. The tropical, the temperate and the Arctic seas as media for flsh production. Dana, 4 :43-60.
WALFORD, L . A . 1946. A new graphic method of describing the growth of animals. Biol. Bull. Woodshole, 90; 141-147