
BM&FBOVESPAir.bmfbovespa.com.br/enu/1936/BVMFPresentationDecember2013.pdf · and central depository...
54
1 BM&FBOVESPA Investor Relations Department December 2013
Transcript of BM&FBOVESPAir.bmfbovespa.com.br/enu/1936/BVMFPresentationDecember2013.pdf · and central depository...
1
BM&FBOVESPA Investor Relations Department
December 2013
2
Forward Looking Statements
This presentation may contain certain statements that express the management’s expectations, beliefs and assumptions about future events or results. Such statements are not historical fact, being based on currently available competitive, financial and economic data, and on current projections about the industries BM&FBOVESPA works in. The verbs “anticipate,” “believe,” “estimate,” “expect,” “forecast,” “plan,” “predict,” “project,” “target” and other similar verbs are intended to identify these forward-looking statements, which involve risks and uncertainties that could cause actual results to differ materially from those projected in this presentation and do not guarantee any future BM&FBOVESPA performance. The factors that might affect performance include, but are not limited to: (i) market acceptance of BM&FBOVESPA services; (ii) volatility related to (a) the Brazilian economy and securities markets and (b) the highly-competitive industries BM&FBOVESPA operates in; (iii) changes in (a) domestic and foreign legislation and taxation and (b) government policies related to the financial and securities markets; (iv) increasing competition from new entrants to the Brazilian markets; (v) ability to keep up with rapid changes in technological environment, including the implementation of enhanced functionality demanded by BM&FBOVESPA customers; (vi) ability to maintain an ongoing process for introducing competitive new products and services, while maintaining the competitiveness of existing ones; (vii) ability to attract new customers in domestic and foreign jurisdictions; (viii) ability to expand the offer of BM&FBOVESPA products in foreign jurisdictions. All forward-looking statements in this presentation are based on information and data available as of the date they were made, and BM&FBOVESPA undertakes no obligation to update them in light of new information or future development. This presentation does not constitute an offer to sell or the solicitation of an offer to buy any securities, nor shall there be any sale of securities where such offer or sale would be unlawful prior to registration or qualification under the securities law. No offering shall be made except by means of a prospectus meeting the requirements of the Brazilian Securities Commission CVM Instruction 400 of 2003, as amended.
3
HISTORY, BUSINESS MODEL AND CORPORATE GOVERNANCE
BRAZILIAN MARKET OPPORTUNITIES
MAIN GROWTH INITIATIVES
OPERATIONAL PERFORMANCE
FINANCIAL HIGHLIGHTS
APPENDIX (includes results for 3Q13)
4
HISTORY, BUSINESS MODEL AND CORPORATE GOVERNANCE
Safety, resilience and transparency
5
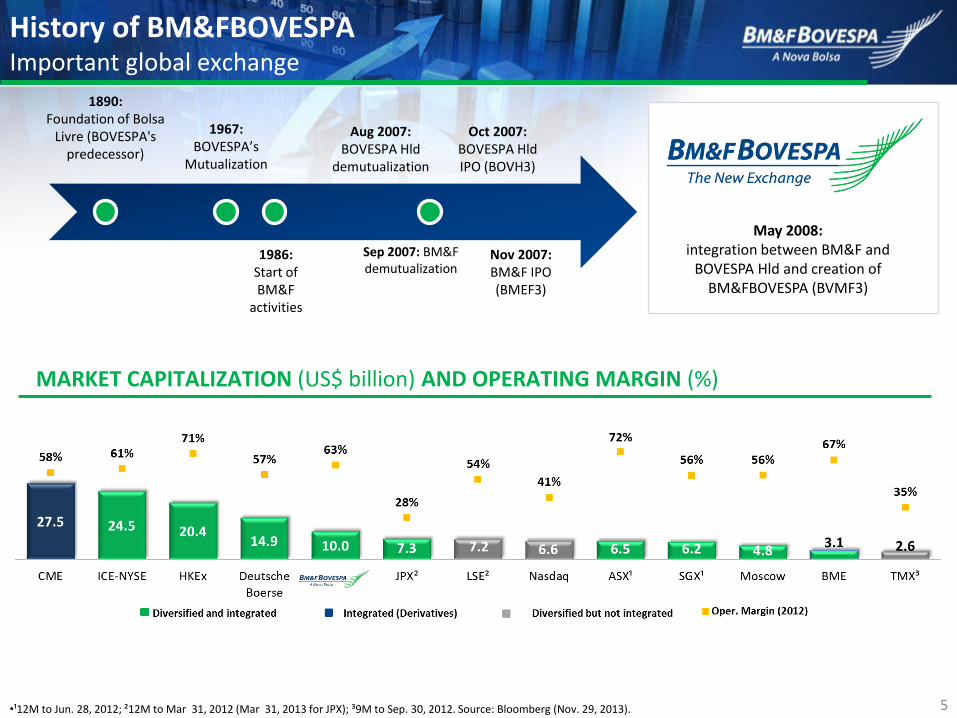
1890: Foundation of Bolsa
Livre (BOVESPA's predecessor)
1986: Start of BM&F
activities
Aug 2007: BOVESPA Hld
demutualization
Sep 2007: BM&F demutualization
Oct 2007: BOVESPA Hld IPO (BOVH3)
Nov 2007: BM&F IPO (BMEF3)
May 2008: integration between BM&F and
BOVESPA Hld and creation of BM&FBOVESPA (BVMF3)
1967: BOVESPA’s
Mutualization
MARKET CAPITALIZATION (US$ billion) AND OPERATING MARGIN (%)
•¹12M to Jun. 28, 2012; ²12M to Mar 31, 2012 (Mar 31, 2013 for JPX); ³9M to Sep. 30, 2012. Source: Bloomberg (Nov. 29, 2013).
History of BM&FBOVESPA Important global exchange
6
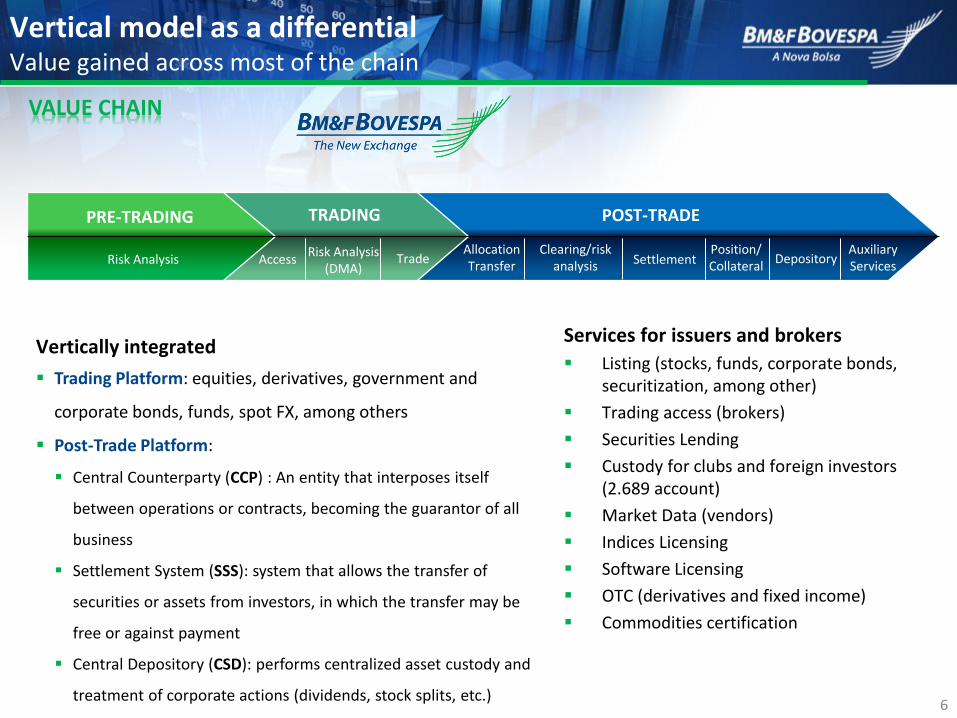
PRE-TRADING TRADING POST-TRADE
Access Trade Allocation Transfer
Clearing/risk analysis
Position/ Collateral
Depository Auxiliary Services
VALUE CHAIN
Vertically integrated
Trading Platform: equities, derivatives, government and
corporate bonds, funds, spot FX, among others
Post-Trade Platform:
Central Counterparty (CCP) : An entity that interposes itself
between operations or contracts, becoming the guarantor of all
business
Settlement System (SSS): system that allows the transfer of
securities or assets from investors, in which the transfer may be
free or against payment
Central Depository (CSD): performs centralized asset custody and
treatment of corporate actions (dividends, stock splits, etc.)
Services for issuers and brokers
Listing (stocks, funds, corporate bonds, securitization, among other)
Trading access (brokers)
Securities Lending
Custody for clubs and foreign investors (2.689 account)
Market Data (vendors)
Indices Licensing
Software Licensing
OTC (derivatives and fixed income)
Commodities certification
Vertical model as a differential Value gained across most of the chain
Settlement Risk Analysis
(DMA) Risk Analysis
7
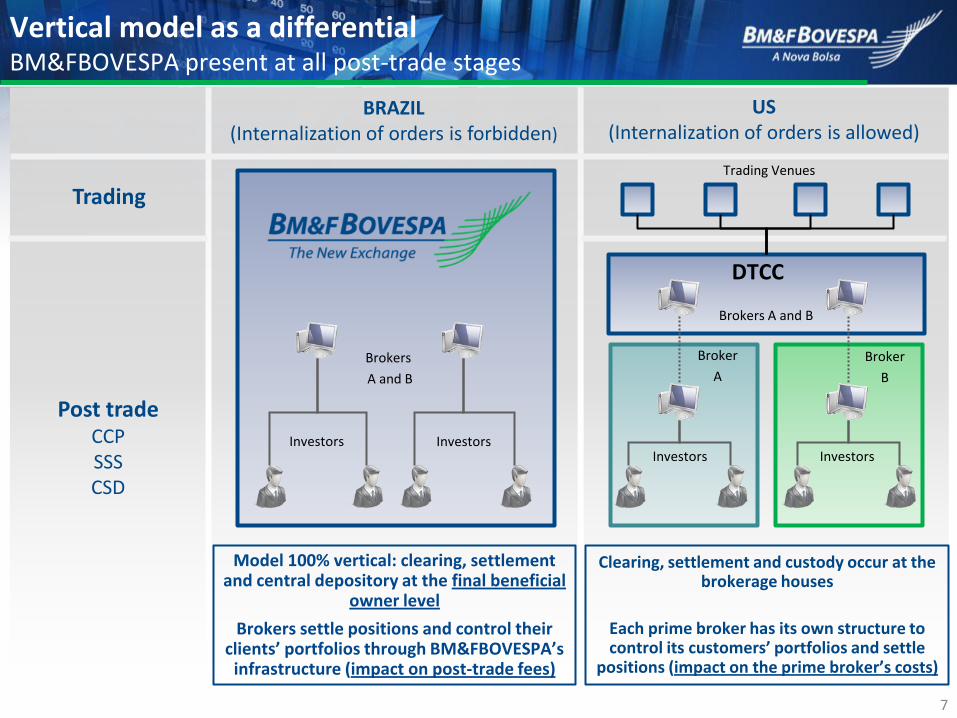
DTCC
BRAZIL (Internalization of orders is forbidden)
US (Internalization of orders is allowed)
Post trade CCP SSS CSD
Trading
Brokers
A and B
Investors Investors
Brokers A and B
Investors Investors
Broker
A
Broker
B
Model 100% vertical: clearing, settlement and central depository at the final beneficial
owner level
Brokers settle positions and control their clients’ portfolios through BM&FBOVESPA’s
infrastructure (impact on post-trade fees)
Clearing, settlement and custody occur at the brokerage houses
Each prime broker has its own structure to control its customers’ portfolios and settle
positions (impact on the prime broker’s costs)
Trading Venues
Vertical model as a differential BM&FBOVESPA present at all post-trade stages
8
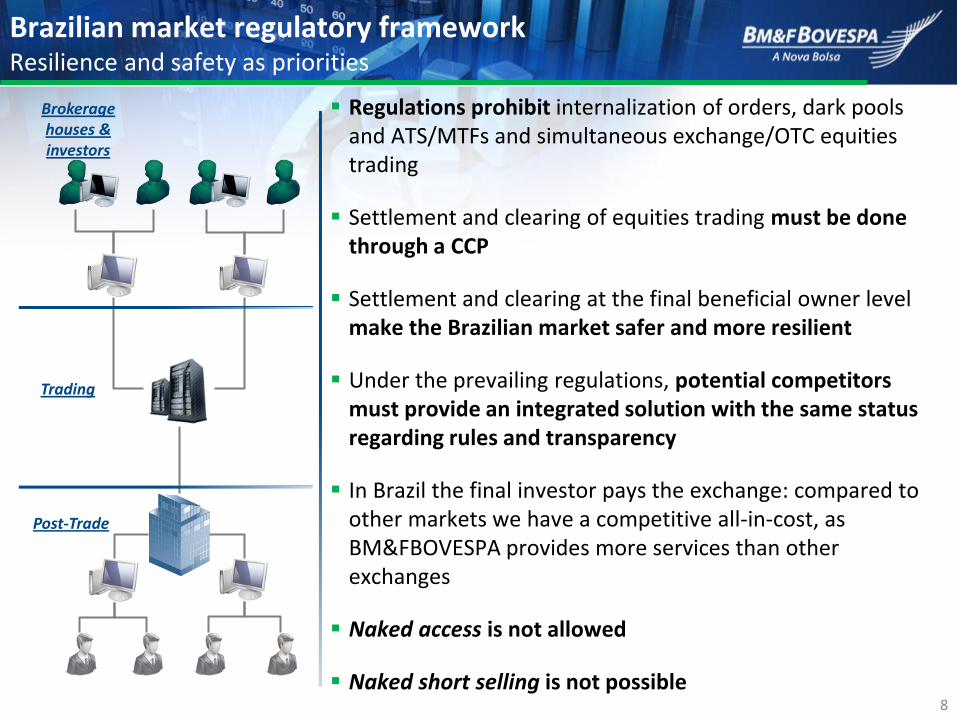
Brokerage houses & investors
Trading
Post-Trade
Regulations prohibit internalization of orders, dark pools and ATS/MTFs and simultaneous exchange/OTC equities trading
Settlement and clearing of equities trading must be done through a CCP
Settlement and clearing at the final beneficial owner level make the Brazilian market safer and more resilient
Under the prevailing regulations, potential competitors must provide an integrated solution with the same status regarding rules and transparency
In Brazil the final investor pays the exchange: compared to other markets we have a competitive all-in-cost, as BM&FBOVESPA provides more services than other exchanges
Naked access is not allowed
Naked short selling is not possible
Brazilian market regulatory framework Resilience and safety as priorities
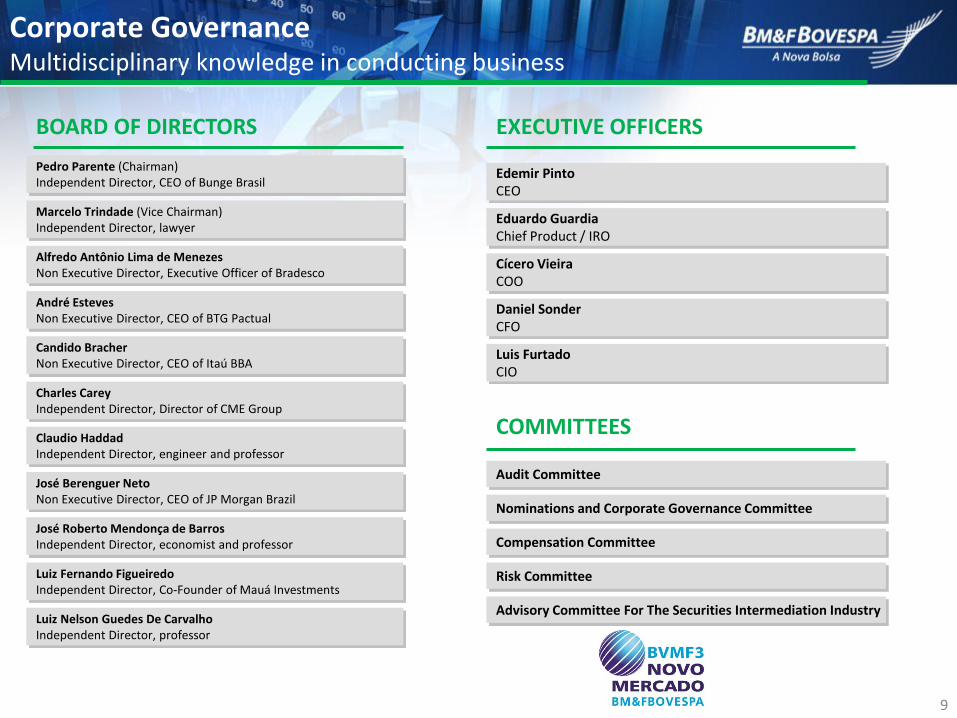
9
EXECUTIVE OFFICERS BOARD OF DIRECTORS
COMMITTEES
Edemir Pinto CEO
Luis Furtado CIO
Cícero Vieira COO
Daniel Sonder CFO
Eduardo Guardia Chief Product / IRO
Audit Committee
Risk Committee
Nominations and Corporate Governance Committee
Compensation Committee
Corporate Governance Multidisciplinary knowledge in conducting business
Charles Carey Independent Director, Director of CME Group
José Roberto Mendonça de Barros Independent Director, economist and professor
Pedro Parente (Chairman) Independent Director, CEO of Bunge Brasil
Marcelo Trindade (Vice Chairman) Independent Director, lawyer
Claudio Haddad Independent Director, engineer and professor
André Esteves Non Executive Director, CEO of BTG Pactual
Alfredo Antônio Lima de Menezes Non Executive Director, Executive Officer of Bradesco
Luiz Fernando Figueiredo Independent Director, Co-Founder of Mauá Investments
Luiz Nelson Guedes De Carvalho Independent Director, professor
Candido Bracher Non Executive Director, CEO of Itaú BBA
José Berenguer Neto Non Executive Director, CEO of JP Morgan Brazil
Advisory Committee For The Securities Intermediation Industry
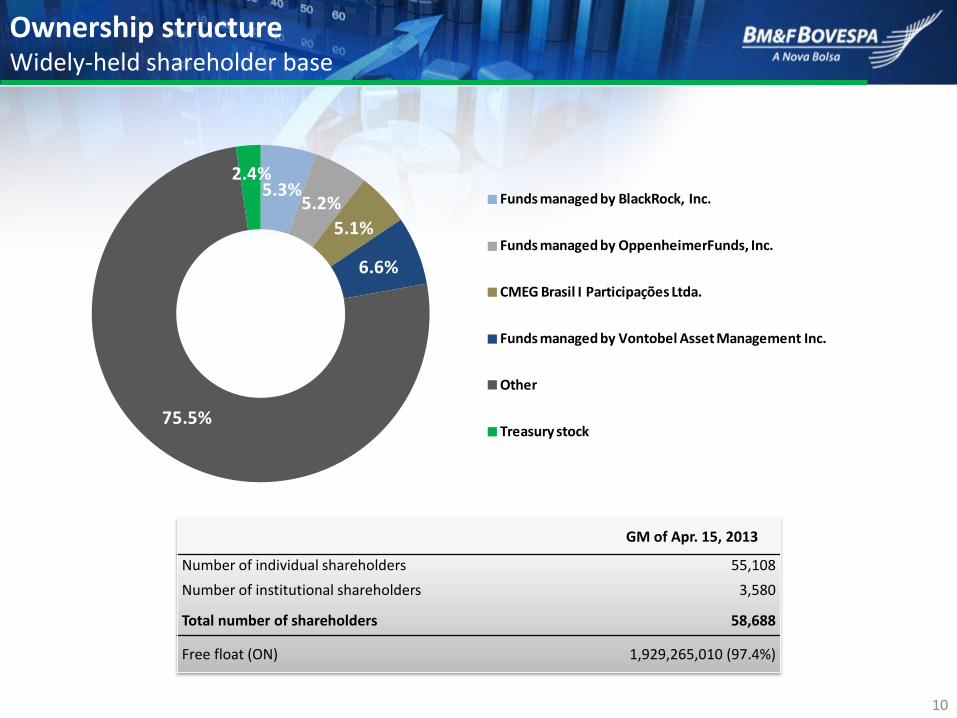
10
GM of Apr. 15, 2013
Number of individual shareholders 55,108
Number of institutional shareholders 3,580
Total number of shareholders 58,688
Free float (ON) 1,929,265,010 (97.4%)
Ownership structure Widely-held shareholder base
5.3%5.2%
5.1%
6.6%
75.5%
2.4%Funds managed by BlackRock, Inc.
Funds managed by OppenheimerFunds, Inc.
CMEG Brasil I Participações Ltda.
Funds managed by Vontobel Asset Management Inc.
Other
Treasury stock
11
BRAZILIAN MARKET OPPORTUNITIES Main growth drivers
12
13.25 11.25
13.75
8.75 10.75 11.00
7.25 10.00
2007 2008 2009 2010 2011 2012 2013
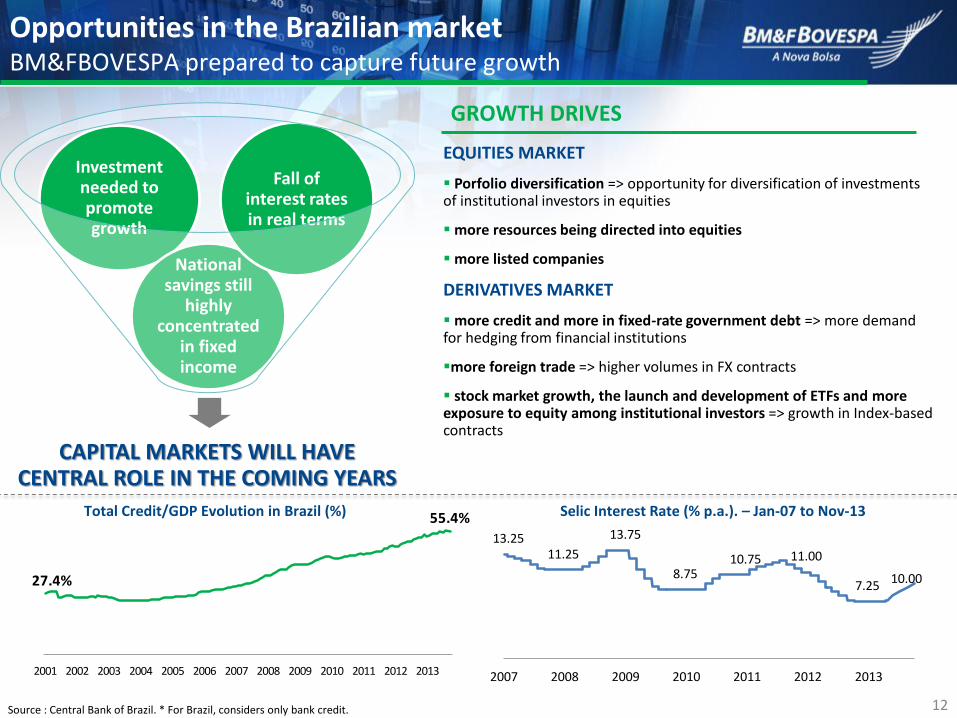
Opportunities in the Brazilian market BM&FBOVESPA prepared to capture future growth
Source : Central Bank of Brazil. * For Brazil, considers only bank credit.
GROWTH DRIVES
EQUITIES MARKET
Porfolio diversification => opportunity for diversification of investments of institutional investors in equities
more resources being directed into equities
more listed companies
DERIVATIVES MARKET
more credit and more in fixed-rate government debt => more demand for hedging from financial institutions
more foreign trade => higher volumes in FX contracts
stock market growth, the launch and development of ETFs and more exposure to equity among institutional investors => growth in Index-based contracts
CAPITAL MARKETS WILL HAVE CENTRAL ROLE IN THE COMING YEARS
Investment needed to promote growth
National savings still
highly concentrated
in fixed income
Fall of interest rates in real terms
Total Credit/GDP Evolution in Brazil (%) Selic Interest Rate (% p.a.). – Jan-07 to Nov-13
27.4%
55.4%
2001 2002 2003 2004 2005 2006 2007 2008 2009 2010 2011 2012 2013
13
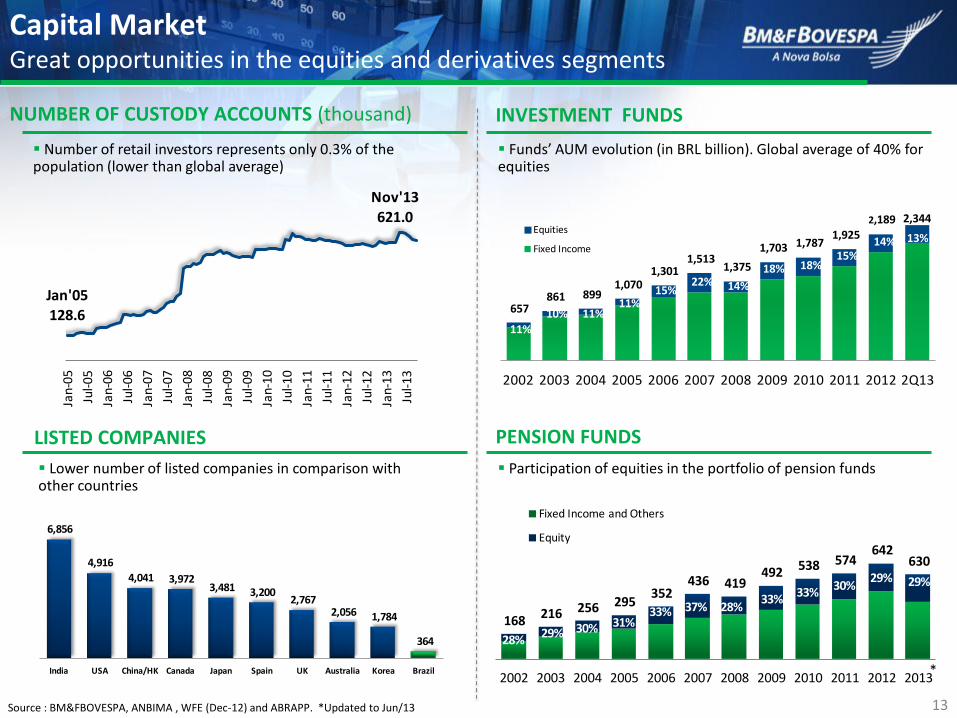
168 216 256 295 352
436 419 492 538 574
642 630
28%29% 30% 31%
33% 37% 28%33%
33%30%
29% 29%
2002 2003 2004 2005 2006 2007 2008 2009 2010 2011 2012 2013
Fixed Income and Others
Equity
Capital Market Great opportunities in the equities and derivatives segments
Funds’ AUM evolution (in BRL billion). Global average of 40% for equities
LISTED COMPANIES
Source : BM&FBOVESPA, ANBIMA , WFE (Dec-12) and ABRAPP. *Updated to Jun/13
INVESTMENT FUNDS NUMBER OF CUSTODY ACCOUNTS (thousand)
PENSION FUNDS
Number of retail investors represents only 0.3% of the population (lower than global average)
Lower number of listed companies in comparison with other countries
Participation of equities in the portfolio of pension funds
6,856
4,916
4,041 3,972 3,481 3,200
2,767 2,056 1,784
364
India USA China/HK Canada Japan Spain UK Australia Korea Brazil
657 861 899
1,070 1,301
1,513 1,375
1,703 1,787 1,925
2,189 2,344
11%
10% 11%11%
15%22% 14%
18% 18%15%
14% 13%
2002 2003 2004 2005 2006 2007 2008 2009 2010 2011 2012 2Q13
Equities
Fixed Income
*
Jan'05 128.6
Nov'13
621.0
Jan
-05
Jul-
05
Jan
-06
Jul-
06
Jan
-07
Jul-
07
Jan
-08
Jul-
08
Jan
-09
Jul-
09
Jan
-10
Jul-
10
Jan
-11
Jul-
11
Jan
-12
Jul-
12
Jan
-13
Jul-
13
14
MAIN GROWTH INITIATIVES Investments, new products and focus on the
customer
15
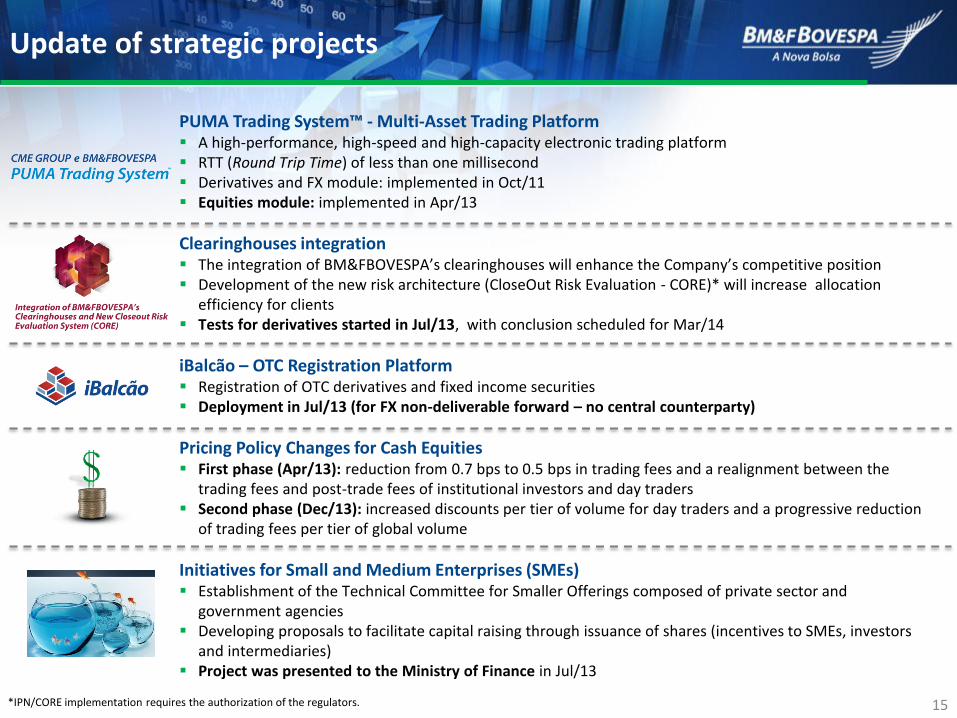
Update of strategic projects
*IPN/CORE implementation requires the authorization of the regulators.
PUMA Trading System™ - Multi-Asset Trading Platform A high-performance, high-speed and high-capacity electronic trading platform RTT (Round Trip Time) of less than one millisecond Derivatives and FX module: implemented in Oct/11 Equities module: implemented in Apr/13
Clearinghouses integration The integration of BM&FBOVESPA’s clearinghouses will enhance the Company’s competitive position Development of the new risk architecture (CloseOut Risk Evaluation - CORE)* will increase allocation
efficiency for clients Tests for derivatives started in Jul/13, with conclusion scheduled for Mar/14
iBalcão – OTC Registration Platform Registration of OTC derivatives and fixed income securities Deployment in Jul/13 (for FX non-deliverable forward – no central counterparty)
Pricing Policy Changes for Cash Equities First phase (Apr/13): reduction from 0.7 bps to 0.5 bps in trading fees and a realignment between the
trading fees and post-trade fees of institutional investors and day traders Second phase (Dec/13): increased discounts per tier of volume for day traders and a progressive reduction
of trading fees per tier of global volume
Initiatives for Small and Medium Enterprises (SMEs) Establishment of the Technical Committee for Smaller Offerings composed of private sector and
government agencies Developing proposals to facilitate capital raising through issuance of shares (incentives to SMEs, investors
and intermediaries) Project was presented to the Ministry of Finance in Jul/13
16
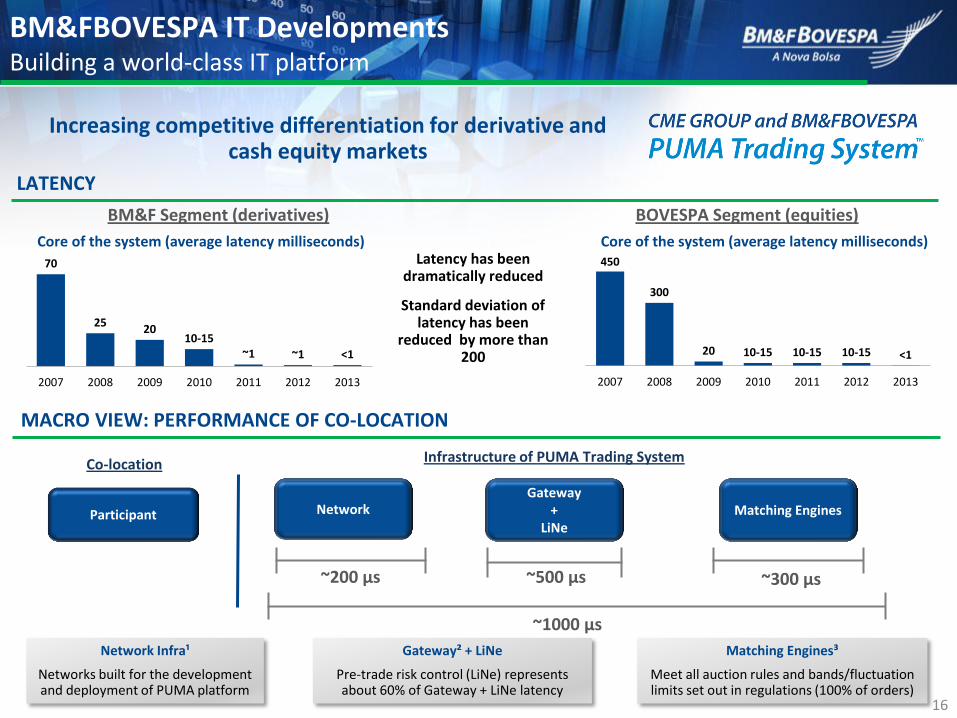
BM&FBOVESPA IT Developments Building a world-class IT platform
Increasing competitive differentiation for derivative and cash equity markets
LATENCY
BM&F Segment (derivatives) BOVESPA Segment (equities)
70
2520
10-15~1 ~1 <1
2007 2008 2009 2010 2011 2012 2013
450
300
20 10-15 10-15 10-15 <1
2007 2008 2009 2010 2011 2012 2013
Core of the system (average latency milliseconds) Core of the system (average latency milliseconds) Latency has been
dramatically reduced
Standard deviation of latency has been
reduced by more than 200
MACRO VIEW: PERFORMANCE OF CO-LOCATION
Co-location
Participant
Infrastructure of PUMA Trading System
Gateway +
LiNe Matching Engines
~300 µs ~500 µs ~200 µs
~1000 µs
Network Infra¹
Networks built for the development and deployment of PUMA platform
Gateway² + LiNe
Pre-trade risk control (LiNe) represents about 60% of Gateway + LiNe latency
Matching Engines³
Meet all auction rules and bands/fluctuation limits set out in regulations (100% of orders)
Network
17
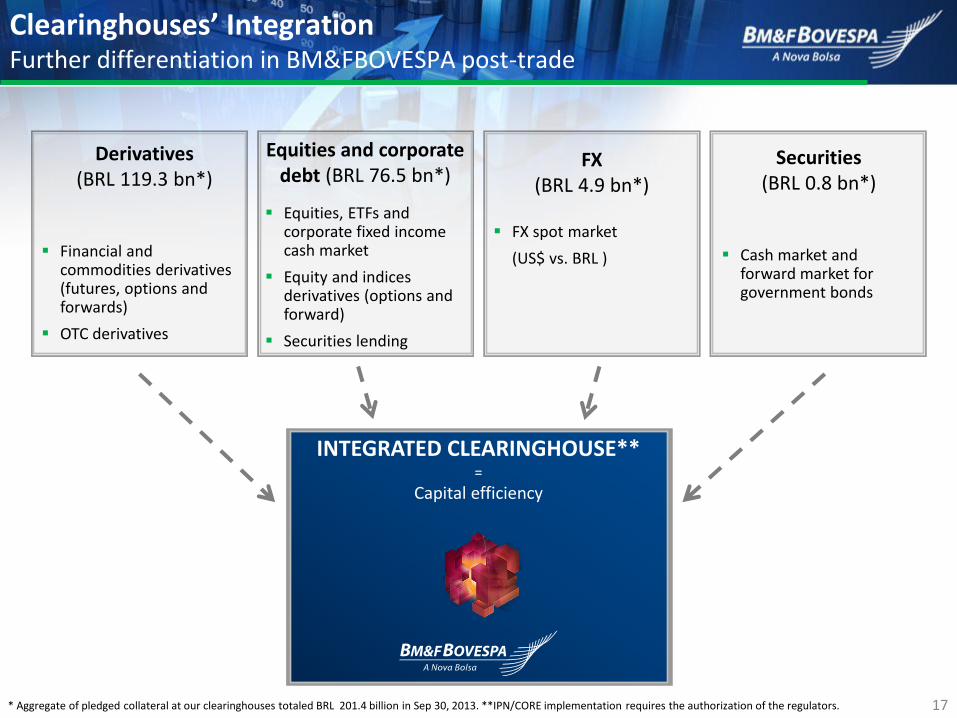
Clearinghouses’ Integration Further differentiation in BM&FBOVESPA post-trade
Equities and corporate debt (BRL 76.5 bn*)
Equities, ETFs and corporate fixed income cash market
Equity and indices derivatives (options and forward)
Securities lending
Derivatives (BRL 119.3 bn*)
Financial and commodities derivatives (futures, options and forwards)
OTC derivatives
FX (BRL 4.9 bn*)
FX spot market
(US$ vs. BRL )
Securities (BRL 0.8 bn*)
Cash market and forward market for government bonds
INTEGRATED CLEARINGHOUSE** =
Capital efficiency
* Aggregate of pledged collateral at our clearinghouses totaled BRL 201.4 billion in Sep 30, 2013. **IPN/CORE implementation requires the authorization of the regulators.
18
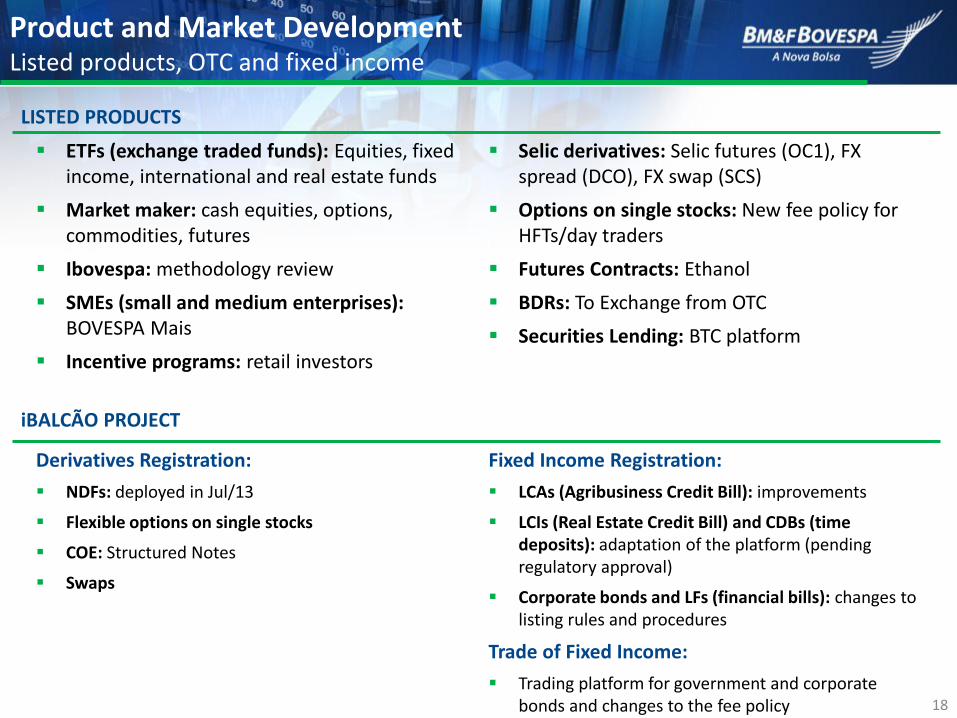
Product and Market Development Listed products, OTC and fixed income
LISTED PRODUCTS
iBALCÃO PROJECT
ETFs (exchange traded funds): Equities, fixed income, international and real estate funds
Market maker: cash equities, options, commodities, futures
Ibovespa: methodology review
SMEs (small and medium enterprises): BOVESPA Mais
Incentive programs: retail investors
Selic derivatives: Selic futures (OC1), FX spread (DCO), FX swap (SCS)
Options on single stocks: New fee policy for HFTs/day traders
Futures Contracts: Ethanol
BDRs: To Exchange from OTC
Securities Lending: BTC platform
Derivatives Registration:
NDFs: deployed in Jul/13
Flexible options on single stocks
COE: Structured Notes
Swaps
Fixed Income Registration:
LCAs (Agribusiness Credit Bill): improvements
LCIs (Real Estate Credit Bill) and CDBs (time deposits): adaptation of the platform (pending regulatory approval)
Corporate bonds and LFs (financial bills): changes to listing rules and procedures
Trade of Fixed Income:
Trading platform for government and corporate bonds and changes to the fee policy
19
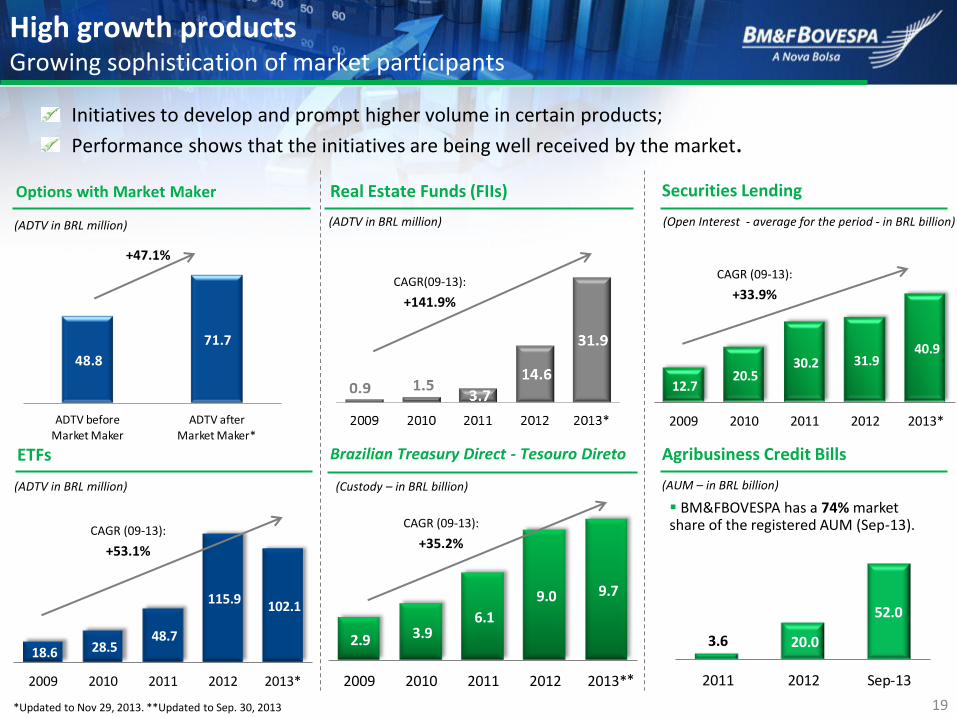
48.8
71.7
ADTV before Market Maker
ADTV after Market Maker*
18.6 28.5 48.7
115.9 102.1
2009 2010 2011 2012 2013*
2.9 3.9 6.1
9.0 9.7
2009 2010 2011 2012 2013*
Securities Lending Real Estate Funds (FIIs) Options with Market Maker
(Open Interest - average for the period - in BRL billion)
Initiatives to develop and prompt higher volume in certain products;
Performance shows that the initiatives are being well received by the market.
ETFs Brazilian Treasury Direct - Tesouro Direto Agribusiness Credit Bills
(ADTV in BRL million)
+47.1%
(ADTV in BRL million)
(ADTV in BRL million) (Custody – in BRL billion)
High growth products Growing sophistication of market participants
BM&FBOVESPA has a 74% market share of the registered AUM (Sep-13).
CAGR(09-13):
+141.9%
CAGR (09-13):
+33.9%
CAGR (09-13):
+53.1%
CAGR (09-13):
+35.2%
*Updated to Nov 29, 2013. **Updated to Sep. 30, 2013
(AUM – in BRL billion)
*
3.6 20.0
52.0
2011 2012 Sep-13
12.7 20.5
30.2 31.9 40.9
2009 2010 2011 2012 2013*

20
OPERATIONAL PERFORMANCE Records in 2013
21
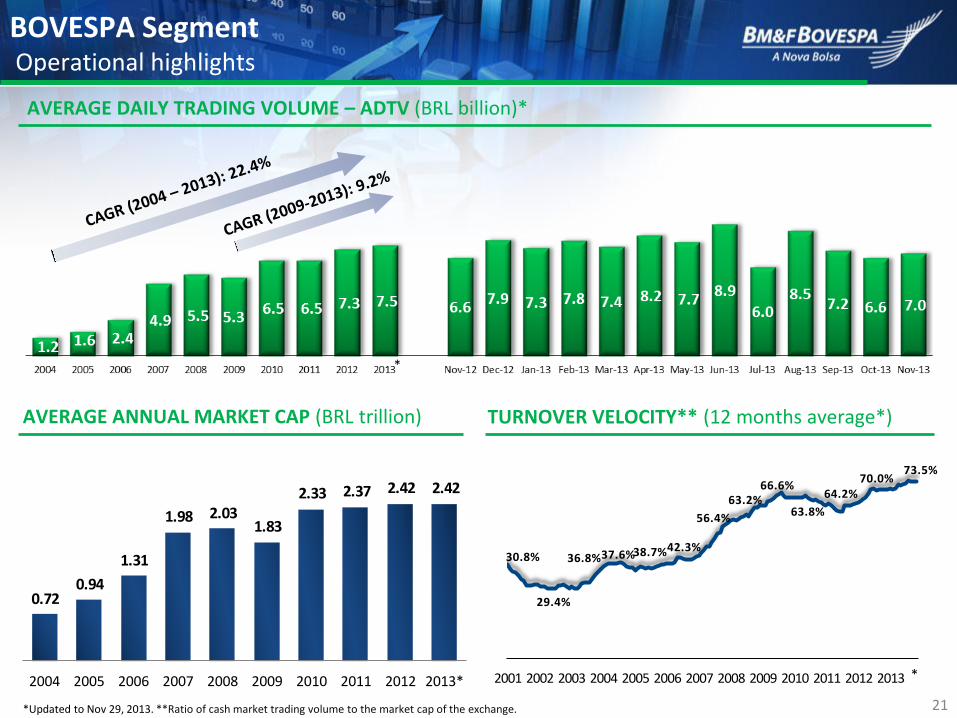
BOVESPA Segment Operational highlights
*Updated to Nov 29, 2013. **Ratio of cash market trading volume to the market cap of the exchange.
AVERAGE DAILY TRADING VOLUME – ADTV (BRL billion)*
AVERAGE ANNUAL MARKET CAP (BRL trillion) TURNOVER VELOCITY** (12 months average*)
*
*
0.72 0.94
1.31
1.98 2.03 1.83
2.33 2.37 2.42 2.42
2004 2005 2006 2007 2008 2009 2010 2011 2012 2013*
30.8%
29.4%
36.8%37.6%38.7%42.3%
56.4%
63.2%66.6%
63.8%
64.2%70.0%
73.5%
2001 2002 2003 2004 2005 2006 2007 2008 2009 2010 2011 2012 2013
22
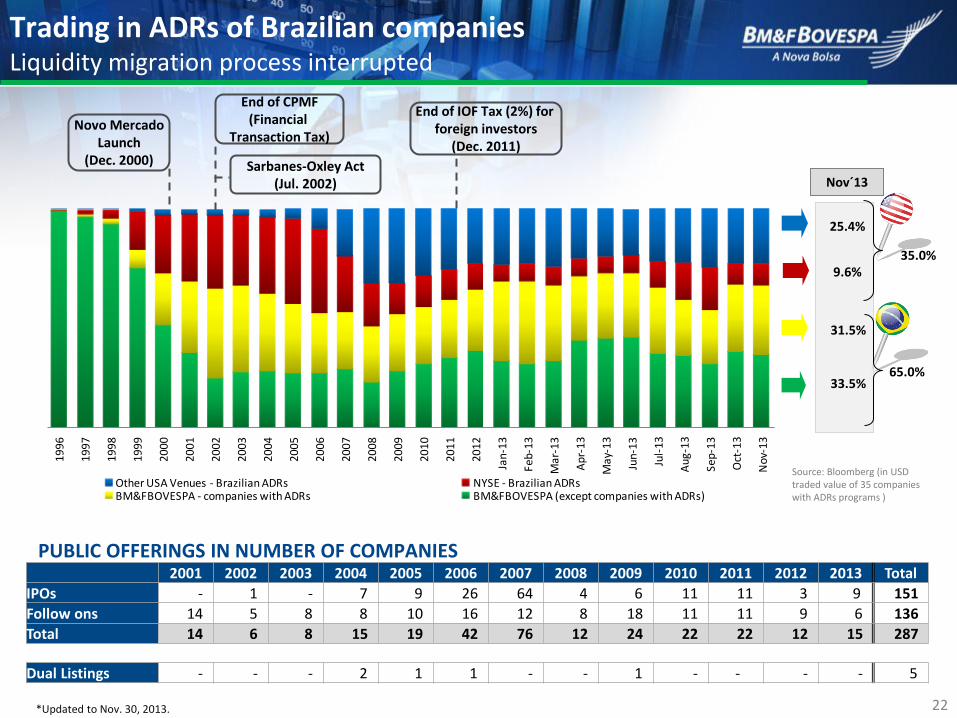
Trading in ADRs of Brazilian companies Liquidity migration process interrupted
Nov´13
Source: Bloomberg (in USD traded value of 35 companies with ADRs programs )
Sarbanes-Oxley Act (Jul. 2002)
*Updated to Nov. 30, 2013.
Novo Mercado Launch
(Dec. 2000)
PUBLIC OFFERINGS IN NUMBER OF COMPANIES
End of IOF Tax (2%) for foreign investors
(Dec. 2011)
End of CPMF (Financial
Transaction Tax)
33.5%
31.5%
9.6%
25.4%
35.0%
65.0%
2001 2002 2003 2004 2005 2006 2007 2008 2009 2010 2011 2012 2013 Total
IPOs - 1 - 7 9 26 64 4 6 11 11 3 9 151
Follow ons 14 5 8 8 10 16 12 8 18 11 11 9 6 136
Total 14 6 8 15 19 42 76 12 24 22 22 12 15 287
Dual Listings - - - 2 1 1 - - 1 - - - - 5
19
96
19
97
19
98
19
99
20
00
20
01
20
02
20
03
20
04
20
05
20
06
20
07
20
08
20
09
20
10
20
11
20
12
Jan
-13
Feb
-13
Mar
-13
Ap
r-1
3
May
-13
Jun-
13
Jul-
13
Au
g-1
3
Sep
-13
Oct
-13
Nov
-13
Other USA Venues - Brazilian ADRs NYSE - Brazilian ADRsBM&FBOVESPA - companies with ADRs BM&FBOVESPA (except companies with ADRs)
23
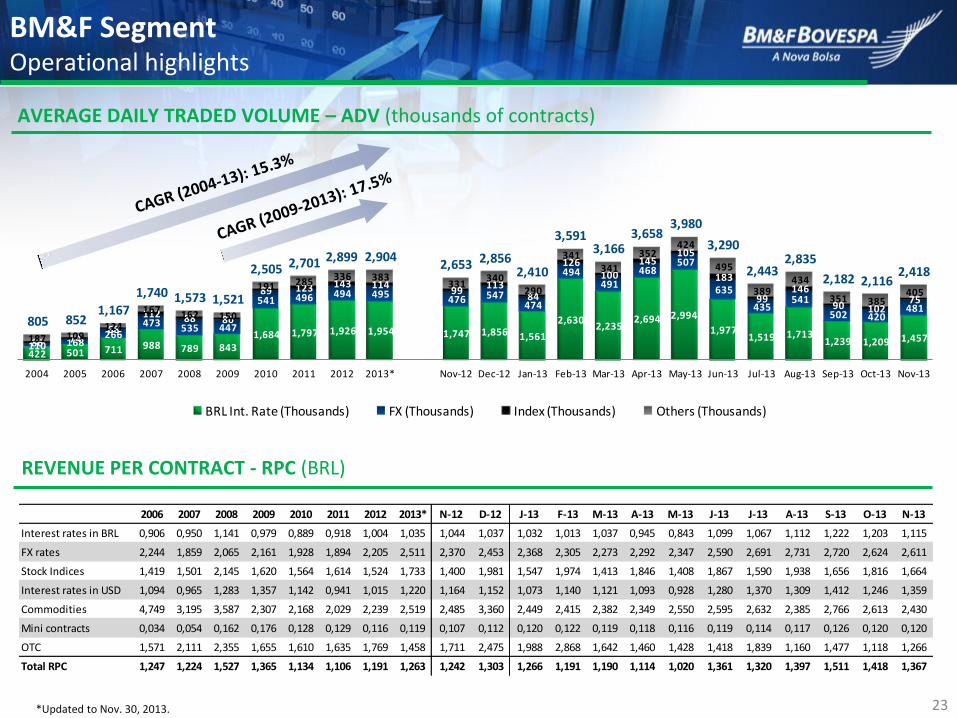
422 501 711 988 789 843 1,684 1,797 1,926 1,954 1,747 1,856 1,561
2,6302,235
2,694 2,994
1,9771,519 1,713
1,239 1,209 1,457110 168
266 473 535 447
541 496 494 495 476 547 474
494 491
468 507
635
435 541
502 420 481
86 74 68
112 88 80
89 123 143 114 99
113 84
126 100
145 105
183
99 146
90 102 75
187 109 124
167 162 150
191 285 336 383 331
340 290
341 341
352 424
495
389 434
351 385 405
805 852 1,167
1,740 1,573 1,521
2,505 2,701 2,899 2,9042,653 2,856
2,410
3,5913,166
3,6583,980
3,290
2,4432,835
2,182 2,1162,418
2004 2005 2006 2007 2008 2009 2010 2011 2012 2013* Nov-12 Dec-12 Jan-13 Feb-13 Mar-13 Apr-13 May-13 Jun-13 Jul-13 Aug-13 Sep-13 Oct-13 Nov-13
BRL Int. Rate (Thousands) FX (Thousands) Index (Thousands) Others (Thousands)
BM&F Segment Operational highlights
AVERAGE DAILY TRADED VOLUME – ADV (thousands of contracts)
REVENUE PER CONTRACT - RPC (BRL)
2006 2007 2008 2009 2010 2011 2012 2013* N-12 D-12 J-13 F-13 M-13 A-13 M-13 J-13 J-13 A-13 S-13 O-13 N-13
Interest rates in BRL 0,906 0,950 1,141 0,979 0,889 0,918 1,004 1,035 1,044 1,037 1,032 1,013 1,037 0,945 0,843 1,099 1,067 1,112 1,222 1,203 1,115
FX rates 2,244 1,859 2,065 2,161 1,928 1,894 2,205 2,511 2,370 2,453 2,368 2,305 2,273 2,292 2,347 2,590 2,691 2,731 2,720 2,624 2,611
Stock Indices 1,419 1,501 2,145 1,620 1,564 1,614 1,524 1,733 1,400 1,981 1,547 1,974 1,413 1,846 1,408 1,867 1,590 1,938 1,656 1,816 1,664
Interest rates in USD 1,094 0,965 1,283 1,357 1,142 0,941 1,015 1,220 1,164 1,152 1,073 1,140 1,121 1,093 0,928 1,280 1,370 1,309 1,412 1,246 1,359
Commodities 4,749 3,195 3,587 2,307 2,168 2,029 2,239 2,519 2,485 3,360 2,449 2,415 2,382 2,349 2,550 2,595 2,632 2,385 2,766 2,613 2,430
Mini contracts 0,034 0,054 0,162 0,176 0,128 0,129 0,116 0,119 0,107 0,112 0,120 0,122 0,119 0,118 0,116 0,119 0,114 0,117 0,126 0,120 0,120
OTC 1,571 2,111 2,355 1,655 1,610 1,635 1,769 1,458 1,711 2,475 1,988 2,868 1,642 1,460 1,428 1,418 1,839 1,160 1,477 1,118 1,266
Total RPC 1,247 1,224 1,527 1,365 1,134 1,106 1,191 1,263 1,242 1,303 1,266 1,191 1,190 1,114 1,020 1,361 1,320 1,397 1,511 1,418 1,367
*Updated to Nov. 30, 2013.
24
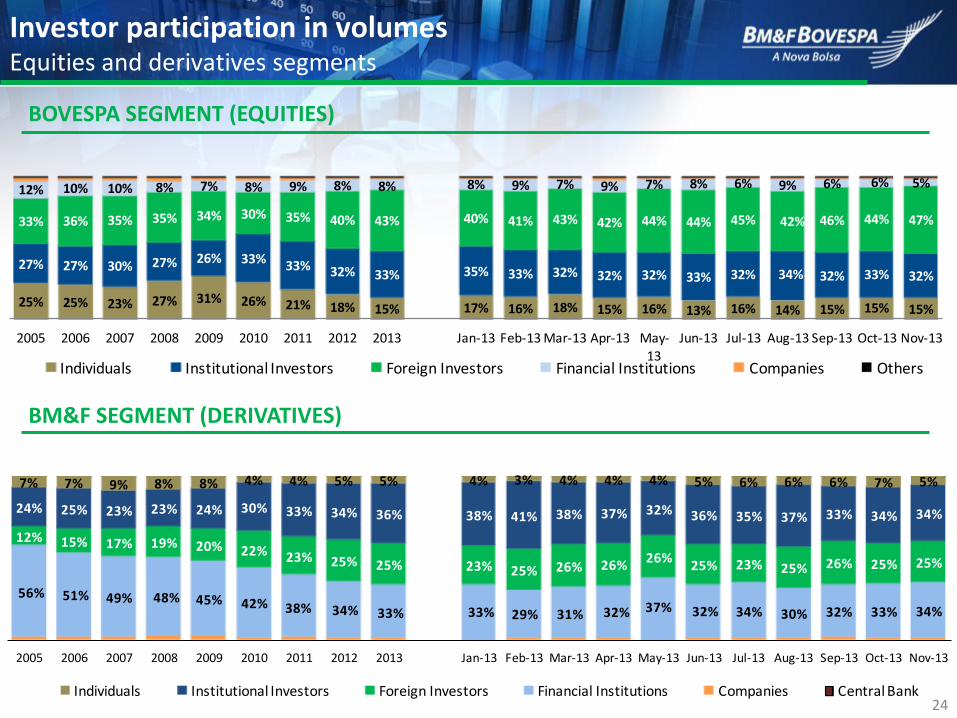
Investor participation in volumes Equities and derivatives segments
BM&F SEGMENT (DERIVATIVES)
BOVESPA SEGMENT (EQUITIES)
25% 25% 23% 27% 31% 26% 21% 18% 15% 17% 16% 18% 15% 16% 13% 16% 14% 15% 15% 15%
27% 27% 30% 27% 26% 33% 33% 32% 33% 35% 33% 32% 32% 32% 33% 32% 34% 32% 33% 32%
33% 36% 35% 35% 34% 30% 35% 40% 43% 40% 41% 43% 42% 44% 44% 45% 42% 46% 44% 47%
12% 10% 10% 8% 7% 8% 9% 8% 8% 8% 9% 7% 9% 7% 8% 6% 9% 6% 6% 5%
2005 2006 2007 2008 2009 2010 2011 2012 2013 Jan-13 Feb-13 Mar-13 Apr-13 May-13
Jun-13 Jul-13 Aug-13 Sep-13 Oct-13 Nov-13
Individuals Institutional Investors Foreign Investors Financial Institutions Companies Others
56% 51% 49% 48% 45% 42% 38% 34% 33% 33% 29% 31% 32% 37% 32% 34% 30% 32% 33% 34%
12% 15% 17% 19% 20% 22% 23% 25% 25% 23% 25% 26% 26%26%
25% 23% 25% 26% 25% 25%
24% 25% 23% 23% 24% 30% 33% 34% 36% 38% 41% 38% 37% 32% 36% 35% 37% 33% 34% 34%
7% 7% 9% 8% 8% 4% 4% 5% 5% 4% 3% 4% 4% 4% 5% 6% 6% 6% 7% 5%
2005 2006 2007 2008 2009 2010 2011 2012 2013 Jan-13 Feb-13 Mar-13 Apr-13 May-13 Jun-13 Jul-13 Aug-13 Sep-13 Oct-13 Nov-13
Individuals Institutional Investors Foreign Investors Financial Institutions Companies Central Bank
25
FINANCIAL HIGHLIGHTS Reduction in expenses. Return to shareholders
26
Income Statement History
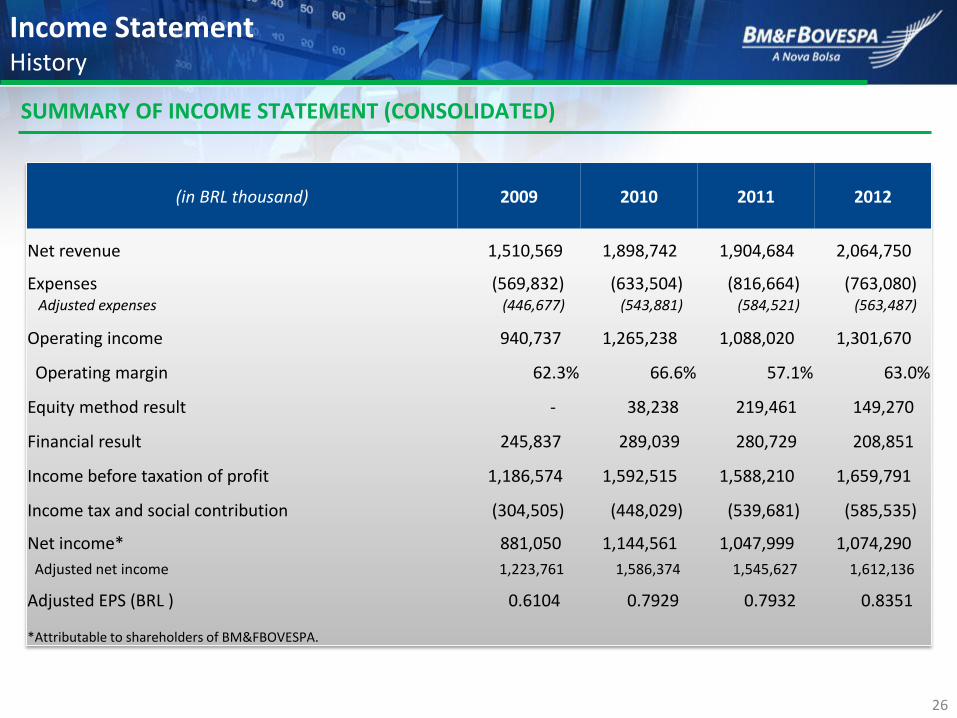
SUMMARY OF INCOME STATEMENT (CONSOLIDATED)
(in BRL thousand) 2009 2010 2011 2012
Net revenue 1,510,569 1,898,742 1,904,684 2,064,750
Expenses (569,832) (633,504) (816,664) (763,080) Adjusted expenses (446,677) (543,881) (584,521) (563,487)
Operating income 940,737 1,265,238 1,088,020 1,301,670
Operating margin 62.3% 66.6% 57.1% 63.0%
Equity method result - 38,238 219,461 149,270
Financial result 245,837 289,039 280,729 208,851
Income before taxation of profit 1,186,574 1,592,515 1,588,210 1,659,791
Income tax and social contribution (304,505) (448,029) (539,681) (585,535)
Net income* 881,050 1,144,561 1,047,999 1,074,290
Adjusted net income 1,223,761 1,586,374 1,545,627 1,612,136
Adjusted EPS (BRL ) 0.6104 0.7929 0.7932 0.8351
*Attributable to shareholders of BM&FBOVESPA.
27
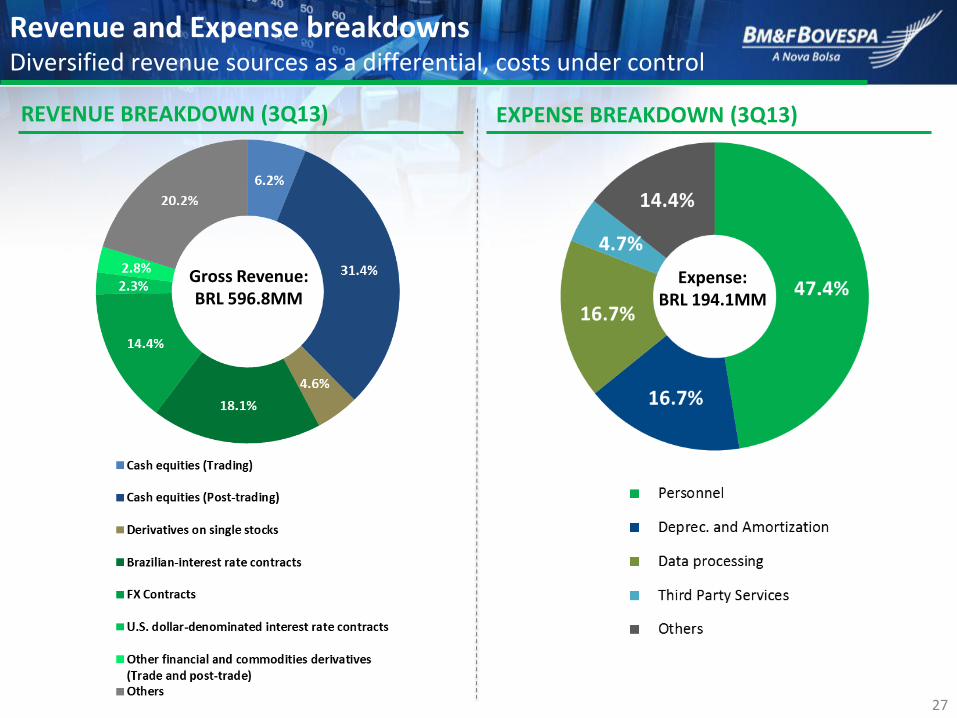
REVENUE BREAKDOWN (3Q13)
Gross Revenue: BRL 596.8MM
Revenue and Expense breakdowns Diversified revenue sources as a differential, costs under control
EXPENSE BREAKDOWN (3Q13)
Expense: BRL 194.1MM
28
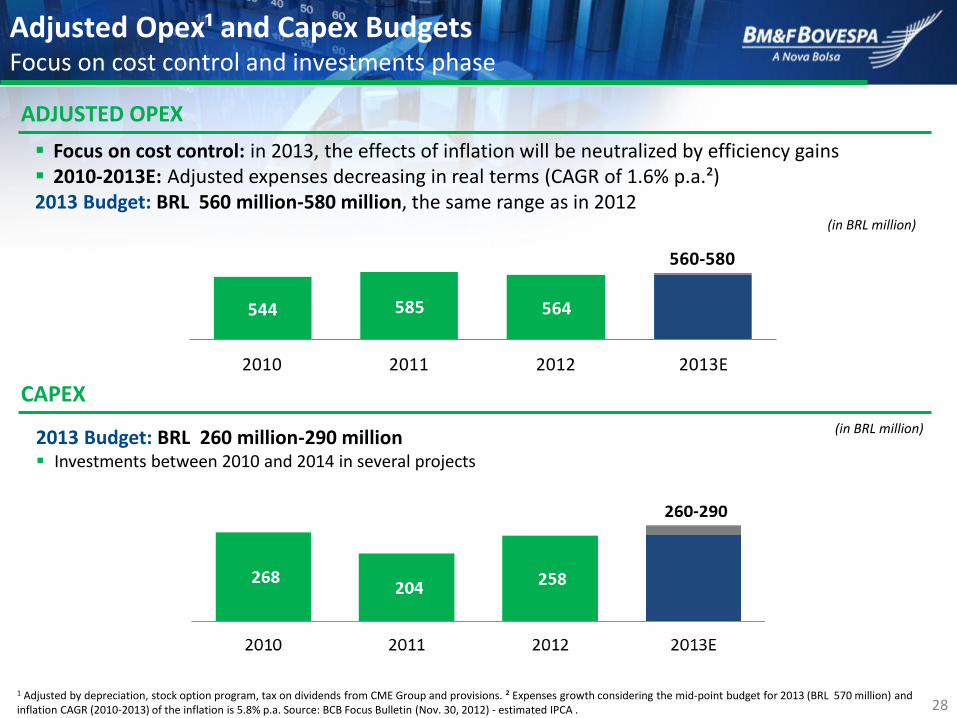
Adjusted Opex¹ and Capex Budgets Focus on cost control and investments phase
Focus on cost control: in 2013, the effects of inflation will be neutralized by efficiency gains 2010-2013E: Adjusted expenses decreasing in real terms (CAGR of 1.6% p.a.²) 2013 Budget: BRL 560 million-580 million, the same range as in 2012
1 Adjusted by depreciation, stock option program, tax on dividends from CME Group and provisions. ² Expenses growth considering the mid-point budget for 2013 (BRL 570 million) and inflation CAGR (2010-2013) of the inflation is 5.8% p.a. Source: BCB Focus Bulletin (Nov. 30, 2012) - estimated IPCA .
(in BRL million)
ADJUSTED OPEX
CAPEX
(in BRL million) 2013 Budget: BRL 260 million-290 million Investments between 2010 and 2014 in several projects
544 585 564
560-580
2010 2011 2012 2013E
29
(in BRL million)
(in BRL)
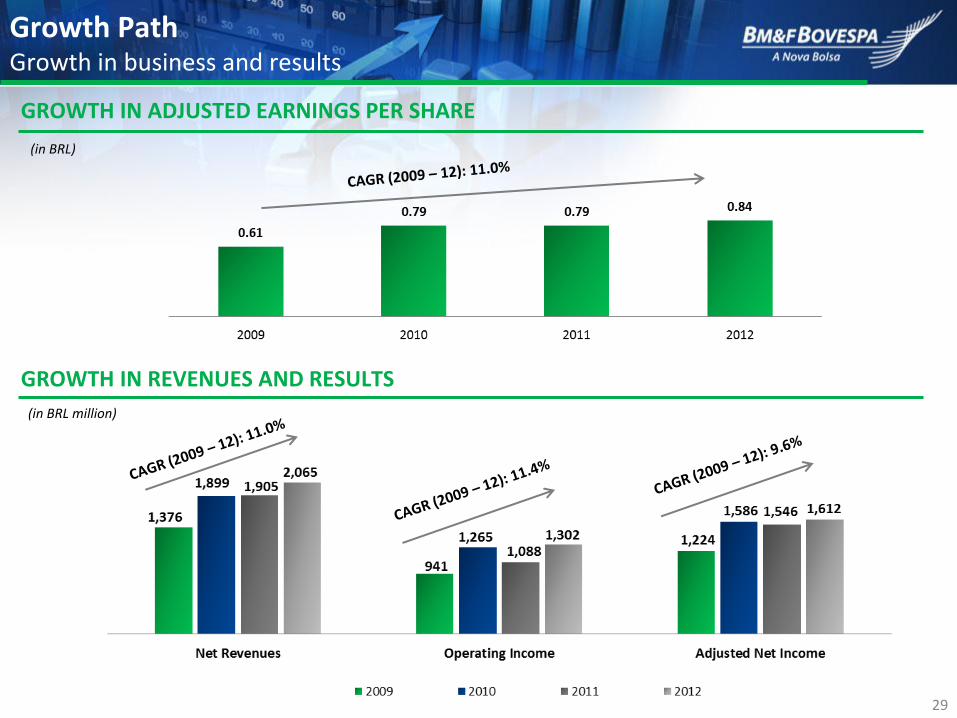
GROWTH IN ADJUSTED EARNINGS PER SHARE
GROWTH IN REVENUES AND RESULTS
Growth Path Growth in business and results
30
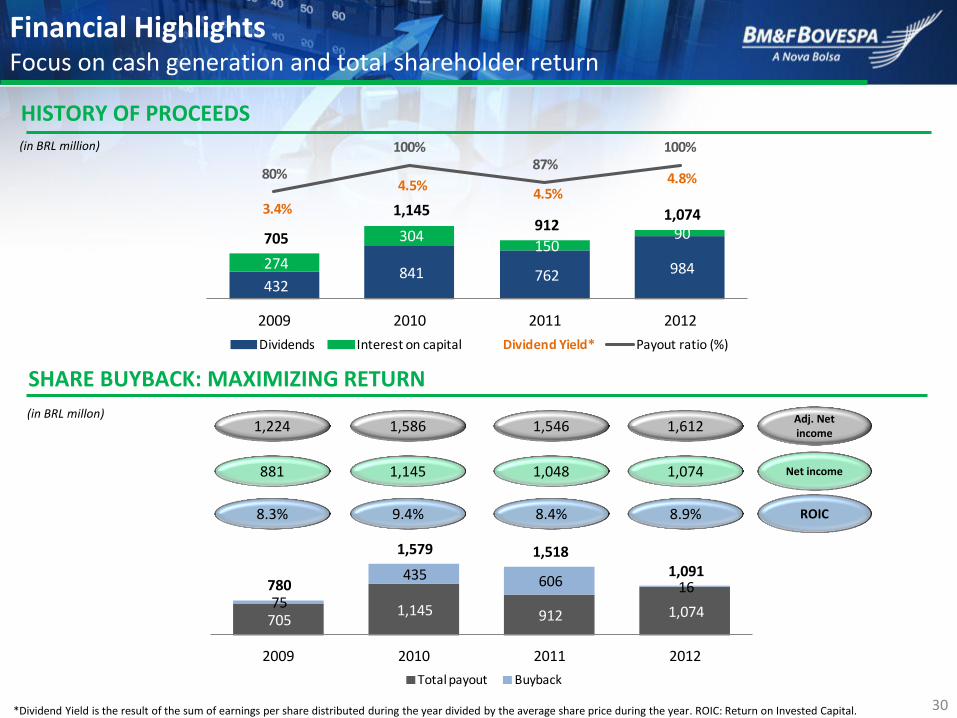
705 1,145 912 1,074
75
435 606 16 780
1,579 1,518 1,091
2009 2010 2011 2012
Total payout Buyback
Financial Highlights Focus on cash generation and total shareholder return
HISTORY OF PROCEEDS
SHARE BUYBACK: MAXIMIZING RETURN
(in BRL millon)
(in BRL million)
*Dividend Yield is the result of the sum of earnings per share distributed during the year divided by the average share price during the year. ROIC: Return on Invested Capital.
1,612 Adj. Net income 1,546 1,586 1,224
1,074 Net income 1,048 1,145 881
432 841 762 984 274
304 150
90 705
1,145 912
1,074 3.4%
4.5%4.5%
4.8%80%
100%87%
100%
2009 2010 2011 2012
Dividends Interest on capital Dividend Yield* Payout ratio (%)
8.9% ROIC 8.4% 9.4% 8.3%
31
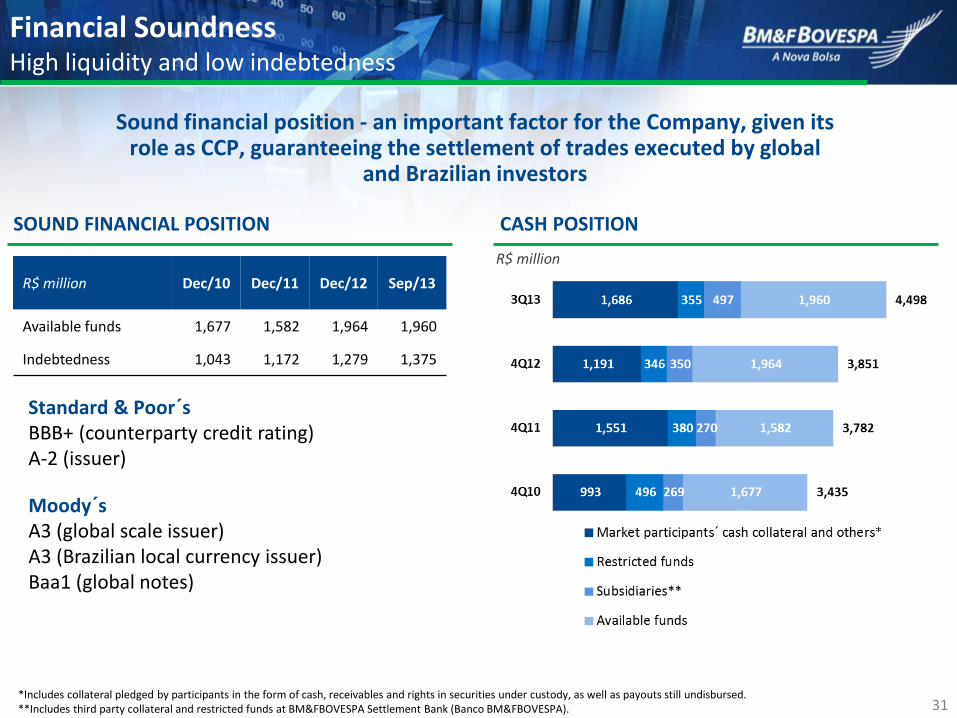
Sound financial position - an important factor for the Company, given its role as CCP, guaranteeing the settlement of trades executed by global
and Brazilian investors
Standard & Poor´s BBB+ (counterparty credit rating) A-2 (issuer) Moody´s A3 (global scale issuer) A3 (Brazilian local currency issuer) Baa1 (global notes)
R$ million Dec/10 Dec/11 Dec/12 Sep/13
Available funds 1,677 1,582 1,964 1,960
Indebtedness 1,043 1,172 1,279 1,375
R$ million
CASH POSITION SOUND FINANCIAL POSITION
*Includes collateral pledged by participants in the form of cash, receivables and rights in securities under custody, as well as payouts still undisbursed. **Includes third party collateral and restricted funds at BM&FBOVESPA Settlement Bank (Banco BM&FBOVESPA).
Financial Soundness High liquidity and low indebtedness
32
APPENDIX
33
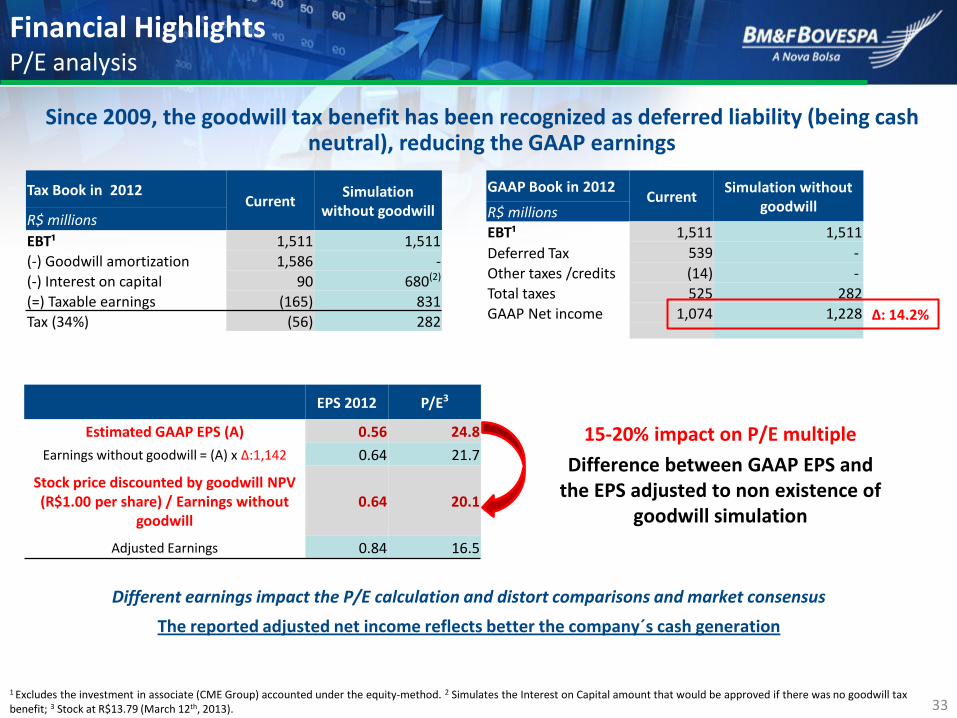
Different earnings impact the P/E calculation and distort comparisons and market consensus
The reported adjusted net income reflects better the company´s cash generation
1 Excludes the investment in associate (CME Group) accounted under the equity-method. 2 Simulates the Interest on Capital amount that would be approved if there was no goodwill tax benefit; 3 Stock at R$13.79 (March 12th, 2013).
EPS 2012 P/E3
Estimated GAAP EPS (A) 0.56 24.8
Earnings without goodwill = (A) x Δ:1,142 0.64 21.7
Stock price discounted by goodwill NPV (R$1.00 per share) / Earnings without
goodwill 0.64 20.1
Adjusted Earnings 0.84 16.5
15-20% impact on P/E multiple
Difference between GAAP EPS and the EPS adjusted to non existence of
goodwill simulation
GAAP Book in 2012 Current
Simulation without goodwill R$ millions
EBT¹ 1,511 1,511
Deferred Tax 539 -
Other taxes /credits (14) -
Total taxes 525 282
GAAP Net income 1,074 1,228
Δ: 14.2%
Tax Book in 2012 Current
Simulation without goodwill
R$ millions
EBT¹ 1,511 1,511
(-) Goodwill amortization 1,586 -
(-) Interest on capital 90 680(2)
(=) Taxable earnings (165) 831
Tax (34%) (56) 282
Since 2009, the goodwill tax benefit has been recognized as deferred liability (being cash neutral), reducing the GAAP earnings
Financial Highlights P/E analysis
34
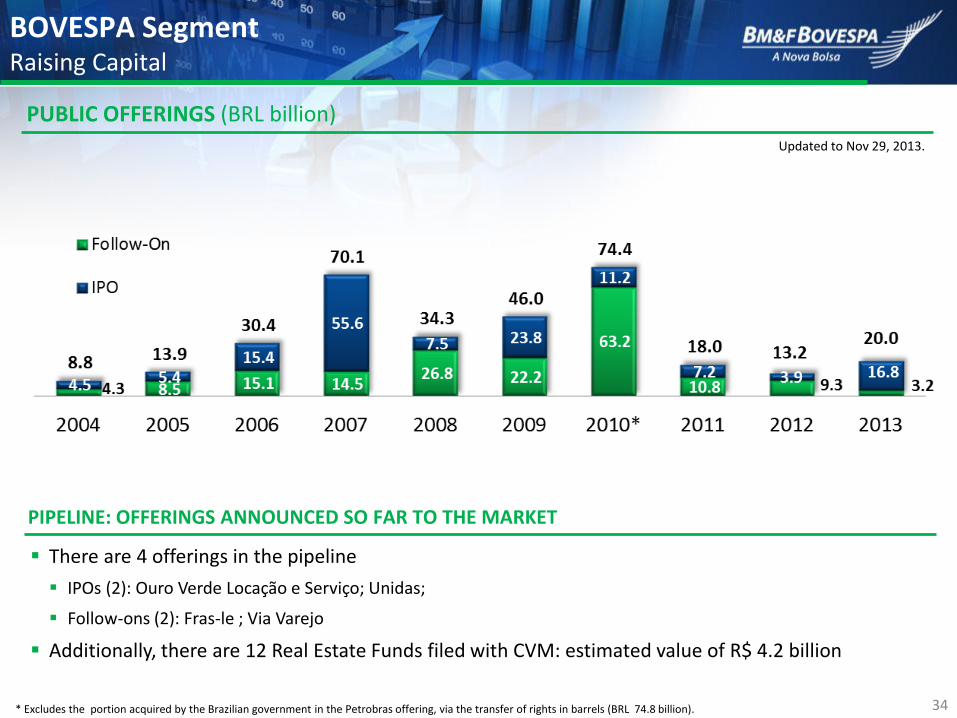
PUBLIC OFFERINGS (BRL billion)
PIPELINE: OFFERINGS ANNOUNCED SO FAR TO THE MARKET
Updated to Nov 29, 2013.
BOVESPA Segment Raising Capital
There are 4 offerings in the pipeline
IPOs (2): Ouro Verde Locação e Serviço; Unidas;
Follow-ons (2): Fras-le ; Via Varejo
Additionally, there are 12 Real Estate Funds filed with CVM: estimated value of R$ 4.2 billion
* Excludes the portion acquired by the Brazilian government in the Petrobras offering, via the transfer of rights in barrels (BRL 74.8 billion).
35
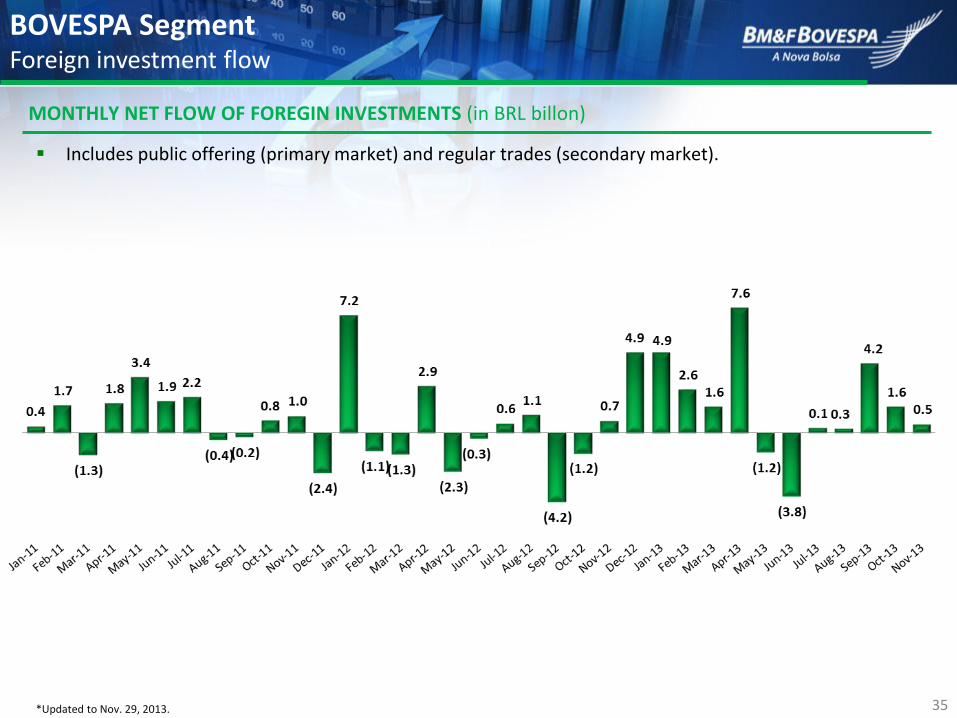
BOVESPA Segment Foreign investment flow
MONTHLY NET FLOW OF FOREGIN INVESTMENTS (in BRL billon)
Includes public offering (primary market) and regular trades (secondary market).
*Updated to Nov. 29, 2013.
36
177%
126% 121%
109%100%
136%
67%75%
87%72%
129%
100%
39%
174%
137%
158%
119%107%
129%
75% 76%
96%
72%
138%
80%
44%
129%
110% 109% 104%
89% 87%
60% 57% 55% 50% 49% 46%35%
151%
111% 117% 119%105%
85%
62%70% 69%
55%
124%
44% 45%
Cingapura Canadá Chile EUA Coréia Austrália Japão França Índia Brasil Inglaterra China México
2009 2010 2011 2012
11.2%
14.3%
2.2%
5.1%
20.4%
5.4%0.4%
5.5%
8.8%
26.8%
Oil, Gas and Biofuels Basic Materials Capital Goods and Services Construction and Transportation Consumer Non Cyclical Consumer Cyclical Information Technology Telecommunications Public Utilities Financial
15.7%
21.6%
2.5%3.6%
8.6%
2.6%
0.3%11.1%
11.5%
22.4%
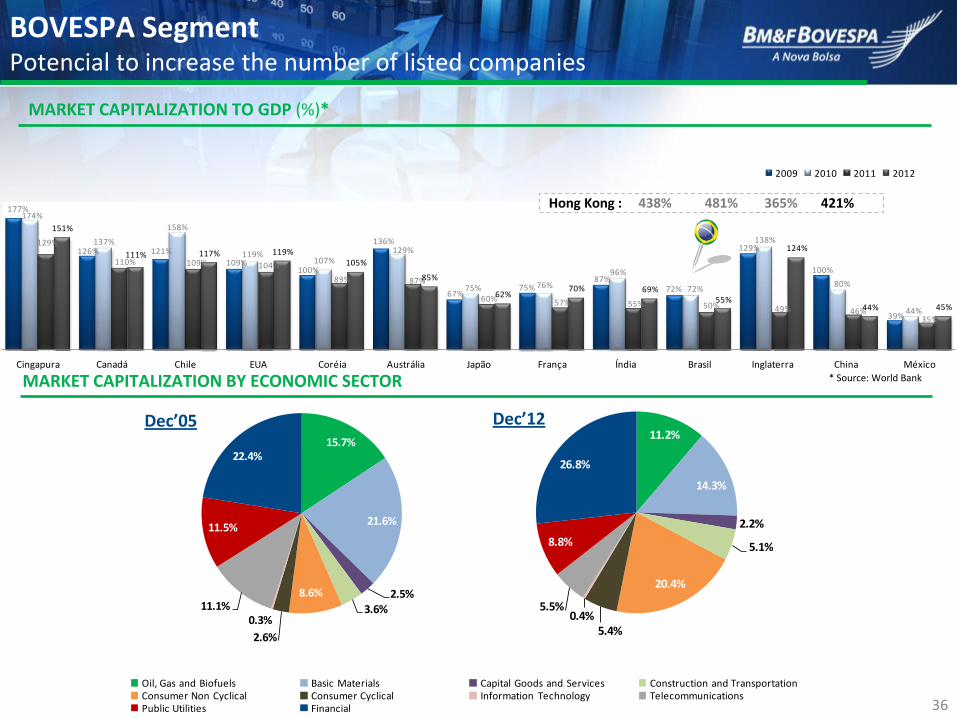
BOVESPA Segment Potencial to increase the number of listed companies
MARKET CAPITALIZATION TO GDP (%)*
MARKET CAPITALIZATION BY ECONOMIC SECTOR * Source: World Bank
Dec’05 Dec’12
Hong Kong : 438% 481% 365% 421%
37
84 95 179 146 135 193 209 209 191
270 251 245 67 101
148 120 129
137 74 45 53 78 97 92
44 45
68 51 47
65 58 53 48
70 61 52 211 251
420 342
413 404 342 307 292
418 409 388
3.9% 5.0%7.8% 7.3% 8.0%
6.3% 6.7% 5.7% 5.0% 6.0%8.7% 9.2%
1Q11 2Q11 3Q11 4Q11 1Q12 2Q12 3Q12 4Q12 1Q13 2Q13 3Q13 4Q13
Mini FX Equities Other % overall volume
319 447 835 917 874
1,186 1,044 830 927 876 1,160 1,277
291 267
319 249 325
268 252
233 296
256 207 171
205 184
175 146 -74
341 369
667 450 568
814 899
1,329 1,312 1,199 1,454 1,369 1,404
1,592 1,800 1,818
1,883 6.1% 7.4%10.3% 10.3%
8.5% 9.4% 9.8% 9.9% 10.6% 10.7%13.4%
15.2%
1Q11 2Q11 3Q11 4Q11 1Q12 2Q12 3Q12 4Q12 1Q13 2Q13 3Q13 4Q13
ADTV (Foreigners) ADTV (Individuals) ADTV (Institutionals) % of overall market
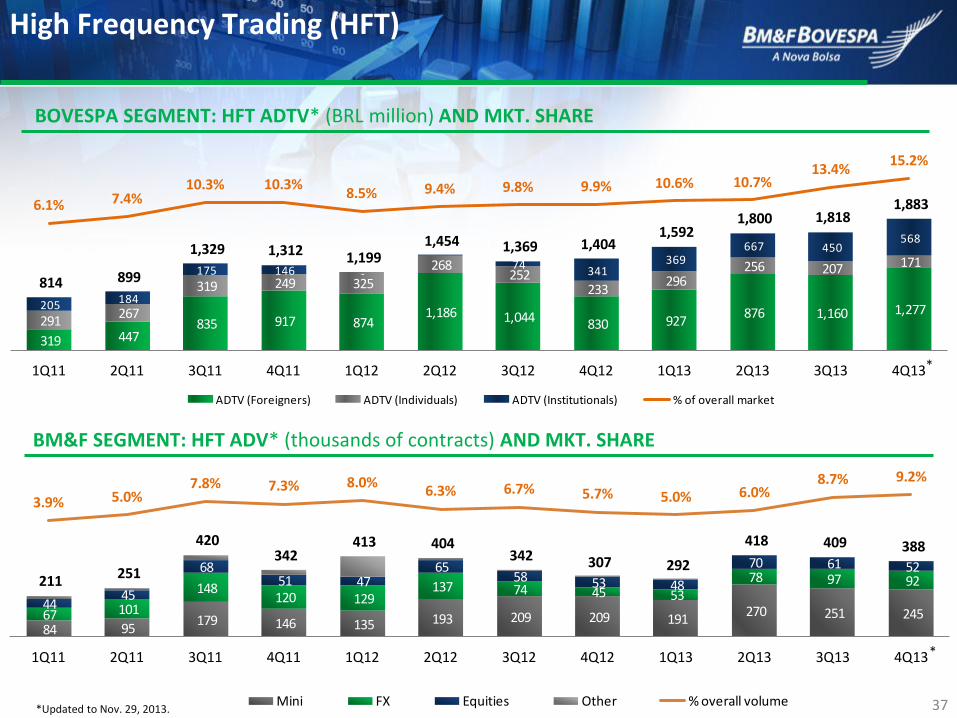
High Frequency Trading (HFT)
BOVESPA SEGMENT: HFT ADTV* (BRL million) AND MKT. SHARE
BM&F SEGMENT: HFT ADV* (thousands of contracts) AND MKT. SHARE
*
*
*Updated to Nov. 29, 2013.
38
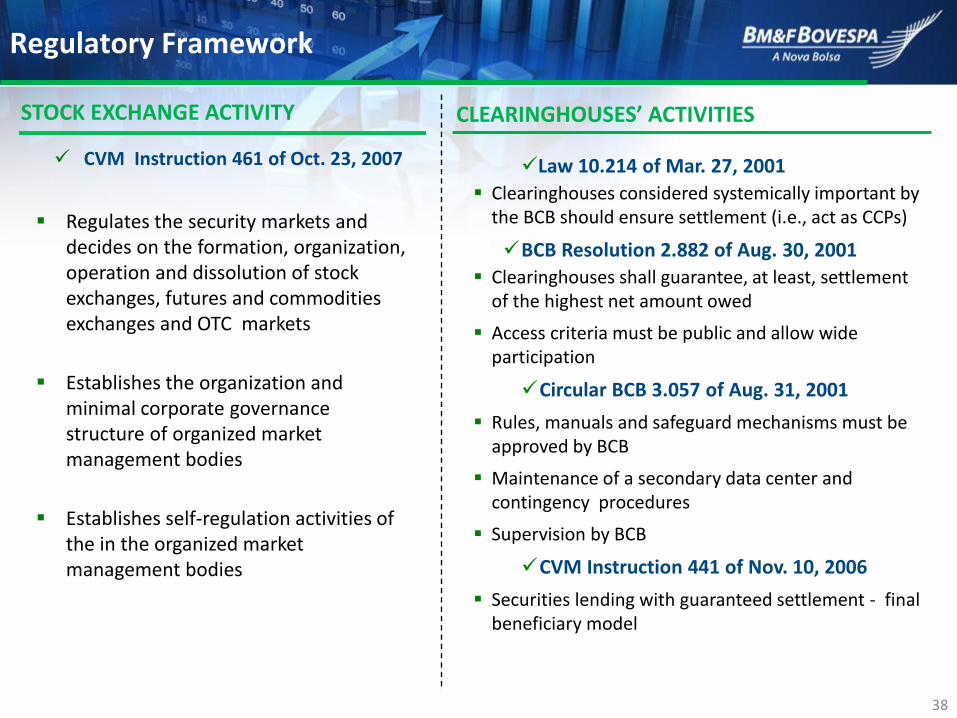
CLEARINGHOUSES’ ACTIVITIES
Law 10.214 of Mar. 27, 2001
Clearinghouses considered systemically important by the BCB should ensure settlement (i.e., act as CCPs)
BCB Resolution 2.882 of Aug. 30, 2001
Clearinghouses shall guarantee, at least, settlement of the highest net amount owed
Access criteria must be public and allow wide participation
Circular BCB 3.057 of Aug. 31, 2001
Rules, manuals and safeguard mechanisms must be approved by BCB
Maintenance of a secondary data center and contingency procedures
Supervision by BCB
CVM Instruction 441 of Nov. 10, 2006
Securities lending with guaranteed settlement - final beneficiary model
STOCK EXCHANGE ACTIVITY
CVM Instruction 461 of Oct. 23, 2007
Regulates the security markets and decides on the formation, organization, operation and dissolution of stock exchanges, futures and commodities exchanges and OTC markets
Establishes the organization and minimal corporate governance structure of organized market management bodies
Establishes self-regulation activities of the in the organized market management bodies
Regulatory Framework
39
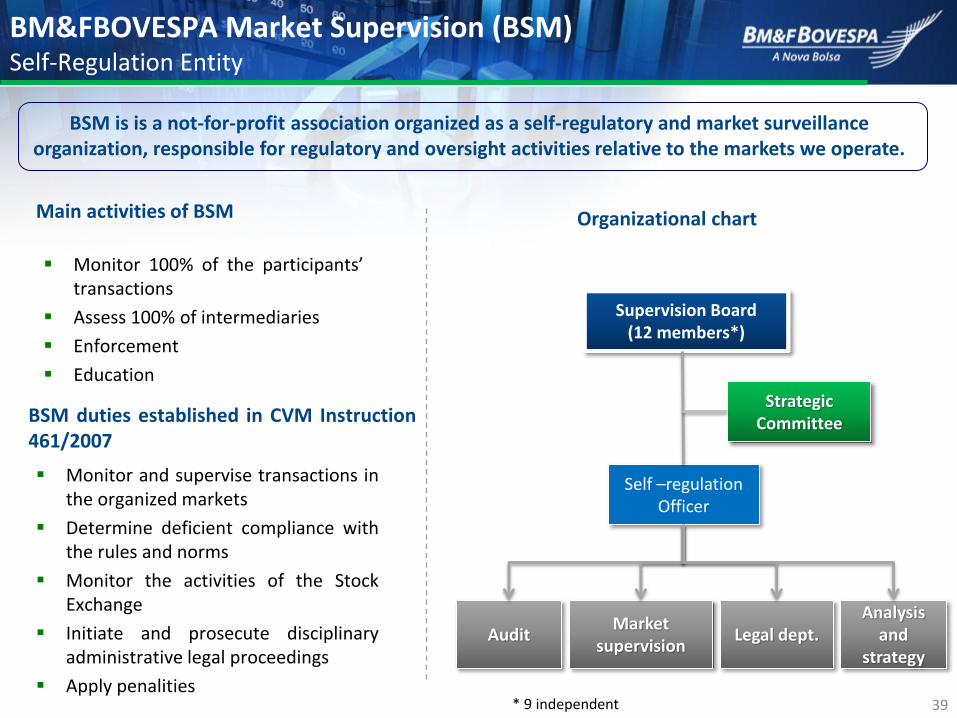
Audit Market
supervision
Analysis and
strategy Legal dept.
Self –regulation Officer
Supervision Board (12 members*)
Strategic Committee
• Atribuições da BSM estabelecidas na Instrução CVM 461/2007:
Monitor and supervise transactions in the organized markets
Determine deficient compliance with the rules and norms
Monitor the activities of the Stock Exchange
Initiate and prosecute disciplinary administrative legal proceedings
Apply penalities
Main activities of BSM Organizational chart
Monitor 100% of the participants’ transactions
Assess 100% of intermediaries
Enforcement
Education
BSM duties established in CVM Instruction 461/2007
BSM is is a not-for-profit association organized as a self-regulatory and market surveillance organization, responsible for regulatory and oversight activities relative to the markets we operate.
* 9 independent
BM&FBOVESPA Market Supervision (BSM) Self-Regulation Entity
40
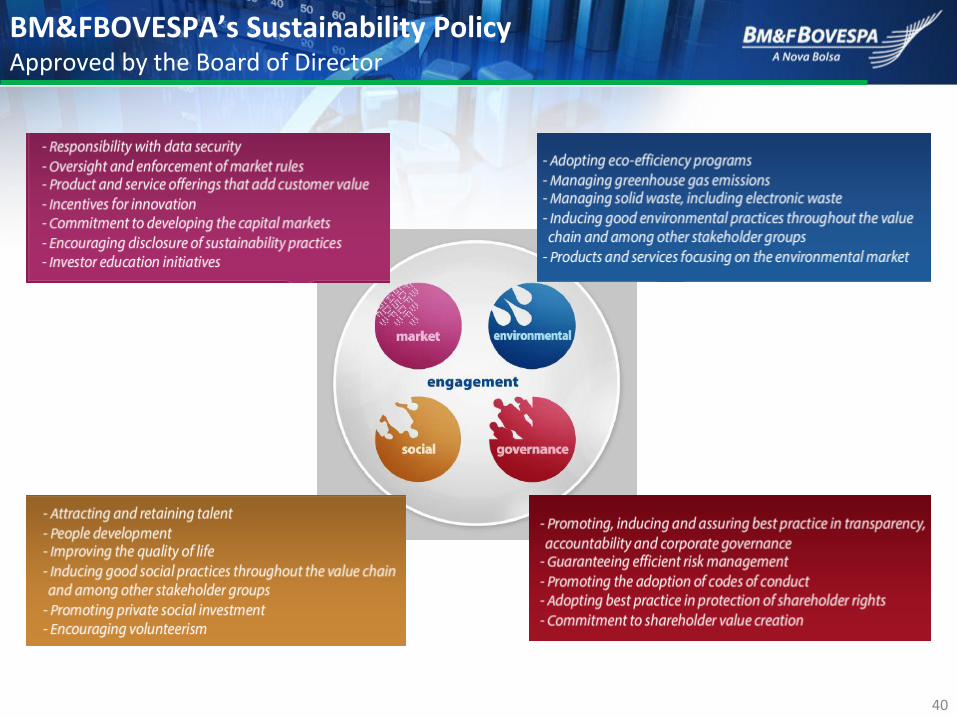
BM&FBOVESPA’s Sustainability Policy Approved by the Board of Director
41
RESULTS FOR 3Q13
42
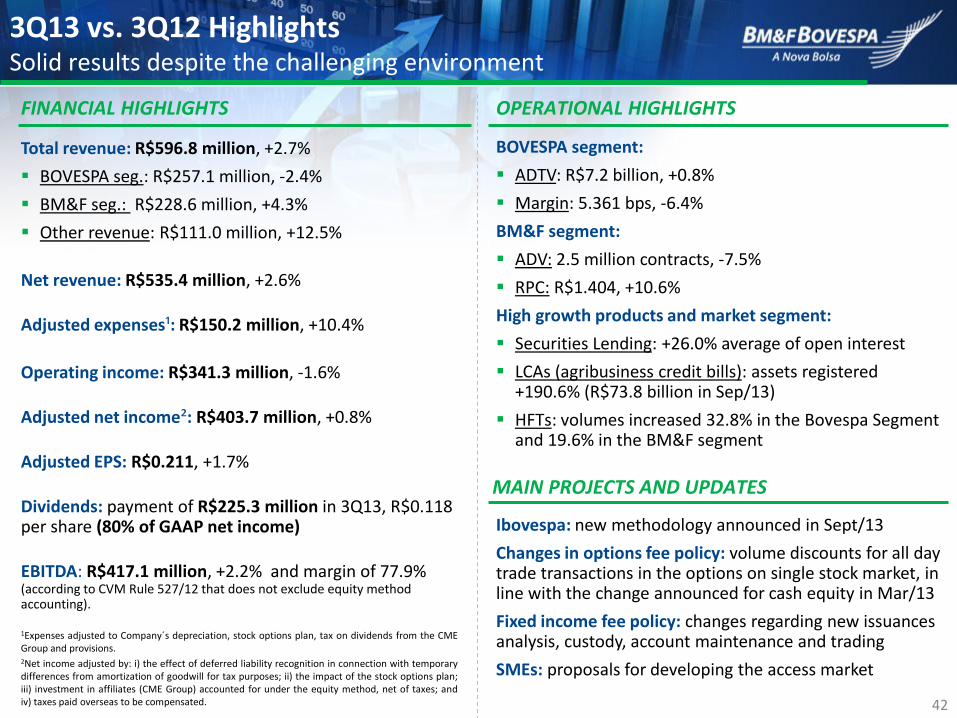
Total revenue: R$596.8 million, +2.7%
BOVESPA seg.: R$257.1 million, -2.4%
BM&F seg.: R$228.6 million, +4.3%
Other revenue: R$111.0 million, +12.5%
Net revenue: R$535.4 million, +2.6%
Adjusted expenses¹: R$150.2 million, +10.4%
Operating income: R$341.3 million, -1.6%
Adjusted net income²: R$403.7 million, +0.8%
Adjusted EPS: R$0.211, +1.7%
Dividends: payment of R$225.3 million in 3Q13, R$0.118 per share (80% of GAAP net income)
EBITDA: R$417.1 million, +2.2% and margin of 77.9% (according to CVM Rule 527/12 that does not exclude equity method accounting).
BOVESPA segment:
ADTV: R$7.2 billion, +0.8%
Margin: 5.361 bps, -6.4%
BM&F segment:
ADV: 2.5 million contracts, -7.5%
RPC: R$1.404, +10.6%
High growth products and market segment:
Securities Lending: +26.0% average of open interest
LCAs (agribusiness credit bills): assets registered +190.6% (R$73.8 billion in Sep/13)
HFTs: volumes increased 32.8% in the Bovespa Segment and 19.6% in the BM&F segment
MAIN PROJECTS AND UPDATES
3Q13 vs. 3Q12 Highlights Solid results despite the challenging environment
FINANCIAL HIGHLIGHTS OPERATIONAL HIGHLIGHTS
1Expenses adjusted to Company´s depreciation, stock options plan, tax on dividends from the CME Group and provisions. 2Net income adjusted by: i) the effect of deferred liability recognition in connection with temporary differences from amortization of goodwill for tax purposes; ii) the impact of the stock options plan; iii) investment in affiliates (CME Group) accounted for under the equity method, net of taxes; and iv) taxes paid overseas to be compensated.
Ibovespa: new methodology announced in Sept/13
Changes in options fee policy: volume discounts for all day trade transactions in the options on single stock market, in line with the change announced for cash equity in Mar/13
Fixed income fee policy: changes regarding new issuances analysis, custody, account maintenance and trading
SMEs: proposals for developing the access market
43
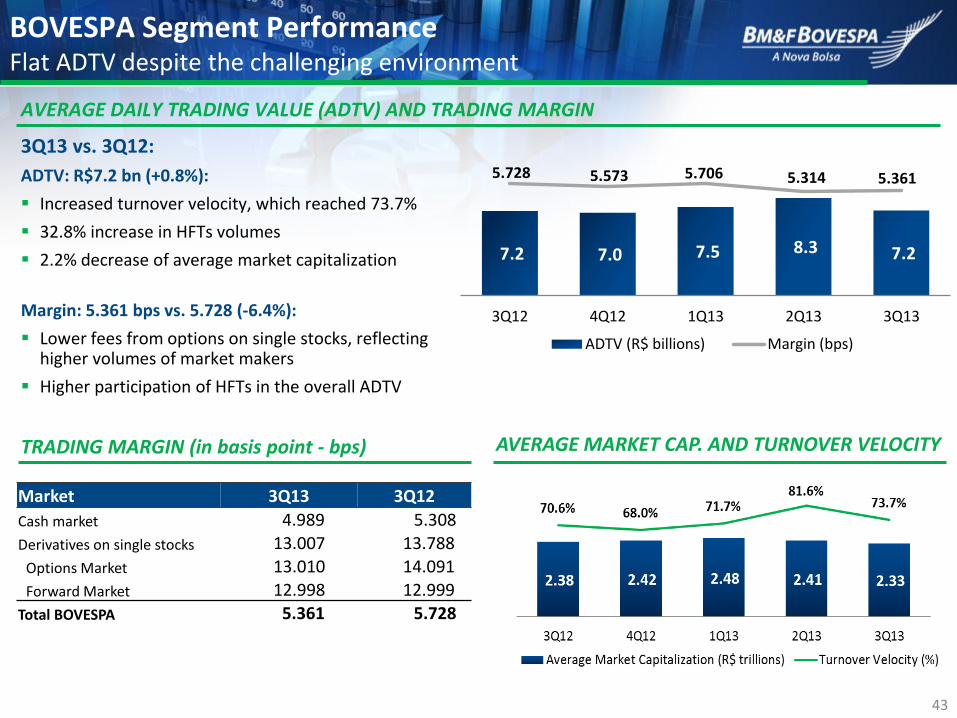
3Q13 vs. 3Q12:
ADTV: R$7.2 bn (+0.8%):
Increased turnover velocity, which reached 73.7%
32.8% increase in HFTs volumes
2.2% decrease of average market capitalization
Margin: 5.361 bps vs. 5.728 (-6.4%):
Lower fees from options on single stocks, reflecting higher volumes of market makers
Higher participation of HFTs in the overall ADTV
AVERAGE DAILY TRADING VALUE (ADTV) AND TRADING MARGIN
BOVESPA Segment Performance Flat ADTV despite the challenging environment
AVERAGE MARKET CAP. AND TURNOVER VELOCITY
7.2 7.0 7.5 8.3 7.2
5.728 5.573 5.706 5.314 5.361
3Q12 4Q12 1Q13 2Q13 3Q13
ADTV (R$ billions) Margin (bps)
TRADING MARGIN (in basis point - bps)
Market 3Q13 3Q12
Cash market 4.989 5.308
Derivatives on single stocks 13.007 13.788
Options Market 13.010 14.091
Forward Market 12.998 12.999
Total BOVESPA 5.361 5.728
44
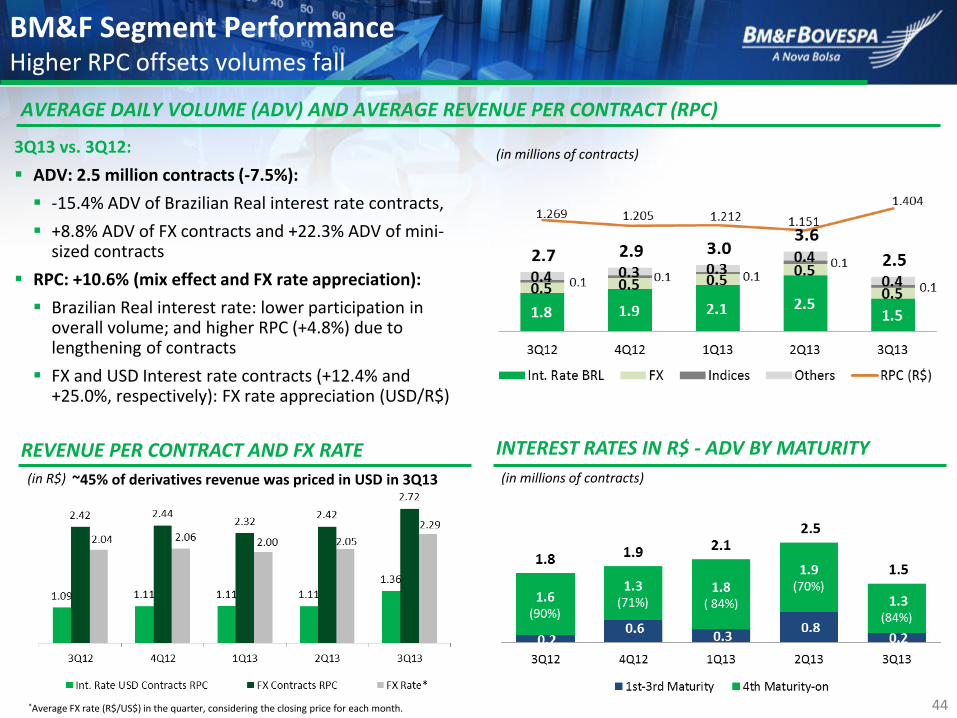
3Q13 vs. 3Q12:
ADV: 2.5 million contracts (-7.5%):
-15.4% ADV of Brazilian Real interest rate contracts,
+8.8% ADV of FX contracts and +22.3% ADV of mini-sized contracts
RPC: +10.6% (mix effect and FX rate appreciation):
Brazilian Real interest rate: lower participation in overall volume; and higher RPC (+4.8%) due to lengthening of contracts
FX and USD Interest rate contracts (+12.4% and +25.0%, respectively): FX rate appreciation (USD/R$)
AVERAGE DAILY VOLUME (ADV) AND AVERAGE REVENUE PER CONTRACT (RPC)
BM&F Segment Performance Higher RPC offsets volumes fall
INTEREST RATES IN R$ - ADV BY MATURITY
(in millions of contracts)
(in millions of contracts)
REVENUE PER CONTRACT AND FX RATE (in R$) ~45% of derivatives revenue was priced in USD in 3Q13
*Average FX rate (R$/US$) in the quarter, considering the closing price for each month.
45
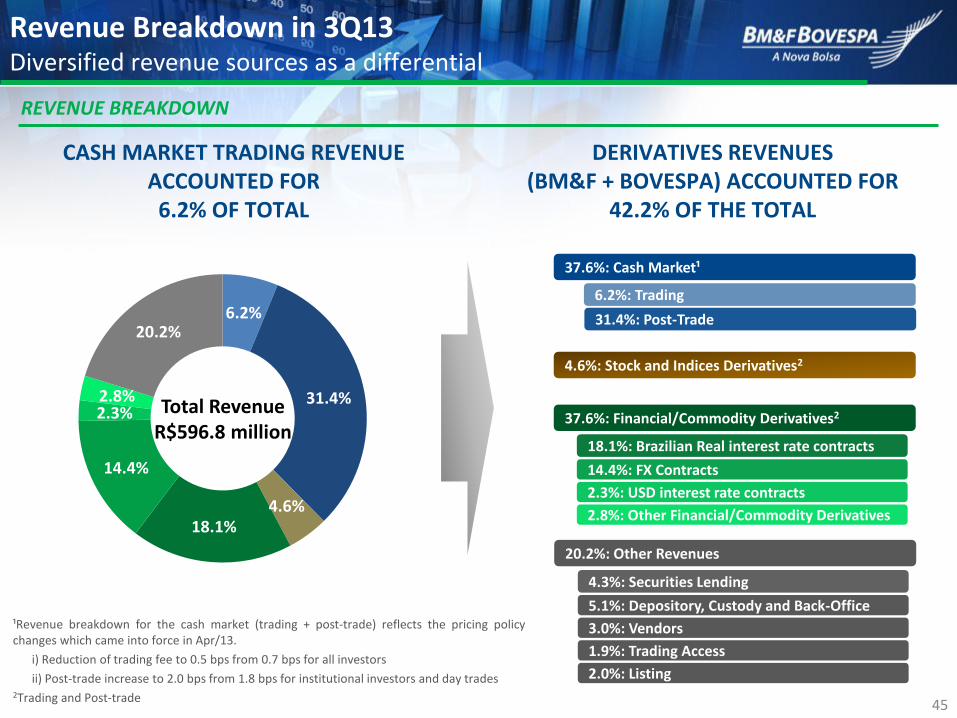
6.2%
31.4%
4.6%18.1%
14.4%
2.3%2.8%
20.2%
37.6%: Financial/Commodity Derivatives2
37.6%: Cash Market¹
6.2%: Trading
31.4%: Post-Trade
4.6%: Stock and Indices Derivatives2
Total Revenue R$596.8 million
4.3%: Securities Lending
5.1%: Depository, Custody and Back-Office
3.0%: Vendors
1.9%: Trading Access
2.0%: Listing
20.2%: Other Revenues
Revenue Breakdown in 3Q13 Diversified revenue sources as a differential
REVENUE BREAKDOWN
¹Revenue breakdown for the cash market (trading + post-trade) reflects the pricing policy changes which came into force in Apr/13.
i) Reduction of trading fee to 0.5 bps from 0.7 bps for all investors
ii) Post-trade increase to 2.0 bps from 1.8 bps for institutional investors and day trades 2Trading and Post-trade
CASH MARKET TRADING REVENUE ACCOUNTED FOR 6.2% OF TOTAL
DERIVATIVES REVENUES (BM&F + BOVESPA) ACCOUNTED FOR
42.2% OF THE TOTAL
18.1%: Brazilian Real interest rate contracts
14.4%: FX Contracts
2.3%: USD interest rate contracts
2.8%: Other Financial/Commodity Derivatives
46
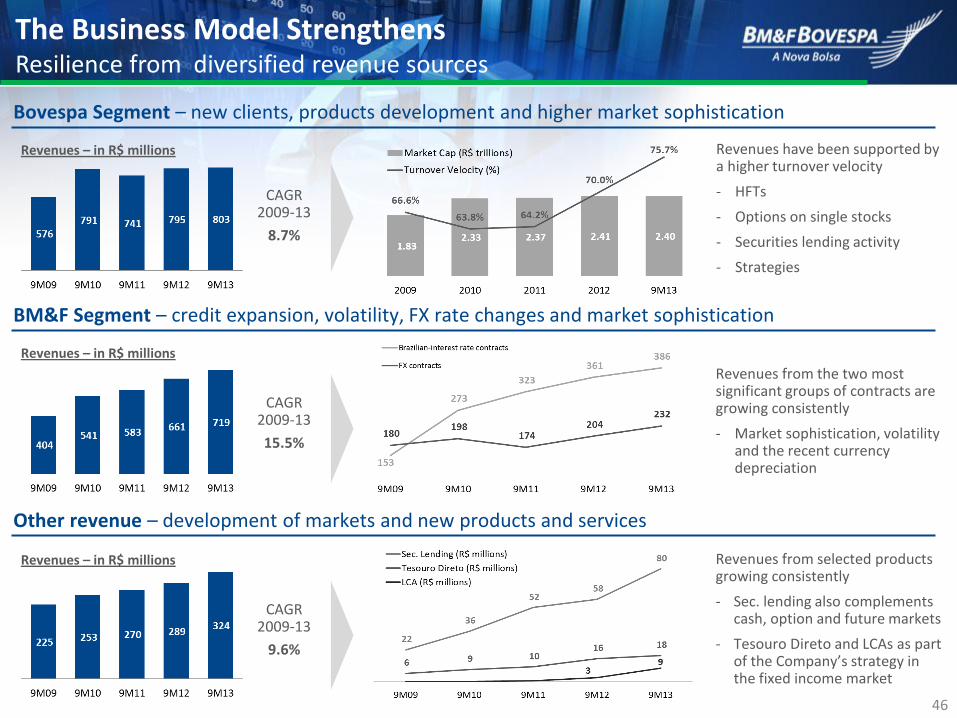
The Business Model Strengthens Resilience from diversified revenue sources
Bovespa Segment – new clients, products development and higher market sophistication
BM&F Segment – credit expansion, volatility, FX rate changes and market sophistication
Other revenue – development of markets and new products and services
CAGR 2009-13
8.7%
Revenues – in R$ millions
Revenues – in R$ millions
CAGR 2009-13
15.5%
CAGR 2009-13
9.6%
Revenues – in R$ millions Revenues have been supported by a higher turnover velocity
- HFTs
- Options on single stocks
- Securities lending activity
- Strategies
Revenues from the two most significant groups of contracts are growing consistently
- Market sophistication, volatility and the recent currency depreciation
Revenues from selected products growing consistently
- Sec. lending also complements cash, option and future markets
- Tesouro Direto and LCAs as part of the Company’s strategy in the fixed income market
47
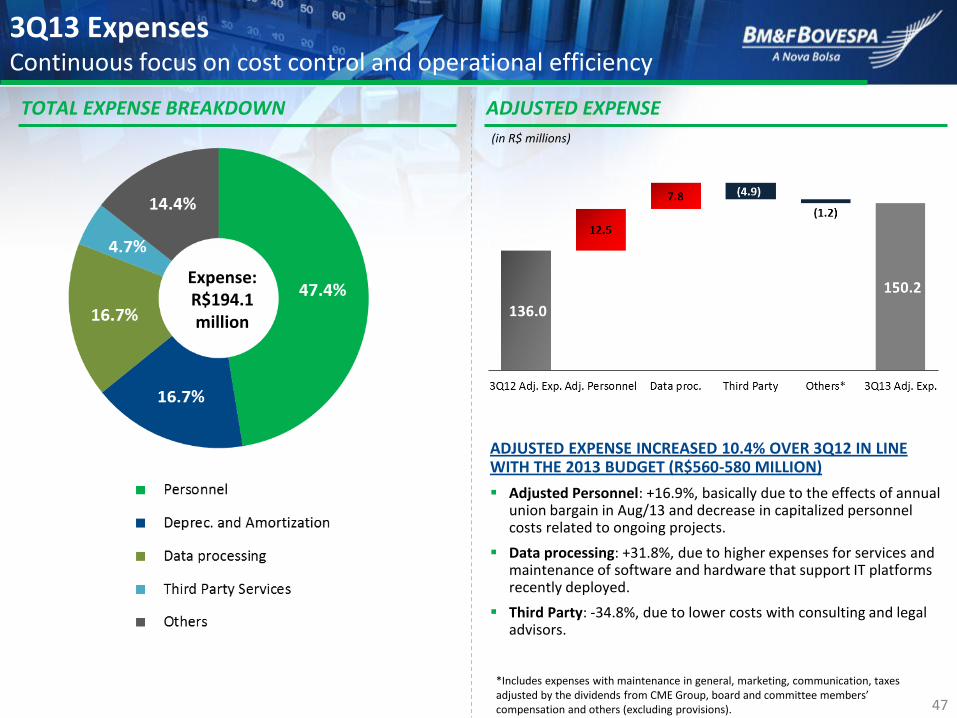
Expense: R$194.1 million
3Q13 Expenses Continuous focus on cost control and operational efficiency
ADJUSTED EXPENSE TOTAL EXPENSE BREAKDOWN
(in R$ millions)
*Includes expenses with maintenance in general, marketing, communication, taxes adjusted by the dividends from CME Group, board and committee members’ compensation and others (excluding provisions).
ADJUSTED EXPENSE INCREASED 10.4% OVER 3Q12 IN LINE WITH THE 2013 BUDGET (R$560-580 MILLION)
Adjusted Personnel: +16.9%, basically due to the effects of annual union bargain in Aug/13 and decrease in capitalized personnel costs related to ongoing projects.
Data processing: +31.8%, due to higher expenses for services and maintenance of software and hardware that support IT platforms recently deployed.
Third Party: -34.8%, due to lower costs with consulting and legal advisors.
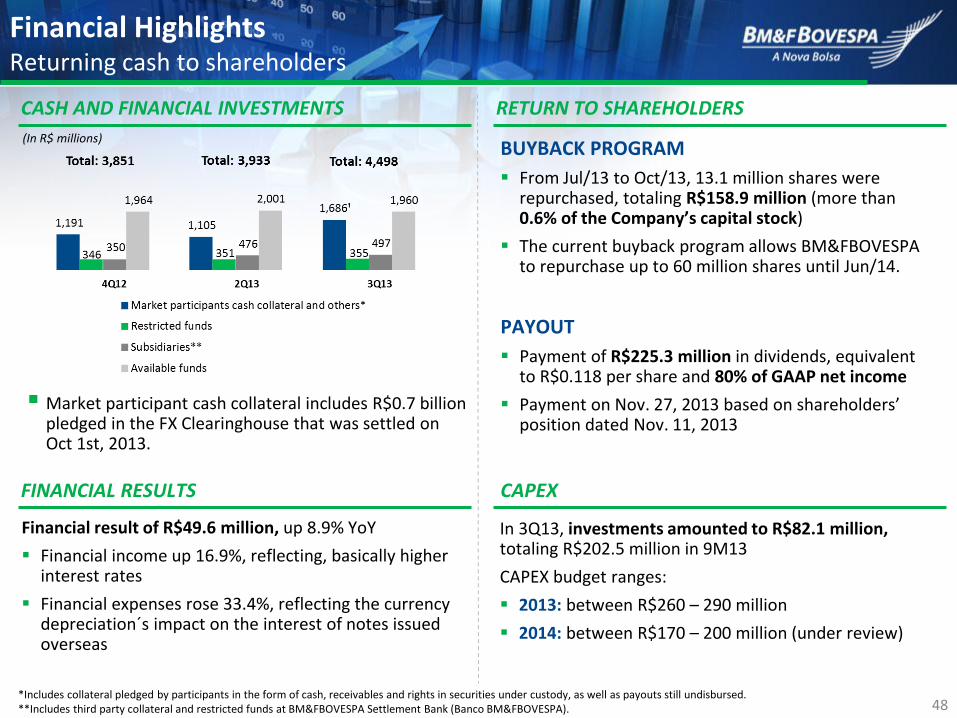
48 *Includes collateral pledged by participants in the form of cash, receivables and rights in securities under custody, as well as payouts still undisbursed. **Includes third party collateral and restricted funds at BM&FBOVESPA Settlement Bank (Banco BM&FBOVESPA).
Financial Highlights Returning cash to shareholders
(In R$ millions)
CASH AND FINANCIAL INVESTMENTS RETURN TO SHAREHOLDERS
FINANCIAL RESULTS
Financial result of R$49.6 million, up 8.9% YoY
Financial income up 16.9%, reflecting, basically higher interest rates
Financial expenses rose 33.4%, reflecting the currency depreciation´s impact on the interest of notes issued overseas
CAPEX
In 3Q13, investments amounted to R$82.1 million, totaling R$202.5 million in 9M13
CAPEX budget ranges:
2013: between R$260 – 290 million
2014: between R$170 – 200 million (under review)
BUYBACK PROGRAM
From Jul/13 to Oct/13, 13.1 million shares were repurchased, totaling R$158.9 million (more than 0.6% of the Company’s capital stock)
The current buyback program allows BM&FBOVESPA to repurchase up to 60 million shares until Jun/14.
PAYOUT
Payment of R$225.3 million in dividends, equivalent to R$0.118 per share and 80% of GAAP net income
Payment on Nov. 27, 2013 based on shareholders’ position dated Nov. 11, 2013
Market participant cash collateral includes R$0.7 billion pledged in the FX Clearinghouse that was settled on Oct 1st, 2013.
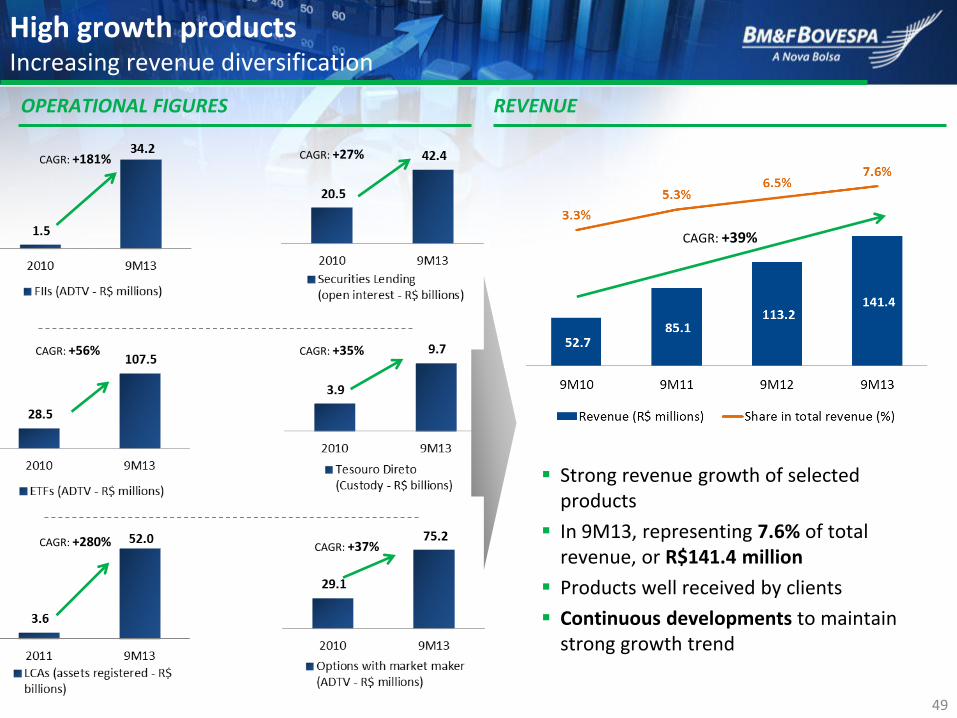
49
High growth products Increasing revenue diversification
CAGR: +39%
OPERATIONAL FIGURES REVENUE
CAGR: +181% CAGR: +27%
CAGR: +56% CAGR: +35%
CAGR: +280% CAGR: +37%
Strong revenue growth of selected products
In 9M13, representing 7.6% of total revenue, or R$141.4 million
Products well received by clients
Continuous developments to maintain strong growth trend
50
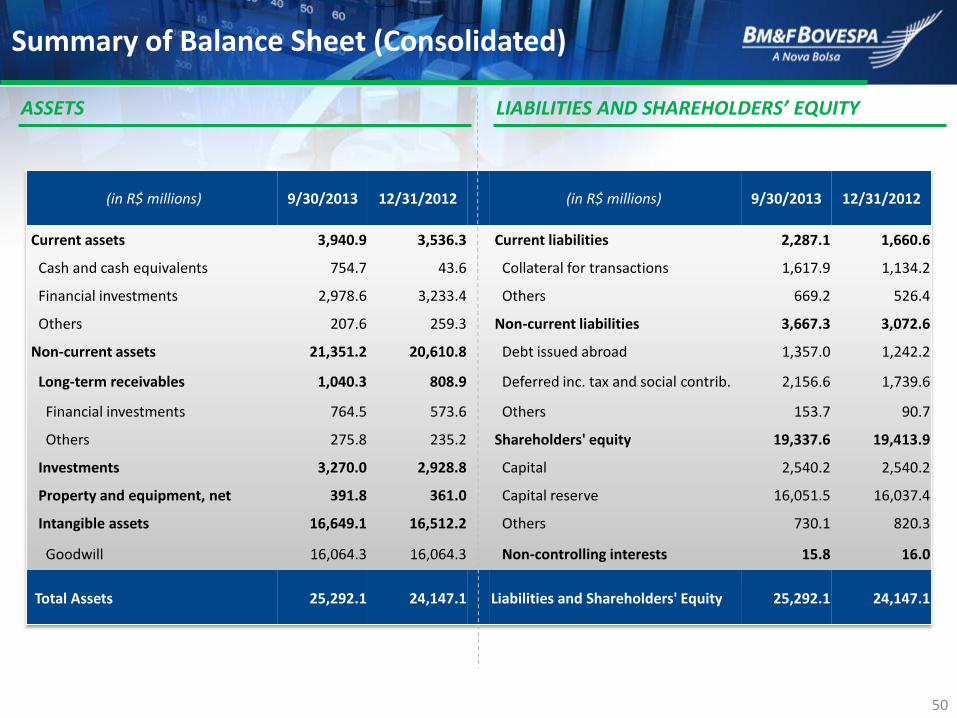
Summary of Balance Sheet (Consolidated)
LIABILITIES AND SHAREHOLDERS’ EQUITY ASSETS
(in R$ millions) 9/30/2013 12/31/2012 (in R$ millions) 9/30/2013 12/31/2012
Current assets 3,940.9 3,536.3 Current liabilities 2,287.1 1,660.6
Cash and cash equivalents 754.7 43.6 Collateral for transactions 1,617.9 1,134.2
Financial investments 2,978.6 3,233.4 Others 669.2 526.4
Others 207.6 259.3 Non-current liabilities 3,667.3 3,072.6
Non-current assets 21,351.2 20,610.8 Debt issued abroad 1,357.0 1,242.2
Long-term receivables 1,040.3 808.9 Deferred inc. tax and social contrib. 2,156.6 1,739.6
Financial investments 764.5 573.6 Others 153.7 90.7
Others 275.8 235.2 Shareholders' equity 19,337.6 19,413.9
Investments 3,270.0 2,928.8 Capital 2,540.2 2,540.2
Property and equipment, net 391.8 361.0 Capital reserve 16,051.5 16,037.4
Intangible assets 16,649.1 16,512.2 Others 730.1 820.3
Goodwill 16,064.3 16,064.3 Non-controlling interests 15.8 16.0
Total Assets 25,292.1 24,147.1 Liabilities and Shareholders' Equity 25,292.1 24,147.1
51
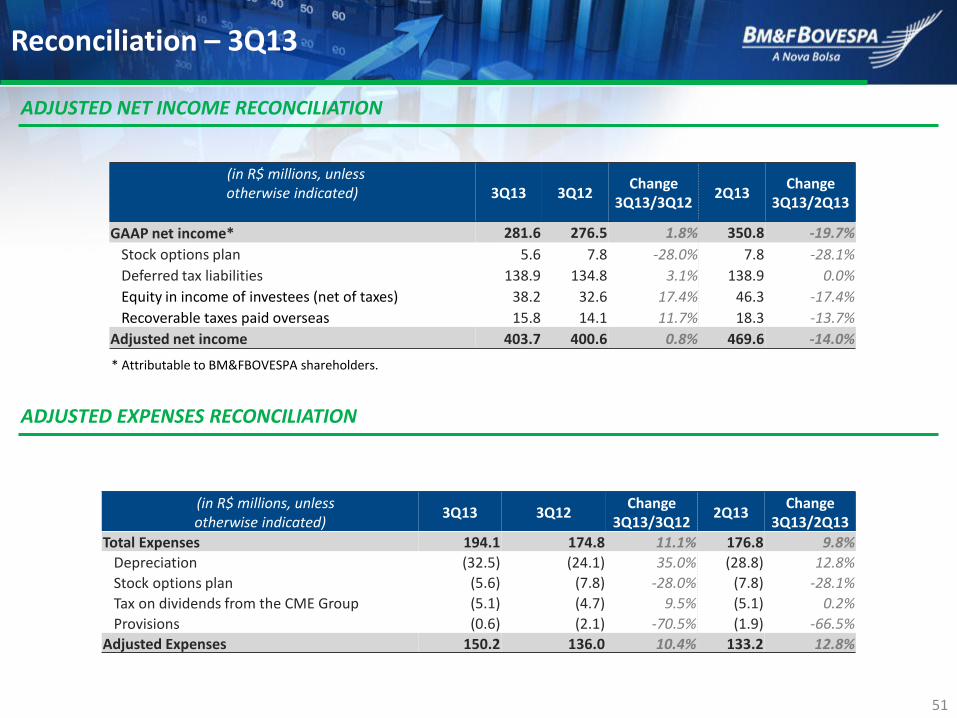
Reconciliation – 3Q13
ADJUSTED NET INCOME RECONCILIATION
ADJUSTED EXPENSES RECONCILIATION
* Attributable to BM&FBOVESPA shareholders.
(in R$ millions, unless otherwise indicated)
3Q13 3Q12
Change 3Q13/3Q12
2Q13 Change
3Q13/2Q13
GAAP net income* 281.6 276.5 1.8% 350.8 -19.7%
Stock options plan 5.6 7.8 -28.0% 7.8 -28.1%
Deferred tax liabilities 138.9 134.8 3.1% 138.9 0.0%
Equity in income of investees (net of taxes) 38.2 32.6 17.4% 46.3 -17.4%
Recoverable taxes paid overseas 15.8 14.1 11.7% 18.3 -13.7%
Adjusted net income 403.7 400.6 0.8% 469.6 -14.0%
(in R$ millions, unless otherwise indicated)
3Q13 3Q12 Change
3Q13/3Q12 2Q13
Change 3Q13/2Q13
Total Expenses 194.1 174.8 11.1% 176.8 9.8%
Depreciation (32.5) (24.1) 35.0% (28.8) 12.8%
Stock options plan (5.6) (7.8) -28.0% (7.8) -28.1%
Tax on dividends from the CME Group (5.1) (4.7) 9.5% (5.1) 0.2%
Provisions (0.6) (2.1) -70.5% (1.9) -66.5%
Adjusted Expenses 150.2 136.0 10.4% 133.2 12.8%
52
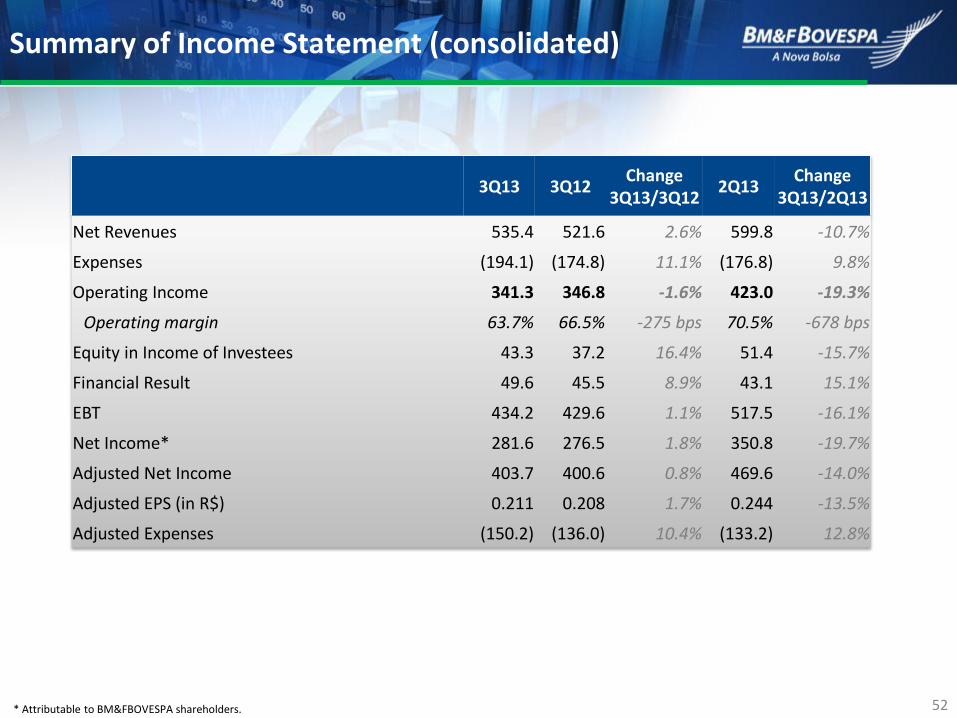
Summary of Income Statement (consolidated)
* Attributable to BM&FBOVESPA shareholders.
3Q13 3Q12 Change
3Q13/3Q12 2Q13
Change 3Q13/2Q13
Net Revenues 535.4 521.6 2.6% 599.8 -10.7%
Expenses (194.1) (174.8) 11.1% (176.8) 9.8%
Operating Income 341.3 346.8 -1.6% 423.0 -19.3%
Operating margin 63.7% 66.5% -275 bps 70.5% -678 bps
Equity in Income of Investees 43.3 37.2 16.4% 51.4 -15.7%
Financial Result 49.6 45.5 8.9% 43.1 15.1%
EBT 434.2 429.6 1.1% 517.5 -16.1%
Net Income* 281.6 276.5 1.8% 350.8 -19.7%
Adjusted Net Income 403.7 400.6 0.8% 469.6 -14.0%
Adjusted EPS (in R$) 0.211 0.208 1.7% 0.244 -13.5%
Adjusted Expenses (150.2) (136.0) 10.4% (133.2) 12.8%
53
REVENUES AND RESULTS
Resilient revenues and results in a challenging market environment
Growing diversification of products and revenues
INVESTMENTS
Commitment with the maintenance of market integrity
Strengthening the competitive edge by delivering efficiency to the market
FOSTERING CLIENTS AND MARKET
Strengthening ties with market participants and clients
Becoming a one-stop-shop by increasing the diversity of products for clients
COMMITMENT TO CAPITAL RETURN FOR SHAREHOLDERS
Maintained focus on cost control
High payout ratio combined with share buyback
Final Remarks

54
BM&FBOVESPA – INVESTOR RELATIONS
+55 (11) 2565 4729 / 4418 / 4834 / 7073 / 4007/4702 [email protected]
ir.bmfbovespa.com.br