Central Coast Office Report Q1-2015_
15
Office Report Central Coast | First Quarter 2015
-
Upload
lynn-nguyen -
Category
Documents
-
view
76 -
download
1
Transcript of Central Coast Office Report Q1-2015_

Offi ce ReportCentral Coast | First Quarter 2015
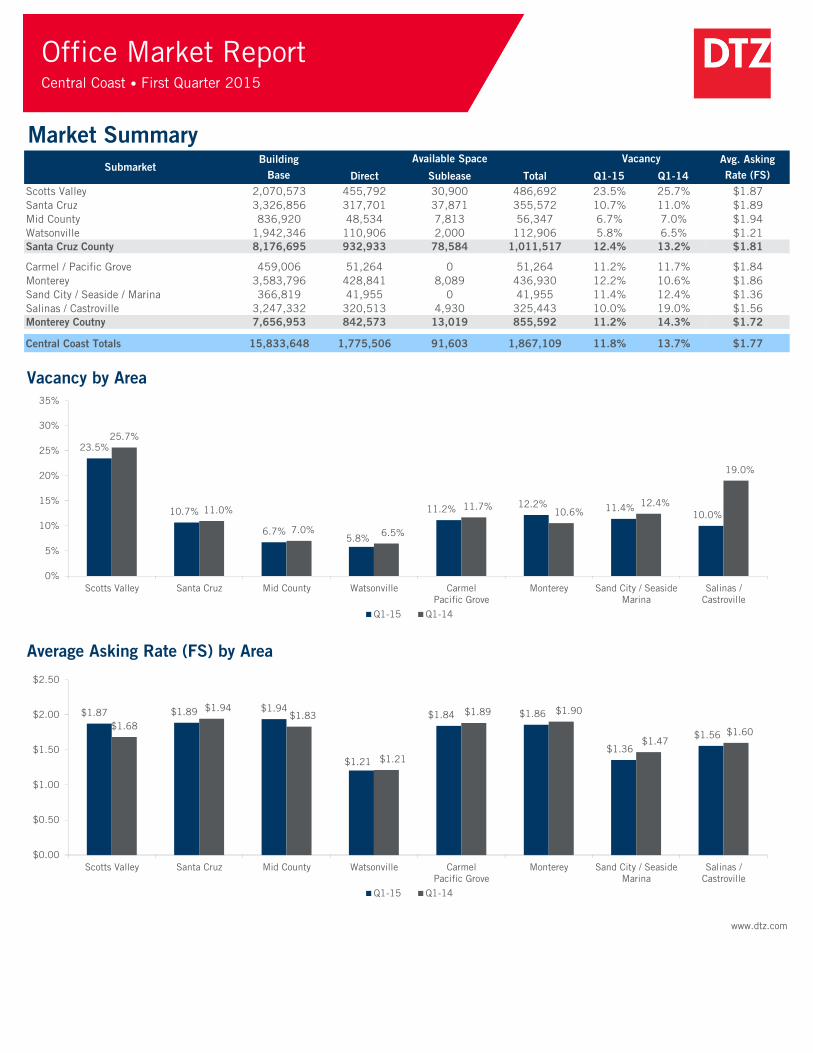
Building Avg. Asking
Base Direct Sublease Total Q1-15 Q1-14 Rate (FS)
Scotts Valley 2,070,573 455,792 30,900 486,692 23.5% 25.7% $1.87
Santa Cruz 3,326,856 317,701 37,871 355,572 10.7% 11.0% $1.89
Mid County 836,920 48,534 7,813 56,347 6.7% 7.0% $1.94
Watsonville 1,942,346 110,906 2,000 112,906 5.8% 6.5% $1.21
Santa Cruz County 8,176,695 932,933 78,584 1,011,517 12.4% 13.2% $1.81
Carmel / Pacific Grove 459,006 51,264 0 51,264 11.2% 11.7% $1.84
Monterey 3,583,796 428,841 8,089 436,930 12.2% 10.6% $1.86
Sand City / Seaside / Marina 366,819 41,955 0 41,955 11.4% 12.4% $1.36
Salinas / Castroville 3,247,332 320,513 4,930 325,443 10.0% 19.0% $1.56
Monterey Coutny 7,656,953 842,573 13,019 855,592 11.2% 14.3% $1.72
Central Coast Totals 15,833,648 1,775,506 91,603 1,867,109 11.8% 13.7% $1.77
Vacancy by Area
Average Asking Rate (FS) by Area
www.dtz.com
SubmarketAvailable Space
Market SummaryVacancy
$1.87 $1.89 $1.94
$1.21
$1.84 $1.86
$1.36
$1.56$1.68
$1.94$1.83
$1.21
$1.89 $1.90
$1.47$1.60
$0.00
$0.50
$1.00
$1.50
$2.00
$2.50
Scotts Valley Santa Cruz Mid County Watsonville CarmelPacific Grove
Monterey Sand City / SeasideMarina
Salinas /Castroville
Q1-15 Q1-14
23.5%
10.7%
6.7%5.8%
11.2%12.2% 11.4%
10.0%
25.7%
11.0%
7.0% 6.5%
11.7%10.6%
12.4%
19.0%
0%
5%
10%
15%
20%
25%
30%
35%
Scotts Valley Santa Cruz Mid County Watsonville CarmelPacific Grove
Monterey Sand City / SeasideMarina
Salinas /Castroville
Q1-15 Q1-14
Office Market ReportCentral Coast • First Quarter 2015

Historical Summary2011 2012 2013 2014 QTD-2015
Vacancy Rate 15.9% 15.1% 14.0% 12.5% 12.4%
Avg. Asking Rate (FS) $1.74 $1.70 $1.79 $1.80 $1.81
Gross Absorption 385,368 413,058 386,304 383,984 100,935
Net Absorption -135,587 71,970 87,180 125,979 10,881
New Construction 0 0 0 5,021 0
Vacancy Rate 9.3% 13.5% 15.1% 9.3% 11.2%
Avg. Asking Rate (FS) $1.77 $1.76 $1.75 $1.77 $1.72
Gross Absorption 296,363 302,570 240,721 546,866 30,307
Net Absorption -32,362 -323,857 -126,340 297,875 5,208
New Construction 15,000 0 0 0 0
Vacancy Rate 12.7% 14.3% 14.5% 11.9% 11.8%
Avg. Asking Rate (FS) $1.75 $1.73 $1.77 $1.77 $1.77
Gross Absorption 681,731 715,628 627,025 930,850 131,242
Net Absorption -167,949 -251,887 -39,160 423,854 16,089
New Construction 15,000 0 0 5,021 0
Vacancy & Average Asking Rate Trend
Historical Absorption & New Construction Trend
www.dtz.com
Total Central Coast
Monterey County
Santa Cruz County
11.2% 11.6%
12.7%14.3%
14.5%
11.9%
$1.70
$1.71
$1.72
$1.73
$1.74
$1.75
$1.76
$1.77
$1.78
0%
2%
4%
6%
8%
10%
12%
14%
16%
2009 2010 2011 2012 2013 2014
Vacancy Avg. Asking Rate
-0.25
0.00
0.25
0.50
0.75
1.00
1.25
1.50
2011 2012 2013 2014 QTD-2015
Square
Feet in
Millions
Gross Absorption Net Absorption New Construction
Office Market ReportCentral Coast • First Quarter 2015

Total MarketQUARTER Q1-2014 Q2-2014 Q3-2014 Q4-2014 Q1-2015
Total Building Base 15,828,627 15,833,648 15,833,648 15,833,648 15,833,648
Direct Availablities: 1,805,923 1,840,627 1,784,259 1,785,937 1,775,506
Sublease Availablities: 369,307 363,376 352,513 97,261 91,603
All Types 2,175,230 2,204,003 2,136,772 1,883,198 1,867,109
Growth Rate: 0.8% -0.2% 0.4% 1.6% 0.1%
Vacancy: 13.7% 13.9% 13.5% 11.9% 11.8%
Gross Absorption: 192,322 192,640 161,380 384,508 131,242
Net Absorption: 126,801 -23,752 67,231 253,574 16,089
Avg. Asking Rate (FS) $1.75 $1.74 $1.75 $1.77 $1.77
Completed New Construction: 0 5,021 0 0 0
Availabilities by Size:
0 - 2,499 SF 349 336 323 315 343
2,500 - 4,999 SF 112 114 112 105 96
5,000 - 7,499 SF 40 36 38 40 41
7,500 & Up 60 58 53 59 58
Total Availabilities: 561 544 526 519 538
Vacancy & Average Asking Rate Trend
www.dtz.com
12.6%
13.0%
15.1%
14.3%14.1%
15.1%14.8%
14.5%
13.7%13.9%
13.5%
11.9% 11.8%
$1.66
$1.68
$1.70
$1.72
$1.74
$1.76
$1.78
6%
8%
10%
12%
14%
16%
Q1-12 Q2-12 Q3-12 Q4-12 Q1-13 Q2-13 Q3-13 Q4-13 Q1-14 Q2-14 Q3-14 Q4-14 Q1-15
Vacancy Avg. Asking Rate (FS)
Office Market ReportCentral Coast • First Quarter 2015

Santa Cruz CountyQUARTER Q1-2014 Q2-2014 Q3-2014 Q4-2014 Q1-2015
Total Building Base 8,171,674 8,176,695 8,176,695 8,176,695 8,176,695
Direct Availablities: 1,017,474 975,118 979,105 938,156 932,933
Sublease Availablities: 62,286 57,145 49,929 84,242 78,584
All Types 1,079,760 1,032,263 1,029,034 1,022,398 1,011,517
Growth Rate: 0.8% 0.6% 0.0% 0.1% 0.1%
Vacancy: 13.2% 12.6% 12.6% 12.5% 12.4%
Gross Absorption: 95,928 125,086 96,961 66,009 100,935
Net Absorption: 63,596 52,518 3,229 6,636 10,881
Avg. Asking Rate (FS) $1.78 $1.77 $1.80 $1.80 $1.81
Completed New Construction: 0 5,021 0 0 0
Availabilities by Size:
0 - 2,499 SF 146 134 132 125 130
2,500 - 4,999 SF 46 42 50 45 41
5,000 - 7,499 SF 20 16 22 21 25
7,500 & Up 38 34 34 33 34
Total Availabilities: 250 226 238 224 230
Vacancy & Average Asking Rate Trend
www.dtz.com
15.2%
16.1%16.3%
15.1%
14.2%
15.8%
14.1% 14.0%
13.2%
12.6% 12.6% 12.5% 12.4%
$1.62
$1.64
$1.66
$1.68
$1.70
$1.72
$1.74
$1.76
$1.78
$1.80
$1.82
6%
8%
10%
12%
14%
16%
18%
Q1-12 Q2-12 Q3-12 Q4-12 Q1-13 Q2-13 Q3-13 Q4-13 Q1-14 Q2-14 Q3-14 Q4-14 Q1-15
Vacancy Avg. Asking Rate (FS)
Office Market ReportCentral Coast • First Quarter 2015

Scotts ValleyQUARTER Q1-2014 Q2-2014 Q3-2014 Q4-2014 Q1-2015
Total Building Base 2,065,552 2,070,573 2,070,573 2,070,573 2,070,573
Direct Availablities: 525,387 515,644 507,626 492,038 455,792
Sublease Availablities: 4,900 4,900 10,214 36,214 30,900
All Types 530,287 520,544 517,840 528,252 486,692
Growth Rate: 1.3% 0.7% 0.1% -0.5% 2.0%
Vacancy: 25.7% 25.1% 25.0% 25.5% 23.5%
Gross Absorption: 32,034 36,011 61,362 17,901 58,700
Net Absorption: 27,505 14,764 2,704 -10,412 41,560
Avg. Asking Rate (FS) $1.79 $1.74 $1.78 $1.85 $1.87
Completed New Construction: 0 5,021 0 0 0
Availabilities by Size:
0 - 2,499 SF 21 19 18 17 20
2,500 - 4,999 SF 21 20 19 14 12
5,000 - 7,499 SF 8 7 8 5 5
7,500 & Up 22 19 21 19 18
Total Availabilities: 72 65 66 55 55
Vacancy & Average Asking Rate Trend
www.dtz.com
30.6%
32.6%
33.4%
30.1%
28.0%
30.6%
26.5%27.0%
25.7%25.1% 25.0%
25.5%
23.5%
$1.50
$1.55
$1.60
$1.65
$1.70
$1.75
$1.80
$1.85
$1.90
15%
20%
25%
30%
35%
Q1-12 Q2-12 Q3-12 Q4-12 Q1-13 Q2-13 Q3-13 Q4-13 Q1-14 Q2-14 Q3-14 Q4-14 Q1-15
Vacancy Avg. Asking Rate (FS)
Office Market ReportCentral Coast • First Quarter 2015

Santa CruzQUARTER Q1-2014 Q2-2014 Q3-2014 Q4-2014 Q1-2015
Total Building Base 3,326,856 3,326,856 3,326,856 3,326,856 3,326,856
Direct Availablities: 330,014 314,531 318,999 299,191 317,701
Sublease Availablities: 34,936 32,645 36,115 36,115 37,871
All Types 364,950 347,176 355,114 335,306 355,572
Growth Rate: 0.4% 0.5% -0.2% 0.6% -0.6%
Vacancy: 11.0% 10.4% 10.7% 10.1% 10.7%
Gross Absorption: 29,257 51,963 17,937 34,594 31,859
Net Absorption: 12,089 17,774 -7,938 19,808 -20,266
Avg. Asking Rate (FS) $1.93 $1.94 $1.95 $1.85 $1.89
Completed New Construction: 0 0 0 0 0
Availabilities by Size:
0 - 2,499 SF 55 51 48 46 48
2,500 - 4,999 SF 12 11 19 18 16
5,000 - 7,499 SF 8 6 8 10 13
7,500 & Up 12 11 11 11 11
Total Availabilities: 87 79 86 85 88
Vacancy & Average Asking Rate Trend
www.dtz.com
10.8%
11.4%11.6%
11.0%
10.6%
12.9%
11.3% 11.3%
11.0%
10.4%10.7%
10.1%
10.7%
$1.70
$1.75
$1.80
$1.85
$1.90
$1.95
$2.00
$2.05
$2.10
6%
8%
10%
12%
14%
Q1-12 Q2-12 Q3-12 Q4-12 Q1-13 Q2-13 Q3-13 Q4-13 Q1-14 Q2-14 Q3-14 Q4-14 Q1-15
Vacancy Avg. Asking Rate (FS)
Office Market ReportCentral Coast • First Quarter 2015

Mid County (Aptos, Capitola, Live Oak, Soquel)QUARTER Q1-2014 Q2-2014 Q3-2014 Q4-2014 Q1-2015
Total Building Base 836,920 836,920 836,920 836,920 836,920
Direct Availablities: 57,272 53,522 54,637 50,062 48,534
Sublease Availablities: 1,600 1,600 1,600 7,813 7,813
All Types 58,872 55,122 56,237 57,875 56,347
Growth Rate: 0.4% 0.4% -0.1% -0.2% 0.2%
Vacancy: 7.0% 6.6% 6.7% 6.9% 6.7%
Gross Absorption: 11,122 8,051 9,656 9,736 5,233
Net Absorption: 3,350 3,750 -1,115 -1,638 1,528
Avg. Asking Rate (FS) $1.96 $1.96 $1.97 $1.99 $1.94
Completed New Construction: 0 0 0 0 0
Availabilities by Size:
0 - 2,499 SF 38 36 36 33 34
2,500 - 4,999 SF 2 1 1 2 2
5,000 - 7,499 SF 1 1 1 1 2
7,500 & Up 0 0 0 0 0
Total Availabilities: 41 38 38 36 38
Vacancy & Average Asking Rate Trend
www.dtz.com
9.6%
10.6%
11.3%
9.8%
9.3%
7.4%
7.7%
7.4%
7.0%
6.6%6.7%
6.9%6.7%
$0.00
$0.50
$1.00
$1.50
$2.00
$2.50
6%
8%
10%
12%
Q1-12 Q2-12 Q3-12 Q4-12 Q1-13 Q2-13 Q3-13 Q4-13 Q1-14 Q2-14 Q3-14 Q4-14 Q1-15
Vacancy Avg. Asking Rate (FS)
Office Market ReportCentral Coast • First Quarter 2015

WatsonvilleQUARTER Q1-2014 Q2-2014 Q3-2014 Q4-2014 Q1-2015
Total Building Base 1,942,346 1,942,346 1,942,346 1,942,346 1,942,346
Direct Availablities: 104,801 91,421 97,843 96,865 110,906
Sublease Availablities: 20,850 18,000 2,000 4,100 2,000
All Types 125,651 109,421 99,843 100,965 112,906
Growth Rate: 1.1% 0.8% 0.5% -0.1% -0.6%
Vacancy: 6.5% 5.6% 5.1% 5.2% 5.8%
Gross Absorption: 23,515 29,061 8,006 3,778 5,143
Net Absorption: 20,652 16,230 9,578 -1,122 -11,941
Avg. Asking Rate (FS) $1.23 $1.25 $1.26 $1.25 $1.21
Completed New Construction: 0 0 0 0 0
Availabilities by Size:
0 - 2,499 SF 32 28 30 29 26
2,500 - 4,999 SF 11 10 11 11 9
5,000 - 7,499 SF 3 2 5 5 5
7,500 & Up 4 4 2 3 3
Total Availabilities: 50 44 48 48 43
Vacancy & Average Asking Rate Trend
www.dtz.com
8.7% 8.8%
8.3% 8.3%
7.9%
8.6%8.5%
7.5%
6.5%
5.6%
5.1% 5.2%
5.8%
$0.60
$0.70
$0.80
$0.90
$1.00
$1.10
$1.20
$1.30
$1.40
0%
2%
4%
6%
8%
10%
Q1-12 Q2-12 Q3-12 Q4-12 Q1-13 Q2-13 Q3-13 Q4-13 Q1-14 Q2-14 Q3-14 Q4-14 Q1-15
Vacancy Avg. Asking Rate (FS)
Office Market ReportCentral Coast • First Quarter 2015

Monterey CountyQUARTER Q1-2014 Q2-2014 Q3-2014 Q4-2014 Q1-2015
Total Building Base 7,656,953 7,656,953 7,656,953 7,656,953 7,656,953
Direct Availablities: 788,449 865,509 805,154 847,781 842,573
Sublease Availablities: 307,021 306,231 302,584 13,019 13,019
All Types 1,095,470 1,171,740 1,107,738 860,800 855,592
Growth Rate: 0.8% -1.0% 0.8% 3.2% 0.1%
Vacancy: 14.3% 15.3% 14.5% 11.2% 11.2%
Gross Absorption: 96,394 67,554 64,419 318,499 30,307
Net Absorption: 63,205 -76,270 64,002 246,938 5,208
Avg. Asking Rate (FS) $1.73 $1.72 $1.71 $1.75 $1.72
Completed New Construction: 0 0 0 0 0
Availabilities by Size:
0 - 2,499 SF 203 202 191 190 213
2,500 - 4,999 SF 66 72 62 60 55
5,000 - 7,499 SF 20 20 16 19 16
7,500 & Up 22 24 19 26 24
Total Availabilities: 311 318 288 295 308
Vacancy & Average Asking Rate Trend
www.dtz.com
9.9% 9.8%
13.8%13.5%
14.0%
14.4%
15.7%
15.1%
14.3%
15.3%
14.5%
11.2% 11.2%
$1.66
$1.68
$1.70
$1.72
$1.74
$1.76
$1.78
$1.80
$1.82
6%
8%
10%
12%
14%
16%
18%
Q1-12 Q2-12 Q3-12 Q4-12 Q1-13 Q2-13 Q3-13 Q4-13 Q1-14 Q2-14 Q3-14 Q4-14 Q1-15
Vacancy Avg. Asking Rate (FS)
Office Market ReportCentral Coast • First Quarter 2015

Carmel / Pacific GroveQUARTER Q1-2014 Q2-2014 Q3-2014 Q4-2014 Q1-2015
Total Building Base 459,006 459,006 459,006 459,006 459,006
Direct Availablities: 53,763 55,023 54,042 51,624 51,264
Sublease Availablities: 0 0 0 0 0
All Types 53,763 55,023 54,042 51,624 51,264
Growth Rate: -1.2% -0.3% 0.2% 0.5% 0.1%
Vacancy: 11.7% 12.0% 11.8% 11.2% 11.2%
Gross Absorption: 940 7,225 3,771 4,828 5,029
Net Absorption: -5,577 -1,260 981 2,418 360
Avg. Asking Rate (FS) $1.91 $2.07 $1.96 $1.96 $1.84
Completed New Construction: 0 0 0 0 0
Availabilities by Size:
0 - 2,499 SF 35 36 32 28 38
2,500 - 4,999 SF 7 7 7 6 5
5,000 - 7,499 SF 0 0 0 0 0
7,500 & Up 0 0 0 0 0
Total Availabilities: 42 43 39 34 43
Vacancy & Average Asking Rate Trend
www.dtz.com
19.9%
21.4%
19.5%
16.7%
14.4%
13.6%
12.0%
10.5%
11.7%12.0%
11.8%
11.2% 11.2%
$1.70
$1.75
$1.80
$1.85
$1.90
$1.95
$2.00
$2.05
$2.10
8%
10%
12%
14%
16%
18%
20%
22%
24%
Q1-12 Q2-12 Q3-12 Q4-12 Q1-13 Q2-13 Q3-13 Q4-13 Q1-14 Q2-14 Q3-14 Q4-14 Q1-15
Vacancy Avg. Asking Rate (FS)
Office Market ReportCentral Coast • First Quarter 2015

MontereyQUARTER Q1-2014 Q2-2014 Q3-2014 Q4-2014 Q1-2015
Total Building Base 3,583,796 3,583,796 3,583,796 3,583,796 3,583,796
Direct Availablities: 369,369 429,547 397,258 445,244 428,841
Sublease Availablities: 8,879 8,089 8,089 8,089 8,089
All Types 378,248 437,636 405,347 453,333 436,930
Growth Rate: 1.8% -1.7% 0.9% -1.3% 0.5%
Vacancy: 10.6% 12.2% 11.3% 12.6% 12.2%
Gross Absorption: 75,923 15,853 40,337 19,304 16,886
Net Absorption: 66,293 -59,388 32,289 -47,986 16,403
Avg. Asking Rate (FS) $1.93 $1.89 $1.89 $1.87 $1.86
Completed New Construction: 0 0 0 0 0
Availabilities by Size:
0 - 2,499 SF 90 92 87 80 84
2,500 - 4,999 SF 32 37 33 36 35
5,000 - 7,499 SF 6 6 5 5 5
7,500 & Up 8 12 10 13 14
Total Availabilities: 136 147 135 134 138
Vacancy & Average Asking Rate Trend
www.dtz.com
10.1%9.9%
10.8%
10.1%
9.5%
10.4%
13.3%
12.4%
10.6%
12.2%
11.3%
12.6%
12.2%
$1.80
$1.85
$1.90
$1.95
$2.00
6%
8%
10%
12%
14%
Q1-12 Q2-12 Q3-12 Q4-12 Q1-13 Q2-13 Q3-13 Q4-13 Q1-14 Q2-14 Q3-14 Q4-14 Q1-15
Vacancy Avg. Asking Rate (FS)
Office Market ReportCentral Coast • First Quarter 2015

Sand City / Del Rey Oaks / Seaside / MarinaQUARTER Q1-2014 Q2-2014 Q3-2014 Q4-2014 Q1-2015
Total Building Base 366,819 366,819 366,819 366,819 366,819
Direct Availablities: 43,500 50,062 41,417 42,690 41,955
Sublease Availablities: 2,094 2,094 0 0 0
All Types 45,594 52,156 41,417 42,690 41,955
Growth Rate: -1.4% -1.8% 2.9% -0.3% 0.2%
Vacancy: 12.4% 14.2% 11.3% 11.6% 11.4%
Gross Absorption: 650 12,846 10,749 0 735
Net Absorption: -5,255 -6,562 10,739 -1,273 735
Avg. Asking Rate (FS) $1.39 $1.45 $1.45 $1.49 $1.36
Completed New Construction: 0 0 0 0 0
Availabilities by Size:
0 - 2,499 SF 20 18 18 18 24
2,500 - 4,999 SF 8 7 4 3 3
5,000 - 7,499 SF 3 3 1 2 2
7,500 & Up 1 1 0 1 1
Total Availabilities: 32 29 23 24 30
Vacancy & Average Asking Rate Trend
www.dtz.com
7.8%
8.7%
11.7%
9.9%
10.4%10.6%
9.5%
11.0%
12.4%
14.2%
11.3%
11.6%11.4%
$1.15
$1.20
$1.25
$1.30
$1.35
$1.40
$1.45
$1.50
$1.55
6%
8%
10%
12%
14%
16%
Q1-12 Q2-12 Q3-12 Q4-12 Q1-13 Q2-13 Q3-13 Q4-13 Q1-14 Q2-14 Q3-14 Q4-14 Q1-15
Vacancy Avg. Asking Rate (FS)
Office Market ReportCentral Coast • First Quarter 2015

Salinas / CastrovilleQUARTER Q1-2014 Q2-2014 Q3-2014 Q4-2014 Q1-2015
Total Building Base 3,247,332 3,247,332 3,247,332 3,247,332 3,247,332
Direct Availablities: 321,817 330,877 312,437 308,223 320,513
Sublease Availablities: 296,048 296,048 294,495 4,930 4,930
All Types 617,865 626,925 606,932 313,153 325,443
Growth Rate: 0.2% -0.3% 0.6% 9.0% -0.4%
Vacancy: 19.0% 19.3% 18.7% 9.6% 10.0%
Gross Absorption: 18,881 31,630 9,562 294,367 7,657
Net Absorption: 7,744 -9,060 19,993 293,779 -12,290
Avg. Asking Rate (FS) $1.61 $1.59 $1.58 $1.57 $1.56
Completed New Construction: 0 0 0 0 0
Availabilities by Size:
0 - 2,499 SF 58 56 54 64 67
2,500 - 4,999 SF 19 21 18 15 12
5,000 - 7,499 SF 11 11 10 12 9
7,500 & Up 13 11 9 12 9
Total Availabilities: 101 99 91 103 97
Vacancy & Average Asking Rate Trend
www.dtz.com
8.5%8.1%
16.6%
17.2%
19.3% 19.4% 19.4% 19.3%19.0%
19.3%
18.7%
9.6%10.0%
$1.54
$1.56
$1.58
$1.60
$1.62
$1.64
$1.66
$1.68
6%
8%
10%
12%
14%
16%
18%
20%
22%
Q1-12 Q2-12 Q3-12 Q4-12 Q1-13 Q2-13 Q3-13 Q4-13 Q1-14 Q2-14 Q3-14 Q4-14 Q1-15
Vacancy Avg. Asking Rate (FS)
Office Market ReportCentral Coast • First Quarter 2015

Disclaimer: The information contained herein while not guaranteed has been secured by sources we deem reliable. All information should be verified prior to lease or sale.
www.dtz.com
Office Report
Central Coast
DefinitionsClass A ProductSteel and concrete construction, built after 1980, quality tenants, excellent amenities & premium rents.
Class B ProductBuilt after 1960, fair to good finishes & wide range of tenants.
Total Building BaseTotal of all Class A, Class B and Office Flex buildings.
Direct AvailabilitiesTotal square footage being marketed for lease by landlord available within 90 days. This may include availabilities with pending leases.
Sublease Availabilities Total square footage being marketed for lease by sublessor.
VacancyTotal available square footage (direct & sublease) divided by Total Building Base.
BTS (Build-to-Suit)A method of leasing property whereby the landlord builds to suit the tenant (according to tenant’s specifications). The cost of construction is figured into the rental amount of the lease, which is usually for a long term.
New Spec (Speculative)A building constructed for lease or sale but without having a tenant or buyer before construction begins.
Gross AbsorptionTotal leasing and user sale activity in the marketplace in a given time period.
Net AbsorptionChange in occupied building square footage in a given time period.
Avg. Asking RateWeighted Average Full Service Rate (by available square footage) of available spaces with NNN rates converted to Full Service rates.
Avg. Time on MarketWeighted Average Time on market (by available square footage) of available spaces reflected in months.
Availables by SizeNumber of current available spaces for lease in the given size.
Historical ContinuityDTZ maintains a building by building historical record. Comparing previous reports to this report may show different building size numbers and statistics. Changes are caused by reclassification of buildings and revised building sizes. Historical comparisons should be made from this report only as DTZ adjusts the historical record accordingly.
SANTA CRUZ COUNTY
= Office Locations
1
1
101681
183
156
Monterey Bay
Pacific Grove
Reservation
Old S
tage
Monterey Rd
PACIFICGROVE
MONTEREY COUNTY
SALINASSALINAS
CASTROVILLECASTROVILLE
MARINAMARINA
SAND CITYSAND CITY
SEASIDESEASIDEMONTEREYMONTEREY
CARMELCARMEL
Empire Grade
1
SCOTTS VALLEYSCOTTS VALLEY
SOQUELSOQUEL
CAPITOLACAPITOLA
APTOSAPTOS
SANTA CRUZSANTA CRUZ
179
Main St
152
WATSONVILLEWATSONVILLE
Rd
Sum
mit
Rd
Rd
Rd
Report Published By:
DTZ Salinas328-B Main StreetSalinas, CA 93901Tel 831-449-8000Fax 831-769-0314