CENTRAL BANK OF SEYCHELLES Report 2000.pdf8.11 Government of Seychelles Re -finance Scheme; 1995...
107
CENTRAL BANK OF SEYCHELLES ANNUAL REPORT 2000
Transcript of CENTRAL BANK OF SEYCHELLES Report 2000.pdf8.11 Government of Seychelles Re -finance Scheme; 1995...
CENTRAL BANK OF SEYCHELLES
ANNUAL REPORT 2000

CENTRAL BANK OF SEYCHELLES
ANNUAL REPORT
2000

CONTENTS
Letter of Transmittal
Board of Directors
List of Tables
Economic Review of 2000 1
Section One World Economic Conditions 4
Section Two Highlights of the Seychelles Economy 17
Section Three Financial Survey 20
Section Four Government Finance 32
Section Five The External Sector 43
Section Six The Real Sector: Production, Employment and Prices 57
Section Seven Investment and Offshore Developments 77
Section Eight Operations and Administration of the Central Bank 83
Letter of Transmittal
Central Bank of Seychelles
P.O. Box 701
Victoria
March 31, 2001.
President F. A. René
State House
Victoria
Dear Mr. President,
In accordance with section 43(3) of the Central Bank of Seychelles Act, 1982, as
amended, I have the honour to submit for your approval the Eighteenth Annual Report of
the Central Bank together with a copy of the Annual Accounts for 2000 certified by the
Auditors.
Yours faithfully,

CENTRAL BANK OF SEYCHELLES
Board of Directors
(as at 31 December 2000)
Norman Weber, Governor - Chairman Francis Chang Leng - Member
Errol Dias - Member
Francis Chang-Sam - Member
Secretary to the Board
Patrick Stravens

List of Charts and Tables Chart No. Title Page Financial Survey 3.1 Growth rates of the money supply aggregates; 1995-2000 23 3.2 Growth rates of credit of the banking system; 1995-2000 25 3.3 Growth rates of credit held by the economic agents; 1995-2000 27 3.4 The movement in credit/deposit ratio in 2000 30 3.5 The movement in commercial bank credit and deposit in 2000 30 3.6 Level of interest rates; 1995-2000 30 The Real Sector: Production, Employment and Prices 6.1 Real GDP growth; 1990-2000 57
6.2 Tourism arrivals and its growth rates for 1995-2000 63
6.3 Tourism income and its growth rates for 1995-2000 63
6.4 Canned tuna produced and exported from 1995-2000 73
6.5 Revenue earned from export from 1995-2000 73
6.6 Inflation rate for 1995-2000 76
Investment and Offshore Developments 7.1 Number of IBCs registered per year and their
cumulative totals; 1995-2000 80
Operations and Administration of the Central Bank 8.1 Advances to Government; 1995-2000 85 8.2 Currency in circulation; 1995-2000 86 8.3 Stock of Public Debt Instruments; 1995-2000 89 8.4 Local Assets Ratio from 1995-2000 94

Table No. Title Page Financial Survey 3.1 Monetary Survey; 1995-2000 24
3.2 Credit; 1995-2000 26
3.3 Commercial Banks – Loans and Advances to Non-Government
Sector by Economic Sectors; 1996-2000 28
3.4 Loans by Development Bank by Economic Sectors; 1996-2000 29
3.5 Liquidity Indicators of Commercial Banks; 1995-2000 29
3.6 Interest Rates; 1995-2000 31
Government Finance 4.1 Government Budget; Summary 1998-2001 34
4.2 Government Budget; Revenue 1998-2001 35
4.3 Government Budget; Expenditure 1998-2001
4.4 Public Sector Capital Project Expenditure 1995-2000 40
The External Sector 5.1 Balance of Payments; 1995-2000 44
5.2 Domestic Exports; 1995-2000 47
5.3 Imports (cif) – by SITC Sections; 1995-2000 48
5.4 Goods procured in ports; 1995-2000 50
5.5 Services 1995-2000 52
5.6 External Reserves; 1995-2000 55
5.7 Exchange Rates; 1995-2000 56
The Real Sector: Production, Employment and Prices 6.1 Gross Domestic Product by Kind of Economic Activity at constant market prices 58 6.2 Gross Domestic Product by Kind of Economic Activity at current market prices 59 6.3 Gross Domestic Product by Broad Productive Sectors at current market prices 61 6.4 Tourism 64

Table No. Title Page
6.5 SMB Purchases of Vegetables and Fruits 66
6.6 Crops 68
6.7 Livestock (slaughters) 68
6.8 Estimates of Fish Landed 71
6.9 Employment 75
6.10 Composition of Retail Price Index 77
Operations and Administration of the Central Bank 8.1 CBS Advances to government; 1995-2000 85
8.2 Circulation of Notes and Coins; 1995-2000 86
8.3 Bankers’Clearing House Activities; 1995-2000 87
8.4 Treasury Bill Yields; 1995-2000 89
8.5 Treasury Bills; 1995-2000 90
8.6 Treasury Bonds; 1995-2000 91
8.7 Government Stocks; 1995-2000 92
8.8 Capital Fund Ratios of Commercial Banks; 1995-2000 93
8.9 Minimum Reserves and Local Assets Ratio; 1995-2000 94
8.10 Temporary Advances against Government Securities; 1995-2000 95
8.11 Government of Seychelles Re-finance Scheme; 1995-2000 96
8.12 Commercial Bank Advances to Non-Seychellois; 1998-2000 96
8.13 Commercial Bank Advances to Parastatals; 1998-2000 97
Technical Note
Owing to rounding of figures, the sum of separate items may not always add up to the total shown. Abbreviations used in this Report are: R = Seychelles Rupee CBS = Central Bank of Seychelles n.a = Figure not available .. = Negligible -/0 = Nil
ECONOMIC REVIEW OF 2000
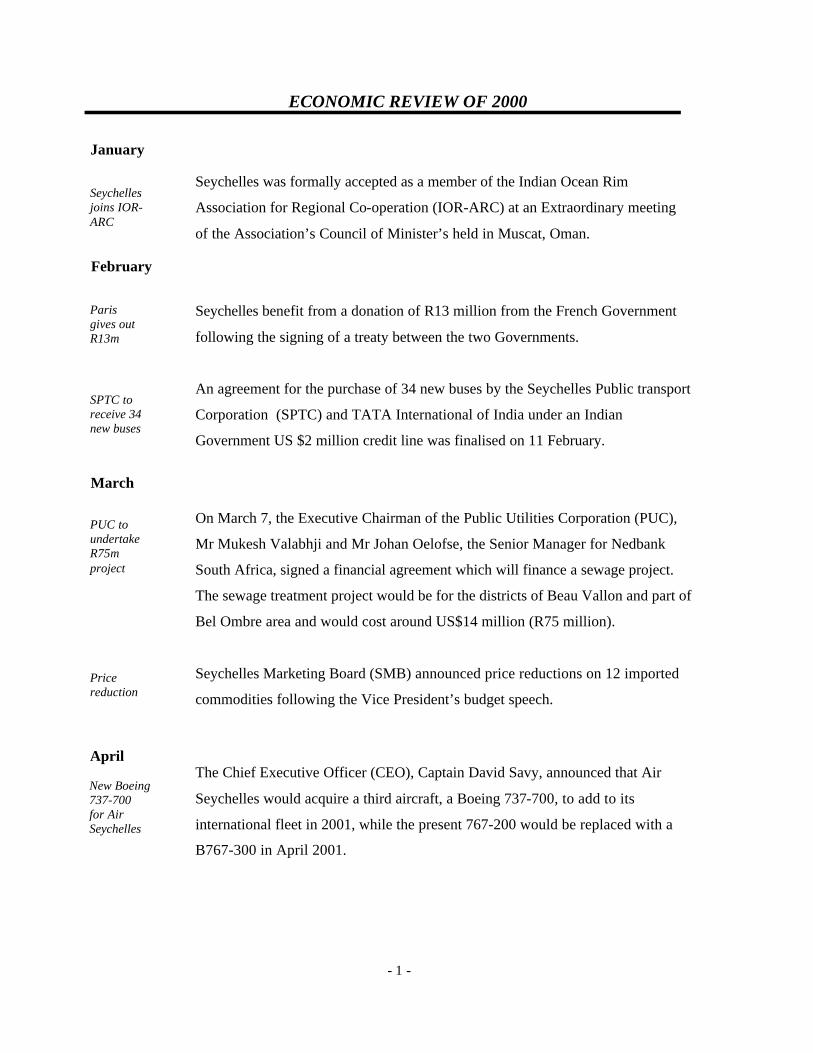
Seychelles was formally accepted as a member of the Indian Ocean Rim
Association for Regional Co-operation (IOR-ARC) at an Extraordinary meeting
of the Association’s Council of Minister’s held in Muscat, Oman.
Seychelles benefit from a donation of R13 million from the French Government
following the signing of a treaty between the two Governments.
An agreement for the purchase of 34 new buses by the Seychelles Public transport
Corporation (SPTC) and TATA International of India under an Indian
Government US $2 million credit line was finalised on 11 February.
On March 7, the Executive Chairman of the Public Utilities Corporation (PUC),
Mr Mukesh Valabhji and Mr Johan Oelofse, the Senior Manager for Nedbank
South Africa, signed a financial agreement which will finance a sewage project.
The sewage treatment project would be for the districts of Beau Vallon and part of
Bel Ombre area and would cost around US$14 million (R75 million).
Seychelles Marketing Board (SMB) announced price reductions on 12 imported
commodities following the Vice President’s budget speech.
The Chief Executive Officer (CEO), Captain David Savy, announced that Air
Seychelles would acquire a third aircraft, a Boeing 737-700, to add to its
international fleet in 2001, while the present 767-200 would be replaced with a
B767-300 in April 2001.
January
March
April
New Boeing 737-700 for Air Seychelles
February
PUC to undertake R75m project
SPTC to receive 34 new buses
Paris gives out R13m
Seychelles joins IOR-ARC
Price reduction
- 1 -
- 2 -
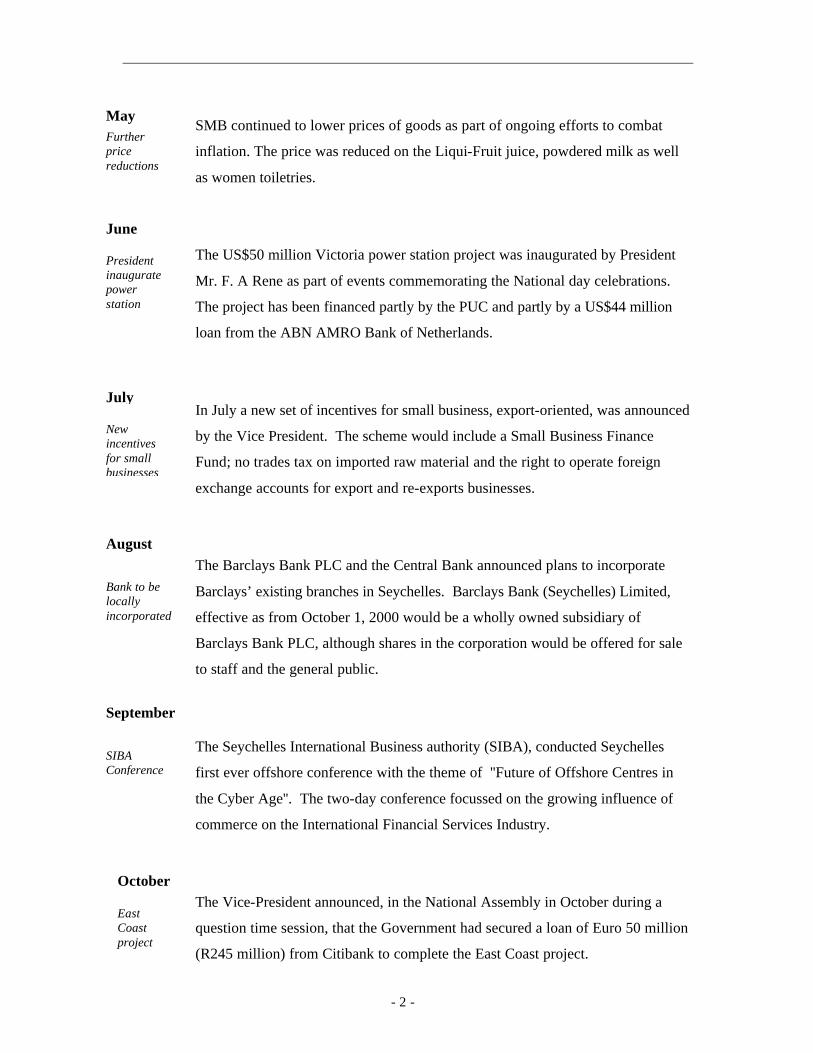
SMB continued to lower prices of goods as part of ongoing efforts to combat
inflation. The price was reduced on the Liqui-Fruit juice, powdered milk as well
as women toiletries.
The US$50 million Victoria power station project was inaugurated by President
Mr. F. A Rene as part of events commemorating the National day celebrations.
The project has been financed partly by the PUC and partly by a US$44 million
loan from the ABN AMRO Bank of Netherlands.
In July a new set of incentives for small business, export-oriented, was announced
by the Vice President. The scheme would include a Small Business Finance
Fund; no trades tax on imported raw material and the right to operate foreign
exchange accounts for export and re-exports businesses.
The Barclays Bank PLC and the Central Bank announced plans to incorporate
Barclays’ existing branches in Seychelles. Barclays Bank (Seychelles) Limited,
effective as from October 1, 2000 would be a wholly owned subsidiary of
Barclays Bank PLC, although shares in the corporation would be offered for sale
to staff and the general public.
The Seychelles International Business authority (SIBA), conducted Seychelles
first ever offshore conference with the theme of ''Future of Offshore Centres in
the Cyber Age''. The two-day conference focussed on the growing influence of
commerce on the International Financial Services Industry.
The Vice-President announced, in the National Assembly in October during a
question time session, that the Government had secured a loan of Euro 50 million
(R245 million) from Citibank to complete the East Coast project.
October October
June
August
September
President inaugurate power station
SIBA Conference
East Coast project
Further price reductions
Bank to be locally incorporated
July
New incentives for small businesses
May

- 3 -
US$6.4 million loan was signed in Khartoum by the Minister of Foreign Affairs,
Mr Jeremie Bonnelame, and the Director General of the Arab Bank for
Development in Africa (BADEA), Mr Medhat Lofty. The loan would go towards
the construction of the new Seychelles Industrial Training Centre (ITC).
After much deliberation on the 2001 budget proposal, the National Assembly
approved the Appropriation Bill 2001. The Appropriation Bill 2001 caters for a
National Budget of R1,225,536,000 and has been the trend throughout the years,
that the Ministry of Education receives the largest share of the budget, R139
million. The Ministry of Health obtained the second largest allocation - R137
million - followed by the Department of Internal Affairs with R68 million and the
Ministry of Defence with R60 million.
December October
BADEA loan for ITC
Budget 2001 approved

SECTION ONE
World Economic Conditions
1. Overview
The global economic recovery that started in
1999 continued to gain strength in 2000 with
the IMF projecting a global output growth of
4.7 per cent for the year under review.
Growth increased in all major economies of
the world, led by the strong US economy;
the robust upswing in Europe; the
consolidation of the recovery in Asia; and a
rebound from 1999’s slowdowns in
emerging markets in Latin America and the
Middle East and Europe. Activity in Africa
rose further, and the countries in transition
saw a second year of solid growth,
underpinned by a much better than expected
performance in Russia. Nevertheless, a
number of countries continued to experience
serious economic problems, in some cases
due to natural disasters and adverse
movements in commodity prices.
With most advanced economies growing at
rates at or above potential, most central
banks continued to raise interest rates.
Although headline inflation rates increased
in response to higher energy prices,
underlying inflation in most advanced
countries remained relatively subdued. In
part, this reflected the continued margins of
slack in some regions of the world, notably
in Japan and to a lesser extent in continental
Europe. But other factors, including fiscal
consolidation and regulatory and
technological changes also played a role.
While the overall outlook was encouraging,
there were significant risks and
uncertainties, for which one of them was oil
prices. Oil prices have been significantly
higher than previously expected, due to both
supply constraints in producing countries
- 4 -

ANNUAL REPORT 2000 WORLD ECONOMIC CONDITIONS
- 5 -
and the continued strength in global
demand. Following the announcement of
further supply increases at the OPEC
meeting in June, as well as indications that
some oil producers would be willing to
boost supply further, the oil price fell back
within in the OPEC target range of US$22-
US28 per barrel in July. However, since
early August prices have rebounded
significantly.
1.1. Developed economies
1.1.1 United States
According to the Monetary Policy Report
submitted to the Congress in February 2001,
the combination of exceptionally strong
growth in the first half of 2000 and subdued
growth in the second half resulted in a rise
in real GDP of about 3.5 per cent for the
year. Domestic demand started out the year
with incredible vigour but decelerated
thereafter and was sluggish by the year-end.
Exports surged for the three quarters and
then faltered. In the labour market, growth
in employment slowed over the year but was
sufficient to keep the unemployment rate
around the lowest sustained level in more
than thirty years.
Core inflation remained low during the year
in the face of sharp increases in energy
prices. Unit labour costs picked up
moderately, adding to the cost pressures
from energy. Nevertheless, the ability of
businesses to raise prices was restrained by
the slowing of the economy and the
persistence of competitive pricing
conditions.
Personal consumption expenditures
increased 4.5 per cent in real terms after
growths of 5.0 per cent and 5.5 per cent in
1998 and 1999 respectively. A large portion
of the gain was in the first quarter, when
consumption grew at a fast pace. For the
remainder of the year, growth was moderate,
averaging about 3.5 per cent. One of the
factors influencing consumption in the year
under review was the change in income and
wealth. Both provided less support to
consumption in 2000 than in other recent
years. Real disposable personal income rose
about 2.25 per cent after a gain of slightly
more than 3.0 per cent in 1999. Disposable
income did not rise quite as much in
nominal terms as it did in 1999, and rising
prices eroded a larger portion of the nominal
gain.
In the business sector, real business fixed
investment rose 10 per cent in 2000
according to an estimate from the
Commerce Department. Investment
spending shot ahead at an annual rate of 21
per cent in the first quarter of the year due to
the high-tech purchases that had been
delayed from 1999 by companies that did
not want their operating systems to be in a

ANNUAL REPORT 2000 WORLD ECONOMIC CONDITIONS
- 6 -
state of change at the onset of the new
millennium. Expansion of investment was
slower but still relatively brisk in the second
and third quarters, at annual rate of about 15
per cent and 8.0 per cent respectively. In the
fourth quarter, however, capital spending
downshifted abruptly, falling at an annual
rate of 1.5 per cent in response to the
slowing economy, tightening financial
conditions, and rising concern about the
prospects for profits.
On the external front, the current account
deficit reached US$452 billion (annual rate)
in the third quarter or 4.5 per cent of GDP,
compared with US$331 billion for 1999.
Most of the expansion in the deficit occurred
in the balance of trade in goods and services.
The deficit on trade in goods and services
widened to US$383 billion (annual rate) in
the third quarter from US$347 billion in the
first half of the year. Data for October and
November suggest that the deficit may have
increased further in the fourth quarter.
Exports of goods and services rose an
estimated 7.0 per cent during the year under
review. Exports surged during the three
quarters, supported by a pickup in economic
activity abroad that began in 1999. By
market destination, US exports were
strongest in Mexico and countries of Asia.
About 45 per cent of goods exports were
capital equipment, 20 per cent were
industrial supplies, and roughly 10 per cent
each were agricultural, automotive,
consumer, and other goods. The quantity of
import of goods and services expanded
rapidly during the first three quarters, due to
the continuing strength of domestic
economy. The counterpart to the increased
US current account deficit was an increase
in net capital flows. As in the previous year,
US capital flows reflected the relatively
strong cyclical position of the economy for
most of the year and the global wave of
corporate mergers.
In the labour market, the non-farm payroll
employment increased about 1.5 per cent in
2000, measured on a December-to-
December basis. Over the first few months
of 2000, the expansion of jobs proceeded at
a faster pace than in 1999, boosted both by
the federal government’s hiring of the
decennial census and by a somewhat faster
rate of job creation in the private.
Indications of a moderation in private hiring
started to emerge towards mid-year. Over
the remainder of the year, monthly increases
in private employment stepped down further
due to a slowing economy.
In terms of changes in the price level, this
was mainly influenced by the surge in
energy prices. The chain-type price index
for real GDP, the broadest measure of goods
and services produced domestically, rose

ANNUAL REPORT 2000 WORLD ECONOMIC CONDITIONS
- 7 -
2.25 per cent in 2000. In addition, the price
index for gross domestic purchases, the
broadest measure of prices for goods and
services purchased by domestic buyers,
posted a rise of 2.5 per cent. The prices of
energy products purchased directly by
consumers increased by 15 per cent in 2000.
In response to the rise in world oil prices,
consumer prices of motor fuels rose nearly
20 per cent. Prices also rose rapidly for
home heating oil.
Businesses had to cope with rising costs of
energy production, transportation, and
temperature control. In some industries that
depend particularly heavily on energy
inputs, the rise in costs had a large effect on
product prices. Despite the spillover of
energy effects into other markets, inflation
outside the energy sector remained overall
moderate.
1.1.2 European Union
1.1.2.1 Eurozone economies
The expansion in the Euro area, which
started in the second half of 1999 continued
to gather strength in the first half of 2000,
with GDP growth rising steadily at around
3.0 per cent. This increase in economic
momentum was aided by resurgent export
growth due to the strengthening of the
global recovery and a highly competitive
currency. During the remainder of the year,
high consumer and business confidence and
the favourable external environment
sustained the expansion. For the year as a
whole, GDP growth was projected at 3.5 per
cent, with all countries registering above-
potential growth rates. The pickup in
activity has been accompanied by a
substantial decline in unemployment.
However, with some slack still remaining in
area-wide labour and product markets,
underlying price pressures have been
restrained. The headline CPI increased to
2.4 per cent by midyear, due largely to rising
oil prices and exchange rate pass through.
Core inflation, at about 1.3 per cent, has
remained subdued, aided by moderate wage
settlements, falling utility prices as
deregulation and privatisation took effect,
and, in some countries, cuts in direct taxes.
Nevertheless, one of the preoccupations of
the European economies was the euro. The
Euro was quite volatile, hitting record lows
against the U.S dollar and most other major
currencies in mid-May, and again in early
September. By early September, the Euro
had depreciated over 15 per cent in nominal
effective terms since its inception in 1999,
and was below the level that could be
justified medium-term fundamentals. In
part, this has reflected the relative cyclical
position of the Euro area, with United
States. In addition, relative interest rate
differentials and market perceptions of

ANNUAL REPORT 2000 WORLD ECONOMIC CONDITIONS
- 8 -
differences in the underlying climate for
investment across countries may have
played a role.
Given buoyant activity, money and credit
development, rising oil prices, and later the
weakness of the Euro, the European Central
Bank (ECB) started raising interest rates
early in the year. Over the period between
February to October, the ECB increased
interest rates by 175 basis points with the
aim on the one hand of forestalling potential
pressures on wages and prices and on the
other to boost the value of the currency.
During 2000, growth rates among individual
countries in the Euro area have continued to
differ markedly, which – since monetary
policy must be set on the basis of conditions
in the Euro area as a whole – has posed
challenges for policymakers, particularly in
the small and faster growing economies.
Over the coming year, differences in growth
rates are projected to decline as the recovery
in Italy and Germany catches up with that in
France and some of the cyclically advanced
countries. Nevertheless, substantially
differences in underlying cyclical positions
are likely to persist for a period. Most of the
cyclically advanced countries continue to
experience higher than average inflation,
rapid growth in domestic credit, sharply
rising property prices, and, in Portugal, a
large current account deficit. In some cases,
particularly Ireland and possibly the
Netherlands, relatively clear signs of
overheating have emerged. While budgetary
positions in these countries are in most cases
in surplus, every effort appeared to have
been made to save the fiscal windfalls
arising from higher growth in order to avoid
fuelling demand pressures.
1.1.2.2 Non-eurozone economies
In the United Kingdom, GDP growth was
projected to pick up to 3.1 per cent in 2000
from 2.1 per cent in 1999, reflecting a
smaller deterioration of the trade balance
and continued strong domestic demand
growth, bolstered partly by the planned
expansion in government consumption.
Inflation has remained below the Bank of
England’s 2.5 per cent target, owing to
subdued wage pressure, falling price-cost
margin, and the strength of sterling.
Nevertheless, labour market conditions
remain tight with the unemployment rate (on
a claimant count basis) below 4.0 per cent.
During the year, the Bank of England
increased interest rates only twice, both at
the early stages of the year, by 50 basis
points taking the repo rate from 5.50 per
cent to 6.00 per cent, where it then remained
until the end of the year.
In Sweden, another country that has
remained outside the monetary union, GDP
growth was estimated at 4.5 per cent in
ANNUAL REPORT 2000 WORLD ECONOMIC CONDITIONS
- 9 -
2000, driven by strengthening domestic
demand and a firming up of net exports.
Nevertheless, some slack still remained in
the economy; wage increases have been
moderate, and core inflation was well below
the 2 per cent midpoint of the target zone.
Activity has also remained strong in Greece,
which, aided by a stability-oriented
economic policy and also introduction of
administrative measures to reduce inflation,
has helped it to successfully meet the
European Monetary Union (EMU)
convergence requirements. From January
2001, Greece will become the 12th member
of the Monetary Union.
In the smaller states, namely Denmark,
Norway and Switzerland, solid recovery was
also underway. In Norway and Denmark,
where the slowdown partly reflected policy
measures to address overheating, the
ensuing rebound has been led by rising
exports (for Norway, aided by higher oil
prices). Domestic demand increased in both
countries during 2000, as fiscal policies
returned to a broadly neutral stance.
In Switzerland, both exports and domestic
demand, aided by an accommodative
monetary stance, drove the recovery. As the
strength of the recovery became apparent,
the Central Bank appropriately moved to
tighten monetary conditions, while allowing
the franc to appreciate against the Euro.
1.1.3 Japan
For the year as a whole, Japanese real GDP
is estimated to have increased about 2.0 per
cent, a substantial improvement from the
very small increase of the previous year and
the decline recorded in 1998. Growth,
which was concentrated in the first part of
the year, was led by private nonresidential
investment. In contrast, residential
investment weakened as the effect of tax
incentives waned. Consumption rebounded
early in the year from a sharp decline at the
end of the previous year but then stagnated,
depressed in part by record-high
unemployment and concerns that ongoing
corporate restructuring could lead to further
job losses. Public investment, which gave a
major boost to the economy in 1999,
remained strong through the first half of the
year but then fell off sharply. For the year
as a whole the fiscal stance is estimated to
have been somewhat contractionary.
Inflation was negative for the second
consecutive year, with the prices of both
consumer goods and real estate continuing
to move lower.
In terms of monetary policy, the Bank of
Japan, which had adopted a zero interest rate
policy since February 1999, changed its

ANNUAL REPORT 2000 WORLD ECONOMIC CONDITIONS
- 10 -
stance in the second half of the year. More
precisely on August 11, the monetary policy
committee of the Bank decided by majority
vote to increase the key interest rate – the
uncollaterised overnight call rate – by 25
basis points to 0.25 per cent. According to
the Bank, the change was effected due to
substantial improvement in the economy.
At that time, the economy was showing
signs of recovery led mainly by business
fixed investment.
1.2 Developing economies
1.2.1 Asia
The rebound from the crisis of 1997-98
continued in Asia, with growth projected to
rise from 6.0 per cent in 1999 to more than
6.5 per cent in 2000 and 2001. The rapid
recovery of output in 1999 was fuelled by
continuing monetary and fiscal stimulus, as
well as external demand, supported by a
recovery in prices of electronics. Asia was
now the world’s largest supplier of such
equipment.
Continuing demand for information
technology goods helped underpin the
expansion, but private domestic demand
became a more important force propelling
regional growth in 2000, particularly in the
countries most advanced in recovery, where
fixed investment was increasing rapidly.
Activity also continued to be buttressed by
continuing robust growth in the region’s two
most populous economies, China and India.
Despite some concerns in financial markets
about the pace of structural reforms, and
political uncertainties, growth in Indonesia
was set to grow at about 4.0 per cent in 2000
and 5.0 per cent in 2001, supported by firm
oil prices, while activity in South Korea was
forecasted to moderate to 8.75 per cent in
2000 and 6.5 per cent in 2001. Fiscal
policies have been generally supportive of
activity, but were starting to move to a more
neutral stance. This process, which has
already started in Korea, was being initiated
in the Philippines, while elsewhere it is
planned to start in 2001. The export-led
nature of the recovery has led to strong
current account positions throughout the
regions, although surpluses were beginning
to fall in response to domestic recovery and
higher oil prices. External surpluses were
helping to insulate parts of the region from
some of the financial impact of tighter
global monetary conditions.
Economic data indicate that China, the
world’s most populous economy, continued
to grow at a robust pace. Stronger private
consumption and export supported real GDP
growth, set at 7.5 per cent in 2000, with
monetary policy remaining accommodative.
On the fiscal side, the authorities announced
a package of additional expenditures;

ANNUAL REPORT 2000 WORLD ECONOMIC CONDITIONS
- 11 -
however, buoyant revenues caused by strong
activity were shifting policy to a more
neutral stance. In India, the second largest
economy, economic performance has been
remarkable in recent years, despite the
adverse effects of the regional crisis on
exports and the more recent hike in world oil
prices. Growth for 2000 forecasted at 6.75
per cent, reflected continued strength in the
information technology sector and a rebound
in agricultural production.
1.2.2 Latin America
Latin America and the Caribbean continued
to recover from the effects of the emerging
market crises of 1997-98. Growth was
fuelled by buoyant exports, particularly to
the United States, as well as a recovery in
consumer confidence and spending that was
occurring despite falls in stock prices. Real
GDP, which was basically flat in 1999, was
expected to expand by a healthy 4.25 per
cent in 2000, reflecting healthy export
volumes and some improvement in the terms
of trade coming from higher commodity
prices. These aggregate trends, however,
mask important differences across countries.
Several countries, such as Brazil, Mexico,
and Chile, were exhibiting more rapid
growth than other countries in the region,
particularly those where economic and
political uncertainties were most acute.
Growth in Brazil continued to recover, led
by exports, which surged as a result of the
depreciation in early 1999. As the year
progressed, rising consumer spending and
investment also contributed to the increased
economic momentum. Real GDP was
projected to rise by 4.0 per cent in 2000 and
4.5 per cent in 2001. Chile was also
experiencing a recovery, supported by
buoyant consumer spending. In both
countries, confidence has been maintained
by responsible macroeconomic policies,
including inflation-targeting regimes. In
Brazil, the government targeted for public
sector primary surplus of 3.25 per cent of
GDP, which was expected to be consistent
with a further decline in public debt relative
to GDP.
Mexico’s economy continued to expand at a
healthy pace, as it has been doing since
1995, backed by prudent monetary policy, as
well as higher oil prices, rapid growth in the
United states, buoyant consumer spending,
and healthy demand for investment goods.
Growth was forecasted to accelerate to
almost 6.5 per cent in 2000 before falling
back slightly in 2001, while inflation was
projected to continue to decline as monetary
policy was tightened. Higher oil prices were
supporting the external position and the
fiscal policy.

ANNUAL REPORT 2000 WORLD ECONOMIC CONDITIONS
- 12 -
In Argentina, the economy was slowly
recuperating from the severe recession of
1999. This should continue in the coming
year in the absence of any external shocks.
Early in the year, the authorities introduced
a fiscal package that reduced planned
government outlays to minimise the
overshoot compared to the targeted deficit.
This helped moderate concerns in
international capital markets about fiscal
slippages, although on average financial
conditions remain tighter than in the latter
part of 1999. Against these headwinds real
GDP was set to grow at around 2 per cent in
2000 and the current account deficit was
anticipated to decline significantly.
Continued structural reform in the fiscal area
remain a high priority, including passing
laws tightening tax administration,
modifying revenue sharing arrangement
with provinces, and reforming the social
security system.
The Andean region, outside of Chile and
Peru, was particularly hard hit by 1998-99
recession. Activity was expanding again in
2000, but political uncertainties was slowing
progress on needed reforms and created
pressures to relax macroeconomic policies.
Business confidence remained weak in
Colombia, in part due to continuing internal
armed conflict, and the currency fell to
record lows against the U.S dollar. In
Venezuela the fiscal benefits of higher oil
prices were partially offset by increased
spending.
1.2.3 The Middle East and Africa
During the 1999-2000 period, the rebound in
world oil prices as well as the increases in
OPEC oil production quotas boosted
economic activity and prospects for most of
the oil-producing countries of the region.
The rise in oil prices and oil output led to
stronger fiscal and external balances in these
countries and also improved confidence and
greater domestic demand. Many of the non-
oil-producing countries of the region,
however, were faced with substantial terms-
of-trade losses as export prices of non-fuel
commodities and other primary goods
remained generally depressed, particularly
in real terms, while oil import prices rose
continuously.
Nonetheless, the upward trend in growth in a
number of these countries in 1999 and 2000
was due to the macroeconomic policies and
reforms that have made economic activity
more broad based and allowed these
countries to benefit from stronger export
market growth.
In the Middle East, economic growth among
the Gulf oil exporters was projected to turn
positive in 2000 and remain so in 2001.
Despite the improved growth prospects, as
well as external and fiscal balances, many of

ANNUAL REPORT 2000 WORLD ECONOMIC CONDITIONS
- 13 -
these countries are pressing ahead, albeit
sometimes slowly, structural reforms to
boost the non-oil private sector that were
initiated when much slower oil prices
threatened macroeconomic stability. For
example, in Saudi Arabia, the government
has been restructuring and corporatising the
telecommunication and utility sectors to
make them more attractive to private
investment, as well as revising laws and
regulations to improve the business
environment and attract foreign investment
and expertise.
Annual output growth in Africa was
projected at 3 ½ percent in 2000, rising to 4
½ percent in 2001, spurred by rebounds in
South Africa and oil-exporting countries as
well as continued strength in some of the
smaller economies. In South Africa, the
continent’s largest economy, the economic
recovery, while still fragile, was gaining
momentum, with output on track to grow 3
to 4 percent in each of the next two years.
The rebound has been supported by a
strengthening of public finances,
improvements in external competitiveness,
and the expansion in world output. The rand
has come under some pressure since the
beginning of 2000 year largely as a result of
the fallout of the turbulence in Zimbabwe
and decreased relative bond yields, but
progress continued to be made in reducing
the net open forward position of the Reserve
Bank, which has helped reduce the risks
premium on South African investment and
boost economic activity. Improvements in
productivity growth have helped dampen the
potential inflationary impact of the
economic recovery. Nevertheless, some
cost-cut pressures have been evident as a
result of the depreciation of the rand, and
flood-related surge in food prices. The
Reserve Bank is being careful in ensuring
that these developments do not undermine
confidence in the inflationary-targeting
framework.
2. Currency movements
2.1 The euro
The dollar showed particular strength in
2000 against the euro, the common currency
of 11 member countries of Western Europe.
During the first three quarters of the year,
the euro continued to weaken, and by late
October had fallen to a low of just above 82
cents, nearly one-third below its value when
it was introduced in January 1999. The
euro’s decline against the dollar through
most of the year, according to market
analysts, appeared to be due mainly to the
vigorous growth of real GDP and
productivity in the US. In September, a
concerted intervention operation by the
monetary authorities of G-7 countries,
including the US, was undertaken at the
request of European authorities to provide
support for the euro. The European Central

ANNUAL REPORT 2000 WORLD ECONOMIC CONDITIONS
- 14 -
Bank also made intervention purchases on
several occasions acting on its own. Late in
the year, the euro changed course and started
to move up strongly, reversing over half of
its decline witnessed earlier in the year.
This recovery of the euro against the dollar
appeared to reflect mainly a market
perception that, while growth was slowing
in both Europe and the US, the slowdown
was much sharper in the latter. For the year
as a whole, the dollar appreciated, on a net
basis about 7.0 per cent against the euro.
3. Trade and investment
3.1 The World Trade Organisation
According to an assessment by the director-
general of the World Trade Organisation
(WTO), the institution for trade and global
trade in general has been practically good in
2000. One year on from the protest and
anger of the Seattle summit, WTO was
starting to function effectively and fairly as
a forum where 140 governments get together
to negotiate rules, promote freer trade and
provide a transparent and predictable
framework for business. Freer trade means
faster economic growth, cheaper imports
and more choice for consumers. The
Organisation also help countries to settle
trade disputes.
In the first half of 2000, world trade rose by
14 per cent, four times faster than in 1999.
Asia’s exports rose by around a quarter.
Imports from the five Asian developing
countries most affected by the financial
crisis in 1997-98 rose above their pre-crisis
levels. Latin America’s exports rose by
about 20 per cent, the United States by 14
per cent. The WTO estimates that world
trade would rise by 10 per cent in 2000 as a
whole, as fast as in the best years of the
1990s.
At the WTO itself, progress has been made
on at least five issues. First, negotiations
have been launched on agriculture and
services, which together account for over
two-thirds of the world economy. The
world has seen a fall in food prices,
telephone calls and better financial services
and a spread of the internet. Liberalising
agriculture and manufacturing alone would
add over US$250 billion a year to the world
economy, according to the Centre for
Economic Policy Research in London. The
gains from services liberalisation, though
hard to quantify, could be even higher.
Secondly, the WTO has welcomed five new
members: Jordan, Georgia, Albania, Croatia
and Oman. Many more countries are about
to join. By far, the biggest is China, which
has concluded bilateral agreements with all
WTO members that requested one except
Mexico. The US Senate and House of
Representatives have both voted
convincingly for permanent normal trade
relations with China.

ANNUAL REPORT 2000 WORLD ECONOMIC CONDITIONS
- 15 -
Third, WTO is doing its upmost to help
developing countries get a better deal from
the world trading system. It has set up a
mechanism for dealing with their difficulties
in implementing the organisation’s
commitments. It has also worked through
an important package to help the poorest
countries. Twenty-seven richer countries,
including the United States and the 15
members of the European Union, have
offered to open their markets more.
Fourthly, the institution is involving all its
140 members in its work. It operates by
consensus, so every country – however
small – has a veto. Furthermore, it is using
the internet to keep its smaller members
better informed.
Finally, WTO is doing more to reconnect
itself with ordinary people everywhere.
Nearly all WTO documents are posted on its
website immediately.
The organisation is now ready to build on
2000’s achievements. The task as seen by
the director-general for the new year is to
broaden support for further multilateral
liberalisation.
3.2 China-US trade relations
Since the beginning of the year, with the
concern of top leaders and joint efforts from
both countries, China-US bilateral relations
have maintained a trend of stable
development. Bilateral economic and trade
relations have developed very fast with rapid
increase of China’s export to and import
from the United States. The two countries
reached a bilateral agreement in 1999 on
China’s joining the World Trade
Organisation (WTO).
According to statistics of the Chinese
customs, during the period from January to
October 2000, Sino-US bilateral trade
amount reached US$61.323 billion,
increasing by 23.4 per cent over the 1999
level. The toal amount of China’s export to
the US during the 10-month period was
US$43.367 billion, increasing by 27.2 per
cent whilst the total amount of China’s
import during the same period was
US$17.955 billion, rising by 15.1 per cent.
It is estimated that the total amount of
bilateral trade will set an all-time record and
reach about US$73.5 billion, accounting for
about 16 per cent of China’s total trade in
the whole year. The United States is
China’s second largest trading partner, and
China is the fourth largest trading partner of
the US.
Moreover, with the constant deepening of
reform and opening up and sustained
economic growth, the scale of US direct
investment in China has been growing year
after year. From January to November

ANNUAL REPORT 2000 WORLD ECONOMIC CONDITIONS
- 16 -
2000, China has approved 2,301 US
investment projects with a total contract
amount of US$7.326 billion. China has also
increased the establishment of companies in
the US. During the same period, 37 Chinese
funded enterprises have been approved with
a total amount of investment reaching
US$70.62 million.
Experts of foreign economic relations in
China are convinced that economic and
trade cooperation between China and the US
has great development potential and is of
complementary nature and mutually
beneficial.

SECTION TWO
Highlights of the Seychelles Economy
Overview
Despite yet another tough year, the
Seychelles economy continued to weather
the storm in 2000. Most indicators of real
GDP growth point to a slowdown as
industries once again struggled to cope with
the foreign exchange shortage. The
situation was not helped as inflows through
the commercial banks declined. Overall,
however, the signs were that there was a
notable degree of consolidation as the
budget deficit was reduced further and
liquidity growth slowed down.
No firm real GDP figures was yet available
at the time of publication, however, Central
Bank estimates based on a survey of
industries and that of the Management &
Information Systems Division (MISD)
suggest that growth in real output stood at
around 1.4 per cent.
Despite the fall in foreign exchange inflows,
as measured by commercial bank receipts,
the balance of payments position improved
significantly compared to the previous year,
mostly on account of a sharp improvement
in the current account.
Whilst growth in GDP output far from
achieved its full potential there were signs of
growth in some areas of economic activity
as reflected by an increase in sectoral output
growth.
For the year 2000, GDP is estimated at
R3450.4 million (nominal terms). A major
boost to income growth has been the tourism
industry, as both tourism arrivals and
income increased relative to the previous
year. Other sectors that achieved important
growth were in ‘electricity & water’,
‘building and construction’ and
‘telecommunications’.
- 17 -
ANNUAL REPORT 2000 HIGHLIGHTS OF THE SEYCHELLES ECONOMY
-18 -
Whilst a drop would have been preferable, it
was nonetheless encouraging to note that
though it remained on the high side at 6.3
per cent, the inflation rate remained
unchanged in 2000. There were however,
some marked changes in how the prices
moved during the year. There was a
slowdown in import prices compared to the
previous year, down from 10 per cent to
only 4.4 per cent. However, in respect of
local prices there was an increase in the rate
of change from 4.4 per cent to 7.2 per cent,
showing a movement from import prices
into local prices.
The budget deficit was estimated at 9.9 per
cent of the estimated nominal GDP for the
year, down from 11 per cent in 1999. In
monetary terms, the deficit narrowed by
R5.7 million to R342 million. The
improvement in the fiscal position compared
to 1999 resulted mostly from a decline in its
expenditure, with all major headings of
expenditure – current and capital outlays;
and net lending, recording reduced
expenditure relative to their budgeted levels.
The improved fiscal performance had a
positive spin-off effect on the monetary
sector as the lower demand for financing
translated into an abatement of liquidity
growth. Furthermore, the positive outcome
on the monetary side also reflected the
manner in which the government financed
its requirements in 2000 compared to the
previous years. It would be noted that at the
end of 1999, the government introduced a
limit on how much it borrows from the
Central Bank as advances, thus reducing the
monetisation process of the deficit. This
commitment to limit monetisation of
government deficit was announced by the
Finance Minister - Vice-President James
Michel in his budget address for 2000. In
2000, the government switched to the
commercial banks and the non-financial
sector for the bulk of its financing
requirements through the issues of
government paper (treasury bills, treasury
bonds & government stocks). This had a
direct impact on the growth of money
supply, which slowed down from 19 per
cent in 1999 to only 8.2 per cent in 2000.
There were no major changes in interest
rates during 2000. The two rates that are
under the ambit of the Central Bank, the
minimum savings rate and that of the
maximum lending rate remained at 3.0 per
cent and 10.0 per cent respectively. In terms
of the interest on time deposits, most
instruments registered declines in their
respective rates. Interest on treasury bills
remained on the tap system and the yields
stood at 4.502 per cent, 4.995 per cent, and
5.496 per cent for the 91-day, 182-day and
365-day bills respectively.

ANNUAL REPORT 2000 HIGHLIGHTS OF THE SEYCHELLES ECONOMY
-19 -
As already noted above, the year under
review saw an improvement in the external
position of Seychelles as indicated by the
balance of payments (BOP) estimates for the
year. Balance of payments figures (recorded
on a commitment basis) for 2000 show an
overall balance surplus of R109 million.
This represented an increase of R130 million
or 596 per cent relative to last year. This
significant improvement in the external
position of the economy was attributable
mainly to the current account, as the deficit
was reduced to R295 million, down from
R645 million in 1999.
In terms of the rate of exchange between the
Seychelles rupee and that of other
currencies, the rupee remained pegged to the
Seychelles Trade and Tourism Weighted
Basket, the peg introduced in May 1996. As
regards the movement of the local currency
vis-à-vis the major currencies, there was
somewhat a volatile fluctuation, which
ranged between negative 7.9 per cent and
plus 12 per cent.
Activity in the offshore sector managed by
the Seychelles International Business
Authority (SIBA) was significantly more
positive during the year under review. The
year was highlighted by the incorporation of
1.351 IBCs and one new trust, which
brought the total since the operations started
to 6, 159 IBCs and 21 trusts. SIBA also
issued three new SITZ licences.

SECTION THREE
Financial Survey
1. Overview
There were significant improvements in
the movements in the key monetary
indicators. The authorities would have
been encouraged to observe a marked
slowdown in liquidity and credit growth.
For the year as a whole, liquidity growth,
as measured by the movements in M2(p),
was only 8.2 per cent, down from 19 per
cent in 1999. As for credit, it grew by 10
per cent compared to 16 per cent over the
year earlier. This notable slowdown in the
pace of both these aggregates during the
year was helped by the strong government
commitment towards budget
consolidation.
During 2000, the government managed to
curb its fiscal deficit further and at the
same time financing that deficit in a less
expansionary manner, through the sale of
government paper rather than have
recourse to Central Bank advances.
Therefore, the switch from Central Bank
borrowing in favour of commercial bank
funding was a key factor in to curbing
monetary growth. During the year, the
government issued two new bonds with
authorised limits of R200 million and
R300 million respectively. As commercial
banks are the main investors in those
instruments, their lending to the
government increased during the course of
the year, albeit at a much slower pace, as
the lower fiscal deficit reduced
Government’s demand for financing.
However, despite these encouraging
developments outlined above, the foreign
exchange difficulties continued to be a
major concern for the authorities. Despite
- 20 -
ANNUAL REPORT 2000 FINANCIAL SURVEY
- 21 -
not putting new measures in place in the
year under review, the government has
indicated that it would be more vigorous in
its approach in the coming year towards
this problem.
As regards interest rates, there were no
changes to the level of interest rates.
Whilst the two interest rates set by the
Central Bank, namely the savings rate and
the maximum lending rate remained
unchanged, there was a general decline in
the market-determined rates, which are
mostly time deposits.
2. Monetary Policy Instruments1
Central banks use monetary policy
instruments to meet certain objectives and
in most cases, aiming to attain an
environment of stable and low inflation.
However, in Seychelles, the Central Bank
uses such instruments mostly to achieve a
manageable level of liquidity; to manage
foreign currency flows; and to fine-tune
interest rates.
2.1 Interest rate floor
As already noted, there was no change in
the minimum statutory interest rate floor
and the maximum lending rate during
2000. The saving rate remained at 3.0 per
cent per annum, and the maximum lending
rate was at 10.0 per cent per annum
throughout the year.
2.2 Minimum reserve requirement
The minimum reserve ratio, which is the
percentage of its liabilities that a
commercial bank is required to hold with
the Central Bank, remained unchanged at
2.5 per cent during the year. All banks
were able to maintain the ratio.
2.3 Local assets ratio2
The local asset ratio is the instrument that
is used by the Central Bank to influence
liquidity at commercial banks. All banks
operating in Seychelles were able to meet
this requirement, which since September
1998 was set at a minimum of 70 per cent.
__________________________________ 1 The minimum reserve requirement is a minimum ratio of cash reserves to eligible deposits that commercial banks are required to hold at the Central Bank. The higher is this ratio, the lower is the money multiplier, and thus the monetary impact of new injections of liquidity. The minimum reserve requirement was set at 20 per cent on 16 November 1992. As from 15 September 1998, this ratio was lowered to 2.5 per cent (see Section Eight in this report for further details). 2 With effect from 15 September 1998, the local assets ratio was raised from 50 per cent to 70 per cent.
ANNUAL REPORT 2000 FINANCIAL SURVEY
- 22 -
2.4 Central Bank advances to
banks3
Central Bank advances are available to
commercial banks to allow them to meet
shortfalls in liquidity. During 2000, total
advances to the commercial banks
increased further, rising by R167 million
or 53 per cent relative to the previous year.
Out of the R485 million disbursed, R463
million was repaid during the period,
leaving an average outstanding stock of
R6.1 million. The high level of advances
during the year reflected the tight liquidity
positions that banks experienced at times,
particularly towards the end of the year,
when the level of transactions by
economic agents tended to rise faster
(transactions demand for money).
2.5 Open market operations4
Open-market operations is one of the
instruments that a Central Bank can use to
regulate the degree of liquidity in the
economy. Though it has been used in a
limited way in Seychelles in the past, since
last year, this strategy has become more
prominent to control the high level of
liquidity in the Seychelles economy. With
the commitment of the government to
reduce the monetisation of its deficit, by
on one hand, limiting the amount it
borrows from the Central Bank, and on the
other, by issuing securities through the
Bank, it has help to reduce the monetary
growth significantly in 2000. During the
year, the government issued two new
treasury bonds with limits of R200 million
and R300 million.
3. Money Supply
Also in 2000, liquidity growth, as
measured by the broad money aggregate
M2(p) increased by only 8.2 per cent,
which represented a decline of 11 per cent
relative to last year, when it grew by 19
per cent (Chart 3.1). This significant
slowdown in money growth in the
economy could be reviewed as a
welcoming development as it set the stage
for further stabilisation, not only in
liquidity, but also in other main economic
indicators. It is also the first time since
1987 that money growth has been below
the 10 per cent mark.
________________________________________
3 This is the sole standing facility offered by the Central Bank of Seychelles. Since September 1993 the rate on advances has been set at 50 basis points above the average of the last tender rate, rounded to 1/8 of 1 per cent. 4 Open market operations are purchases/sales of financial securities by Central Bank in the open market to regulate the money supply. Such instruments frequently used to mop up excess liquidity. The securities involved can be both short and long term.

ANNUAL REPORT 2000 FINANCIAL SURVEY
- 23 -
Chart 3.1. Growth rates of the money supply aggregates for 1995 to 2000
-40.0
-30.0
-20.0
-10.0
0.0
10.0
20.0
30.0
40.0
50.0
60.0
1995 1996 1997 1998 1999 2000
Years
Per
cen
t
M2(p) M2 M1 Pipeline deposits
A more detailed analysis of the
deceleration in the pace of the money
growth showed that it stemmed from both
domestic and external factors, with the
latter being influenced by a decline of
R126 million in net foreign assets. From
the domestic side, the pace of money
supply growth declined due to the
moderate growths in bank deposits and in
currency with the public.
This was reflected in the slower growth
rate of M2, which consist of M1 (currency
with public plus demand deposits) and
quasi-money (time deposits plus savings
deposits), compared to the previous year.
M2 grew by 9.1 per cent compared to 22
per cent in the preceding year, influenced
by a 6.2 per cent increase in M1 and an 11
per rise in quasi-money. Last year, these
aggregates grew by 37 per cent and 14 per
cent respectively.
The significant abatement in the growth
rate of M1 was caused by both its
components - "demand deposits" and
"currency with public". They grew at a
considerably slower pace than was
observed in the preceding year. During
2000, "demand deposits" grew by R50
million or 6.1 per cent whilst "currency
with public" rose by R16 million or 6.6
per cent. Of the increase of "demand
deposits", the private sector accounted for
82 per cent, as demand deposits of the
parastatal sector rose by R8.0 million only.
ANNUAL REPORT 2000 FINANCIAL SURVEY
- 24 -
Table 3.1 Monetary Survey;1 1995-2000
1995 1996 1997 1998 1999 2000
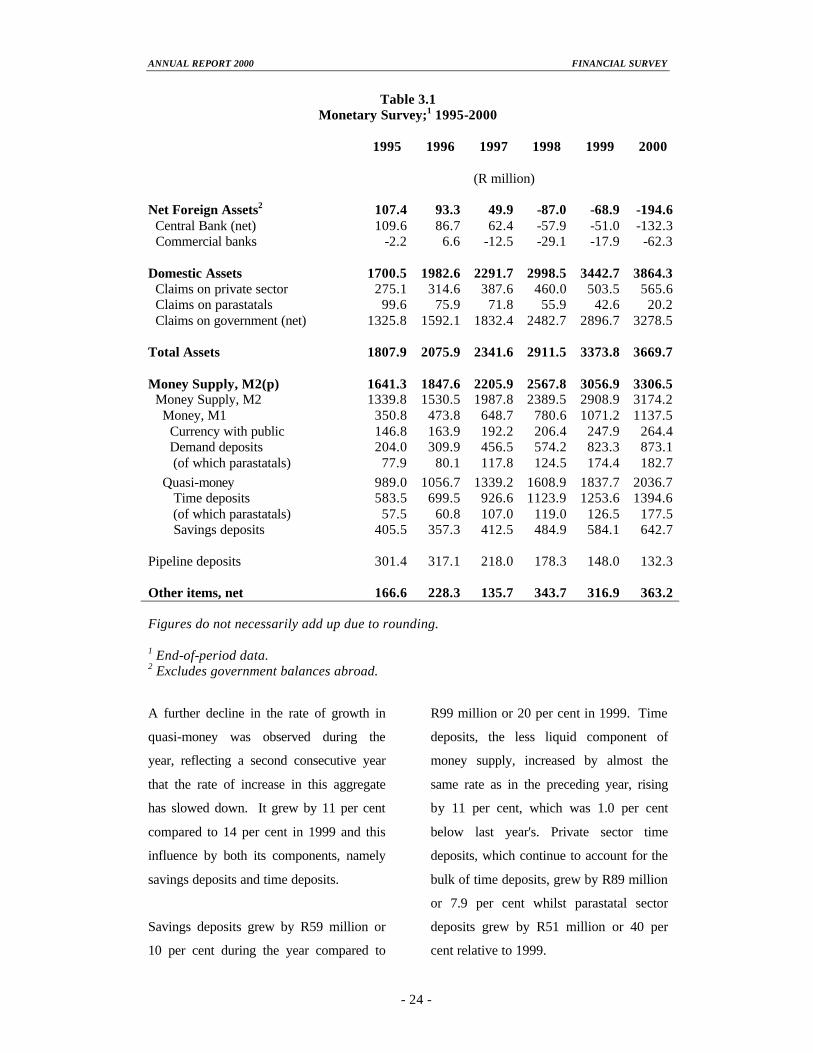
(R million) Net Foreign Assets2 107.4 93.3 49.9 -87.0 -68.9 -194.6 Central Bank (net) 109.6 86.7 62.4 -57.9 -51.0 -132.3 Commercial banks -2.2 6.6 -12.5 -29.1 -17.9 -62.3 Domestic Assets 1700.5 1982.6 2291.7 2998.5 3442.7 3864.3 Claims on private sector 275.1 314.6 387.6 460.0 503.5 565.6 Claims on parastatals 99.6 75.9 71.8 55.9 42.6 20.2 Claims on government (net) 1325.8 1592.1 1832.4 2482.7 2896.7 3278.5 Total Assets 1807.9 2075.9 2341.6 2911.5 3373.8 3669.7 Money Supply, M2(p) 1641.3 1847.6 2205.9 2567.8 3056.9 3306.5 Money Supply, M2 1339.8 1530.5 1987.8 2389.5 2908.9 3174.2 Money, M1 350.8 473.8 648.7 780.6 1071.2 1137.5 Currency with public 146.8 163.9 192.2 206.4 247.9 264.4 Demand deposits 204.0 309.9 456.5 574.2 823.3 873.1 (of which parastatals) 77.9 80.1 117.8 124.5 174.4 182.7
Quasi-money 989.0 1056.7 1339.2 1608.9 1837.7 2036.7 Time deposits 583.5 699.5 926.6 1123.9 1253.6 1394.6 (of which parastatals) 57.5 60.8 107.0 119.0 126.5 177.5 Savings deposits 405.5 357.3 412.5 484.9 584.1 642.7 Pipeline deposits 301.4 317.1 218.0 178.3 148.0 132.3 Other items, net 166.6 228.3 135.7 343.7 316.9 363.2 Figures do not necessarily add up due to rounding. 1 End-of-period data. 2 Excludes government balances abroad.
A further decline in the rate of growth in
quasi-money was observed during the
year, reflecting a second consecutive year
that the rate of increase in this aggregate
has slowed down. It grew by 11 per cent
compared to 14 per cent in 1999 and this
influence by both its components, namely
savings deposits and time deposits.
Savings deposits grew by R59 million or
10 per cent during the year compared to
R99 million or 20 per cent in 1999. Time
deposits, the less liquid component of
money supply, increased by almost the
same rate as in the preceding year, rising
by 11 per cent, which was 1.0 per cent
below last year's. Private sector time
deposits, which continue to account for the
bulk of time deposits, grew by R89 million
or 7.9 per cent whilst parastatal sector
deposits grew by R51 million or 40 per
cent relative to 1999.
ANNUAL REPORT 2000 FINANCIAL SURVEY
- 25 -
The other principal component of broad
money M2(p) is pipeline deposits. During
2000, clearing of pipeline deposits
continued with a reduction of R16 million
or 11 per cent. This decline however, was
significantly less than the R30 million
cleared in 1999. This year's outcome
reflects the further decline in the amount
of foreign exchange through entered the
banking system, from R818 million in
1999 to R755 million in 2000.
4. Net Foreign Assets
Seychelles’ net foreign asset position
deteriorated significantly during 2000,
falling by 183 per cent relative to the
previous year. In aggregate, the country's
net foreign assets at the end of the year,
which comprises Central Bank and
commercial bank reserves, stood at
negative R195 million, compared to
negative R69 million at the end of 1999.
This unfavourable outcome in 2000 was
attributed to declines in both the Central
Bank and commercial banks’ reserves.
The central bank’s reserves fell by R81
million whilst the net foreign reserve
position of the banking sector declined
from negative R18 million to negative R62
million.
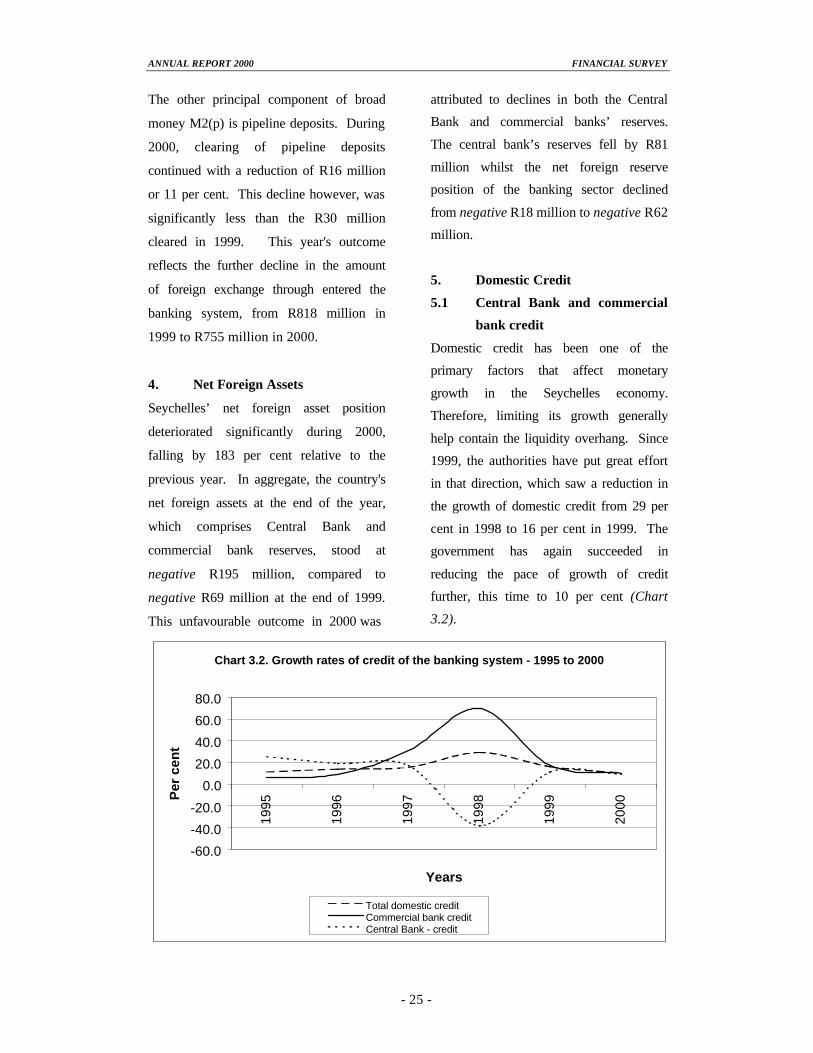
5. Domestic Credit
5.1 Central Bank and commercial
bank credit
Domestic credit has been one of the
primary factors that affect monetary
growth in the Seychelles economy.
Therefore, limiting its growth generally
help contain the liquidity overhang. Since
1999, the authorities have put great effort
in that direction, which saw a reduction in
the growth of domestic credit from 29 per
cent in 1998 to 16 per cent in 1999. The
government has again succeeded in
reducing the pace of growth of credit
further, this time to 10 per cent (Chart
3.2).
Chart 3.2. Growth rates of credit of the banking system - 1995 to 2000
-60.0
-40.0
-20.0
0.0
20.0
40.0
60.0
80.0
1995
1996
1997
1998
1999
2000
Years
Per
cen
t
Total domestic creditCommercial bank creditCentral Bank - credit

ANNUAL REPORT 2000 FINANCIAL SURVEY
- 26 -
The two principal lenders in the economy,
namely the commercial banks and Central
Bank, influenced the decline in the rate of
growth in 2000. Total commercial banks’
credit expanded by R319 million or 10 per
cent compared to R450 million or 17 per
cent in 1999. Credit of the Central Bank
grew by R58 million or 9.2 per cent during
the year, compared to a rise of 11 per cent
in 1999.
Table 3.2
Credit;1/2 1995-2000 1995 1996 1997 1998 1999 2000 (R million) Total Credit 1879.1 2139.8 2473.0 3197.6 3712.8 4090.3 Commercial banks 1215.7 1349.4 1546.2 2622.6 3072.7 3391.5 Claims on private sector 275.1 314.6 387.6 460.0 503.5 565.6 Claims on parastatals 99.6 75.9 71.8 55.9 42.6 20.2 Claims on government 841.0 958.9 1086.9 2106.7 2526.6 2805.7 Of which: Dev. Fund Stocks (64.6) (68.6) (82.0) (89.1) (96.2) (100.7) Treasury bonds (205.4) (308.0) (326.1) (1130.7) (770.6) (903.6) Treasury bills (484.1) (471.9) (608.8) (832.2) (1621.6) (1777.1) Central Bank 663.3 790.5 926.8 575.0 640.1 698.8 Claims on government 663.3 790.5 926.8 575.0 640.1 698.8 Of which: Advances (452.4) (503.6) (923.2) (469.0) (623.9) (395.8) Treasury bonds (23.3) (23.4) (3.2) (0.05) (0.05) (300.7) Treasury bills (184.0) (259.9) (0.4) (106.0) (16.2) (2.3) Figures do not necessarily add up due to rounding. 1 End-of period data. 2 All figures for stocks, bonds and bills are at cost value. Unlike the Central Bank, which lends only
to the Government, commercial banks also
lend to the private sector and parastatals.
Analysing the different movements in
these portfolios of debt Chart 3.3, it was
observed that there was an increase in
credit extended to the private sector, rising
from 9.5 per cent in 1999 to 12 per cent in
the current year under review. For the
government, there continued to be a
further slowdown in its growth, falling to
11 per cent compared to a 20 per cent rise
in the previous year. This slowdown in
the growth of government claims from the
commercials reflected the lower than
forecasted deficit during the year, which
thus reduced the need to borrow. The
lower demand for funds by the
government has also released funds to
other sectors, namely to the private sector,
which has seen an increase in its growth as
described above. In terms of the
parastatals, there was a further decline,
this time by 53 per cent relative to 1999.
ANNUAL REPORT 2000 FINANCIAL SURVEY
- 27 -
Chart 3.3. Growth rates of credit held by the economic agents - 1995 to 2000
-60.0
-40.0
-20.0
0.0
20.0
40.0
60.0
80.0
100.0
120.0
1995 1996 1997 1998 1999 2000
Years
Per
cen
t
Commercial bank - parastatal Commercial bank - private
Commercial bank - government Central Bank - government
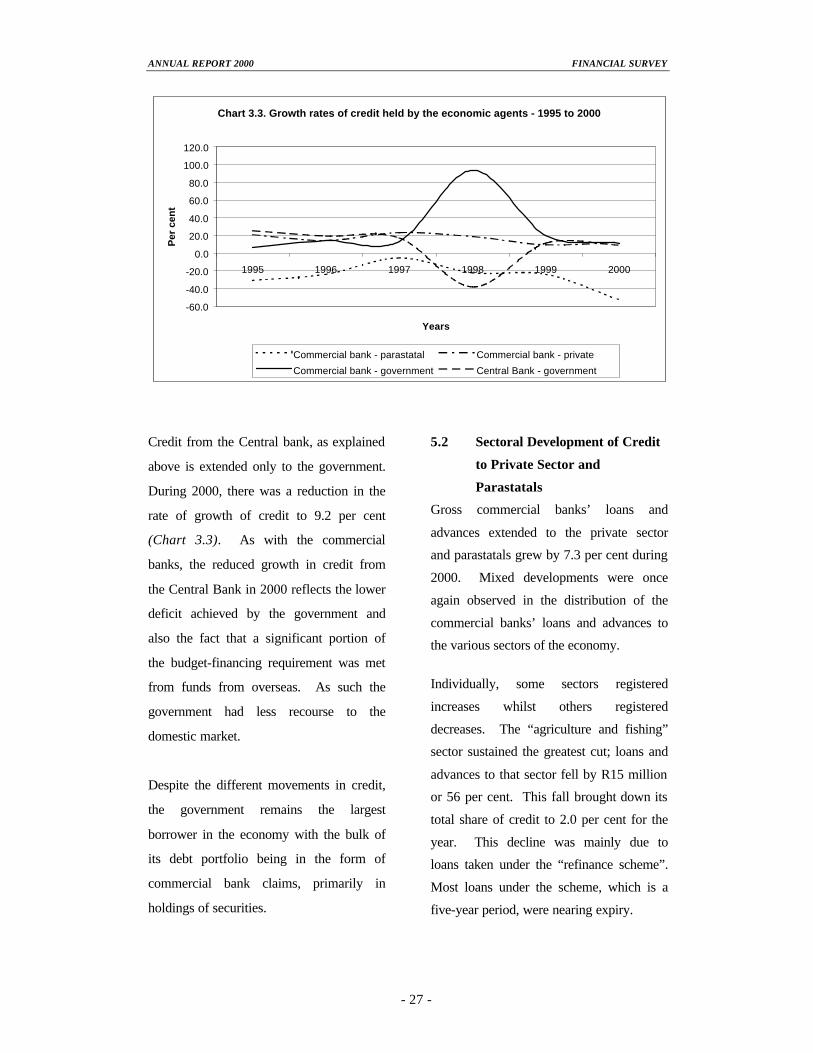
Credit from the Central bank, as explained
above is extended only to the government.
During 2000, there was a reduction in the
rate of growth of credit to 9.2 per cent
(Chart 3.3). As with the commercial
banks, the reduced growth in credit from
the Central Bank in 2000 reflects the lower
deficit achieved by the government and
also the fact that a significant portion of
the budget-financing requirement was met
from funds from overseas. As such the
government had less recourse to the
domestic market.
Despite the different movements in credit,
the government remains the largest
borrower in the economy with the bulk of
its debt portfolio being in the form of
commercial bank claims, primarily in
holdings of securities.
5.2 Sectoral Development of Credit
to Private Sector and
Parastatals
Gross commercial banks’ loans and
advances extended to the private sector
and parastatals grew by 7.3 per cent during
2000. Mixed developments were once
again observed in the distribution of the
commercial banks’ loans and advances to
the various sectors of the economy.
Individually, some sectors registered
increases whilst others registered
decreases. The “agriculture and fishing”
sector sustained the greatest cut; loans and
advances to that sector fell by R15 million
or 56 per cent. This fall brought down its
total share of credit to 2.0 per cent for the
year. This decline was mainly due to
loans taken under the “refinance scheme”.
Most loans under the scheme, which is a
five-year period, were nearing expiry.

ANNUAL REPORT 2000 FINANCIAL SURVEY
- 28 -
Table 3.3
Commercial Banks – Loans and Advances To Non-Government Sector by Economic Sectors;1 1996-2000
1996 1997 1998 1999 2000 1996 1997 1998 1999 2000 (R million) (per cent) Total Advances 338.3 459.3 515.8 546.0 585.8 100.0 100.0 100.0 100.0 100.0 Agriculture & fishing 29.8 26.7 26.6 26.6 11.6 8.8 5.8 5.2 4.9 2.0 of which: Refinance scheme 18.0 18.8 18.3 18.8 3.1 5.3 4.1 3.5 3.4 0.5 Manufacturing 10.4 9.0 33.8 3.4 4.8 3.1 2.0 6.6 0.6 0.8 of which: Refinance scheme 8.0 7.0 29.0 0.0 0.0 2.4 1.5 5.6 0.0 0.0 Construction 13.1 15.8 22.9 20.6 29.8 3.4 3.3 3.4 4.4 3.8 Transportation 21.0 14.6 8.6 4.8 4.7 6.2 3.2 1.7 0.9 0.8 Tourist facilities 80.5 82.2 75.1 87.4 107.7 23.8 17.9 14.6 16.0 18.4 Wholesale & Retail trade 55.3 64.0 58.8 51.3 38.7 16.3 13.9 11.4 9.4 6.6 Other businesses 50.3 69.8 81.9 104.6 99.5 14.9 15.2 15.9 19.2 17.0 Private households & Non-profit organisations 77.8 177.3 208.2 247.3 288.9 23.0 38.6 40.4 45.3 49.3 of which: Mortgage loans 29.3 93.0 80.5 114.2 156.6 8.7 20.2 15.6 20.9 26.7 Figures do not necessarily add up due to rounding. 1 End-of-period data.
The most notable increase was observed in
credit granted to the construction sector.
Loans and advances made to that sector
rose by R9 million or 45 per cent during
the year to bring its share of total loans to
5.1 per cent. Loans and advances to the
transport sector fell further despite only by
1.6 per cent whilst the most significant
change occurred in respect of loans and
advances to the other business sector.
During the year, loans and advances to
other businesses fell by 4.9 per cent
compared to an increase of 28 per cent in
1999. This decline brought down its
percentage share of total credit by 2.2
percentage points to 17 per cent, in
relation to 1999. The other significant fall
was registered in respect of credit to the
trade sector; that sector lost 2.8 per cent of
its share of total credit by being granted 25
per cent less credit than the preceding
year.
However, the “manufacturing” and
“private household” sectors benefited from
42 per cent and 17 per cent increases in
credit allocated to them. During the year
2000, the tourism sector was granted 23
per cent or R18 million more credit than in
the preceding year. This growth brought
its percentage share of total to 18 per cent.
5.3 Development Bank Credit5
The Development Bank of Seychelles
(DBS) provides credit to mostly small to
medium sized enterprises, which generally
cannot obtain advances from commercial
banks. Data provided to the Central Bank
by DBS showed that total advances grew
during 2000, depicting an increase in
______________________________ 5 From 17 January 1994, the Development Bank of Seychelles provided credit to Seychellois investors at a concessionary rate of 12 per cent per annum. To qualify as ‘Seychellois’, Seychellois nationals must own at least 50 per cent of the investment. The minimum contribution for the investor was raised to 25 per cent from 15 per cent at the same occasion. The Development Bank does not provide credit for purposes of working capital. Previously it had lent at 12 per cent per annum for loans in excess of R50,000, rates varied between 9 per cent and 11 per cent depending on economic sector. This rule had been implemented on 17 July 1991.
ANNUAL REPORT 2000 FINANCIAL SURVEY
- 29 -
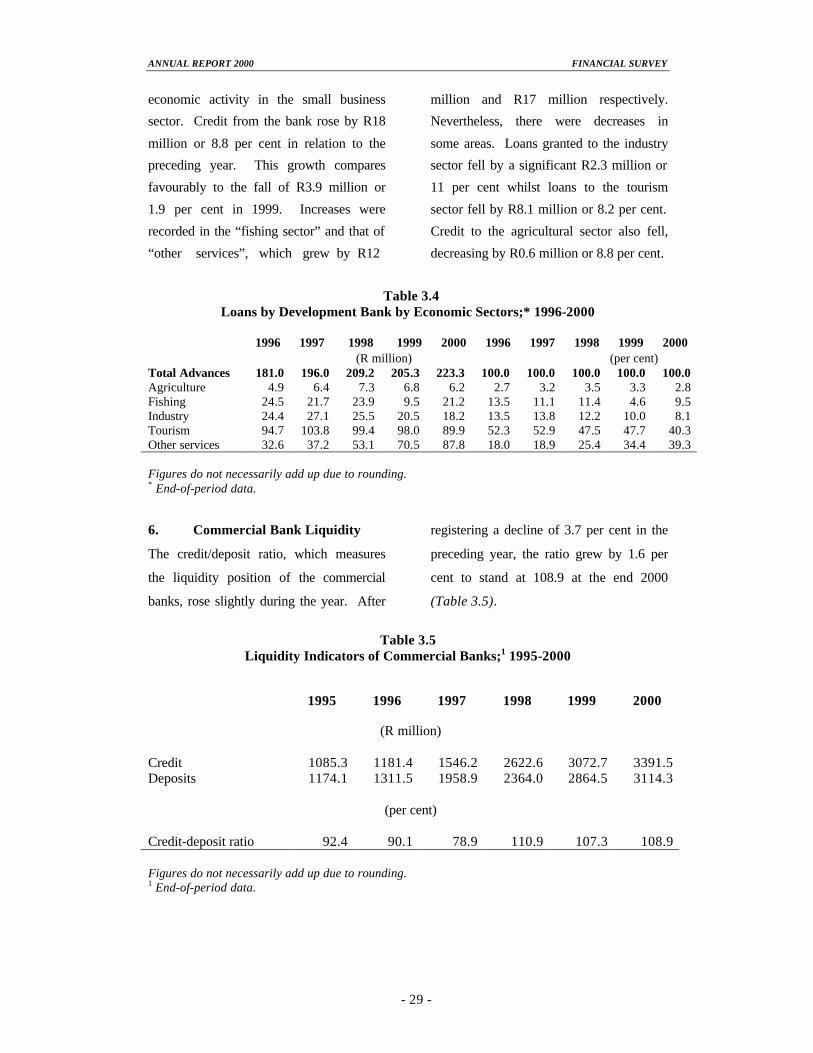
economic activity in the small business
sector. Credit from the bank rose by R18
million or 8.8 per cent in relation to the
preceding year. This growth compares
favourably to the fall of R3.9 million or
1.9 per cent in 1999. Increases were
recorded in the “fishing sector” and that of
“other services”, which grew by R12
million and R17 million respectively.
Nevertheless, there were decreases in
some areas. Loans granted to the industry
sector fell by a significant R2.3 million or
11 per cent whilst loans to the tourism
sector fell by R8.1 million or 8.2 per cent.
Credit to the agricultural sector also fell,
decreasing by R0.6 million or 8.8 per cent.
Table 3.4 Loans by Development Bank by Economic Sectors;* 1996-2000
1996 1997 1998 1999 2000 1996 1997 1998 1999 2000 (R million) (per cent) Total Advances 181.0 196.0 209.2 205.3 223.3 100.0 100.0 100.0 100.0 100.0 Agriculture 4.9 6.4 7.3 6.8 6.2 2.7 3.2 3.5 3.3 2.8 Fishing 24.5 21.7 23.9 9.5 21.2 13.5 11.1 11.4 4.6 9.5 Industry 24.4 27.1 25.5 20.5 18.2 13.5 13.8 12.2 10.0 8.1 Tourism 94.7 103.8 99.4 98.0 89.9 52.3 52.9 47.5 47.7 40.3 Other services 32.6 37.2 53.1 70.5 87.8 18.0 18.9 25.4 34.4 39.3 Figures do not necessarily add up due to rounding. * End-of-period data.
6. Commercial Bank Liquidity
The credit/deposit ratio, which measures
the liquidity position of the commercial
banks, rose slightly during the year. After
registering a decline of 3.7 per cent in the
preceding year, the ratio grew by 1.6 per
cent to stand at 108.9 at the end 2000
(Table 3.5).
Table 3.5
Liquidity Indicators of Commercial Banks;1 1995-2000 1995 1996 1997 1998 1999 2000
(R million) Credit 1085.3 1181.4 1546.2 2622.6 3072.7 3391.5 Deposits 1174.1 1311.5 1958.9 2364.0 2864.5 3114.3
(per cent) Credit-deposit ratio 92.4 90.1 78.9 110.9 107.3 108.9 Figures do not necessarily add up due to rounding. 1 End-of-period data.
ANNUAL REPORT 2000 FINANCIAL SURVEY
- 30 -
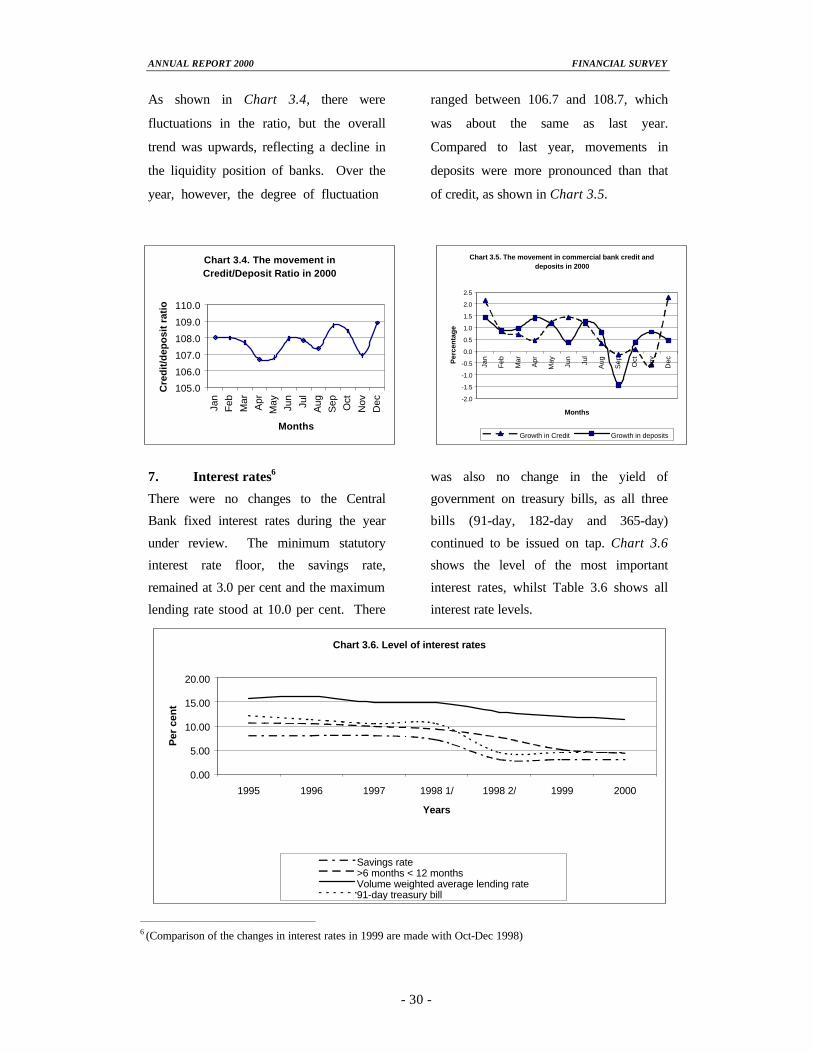
As shown in Chart 3.4, there were
fluctuations in the ratio, but the overall
trend was upwards, reflecting a decline in
the liquidity position of banks. Over the
year, however, the degree of fluctuation
ranged between 106.7 and 108.7, which
was about the same as last year.
Compared to last year, movements in
deposits were more pronounced than that
of credit, as shown in Chart 3.5.
7. Interest rates6
There were no changes to the Central
Bank fixed interest rates during the year
under review. The minimum statutory
interest rate floor, the savings rate,
remained at 3.0 per cent and the maximum
lending rate stood at 10.0 per cent. There
was also no change in the yield of
government on treasury bills, as all three
bills (91-day, 182-day and 365-day)
continued to be issued on tap. Chart 3.6
shows the level of the most important
interest rates, whilst Table 3.6 shows all
interest rate levels.
Chart 3.6. Level of interest rates
0.00
5.00
10.00
15.00
20.00
1995 1996 1997 1998 1/ 1998 2/ 1999 2000
Years
Per
cen
t
Savings rate>6 months < 12 monthsVolume weighted average lending rate91-day treasury bill
Chart 3.4. The movement in Credit/Deposit Ratio in 2000
105.0
106.0
107.0
108.0
109.0
110.0
Jan
Feb
Mar
Apr
May Jun
Jul
Aug
Sep Oct
Nov
Dec
Months
Cre
dit
/dep
osi
t ra
tio
Chart 3.5. The movement in commercial bank credit and deposits in 2000
-2.0
-1.5
-1.0
-0.5
0.0
0.5
1.0
1.5
2.0
2.5
Jan
Feb
Mar
Apr
May Jun
Jul
Aug
Sep Oct
Nov
Dec
Months
Per
cen
tag
e
Growth in Credit Growth in deposits
_____________________________________________
6 (Comparison of the changes in interest rates in 1999 are made with Oct-Dec 1998)

ANNUAL REPORT 2000 FINANCIAL SURVEY
- 31 -
As regards the market-determined interest
rates, there was again a general decline
during 2000. Nevertheless, the
movements in these rates were less
pronounced than they were in 1999. All
the rates on time deposits, except for the
rate on deposits with maturity between 3
months and 6 months and the deposits
with maturity above twelve months, fell on
average relative to 1999.
The rate on deposits maturing within 7
days fell by 14 basis points to reach 2.79
per cent at the end of the year, this after
registering a rise of 18 basis points in
1999. Interest on deposits with maturity
between 7 days and 3 months fell by 36
basis points to average 4.77 per cent. The
most significant decline was recorded in
respect of the rate on deposits with
maturity between 6 and 12 months, which
fell by 76 basis points relative to the
previous year, to reach 4.29 per cent. The
only increase as stated above was on
deposits with maturity between 3 months
and 6 months, which rose by only 5 basis
points whilst the rate on deposits which
maturity exceeds 12 months rose by a
negligible 1 basis point.
Table 3.6
Interest Rates;1/2 1995-2000 1995 1996 1997 1 9 9 8 1999 2000 Jan-
Sep Oct-Dec
(per cent) Volume-weighted average deposit rates: Savings rate 8.00 8.00 8.00 7.11 3.00 3.00 3.00 Time deposits 7 days 8.74 8.36 7.86 7.11 2.75 2.93 2.79 > 7 days < 3 months 9.22 9.90 9.20 8.03 6.03 5.13 4.77 > 3 months < 6 months 9.48 9.44 9.11 8.77 6.94 4.71 4.76 > 6 months < 12 months 10.65 10.50 9.91 9.31 7.64 5.05 4.29 > 12 months 10.70 11.30 8.46 7.18 5.23 5.13 5.14 Volume-weighted Average lending rate 15.76 16.21 14.88 14.88 12.92 12.01 11.45 91-day treasury bill rate 12.15 11.33 10.50 10.50 4.50 4.50 4.50 1 Averages of quarterly data, compiled on an end-of-period basis, whereas that of the 91-day bill rate is the average of monthly data, compiled on an end-of-period basis. 2 With the exception of the 91-day bill rate, all other figures differ to the 1994 Annual Report due to revision.
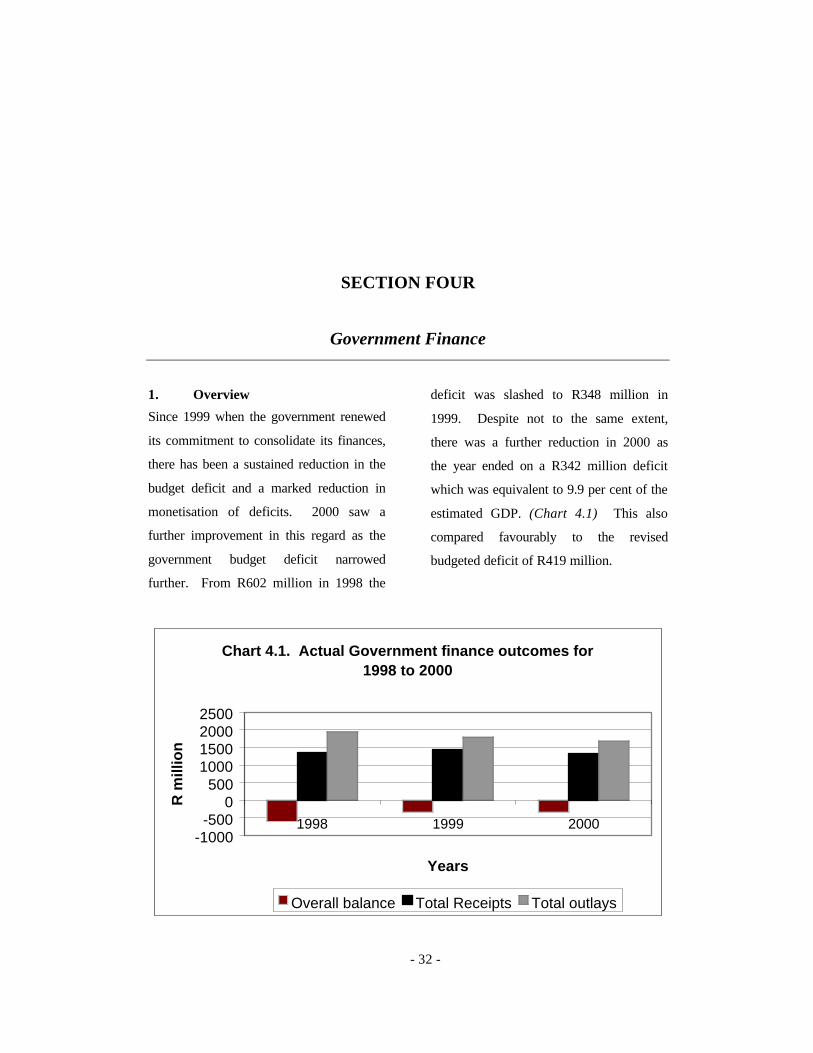
SECTION FOUR
Government Finance
1. Overview
Since 1999 when the government renewed
its commitment to consolidate its finances,
there has been a sustained reduction in the
budget deficit and a marked reduction in
monetisation of deficits. 2000 saw a
further improvement in this regard as the
government budget deficit narrowed
further. From R602 million in 1998 the
deficit was slashed to R348 million in
1999. Despite not to the same extent,
there was a further reduction in 2000 as
the year ended on a R342 million deficit
which was equivalent to 9.9 per cent of the
estimated GDP. (Chart 4.1) This also
compared favourably to the revised
budgeted deficit of R419 million.
Chart 4.1. Actual Government finance outcomes for 1998 to 2000
-1000-500
0500
1000150020002500
1998 1999 2000
Years
R m
illio
n
Overall balance Total Receipts Total outlays
- 32 -
ANNUAL REPORT 2000 GOVERNMENT FINANCE
- 33 -
The R342 million deficit was the result of
expenditure, which totalled R1,675 million,
exceeding revenue of R1,333 million. In
relation to budget, it was the shortfall in
receipts that proved the determining factor in
explaining the overall outcome. Total revenue
was R195 million below budget, which
significantly outweighed the savings in total
outlays, particularly in net lending and current
expenditure. Net lending posted a saving of
R191 million whilst current outlays were in
aggregate R82 million short of expectations.
Whilst capital expenditure recorded an
overrun, this was minimal, amounting to R1.9
million, on account of development grants.
Whilst overall development grants came in
some R41 million over budget, savings of R8.3
million and R31 million in “compensation for
land acquisiton” and “capital projects”
respectively helped contain the overall capital
spending.
Unlike in recent years, foreign loans were
the main source of finance for the
budgetary shortfall on a net basis. Net
foreign financing amounted to R461
million, with inflows of R501 million and
repayment of R40 million. From the
domestic market, the government raised
R8.5 million (net). The balance was made
up for by a R127 million increase in
government cash balances.
Compared to the previous year, the
shortfall in fiscal receipts over outlays
narrowed by R5.7 million. As already
noted, in 1999 the deficit stood at R348
million, which was 11 per cent of GDP.
The decline to R342 million was due
primarily to a cutback in government
expenditure as receipts were lower than in
the previous year. Provisional government
finance data shows that there was an
abatement of R113 million in total
spending compared to the 1999 level,
mainly on account of net lending.
Contrary to the positive developments on
the expenditure side, however, revenue
performed less encouragingly that last
year, falling by R107 million. This
reduction was attributable primarily to
lower current receipts. There were
nonetheless, improved performances in
certain categories of current revenue, most
notably in the collection of business tax,
which exceeded the 1999 level by R22
million.

ANNUAL REPORT 2000 GOVERNMENT FINANCE
- 34 -
Table 4.1 Government Budget; 1998- 2001
Summary
1998 1998 1999 1999 2000 2000 2001 Revised Revised Revised Budget Actual1 Budget Actual1 Budget Actual1 Budget
(R million)
Total Receipts 1379 1340 1484 1440 1528 1333 1405 Current receipts 1369 1312 1400 1400 1477 1283 1389 Of which: Trades tax [553] [575] [602] [577] [591] [578] [610] Transfers from Social Security [100] [66] [125] [77] [80] [80] [95] Business/income tax [161] [165] [182] [223] [205] [244] [219] Grants 10 28 84 41 51 50 16 Total Outlays 1692 1942 1822 1788 1947 1675 1650 Current outlays 1440 1380 1314 1352 1440 1358 1468 Appropriation items 1075 1025 1060 1019 1149 1083 1226 Of which: Ministries/departments [730] [707] [731] [705] [735] [712] [728] Social Security contributions [120] [120] [119] [119] [119] [119] [125] Current outlays to parastatals [37] [38] [32] [32] [33] [35] [71] Charges 364 355 254 333 291 274 242 Of which: Interest payments [338] [329] [243] [322] [280] [263] [231] Capital outlays 222 412 457 402 461 463 263 Net lending 30 150 52 33 46 -145 -80 Of which: Parastatals [28] [67] [22] [7] [17] [-47] [-80] Primary Balance2 25 -273 -95 -26 -139 -79 -14 Overall Balance -313 -602 -338 -348 -419 -342 -245 Financing 313 602 338 348 419 342 245 Foreign loans (net) -27 -27 47 -65 208 461 92 Domestic loans (net) 320 624 271 447 210 9 153 Cash movements 20 6 20 -34 0 -127 0 Memorandum Items: Amortisation of loans 227 245 227 245 849 876 390 Foreign loans 67 80 91 100 112 40 90 Domestic loans 159 164 758 776 278 604 589 Figures do not necessarily add up due to rounding. 1 These series are subject to audit and might be revised accordingly. 2 The primary balance is obtained by excluding interest payments from the overall balance. Source: Ministry of Finance
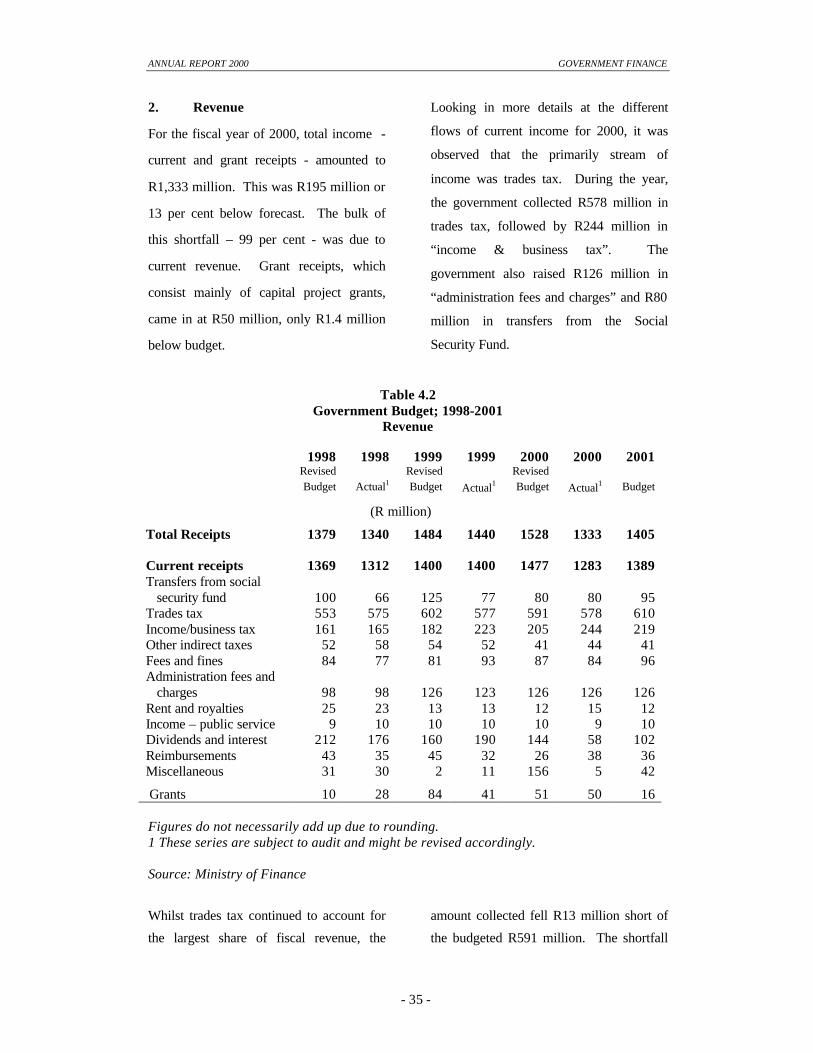
ANNUAL REPORT 2000 GOVERNMENT FINANCE
- 35 -
2. Revenue
For the fiscal year of 2000, total income -
current and grant receipts - amounted to
R1,333 million. This was R195 million or
13 per cent below forecast. The bulk of
this shortfall – 99 per cent - was due to
current revenue. Grant receipts, which
consist mainly of capital project grants,
came in at R50 million, only R1.4 million
below budget.
Looking in more details at the different
flows of current income for 2000, it was
observed that the primarily stream of
income was trades tax. During the year,
the government collected R578 million in
trades tax, followed by R244 million in
“income & business tax”. The
government also raised R126 million in
“administration fees and charges” and R80
million in transfers from the Social
Security Fund.
Table 4.2 Government Budget; 1998-2001
Revenue
1998 1998 1999 1999 2000 2000 2001 Revised Revised Revised Budget Actual1 Budget Actual1 Budget Actual1 Budget
(R million) Total Receipts 1379 1340 1484 1440 1528 1333 1405 Current receipts 1369 1312 1400 1400 1477 1283 1389 Transfers from social security fund 100 66 125 77 80 80 95 Trades tax 553 575 602 577 591 578 610 Income/business tax 161 165 182 223 205 244 219 Other indirect taxes 52 58 54 52 41 44 41 Fees and fines 84 77 81 93 87 84 96 Administration fees and charges
98
98
126
123
126
126
126
Rent and royalties 25 23 13 13 12 15 12 Income – public service 9 10 10 10 10 9 10 Dividends and interest 212 176 160 190 144 58 102 Reimbursements 43 35 45 32 26 38 36 Miscellaneous 31 30 2 11 156 5 42 Grants 10 28 84 41 51 50 16 Figures do not necessarily add up due to rounding. 1 These series are subject to audit and might be revised accordingly. Source: Ministry of Finance
Whilst trades tax continued to account for
the largest share of fiscal revenue, the
amount collected fell R13 million short of
the budgeted R591 million. The shortfall

ANNUAL REPORT 2000 GOVERNMENT FINANCE
- 36 -
was attributable principally to taxes on
locally manufactured goods and on
services. Those taxes fell below
expectations by R8.1 million and R4.9
million respectively. On the other hand,
revenue from taxes on direct imports was
virtually on target falling by only
R329,000. The main sources of tax on
direct imports were “mineral products”
(R122 million), “beverages, spirits &
vinegar” (R41 million) and “vehicles,
aircraft & vessels” (R27 million).
A comparison of trades tax inflows of
2000 with that of the previous year shows
that in the current year, revenue was only
R943,000 higher. Higher receipts of R2.0
million from taxes on services and R1.6
million from taxes on locally
manufactured goods explained this
increase, whilst the other source of trades
tax, namely taxes on direct import,
registered a decline of R2.7 million.
Contrary to trades taxes, revenue from
“income & business tax” was R39 million
or 19 per cent above the expected R205
million. This significant increase owed
primarily to the corporate sector from
which the government collected a total of
R244 million. In addition, the inflow in
the current period was R22 million higher
than in the previous year. This was the
fourth consecutive annual inflow increases
in respect of “income & business tax”.
These increases over those years represent
the rise in the number of businesses as
well as the better collection mechanism for
taxes put into place by the government.
The third most important inflow of income
in current receipts was “administration
fees and charges” from which the
government gained R126 million during
2000. This was nearly on target, falling
below budget by only R23,000.
Nevertheless, it was R3.4 million higher
than in 1999. Transfers from Social
Security Fund were exactly on target at
R80 million and this was R2.9 million
more than in the previous year.
Besides “income & business tax”, which
brought the government a significant
increase in its revenue, there were four
other components, namely
“reimbursements”, “other fees and fines,
excluding fishing licences”, “rents &
royalties” and “other indirect taxes” which
recorded better than anticipated outcome.
Their respective budget and actual data are
shown below.
Budget Actual Excess
(R m) (R m) (R m)
Reimbursements 26 38 12
Other fees & fines 50 58 8.2
Rents & royalties 12 15 3.8
Other indirect taxes 41 44 3.6
ANNUAL REPORT 2000 GOVERNMENT FINANCE
- 37 -
During 2000 inflows in respect of
“reimbursements” and “rents & royalties”
were R5.9 million and R2.7 million higher
than 1999, respectively, whilst those in
respect of “other indirect taxes” and
“other fees and fines” were below last
year’s levels, by R7.6 million and R1.6
million respectively.
The outcome in respect of other revenue
flows, namely “miscellaneous receipts”,
“dividends & interests”, “fishing licences”
and “income – public services”, were less
encouraging. Indeed, two of those
incomes were particularly influential in
explaining the overall shortfall in current
revenue. These were “miscellaneous
receipts” and “dividends & interests”
which fell by R151 million R86 million
respectively. The main factor explaining
the fall in “miscellaneous receipts” was
the lower than expected inflows in respect
of “sale of assets” for which the
government collected R1.7 million against
a forecast of R150 million. This reflected
in turn the failure to get the Housing
Ownership Scheme under way in 2000 as
the Government had anticipated. To a
letter extent there was also lower revenue
from “sale of equity holdings”, which
amounted to R1.9 million against the
expected R5.0 million.
For “dividends & interest”, the lower that
expected outcome came from lower
dividends from the petroleum company
SEPEC and also in the statutory transfers
from the Central Bank. Relative to the
previous year income from “miscellaneous
receipts” was R3.3 million higher than in
the previous year, however, “dividends &
interests” dropped by R132 million.
In respect of “fishing licences”, the lower
than expected income of R26 million
reflected mainly the 31 per cent reduction
in foreign licences fees. On the other
hand, income from public services fell
only marginally relative to budget, by
R0.6 million, amounting to R9.3 million.
A comparison with last year’s results
reveals that “fishing licences” were R7.1
million lower in 2000, whilst “income
public services” fell only marginally.
Relative to 1999, total receipts fell by a
significant R107 million, caused by a
decline of R117 million in current
revenue, which completely overshadowed
the rise of R9.1 million in grant receipts.
This decline in current inflows stemmed
predominantly from the lower than
expected revenue in respect of “dividends
& interest”, which as noted above was
R132 million below its 1999 level.
Nevertheless, it was encouraging to note
some notable increases in current revenue
despite the overall fall, notably in “income
& business tax”. This category of taxes
brought the government an additional R22
million relative to the previous year.
3. Expenditure
Government expenses amounted to R1,675
million, which represents a saving of R272

ANNUAL REPORT 2000 GOVERNMENT FINANCE
- 38 -
million or 14 per cent relative to the
budgeted R1,947 million. It was the
savings in current outlays and net lending
that explained this favourable
performance. The lower expenditure
under these two headings helped to
outweigh the slight overrun in capital
outlays.
3.1 Current outlays
Current spending, which totalled R1,358
million was R83 million or 5.7 per cent
below forecast. This outcome was
attributable to both its components namely
‘appropriation items’ and ‘charges’. Both
these categories fell below their respective
budgets, by R66 million and R17 million
respectively. Lower spending in respect of
appropriation items was attributable to
most items with the exception of current
outlays to parastatals, which overshot its
target by R1.2 million. The latter was
explained mainly by the higher than
budgeted outlays towards the Seychelles
Public Transport Corporation (SPTC).
The overall saving in ‘appropriation items’
was attributable to
“ministries/departments”, with all
ministries having contained their spending
well below budget. In total a saving of
R23 million was realized. The
government spent less than budgeted in
respect of “centralized payments”,
“pensions & gratuities” and “current
outlays on regulatory bodies”. These
items fell R34 million, R5.4 million and
R3.9 million below their respective
budgets. Other expenditure items, namely
contributions to the Social Security Fund
and Pension Scheme were both on target.
In terms of ‘charges’, positive outcome
relative to the budgeted expenditure was
due to lower spending in relation to
“public debt interest payments”, which fell
R17 million short of forecast, totalling
R263 million. Out of this total, R213
million represented domestic payments.
The reduced spending on public interest
payments reflected the lower deficit in
1999, which warranted less borrowing.
Current expenditure increased compared
to last year. From R1,352 million in 1999,
expenditure under this heading rose to
R1,358 million. This increase of R5.3
million or 0.4 per cent, was mainly due to
the rise of R64 million in the level of
spending in ‘appropriation items’, which
overshadowed the decline of R58 million
in ‘charges’. The higher level of spending
in ‘appropriation items’ was influenced by
the increased spending in relation to ‘other
appropriations’, which rose by R46
million relative to its 1999 level. On the
other hand, the fall in ‘charges’ reflected a
R59 million decline in “public interest
payments".
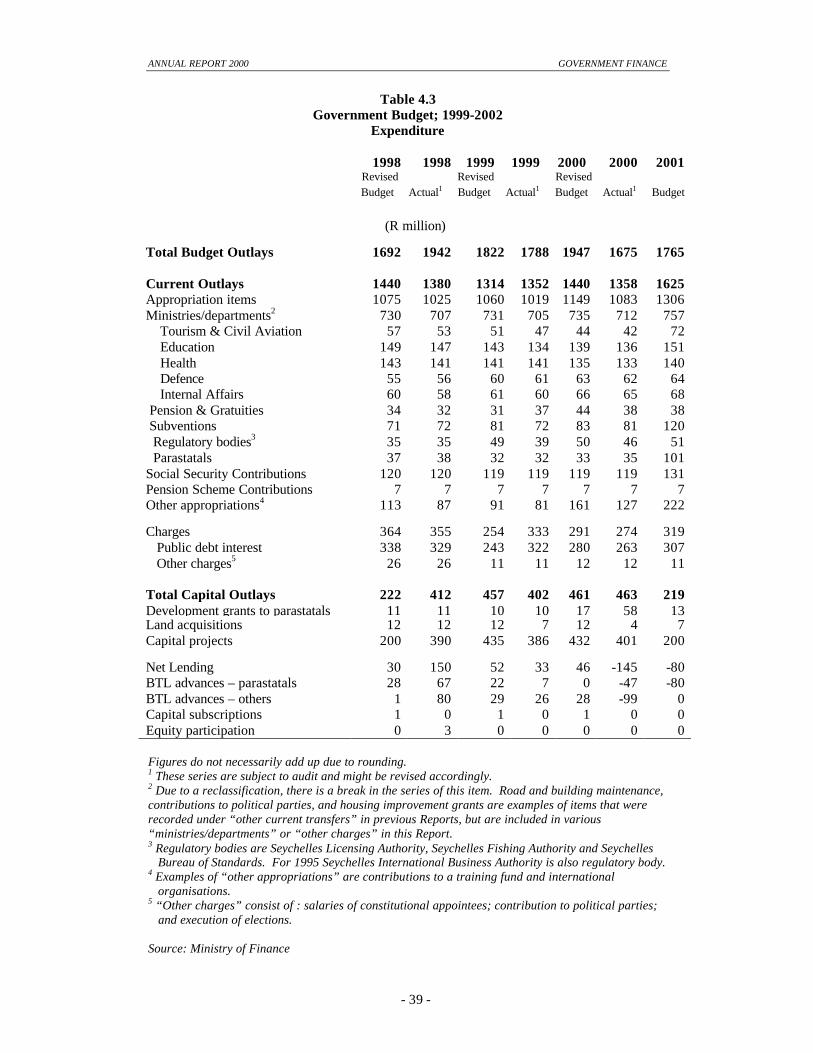
ANNUAL REPORT 2000 GOVERNMENT FINANCE
- 39 -
Table 4.3 Government Budget; 1999-2002
Expenditure
1998 1998 1999 1999 2000 2000 2001 Revised Revised Revised
Budget Actual1 Budget Actual1 Budget Actual1 Budget
(R million)
Total Budget Outlays 1692 1942 1822 1788 1947 1675 1765 Current Outlays 1440 1380 1314 1352 1440 1358 1625 Appropriation items 1075 1025 1060 1019 1149 1083 1306 Ministries/departments2 730 707 731 705 735 712 757 Tourism & Civil Aviation 57 53 51 47 44 42 72 Education 149 147 143 134 139 136 151 Health 143 141 141 141 135 133 140 Defence 55 56 60 61 63 62 64 Internal Affairs 60 58 61 60 66 65 68 Pension & Gratuities 34 32 31 37 44 38 38 Subventions 71 72 81 72 83 81 120 Regulatory bodies3 35 35 49 39 50 46 51 Parastatals 37 38 32 32 33 35 101 Social Security Contributions 120 120 119 119 119 119 131 Pension Scheme Contributions 7 7 7 7 7 7 7 Other appropriations4 113 87 91 81 161 127 222 Charges 364 355 254 333 291 274 319 Public debt interest 338 329 243 322 280 263 307 Other charges5 26 26 11 11 12 12 11 Total Capital Outlays 222 412 457 402 461 463 219 Development grants to parastatals 11 11 10 10 17 58 13 Land acquisitions 12 12 12 7 12 4 7 Capital projects 200 390 435 386 432 401 200 Net Lending 30 150 52 33 46 -145 -80 BTL advances – parastatals 28 67 22 7 0 -47 -80 BTL advances – others 1 80 29 26 28 -99 0 Capital subscriptions 1 0 1 0 1 0 0 Equity participation 0 3 0 0 0 0 0 Figures do not necessarily add up due to rounding. 1 These series are subject to audit and might be revised accordingly. 2 Due to a reclassification, there is a break in the series of this item. Road and building maintenance, contributions to political parties, and housing improvement grants are examples of items that were recorded under “other current transfers” in previous Reports, but are included in various “ministries/departments” or “other charges” in this Report. 3 Regulatory bodies are Seychelles Licensing Authority, Seychelles Fishing Authority and Seychelles Bureau of Standards. For 1995 Seychelles International Business Authority is also regulatory body. 4 Examples of “other appropriations” are contributions to a training fund and international organisations. 5 “Other charges” consist of : salaries of constitutional appointees; contribution to political parties; and execution of elections. Source: Ministry of Finance
ANNUAL REPORT 2000 GOVERNMENT FINANCE
- 40 -
3.2 Capital Outlays
During the year 2000, the government
spent a total of R463 million on capital
expenditure, which was R1.9 million
above its budgeted allocation of R461
million. The excess spending was
influenced by higher than budgeted of R41
million on development grants.
Nonetheless, this was contained by
savings of R8.3 million and R31 million in
“compensation for land acquisition” and
“capital projects” respectively. Capital
projects continued to account for the bulk
of spending in this category with outlays
standing at R401 million, R31 million
below forecast. Those funds went
principally towards the reclamation works
in the East Coast Phase III Project whilst
the excess spending under “developments
grants” was due to an unbudgeted R51
million allocation accorded to the
Seychelles Fishing Authority.
Compared to the previous year, capital
spending rose by R60 million.
Development grants and capital projects,
which stood at R58 million and R401
million, were R48 million and R15 million
above their 1999 levels. On the other
hand, expenditure going towards
compensation of land acquisitions fell by
R3.7 million.
3.2.1 Public Sector Capital Project
Expenditure
Capital project expenditure of the
government for the fiscal year 2000
reached a total of R401 million, depicting
a rise of R15 million or 4.0 per cent
relative to the previous year. In sectoral
terms, the increase in total expenditure
was due to mainly to the subgroup of
‘infrastructure and utilities’, which rose by
R103 million or 62 per cent. Spending
under the other two main headings,
namely ‘economic sectors’ and ‘services’,
fell by R11 million and R76 million
respectively.
3.2.1.1 Economic Sectors
Expenditure on ‘economic sectors’
declined by R11 million. The fall in this
category was in respect of all the sectors,
with the most significant being R8.5
million in agriculture. The declines in all
the sectors were due to major projects
being completed in the previous year. In
terms of agriculture, where the highest
decline occurred, the fall was attributable
to the completion of the rehabilitation of
the Victoria market and the Farming
Training Centre in the 1999.

ANNUAL REPORT 2000 GOVERNMENT FINANCE
- 41 -
Table 4.4
Public Sector Capital Expenditure
1995 1996 1997 1998 1999 2000
(R thousand) Total 131,068 185,023 213,983 390,008 385,561 400,986Economic Sectors 11,917 19,267 25,941 35,463 15,380 3,930 Agriculture 1,047 4,511 2,991 9,055 9,605 1,112 Fisheries 1,535 1,139 2,195 8,776 522 18 Tourism 3,214 949 2,372 882 2,823 2,674 Outer island development 1,399 1,882 708 2,500 500 - Craft & home industries 1,424 595 1,393 2,515 - - Trade & commerce 3,298 10,191 16,283 11,735 1,929 126 Infrastructure and Utilities 33,583 38,405 67,022 172,018 166,191 268,694 Transport 20,099 6,531 21,988 29,201 53,223 49,267 Water supply & sanitation 443 14,331 13,533 60,621 26,394 64,805 Communications 687 842 358 1,679 4,657 4,581 Land Reclamation 5,327 1,701 315 45,521 63,738 137,317 Land Bank 7,027 15,000 30,827 34,996 18,179 12,725 Services 85,568 127,351 121,020 182,527 203,990 128,362 Education 35,533 31,861 16,721 40,481 25,440 13,057 Health 4,043 15,575 15,593 14,054 4,190 6,726 Housing 19,459 41,280 41,748 63,377 82,195 58,826 Social development 7,782 17,525 27,102 34,878 15,658 8,934 Culture 388 172 197 99 276 908 Sports 778 180 1,567 3,089 2,063 1,915 Information & media 172 46 452 918 39,046 4,157 Internal affairs 8,503 8,456 7,008 9,817 5,012 4,226 Public sector management 2,508 798 4,972 4,832 9,850 17,910 Environment 6,401 11,458 5,659 10,982 20,259 11,704 Source: Ministry of Finance
3.2.1.2 Infrastructure and Utilities
As pointed out above, the only increase in
capital expenditure was in respect of
‘infrastructure and utilities’, which
amounted to R269 million, a rise of R103
million relative to the previous year. The
largest increases were in respect of “land
reclamation” and “electricity, water supply
& sanitation”, which rose by R74 million
and R38 million respectively. The rise in
expenditure towards “land reclamation” is
explained mostly by the East Coast Phase
III Project, which started in the previous
year. During the year under review, was
the start of the reclamation itself compared
to last year, where works comprised of the
setting up of barriers. With regards to
“electricity, water supply & sanitation”,
the increase in cost was due the project on
the Anse Royale landfill and two sewage
projects, one for Greater Victoria and the
other for Beau Vallon. Together, these
projects accounted for 76 per cent of total
expenditure under “electricity, water
supply & sanitation”.

ANNUAL REPORT 2000 GOVERNMENT FINANCE
- 42 -
For the rest of the remaining headings of
expenditures under ‘infrastructure and
utilities’, there were reduced spending
relative to the previous year, ranging
between R76,000 and R5.5 million.
Spending of R49 million on “transport” in
2000 went principally on the Praslin
Airport re-development project and on the
completion of the Providence-Airport
Highway link on Mahe. Government
expenditure on “communications”, which
amounted to R4.6 million, represented
mainly spending on the ‘electronic
government’ project. This initiative
involves the linkage of major government
departments electronically. In terms of
expenditure on land bank, this is the
ongoing effort of the government to make
land available for housing projects.
3.2.1.3 Services
‘Services’ was the other category that
recorded a decline in its overall
expenditure during the year under review,
a fall of 37 per cent. All categories
registered declines with the exception of
“health”, “culture” and “public sector
management”. As in the ‘economic
sector’, the drop in spending in services is
explained by the fact that major projects
were completed in the previous year, most
particularly in “education”, “housing” and
“information & media”. The latter, which
recorded the largest fall was due to the fact
that in the previous year, expenditure went
principally to improve computer systems
to make them Y2K compliant.
The most significant increase in relation to
the three headings mentioned above was in
respect of “public sector management” and
“health”. The rise of R8.1 million in
spending towards “public sector
management” was mainly for renovation
work on government offices and for
“health”, it went towards the cost of
renovation works on the paediatric &
maternity wards, which accounted for 60
per cent of total spending in health and
also on new facilities.
3.3 Net Lending
Expenses under net lending continued to
be strictly controlled in 2000. Against a
budgeted total government advance of R46
million, the government actually registered
a net repayment of R145 million. Lending
under this category, which goes
principally to parastatals and general-
purpose loans, saw a net repayment of R47
million for the former and R99 million
under the latter.
Analyzing the 2000 outcome relative to
the previous year, it was observed that net
lending was significantly curtailed. From
R33 million in 1999, it shrank to a net
repayment of R145 million, a saving of
R179 million. The favourable
performance in the year under review is
attributable to the R47 million and R99
million net repayments for parastatals and
general-purpose loans, as compared to a
net lending of R7.0 million and R26

ANNUAL REPORT 2000 GOVERNMENT FINANCE
- 43 -
million for the same headings in the
previous year.
4. Financing
In a complete switch from normal trends,
it was foreign savings that made up for the
bulk of the budgetary shortfall in 2000.
On a net basis, foreign loans amounted to
R461 million, of which gross inflows
totalled R501 million and amortisation
amaounting to R40 million. It would be
noted that at this level, gross inflows was
extraordinarily high and this reflected inter
alia the drawdown, through the Central
Bank, of Euro 50 million facility from an
overseas bank.
In addition, the government accessed R8.5
million from the domestic market, with
inflows at R613 million and redemption at
R604 million. It should be noted that
during the fiscal year 2000, the
government intensified its efforts in
reducing the monetisation of its deficits.
Borrowing from the domestic market was
mainly through the issue of securities, with
minimal recourse to central bank
advances. The R613 million that was
raised consisted primarily of R84 million
worth of treasury bills and R1.1 billion
worth of treasury bonds and also a
significant repayment by the government
of R622 million on its stocks of advances.
The balance of R127 million was met
through movement in cash balances held
mainly with the Central Bank.

SECTION FIVE
The External Sector
1. Overview
The year 2000 saw a major improvement
in the Balance of Payments (BOP).
Overall, the BOP moved into a surplus
mostly on account of a substantial
narrowing of the current account deficit.
These movements are illustrated in Chart
5.1 and Table 5.1 below. This marked a
major overturn of the situation over the
last two years, in particular with regards to
the current account.
-800.0
-600.0
-400.0
-200.0
0.0
200.0
400.0
600.0
800.0
R M
illio
n
1995
1996
1997
1998
1999
2000
Chart 5.1. The overall balance, current account and capital & financial account of the BOP for 1995 to 2000
Overall balance Current account Capital & Financial account
- 43 -
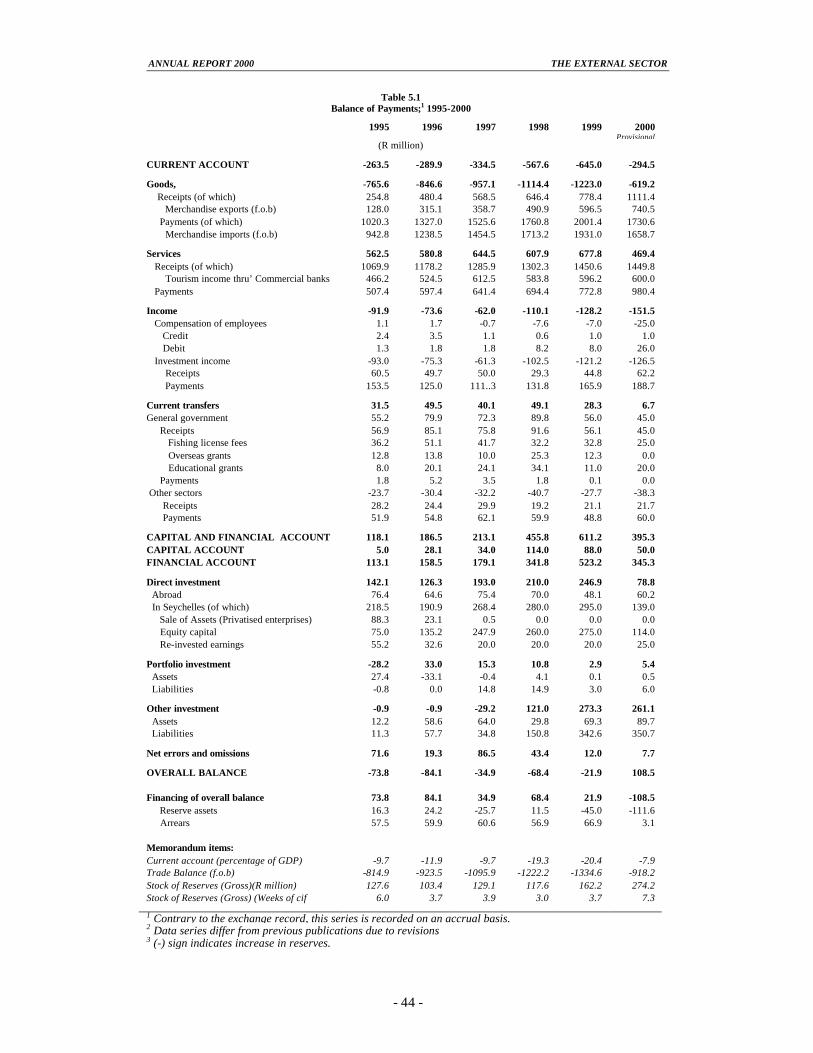
ANNUAL REPORT 2000 THE EXTERNAL SECTOR
- 44 -
Table 5.1 Balance of Payments;1 1995-2000
1995 1996 1997 1998 1999 2000 Provisional
(R million) CURRENT ACCOUNT -263.5 -289.9 -334.5 -567.6 -645.0 -294.5 Goods, -765.6 -846.6 -957.1 -1114.4 -1223.0 -619.2 Receipts (of which)
254.8 480.4 568.5 646.4 778.4 1111.4 Merchandise exports (f.o.b) 128.0 315.1 358.7 490.9 596.5 740.5 Payments (of which) 1020.3 1327.0 1525.6 1760.8 2001.4 1730.6 Merchandise imports (f.o.b) 942.8 1238.5 1454.5 1713.2 1931.0 1658.7 Services 562.5 580.8 644.5 607.9 677.8 469.4 Receipts (of which) 1069.9 1178.2 1285.9 1302.3 1450.6 1449.8 Tourism income thru’ Commercial banks 466.2 524.5 612.5 583.8 596.2 600.0 Payments 507.4 597.4 641.4 694.4 772.8 980.4 Income -91.9 -73.6 -62.0 -110.1 -128.2 -151.5 Compensation of employees 1.1 1.7 -0.7 -7.6 -7.0 -25.0 Credit 2.4 3.5 1.1 0.6 1.0 1.0 Debit 1.3 1.8 1.8 8.2 8.0 26.0 Investment income -93.0 -75.3 -61.3 -102.5 -121.2 -126.5 Receipts 60.5 49.7 50.0 29.3 44.8 62.2 Payments 153.5 125.0 111..3 131.8 165.9 188.7 Current transfers 31.5 49.5 40.1 49.1 28.3 6.7 General government gG
55.2 79.9 72.3 89.8 56.0 45.0 Receipts 56.9 85.1 75.8 91.6 56.1 45.0 Fishing license fees 36.2 51.1 41.7 32.2 32.8 25.0 Overseas grants 12.8 13.8 10.0 25.3 12.3 0.0 Educational grants 8.0 20.1 24.1 34.1 11.0 20.0 Payments 1.8 5.2 3.5 1.8 0.1 0.0 Other sectors -23.7 -30.4 -32.2 -40.7 -27.7 -38.3 Receipts 28.2 24.4 29.9 19.2 21.1 21.7 Payments 51.9 54.8 62.1 59.9 48.8 60.0 CAPITAL AND FINANCIAL ACCOUNT 118.1 186.5 213.1 455.8 611.2 395.3 CAPITAL ACCOUNT 5.0 28.1 34.0 114.0 88.0 50.0 FINANCIAL ACCOUNT 113.1 158.5 179.1 341.8 523.2 345.3 Direct investment 142.1 126.3 193.0 210.0 246.9 78.8 Abroad 76.4 64.6 75.4 70.0 48.1 60.2 In Seychelles (of which) 218.5 190.9 268.4 280.0 295.0 139.0 Sale of Assets (Privatised enterprises) 88.3 23.1 0.5 0.0 0.0 0.0 Equity capital 75.0 135.2 247.9 260.0 275.0 114.0 Re-invested earnings 55.2 32.6 20.0 20.0 20.0 25.0 Portfolio investment -28.2 33.0 15.3 10.8 2.9 5.4 Assets 27.4 -33.1 -0.4 4.1 0.1 0.5 Liabilities -0.8 0.0 14.8 14.9 3.0 6.0 Other investment -0.9 -0.9 -29.2 121.0 273.3 261.1 Assets 12.2 58.6 64.0 29.8 69.3 89.7 Liabilities 11.3 57.7 34.8 150.8 342.6 350.7 Net errors and omissions 71.6 19.3 86.5 43.4 12.0 7.7 OVERALL BALANCE -73.8 -84.1 -34.9 -68.4 -21.9 108.5 Financing of overall balance 73.8 84.1 34.9 68.4 21.9 -108.5 Reserve assets 16.3 24.2 -25.7 11.5 -45.0 -111.6 Arrears 57.5 59.9 60.6 56.9 66.9 3.1 Memorandum items: Current account (percentage of GDP) -9.7 -11.9 -9.7 -19.3 -20.4 -7.9 Trade Balance (f.o.b) -814.9 -923.5 -1095.9 -1222.2 -1334.6 -918.2 Stock of Reserves (Gross)(R million) 127.6 103.4 129.1 117.6 162.2 274.2 Stock of Reserves (Gross) (Weeks of cif imports) million)
6.0 3.7 3.9 3.0 3.7 7.3
1 Contrary to the exchange record, this series is recorded on an accrual basis. 2 Data series differ from previous publications due to revisions 3 (-) sign indicates increase in reserves.

ANNUAL REPORT 2000 THE EXTERNAL SECTOR
- 45 -
Provisional estimates based on
information gathered by the Central Bank
points to an overall BOP surplus of R108
million in 2000, which was an
improvement of R130 million relative to
the previous year (Table 5.1). The gross
reserve position of the country improved
by some R112 million, with the balance
representing accumulation of arrears.
The determining factor in the overall
improvement during 2000 was the current
account. Over the last few years, the
growing current account deficit had been a
major concern. However, there was a
major turnaround in 2000 as the deficit
shrank to R295 million, representing a
decline of R351 million or 54 per cent
relative to 1999. The lower deficit was
ascribed mainly to the reduction in the
trade deficit, which helped to outweigh the
decline in the surpluses in “services” and
“current transfers” and the expansion of
the deficit in “income”.
The deficit on account of “goods” stood at
R619 million, representing an
improvement of R604 million or 49 per
cent relative to the previous year. This
outcome was attributable to an increase in
receipts coupled with a fall in payments.
Receipt in respect of trade in goods
totalled R1.1 billion, of which
merchandise exports accounted for R740
million, an increase of R144 million
relative to 1999. The increase in exports
came primarily from canned tuna, which
rose by R74 million, though frozen prawns
also posted an encouraging R11 million.
The remainder of exports posted an overall
growth of R68 million.
Payments amounted to R1.7 billion of
which imports accounted for 96 per cent.
Imports, which comprise the bulk of
"goods" payment declined relative to the
previous year. For 2000, the total import
bill was estimated at R1.7 billion (f.o.b),
which was R272 million or 14 per cent
lower than in 1999. The most notable
reductions were observed under
“machinery and transport equipment”,
“manufactured goods and miscellaneous
manufactured goods” and “chemicals”.
On the other hand, there was a significant
increase in import of oil. Whilst the
decline in most non-oil imports reflected
the shortage in foreign currency, the rise in
oil imports was explained primarily by the
sharp rise in oil prices on the international
market.
As already noted, the services account
surplus fell by R208 million, amounting to
R469 million. This sharp contraction
reflected principally a strong growth in
payments, which completely outweighed
the minimal growth in receipts. Whilst on
an individual basis certain services items -
such as “transportation” - recorded notable
increases in revenue, it was the fall in the
surplus from travel and the worsening

ANNUAL REPORT 2000 THE EXTERNAL SECTOR
- 46 -
position of the “financial and business
services” account that contributed to the
deterioration of the services surplus.
With regards to the “income account”, the
expansion of the deficit was accountable
in most part by an increase in net
payments of investment income which in
turn reflected the further increase in the
country's external interest burden. As for
“current transfers”, the 76 per cent drop in
the surplus relative to 1999 was mainly
due to a fall in receipts under “general
government” and an increase in payments
by “other sectors”. The decline in
“general government” inflows owed
primarily to a decrease in receipt from
fishing licences and overseas grants.
The other main heading in the BOP is the
“capital and financial account”. For 2000,
the balance under this heading stood at
R395 million, which was 216 million or
35 per cent below the previous year’s
level. Direct investment inflows were
estimated at R139 million, of which 82 per
consisted of equity capital. Portfolio
investment, though remaining relatively
low, registered an increase compared to
1999, rising by R2.5 million.
“Other investment”, which represents
mostly loans, showed a net inflow of R261
million, a reduction of R12 million
relative to 1999. Inflows amounted to
R351 million whilst foreign loan
repayment stood at R90 million.
2. Current account
2.1 Trade in goods
For the first time since 1994, there was a
marked improvement in respect of the
"goods account". This account, which
consists of trade in merchandise goods, the
value of repairs carried out on non-
resident goods, mainly carriers, and goods
procured in ports (re-exports) registered a
lower deficit compared to the preceding
year. Provisional estimates showed the
deficit at R619 million, representing a
decline of R604 million or 49 per cent.
The significant improvement in the deficit
in goods during 2000 was attributable to
the two largest items under the goods
account, the most important being "general
merchandise", which covers the export and
import of goods. It recorded a deficit of
R918 million, which represented a fall of
R416 million relative to last year. In turn,
this reflected a combination of a decline in
imports and a continued growth in export
revenue.
With regards to "goods procured in ports",
the second largest component of the goods
account, the surplus continued to widen,
amounting to R302 million, which was
R188 million above the last year's level.
By contrast, "repairs" remain in deficit
compared to the previous year.
2.1.1 Merchandise exports
As outlined above, there was a decline in
the deficit in respect of general
merchandise, i.e., the trade balance. In
2000 the deficit amounted to R918
million, representing a fall of 31 per cent
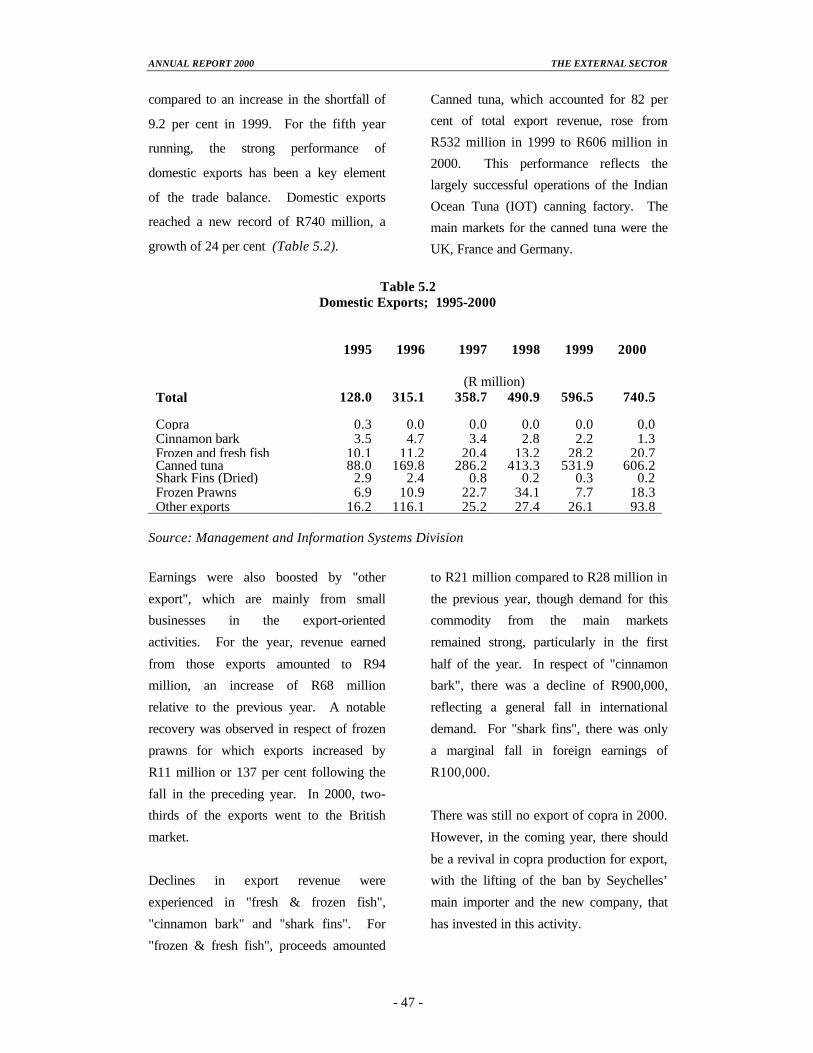
ANNUAL REPORT 2000 THE EXTERNAL SECTOR
- 47 -
compared to an increase in the shortfall of
9.2 per cent in 1999. For the fifth year
running, the strong performance of
domestic exports has been a key element
of the trade balance. Domestic exports
reached a new record of R740 million, a
growth of 24 per cent (Table 5.2).
Canned tuna, which accounted for 82 per
cent of total export revenue, rose from
R532 million in 1999 to R606 million in
2000. This performance reflects the
largely successful operations of the Indian
Ocean Tuna (IOT) canning factory. The
main markets for the canned tuna were the
UK, France and Germany.
Table 5.2
Domestic Exports; 1995-2000
1995 1996 1997 1998 1999 2000
(R million) Total 128.0 315.1 358.7 490.9 596.5 740.5 Copra 0.3 0.0 0.0 0.0 0.0 0.0 Cinnamon bark 3.5 4.7 3.4 2.8 2.2 1.3 Frozen and fresh fish 10.1 11.2 20.4 13.2 28.2 20.7 Canned tuna 88.0 169.8 286.2 413.3 531.9 606.2 Shark Fins (Dried) 2.9 2.4 0.8 0.2 0.3 0.2 Frozen Prawns 6.9 10.9 22.7 34.1 7.7 18.3 Other exports 16.2 116.1 25.2 27.4 26.1 93.8
Source: Management and Information Systems Division
Earnings were also boosted by "other
export", which are mainly from small
businesses in the export-oriented
activities. For the year, revenue earned
from those exports amounted to R94
million, an increase of R68 million
relative to the previous year. A notable
recovery was observed in respect of frozen
prawns for which exports increased by
R11 million or 137 per cent following the
fall in the preceding year. In 2000, two-
thirds of the exports went to the British
market.
Declines in export revenue were
experienced in "fresh & frozen fish",
"cinnamon bark" and "shark fins". For
"frozen & fresh fish", proceeds amounted
to R21 million compared to R28 million in
the previous year, though demand for this
commodity from the main markets
remained strong, particularly in the first
half of the year. In respect of "cinnamon
bark", there was a decline of R900,000,
reflecting a general fall in international
demand. For "shark fins", there was only
a marginal fall in foreign earnings of
R100,000.
There was still no export of copra in 2000.
However, in the coming year, there should
be a revival in copra production for export,
with the lifting of the ban by Seychelles’
main importer and the new company, that
has invested in this activity.
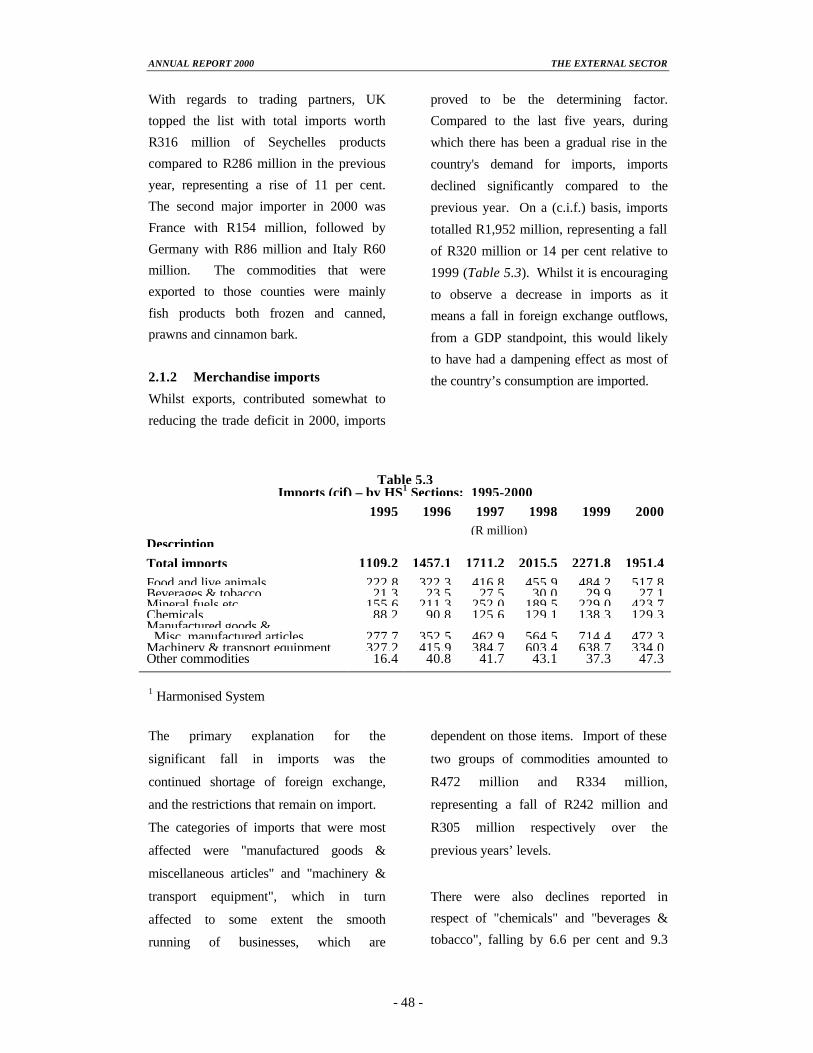
ANNUAL REPORT 2000 THE EXTERNAL SECTOR
- 48 -
With regards to trading partners, UK
topped the list with total imports worth
R316 million of Seychelles products
compared to R286 million in the previous
year, representing a rise of 11 per cent.
The second major importer in 2000 was
France with R154 million, followed by
Germany with R86 million and Italy R60
million. The commodities that were
exported to those counties were mainly
fish products both frozen and canned,
prawns and cinnamon bark.
2.1.2 Merchandise imports
Whilst exports, contributed somewhat to
reducing the trade deficit in 2000, imports
proved to be the determining factor.
Compared to the last five years, during
which there has been a gradual rise in the
country's demand for imports, imports
declined significantly compared to the
previous year. On a (c.i.f.) basis, imports
totalled R1,952 million, representing a fall
of R320 million or 14 per cent relative to
1999 (Table 5.3). Whilst it is encouraging
to observe a decrease in imports as it
means a fall in foreign exchange outflows,
from a GDP standpoint, this would likely
to have had a dampening effect as most of
the country’s consumption are imported.
Table 5.3
Imports (cif) – by HS1 Sections; 1995-2000 1995 1996 1997 1998 1999 2000 (R million) Description Total imports 1109.2 1457.1 1711.2 2015.5 2271.8 1951.4 Food and live animals 222.8 322.3 416.8 455.9 484.2 517.8 Beverages & tobacco 21.3 23.5 27.5 30.0 29.9 27.1 Mineral fuels etc. 155.6 211.3 252.0 189.5 229.0 423.7 Chemicals 88.2 90.8 125.6 129.1 138.3 129.3 Manufactured goods & Misc. manufactured articles 277.7 352.5 462.9 564.5 714.4 472.3 Machinery & transport equipment 327.2 415.9 384.7 603.4 638.7 334.0 Other commodities 16.4 40.8 41.7 43.1 37.3 47.3 1 Harmonised System
The primary explanation for the
significant fall in imports was the
continued shortage of foreign exchange,
and the restrictions that remain on import.
The categories of imports that were most
affected were "manufactured goods &
miscellaneous articles" and "machinery &
transport equipment", which in turn
affected to some extent the smooth
running of businesses, which are
dependent on those items. Import of these
two groups of commodities amounted to
R472 million and R334 million,
representing a fall of R242 million and
R305 million respectively over the
previous years’ levels.
There were also declines reported in
respect of "chemicals" and "beverages &
tobacco", falling by 6.6 per cent and 9.3
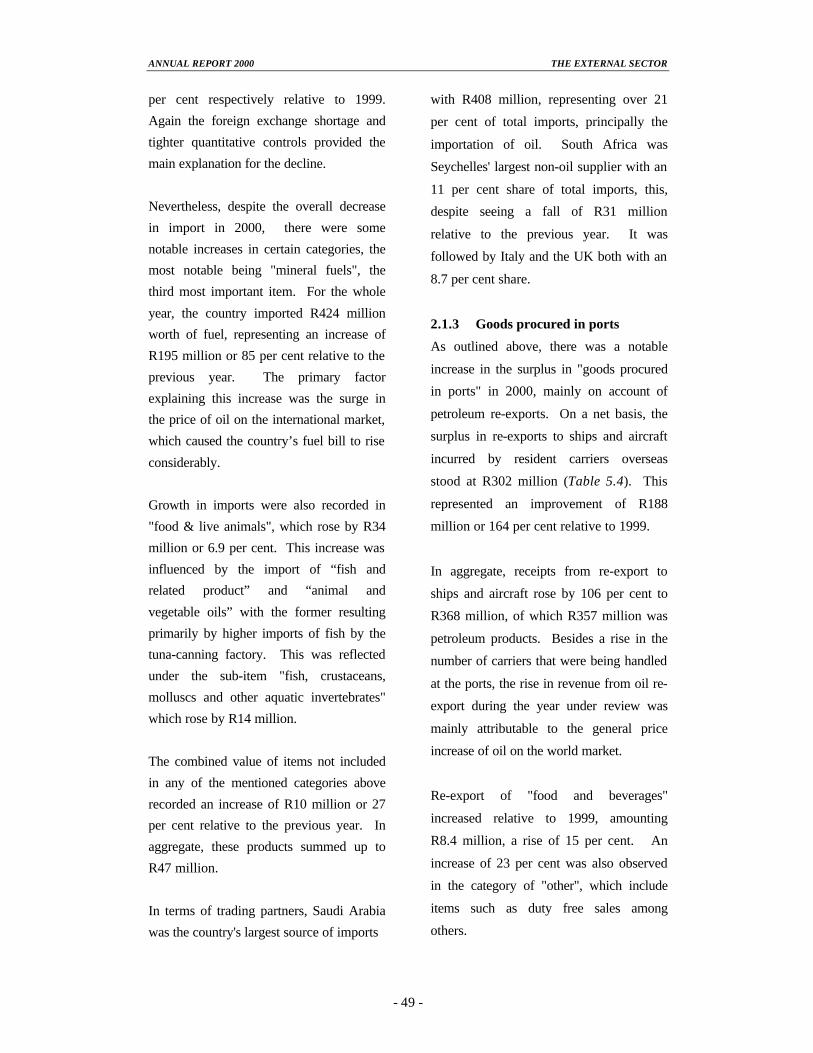
ANNUAL REPORT 2000 THE EXTERNAL SECTOR
- 49 -
per cent respectively relative to 1999.
Again the foreign exchange shortage and
tighter quantitative controls provided the
main explanation for the decline.
Nevertheless, despite the overall decrease
in import in 2000, there were some
notable increases in certain categories, the
most notable being "mineral fuels", the
third most important item. For the whole
year, the country imported R424 million
worth of fuel, representing an increase of
R195 million or 85 per cent relative to the
previous year. The primary factor
explaining this increase was the surge in
the price of oil on the international market,
which caused the country’s fuel bill to rise
considerably.
Growth in imports were also recorded in
"food & live animals", which rose by R34
million or 6.9 per cent. This increase was
influenced by the import of “fish and
related product” and “animal and
vegetable oils” with the former resulting
primarily by higher imports of fish by the
tuna-canning factory. This was reflected
under the sub-item "fish, crustaceans,
molluscs and other aquatic invertebrates"
which rose by R14 million.
The combined value of items not included
in any of the mentioned categories above
recorded an increase of R10 million or 27
per cent relative to the previous year. In
aggregate, these products summed up to
R47 million.
In terms of trading partners, Saudi Arabia
was the country's largest source of imports
with R408 million, representing over 21
per cent of total imports, principally the
importation of oil. South Africa was
Seychelles' largest non-oil supplier with an
11 per cent share of total imports, this,
despite seeing a fall of R31 million
relative to the previous year. It was
followed by Italy and the UK both with an
8.7 per cent share.
2.1.3 Goods procured in ports
As outlined above, there was a notable
increase in the surplus in "goods procured
in ports" in 2000, mainly on account of
petroleum re-exports. On a net basis, the
surplus in re-exports to ships and aircraft
incurred by resident carriers overseas
stood at R302 million (Table 5.4). This
represented an improvement of R188
million or 164 per cent relative to 1999.
In aggregate, receipts from re-export to
ships and aircraft rose by 106 per cent to
R368 million, of which R357 million was
petroleum products. Besides a rise in the
number of carriers that were being handled
at the ports, the rise in revenue from oil re-
export during the year under review was
mainly attributable to the general price
increase of oil on the world market.
Re-export of "food and beverages"
increased relative to 1999, amounting
R8.4 million, a rise of 15 per cent. An
increase of 23 per cent was also observed
in the category of "other", which include
items such as duty free sales among
others.

ANNUAL REPORT 2000 THE EXTERNAL SECTOR
- 50 -
Table 5.4 Goods procured in Ports; 1995-2000
1995 1996 1997 1998 1999 2000
(R million) Goods procured in port, net 77.2 104.5 148.9 105.1 114.5 302.2 Receipts 125.5 163.6 208.4 152.7 179.1 368.1 Petrol 118.4 151.3 200.1 140.3 169.4 356.8 Food and beverages 4.5 10.5 6.1 6.3 7.3 8.4 Others 2.6 1.8 2.2 6.1 2.4 2.9 Payments 48.3 59.1 59.5 47.7 64.6 65.9 Petrol 41.5 56.9 50.2 42.8 54.6 50.9 Food and beverages 6.8 2.3 9.3 4.8 10.0 15.0
Source: Management and Information Systems Division
Re-export excluding those to ships and
aircraft totalled R35 million in 2000,
representing a rise of R20 million
compared to the previous year. It should
be noted that since these re-exports do not
represent goods procured in ports, for
balance of payments recording purposes,
they are treated as export in the "goods
account".
Payments on the other hand rose only
marginally during the year, by R1.3
million or 1.9 per cent. This slight
expansion in payments in overseas ports
by Seychelles carriers reflected mostly a
rise in spending on fuel, and to some
extent, on food and beverages, the bulk of
these being procurement by the national
carrier - Air Seychelles.
2.1.4 Repairs
As is recommended by the IMF’s Balance
of Payments Manual (Fifth Edition) the
value of repairs carried out on non-
residents property is recorded under
"goods". In 2000, the net flow in respect
of these transactions stood at negative
R3.2 million, representing a widening of
the deficit relative to last year. The
increase in the deficit was caused entirely
by the rise in payments in 2000, as
revenue remained constant. The bulk of
the expenses, which stood at R6.0 million,
was incurred by the national carrier Air
Seychelles.
2.2 Services
The surplus on the "services" account
shrank sharply in 2000. At the aggregate
level, it amounted to R469 million or a

ANNUAL REPORT 2000 THE EXTERNAL SECTOR
- 51 -
decline of R208 million or 31 per cent
relative to 1999. The surplus decreased
mainly on account of “financial &
business services” and to a lesser extent
“travel” and “government services”. In
respect of “financial & business services",
the shortfall widened by R185 million
whilst for the other two items mentioned
above, these surplus widened by R37
million and R18 million respectively.
In analysing the different service inflows
for 2000, it was observed that receipts
from “travel” remained one of the largest
service components. Nevertheless, on a
net basis “travel” recorded a surplus of
R574 million, which was R37 million or
6.1 per cent below last year level. This
downturn was attributable mainly to the
sharp rise in outflows, which completely
outweighed the moderate increase in
receipts. The rise in payments for the
current year under review was in turn
explained by the increase in relation to
foreign travel expenditure and training of
residents abroad, which rose by R30
million and a R12 million respectively.
Receipts, on the other hand, rose
moderately by only R5.2 million
compared to R15 million in the previous
year. Tourism earnings which makes up
the bulk of travel receipts grew by an
estimated R4.6 million.
The second largest revenue item under
services, “transportation” posted a further
increase - the third consecutive increase.
This was also the only major item under
services that recorded an improvement.
The surplus expanded by 17 per cent
amounting to R319 million and was
primarily on account of passenger-related
services, which grew by R11 million.
This reflected principally growth in ticket
sales by the national carrier, Air
Seychelles. Nevertheless, there was also
an increase in payments in 2000, in the
order of R4.2 million.
Other “transportation” items registered
mix outcomes. On the one hand there was
an improvement in “freight” payment and
that of “other transportation services” for
which payment declined, though the latter
only marginally. In respect of “freight”,
the shortfall stood at R41 million or 22 per
cent in relation to the previous year, due to
the sharp drop in imports. At R244
million, freight costs fell by R40 million
or 14 per cent.
As noted above it was the deterioration in
“financial & business services” that was
the key factor that caused the decline in
services. Whilst there was an increase in
receipts from “financial & business
services”, it was the rise in payments that
was most significant. This was in turn
caused by a rise in expenses incurred in
relation to operational lease and other
services payments.
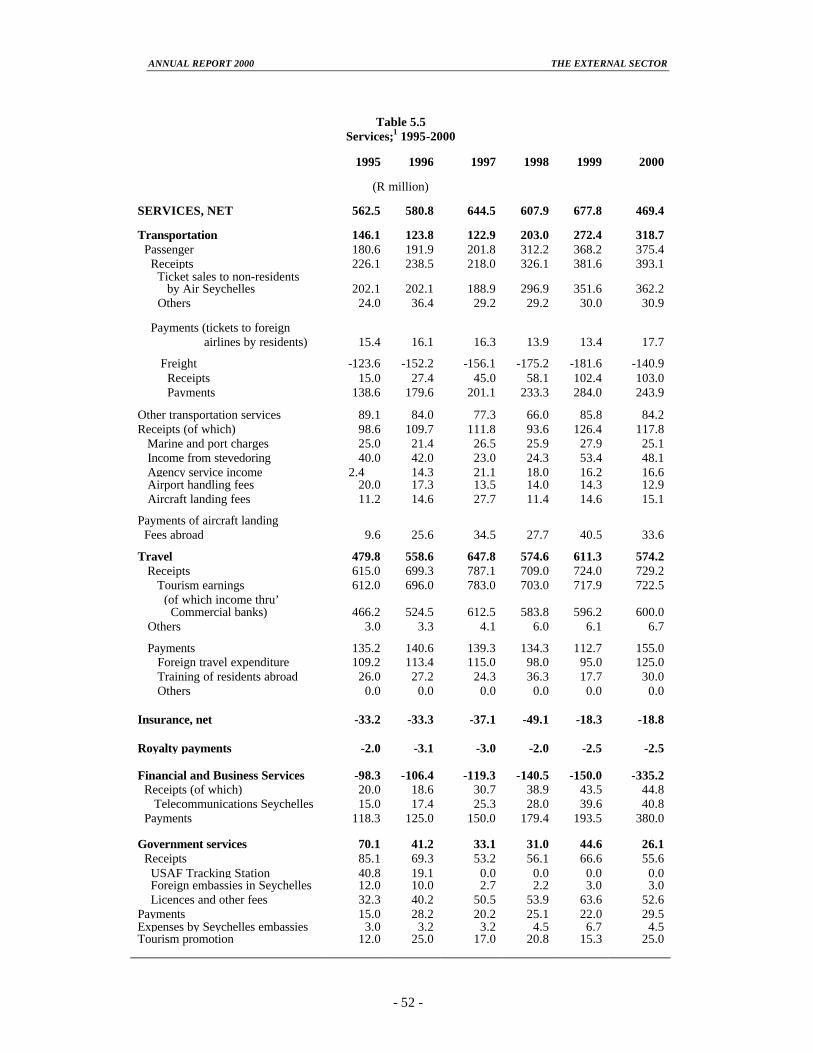
ANNUAL REPORT 2000 THE EXTERNAL SECTOR
- 52 -
Table 5.5 Services;1 1995-2000
1995 1996 1997 1998 1999 2000
(R million)
SERVICES, NET 562.5 580.8 644.5 607.9 677.8 469.4 Transportation 146.1 123.8 122.9 203.0 272.4 318.7 Passenger 180.6 191.9 201.8 312.2 368.2 375.4 Receipts 226.1 238.5 218.0 326.1 381.6 393.1 Ticket sales to non-residents by Air Seychelles 202.1 202.1 188.9 296.9 351.6 362.2 Others 24.0 36.4 29.2 29.2 30.0 30.9 Payments (tickets to foreign airlines by residents) 15.4 16.1 16.3 13.9 13.4 17.7 Freight -123.6 -152.2 -156.1 -175.2 -181.6 -140.9 Receipts 15.0 27.4 45.0 58.1 102.4 103.0 Payments 138.6 179.6 201.1 233.3 284.0 243.9 Other transportation services 89.1 84.0 77.3 66.0 85.8 84.2 Receipts (of which) 98.6 109.7 111.8 93.6 126.4 117.8 Marine and port charges 25.0 21.4 26.5 25.9 27.9 25.1 Income from stevedoring 40.0 42.0 23.0 24.3 53.4 48.1 Agency service income 2.4 14.3 21.1 18.0 16.2 16.6 Airport handling fees 20.0 17.3 13.5 14.0 14.3 12.9 Aircraft landing fees 11.2 14.6 27.7 11.4 14.6 15.1 Payments of aircraft landing Fees abroad 9.6 25.6 34.5 27.7 40.5 33.6 Travel 479.8 558.6 647.8 574.6 611.3 574.2 Receipts 615.0 699.3 787.1 709.0 724.0 729.2 Tourism earnings 612.0 696.0 783.0 703.0 717.9 722.5 (of which income thru’ Commercial banks) 466.2 524.5 612.5 583.8 596.2 600.0 Others 3.0 3.3 4.1 6.0 6.1 6.7 Payments 135.2 140.6 139.3 134.3 112.7 155.0 Foreign travel expenditure 109.2 113.4 115.0 98.0 95.0 125.0 Training of residents abroad 26.0 27.2 24.3 36.3 17.7 30.0 Others 0.0 0.0 0.0 0.0 0.0 0.0 Insurance, net -33.2 -33.3 -37.1 -49.1 -18.3 -18.8 Royalty payments -2.0 -3.1 -3.0 -2.0 -2.5 -2.5 Financial and Business Services -98.3 -106.4 -119.3 -140.5 -150.0 -335.2 Receipts (of which) 20.0 18.6 30.7 38.9 43.5 44.8 Telecommunications Seychelles 15.0 17.4 25.3 28.0 39.6 40.8 Payments 118.3 125.0 150.0 179.4 193.5 380.0 Government services 70.1 41.2 33.1 31.0 44.6 26.1 Receipts 85.1 69.3 53.2 56.1 66.6 55.6 USAF Tracking Station 40.8 19.1 0.0 0.0 0.0 0.0 Foreign embassies in Seychelles 12.0 10.0 2.7 2.2 3.0 3.0 Licences and other fees 32.3 40.2 50.5 53.9 63.6 52.6 Payments 15.0 28.2 20.2 25.1 22.0 29.5 Expenses by Seychelles embassies 3.0 3.2 3.2 4.5 6.7 4.5 Tourism promotion 12.0 25.0 17.0 20.8 15.3 25.0

ANNUAL REPORT 2000 THE EXTERNAL SECTOR
- 53 -
2.3 Income
In 2000 net income flows accruing to the
Seychelles economy declined somewhat,
as reflected by the widening of the deficit
to R152 million. This deterioration was
ascribed to the worsening positions of both
major headings of income "compensation
of employees" and "investment income".
Firstly, the widening in the shortfall in
"compensation of employees", which
amounted to R18 million, was due to an
increase in payments, whilst receipts
remained unchanged relative to last year.
The underlying factor with regards to the
rise in payments was the increase in
income paid for the services rendered by
non-residents in the private sector in the
form of salaries.
With regards to "investment income", net
outflow during 2000 stood at R127 million
and this comprised of net direct
investment and net other investment. In
terms of direct investment income, for the
year under review, it registered a surplus
of R3.8 million, a significant improvement
of R12 million relative to the previous
year. This movement from a deficit to a
surplus over the two years reflected the
notable increase in re-invested earnings
abroad by 50 per cent. It is worth noting
here that whilst actual payments i.e. cash
transfers of re-invested earnings was
constrained by the shortage of foreign
exchange, the increase reflects the fact that
such earnings are recorded on an accrual
basis.
Payments on the other hand remained
practically unchanged relative to last year.
It totalled R32 million and this consisted
of re-invested earnings in Seychelles and
dividend and distributed profits abroad,
which amounted to R20 million and R12
million respectively.
The most important component of income
flows remained other investment income,
which comprises mainly of interest flows.
In 2000, interest accruing to residents
from foreign investment amounted to R26
million, an increase of R5.5 million
relative to 1999. However, payments rose
by more than the increase in receipts,
resulting in a deterioration in the overall
balance on other investment income. In
total, payments amounted to R156 million,
a rise of R23 million.
At the aggregate level, the R26 million
inflow for 2000 represented interest
receipts of R8.7 million, R4.7 million and
R10 million for the Central Bank,
commercial banks and the private sector
respectively. In all three cases, inflows
were higher than in the year before.
In terms of payments, there were growths
in all payment categories with the
exception of interest payments by the
government, which fell by R11 million
relative to the previous year.

ANNUAL REPORT 2000 THE EXTERNAL SECTOR
- 54 -
2.4 Transfers
Whilst “net transfers” remained in surplus,
it contracted significantly compared to the
previous year, falling by R22 million or 76
per cent. This contraction was explained
by a combination of a drop in receipts and
a rise in payments.
Current transfers to government, which
accounts for the bulk of flows, recorded a
surplus of R45 million. At this level, it
represented a decline of R11 million or 20
per cent. One of the influential factors in
determining the level of current transfers
to the government is fishing licences.
During 2000, revenue from this item fell
to R25 million compared to R33 million in
1999. Furthermore, there was a decline in
overseas grants. This was partly
compensated, however, by an increase in
transfers to government in the form of
grants. It rose by R9.0 million or 82 per
cent relative to the previous year.
Net transfers to the private sector
remained in deficit during the year under
review, amounting to R38 million, a
deterioration of R11 million relative to the
previous year. The widening of the deficit
was entirely due to the rise in payments,
which completely overshadowed the
marginal increase in receipts. Receipts
amounted to R22 million compared to R21
million in 1999 whilst payments stood at
R60 million as against the R49 million
recorded in the previous year.
3. Capital and financial account
3.1 Capital account
For a second consecutive year, there was a
decline in the surplus recorded in the
capital account. According to data from
the Ministry of Foreign Affairs, capital
grants to Seychelles in 2000 from bilateral
and multilateral donors amounted to R50
million. This represented a fall of R38
million or 43 per cent relative to the
previous year.
3.2 Financial account
The Financial account remained in surplus
during 2000, with capital flows accounting
for 87 per cent of total inflows under the
combined “capital and financial account”.
For the year, net capital flow under the
financial account amounted to R345
million. At this level, it represented a
decline of R178 million or 34 per cent
relative to previous year. A net direct
investment inflow of R79 million was
recorded whilst the surplus in “other
investment” stood at R261 million.
Portfolio investment also registered a
surplus, though minimal in magnitude,
amounting to R5.4 million.
As stated above net foreign direct
investment (FDI) in the Seychelles
economy amounted to R79 million, of
which R60 million was investment by
Seychellois residents overseas and R139
million being investment of non-residents
in the economy. Outward FDI represents

ANNUAL REPORT 2000 THE EXTERNAL SECTOR
- 55 -
investment of equity capital and re-
investment of resident funds abroad by
Seychelles residents and compared to last
year, it has increased by R12 million
mainly on account of the latter.
As stated above FDI within the economy
amounted to R139 million a decline of
R156 million compared to 1999.
Investment in the form of equity capital
accounted for the bulk of total inflow,
though compared to last year. Most of the
investment went into the tourism industry.
As regards to the last heading of inflow in
the financial account, “other investment”,
on a net basis, it remained in surplus in
2000, though the surplus contracted
compared to the previous year. At the
aggregate level, it amounted to R261
million, representing a fall of R12 million
or 4.5 per cent relative to last year. On the
asset side (debit), currency and deposits
grew by R20 million. However, the bulk
of the inflow was accounted for on the
liability side (credit). Inflows totalled
R351 million, an increase of 2.4 per cent
relative to the previous year. This increase
represented new drawdown by the Central
Bank and the government respectively.
4. External reserves
Gross official reserves increased by a
further R112 million or 69 per cent. At
the end of December, gross reserves stood
at R274 million. This was equivalent to
7.3 weeks of imports 2000 imports (c.i.f.).
Table 5.6 External Reserves;1 1995-2000
1995 1996 1997 1998 1999 2000
(R million) Gross official reserves 127.6 103.4 129.1 117.6 162.7 274.2 Central Bank 126.8 99.2 127.2 115.2 160.2 271.1 Government 0.8 4.2 1.9 2.4 2.5 3.1 Central Bank’s short-term Borrowings 17.2 12.5 64.8 173.1 211.2 403.4 Net official reserves 110.4 90.9 64.3 -55.5 -48.5 -129.2
1 End-of period data.
But despite the growth in gross reserves,
on a net official basis reserves deteriorated
by R81 million. This adverse movement
in the net position was due to the rise in
the Central Bank’s short-term borrowings,
which increased by R192 million relative
to the end of last year. At the end of the
year, the net official reserves position
stood at negative R129 million.
5. Exchange rates
The Seychelles rupee remained pegged to
the Seychelles Trade and Tourism
Weighted basket (STTWB) during 2000,

ANNUAL REPORT 2000 THE EXTERNAL SECTOR
- 56 -
the peg, which was introduced in May
1996. During the year, the movements in
the value of the rupee relative to the major
world currencies were somewhat volatile
compared to the previous year with the
range of fluctuation being between
negative 7.9 per cent and plus 13 per cent.
The rupee recorded mixed movements
relative to the different currencies. The
greatest gain was against the euro (7.6 per
cent) and that of the South African rand
(5.7 per cent).
In terms of the other currencies in the
basket, the rupee lost grounds against the
Japanese yen, which depreciated by the
highest margin of 13 per cent. This was
followed by the US dollar by 7.0 per cent
and the Singapore dollar by 5.1 per cent.
The marginal lost was against the UK
pound by 0.04 per cent.
Table 5.7 Exchange Rates;1 1995-2000
1995 1996 1997 1998 1999 2000
(Seychelles Rupees per currency unit) US dollar 4.7722 4.9699 5.0269 5.2638 5.3418 5.7132 Pound sterling 7.5312 7.7991 8.2379 8.7229 8.6415 8.6446 Deutsche mark 3.3339 3.2899 2.9029 2.9989 2.9217 2.6917 Japanese yen 0.0509 0.0455 0.0416 0.0404 0.0471 0.0530 French franc 0.9569 0.9676 0.8624 0.8945 0.8710 0.8026 Italian lira 0.0029 0.0032 0.0030 0.0030 0.0030 0.0027 South African rand 1.3160 1.1602 1.0915 0.9572 0.8742 0.8248 Singapore dollar 3.3652 3.5066 3.3921 3.1481 3.1515 3.3132
1 Period averages.

SECTION SIX
The Real Sector: Production,
Employment and Prices
1. Macroeconomic developments
in 2000 - Overview
Provisional estimates of national income
for the year point to a further slowdown in
real economic growth. This year’s
outcome emanated principally from a
decline in nominal growth of Gross
Domestic Product (GDP), as inflation
remained stable relative to the previous
year, standing at 6.3 per cent. Central
Bank estimates based on information
collected from various sources including
MISD suggest that GDP growth for the
year 2000 stood at 1.4 per cent, down from
2.9 per cent in 1999 (Chart 6.1 & Table
6.1) in real terms.
C h a r t 6 . 1 . R e a l G D P g r o w t h
-4 .0
-2 .0
0 .0
2 .0
4 .0
6 .0
8 .0
10 .0
1 9 9 0 1 9 9 1 1 9 9 2 1 9 9 3 1 9 9 4 1 9 9 5 1 9 9 6 1 9 9 7 1 9 9 8 1 9 9 9 2 0 0 0
Y e a r s
Per
cen
tag
e
R e a l G D P g r o w t h
- 57 -

ANNUAL REPORT 2000 THE REAL SECTOR: PRODUCTION, EMPLOYMENT AND PRICES
- 58 -
Despite the general slowdown, there were
sectors of the economy that registered
encouraging growth, notably “electricity
& water”, “building & construction”,
“transport, distributions and
communications” and “other services”.
Rather encouraging in 2000 was the
recovery of the tourism industry, both in
terms of arrivals and in revenue earned.
This turnaround in fortunes for the sector
also had a positive impact for other
sectors, in particular those directly or
indirectly linked to the industry. This was
reflected in higher growth in “other
services” category of Gross Domestic
Product.
Growth in the industrial sector, which is
becoming increasingly important, was
again hampered by the continued foreign
exchange shortage. In Seychelles the
sector depends largely on imported raw
materials. It is for this reason that
impediments on imports would normally
leads to the sector performing below its
potential.
Table 6.1
Gross Domestic Product by Kind of Economic Activity1 at constant market prices
1995 1996 1997 1998 1999 2000 Percentage change -0.8 4.9 4.6 5.5 2.9 1.4
(R million) GDP at constant market prices 1933.9 2029.0 2122.11 2238.8 2303.7 2336.0 Agriculture, forestry and fishing 61.4 64.1 65.0 64.4 67.5 67.2 Mining, manufacturing and Handicrafts 243.4 280.0 368.0 389.3 433.4 426.7 Electricity and water 81.2 107.6 128.6 138.5 149.7 156.1 Building and construction 116.4 133.0 148.6 159.7 167.7 173.6 Transport, distribution and Communications 617.9 612.7 597.4 657.1 690.0 714.1 Hotels and restaurants 101.5 89.2 75.9 76.3 72.8 75.0 Financial and business services 231.4 240.9 250.0 242.7 244.8 244.8 Government services 232.4 242.0 224.1 245.0 239.9 237.5 Other services 248.2 259.3 264.5 265.7 237.9 241.0
Source: Management and Information Systems Division (except 1997, 1998 and 1999 which are Central Bank
estimates with the help of IMF projections.
All the three broad sectors of economic
activity, namely the primary, secondary
and tertiary sectors, contributed to the
growth in GDP. However, the major
influence on growth appeared to come
from the secondary and tertiary sectors,
which comprises mainly of utilities and
construction, transport, communication,
tourism and government services
respectively (Tables 6.1-6.3).

ANNUAL REPORT 2000 THE REAL SECTOR: PRODUCTION, EMPLOYMENT AND PRICES
- 59 -
Although there was a slowdown in the
growth of the industrial sector, there were
nevertheless some encouraging
developments, especially with regards to
locally processed food for both the local
and international markets. Meat and fish
processing industries, El 's Products
(meat), Oceana Fisheries and Sea Harvest
have performed generally strongly
whereby in some cases exporting to
Europe. The country's primary
manufacturing entity, the Indian Ocean
Tuna (IOT) canning factory registered an
increase in exports in 2000, although the
level of output declined relative to the
previous year, the latter caused mostly by
excess supply abroad. In absolute terms
there was a general increase in revenue but
in percentage terms a declining growth
rate was recorded relative to the previous
year. There was an increase in the
exports of prawn feeds mostly to
Madagascar.
The construction sector, recorded a
slowdown in real growth relative to 1999,
due to two main constraints. Firstly the
industry remained largely dependent on
imported inputs, notably cement, steel and
most of the finishing materials mainly as a
result of the foreign exchange shortage.
In turn the shortage had an influence on
prices on the limited products available,
causing growth to be eroded in real terms.
Nevertheless, there were major
construction projects implemented in
2000. Among them being the continuation
of the reclamation work on the East Coast
Phase III, the ongoing Government
housing projects at Les Mamelles, Union
Vale and upper Anse Aux Pins, the near
completion of the Praslin airport, and the
construction of various shopping
complexes in Victoria.
During 2000, the combined output of
electricity and water was estimated to have
grown by 4.3 per cent in real terms. The
rise in the output of utilities came
primarily from increased generation of
electricity with the completion of the new
generating station, which was opened in
June. This new station has increased the
generating capacity significantly.

ANNUAL REPORT 2000 THE REAL SECTOR: PRODUCTION, EMPLOYMENT AND PRICES
- 60 -
Table 6.2 Gross Domestic Product by Kind of Economic Activity1
at current market prices 1995 1996 1997 1998 1999 2000
(R million) GDP at market value 2419.8 2588.7 2829.6 3201.0 3379.1 3450.4 Agriculture, forestry and fishing 101.0 97.4 98.8 84.2 81.3 83.3 Mining, manufacturing and Handicrafts 306.2 321.7 406.8 482.1 512.0 498.8 Electricity and water 51.2 52.5 69.5 80.1 81.5 86.7 Building and construction 190.9 208.1 212.7 264.9 310.1 341.1 Transport, distribution and Communications 717.5 799.6 816.7 963.6 1105.5 1123.3 Hotels and restaurants 226.3 247.2 268.9 289.5 279.2 295.6 Financial and business services 254.6 287.5 320.8 341.7 373.4 373.3 Government services 338.8 351.0 376.0 410.0 422.2 440.3 Other services 233.3 223.7 259.4 284.9 213.9 208.0
Source: Management and Information Systems Division (except 1996, which is a Central Bank estimate).
In absolute terms the primary sector
witnessed encouraging performances in
2000, though overall growth declined in
real terms relative to the previous year.
The primary focus of this sector, namely
agriculture experienced a further upward
trend in overall output during the year.
The rise in output was primarily induced
by the rise in livestock production, whilst
both crop production and the production of
fruit and vegetables fell relative to 1999.
There was also an increase in production
of copra, whilst cinnamon recorded a
decline.
In terms of the fisheries sector, there was a
general decline in output – as measured by
the catch. This was the case for all three
methods of fishing, namely artisanal,
semi-industrial and industrial. However,
Exports and revenue in all these different
methods increased. There was also an
increase in transhipment activities,
confirming Victoria as the principal
transhipment port in the Indian Ocean
during the year.

ANNUAL REPORT 2000 THE REAL SECTOR: PRODUCTION, EMPLOYMENT AND PRICES
- 61 -
Table 6.3 Gross Domestic Product by Broad Productive Sectors1
at current market prices 1995 1996 1997 1998 1999 2000
(R million) GDP 2419.8 2588.7 2829.5 3201.3 3379.1 3450.4 Agriculture, forestry and fishing 101.0 97.4 98.8 84.2 81.3 83.3 Industries 529.6 560.6 666.1 800.3 877.5 898.2 Tourism 386.1 370.7 415.4 549.4 546.4 573.9 Government 338.8 351.0 376.0 410.0 422.2 440.3 Other services2 1064.3 1209.0 1273.2 1357.4 1451.7 1454.7
1 Source: Management and Information Systems Division (except 1996, which is a Central Bank estimate). 2 Includes import duties.
With regard to the tertiary sector, the
indicators point to an increase of around
2.0 per cent in nominal terms in 2000. In
real terms, the sector, which accounts for
72 per cent of gross domestic product
grew by 1.8 per cent. The main factors
behind this increase were improvement in
tourism activities, transport and
communications. Tourism accounted for
17 per cent of GDP in 2000, thus
remaining the country's major economic
activity. There were growth in terms of
the main indicators, namely arrivals and
income. These positive observations in
terms of tourism would have boosted the
rest of the economy, in view of its domino
effect on other areas of the economy such
as "transportation " and "other services".
Increased activity of "hotels & restaurants"
and "other activities" both mirrored the
rise in tourism. The "other activities"
category comprises of recreational
activities directed to tourists and other
related tourism activities. The increase in
tourism arrivals in 2000 was due partly to
the improved code-sharing agreements
with the different international airlines,
enabling the accommodation of more
passengers on behalf of Air Seychelles.
During 2000 the Seychelles Tourism
Marketing Authority (STMA) continued to
play a pivotal role in marketing Seychelles
overseas. The rise in tourism income via
banks is another plus recorded in that
sector.
Output in relation to “transportation” was
boosted by the increase in transhipment
activities during 2000.
The communications sector, also saw its
output increase in 2000. Several
developments have contributed to the
increased dynamism of this sector. Firstly,
there was a follow up to the dynamic price
war and competition between the two
telephone companies in the previous year,

ANNUAL REPORT 2000 THE REAL SECTOR: PRODUCTION, EMPLOYMENT AND PRICES
- 62 -
namely Airtel and Cable & Wireless (Sey)
Ltd, with the former introducing its own
fixed line services. There has also been a
continuous rise in mobile phone services.
Secondly, there was another opening in the
telecommunications business with the
introduction of a second Internet Services
Provider (ISP) company - Kokonet. This
new company would provide services
alongside incumbent company ATLAS.
Kokonet, jointly owned by Space 95,
Cable & Wireless (Sey) Ltd, and Mauritian
group Blanche Birger Limited as well as
staff grouping would be offering a choice
of different link-up technologies - dial-up,
digital leased line and wireless.
The example of the communications sector
should serve as a model on the benefits
that more competition could bring to the
Seychelles economy.
After registering an increase in both real
and nominal terms in 1999, financial and
business services remained constant
during the year under review, as there was
no major development. Its contribution to
overall GDP in both nominal and real
terms remained roughly at 11 per cent as
recorded in the preceding year.
Outlook for the year 2001 will depend on
the policies that the government
implement in its efforts to improve the
influx of foreign exchange situation.
Under current circumstances the primary
focus will remain on addressing shortage.
This shortage remains the core of the
distortions that the economy is facing.
Producers have been affected by their
inability to access inputs required in the
production process. As far as inflation is
concerned, the existence of price control
will likely to continue to keep inflation in
single digits. However, it is also important
that more fundamental measures need to
be strengthened, in particular the excessive
credit expansion. In this regard it would
assist largely if the Government would
maintain the fiscal discipline, if not
strengthen it, in view of the fact that
Government accounts for a 85 per cent of
total domestic credit.
Whilst supply side policies will also need
to be re-looked at, the looming threat of
inflation warrants serious consideration by
the authorities.
2. Tourism
The year 2000 saw a turnaround for the
most important economic activity.
Analysis at the two main targeted
indicators of growth for the industry,
namely arrivals and income, revealed that
there were increases in both these
aggregates, although the latter was
marginal (Charts 6.2 & 6.3 below).
Furthermore, according to provisional
data on national income, the rise in
activity in the industry during the year
meant that the share of tourism value
added in Gross Domestic Product rose to
17 per cent compared to 16 per cent in the
previous year. This meant that it was not
only the industry that grew but also other
auxiliary services that provide support to
the sector saw increases in their activities.
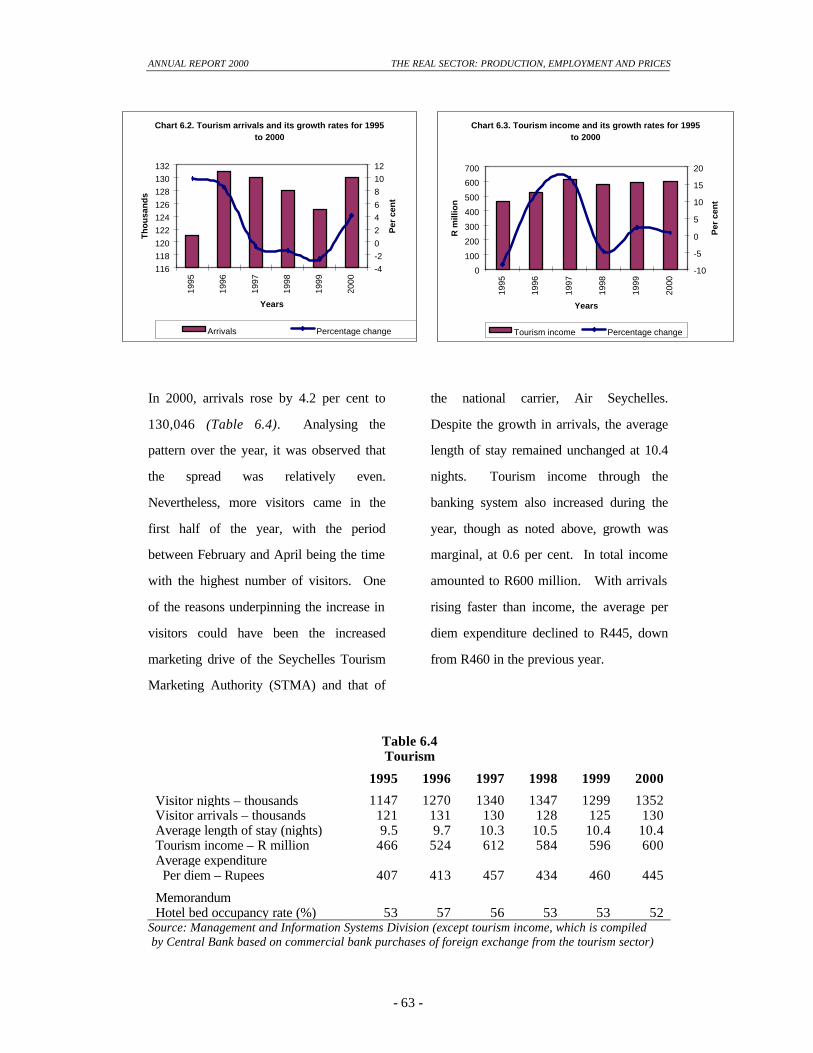
ANNUAL REPORT 2000 THE REAL SECTOR: PRODUCTION, EMPLOYMENT AND PRICES
- 63 -
In 2000, arrivals rose by 4.2 per cent to
130,046 (Table 6.4). Analysing the
pattern over the year, it was observed that
the spread was relatively even.
Nevertheless, more visitors came in the
first half of the year, with the period
between February and April being the time
with the highest number of visitors. One
of the reasons underpinning the increase in
visitors could have been the increased
marketing drive of the Seychelles Tourism
Marketing Authority (STMA) and that of
the national carrier, Air Seychelles.
Despite the growth in arrivals, the average
length of stay remained unchanged at 10.4
nights. Tourism income through the
banking system also increased during the
year, though as noted above, growth was
marginal, at 0.6 per cent. In total income
amounted to R600 million. With arrivals
rising faster than income, the average per
diem expenditure declined to R445, down
from R460 in the previous year.
Table 6.4 Tourism
1995 1996 1997 1998 1999 2000 Visitor nights – thousands 1147 1270 1340 1347 1299 1352 Visitor arrivals – thousands 121 131 130 128 125 130 Average length of stay (nights) 9.5 9.7 10.3 10.5 10.4 10.4 Tourism income – R million 466 524 612 584 596 600 Average expenditure Per diem – Rupees 407 413 457 434 460 445 Memorandum Hotel bed occupancy rate (%) 53 57 56 53 53 52
Source: Management and Information Systems Division (except tourism income, which is compiled by Central Bank based on commercial bank purchases of foreign exchange from the tourism sector)
Chart 6.2. Tourism arrivals and its growth rates for 1995 to 2000
116
118
120
122
124
126
128
130
132
1995
1996
1997
1998
1999
2000
Years
Th
ou
san
ds
-4
-2
0
2
4
6
8
10
12
Per
cen
t
Arrivals Percentage change
Chart 6.3. Tourism income and its growth rates for 1995 to 2000
0
100
200
300
400
500
600
700
1995
1996
1997
1998
1999
2000
Years
R m
illio
n
-10
-5
0
5
10
15
20
Per
cen
t
Tourism income Percentage change

ANNUAL REPORT 2000 THE REAL SECTOR: PRODUCTION, EMPLOYMENT AND PRICES
- 64 -
In terms of geographical distribution, the
European continent remained the leading
market with 80 per cent of total visitors.
France, like in previous years was the
most important market with 28,282
visitors. At this level, it accounted for 22
per cent of total arrivals 3.0 per cent
higher than the 1999 aggregate. The other
important European markets remained
Italy, Germany and the UK, accounting for
15 per cent, 14 per cent and 13 per cent of
the total number of visitors respectively.
The market share of Scandinavia and that
of other countries in Europe remained
relatively unchanged. From the other
sources, with the exception of Africa,
there were increases in respect of America
and Asia. For those two markets, the rise
in arrivals was 51 per cent and 7.6 per cent
respectively.
The interest of foreign investors in the
country’s major industry continued during
the year with the start of the construction
of a new five-star hotel at Intendance.
This will be Mahe’s first 5 star hotel. The
hotel owned by Banyan Tree Resort will
be a 100-room hotel and is expected to be
completed by November 2001. Further
capacity increases in luxury hotels have
already been approved. These include
Sofitel Seychelles Hotel and Petite Anse
Hotel. Other project proposals on the
table are Corvina investment/ Sun Resort
(Port Launay), Beach Comber (Ste.Anne),
North Island and Carana Beach.
The opening of the Lemuria Resort further
complemented this strong interest of
foreign investors during the year.
President Rene officially opened the five-
star luxury Lemuria Resort and golf course
on Praslin on October 22, calling on all
Praslinois to support the establishment and
value it as part of their land and the
economic development of their island. He
described the luxury resort, as a “jewel”
which we must all treasure.
In April, Air Seychelles announced the
acquisition of a new generation Boeing
737-700 and a third aircraft in November
2001 to serve regional routes. Its first
aircraft, a Boeing 767-200 would be
replaced by a 767-300, which has 20 per
cent more seat capacity, in April the same
year. This boost in capacity has been
rendered necessary due to the increase in
the number of passengers on some of the
airline’s routes, particularly that of the
UK. The Airline, which operates two
flights a week from Gatwick to Mahe, will
be able to offer more capacity from April
2001 when a Boeing 767-300 will come
into its fleet.
Further additions to Air Seychelles
services have been a partnership with
Avis, a car rental company. Air
Seychelles and international car rental
company Avis, launched a joint initiative,
which will offer passengers flying Air
Seychelles the opportunity to rent Avis
ANNUAL REPORT 2000 THE REAL SECTOR: PRODUCTION, EMPLOYMENT AND PRICES
- 65 -
cars at beneficial rates. Air Seychelles’
passengers are identified through Avis’
worldwide system as being specifically
Air Seychelles passengers, which means
that if and when they make a booking for a
car rental with Avis anywhere in the
world, they are given beneficial rates.
In addition, there will be special
programmes such as upgrades, running
through the coming year to promote the
partnerships. In Seychelles, it costs on
average about SR350 to SR400 to rent a
car with Avis for a day, but under the
programme, passengers flying Air
Seychelles will pay an average of SR317,
benefiting a reduction of about 9 per cent.
Other developments in terms of air traffic,
has been the re-launching of Inter-Air
services in September from Johannesburg
to Seychelles via Madagascar. There were
also discussions with other airline
companies to start operations in the
coming years.
The Ministry of Tourism & Civil Aviation
again organised its Tourism Week at the
end of September. This time instead of
organising a conference on Mahé, it did a
symposium, by decentralising the
activities to the islands of Praslin and La
Digue, reflecting their continued growing
importance in the tourism trade. The
symposium theme “Impact of Tourism on
the National Economy”, offered the
opportunity for all those involved in the
industry, particularly those on these two
islands.
The prospects for the coming year are
overall positive. The marketing strategy
of STMA and the acquisition of the two
aircraft by Air Seychelles will surely be a
boost to the industry, not just for 2001 but
also for the years ahead.
3. Agriculture
Overview
Agricultural output remained on the
upward trend in the year 2000. Overall,
production increased relative to the
previous year, but it was livestock more
than crop output that explained the rise in
agricultural production. Local production
of livestock continued to expand further,
particularly that of chicken, pork and beef.
If this trend continues this should help
reduce our dependence on imports in the
long run.
As far as crop production was concerned,
there was a decline relative to the previous
year on account of various difficulties
encountered by the farming sector.
Declines were particularly pronounced in
the traditional crops, namely
cinnamon, where both deliveries to
warehouses and export fell significantly.
Copra on the other hand saw an increase in
output, whilst at the same time, there was
a new breath of life for export with an
SITZ company Hinds looking into the
possibility of exporting coconut products.
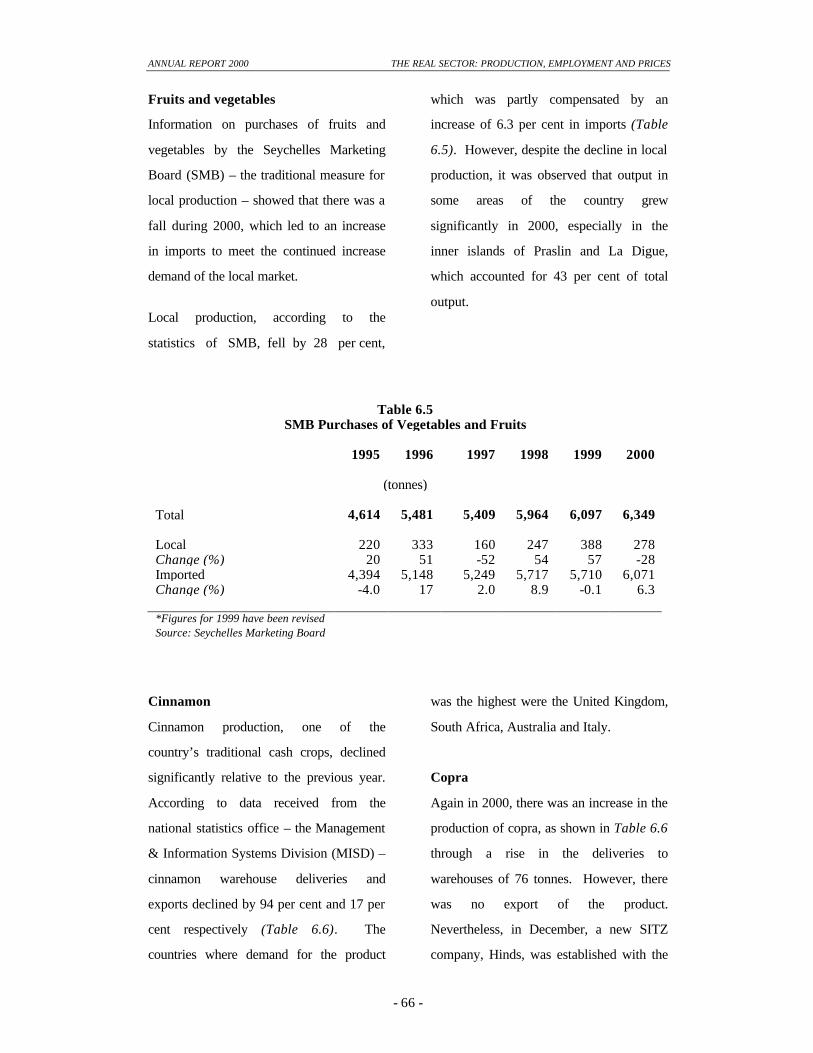
ANNUAL REPORT 2000 THE REAL SECTOR: PRODUCTION, EMPLOYMENT AND PRICES
- 66 -
Fruits and vegetables
Information on purchases of fruits and
vegetables by the Seychelles Marketing
Board (SMB) – the traditional measure for
local production – showed that there was a
fall during 2000, which led to an increase
in imports to meet the continued increase
demand of the local market.
Local production, according to the
statistics of SMB, fell by 28 per cent,
which was partly compensated by an
increase of 6.3 per cent in imports (Table
6.5). However, despite the decline in local
production, it was observed that output in
some areas of the country grew
significantly in 2000, especially in the
inner islands of Praslin and La Digue,
which accounted for 43 per cent of total
output.
Table 6.5
SMB Purchases of Vegetables and Fruits 1995 1996 1997 1998 1999 2000
(tonnes) Total 4,614 5,481 5,409 5,964 6,097 6,349 Local 220 333 160 247 388 278 Change (%) 20 51 -52 54 57 -28 Imported 4,394 5,148 5,249 5,717 5,710 6,071 Change (%) -4.0 17 2.0 8.9 -0.1 6.3 *Figures for 1999 have been revised Source: Seychelles Marketing Board
Cinnamon
Cinnamon production, one of the
country’s traditional cash crops, declined
significantly relative to the previous year.
According to data received from the
national statistics office – the Management
& Information Systems Division (MISD) –
cinnamon warehouse deliveries and
exports declined by 94 per cent and 17 per
cent respectively (Table 6.6). The
countries where demand for the product
was the highest were the United Kingdom,
South Africa, Australia and Italy.
Copra
Again in 2000, there was an increase in the
production of copra, as shown in Table 6.6
through a rise in the deliveries to
warehouses of 76 tonnes. However, there
was no export of the product.
Nevertheless, in December, a new SITZ
company, Hinds, was established with the

ANNUAL REPORT 2000 THE REAL SECTOR: PRODUCTION, EMPLOYMENT AND PRICES
- 67 -
aim of reviving the coconut industry with
value-added coconut products such as
coconut husk, oil and activated carbon
produced from coconut shell, which would
be targeted mainly for the international
market.
Tea
After two years of low output due to
drought, tea production saw an increase,
rising by 4.3 per cent to total 246 tonnes
(Table 6.6). This improvement was due
mainly to better weather conditions.
Table 6.6 Crops
1995 1996 1997 1998 1999 2000
(tonnes) Copra (exports) 353 0 0 0 0 0 Copra (warehouse deliveries) 344 393 314 259 301 377 Cinnamon bark (exports) 487 318 220 289 214 177 Cinnamon bark (warehouse Deliveries) 414 280 241 478 385 25 Tea, green leaf (processed) 226 223 270 250 236 246 Source: Management & Information Systems Division
4. Livestock
The production of livestock, as highlighted
above, was significantly higher than in the
previous year. Data obtained from the
Ministry of Agriculture and Marine
Resources show that local production of
the three most demanded meat rose on
aggregate by 17 per cent, with increases of
34 per cent, 10 per cent and 6.2 per cent in
pork, chicken and beef respectively. The
rise in local production of meat was also
reflected by the traditional indicator of
animals slaughtered at the abattoir in
(Table 6.7). This indicates that increases
were registered in all three meat products
of 30 per cent, 5.7 per cent and 5.8 per
cent respectively.
Table 6.7
Livestock (slaughters)1 1995 1996 1997 1998 1999 2000 (Units) Cattle 189 162 91 123 139 147 Pigs 6,739 5,302 5,165 6,430 6,629 8,619 Chicken (‘000) 733 720 806 684 695 734 1 Le Rocher Abattoir only

ANNUAL REPORT 2000 THE REAL SECTOR: PRODUCTION, EMPLOYMENT AND PRICES
- 68 -
5. Fisheries
The fisheries sector continued to play a
major role in the country’s economy in the
year under review, both in terms of
employment and value added. Though the
total volume of production from the sector
experienced a drop in terms of fish caught,
namely artisanal and semi-industrial, the
quantity exported and revenue earned from
the fishing industry grew significantly
during 2000, according to data obtained
from the Seychelles Fishing Athority
(SFA).
The lobster season, which was reopened in
the previous year, again produced record
landings. According to preliminary
statistics over fourteen metric tonnes of
lobster were caught in the period of
November 2000 to January 2001.
With regards to the industrial fishing
activity, which in Seychelles covers
entirely tuna fishing, the year 2000 was on
the whole another good year, even though
there was a marginal decline in total catch.
It fell by 0.3 per cent. Nevetheless, there
was an increase in transhipment through
Port Victoria. Furthermore, there was a
rise in total revenue obtained from this
activity.
5.1 Artisanal and semi-industrial
fishing sector
According to information provided to the
Central Bank by the Seychelles Fishing
Authority (SFA), landing through artisanal
fishing, which represent mostly fishing
along the coast (including through the use
of traps) declined marginally during 2000.
Total catch amounted to 4,768 metric
tonnes, a decline of 74 metric tonnes
relative to the previous year (Table 6.8).
Whilst the bulk of what is caught through
this type of fishing is for local
consumption, there continued to be an
increase in demand on the international
market for the high value species of fish.
This was particularly evident in 2000,
where the amount of fresh, frozen and
processed fish exported increased from
825 metric tonnes in 1999 to 2,271 metric
tonnes in the year under review. This
brought the country R45 million in foreign
earnings. The export of fish also includes
those caught using semi-industrial
methods, one of the fishing methods that is
increasingly being encouraged.
SFA concerted efforts have been geared to
promote the development of the semi-
industrial fishing technique. Another boat
built in Sri Lanka joined the fishery during
the year and loans were disbursed for two
22-metre boats financed under the
European Union (EU) longline
disbursement project. The local semi-
industrial fleet as of December 2000 now
comprises 9 vessels. A total of 390 metric
tonnes of fish was caught during 2000
compared to 457 metric tonnes in 1999.
The predation rate an important drawback
for longline fishing decreased substantially
to 11 per cent. Swordfish was the main
species targeted (56 per cent), whilst shark
catch made up 15 per cent of the catch,
this being principally due to the value of
their fins on the international market.

ANNUAL REPORT 2000 THE REAL SECTOR: PRODUCTION, EMPLOYMENT AND PRICES
- 69 -
The lobster season, which was opened
from November to January for the second
consecutive year, produced landings of 14
metric tonnes. In 2000 this activity was
also better monitored with regular night
patrols organised and more catch and
effort data collected.
Other developments during the year
included negotiations with the Japanese
Government to finalise the grant aid
project for the development of the
artisanal fishery. This project, valued at
R25 million involves the acquisition of an
ice plat of 5 metric tonnes daily capacity,
approximately 60 inboard engines, 5
fishing vessels, fishing and safety
equipment that will eventually be sold to
the local fishermen.
The fuel voucher scheme was also
reviewed with the objective of ensuring
that abuse of the scheme was minimised.
The scheme was also computerised to
facilitate its administration.
5.2 Industrial fishing
The industrial tuna purse-seining fleet
continued to play an active role with 49
purse-seiners licensed, of which 45 were
active. This is a reduction in the number
of licensed vessel compared to 1999 when
56 vessels were licensed but roughly the
same number i.e. 46 were active. The total
catch for the purse seiners licensed to fish
in Seychelles Exclusive Economic Zone
(EEZ) and generally operating in the
Western Indian Ocean during 2000 was
330,340 metric tonnes, compared with a
catch of 331,424 metric tonnes in 1999
(Table 6.8).
Transhipment activity, which includes
landings to the canning factory, increased
during 2000 with 269,673 metric tonnes
transhipped compared to 257,447 in 1999.
This maintained Port Victoria’s status as
the principal transhipment port in the
Indian Ocean. The total amount
transhipped represented 82 per cent of
total catch. This reflects an increase in
fishing operations in the western part of
the Indian Ocean compared to last year.
Concerning industrial longlining activity
165 licences were issued (the major
countries being Taiwan 69, South Korea
28 and Japan 43). The licence fees from
foreign purse-seiners and longliners
dropped significantly in 2000 to R24.6
million compared to R34.6 million in
1999. This is partly due to a reduction in
the catch inside the EEZ as well as the
decrease in the number of longliners
applying for a licence, in particular
Taiwanese vessels.
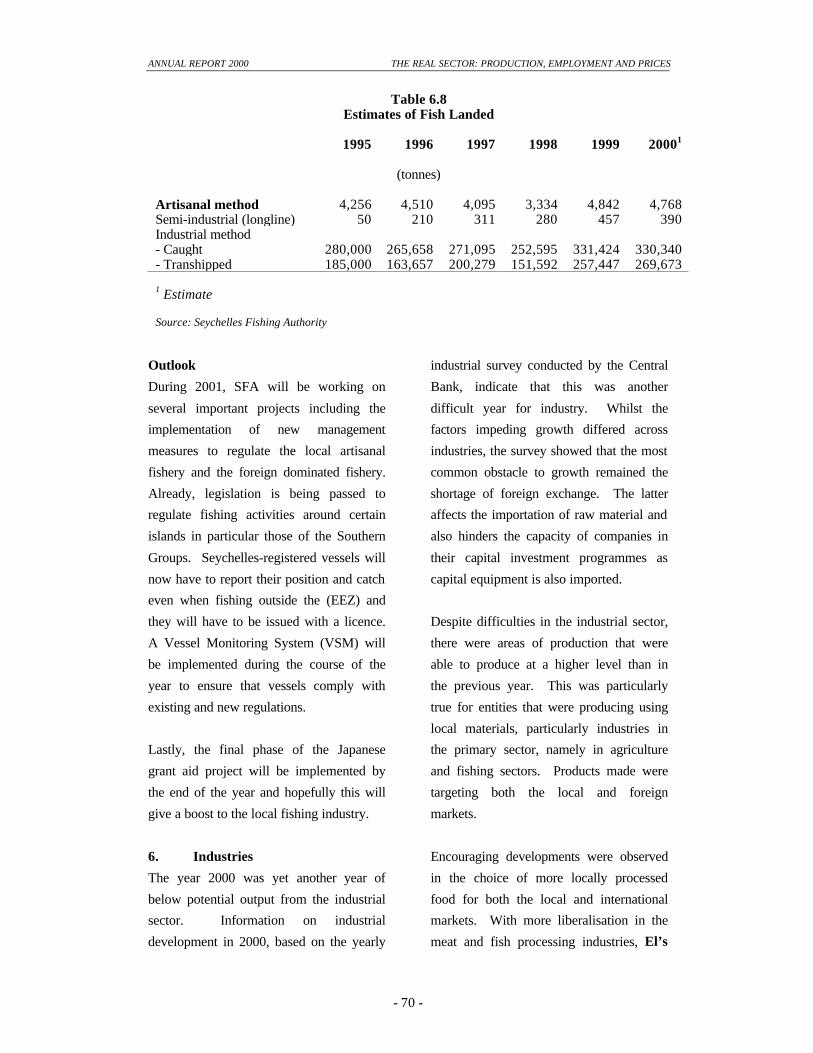
ANNUAL REPORT 2000 THE REAL SECTOR: PRODUCTION, EMPLOYMENT AND PRICES
- 70 -
Table 6.8 Estimates of Fish Landed
1995 1996 1997 1998 1999 20001
(tonnes) Artisanal method 4,256 4,510 4,095 3,334 4,842 4,768 Semi-industrial (longline) 50 210 311 280 457 390 Industrial method - Caught 280,000 265,658 271,095 252,595 331,424 330,340 - Transhipped 185,000 163,657 200,279 151,592 257,447 269,673 1 Estimate Source: Seychelles Fishing Authority
Outlook
During 2001, SFA will be working on
several important projects including the
implementation of new management
measures to regulate the local artisanal
fishery and the foreign dominated fishery.
Already, legislation is being passed to
regulate fishing activities around certain
islands in particular those of the Southern
Groups. Seychelles-registered vessels will
now have to report their position and catch
even when fishing outside the (EEZ) and
they will have to be issued with a licence.
A Vessel Monitoring System (VSM) will
be implemented during the course of the
year to ensure that vessels comply with
existing and new regulations.
Lastly, the final phase of the Japanese
grant aid project will be implemented by
the end of the year and hopefully this will
give a boost to the local fishing industry.
6. Industries
The year 2000 was yet another year of
below potential output from the industrial
sector. Information on industrial
development in 2000, based on the yearly
industrial survey conducted by the Central
Bank, indicate that this was another
difficult year for industry. Whilst the
factors impeding growth differed across
industries, the survey showed that the most
common obstacle to growth remained the
shortage of foreign exchange. The latter
affects the importation of raw material and
also hinders the capacity of companies in
their capital investment programmes as
capital equipment is also imported.
Despite difficulties in the industrial sector,
there were areas of production that were
able to produce at a higher level than in
the previous year. This was particularly
true for entities that were producing using
local materials, particularly industries in
the primary sector, namely in agriculture
and fishing sectors. Products made were
targeting both the local and foreign
markets.
Encouraging developments were observed
in the choice of more locally processed
food for both the local and international
markets. With more liberalisation in the
meat and fish processing industries, El’s
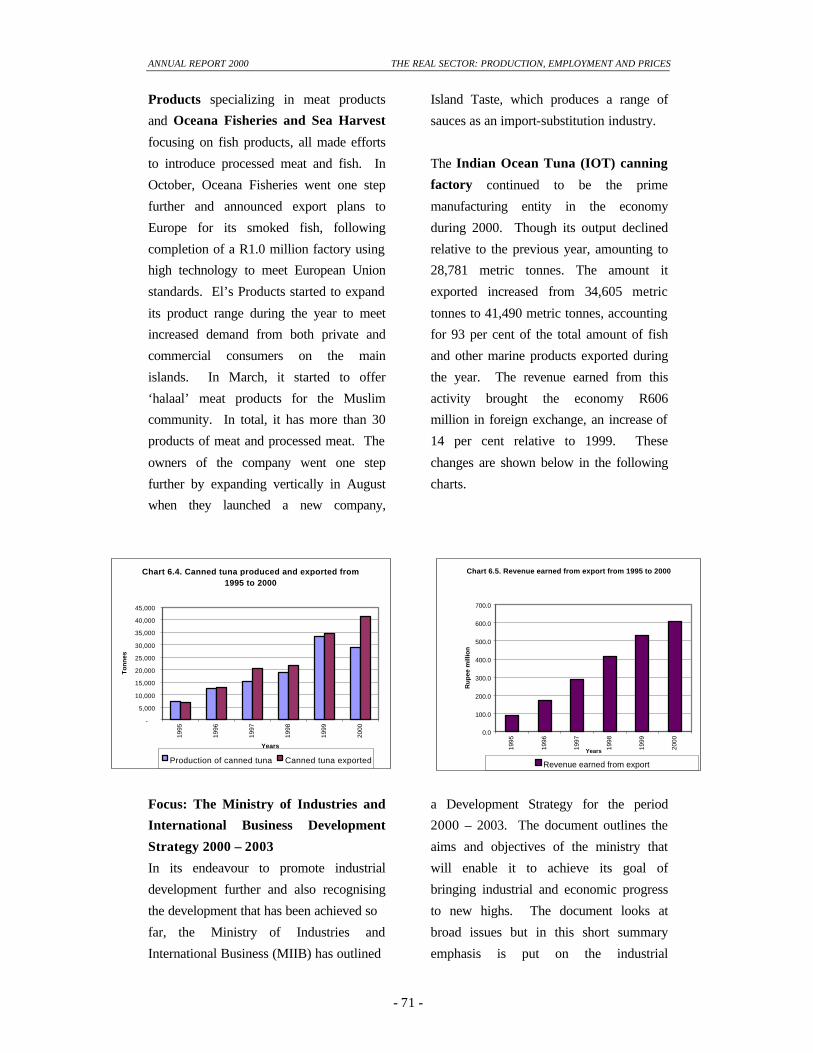
ANNUAL REPORT 2000 THE REAL SECTOR: PRODUCTION, EMPLOYMENT AND PRICES
- 71 -
Products specializing in meat products
and Oceana Fisheries and Sea Harvest
focusing on fish products, all made efforts
to introduce processed meat and fish. In
October, Oceana Fisheries went one step
further and announced export plans to
Europe for its smoked fish, following
completion of a R1.0 million factory using
high technology to meet European Union
standards. El’s Products started to expand
its product range during the year to meet
increased demand from both private and
commercial consumers on the main
islands. In March, it started to offer
‘halaal’ meat products for the Muslim
community. In total, it has more than 30
products of meat and processed meat. The
owners of the company went one step
further by expanding vertically in August
when they launched a new company,
Island Taste, which produces a range of
sauces as an import-substitution industry.
The Indian Ocean Tuna (IOT) canning
factory continued to be the prime
manufacturing entity in the economy
during 2000. Though its output declined
relative to the previous year, amounting to
28,781 metric tonnes. The amount it
exported increased from 34,605 metric
tonnes to 41,490 metric tonnes, accounting
for 93 per cent of the total amount of fish
and other marine products exported during
the year. The revenue earned from this
activity brought the economy R606
million in foreign exchange, an increase of
14 per cent relative to 1999. These
changes are shown below in the following
charts.
Focus: The Ministry of Industries and
International Business Development
Strategy 2000 – 2003
In its endeavour to promote industrial
development further and also recognising
the development that has been achieved so
far, the Ministry of Industries and
International Business (MIIB) has outlined
a Development Strategy for the period
2000 – 2003. The document outlines the
aims and objectives of the ministry that
will enable it to achieve its goal of
bringing industrial and economic progress
to new highs. The document looks at
broad issues but in this short summary
emphasis is put on the industrial
Chart 6.4. Canned tuna produced and exported from 1995 to 2000
-
5,000
10,000
15,000
20,000
25,000
30,000
35,000
40,000
45,000
1995
1996
1997
1998
1999
2000
Years
To
nn
es
Production of canned tuna Canned tuna exported
Chart 6.5. Revenue earned from export from 1995 to 2000
0.0
100.0
200.0
300.0
400.0
500.0
600.0
700.0
1995
1996
1997
1998
1999
2000
Years
Ru
pee
mill
ion
Revenue earned from export
ANNUAL REPORT 2000 THE REAL SECTOR: PRODUCTION, EMPLOYMENT AND PRICES
- 72 -
development programme and the industrial
management programme.
§ The industrial development
programme
This consists of the following:
Identify, plan and facilitate the co-
ordination and development of appropriate
infrastructure facilities in line with
prospective and future industrial
development;
Evaluate and develop the right policy and
facilitative framework for the various
emerging and developing business sectors,
especially small and micro businesses;
Put in place an equitable financial system
to allow small and medium sized
enterprises (SMEs) access to more
available and cheaper sources of finance;
Identify constraints and solutions to SME
development by consulting representatives
of the private sector and by conducting
periodical surveys;
Guide and work closely with the
Seychelles Bureau of Standards in
developing a policy framework for the co-
ordination of research and development in
the country and facilitating the appropriate
transfer of technology into industrial
processes; and
Facilitate and co-ordinate research
activities carried out by overseas
institutions within Seychelles.
§ The industrial management
programme
This consists of the following:
Guide and support local businesses and
provide facilitatory information on
administrative regulations, procedures and
on concession and incentives available;
Develop and implement an information
system to include intranet services,
industrial statistics and to automate
applications processing;
Provide national databases on business,
standards, science and technology for use
by various organisations and enterprises in
the industrial, commercial and scientific
sectors;
Develop and implement an evaluation
system, which encompasses benchmarking
analysis, determining industrial standards,
value added, and productivity levels; and
Ensure the proper management and
disposition of natural resources to allow
for their sustainable exploitation by
industry.
7. Employment
According to the records of the Social
Security Fund, growth in the labour
market remained strong during the year
under review despite the economic
slowdown. The level of job creation was
even more than last year, particularly in
the private sector. One important factor
that contributed to the rise was the

ANNUAL REPORT 2000 THE REAL SECTOR: PRODUCTION, EMPLOYMENT AND PRICES
- 73 -
continued expansion of some companies in
the manufacturing sector, particularly
those engaged in export-oriented and
import-substitution activities and also that
of the services sector. The significant
increase in the services sector was
attributable to the revival of the tourism
industry and related activities and also to
the continued growth of
telecommunication provision.
As shown below in Table 6.9, total
employment rose by 1,916 or 5.1 per cent,
of which an increase of 1,845 or 10 per
cent was in respect of the private sector.
This expansion in the level of employment
took the number of people employed in the
country to 39,381. Apart from the
parastatal sector, which also recorded a
rise in its employment pool by another 450
or 8.8 per cent, the government sector
registered a decline. It fell by 379 or 2.6
per cent. The last fall in government
employment was in 1997, when it fell by
8.7 per cent.
Table 6.9 Employment
Dec Dec Dec Dec Dec 1996 1997 1998 1999 2000 Total 30,935 33,328 36,207 37,465 39,381 Private Sector 13,534 16,486 17,675 17,908 19,753 Parastatals 4,836 5,368 4,921 5,100 5,550 Government 12,565 11,474 13,611 14,457 14,078
Source: Social Security Fund
With these diverge movements in sectoral
employment, the share of each sector,
namely private, parastatal and
government, also changed relative to last
year. With the significant increase in
private employment, this sector registered
a rise in its share from 48 per cent in the
previous year to 50 per cent.
Consequently, that of the parastatals and
government put together fell from 52 per
cent to 50 per cent for the same period.
This was mainly on account of the fall in
government employment as the share of
the parastatal sector remained unchanged.
8. Prices
Containing the surge in inflation was one
of government’s major priorities for 2000,
after having seen the average price level
surge from 2.6 per cent in 1998 to 6.3 per
cent in 1999. The inflation rate for 2000,
as published by the Management and

ANNUAL REPORT 2000 THE REAL SECTOR: PRODUCTION, EMPLOYMENT AND PRICES
- 74 -
Information Systems Division (MISD),
remained unchanged at 6.3 per cent (Chart
6.6 & Table 6.10). This indicates that
whilst the government could not succeed
in slowing down inflation, it at least
managed to prevent a further escalation
thus laying a platform in the coming year
to achieving a reduction in the general
price level.
The relative stability in prices in 2000 was
attributable to all subgroups of the retail
price index (RPI). In Seychelles, there are
three broad categories, namely fish, ‘other
food items’ and ‘non-food products’.
Chart 6.6. Inflation rate for 1995 to 2000
-2.0-1.00.01.02.03.04.05.06.07.0
1995
1996
1997
1998
1999
2000
Years
Per
cen
t
Looking in more detail at these
components, it was observed that the
movements in the price of fish and the
‘non-food’ categories contributed most in
stabilising prices over the twelve months.
There was a fall of 6.5 per cent in the price
of fish along with a moderation in the
growth of prices in the ‘non-food’
subgroup, which rose by 7.7 per cent
compared to 8.6 per cent in the previous
year. The continued fall in fish prices was
in response to the increase in the supply of
fish particularly those of the artisanal
fishery, which makes up the bulk of the
consumption of fish in the economy. In
terms of the slowdown in the price of
‘non-food’ products, the main factor was
the import content on that category.
Compared to a year earlier, the import
index of that group moderated
significantly from 13 per cent to 5.5 per
cent in the year under review. The
moderate growths in the price of
“alcoholic beverages & tobacco”, “fuel,
power & water” and “personal items”
were the main influences in movements in

ANNUAL REPORT 2000 THE REAL SECTOR: PRODUCTION, EMPLOYMENT AND PRICES
- 75 -
the ‘non-food’ category. The first two sets
of items suggested that the effects of the
tax increases that were effected in
September 1998 have already filtered
through the system. Furthermore,
increases in oil prices did not appear to
affect the domestic price of fuel, as the
government kept prices stable even though
those on international markets were
continuously rising.
Table 6.10 Composition of Retail Price Index1
1995 1996 1997 1998 1999 2000 Weights
(percentage change) All Items 1,000 -0.3 -1.1 0.6 2.7 6.3 6.3 Local 656 -0.8 -1.3 0.4 3.2 4.4 7.2 Imported 344 0.6 -0.5 1.2 1.3 10.3 4.4 Fish 32 6.8 -7.3 12.0 10.8 -15.3 -6.5 Other Food Items 234 -1.5 -2.2 0.7 1.0 1.9 2.9 Local 119 -1.3 1.9 1.0 1.5 0.9 4.5 Imported 115 -1.8 -2.6 0.3 0.3 3.3 0.7 Non-Food Items 734 -0.3 -0.4 0.0 2.7 8.6 7.7 Local 505 -1.0 -0.9 -0.5 3.0 6.7 8.6 Imported 229 1.6 0.3 1.4 1.8 12.9 5.5 1 Period averages. Source: Management & Information Systems Division
Nevertheless, despite the slowdown in the
import content of the ‘non-food’ category,
this was partly outweighed by the rise in
the price of locally produced items in that
subgroup. Compared to 6.7 per cent in the
previous year, it increased by 8.6 per cent
in the current year. This was mainly on
account of “housing costs”, which rose by
21 per cent on average compared to 2.4
per cent a year earlier.
For the third sub-group, the ‘other food’,
there was an acceleration in the rate of
growth of its prices, increasing by 1.0
percentage point relative to 1999 to stand
at 2.9 per cent. Again, like the ‘non-food’
category the local component was the
main influential factor explaining the
movement in the price. The local index
rose by 4.5 per cent on average compared
to only 0.9 per cent in the previous year.
The main contributory factors were the
increases in the rate of growth in the price
of “fruits & vegetables” and that of “other
food & non-alcoholic beverages”. As for
the latter, growth mainly attributable to
non-alcoholic beverages as there was a
rise in the price of soft drinks by the main
manufacturer. On the other hand, the

ANNUAL REPORT 2000 THE REAL SECTOR: PRODUCTION, EMPLOYMENT AND PRICES
- 76 -
import content of the ‘other food’
subgroup moderated considerably, from
3.3 per cent to 0.7 per cent. This was on
account of declines in the prices of
imported “meat and tinned fish” and that
of “dairy products, oils & fats”.

SECTION SEVEN
Offshore and Investment Developments
1. Overview
During the year 2000, activity in the
offshore sector picked up further when
compared to 1999. Firstly, there was an
increase of 11 International Business
Companies (IBCs) above the total
registered in the previous year. Secondly,
a record of 416 IBCs was registered in the
first quarter in the international business
company registration, that brought the
total number of new IBCs for the year to a
total of 1,351. Furthermore, three new
companies were awarded licences to
operate within the Industrial Trade Zone
(ITZ), whilst one new trust was registered.
Among the new ITZ companies, there was
a can manufacturing company, Impress
Packaging Limited that set up operations
to supply cans exclusively to the Indian
Ocean Tuna (IOT) canning factory.
In a separate development, Planus Dental
Technology received ISO certification for
quality management and for
manufacturing and servicing medical
devices.
Mayfair Trust Company Limited, a
licensed registered agent and trustee that
specialises in providing offshore services
opened its offices in Seychelles. The
opening of this foreign owned company
highlighted Seychelles potential as a
growing offshore centre.
In September, SIBA hosted its first
offshore conference at the Casino Des Iles
on Praslin. The influence of e-commerce
on the International Financial Services
Industry was the focus of the conference.
In a move that would further cement the
already strong technological base, on
which offshore businesses rely critically,
the telecommunication sector saw the
introduction of a second Internet Service
Provider (ISP) under the name of Kokonet
that was launched during the year. This
would offer access to some key Internet
- 77 -

ANNUAL REPORT 2000 OFFSHORE AND INVESTMENT DEVELOPMENTS
- 78 -
services such as wireless services.
Kokonet would be making use of the latest
state-of-the-art technology, and would
provide a reliable and performing
connection to Internet customers.
Other developments included Seychelles'
eligibility to receive benefits under the
provisions of the Africa Growth and
Opportunity Act (AGOA). This
development would help facilitate Africa's
involvement into the global economy.
With regards to developments on-shore,
the Investment Desk issued an additional
14 ‘certificates of approval’ under the
Investment Promotion Act (IPA) 1994. At
the end of 2000, a total of 98 companies
had attained the IPA status, with the bulk
of those companies being tourism-related
investments.
During the year, the Seychelles Industrial
Development Corporation (SIDEC)
reported that it had approved 88 cases for
assistance at a value of R1.8 million,
whilst disbursing R1.9 million. The
European Credit Line Project, which is
also under SIDEC's auspices, disbursed a
further half a million rupees worth of loans
in 2000.
2. Offshore developments
An important component of the country's
offshore sector is the registration of
International Business Companies (IBCs)
by the Seychelles International Business
Authority (SIBA). The IBCs are
incorporated in Seychelles through 18
registered agents. These agents are
responsible for marketing the country's
offshore services abroad. An IBC could
be registered in less than 2 hours, which is
the minimum reported time for
registration.
During 2000, 1,351 new International
Business Companies (IBCs) were
registered with the Seychelles offshore
authority. This represented an increase of
11 relative to the aggregate figure for
1999, when a total of 1,340 IBCs were
registered. Since 1995, there has been an
increasing trend in the number of
registered IBCs (see chart 7.1), bringing
the aggregate number of IBCs registered
with SIBA to a total of 6,159 at the end of
the year under review.
During the first quarter, SIBA set a new
record in international business company
registration, with 416 IBCs being licensed.
This performance is an indicator of SIBA's
established position as an offshore centre.
Things were slower as far as activity in the
international trade zone (ITZ) was
concerned with only 3 new companies
licensed to operate within the Zone. In
fact a total of four licenses were issued,
with one company being allocated two of
those. As already noted there was one
trust that was registered, bringing the total
number to 21 by the end of the year.

ANNUAL REPORT 2000 OFFSHORE AND INVESTMENT DEVELOPMENTS
- 79 -
Chart 7.1. Number of IBCs registered per year and their cumulative totals
335
909
1134
1090
1340
1351
335
1244
2378
3468
4808
6159
1995
1996
1997
1998
1999
2000
Total yearly registration Cumulative total
During the first quarter, there was a new
SITZ Company that entered into an
agreement to supply cans exclusively to
the Indian Ocean Tuna (IOT) canning
factory. Impress Packaging Limited,
based in Amsterdam, entered into a
partnership with Heinz seafood for a metal
packaging supply agreement.
Planus Dental Technology, a German-
based company already operating in the
SITZ, received ISO certification with the
help and advice of the Wiatrek-Qualitats-
Systeme Company. The ISO certification
was for quality management and for
manufacturing and servicing medical
devices. The company has plans to further
expand through a new-patented dental
implant and a patented electrical technique
using light-emitting diodes (LEDS). It
intends to triple its current workforce of 40
to cater for expected demand for the new
products. The ISO include certification
for the new implant abutment and LED
electro technique patented by Planus,
aimed at the US and Canadian markets.
The LED electro technique process is
designed to fabricate electrical circuits
within billboard advertising letters and
logos, providing back lighting for the
advertisements. German insurance
company Allianz donated 7,000 sets of the
company name and logo, plus some for its
insurance brokers. The implant abutment
was to be introduced in January 2001 by
the 3I company in Miami.
In August a licensed registered agent and
trustee, Mayfair Trust Company Limited
opened its offices in Seychelles. The
company specialises in the provision of
offshore services and has a representative
office in London. It also has a strategic
alliance with Fortress Management in the

ANNUAL REPORT 2000 OFFSHORE AND INVESTMENT DEVELOPMENTS
- 80 -
Isle of Man. The company, which is
foreign-owned, is committed in having its
headquarters in Seychelles. With a sound
legal framework and infrastructure,
Mayfair highlighted Seychelles' potential
as a growing offshore centre with further
development in the IBC market. The
company also identified further scope for
expanding into more value-added offshore
areas of international trusts, mutual funds
and insurance.
2000 saw SIBA successfully host its first
offshore conference entitled 'Future of
Offshore Centres in the Cyber Age' at the
Casino Des Iles on Praslin in September.
The conference focused on the growing
influence of e-commerce on the
International Financial Services Industry.
SIBA invited a selection of expert
speakers from various jurisdictions within
the offshore industry, including two from
Seychelles to add depth and diversity to
the central theme. Initiatives from the
Organisation for Economic Co-Operation
and Development (OECD), the Financial
Action Task Force on Money Laundering
(FATF), the Financial Stability Forum
(FSF) and International Monetary Fund
(IMF) were comprehensively debated,
covering the combined effects of modern
technology and the new regulatory
environment.
A new modern Telecommunications Act
(2000) was enacted during the year, with
the anticipation of a progressive Electronic
Transactions Act later during the year.
This was followed by the launching of a
second Internet Service Provider (ISP)
under the name of Kokonet. The ISPs
offer shared or dedicated bandwidth to the
Internet backbone and have access to a
variety of key services on the web.
Kokonet would be making use of the latest
state-of-the-art technology, combining the
best of Dell and Cisco. This would
provide a reliable and performing
connection to Internet customers. The
introduction of Kokonet sparked a
competitive price readjustment for the ISP,
namely Kokonet and the existing ISP,
ATLAS. Nonetheless, ATLAS intends to
retain its market share by providing
increased value added services including
international roaming to its customers.
Meanwhile, the SITZ was encouraging a
number of high tech and
telecommunications oriented companies to
take advantage of the presence of well-
qualified personnel, plus an excellent
regulatory framework for e-commerce.
These include SeySAT and Station
Africa's Network Management operation,
which would be upgraded during the first
months of 2001.
With regard to other developments, it was
officially announced in October that
Seychelles is eligible for benefits under
the provisions of the Africa Growth and
Opportunity Act (AGOA). This Act is
collaboration between the United States
and Africa in the President's Partnership
for Economic Growth and Opportunity in
Africa. This development would facilitate
ANNUAL REPORT 2000 OFFSHORE AND INVESTMENT DEVELOPMENTS
- 81 -
Africa's integration into the global
economy. The AGOA, also referred to as
their 'Africa Act', was signed into law in
May and took effect in October. The law
offers eligible African nations duty and
quota-free entry of their goods into the US
market, especially textiles and apparel.
Eligibility involves African governments'
commitment to open-market reforms and
willingness to free their private sectors.
3. Investment
3.1 The Investment Desk
During the period under review, activity in
the on-shore sector in Seychelles picked
up relative to the previous year. The
investment desk accorded 14 new
businesses the Investment Promotion Act
(IPA) status compared to 8 in 1999. Of
these companies, 5 were ‘tourism
development’ investment, 5 were
‘agriculture and marine resources’
investments, 2 were ‘industrial and
manufacturing sector’ and 2 were
‘professional services’ investment. Out of
the ‘tourism development projects’ one
belonged to the ‘boat charter’ category.
The other four were classed as ‘special
growth status’ investment, that is,
investment relating to tourism
development activities in Outer Islands,
yacht marinas and golf resorts.
This brings the number of Certificates of
Approval issued since the IPA came into
effect in 1995 to 98. The bulk of these
certificates have been issued to tourism
related investments with a total of 55,
which reflects the government’s persistent
attempt to provide incentives to develop
and promote the country’s main service
industry. The other 43 companies issued
with certificates were as follows: 17 were
‘professional services’; 12 were ‘industrial
and manufacturing sector’ investments;
and 14 were in the ‘agriculture and marine
sectors.
3.2 SIDEC
3.2.1 Young Enterprise Scheme
The Small Business Bureau (SBB), which
manages the Young Enterprise Scheme
(YES), under the patronage of the
Seychelles Industrial Development
Corporation (SIDEC), received a total of
1,031 applications for financial assistance
in 2000. The Loans Committee reviewed
428 viable cases, of which only 88 were
approved for assistance for a total value of
R1.8 million. However, a total of R1.9
million was disbursed during the year,
which comprised partly of loans approved
during the year and outstanding loans
approved prior to 2000.
Since it was launched in 1996, loans to the
value of R42.4 million for 1,232 small
enterprises have been approved. Out of
this total amount, R39.9 million has
already been disbursed. In terms of
financial assistance, the "fishing" sector
has been the major beneficiary with a
share of 20 per cent of the aggregate
borrowing. This reflected the
government's efforts to enhance the
artisanal and semi-industrial fishing

ANNUAL REPORT 2000 OFFSHORE AND INVESTMENT DEVELOPMENTS
- 82 -
sectors. The other major beneficiaries of
the YES scheme were the "retailing",
"social services", "maintenance" and the
"agricultural" sectors with shares of 14 per
cent, 11 per cent, 10 per cent and 9.0 per
cent respectively.
3.2.2 European Union Credit Line
Project
Under the European Union Credit Line
Project a total of R573,500 in loans were
sanctioned, whilst disbursement stood at
R506,650. Since the project was
inaugurated in 1995, a total of R3.5
million has already been disbursed out of
the R7.0 million grant available under the
credit line at a concessionary rate of 3.0
per cent per annum.
Tailoring, handicraft, and carpentry
businesses have received the bulk
of the assistance under the project's
financing scheme with a combined share
of 54 per cent of all total loans under the
project. The districts of English River and
Anse Boileau has benefited the most under
the project each with an 8.0 per cent share
of total loans.
SECTION EIGHT
Operations and Administration
of Central Bank1
1. Overview
The Central Bank continued to assist the
government in assessing and running the
economy through advice and
implementation of economic measures and
at the same time ensure full compliance to
the Financial Institutions Act. With the
continuous decline in the foreign exchange
reserves, new measures were being
considered along with the existing ones,
with the aim of boosting the inflows of
foreign exchange reserves.
As part of the new monetary and fiscal
policy measures implemented by the
government, there was the introduction of
two new bonds. Due to the decline in
interest rates on savings and other time
deposits, there were remarkable sales of
these new issues.
During the year 2000, Barclays Bank PLC
was locally incorporated and was granted
a domestic licence.
In aid of the small business and export-
oriented companies the government
provided new schemes, which constitute
better credit facilities.
2. Banking Services
2.1 Currency and Banking
Operations
The Currency and Banking Operation
Services Division is responsible for the
issue of currency, the management of
accounts held with the Bank on behalf of
the government, commercial banks, other
local financial institutions, foreign
government agencies and international
agencies. It is accountable for the daily
financial transactions of the Bank and
administers temporary advances made to
the government whilst closely monitoring
the external reserves. It is also responsible
for the sale of numismatic coins.
2.1.1 Government Accounts
Over the past years, the government relied
to some extent on the Central Bank for
______________________________ 1 All the data presented in this section is actual.
- 83 -
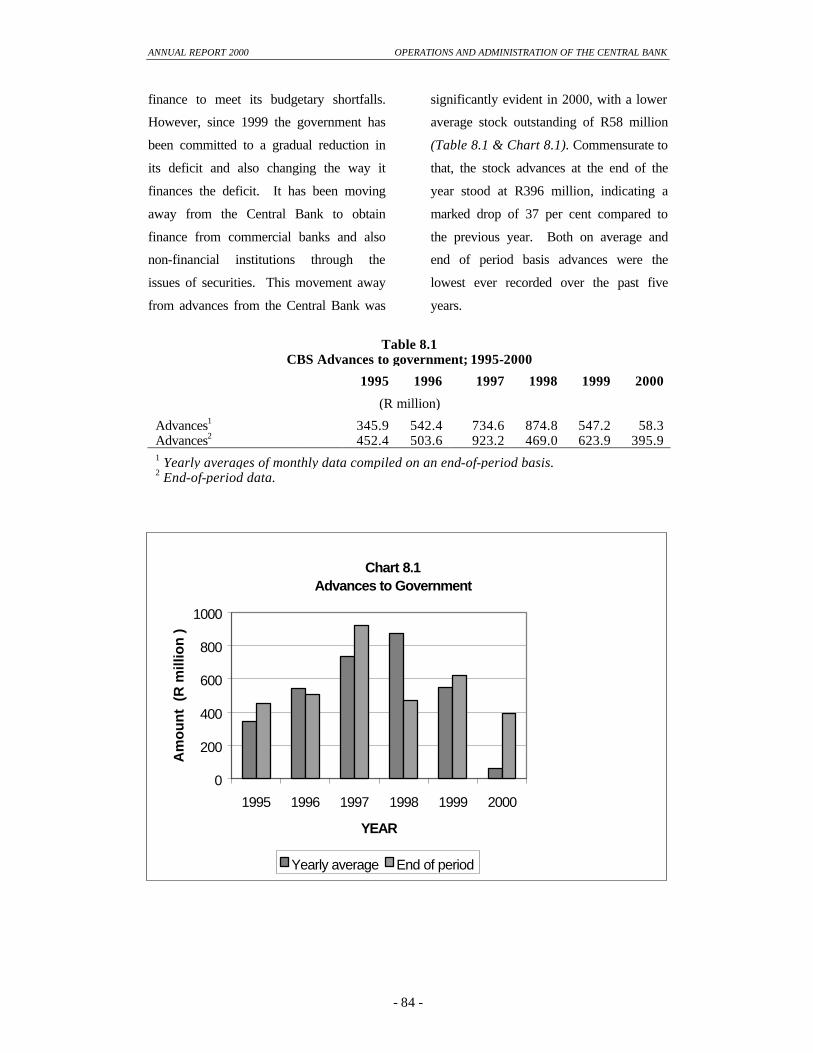
ANNUAL REPORT 2000 OPERATIONS AND ADMINISTRATION OF THE CENTRAL BANK
- 84 -
finance to meet its budgetary shortfalls.
However, since 1999 the government has
been committed to a gradual reduction in
its deficit and also changing the way it
finances the deficit. It has been moving
away from the Central Bank to obtain
finance from commercial banks and also
non-financial institutions through the
issues of securities. This movement away
from advances from the Central Bank was
significantly evident in 2000, with a lower
average stock outstanding of R58 million
(Table 8.1 & Chart 8.1). Commensurate to
that, the stock advances at the end of the
year stood at R396 million, indicating a
marked drop of 37 per cent compared to
the previous year. Both on average and
end of period basis advances were the
lowest ever recorded over the past five
years.
Table 8.1
CBS Advances to government; 1995-2000 1995 1996 1997 1998 1999 2000 (R million) Advances1 345.9 542.4 734.6 874.8 547.2 58.3 Advances2 452.4 503.6 923.2 469.0 623.9 395.9 1 Yearly averages of monthly data compiled on an end-of-period basis. 2 End-of-period data.
Chart 8.1 Advances to Government
0
200
400
600
800
1000
1995 1996 1997 1998 1999 2000
YEAR
Am
ou
nt
(R
mill
ion
)
Yearly average End of period

ANNUAL REPORT 2000 OPERATIONS AND ADMINISTRATION OF THE CENTRAL BANK
- 85 -
2.1.2 Currency Issues
The total currency in circulation continued
to increase during the year to reach an
amount of R282 million which was 6.8 per
cent higher than the preceding year (Table
8.2 & Chart 8.2). However, the rate of
increase was much slower indicating a
partial success of the measures to control
liquidity.
Of the two components of currency, notes
increased by 7.0 per cent, which was 14
per cent less than the previous year’s
increase, whereas the rate of growth in the
amount of coins in circulation rose by 3.9
per cent. In addition, the share of notes
increased, whereas that of the coins fell by
0.2 percentage points.
Table 8.2 Circulation of Notes and Coins;1 1995-2000
1995 1996 1997 1998 1999 2000 (R million)
Total 154.20 174.20 202.97 219.24 264.27 282.23 Notes 141.60 160.50 189.07 204.29 247.94 265.27 Coins 12.60 13.70 13.90 14.95 16.33 16.96
(per cent) Share Notes 91.8 92.1 93.2 93.2 93.8 94.0 Coins 8.2 7.9 6.8 6.8 6.2 6.0 1 End-of-period data
Chart 8.2. Currency in Circulation
0
50
100
150
200
250
300
1995 1996 1997 1998 1999 2000
Year
(R m
illio
ns)
ANNUAL REPORT 2000 OPERATIONS AND ADMINISTRATION OF THE CENTRAL BANK
- 86 -
2.1.3 Numismatic Issues
During the year 2000, revenue generated
from the sale of numismatic coins, locally
and abroad, totalled R87,117. The Central
Bank issued only one series of coins to
commemorate the 100th birthday of Queen
Elizabeth, the Queen mother. The coins
were issued in silver and cupro-nickel both
having a face value of R25.
2.1.4 Accounts of Commercial Banks During the year under review the
mandatory cash reserve ratio that
commercial banks have to maintain with
the Central Bank remained unaltered at 2.5
per cent of all eligible deposits. At this
rate, all six commercial banks currently
operating in Seychelles were able to meet
this requirement.
The activities of the bankers' clearing
house remained under the ambit of the
Central Bank. Consistent to recent trends,
the total amount cleared continued to rise
reaching an all time high of R1.9 million
in 2000, which was 13 per cent higher than
the value reported in the previous year
(Table 8.3). Notwithstanding the rise in
the amount cleared, the number of items
cleared dropped by 3.7 per cent totalling
620,492 compared to the 644,593 items
reported in 1999.
Table 8.3 Bankers’ Clearing House Activities; 1995-2000
1995 1996 1997 1998 1999 2000
(Total) Number of items cleared 517,862 577,923 591,415 623,749 644,593 620,492 Amount (R’000) 906,373 1,161,269 1,327,170 1,543,457 1,641,388 1,861,626
(Daily average) Number of items cleared 2,097 2,309 2,394 2,536 2,568 2533 Amount (R’000) 3,670 4,621 5,373 6,274 6,539 7598
2.1.5 Other Accounts
In addition to the accounts of government
and those of banks, the Central Bank
continued to administer two other groups
of accounts on behalf of the government.
The first set of accounts was those of local
and international financial institutions,
foreign government agencies and accounts
in respect of the pipeline scheme. The
second group consisted of several interest
bearing “special funds” of the government
(labelled special deposits). At the end of
the year, these accounts showed a balance
of R774,971, an increase of 3.9 per cent
relative to the previous year.
2.1.6 Annual Balances
For the financial year ending December
29, 2000, the net operating profit of the

ANNUAL REPORT 2000 OPERATIONS AND ADMINISTRATION OF THE CENTRAL BANK
- 87 -
Central Bank reached an aggregate of R20
million as against the preceding year. This
showed a R5.0 million increase in profit,
which was attributed largely to the rise in
income through an increase in commission
and fees, interests and other income. In
accordance with the Section 16(1), Section
16(3) and Section 16(4) of the Central
Bank of Seychelles Act, as amended in
1986 and 1999, the net profit was
appropriated to the General Reserve
Accounts in amounts determined by the
Board. By the end of the financial year
the Revaluation and Reserve Account,
showed a credit balance of R8.4 million,
reflecting a gain on the revaluation of
Central Bank external reserves.
2.1.7 External Reserves
Total external reserves held by the Central
Bank at the end of 2000 stood at R271
million, which represented a substantial
increment of R111 million relative to the
previous year.
The Special Drawings Right (SDR)
allocated to the Seychelles by the
International Monetary Fund increased by
R0.3 million to reach an amount of R3
million. The increase in SDR is not
accountable by nominal term but rather in
real terms due to the depreciation of our
local currency. At the end of the year
holdings of SDRs stood at SDR 9,367,
which is equivalent to R75,708, after
accounting for the General Reserve
Account of the IMF. The balance of the
reserve tranche with the Fund was at nil at
the end of December.
2.2 Public Debt
The main function of the Public Debt
Division remains the manager of the
Domestic public debt instruments on
behalf of the government. This is in
accordance with the Local Loans Act,
1960, as amended in 1985 (stocks and
treasury bonds); and the Land Acquisition
Compensation Act, 1997 (land acquisition
bonds).
Major developments during the year 2000
included the introduction of new issues of
treasury bonds. This comprised of a 7.5
per cent, 3-year bond introduced in
February with a limit of R300 and a 6.75
per cent, 2-year bond in September with a
limit of R200 million. In addition, the
6.75 per cent 2-year bond issued in 1998
and the 11 per cent 3-year bond issued in
1997 started to redeem.

ANNUAL REPORT 2000 OPERATIONS AND ADMINISTRATION OF THE CENTRAL BANK
- 88 -
2.2.1 Treasury Bills
Following the introduction of the tap
system in September 1998 there were no
new issue of 91-day, 182-day and 365-day
bills in 2000. These securities remained
with their actual limits of R700 million,
R650 million and R650 million
respectively.
The annual yield on the 91-day bills, 182-
day and 365-day bills remained unaltered
at 4.5 per cent, 5.0 per cent and 5.5 per
cent respectively, since there was no
change in their rates (Table 8.4).
Table 8.4 Treasury Bill Yields;* 1995-2000
Issues 1995 1996 1997 1998 1999 2000 (per cent)
Tender 91-day 12.15 11.51 - - - - 182-day 12.39 11.67 - - - - 365-day 12.28 11.71 - - - - Tap 91-day - 10.50 10.50 7.96 4.50 4.50 182-day - - - - 5.00 5.00 365-day - - - - 5.00 5.50
* Yearly averages of monthly data, compiled on an end-of-period basis.
Chart 8.3. Stock of Public Debt Instruments
0
500
1000
1500
2000
1995 1996 1997 1998 1999 2000Years
Ave
rag
e S
tock
(R
m
illio
n)
Treasury bills Treasury bonds Government stocks
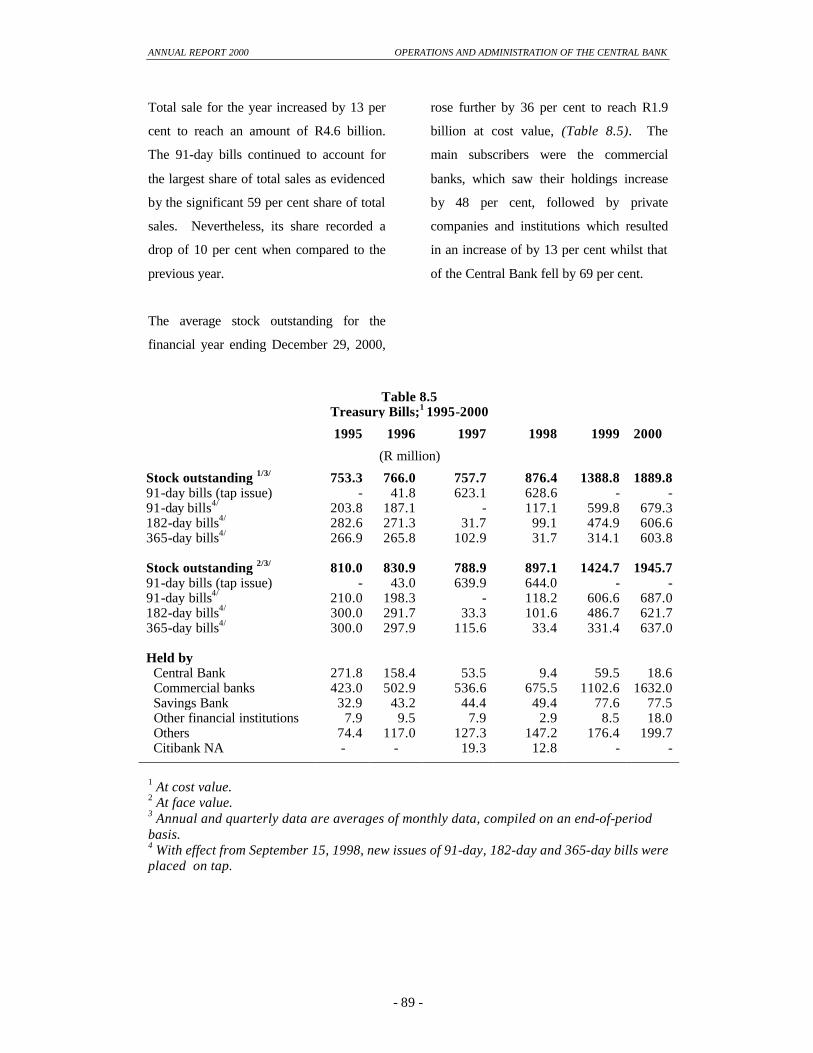
ANNUAL REPORT 2000 OPERATIONS AND ADMINISTRATION OF THE CENTRAL BANK
- 89 -
Total sale for the year increased by 13 per
cent to reach an amount of R4.6 billion.
The 91-day bills continued to account for
the largest share of total sales as evidenced
by the significant 59 per cent share of total
sales. Nevertheless, its share recorded a
drop of 10 per cent when compared to the
previous year.
The average stock outstanding for the
financial year ending December 29, 2000,
rose further by 36 per cent to reach R1.9
billion at cost value, (Table 8.5). The
main subscribers were the commercial
banks, which saw their holdings increase
by 48 per cent, followed by private
companies and institutions which resulted
in an increase of by 13 per cent whilst that
of the Central Bank fell by 69 per cent.
Table 8.5 Treasury Bills;1 1995-2000
1995 1996 1997 1998 1999 2000 (R million) Stock outstanding 1/3/ 753.3 766.0 757.7 876.4 1388.8 1889.8 91-day bills (tap issue) - 41.8 623.1 628.6 - - 91-day bills4/ 203.8 187.1 - 117.1 599.8 679.3 182-day bills4/ 282.6 271.3 31.7 99.1 474.9 606.6 365-day bills4/ 266.9 265.8 102.9 31.7 314.1 603.8 Stock outstanding 2/3/ 810.0 830.9 788.9 897.1 1424.7 1945.7 91-day bills (tap issue) - 43.0 639.9 644.0 - - 91-day bills4/ 210.0 198.3 - 118.2 606.6 687.0 182-day bills4/ 300.0 291.7 33.3 101.6 486.7 621.7 365-day bills4/ 300.0 297.9 115.6 33.4 331.4 637.0 Held by Central Bank 271.8 158.4 53.5 9.4 59.5 18.6 Commercial banks 423.0 502.9 536.6 675.5 1102.6 1632.0 Savings Bank 32.9 43.2 44.4 49.4 77.6 77.5 Other financial institutions 7.9 9.5 7.9 2.9 8.5 18.0 Others 74.4 117.0 127.3 147.2 176.4 199.7 Citibank NA - - 19.3 12.8 - -
1 At cost value. 2 At face value. 3 Annual and quarterly data are averages of monthly data, compiled on an end-of-period basis. 4 With effect from September 15, 1998, new issues of 91-day, 182-day and 365-day bills were placed on tap.
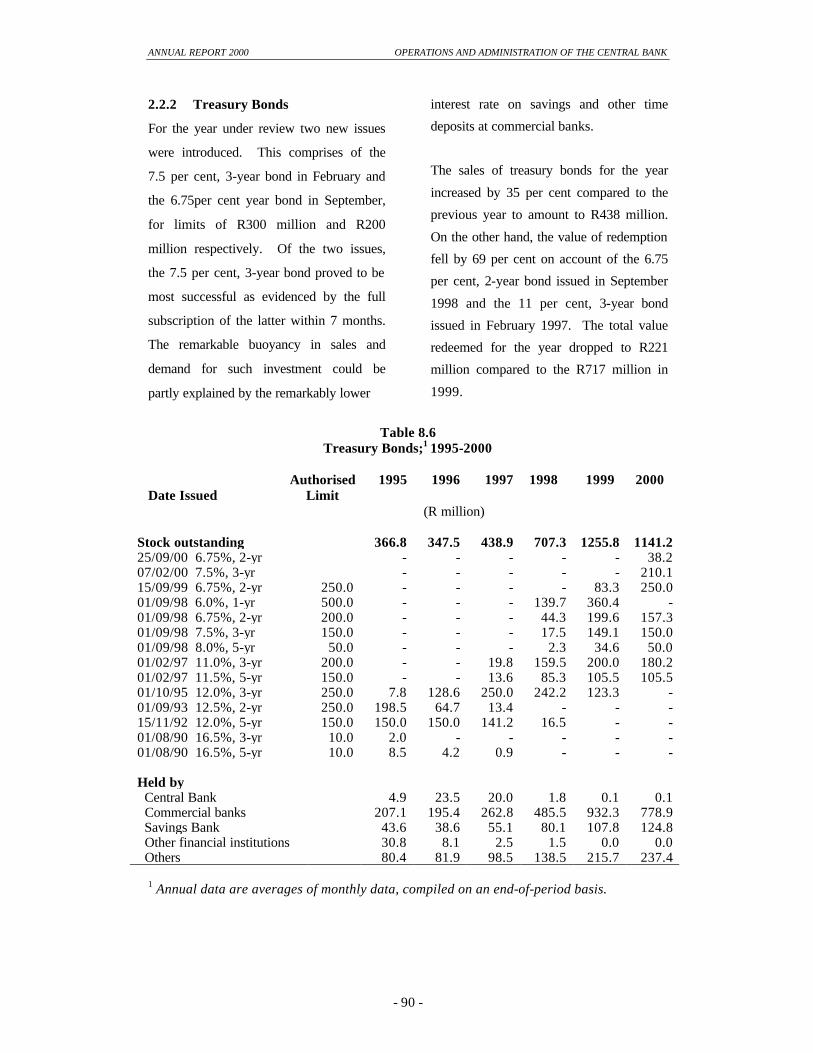
ANNUAL REPORT 2000 OPERATIONS AND ADMINISTRATION OF THE CENTRAL BANK
- 90 -
2.2.2 Treasury Bonds
For the year under review two new issues
were introduced. This comprises of the
7.5 per cent, 3-year bond in February and
the 6.75per cent year bond in September,
for limits of R300 million and R200
million respectively. Of the two issues,
the 7.5 per cent, 3-year bond proved to be
most successful as evidenced by the full
subscription of the latter within 7 months.
The remarkable buoyancy in sales and
demand for such investment could be
partly explained by the remarkably lower
interest rate on savings and other time
deposits at commercial banks.
The sales of treasury bonds for the year
increased by 35 per cent compared to the
previous year to amount to R438 million.
On the other hand, the value of redemption
fell by 69 per cent on account of the 6.75
per cent, 2-year bond issued in September
1998 and the 11 per cent, 3-year bond
issued in February 1997. The total value
redeemed for the year dropped to R221
million compared to the R717 million in
1999.
Table 8.6
Treasury Bonds;1 1995-2000 Authorised 1995 1996 1997 1998 1999 2000 Date Issued Limit (R million)
Stock outstanding 366.8 347.5 438.9 707.3 1255.8 1141.2 25/09/00 6.75%, 2-yr - - - - - 38.2 07/02/00 7.5%, 3-yr - - - - - 210.1 15/09/99 6.75%, 2-yr 250.0 - - - - 83.3 250.0 01/09/98 6.0%, 1-yr 500.0 - - - 139.7 360.4 - 01/09/98 6.75%, 2-yr 200.0 - - - 44.3 199.6 157.3 01/09/98 7.5%, 3-yr 150.0 - - - 17.5 149.1 150.0 01/09/98 8.0%, 5-yr 50.0 - - - 2.3 34.6 50.0 01/02/97 11.0%, 3-yr 200.0 - - 19.8 159.5 200.0 180.2 01/02/97 11.5%, 5-yr 150.0 - - 13.6 85.3 105.5 105.5 01/10/95 12.0%, 3-yr 250.0 7.8 128.6 250.0 242.2 123.3 - 01/09/93 12.5%, 2-yr 250.0 198.5 64.7 13.4 - - - 15/11/92 12.0%, 5-yr 150.0 150.0 150.0 141.2 16.5 - - 01/08/90 16.5%, 3-yr 10.0 2.0 - - - - - 01/08/90 16.5%, 5-yr 10.0 8.5 4.2 0.9 - - - Held by Central Bank 4.9 23.5 20.0 1.8 0.1 0.1 Commercial banks 207.1 195.4 262.8 485.5 932.3 778.9 Savings Bank 43.6 38.6 55.1 80.1 107.8 124.8 Other financial institutions 30.8 8.1 2.5 1.5 0.0 0.0 Others 80.4 81.9 98.5 138.5 215.7 237.4
1 Annual data are averages of monthly data, compiled on an end-of-period basis.

ANNUAL REPORT 2000 OPERATIONS AND ADMINISTRATION OF THE CENTRAL BANK
- 91 -
Despite the higher sales, the stock
outstanding for the year declined by 9 per
cent relative to the previous year to
average R1.1 billion (Table 8.6). This was
due to the effect of the higher redemption
in the second half of the year, which
outweighed sales.
2.2.4 Seychelles Stocks
No new issue of Seychelles Government
Stocks was offered during 2000. The 8.0
per cent 2004 and the 8.0 per cent
2005/2007 stocks were fully subscribed.
Thus the only government stock open for
subscriptions for the current year was the
8.0 per cent 2009 stocks, for a limit of R50
million.
A total amount of R4.5 million worth of
stocks was sold, representing a 38 per cent
fall relative to the previous year, (Table
8.7). Similarly, the total value of
redemption for the year 2000 was 48 per
cent lower than the R20 million redeemed
in the preceding year. Despite, total
redemption outweighing sales, the average
stock outstanding for the year increased by
8.7 per cent.
Table 8.7
Government Stocks;1/2/ 1995-2000 Authorised 1995 1996 1997 1998 1999 2000 Limit (R million)
Stock outstanding 69.8 73.6 78.7 86.5 91.9 99.9 8.00%, 2009 50.0 - - - - 2.1 9.9 8.50%, 2005/07 30.0 - - 18.7 26.5 29.8 30.0 8.00%, 2004 60.0 55.1 58.9 60.0 60.0 60.0 60.0 9.50%, 1993/97 14.7 14.7 14.7 - - - - Held by Central Bank 3.6 3.6 0.0 0.0 0.0 0.0 Commercial banks 58.7 62.1 74.4 82.0 86.6 91.2 Savings Bank 5.0 5.4 4.3 4.5 5.4 8.7 Other financial institutions 2.5 2.5 0.0 0.0 0.0 0.0
1 Yearly averages of monthly data, compiled on an end-of-period basis. 2 At cost value.
Due to its long time frame to reach
maturity, government stocks proved to be
more popular amongst financial
institutions than with non-financial sector
investments. However, the rate of
increase in government stocks held by
commercial banks was approximately the
same, at 5.0 per cent.
2.3 Banking Supervision
During 2000, the Bank Supervision
Division continued to conduct
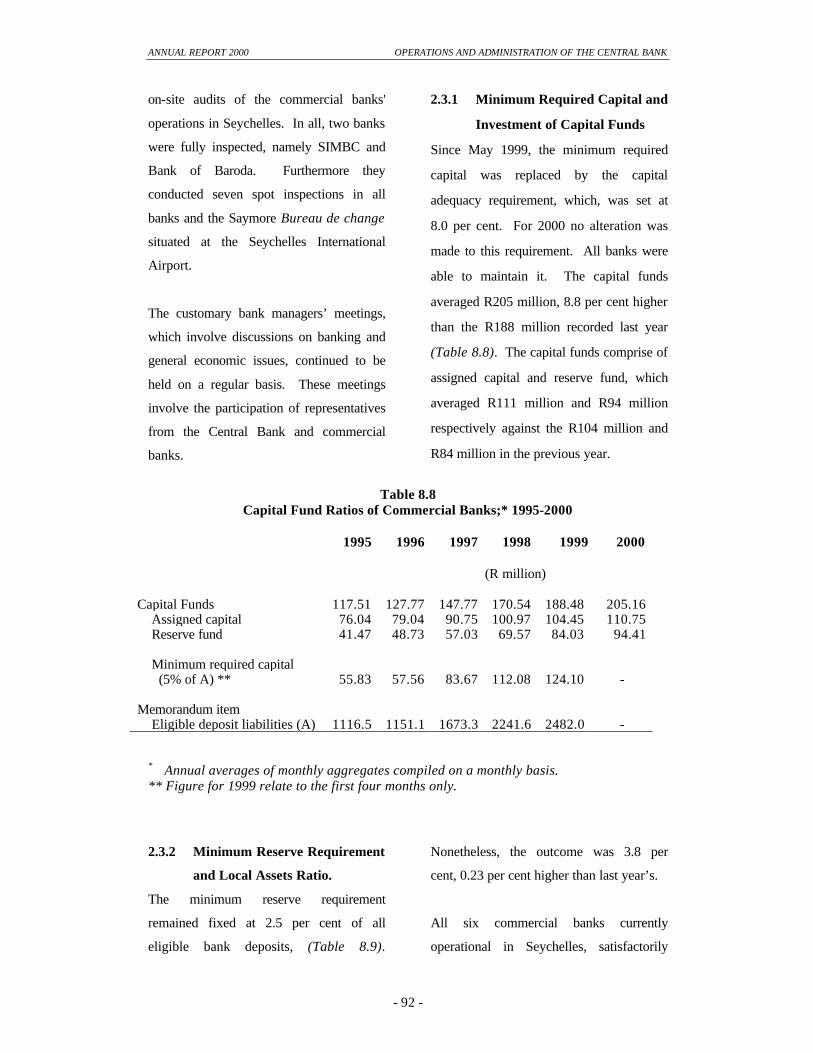
ANNUAL REPORT 2000 OPERATIONS AND ADMINISTRATION OF THE CENTRAL BANK
- 92 -
on-site audits of the commercial banks'
operations in Seychelles. In all, two banks
were fully inspected, namely SIMBC and
Bank of Baroda. Furthermore they
conducted seven spot inspections in all
banks and the Saymore Bureau de change
situated at the Seychelles International
Airport.
The customary bank managers’ meetings,
which involve discussions on banking and
general economic issues, continued to be
held on a regular basis. These meetings
involve the participation of representatives
from the Central Bank and commercial
banks.
2.3.1 Minimum Required Capital and
Investment of Capital Funds
Since May 1999, the minimum required
capital was replaced by the capital
adequacy requirement, which, was set at
8.0 per cent. For 2000 no alteration was
made to this requirement. All banks were
able to maintain it. The capital funds
averaged R205 million, 8.8 per cent higher
than the R188 million recorded last year
(Table 8.8). The capital funds comprise of
assigned capital and reserve fund, which
averaged R111 million and R94 million
respectively against the R104 million and
R84 million in the previous year.
Table 8.8
Capital Fund Ratios of Commercial Banks;* 1995-2000 1995 1996 1997 1998 1999 2000 (R million)
Capital Funds 117.51 127.77 147.77 170.54 188.48 205.16 Assigned capital 76.04 79.04 90.75 100.97 104.45 110.75 Reserve fund 41.47 48.73 57.03 69.57 84.03 94.41 Minimum required capital (5% of A) ** 55.83 57.56 83.67 112.08 124.10 - Memorandum item Eligible deposit liabilities (A) 1116.5 1151.1 1673.3 2241.6 2482.0 -
* Annual averages of monthly aggregates compiled on a monthly basis. ** Figure for 1999 relate to the first four months only.
2.3.2 Minimum Reserve Requirement
and Local Assets Ratio.
The minimum reserve requirement
remained fixed at 2.5 per cent of all
eligible bank deposits, (Table 8.9).
Nonetheless, the outcome was 3.8 per
cent, 0.23 per cent higher than last year’s.
All six commercial banks currently
operational in Seychelles, satisfactorily

ANNUAL REPORT 2000 OPERATIONS AND ADMINISTRATION OF THE CENTRAL BANK
- 93 -
met the 70 per cent local assets ratio.
However, the real outcome was 96 per
cent, thus indicating that commercial
banks reserves were mostly tied up,
implying a sharp drop in liquidity level at
the banks.
Table 8.9 Minimum Reserves and Local Assets Ratio;1 1995-2000
1995 1996 1997 1998 1999 2000 (per cent) Minimum reserve requirement Statutory limit 20.00 20.00 20.00 14.62 2.50 2.50 Outcome 20.92 21.01 21.49 21.62 3.56 3.79 Minimum local assets Statutory limit 50.00 50.00 50.00 55.83 70.00 70.00 Outcome 59.85 60.41 60.53 71.85 97.11 95.83 1 Yearly averages of weekly data Note: Minimum reserves and local assets in respect of Seychelles Savings Bank has been incorporated with that of other commercial banks.
Chart 8.4 Local Assets Ratio from 1995 to 2000
0
20
40
60
80
100
1995 1996 1997 1998 1999 2000
Years
(Per
cen
t)
Statutory limit Outcome Growth
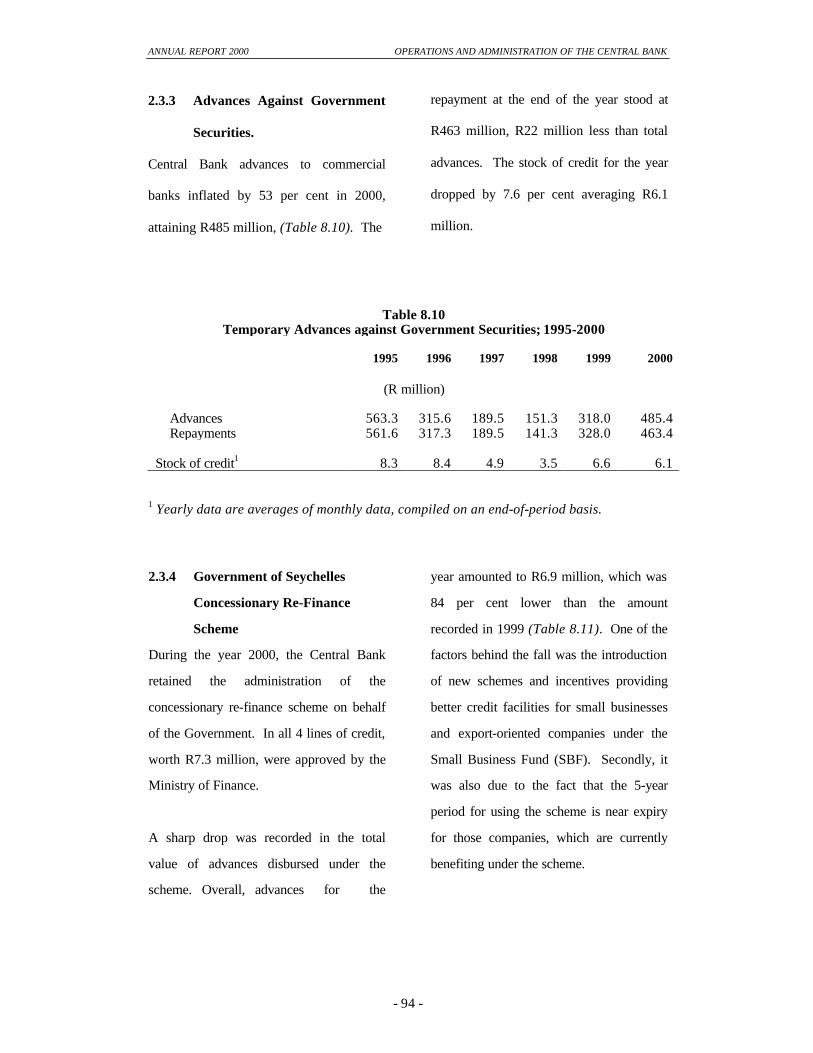
ANNUAL REPORT 2000 OPERATIONS AND ADMINISTRATION OF THE CENTRAL BANK
- 94 -
2.3.3 Advances Against Government
Securities.
Central Bank advances to commercial
banks inflated by 53 per cent in 2000,
attaining R485 million, (Table 8.10). The
repayment at the end of the year stood at
R463 million, R22 million less than total
advances. The stock of credit for the year
dropped by 7.6 per cent averaging R6.1
million.
Table 8.10 Temporary Advances against Government Securities; 1995-2000
1995 1996
1997 1998 1999 2000
(R million)
Advances 563.3 315.6 189.5 151.3 318.0 485.4 Repayments 561.6 317.3 189.5 141.3 328.0 463.4 Stock of credit1 8.3 8.4 4.9 3.5 6.6 6.1
1 Yearly data are averages of monthly data, compiled on an end-of-period basis.
2.3.4 Government of Seychelles
Concessionary Re-Finance
Scheme
During the year 2000, the Central Bank
retained the administration of the
concessionary re-finance scheme on behalf
of the Government. In all 4 lines of credit,
worth R7.3 million, were approved by the
Ministry of Finance.
A sharp drop was recorded in the total
value of advances disbursed under the
scheme. Overall, advances for the
year amounted to R6.9 million, which was
84 per cent lower than the amount
recorded in 1999 (Table 8.11). One of the
factors behind the fall was the introduction
of new schemes and incentives providing
better credit facilities for small businesses
and export-oriented companies under the
Small Business Fund (SBF). Secondly, it
was also due to the fact that the 5-year
period for using the scheme is near expiry
for those companies, which are currently
benefiting under the scheme.

ANNUAL REPORT 2000 OPERATIONS AND ADMINISTRATION OF THE CENTRAL BANK
- 95 -
Table 8.11 Government of Seychelles Re-finance Scheme; 1995-2000
1995 1996 1997 1998 1999 2000 (R million)
Stock of credit1 25.6 25.7 26.1 38.4 21.3 4.9 Of which: Export-oriented: Private sector 0.8 7.7 10.5 23.4 6.3 3.7 Public sector 24.8 18.1 15.7 15.0 15.0 1.3 Advances 53.5 56.4 55.5 89.5 43.1 6.9 Repayments 75.1 52.0 57.7 68.0 71.6 22.6
1 Yearly data are averages of monthly data, compiled on an end-of-period basis.
2.3.5 Advances To Non-Seychellois
The Central Bank continued to request the
submission of all information regarding
advances disbursed to non-Seychellois
investors and private individual by
commercial banks.
The recorded outstanding advances, at the
end of December 2000, amounted to R21
million (Table 8.12). In comparison to the
preceding year, the overall stock
outstanding continued to decline, as
evidenced by the 32 per cent drop reported
over the year as against the 55 per cent in
the previous year. The principal
beneficiary under the scheme was the
tourism-related sector with a share of 62
per cent.
Table 8.12
Commercial Bank Advances to Non-Seychellois;1 1998-2000 1 9 9 8 1 9 9 9 2 0 0 0 Limit Outstanding Limit Outstanding Limit Outstanding R million % R million % R million % Advances 68.5 30.5 20.6 Tourism 16.6 (24.3) 15.9 (52.3) 12.8 (61.9) Wholesale/retail 3.0 (4.4) 0.0 (0.0) .. (0.2) Building and construction 0.1 (0.1) 0.1 (0.2) 0.2 (0.9) Manufacturing 29.0 (42.3) 0.0 (0.0) 0.0 (0.0) Agriculture 0.0 (0.0) 0.0 (0.0) 0.0 (0.0) Fishing 0.2 (0.3) 0.2 (0.7) 0.2 (1.1) Real estate 2.5 (3.6) 0.7 (2.3) 0.0 (0.0) Individuals & households 1.4 (2.0) 1.5 (4.8) 1.2 (5.7) Other businesses 15.8 (23.0) 12.1 (39.7) 6.2 (30.1) 1End-of-period data
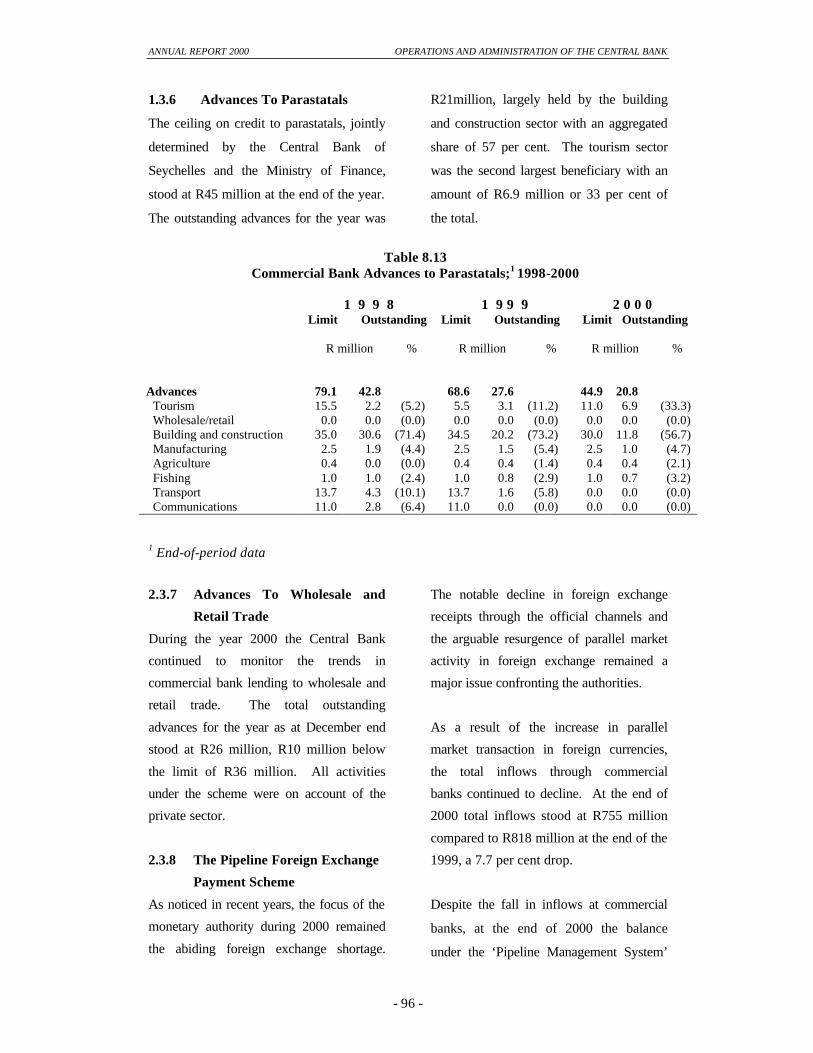
ANNUAL REPORT 2000 OPERATIONS AND ADMINISTRATION OF THE CENTRAL BANK
- 96 -
1.3.6 Advances To Parastatals
The ceiling on credit to parastatals, jointly
determined by the Central Bank of
Seychelles and the Ministry of Finance,
stood at R45 million at the end of the year.
The outstanding advances for the year was
R21million, largely held by the building
and construction sector with an aggregated
share of 57 per cent. The tourism sector
was the second largest beneficiary with an
amount of R6.9 million or 33 per cent of
the total.
Table 8.13
Commercial Bank Advances to Parastatals;1 1998-2000 1 9 9 8 1 9 9 9 2 0 0 0 Limit Outstanding Limit Outstanding Limit Outstanding R million % R million % R million % Advances 79.1 42.8 68.6 27.6 44.9 20.8 Tourism 15.5 2.2 (5.2) 5.5 3.1 (11.2) 11.0 6.9 (33.3) Wholesale/retail 0.0 0.0 (0.0) 0.0 0.0 (0.0) 0.0 0.0 (0.0) Building and construction 35.0 30.6 (71.4) 34.5 20.2 (73.2) 30.0 11.8 (56.7) Manufacturing 2.5 1.9 (4.4) 2.5 1.5 (5.4) 2.5 1.0 (4.7) Agriculture 0.4 0.0 (0.0) 0.4 0.4 (1.4) 0.4 0.4 (2.1) Fishing 1.0 1.0 (2.4) 1.0 0.8 (2.9) 1.0 0.7 (3.2) Transport 13.7 4.3 (10.1) 13.7 1.6 (5.8) 0.0 0.0 (0.0) Communications 11.0 2.8 (6.4) 11.0 0.0 (0.0) 0.0 0.0 (0.0) 1 End-of-period data
2.3.7 Advances To Wholesale and
Retail Trade
During the year 2000 the Central Bank
continued to monitor the trends in
commercial bank lending to wholesale and
retail trade. The total outstanding
advances for the year as at December end
stood at R26 million, R10 million below
the limit of R36 million. All activities
under the scheme were on account of the
private sector.
2.3.8 The Pipeline Foreign Exchange
Payment Scheme
As noticed in recent years, the focus of the
monetary authority during 2000 remained
the abiding foreign exchange shortage.
The notable decline in foreign exchange
receipts through the official channels and
the arguable resurgence of parallel market
activity in foreign exchange remained a
major issue confronting the authorities.
As a result of the increase in parallel
market transaction in foreign currencies,
the total inflows through commercial
banks continued to decline. At the end of
2000 total inflows stood at R755 million
compared to R818 million at the end of the
1999, a 7.7 per cent drop.
Despite the fall in inflows at commercial
banks, at the end of 2000 the balance
under the ‘Pipeline Management System’

ANNUAL REPORT 2000 OPERATIONS AND ADMINISTRATION OF THE CENTRAL BANK
- 97 -
stood at R132 million, 11 per cent lower
than the R148 million recorded at the end
of 1999.
2.3.9 Banking Licences
Under the Financial Institutions Act 1984,
as amended and the Licences Act 1986,
and in accordance with the Financial
Institutions (Domestic Banking Business)
Regulations, 1996, all banking licences are
renewable annually. Altogether a total of
six banks were operational in Seychelles
during the year 2000 and during the course
of the year all of the banks renewed their
licences.
Barclays Bank PLC was granted a
domestic banking licence on September 29
as it announced its intentions to be locally
incorporated and is now incorporated as
Barclays Bank (Seychelles) Ltd.
3.0 Research and Statistics
The focal point of this division is to advise
the government on monetary, exchange
rate and fiscal measures and policies and
like it has been in the previous years the
publication of the Bank’s Quarterly
Reviews and Annual Report. The
Research and Statistics Division is also
assigned the responsibility of compiling
statistics and the furnishing of macro-
economic and statistical information to
multilateral organisation such as the
International Monetary Fund (IMF) at
regular intervals.
4. Administrative Matters
4.1 Higher Education and Training
4.1.1 General
Ms Jennifer Morel, Director General Bank
Supervision, resumed duty on September
27 after completing her Master’s
programme in Banking and Finance in the
Sheffield Hallan University in UK.
4.2 Courses, Workshops and
Seminars
Miss Maryline Joseph, Bank Supervision
Officer, and Miss Caroline Abel, Research
Officer, participated in a workshop on the
“Legal and Operational Framework of
SADC Central Banks”, held in South
Africa from March 21 to 23.
Mrs Marylene Simeon, Public Debt
Supervisor, attended the 32nd Central
Banking course held in Pakistan from
February 28 to April 29. This course is
aimed at providing participants with a
broad knowledge of the principles of
central banking and its relationship with
the changing socio-economic problems of
developing countries.
Mr Pierre Laporte, Director General of
Research and Statistics, participated in the
SADC Payment Systems Harmonisation
Workshop on Payments System held
Pretoria, South Africa, from May 8 to 10.
This was a follow up of the meeting held
in February.
Mr Norman Lucas, Director Banking and
Currency Operations attended the
ANNUAL REPORT 2000 OPERATIONS AND ADMINISTRATION OF THE CENTRAL BANK
- 98 -
Operations Management held in Pretoria,
South Africa, from August 14 to 18. The
course was organised by the Information
Technology Forum of SADC.
Mr Phillip Moustache, Bank Supervision
Officer attended the International
Conference of Banking Supervisors and
seminars on Co-operation and Information
Sharing-Principles and Practices. The
conference was held in Switzerland from
the 17 to 21 September.
4.3 Official Meetings
Mr Pierre Laporte, Director General of
Research & Statistics, attended, a meeting
associated with the SADC Payment
System Project held in Pretoria, South
Africa, from February 17 to 18.
Mr Norman Lucas, Director Banking &
Currency Operations, attended the
Common Market for East and Southern
African countries (COMESA) Monetary
Co-operation meetings held in Mauritius
from the 20 to 25 March. There were
altogether three meetings at the ministerial
level, central bank governors' level and for
experts from central bank/ministry of
finance.
Mr Francis Chang-Leng, General Manager
and Mr Pierre Laporte, Director General
Research and Statistics, attended the
International Monetary Fund (IMF)
/World Bank Annual Meetings which was
held in Czech Republic from September
26 to 28.
5. Board of Directors
During the year 2000, the Board of
Directors held six meetings. The board of
Directors comprised of Mr Norman
Weber, Governor of the Central Bank, Mr.
Errol Dias, as a Director, Mr. Francis
Chang Sam as a Director, Mr. Francis
Chang Leng, the General Manager of the
Central Bank and Mr. Patrick Stravens as
the Secretary to the Board.