SNF Nigeria Report 2005_Enhancement of Local Content in Nigeria

CENTRAL BANK OF NIGERIACENTRAL BANK OF NIGERIA
Economic ReportFor the
First Half of 2017
Economic ReportFor the
First Half of 2017


© 20 Central Bank of Nigeria17
ISSN 1597 - 2976
iii
Central Bank of NigeriaCorporate Head Office33 Tafawa Balewa WayCentral Business DistrictP. M. B. 0187, GarkiAbujaWebsite: www.cbn.gov.ng
Tel: +234(0)946238707 +234(0)946238762 +234(0)946435900
CBN Economic Report for the First Half of 2017


v
Vision
Mission
e THE MODEL CENTRAL BANK
delivering PRICE and FINANCIAL SYSTEM STABILITY
and promoting SUSTAINABLE ECONOMIC DEVELOPMENT”.
o be proactive in providing a stable framework for the economic development
of Nigeria, through effective, efficient and transparent implementation of
monetary and exchange rate policy, and management of the financial sector.
T
“B
CBN Economic Report for the First Half of 2017

The Central Bank of Nigeria
vi
Established by the Central Bank of Nigeria (CBN) Act of 1958, the
Principal objects of the Bank as contained in the new CBN Act, 2007 are to
· ensure monetary and price stability
· issue legal tender currency in Nigeria
· maintain external reserves to safeguard the international value of
the legal tender currency
· promote a sound financial system in Nigeria
· act as banker and provide economic and financial advice to the
Federal Government of Nigeria
CBN Economic Report for the First Half of 2017

vii
CBN Economic Report for the First Half of 2017
MEMBERS OF THE COMMITTEE OF GOVERNORS OFTHE BANK AS AT JUNE 30, 2017
1. Godwin I. Emefiele, CON - Governor (Chairman)2. Suleiman A. Barau, OON - Deputy Governor (Corporate Services)3. Okwu J. Nnanna - Deputy Governor (Financial System Stability/ Economic
Policy) 4. Adebayo A. Adelabu - Deputy Governor (Operations)
Yunusa M. Sanusi - Secretary
MEMBERS OF THE MONETARY POLICY COMMITTEE (MPC)AS AT JUNE 30, 2017
1. Godwin I. Emefiele, CON - Governor (Chairman)2. Suleiman A. Barau, OON - Deputy Governor (Corporate Services)3. Okwu J. Nnanna - Deputy Governor (Financial System Stability/ Economic Policy) 4. Adebayo A. Adelabu - Deputy Governor (Operations)5. Dahiru Balami - Member6. Abdul-Ganiyu Garba - Member7. Adedoyin R. Salami - Member 8. Chibuike C. Uche - Member9. Shehu Yahaya - Member
Moses K. Tule - Secretary

viii
CBN Economic Report for the First Half of 2017
1. Dipo T. Fatokun - Banking & Payments System2. Ahmad Abdullahi - Banking Supervision3. Salisu Rabeh - Branch Operations4. Chizoba V. Mojekwu (Ms.) - Capacity Development5. Umma Dutse (Haj.) - Consumer Protection6. Isaac A. Okorafor* - Corporate Communications7. Yunusa M. Sanusi - Corporate Secretariat8. Prescilia Eleje* - Currency Operations9. Mudashir A. Olaitan - Development Finance10. Dayo M. Arowosegbe - Finance11. Alvan E. Ikoku - Financial Markets12. Kevin N. Amugo - Financial Policy and Regulation13. Dabai M. Suleyman - FSS 202014. Anthony C. Ifechikwu - Governors' Department15. Lametek E. Adamu - Human Resources16. John I. Ayoh - Information Technology17. Vivian I. Agu (Mrs.) - Internal Audit18. Johnson O. Akinkunmi - Legal Services19. Faozat A. O. Bello (Mrs.) - Medical Services20. Moses K. Tule - Monetary Policy 21. Agnes O. Martins (Mrs.) - Other Financial Institutions Supervision 22. Lazarus M. Agbor - Procurement & Support Services23. Uwatt B. Uwatt - Research24. Thirmidhi Y. - Reserve Management25. Oluwafolakemi J. Fatogbe(Ms.)- Risk Management26. Ibitayo O. Amu - Security Services27. Mohammed Tumala M. - Statistics28. Mu'azu Ibrahim - Strategy Management 29. Dauda W. Gotring - Trade & Exchange30. Abwaku Englama - Secondment to WAMI
* Overseeing the Department
DEPARTMENTAL DIRECTORS
ix
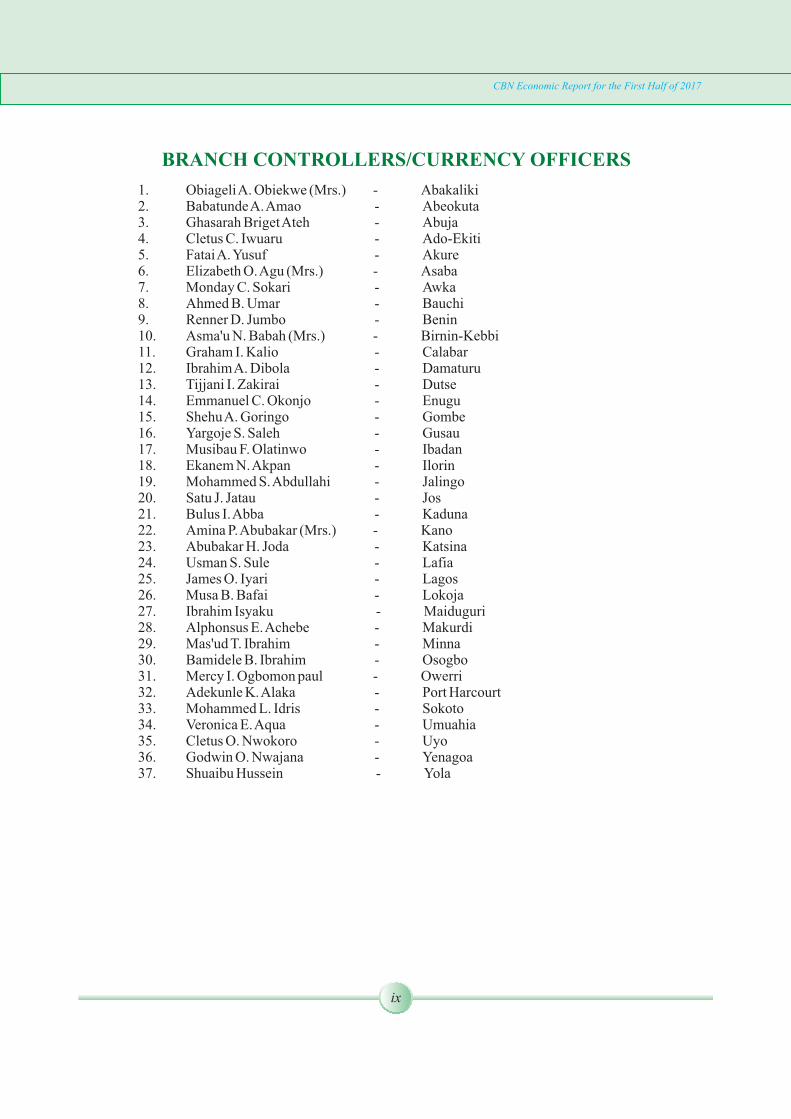
BRANCH CONTROLLERS/CURRENCY OFFICERS
1. Obiageli A. Obiekwe (Mrs.) - Abakaliki 2. Babatunde A. Amao - Abeokuta3. Ghasarah Briget Ateh - Abuja4. Cletus C. Iwuaru - Ado-Ekiti5. Fatai A. Yusuf - Akure6. Elizabeth O. Agu (Mrs.) - Asaba7. Monday C. Sokari - Awka8. Ahmed B. Umar - Bauchi9. Renner D. Jumbo - Benin10. Asma'u N. Babah (Mrs.) - Birnin-Kebbi11. Graham I. Kalio - Calabar12. Ibrahim A. Dibola - Damaturu13. Tijjani I. Zakirai - Dutse14. Emmanuel C. Okonjo - Enugu15. Shehu A. Goringo - Gombe16. Yargoje S. Saleh - Gusau17. Musibau F. Olatinwo - Ibadan18. Ekanem N. Akpan - Ilorin19. Mohammed S. Abdullahi - Jalingo 20. Satu J. Jatau - Jos21. Bulus I. Abba - Kaduna22. Amina P. Abubakar (Mrs.) - Kano23. Abubakar H. Joda - Katsina24. Usman S. Sule - Lafia25. James O. Iyari - Lagos26. Musa B. Bafai - Lokoja27. Ibrahim Isyaku - Maiduguri28. Alphonsus E. Achebe - Makurdi29. Mas'ud T. Ibrahim - Minna30. Bamidele B. Ibrahim - Osogbo31. Mercy I. Ogbomon paul - Owerri32. Adekunle K. Alaka - Port Harcourt33. Mohammed L. Idris - Sokoto34. Veronica E. Aqua - Umuahia35. Cletus O. Nwokoro - Uyo36. Godwin O. Nwajana - Yenagoa37. Shuaibu Hussein - Yola
CBN Economic Report for the First Half of 2017

xi
TABLE OF CONTENTS
Page
� � � � � � � � � � Summary� ..� ..� ..� ..� ..� ..� ..� ..� ..� ..� xxi�� � � � � � � �1.0 INTRODUCTION� ..� ..� ..� ..� ..� ..� ...� ..� 1� �2.0 OPERATIONS OF THE CENTRAL BANK OF NIGERIA .. .. .. 2 2.1 Liquidity Management .. .. .. .. .. .. 2 2.2 Monetary Policy Committee (MPC) Decisions� ..� .. .. 2 2.3 Developments in the Payments system� ..� ..� ..� .. 3 �
2.3.1� Payments System Initiatives�� ..� .. .. .. 3�� � The Bank Verification Number (BVN) Scheme� .. 32.3.1.1
� Nigeria Electronic Fraud Forum (NeFF)� .. .. 4�2.3.1.2 � � Migration from Merchant Service Charge to 2.3.1.3
Interchange Fee Regime� ..� ..� ..� �4 2.3.1.4 Cheque Standards and Cheque Printers Accreditation Scheme� ..� ..� ..� ..� 4� 2.3.1.5 Licensing of Payments System Participants� ..� 4� � � 2.3.1.6� Payments System Vision 2020 (PSV 2020)� ..� 4� 2.3.2 � Retail Payments System..� ..� ..� ..� ..� ..� 5� � � � Cheque� ..� ..� ..� ..� ..� .. 5�2.3.2.1� � � � Electronic Payments� ..� ..� .. � ..� 62.3.2.2� � � � ATM Transactions� ..� ..� ..� ..� 82.3.2.2.1
2.3.2.2.2 Web Transactions .. .. .. .. 9 2.3.2.2.3 Point of Sale (PoS) Transactions .. .. 9� � 2.3.2.2.4 Mobile Payments� ..� ..� ..� ..� 102.3.3� Wholesale Payments System� ..� ..� ..� ..� 11� Real Time Gross Settlement (RTGS) System� ..� 112.3.3.1 � � Nigeria Inter-bank Settlement System Instant 2.3.3.2
Payment (NIP)� ..� ..� ..� ..� ..� 12� Nigeria Inter-bank Settlement System Electronic 2.3.3.3
Fund Transfer (NEFT)� ..� ..� ..� .. 132.3.4� Currency Operations� ..� ..� ..� ..� ..� 14� 2.3.4.1� Issuance of the Legal Tender� ..� ..� ..� 14� 2.3.4.2 Currency-in-Circulation (CIC)� ..� ..� ..� 15
2.4� Financial Sector Surveillance� ..� ..� ..� ..� ..� 17 2.4.1 � Banking Supervision� � ..� ..� ..� ..� ..� 17 2.4.2 � Routine/Target Examination� ..� ..� ..� ..� 18
� � Special/ Foreign Exchange Examinations ..� ..� ..� 192.4.3 Banking Sector Soundness .. .. .. .. .. 192.4.4
2.4.5 � Compliance with the Code of Corporate � Governance for Banks� ..� ..� ..� ..� ..� 20�� �
CBN Economic Report for the First Half of 2017

xii
CBN Economic Report for the First Half of 2017
2.4.6 � Financial Crimes Surveillance/Anti-Money Laundering� � � /Combating the Financing of Terrorism (AML/CFT)..� ..� 21
2.4.7� Financial Literacy and Consumer Protection� ..� ..� 222.4.8� Fraud and Forgeries..� ..� ..� ..� ..� ..� 242.4.9� Cross Border Activities� ..� ..� ..� ..� ..� 252.4.10 �Update on the Implementation of the Systemic Support
Partnership and Oliver Wyman (SPP&OW) Report� ..� 25� Examination of Other Financial Institutions� ..� ..� ���262.4.11 2.5� Foreign Exchange Market and Management� ..� ..� ..� 26� � Spot Segment of the Foreign Exchange Market�� ..� 272.5.1� � Forwards and Swaps..� ..� � ..� ..� ..� 272.5.2� � Exchange Rate Movements� ..� ..� ..� ..� 282.5.3� � Spot Exchange Rates� ..� ..� ..� ..� 282.5.3.1� � Foreign Exchange Flows� ..� ..� ..� ..� ..� 29 �2.5.4
2.5.5 � Sectoral Utilisation of Foreign Exchange� ..� ..� ..� 32� � Nominal Effective Exchange Rate (NEER) and Real2.5.6 � Effective Exchange Rate (REER) Indices� ..� ..� ..� 34 �2.6� Development Finance Operations� ..� ..� ..� ..� 36�
2.6.1 Agricultural Credit Guarantee SchemeFund (ACGS)�� ..� ..� ..� ..� ..� ..� 36
2.6.2� Interest Drawback Programme (IDP)� ..� ..� ..� 372.6.3 Commercial Agriculture Credit Scheme (CACS) .. 37�2.6.4 MSME Development Fund (MSMEDF)� ..� ..� ..� 37
� �Anchor Borrowers' Programme (ABP)� ..� ..� ..� 382.6.5� � Presidential Fertilizer Initiative� ..� ..� ..� ..� 392.6.6� 2.6.7� National Food Security Programme (NFSP)� ..� ..� 39
2.6.8 � National Collateral Registry (NCR)�..� ..� ..� ..� 392.6.9� SME Credit Guarantee Scheme (SMECGS)� ..� ..� 402.6.10� Textile Sector Intervention Fund (TSIF)� ..� ..� ..� 402.6.11� Power and Airline Intervention Fund (PAIF)� ..� ..� 412.6.12 Nigeria Electricity Market Stabilisation Facility (NEMSF)� ..� 412.6.13 Financial Inclusion Activities� ..� ..� ..� ..� 41� 2.6.13.1 Visit of Delegates from 8 (eight) Alliance for
Financial Inclusion (AFI) Member Countries� ..� 41� � � Geospatial Mapping Update� ..� ..� ..� 412.6.13.2
2.6.14 Entrepreneurship Development Centres (EDCs)�..� ..� 422.6.15 Youth Entrepreneurship Development Programme (YEDP)� 42
� � � � � � � � ECONOMIC REPORT .. .. .. .. .. .. .. 433.0 GLOBAL ECONOMIC DEVELOPMENTS 43.. .. .. .. ..� 3.1 � Global Output� ..� ..� ..� ..� ..� ..� ..� 43
3.2� Global Commodity Prices� ..� ..� ..� ..� ..� ..� 45 �3.3 � Global Inflation..� ..� ..� ..� ..� ..� ..� ..� 453.4 � International Financial Markets � ..� ..� ..� ..� ..� 47 �
� � World Economic Outlook for the Rest of 2017� ..� ..� ..� 50 �3.5

xiii
CBN Economic Report for the First Half of 2017
4.0 � DEVELOPMENTS IN THE DOMESTIC ECONOMY� � 53..� ..� .. �4.1 � Monetary and Credit Developments� ..� ..� ..� ..� 53�
4.1.1 � Reserve Money � ..� ..� ..� ..� ..� ..� 53�� �Broad Money (M )� ..� ..� ..� ..� ..� ..� 55�24.1.2
4.1.3 � Narrow Money (M ) ..� ..� ..� ..� ..� ..� 551
4.1.4 � Quasi Money (QM) ..� ..� ..� ..� ..� ..� 554.1.5 � Currency-in-Circulation and Deposits at the CBN ..� ..� 554.1.6 � Currency Outside Bank (COB)� ..� ..� ..� ..� 564.1.7� Drivers of Growth in Monetary Supply� ..� ..� ..� 57
4.1.7.1 Net Foreign Assets� (NFA) ..� ..� ..� ..� 574.1.7.2 Net Domestic Credit (NDC) ..� ..� ..� ..� 57�
4.1.7.2.1 Net Credit to the Government (NCG)� 574.1.7.2.2 Credit to the Private Sector (Cp) � 58
4.1.7.3 Other Assets (Net) (OAN)� ..� ..� ..� ..� 584.1.8 � Sectoral Distribution of Credit..� ..� ..� ..� ..� 594.1.9 � Maturity Structure of DMBs' Outstanding
Loans and Advances, and Deposit Liabilities..� ..� ..� 60� � �Market Structure of the Banking Industry� ..� ..� ..� 624.1.10� � �Consumer Credit � ..� ..� ..� ..� ..� ..� 634.1.11� � �Money Market Developments..� ..� ..� ..� ..� 634.1.12
4.1.12.1 Money Market Assets Outstanding..� ..� ..� 64� �4.1.12.2 Primary Market..� ..� ..� ..� ..� ..� 64� �4.1.12.3 Federal Government of Nigeria Bonds� ..� ..� 664.1.12.4 Open Market Operations (OMO)..� ..� ..� 664.1.12.5 OMO Auctions� ..� ..� ..� ..� ..� 664.1.12.6 The Two-Way Quote Trading in NTBs..� ..� ..� 674.1.12.7 Tenor Repurchase Transactions..�..� ..� ..� 674.1.12.8 Discount Window Operations� ..� ..� ..� 674.1.12.9 Central Bank of Nigeria (CBN) Standing Facilities..� 67
4.1.12.9.1 Standing Lending Facility (SLF).�..� ..� 674.1.12.9.2 Standing Deposit Facility (SDF).�..� ..� 68
4.1.12.10 Inter-Bank Funds Market� ..� ..� ..� ..� 684.1.13 �Interest Rates Developments..� ..� ..� ..� ..� 68�
4.1.13.1 Money Market Rates..� ..� ..� ..� ..� 68�4.1.13.1.1 Deposit Rates..� ..� ..� ..� ..� 69�4.1.13.1.2 Lending Rates..� ..� ..� ..� ..� 69�
4.1.14 Institutional Savings� ..� ..� ..� ..� ..� ..� 70�4.1.15 Other Financial Institutions� ..� ..� ..� ..� ..� 70�
4.1.15.1 Development Finance Institutions �..� ..� ..� 704.1.15.2 Microfinance Banks (MFBs)..� ..� ..� ..� 71�4.1.15.3 Finance Companies (FCs)�..� ..� ..� ..� 71�
� Primary Mortgage Banks (PMBs) ..� ..� ..� 724.1.15.44.1.15.5 Bureaux-De-Change (BDCs)� ..� ..� ..� 734.1.15.6 Asset Management Corporation of Nigeria
(AMCON)..� ..� ..� ..� ..� ..� ..� 734.1.16 �Capital Market Developments..� ..� ..� ..� ..� 74��

xiv
CBN Economic Report for the First Half of 2017
Institutional Developments.. .. .. .. 744.1.16.14.1.16.2 The Nigerian Stock Exchange(NSE).. .. .. 74
New Issues Market .. .. .. .. .. 75 4.1.16.3 The Secondary Market.. .. .. .. .. 75 4.1.16.4 All-Share Index and Aggregate Market 4.1.16.5
Capitalisation .. .. .. .. .. 764.2 Fiscal Operations 77
4.2.1 Federally Collected Revenue .. .. .. .. 774.2.1.1 Federation Account Distribution .. .. .. 814.2.1.2 VAT Pool Account .. .. .. .. .. 814.2.1.3 Cumulative Distribution .. .. .. .. 82
4.2.2 Federal Government Finances .. .. .. .. 82 Federal Government Fiscal Balance .. .. 824.2.2.1
4.2.2.2 Federal Government Retained Revenue .. .. 83 Federal Government Expenditure .. .. .. 84 4.2.2.34.2.3 State Government Finances .. .. .. .. 86 4.2.4 Local Government Finances .. .. .. .. 87
Public Debt .. .. .. .. .. .. .. 88 4.2.5 Consolidated Government Debt .. .. .. .. 884.2.5.1
4.2.5.2 Domestic Debt.. .. .. .. .. .. 89 4.2.5.3 External Debt.. .. .. .. .. .. 89 4.2.5.4 Total Debt Service .. .. .. .. .. 90
4.3 Real Sector Developments .. .. .. .. .. .. 91 Agriculture.. .. .. .. .. .. .. .. 91 4.3.1
4.3.1.1 Agricultural Policies and Institutional Support.. .. 91 4.3.1.2 Agricultural Production and Prices.. .. .. 93
4.3.2 Industry.. .. .. .. .. .. .. .. 94 4.3.2.1 Industrial Policy and Institutional Support .. .. 94 4.3.2.2 Industrial Production .. .. .. .. 95 4.3.2.3 Manufacturing .. .. .. .. .. 95
4.3.3 Crude Oil .. .. .. .. .. .. .. 96 4.3.3.1 Crude Oil Production and Demand .. .. 964.3.3.2 Crude Oil Prices.. .. .. .. .. .. 98
4.3.4 Gas .. .. .. .. .. .. .. .. 98 4.3.5 Petroleum Products .. .. .. .. .. .. 99 4.3.6 Solid Minerals .. .. .. .. .. .. .. 99 4.3.7 Electricity Generation .. .. .. .. .. 100 4.3.8 Electricity Consumption .. .. .. .. .. 100 4.3.9 Industrial Financing.. .. .. .. .. .. 100
4.3.9.1 The Bank of Industry (BOI) .. .. .. .. 1004.3.9.2 The Nigerian Export-Import Bank (NEXIM) .. .. 101
4.3.10 Telecommunications .. .. .. .. .. .. 102 4.3.11 Consumer Prices .. .. .. .. .. .. 103
4.3.11.1 Headline Inflation .. .. .. .. .. 103 4.3.11.2 Core Inflation.. .. .. .. .. .. 1034.3.11.3 Food Inflation.. .. .. .. .. .. 1044.3.11.4 Urban and Rural Consumer Price Indices and
Inflation Rates .. .. .. .. .. 105
xv
CBN Economic Report for the First Half of 2017
4.3.12 Aviation Services .. .. .. .. .. .. 1064.3.12.1 Policy and Airport Development .. .. .. 1064.3.12.2 Domestic Operations .. .. .. .. 1064.3.12.3 International Operations .. .. .. .. 107
4.3.13 Maritime Services .. .. .. .. .. .. 1074.3.14 Railway Services .. .. .. .. .. .. 107
4.4 Social Sector Developments .. .. .. .. .. 108 Health .. .. .. .. .. .. .. .. 1084.4.1 4.4.2 Environment .. .. .. .. .. .. .. 109 4.4.3 Housing and Urban Development .. .. .. .. 1094.5 External Sector Developments .. .. .. .. .. 110 Current Account .. .. .. .. .. .. 110 4.5.1
4.5.1.1 Trade .. .. .. .. .. .. .. 110 Services .. .. .. .. .. .. .. 114 4.5.1.24.5.1.3 Income .. .. .. .. .. .. .. .. 115 Current Transfers.. .. .. .. .. .. 1154.5.1.4
Capital and Financial Accounts .. .. .. .. 1164.5.2 Foreign Direct Investment .. .. .. .. 1164.5.2.1 Portfolio Investment .. .. .. .. .. 1164.5.2.2 4.5.2.3 Other Investment .. .. .. .. .. 117 Capital Importation and Capital Outflow .. .. .. 1174.5.3
4.5.4 External Reserve .. .. .. .. .. .. 119
5.0 INTERNATIONAL ECONOMIC RELATIONS 121 5.1 Global Institutions .. .. .. .. .. .. .. 121
5.1.1 International Monetary Fund (IMF) .. .. .. .. 1215.1.2 The World Bank/IMF Spring Meetings .. .. .. 1215.1.3 G24 Technical Group Meeting .. .. .. .. 122
5.2 Regional Institutions .. .. .. .. .. .. .. 1235.2.1 Ordinary Meeting of the Bureau of the Association of African Central Banks (AACB), Dakar, Senegal, March 8, 2017 ... 1235.2.2 2017 Association of African Central Banks (AACB) Continental Seminar .. .. .. .. .. .. 124
5.3 Sub-Regional Institutions .. .. .. .. .. .. 125 Economic Community of West African States (ECOWAS).. 1255.3.1
5.3.2 West African Monetary Zone (WAMZ) Committee of Governors .. .. .. .. .. .. .. 1255.3.3 West African Institute for Financial and Economic Management (WAIFEM) .. .. .. .. .. 1265.3.4 Meeting of the Committee of Governors of ECOWAS Member Central Banks .. .. .. .. .. 1275.3.5 Convergence Council of Ministers and Governors of Central Banks of WAMZ .. .. .. .. .. .. 129
6.0 OUTLOOK FOR THE SECOND HALF OF 2017 130 .. .. .. ..

TABLES
xvi
CBN Economic Report for the First Half of 2017
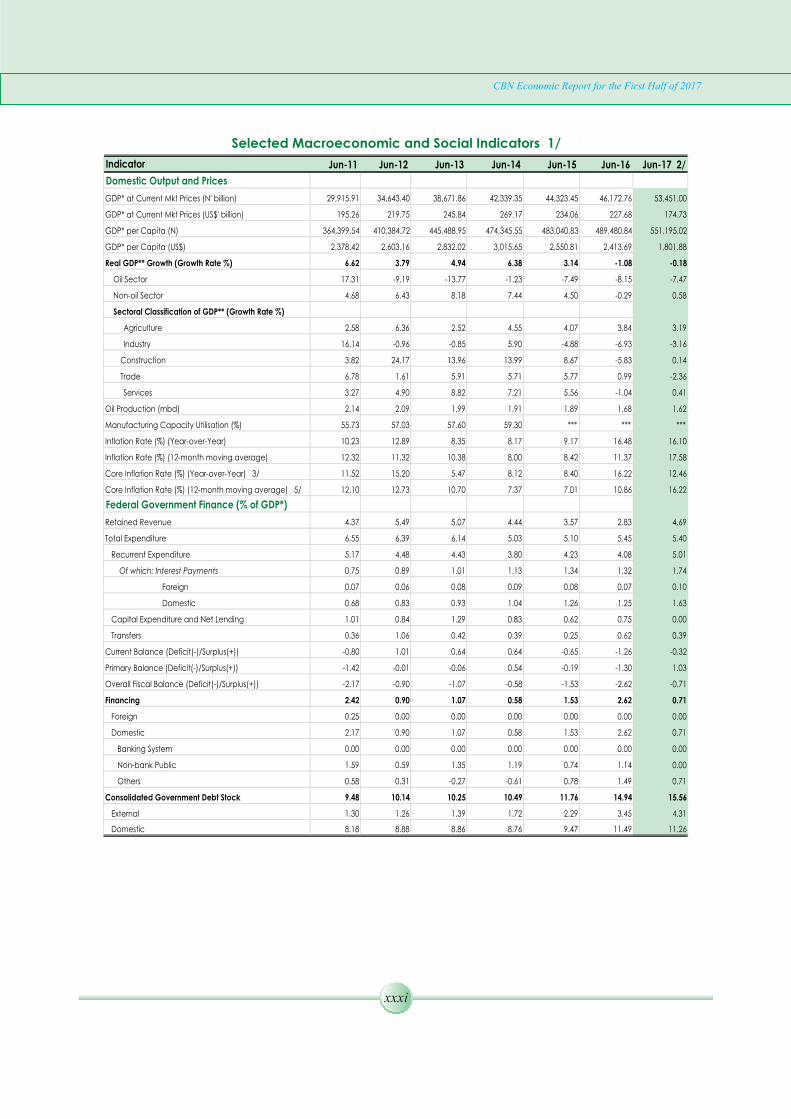
Selected Macroeconomic and Social Indicators .. .. .. .. xxxi1 Monetary Policy Benchmarks and Outcomes .. .. .. .. 1 2 Monetary Policy Committee Decision During the First Half of 2017 .. 33 Licensed Payments System Participants .. .. .. .. .. 44 Structure of the CIC .. .. .. .. .. .. .. .. 165 Nominal and the Real Effective Exchange Rate Indices .. .. 356 Summary of MSMEDF Activities .. .. .. .. .. .. 387 Number of Value of Financing Statement in the National Collateral Registry .. .. .. .. .. .. .. .. 408 Summary of Projects Financed Under PAIF .. .. .. .. 419 Indices of Selected International Stock Markets .. .. .. .. 4910 Exchange Rates of Selected Countries .. .. .. .. .. 5011 Sources and Uses of Reserve Money .. .. .. .. .. 5412 Growth in Monetary Aggregates .. .. .. .. .. .. 5813 Share of Credit to the Core Private Sector.. .. .. .. .. 5914 Maturity Structure of Banks Assets and Liabilities.. .. .. .. 6115 Bid-Cover Ratios of Selected Securities .. .. .. .. .. 6516 Money Market Rates.. .. .. .. .. .. .. .. 6817 DMBs Deposit and Lending Rates. .. .. .. .. .. .. 7018 Key Finance Companies Financial Highlights .. .. .. .. 7219 Key PMB Financial Highlights .. .. .. .. .. .. 7320 DMBs' Credit to Core Private Sector .. .. .. .. .. 13221 Money Market Rates .. .. .. .. .. .. .. 13322 Selected Interest Rates .. .. .. .. .. .. .. 13323 Open Market Operations (OMO) Sessions .. .. .. .. 13424 Treasury Bills: Issues and Allotments .. .. .. .. .. 13525 Monetary and Credit Developments.. .. .. .. .. .. 13626 Value of Money Market Assets .. .. .. .. .. .. 13727 Selected Interest Rates .. .. .. .. .. .. .. 13828 Federation Account Operations .. .. .. .. .. .. 13929 Federally Collected Revenue Distribution .. .. .. .. 14030 Summary of Government Finances .. .. .. .. .. 14131 Functional Classification of Federal Government Recurrent and Capital Expenditure. .. .. .. .. .. .. .. 14232 Summary of Statutory & VAT Revenue Allocation to State Governments.. .. .. .. .. .. .. .. .. 143 33 Allocation to Local Government From the Federation and VAT Pool Accounts .. .. .. .. .. .. .. .. 14534 Consolidated Debt of the Federal Government .. .. .. .. 14735 External Public Debt Outstanding .. .. .. .. .. .. 14836 Consolidated Debt Service Payment .. .. .. .. .. 14937 Domestic Debt Service Payment of the Federal Government .. .. 14938 Gross Domestic Product at 2010 Constant Basic Prices .. .. .. 15039 Gross Domestic Product at Current Basic Prices .. .. .. .. 15140 Selected Real Sector Indicators.. .. .. .. .. .. .. 15241 Composite Consumer Price Index .. .. .. .. .. .. 15442 Urban and Rural Consumer Price Index .. .. .. .. .. 15543 Balance of Payments Analytic Presentation (US$).. .. .. .. 15644 Balance of Payments Analytic Presentation (Naira) .. .. .. 157

xvii
CBN Economic Report for the First Half of 2017
45 Foreign Exchange Flows Through the Economy.. .. .. .. 15846 Nigeria's Gross External Reserves.. .. .. .. .. .. .. 15947 Nigeria's Foreign Exchange Cross Rates.. .. .. .. .. .. 16048 Monthly Average Exchange Rate Movement.. .. .. .. .. 16149 Demand and Supply of Foreign Exchange .. .. .. .. 16250 Sectoral Utilization of Foreign Exchange .. .. .. .. .. 16351 Total External Assets of Financial Institutions.. .. .. .. .. 164
xviii
CBN Economic Report for the First Half of 2017
FIGURES 1 Volume of Cheques Cleared.. .. .. .. .. .. 5 2 Value of Cheques Cleared.. .. .. .. .. .. 6 3 Use of E-Payment Channels by Volume .. .. .. .. 6 4 Use of E-Payment Channels by Value .. .. .. .. 7 5 Volume of Electronic Payments .. .. .. .. .. 7 6 Value of Electronic Payments .. .. .. .. .. 7 7 Volume of ATM Transactions .. .. .. .. .. 8 8 Value of ATM Transactions.. .. .. .. .. .. 8 9 Volume of Web Transactions .. .. .. .. .. 910 Value of Web Transactions .. .. .. .. .. .. 911 Volume of PoS Transactions .. .. .. .. .. 1012 Value of PoS Transactions .. .. .. .. .. .. 1013 Volume of Mobile Transactions .. .. .. .. .. 1114 Value of Mobile Transactions .. .. .. .. .. 1115 Volume of RTGS Transactions .. .. .. .. .. 1216 Value of RTGS Transactions .. .. .. .. .. .. 1217 Volume of NIP Transactions .. .. .. .. .. .. 1318 Value of NIP Transactions .. .. .. .. .. .. 1319 Volume of NEFT Transactions .. .. .. .. .. 1420 Value of NEFT Transactions .. .. .. .. .. .. 1421 Credit Risk Management System (CRMS) Statistics.. .. .. 1822 Demand, Supply and Net Demand of Foreign Exchange .. 2823 Exchange Rate Movements.. .. .. .. .. .. 2924 Interbank/Bureau-de-Change Foreign Exchange (N/US$) Premium 2925 Foreign Exchange Disbursements Through the CBN.. .. .. 31 26 Foreign Exchange Transactions Through the CBN.. .. .. 32 27 Sectoral Utilisation of Foreign Exchange (Visibles).. .. .. 33 28 Sectoral Utilisation of Foreign Exchange (Invisibles).. .. .. 34 29 Nominal Effective Exchange Rate (NEER) and Real Effective Exchange Rate (REER) .. .. .. .. .. .. .. 3530 Distribution of ACGSF Loans (By Purpose).. .. .. .. 36 31 Performance of the Naira against Major Currencies .. .. 4832 Performance of the Naira against Regional Currencies .. 4933 (a) Reserve Money and its Components: Sources .. .. .. 5433 (b) Reserve Money and its Components: Uses .. .. .. 5534 Ratio of Currency Outside Bank to Broad Money Supply .. 5635 Growth in Money Supply.. .. .. .. .. .. .. 5636 Distribution of Aggregate Credit to the Economy .. .. 57 37 Distribution of Private Sector Credit. .. .. .. .. 5838 Distribution of Bank Loans and Advances by Maturity .. .. 6039 Maturity Structure of Banks Deposits. .. .. .. .. 6140 (a) Market Concentration Ratios of Banks (Assets and Deposits) .. 6240 (b) Measures of Competition in Banks: Herfindahl-Hirschman Index 6241 Consumer Credit and Ratio of Claims on Core Private Sector .. 6342 Money Market Assets Outstanding.. .. .. .. .. 6443 Nigerian Treasury Bills Outstanding .. .. .. .. .. 65
xix
CBN Economic Report for the First Half of 2017
44 Distribution of FGN Bonds.. .. .. .. .. .. .. 6645 Money Market Rates.. .. .. .. .. .. .. 69 46 Complaints Received and Resolved .. .. .. .. 75 47 Volume and Value of Transactions at the NSE .. .. .. 7648 Aggregate Market Capitalization and NSE Value Index.. .. 77 49 Structure of Gross Federation Revenue.. .. .. .. .. 78 50 Composition of Oil Revenue.. .. .. .. .. .. 7951 Composition of Non-Oil Revenue.. .. .. .. .. 8052 Composition of Federally-Collected Revenue (Net) .. .. 8153 Cumulative Distribution to the tiers of Government and 13% Derivation Fund .. .. .. .. .. .. .. 82 54 Federal Government (FGN) Fiscal Balance.. .. .. .. 8355 Composition of Federal Government Retained Revenue.. .. 84 56 Composition of Federal Government Expenditure.. .. .. 85 57 Economic Classification of Federal Government Recurrent Expenditure.. .. .. .. .. .. .. .. 8658 Composition of Total Allocation to State Governments .. .. 87 59 Composition of Statutory Allocation to Local Governments .. .. 8860 Composition of Federal Government Consolidated Debt .. 8961 Breakdown of External Debt Stock .. .. .. .. 9062 Breakdown of Extenal Debt Service .. .. .. .. 91 63 GDP Growth Rate.. .. .. .. .. .. .. .. 9264 Industrial Production Index.. .. .. .. .. .. 9365 Average Manufacturing Capacity Utilisation .. .. .. 9466 Crude Oil Production and Exports.. .. .. .. .. 97 67 Average Spot Prices of Selected Crudes .. .. .. .. 9868 Gas Production and Utilization.. .. .. .. .. .. 99 69 Sectoral Disbursement of BOI Loans .. .. .. .. 10170 Sectoral Disbursement of NEXIM Loans .. .. .. .. 10171 Total Active Lines and Tele-density.. .. .. .. .. 102 72 Consumer Price Indices.. .. .. .. .. .. .. 103 73 Inflation Rate .. .. .. .. .. .. .. .. 10474 Urban and Rural Consumer Price Indices.. .. .. .. 106 75 Exports, Imports and Trade Balance.. .. .. .. .. 111 76 Foreign Exchange Utilisation .. .. .. .. .. 11277 Non-Oil Exports by Products.. .. .. .. .. .. 11278 Non-Oil Exports to the ECOWAS Sub-Region .. .. .. 11379 Share of Services Out Payments.. .. .. .. .. .. 11480 Private Home Remittances.. .. .. .. .. .. 11581 FDI and Portfolio Investment Inflows.. .. .. .. .. 11782 Capital Importation by Sector.. .. .. .. .. .. 11883 Capital Outflows and Outward Transfers .. .. .. .. 11984 External Reserves Stock and Months of Import Commitments .. 120


CBN OPERATIONS:Developmental
Initiatives
POLICY FRAMEWORK
SUMMARY
xxi
The Central Bank of Nigeria (CBN) sustained a non-expansionary monetary policy stance in the first half of 2017 to ensure exchange rate and price stability, as high inflation and foreign exchange demand pressure remained the main challenges. The monetary policy rate (MPR), was retained at 14.0 per cent throughout the review period, with asymmetric corridor of +200/-500 basis points. Similarly, the cash reserve and liquidity ratios were retained at 22.5 and 30.0 per cent, respectively. Open market operations (OMO) remained the primary instrument for liquidity management, complemented by cash reserve requirements, repo transactions and interventions in the foreign exchange market. The Bank also carried out its supervisory and regulatory activities through regular appraisal of banks' returns, periodic on-site examination and special investigations, among others, to foster a sound and stable financial system.
Growth in major monetary aggregates was generally below the indicative benchmarks in the first half of 2017. Reserve money, at N5,489.6 billion, fell by 6.2 per cent, as against the 11.4 per cent growth benchmark and 7.6 per cent decline at end-June 2016. Similarly, broad money supply (M2) and narrow money supply (M1) fell by 7.3 and 10.7 per cent, compared with the respective benchmark growth of 10.3 and 11.0 per cent. The development in broad money supply reflected the decrease in net foreign assets and other asset (net) of the banking system, which more than offset the increase in domestic credit (net). Currency-in-circulation and currency outside banks, at N1,873.5 billion and N1,477.1 billion, respectively, also fell by 14.0 and 18.9 per cent in the review period.
The CBN continued to support the real economy through the implementation of existing development finance initiatives, notably the Anchor Borrowers' Programme (ABP); Commercial Agriculture Credit Scheme (CACS); Micro, Small and Medium Enterprises Development Fund (MSMEDF); Power and Airline Intervention Fund (PAIF); and Nigeria Electricity Market Stabilisation Facility (NEMSF). The Bank also supported activities of the Youth Entrepreneurship Development Programme (YEDP), the Entrepreneurship Development Centres (EDC) and the National Collateral Registry (NCR).
CBN Economic Report for the First Half of 2017

Financial SectorSurveillance
xxii
The Bank continued to accord priority to the safety, reliability and efficiency of the payments system, and sustained the implementation of various initiatives to consolidate on the gains achieved thus far. Under the BVN scheme, the Bank issued a draft Regulatory Framework for BVN Operations and Watch-list for the Nigerian Financial System and extended the deadline for enrollment by customers of other financial institutions to end-December 2017. At end-June 2017, 29.6 million customers had been registered for BVN linked to 40.7 million accounts out of the 62.6 million active customer accounts.
The Bank participated in the activities of the Committee on Identity Management and Harmonisation of Data, set-up by the Federal Government to integrate identity data captured by different organisations. Other achievements and initiatives included: development of “Smart Cities Policy framework and Leadership Paper”, “Framework for the Adoption of Electronic Payments in the Education System and Transportation Services in Nigeria”, “Revised Rules and Regulations on RTGS”, “Revised Framework for Collateral Management” for the operations of deferred net settlement systems; and exposure of the revised Nigeria Cheque Standards and guidelines on the Payments System Vision 2020 to stakeholders.
In the first half of 2017, liquidity was influenced by fiscal operations of the three tiers of government, effect of CRR operations, settlement of foreign exchange transactions and maturity of CBN bills. To maintain optimal level of liquidity, the Bank retained open market operations (OMO) as the main tool for liquidity management, supported by reserve requirements, repurchase agreements and the discount windows. The Bank also introduced special windows in the foreign exchange market to address demand-supply bottlenecks and improve overall liquidity.
Payments&
Clearing System
CBN Economic Report for the First Half of 2017
LiquidityManagement
The CBN intensified its supervisory and regulatory activities on the banking system to promote the safety and soundness of institutions, and stability of the financial system. In this regard, the CBN/NDIC Joint Risk-based assessment of banks was conducted to ascertain the quality of risk assets and adequacy of loan loss provisions. Routine examination was also carried out on the three private credit bureaux, the Asset Management Corporation of Nigeria (AMCON) and two Nigerian banks' foreign subsidiaries. In addition, the Bank carried out the first of the bi-annual examination of foreign exchange activities of twenty-five (25) banks in April 2017. Furthermore, several ad-hoc investigations were conducted and the outcomes served as

xxiii
Financial SectorSurveillance
CBN Economic Report for the First Half of 2017
input to the policy development process.To further entrench good corporate governance codes and practices in the banking industry, the Bank developed a Corporate Governance Scorecard to monitor implementation of the Code by (Deposit Money Banks (DMBs). A pilot run on ten (10) banks, for all the categories of licences, revealed lack of approved strategy document in three (3) banks and general absence of a unit/department for the implementation of banks' corporate governance strategy.
The industry average capital adequacy ratio (CAR) was 11.5 per cent, compared with the industry threshold of 15.0 per cent for banks with international authorisation and 10.0 per cent for those with national and regional authorisation. The industry liquidity ratio increased to 45.8 per cent at end-June 2017, compared with 42.6 per cent at end-June 2016 and regulatory minimum of 30.0, 20.0 and 10.0 per cent for commercial, merchant and non-interest banks, respectively. The industry ratio of non-performing loans (NPLs) to total loans, however, deteriorated further to 15.0 per cent at end-June 2017, due to adverse economic conditions – and the poor performance of three outlier banks.
In the other Financial Institutions (OFIs) sub-sector, routine risk-based examination of the five (5) reporting development finance institutions (DFIs) revealed that the Composite Risk Rating (CRR) of four institutions was High and one “Moderate”. Earnings of one institution was rated “acceptable”, one “needs improvement” and three “weak”, due, mainly, to significant deterioration in asset quality and high loan loss provisions. In addition, risk-based examinations of 226 microfinance banks (MFBs) and 51 finance companies (FCs) were conducted in the first half of 2017.
A total of 1,141 and 1,270 complaints against banks and other financial institutions were received and resolved, respectively, in the first half of 2017, compared with 1,473 and 1,157 received and resolved in the corresponding period of 2016. Compliance examination on 19 banks indicated different compliance levels with the regulations on consumer protection and selected provisions of the Revised Guide to Bank Charges (RGBC), following which erring banks were directed to implement specific remedial actions, including refunds to customers where applicable.

xxiv
The CBN deepened the reforms in the foreign exchange market, including regular interventions to improve liquidity in the market. The introduction of special windows for investors and exporters, Form “Q” for small and medium enterprises (SMEs) and weekly sales to retail end-users eased the foreign exchange market bottlenecks and moderated the demand pressure. Following sustained interventions, the end-period exchange rate of the naira to the US dollar, at the BDC segment, appreciated to N366.00/US$ at end-June 2017, compared with N490.00/US$ at end-December 2016. This implied narrower arbitrage premium between naira exchange rate at the inter-bank and BDC segments.
FOREIGN EXCHANGE MANAGEMENT
Aggregate credit to the domestic economy grew marginally, mainly, as a result of the growth in net claims on the Federal Government. Net domestic credit (NDC) grew by 1.0 per cent to N26,921.0 billion at the end of the first half of 2017, compared with 13.9 per cent at the end of the corresponding period of 2016. Net claims on government rose by 5.9 per cent, reflecting, increased holding of government securities, especially treasury bills by commercial banks. As in the preceding period, the Federal Government remained a net lender to the banking system in the review period. Credit to the private sector, however, fell marginally by 0.02 per cent to N21,978.60 billion at end-June 2017, in contrast to the 14.6 per cent growth in the corresponding period of 2016. Banks' deposit and lending rates generally trended upward in the first half of 2017. The average term deposit rate rose by 3.29 percentage points to 8.69 per cent above the level in the corresponding period of 2016. Similarly, the weighted average prime and maximum lending rates increased to 17.21 and 29.99 per cent, respectively. The spread between the average term deposits and maximum lending rates narrowed to 21.29 percentage points. Movements in money market rates reflected the tight liquidity conditions in the banking system in the review period. The rates were generally higher than the levels in the corresponding period of 2016. The monthly weighted average inter-bank and average Open-Buy-Back rates stood at 22.94 and 26.66 per cent, respectively, compared with 8.50 and 7.63 per cent in the corresponding period of 2016. The weighted average Nigeria Inter-bank Offered Rate (NIBOR) for the 30-day tenor was 29.26 per cent, compared with the 18.64 per cent in the corresponding half of 2016. With the year-on-year inflation rate at 16.1 per cent in June 2016, all deposit rates were negative in real terms.The Nigerian Stock Exchange recorded improved performance
THE FINANCIAL SECTOR
CBN Economic Report for the First Half of 2017

xxv
THE FINANCIAL SECTOR
CBN Economic Report for the First Half of 2017
in the first half of 2017, due to positive investors' confidence. There were twelve (12) new equity listings worth N79.35 billion in the primary segment. Aggregate volume of traded securities fell by 19.0 per cent, while the value of traded securities rose significantly by 50.1 per cent relative to the levels in the corresponding period of 2016. The aggregate market capitalisation and All-Share Index (ASI) rose by 10.1 and 11.9 per cent, respectively, to N19.03 trillion and 33,117.48 at end-June 2017.
Gross federally-collected revenue, at N3,020.00 billion or 5.8 per cent of GDP in the first half of 2017, was below the proportionate budget estimate by 43.7 per cent, but 26.1 per cent above the level in the corresponding period of 2016. The shortfall relative to the proportionate budget estimate reflected the decline in both oil and non-oil revenue.
The Federal Government retained revenue, at N1,226.37 billion or 2.4 per cent of GDP, was 54.5 and 6.1 per cent below the proportionate budget estimate and the level in the corresponding period of 2016, respectively. The aggregate expenditure of the Federal Government in the first half of 2017 amounted to N1,842.11 billion or 3.5 per cent of GDP and, was 52.5 per cent below the proportionate budget estimate. The decrease, relative to the proportionate budget estimate was attributed, largely, to low capital releases in the review period owing to revenue short-fall and the late passage of the 2017 appropriation bill.
Recurrent and capital expenditure constituted 88.2 and 2.9 per cent, respectively, while statutory transfers accounted for the balance of 8.9 per cent of the total. The fiscal operations of the Federal Government in the first half of 2017 resulted in an estimated overall deficit of N615.74 billion or 1.2 per cent of GDP, compared with the proportionate budget estimate and the corresponding period of 2016, at N1,110.97 billion and N676.47 billion, respectively. The deficit was financed, mainly, from domestic sources.
The Federal Government consolidated debt stock at end-March 2017 was N16,201.29 billion or 15.6 per cent of GDP, representing an increase of 11.4 per cent over the level at end-December 2016. Domestic debt accounted for N11,971.34 billion or 73.9 per cent, while the external debt amounted to N4,229.95 billion (US$13.81 billion) or 26.1 per cent of the total. The external debt of US$13.81 billion or 4.1 per cent of GDP remained within sustainable threshold of 40.0 per cent of GDP.
THE FISCALSECTOR

xxvi
THE REALSECTOR
CBN Economic Report for the First Half of 2017
The real sector continued to grapple with the challenges arising from binding infrastructure deficit, especially power supply. Data from the National Bureau of Statistics (NBS) showed that the gross domestic product (GDP), at 2010 constant basic prices, recorded a growth of 0.55 per cent in the second quarter of 2017, but contracted by 2.1 per cent in the corresponding period of 2016. The development reflected the effect of gradual increase in aggregate demand, improved production in the agricultural and manufacturing sectors, and the impact of government's effort to address infrastructure challenges. The agricultural sector recorded positive growth on account of favourable weather conditions, sustained effort at s t rengthen ing domest ic p roduct ion th rough the implementation of the Agriculture Promotion Policy Framework, especially, the CBN sponsored Anchor Borrower Programme and strong commitment to economic diversification. Notable activities to promote growth in the industrial sector included: constitution of the Presidential Industrial Policy and Competitiveness Advisory Council, to drive the nation's industrialisation agenda; commencement of the construction of US$100.00 million gas turbine assembly plant in Cross River State, to support development of gas reserve and improve gas supply to thermal power plants; and continuation of the power sector privitisation process.
There was improvement in the Nigerian oil and gas industry, mainly, on account of ongoing peace deal in the Niger Delta. Consequently, average daily crude oil production was 1.62 million barrels per day (mbd) or 293.2 million barrels (mb), an increase of 0.07 mbd or 4.5 per cent above the 1.55 mbd or 285.2 mb in the preceding half of 2016. The average spot price of Nigeria's reference crude, the Bonny Light, increased by 7.4 and 28.8 per cent to US$52.19 per barrel, above the levels in the preceding and the first halves of 2016, respectively. The price increase was attributed to the continued cooperation between OPEC and non-OPEC producers on production cut.
The general price level decelerated in the first half of 2017 due, mainly, to moderation in non-food prices arising from stability of the naira exchange rate. The all-items composite Consumer Price Index (CPI) stood at 234.2 (November 2009=100), compared with 213.6 and 201.7 at end-December and end-June 2016, respectively. The year-on-year headline inflation declined consistently throughout the review period from 18.7 per cent in January to 16.1 per cent at end-June 2017, compared with 18.6 and 16.5 per cent at end-December and end-June 2016, respectively.

xxvii
The moderation of pressure in the external sector continued in the first half of 2017, as reflected in significant improvement in the overall balance of payments position and further accretion to the external reserve on account of increased price and domestic production of crude oil amidst gradual recovery in the emerging markets. The development reflected the effect of trade surplus in the goods account due to improved crude oil price and export, and higher net-surplus in current transfer occasioned by increased inflow of workers' remittances which more than offset the deficits in both the services and income accounts.
The capital and financial account recorded a net acquisition of financial assets equivalent to 0.2 per cent of GDP compared with 7.4 per cent in the corresponding period in 2016. The stock of external reserves rose to US$30.64 billion at end-June 2017, enough to finance 12.3 months of current level of import of goods and 8.5 months of goods and services. The increased resort to heterodox demand management policies by the Bank in the first half of 2017 had significant positive impact on the Nigerian Foreign Exchange Market. Enhanced supply of foreign exchange to meet the needs of different categories of end-user, direct disbursement and mandatory time frame for banks to meet foreign exchange demand at the retail segment resulted in significant appreciation of the naira exchange rate, especially at the BDC segment and narrowed the arbitrage premium.
EXTERNALSECTOR
CBN Economic Report for the First Half of 2017
OUTLOOKFOR THE REST
OF 2017
Global GDP was projected to grow at 3.5 per cent in 2017 as the gradual pick-up in global economic activities and recovery is expected to continue. Growth in the advanced economies was also marked-up to 2.0 per cent from 1.7 per cent in 2016 due, largely, to expected stronger consumer demand, investment and trade. In the euro area, growth was projected at 1.9 per cent in 2017, compared with 1.8 per cent in 2016. Growth projections in Britain, Japan, Spain, Italy were revised downwards on account of weaker-than-expected activities in the first quarter of 2017.
Growth in emerging and developing economies was projected to rise to 4.6 per cent in 2017, driven, mainly, by the bottoming-out of economic recession in some countries and firming up of commodity prices. Growth in India was projected to rise to 7.2 per cent in 2017, above 7.1 per cent in 2016, owing to higher government spending. In Brazil, growth was projected to rebound to 0.3 per cent in 2017, from a contraction of 3.6 per cent in 2016, due to expected moderate recovery in commodity prices and upswing in economic activity.

Growth in the Middle East and North Africa (MENA) region was projected to decelerate to 2.6 per cent in 2017, from 5.0 per cent in 2016, reflecting slowdown in oil exports and political crisis in a number of countries in the region. Also, continued weakness in oil prices if sustained, could weigh further on the outlook for the region.
In sub-Sahara Africa, growth, was projected to rise to 2.7 per cent in 2017, predicated on gradual rise in commodity prices and sustained implementation of reforms to address macroeconomic imbalances. The growth was expected to be driven by recovery in South Africa and Nigeria. Growth in South Africa was projected at 1.0 per cent in 2017, from 0.3 per cent in 2016.
The outlook for Nigeria's economy for the rest of the year signals moderate improvement premised, largely, on expected fiscal expansion, slowdown in inflationary pressure and increase in non-oil receipts. The cautious optimism was against the backdrop of persistent structural imbalances and sluggish recovery of the global economy. The downward trend in inflationary pressure was projected to continue into the rest of 2017 as the Bank deepens implementation of measures to curb exchange rate pass through and moderate pressure on domestic prices.
The outlook for the real sector in the remaining half of 2017 is largely optimistic. Government's commitment to the implementation of the Economic Recovery and Growth Plan (ERGP) and improvement of the stock, and quality of infrastructure is expected to increase domestic production as well as moderate unemployment rate. In addition, CBN interventions in critical sectors, further progress in government's effort to enhance the ease of doing business and sustain effort to stem insurgency in the North East as well as maintain the peace deal in the Niger Delta would improve the macroeconomic environment and facilitate increased real sector productivity.
On the fiscal side, the passage of the 2017 appropriation bill, realisation of revenue target and targeted expenditure, particularly capital releases to address infrastructure deficits would stimulate economic activities. Also, the Paris Club Refund would assist state governments to settle accumulated salaries and pension arrears. Overall, these developments would provide the necessary fiscal stimulus for the economy and boost aggregate demand and output.
xxviii
CBN Economic Report for the First Half of 2017
OUTLOOKFOR THE REST
OF 2017
xxix
CBN Economic Report for the First Half of 2017
The impressive performance of the external sector is expected to continue into the rest of the year, premised on increased crude oil price, production and export in 2017. Sustained peace deal in the Niger Delta region, would provide favourable condition in the near-term for stability in production. In addition CBN's commitment to provide the required liquidity in the foreign exchange market would support domestic production. The non-expansionary monetary policy stance of the Bank would sustain the downward trend in inflationary pressure and enhance the prospect of achieving exchange rate and price stability.
OUTLOOKFOR THE REST
OF 2017

xxxi
CBN Economic Report for the First Half of 2017
Indicator Jun-11 Jun-12 Jun-13 Jun-14 Jun-15 Jun-16 Jun-17 2/
Domestic Output and Prices
GDP* at Current Mkt Prices (N' billion) 29,915.91 34,643.40 38,671.86 42,339.35 44,323.45 46,172.76 53,451.00
GDP* at Current Mkt Prices (US$' billion) 195.26 219.75 245.84 269.17 234.06 227.68 174.73
GDP* per Capita (N) 364,399.54 410,384.72 445,488.95 474,345.55 483,040.83 489,480.84 551,195.02
GDP* per Capita (US$) 2,378.42 2,603.16 2,832.02 3,015.65 2,550.81 2,413.69 1,801.88
Real GDP** Growth (Growth Rate %) 6.62 3.79 4.94 6.38 3.14 -1.08 -0.18
Oil Sector 17.31 -9.19 -13.77 -1.23 -7.49 -8.15 -7.47
Non-oil Sector 4.68 6.43 8.18 7.44 4.50 -0.29 0.58
Sectoral Classification of GDP** (Growth Rate %)
Agriculture 2.58 6.36 2.52 4.55 4.07 3.84 3.19
Industry 16.14 -0.96 -0.85 5.90 -4.88 -6.93 -3.16
Construction 3.82 24.17 13.96 13.99 8.67 -5.83 0.14
Trade 6.78 1.61 5.91 5.71 5.77 0.99 -2.36
Services 3.27 4.90 8.82 7.21 5.56 -1.04 0.41
Oil Production (mbd) 2.14 2.09 1.99 1.91 1.89 1.68 1.62
Manufacturing Capacity Utilisation (%) 55.73 57.03 57.60 59.30 *** *** ***
Inflation Rate (%) (Year-over-Year) 10.23 12.89 8.35 8.17 9.17 16.48 16.10
Inflation Rate (%) (12-month moving average) 12.32 11.32 10.38 8.00 8.42 11.37 17.58
Core Inflation Rate (%) (Year-over-Year) 3/ 11.52 15.20 5.47 8.12 8.40 16.22 12.46
Core Inflation Rate (%) (12-month moving average) 5/ 12.10 12.73 10.70 7.37 7.01 10.86 16.22
Federal Government Finance (% of GDP*)
Retained Revenue 4.37 5.49 5.07 4.44 3.57 2.83 4.69
Total Expenditure 6.55 6.39 6.14 5.03 5.10 5.45 5.40
Recurrent Expenditure 5.17 4.48 4.43 3.80 4.23 4.08 5.01
Of which: Interest Payments 0.75 0.89 1.01 1.13 1.34 1.32 1.74
Foreign 0.07 0.06 0.08 0.09 0.08 0.07 0.10
Domestic 0.68 0.83 0.93 1.04 1.26 1.25 1.63
Capital Expenditure and Net Lending 1.01 0.84 1.29 0.83 0.62 0.75 0.00
Transfers 0.36 1.06 0.42 0.39 0.25 0.62 0.39
Current Balance (Deficit(-)/Surplus(+)) -0.80 1.01 0.64 0.64 -0.65 -1.26 -0.32
Primary Balance (Deficit(-)/Surplus(+)) -1.42 -0.01 -0.06 0.54 -0.19 -1.30 1.03
Overall Fiscal Balance (Deficit(-)/Surplus(+)) -2.17 -0.90 -1.07 -0.58 -1.53 -2.62 -0.71
Financing 2.42 0.90 1.07 0.58 1.53 2.62 0.71
Foreign 0.25 0.00 0.00 0.00 0.00 0.00 0.00
Domestic 2.17 0.90 1.07 0.58 1.53 2.62 0.71
Banking System 0.00 0.00 0.00 0.00 0.00 0.00 0.00
Non-bank Public 1.59 0.59 1.35 1.19 0.74 1.14 0.00
Others 0.58 0.31 -0.27 -0.61 0.78 1.49 0.71
Consolidated Government Debt Stock 9.48 10.14 10.25 10.49 11.76 14.94 15.56
External 1.30 1.26 1.39 1.72 2.29 3.45 4.31
Domestic 8.18 8.88 8.86 8.76 9.47 11.49 11.26
Selected Macroeconomic and Social Indicators 1/

xxxii
CBN Economic Report for the First Half of 2017
Selected Macroeconomic and Social Indicators 1/ (Cont...)
Indicator Jun-11 Jun-12 Jun-13 Jun-14 Jun-15 Jun-16 Jun-17 2/
Money and Credit ( Growth Rate %)
Reserve Money 11.88 -9.77 -12.64 -5.97 0.25 -7.58 -6.29
Narrow Money (M1) 1.18 -2.54 -6.49 -2.88 -5.25 11.05 -9.59
Broad Money (M2) 5.61 1.35 0.71 3.08 -0.54 10.23 -6.83
Net Foreign Assets -0.81 5.37 1.34 -9.49 -14.42 25.69 -7.45
Net Domestic Assets 13.94 -3.31 -0.18 18.55 7.54 4.14 -6.44
Net Domestic Credit 2.32 -1.01 3.55 3.26 11.08 13.93 1.41
Net Credit to Government 5.22 -63.15 -3.63 -19.16 118.79 9.66 7.69
Credit to Private Sector 1.30 3.65 3.57 4.88 4.26 14.59 0.02
Money Multiplier for M2 5.89 5.37 4.82 3.38 3.16 4.11 4.01
Income Velocity of M2 4.92 5.14 4.96 5.24 4.71 4.18 4.86
Interest Rates (% per annum)
Monetary Policy Rate (MPR) 4/ 8.00 12.00 12.00 12.00 13.00 12.00 14.00
Repurchase Rate
Reverse Repurchase Rate
Treasury Bill Rate
91-day 8.20 14.08 11.60 9.98 9.95 8.32 13.50
Inter-bank Call Rate 11.15 14.92 11.59 10.50 10.85 35.26 13.46
Deposit Rates
Savings Rate 1.40 1.76 2.04 3.42 3.60 3.61 4.08
3-months Fixed 5.14 7.80 7.49 9.30 10.27 6.92 9.01
6-months Fixed 5.26 8.08 7.07 9.52 10.81 6.59 10.68
12-months Fixed 4.68 7.51 5.32 9.19 10.83 5.17 11.15
Prime Lending Rate 15.76 16.93 16.56 16.50 17.24 16.78 17.59
Maximum Lending Rate 22.02 23.44 24.58 26.07 26.84 26.93 30.94
External Sector
Current Account Balance (% of GDP*) 6.28 2.63 4.50 1.12 -3.25 -0.29 2.37
Goods Account 11.11 7.88 9.48 5.02 -1.19 -1.19 2.50
Services and Income Account -10.32 -10.05 -9.30 -7.94 -6.08 -3.46 -5.96
Current Transfers 5.50 4.80 4.32 4.04 4.01 4.36 5.82
Capital and Financial Account Balance (% of GDP*) -1.24 0.67 0.47 0.87 1.63 0.12 3.25
Overall Balance (% of GDP*) -0.29 1.27 0.48 -2.04 -2.50 -0.68 1.87
External Reserves (US $ million) 31,890.91 35,412.50 44,957.00 37,330.03 28,335.21 26,505.50 30,340.96
Number of Months of Import Equivalent 6.46 6.36 9.86 7.19 6.11 8.14 11.11
Debt Service Due (% of Exports of Goods and Services)
Average Crude Oil Price (US$/barrel) 113.86 115.05 110.29 111.29 58.54 40.51 52.19
Average AFEM/DAS Rate (N/$1.00)+ 153.21 157.65 157.30 157.29 189.37 202.79 305.90
End of Period AFEM/DAS Rate (N/$1.00) 153.31 157.50 157.31 157.29 196.95 283.00 305.72
Average Bureau de Change Exchange Rate (N/$) 156.95 161.22 159.66 169.50 213.55 325.00 366.00
End of Period Bureau de Change Exchange Rate (N/$) 159.00 164.00 162.00 168.00 225.50 348.00 366.25
Capital Market
All Share Value Index (1984=100) 24,980.20 21,599.57 36,164.31 42,482.48 33,456.83 29,597.79 33,117.48
Value of Stocks Traded (Billion Naira) 373.50 468.17 1,110.38 579.98 557.13 313.25 376.77
Market Capitalization (Trillion Naira) 11.20 12.40 17.43 14.03 11.42 9.79 11.45
Social Indicators
Population (million) 164.19 168.83 173.62 178.52 183.52 188.66 193.95
Population Growth Rate (%) 2.80 2.81 2.80 2.80 2.80 2.80 2.80
Life Expectancy at Birth (Years) *** *** *** *** *** *** ***
Adult Literacy Rate (%) *** *** *** *** *** *** ***
Incidence of Poverty 5/ *** *** *** *** *** *** ***
1/ Revised
2/ Provisional
3/ Core Inflation is measured as the rate of change of all-item Consumer Price Index (CPI) less farm produce.
4/ MPR replaced MRR with effect from December 11, 2006.
5/ The incidence of poverty in Nigeria was projected to increase from 65.6 per cent in 1996 to 70.0 per cent in 2000.
However, the result of a Nigeria Living Standard Survey of 2003/2004 from NBS (former FOS),
showed that the incidence of poverty declined to 54.4 per cent in 2003/2004.
The Interbank exchange rate became the reference official rate since February 19, 2015.
*Figures and computations are based on nominal GDP at market prices.
**Figures and computations are based on nominal GDP by production, comprising 44 activity sectors.
*** indicates not available

CENTRAL BANK OF NIGERIA
REPORT FOR THE FIRST HALF OF 2015
1.0 INTRODUCTION
In the first half of 2017, the Nigerian economy witnessed a confluence of global and
domestic headwinds, including constrained fiscal space owing to lower crude oil
receipts and heightened monetary policy divergence in the advanced economies,
such as policy normalisation by the US Fed and excess liquidity in the banking system.
These developments intensified the demand pressure in the foreign exchange market,
thereby impacting domestic prices and economic activity. Accordingly, the Bank
retained its non-expansionary monetary policy stance to rein in inflationary pressure and
encourage capital inflow. The Bank also introduced key reforms in the foreign exchange
market, notably the special Investors' and Exporters' (I&E) Window, to improve foreign
exchange supply from autonomous sources. Monetary targeting remained the
framework for monetary management, with the monetary policy rate (MPR) as the
anchor for short-term money market rates.
Open Market Operations (OMO) remained the Bank's key liquidity management
instrument, complemented by reserve requirements, repurchase agreements, standing
facilities and discount window operations.
Table 1Monetary Policy Benchmarks and Outcomes
(Growth in % except otherwise stated)
1
CBN Economic Report for the First Half of 2017
Key Variables Dec 2015 Jun 2016 Dec, 2016 Jun 2017
Be
nc
hm
ark
Ou
tco
me
Be
nc
hm
ark
Ou
tco
me
Be
nc
hm
ark
Ou
tco
me
Be
nc
hm
ark
Ou
tco
me
Broad Money (M2)
15.24
5.9
11.0
10.2 11.0 16.8 10.3 -7.3
Narrow Money (M1)
9.9
24.4
11.3
11.1 11.3 29.1 11.0 -10.7
Base Money (Reserve)
16.8
-2.0
13.2
-7.6 13.2 0.6 11.4 -6.1
Aggregate credit to the domestic economy (Net)
29.3
12.1
17.9
13.9 17.9 23.3 17.9 1.0
Credit to Government (Net) 36.0 152.0 47.4 9.7 47.43 61.4 33.1 5.9
Credit to the private sector 26.1 3.3 13.4 14.6 13.4 17.4 14.9 -0.02
Inflation rate 8.00 9.6 11.9 16.5 11.9 18.6 10.7 16.1
Real GDP 7.24 3.6 -2.1 3.6 -1.3 4.1 0.55
Source: CBN
2.0 OPERATIONS OF THE CENTRAL BANK OF NIGERIA
2.1 Liquidity Management
In the first half of 2017, the monetary policy environment was shaped by a number of
global and domestic headwinds. These included: lower crude oil receipts which strained
fiscal space, monetary policy divergence in the advanced economies, demand
pressure in the foreign exchange market, excess liquidity in the banking system as well as
recession. The Bank's response included the adoption of non-standard monetary policies
and measures. Consequently, the Bank retained its monetary tightening stance to
achieve the objectives of monetary and price stability. It also deployed a combination of
policy tools to ensure effective liquidity management and stimulate economic recovery.
Open Market Operations (OMO) remained the Bank's key liquidity management
instrument, complemented by reserve requirements, repurchase agreements, standing
facilities and discount window operations.
The MPR was retained at 14.0 per cent with an asymmetric corridor of +200/-500 basis
points at the January, March and May 2017 MPC meetings. The Cash Reserve Ratio (CRR)
and Liquidity Ratio (LR) were also retained at 22.5 and 30.0 per cent, respectively.
Reserve money stood at N5,489.64 billion at end-June 2017, indicating declines of 6.1 and
7.6 per cent below its level in the preceding and corresponding periods of 2016. The Bank
also introduced key innovations in the foreign exchange market, notably a special
Investors' and Exporters' Window, to improve foreign exchange supply from autonomous
sources.
2.2 Monetary Policy Committee (MPC) Decisions
The Monetary Policy Committee held three (3) meetings in the review period. A summary
of the key decisions were as follows:
2
CBN Economic Report for the First Half of 2017

3
2.3 Developments in the Payments System The Bank continued to accord priority to the safety and efficiency of the payments system in Nigeria. To this end, it sustained the implementation of the following initiatives:
2.3.1 Payments System Initiatives
2.3.1.1 The Bank Verification Number (BVN) SchemeTo consolidate on the gains achieved on the BVN scheme, the Bank/Federal Government initiated the following: Draft Regulatory Framework for BVN Operations and Watch-list for the Nigerian
Financial System; Extension of BVN scheme to Other Financial Institutions (OFIs), to avoid broken
identity link in the banking system. It is required that by end-July 2017, all customers of OFIs should have BVN. Any customer of OFIs without a BVN would not be allowed to initiate a debit transaction on his/her account; and
Set up a Committee on Identity Management and Harmonisation of data, to integrate identity data including the BVN captured by different organisations. The Committee agreed on minimum data standards, minimum data fields and resolved issues on the NIN-BVN harmonisation process.
At end-June 2017, the BVN Project had 29,565,684 registered customers with BVNs and 40,676,362 accounts linked with the BVN platform out of 62,615,344 active customer accounts.
CBN Economic Report for the First Half of 2017
Table 2Monetary Policy Committee Decisions During the First Half of 2017
Source: Central Bank of Nigeria MPC Communiqués
Date of
Meeting
Type of
Meeting
Decisions
January 2 3
and 24, 2017
Regular
·
Retained the MPR at 14.0 per cent;
·
Retained the CRR at 22.5
per cent;
·
Retained the LR
at 30.0
per cent; and·
Retained the asymmetric corridor at +200/ -500 basis points
around the MPR.
March 20
and 21, 2017 Regular § Retained the MPR at 14.0 per cent;
§ Retained the CRR at 22.5 per cent; § Retained the LR at 30.0 per cent; and§ Retained the asymmetric corridor at +200/ -
500 basis points around the MPR.
May 22 and 23, 2017
Regular § Retained the MPR at 14.0 per cent; §
Retained the CRR at 22.5
per cent;
§
Retained the LR
at 30.0
per cent; and§
Retained the asymmetric corridor at +200/ -500 basis points around the MPR.
4
2.3.1.2 Nigeria Electronic Fraud Forum (NeFF) The NeFF organised a 2-day workshop on Cybercrime from May 30 - 31, 2017 in Abuja, with the theme, “Tackling Enforcement Challenges under the Cybercrime Act”. The workshop provided an opportunity for the Central Bank of Nigeria, financial institutions, the Ministry of Justice, law enforcement agencies, the Military and other stakeholders, to brainstorm and engage the law enforcement community on the best ways to implement the Cybercrime Act. 2.3.1.3 Migration from Merchant Service Charge (MSC) to Interchange Fee RegimeThe plan to migrate the Nigerian payment card industry from the use of merchant service charge (MSC) to Interchange Fee Regime with effect from May, 2017 was suspended to enable stakeholders to resolve all the issues relating to the migration.
2.3.1.4 Cheque Standards and Cheque Printers Accreditation SchemeThe draft of the revised Nigeria Cheque Standards, meant to enhance the efficiency and safety of cheque clearing system, was exposed to key stakeholders in the industry. Notable changes in the revised version included: introduction of quick response (QR) code for faster verification of cheque details; expiry date of printed cheque booklet; and clear zone at the back of the cheque.
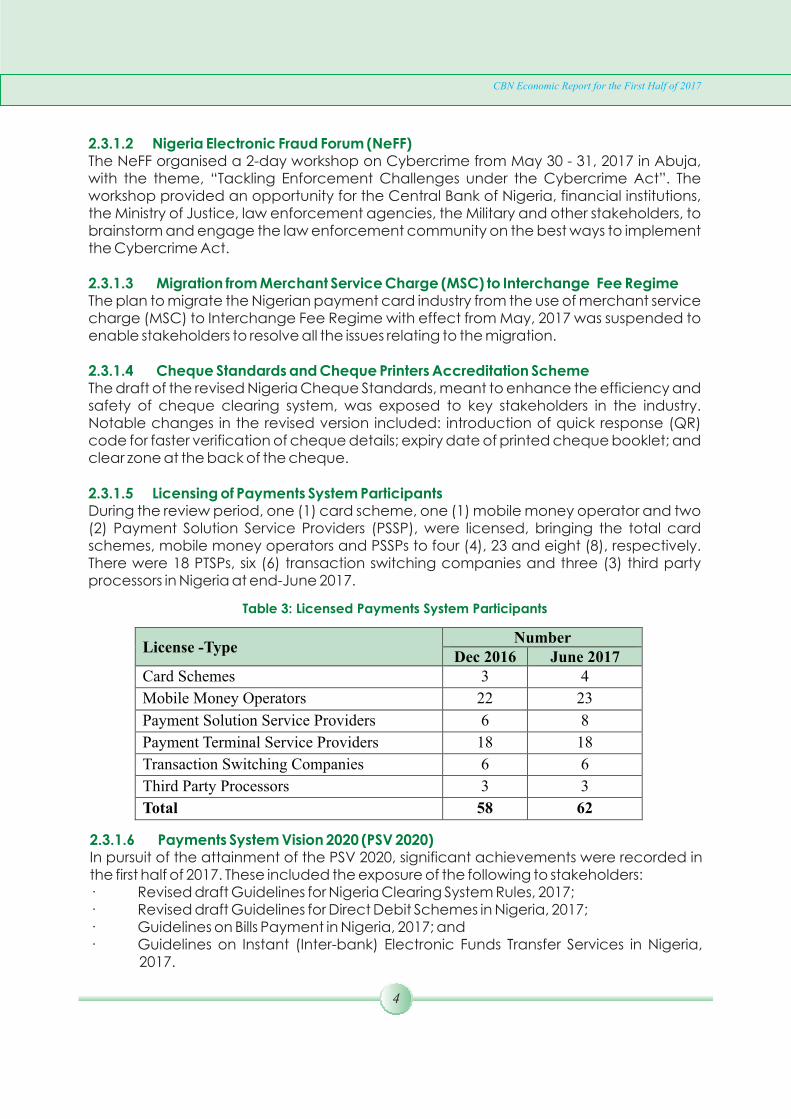
2.3.1.5 Licensing of Payments System ParticipantsDuring the review period, one (1) card scheme, one (1) mobile money operator and two (2) Payment Solution Service Providers (PSSP), were licensed, bringing the total card schemes, mobile money operators and PSSPs to four (4), 23 and eight (8), respectively. There were 18 PTSPs, six (6) transaction switching companies and three (3) third party processors in Nigeria at end-June 2017.
CBN Economic Report for the First Half of 2017
Table 3: Licensed Payments System Participants
License -Type Number
Dec 2016 June 2017
Card Schemes 3 4
Mobile Money Operators 22 23
Payment Solution Service Providers 6 8 Payment Terminal Service Providers 18 18 Transaction Switching Companies 6 6 Third Party Processors 3 3 Total 58 62
2.3.1.6 Payments System Vision 2020 (PSV 2020)In pursuit of the attainment of the PSV 2020, significant achievements were recorded in the first half of 2017. These included the exposure of the following to stakeholders: · Revised draft Guidelines for Nigeria Clearing System Rules, 2017;· Revised draft Guidelines for Direct Debit Schemes in Nigeria, 2017;· Guidelines on Bills Payment in Nigeria, 2017; and· Guidelines on Instant (Inter-bank) Electronic Funds Transfer Services in Nigeria,
2017.

5
CBN Economic Report for the First Half of 2017
Also, to deepen the use of electronic payments, the following activities were undertaken:· Developed the “Smart Cities Policy Framework and Leadership Paper”;· Developed the draft “Framework for The Adoption of Electronic Payments in The
Education Ecosystem”; · Developed the draft “Strategies for the Adoption of Electronic Payments for
Transport Services in Nigeria”;· Reviewed the RTGS Rules and Regulations;· Defined the point at which settlement is final and irrevocable for four major
payments schemes in Nigeria - RTGS, Card, Mobile and ACH/Cheque/Instant Payment Schemes. This is in compliance with Principle 8 of the BIS Principles for Financial Market Infrastructures (PFMI) on Settlement Finality; and
· Reviewed the current collateral management framework for the operations of deferred net settlement systems and recommended phased approach for migration from fixed collateral requirement to a risk-based collateral requirement, among others.
2.3.2 Retail Payments System
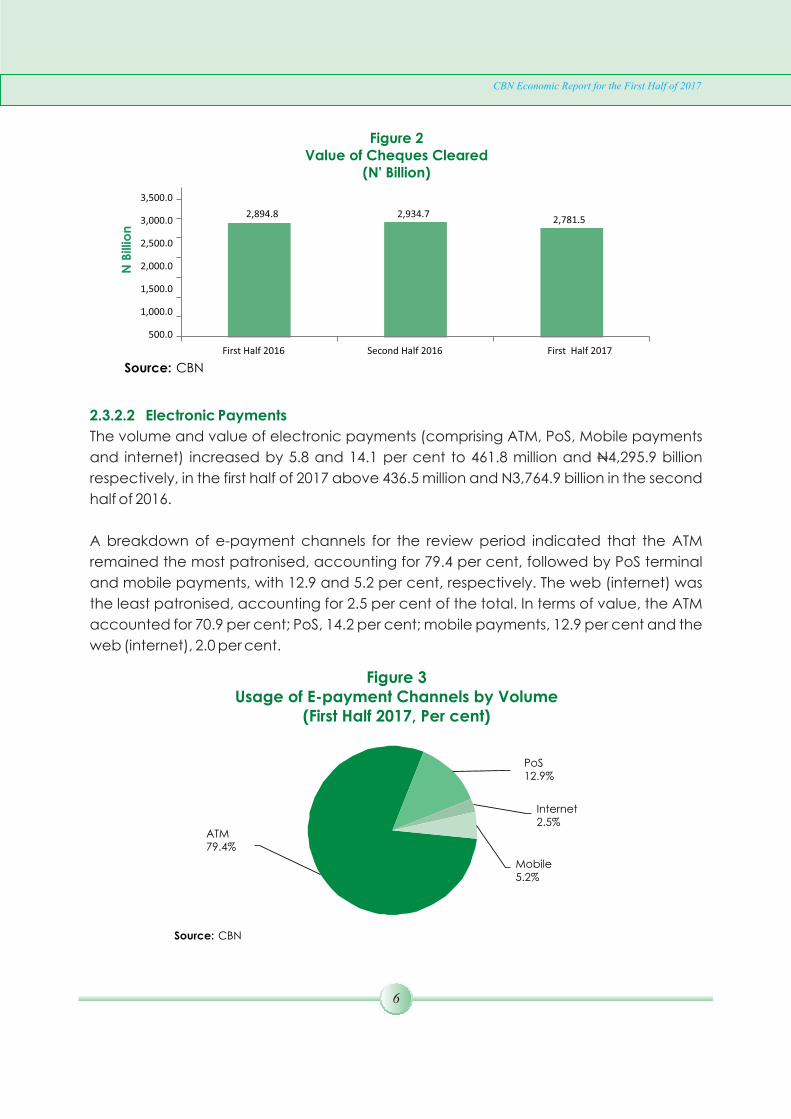
2.3.2.1 Cheque The volume and value of cheques cleared decreased by 14.5 and 5.2 per cent to 5.3 million and 2,781.5 billion in the first half of 2017 from 6.2 million and 2,934.7 billion in the N Nsecond half of 2016. The decrease was attributed to consumers growing preference for the use of elecronic payments.
Figure 1Volume of Cheques Cleared
(Million)
Source: CBN
7.0
6.0
5.0
4.0
5.7
6.2
5.3
6
CBN Economic Report for the First Half of 2017
Figure 2Value of Cheques Cleared
(N' Billion)
Source: CBN
3,500.0
3,000.0
2,500.0
2,000.0
1,500.0
1,000.0
500.0
2,894.8 2,934.72,781.5
First Half 2016 Second Half 2016 First Half 2017
N B
illio
n
2.3.2.2 Electronic Payments
The volume and value of electronic payments (comprising ATM, PoS, Mobile payments
and internet) increased by 5.8 and 14.1 per cent to 461.8 million and N4,295.9 billion
respectively, in the first half of 2017 above 436.5 million and N3,764.9 billion in the second
half of 2016.
A breakdown of e-payment channels for the review period indicated that the ATM
remained the most patronised, accounting for 79.4 per cent, followed by PoS terminal
and mobile payments, with 12.9 and 5.2 per cent, respectively. The web (internet) was
the least patronised, accounting for 2.5 per cent of the total. In terms of value, the ATM
accounted for 70.9 per cent; PoS, 14.2 per cent; mobile payments, 12.9 per cent and the
web (internet), 2.0 per cent.
Figure 3Usage of E-payment Channels by Volume
(First Half 2017, Per cent)
Source: CBN
ATM 79.4%
PoS12.9%
Internet 2.5%
Mobile 5.2%

7
CBN Economic Report for the First Half of 2017
Figure 4Usage of E-payment Channels by Value
(First Half 2017, Per cent)
Source: CBN
PoS 14.2%
Mobile 12.9%
Internet 2.0%
ATM70.9%
Figure 5Volume of Electronic Payments
(Million)
Source: CBN
500.0
400.0
300.0
200.0
100.0
-
314.6
436.5461.8
Figure 6Value of Electronic Payments
(N'Billion)
Source: CBN
5,000.0
4,000.0
3,000.0
2,000.0
1,000.0
-
N B
illio
n
N B
illio
n
2,871.5
3,7644,295.9
First Half 2016 Second Half 2016 First Half 2017
First Half 2016 Second Half 2016 First Half 2017

2.3.2.2.1 ATM Transactions
The number of ATMs stood at 17,712 at end-June 2017 from 17,083 in the corresponding
period of 2016, representing a slight increase of 3.7 per cent. ATM transactions increased
in both volume and value by 40.4 and 38.2 per cent to 366.8 million and N3,046.3 billion
respectively, in the first half of 2017, above 261.2 million and N2,204.5 billion in the
corresponding period of 2016, respectively.
8
CBN Economic Report for the First Half of 2017
Figure 7Volume of ATM Transactions
(Million)
Source: CBN
Mill
lion
400.0
350.0
300.0
250.0
200.0
150.0
100.0
50.0
-
First Half 2016 Second Half 2016 First Half 2017
Figure 8Value of ATM Transactions
(N' Billion)
Source: CBN
3,500.0
3,000.0
2,500.0
2,000.0
1,500.0
1,000.0
500.0
-
2,204.5
2,783.73,046.3
First Half 2016 Second Half 2016 First Half 2017
Mill
lion

2.3.2.2.2 Web Transactions
The volume and value of internet transactions increased by 113.0 and 44.3 per cent, to
11.5 million and N83.7 billion, respectively, in the first half of 2017 above 5.4 million and
N58.0 billion in the corresponding period of 2016. The rise was due largely to increased
awareness and acceptance of internet payment.
9
Figure 9Volume of Web Transactions
(Million)
CBN Economic Report for the First Half of 2017
Source: CBN
14.0
12.0
10.0
8.0
6.0
4.0
2.0
-
5.4
8.7
11.5
Figure 10Value of Web Transactions
(N'Billion)
Source: CBN
100.0
80.0
60.0
40.0
20.0
-
58.0
74.483.7
First Half 2016 Second Half 2016 First Half 2017
First Half 2016 Second Half 2016 First Half 2017
N’
Bill
lion
Mill
lion
2.3.2.2.3 Point of Sale (PoS) Transactions
The number of PoS terminals in operation increased by 3.4 per cent to 125,608 at end-
June 2017 above 121,488 in the corresponding period of 2016. The PoS transactions
increased significantly both in volume and value by 134.8 and 97.8 per cent to 59.4 million
and N610.1 billion respectively, above 25.3 million and N308.5 billion in the corresponding
period of 2016. The rise in PoS transactions in both volume and value was due to
increased public confidence and acceptance of the terminal.

2.3.2.2.4 Mobile Payments
The volume and value of mobile payments increased by 6.6 and 83.1 per cent to 24.2
million and N555.8 billion, respectively, in the first half of 2017 above 22.7 million and
N303.5 billion, in the corresponding period of 2016. The rise was due to continued
acceptance of mobile payments as an alternative and conveniant mode of payment.
10
CBN Economic Report for the First Half of 2017
Figure 11Volume of PoS Transactions
(Million)
Source: CBN
First Half 2016 Second Half 2016 First Half 2017
70.0
60.0
50.0
40.0
30.0
20.0
10.0
-
25.3
38.4
59.4
Mill
lion
Figure 12Value of PoS Transactions
(N'Billion)
Source: CBN
N’
Bill
lion
700.0
600.0
500.0
400.0
300.0
200.0
100.0
-
308.5
450.5
610.1
First Half 2016 Second Half 2016 First Half 2017

11
Figure 13Volume of Mobile Transactions
(Million)
CBN Economic Report for the First Half of 2017
Source: CBN
24.5
24.0
23.5
23.0
22.5
22.0
21.5
Mill
ion
22.7
24.324.2
First Half 2016 Second Half 2016 First Half 2017
Figure 14Value of Mobile Transactions
(N' Billion)
Source: CBN
600.0
500.0
400.0
300.0
200.0
100.0
-
303.5
453.4
555.8
NB
illio
n
First Half 2016 Second Half 2016 First Half 2017
2.3.3 Wholesale Payments System
2.3.3.1 Real Time Gross Settlement (RTGS) System
The volume and value of inter-bank transfers through the RTGS System (CBN Inter-bank
Funds Transfer System - CIFTS) increased by 14.6 per cent and 10.5 per cent to 625,788 and
N202,664.0 billion respectively, in the first half of 2017. This was above the 546,283 and
N183,365.0 billion recorded in 2016. The increase was attributed to the bulk upload of
government payments through the System.

12
2.3.3.2 Nigeria Inter-bank Settlement System Instant Payment (NIP)
The volume and value of the NIBSS Instant Payment transactions increased significantly
by 167.3 and 49.7 per cent to 150.5 million and N24,491.2 billion respectively, in the first half
of 2017 above the 56.3 million and N16,365.0 billion in the corresponding period of 2016.
The increase was attributed to users' preference for its quick transfer capacity.
Figure 15Volume of RTGS Transactions
(Million)
CBN Economic Report for the First Half of 2017
Source: CBN
640,000.0
620,000.0
600,000.0
580,000.0
560,000.0
540,000.0
520,000.0
500,000.0
546,283.0
612,843.0625, 788.0
Mill
ion
First Half 2016 Second Half 2016 First Half 2017
Figure 16Value of RTGS Transactions
(N' Billion)
Source: CBN
205,000.0
200,000.0
195,000.0
190,000.0
185,000.0
180,000.0
175,000.0
170,000.0
NB
illio
n

13
CBN Economic Report for the First Half of 2017
Figure 17Volume of NIP Transactions
(Million)
Source: CBN
160.0
140.0
120.0
100.0
80.0
60.0
40.0
20.0
-
56.3
97.3
150.5
First Half 2016 Second Half 2016 First Half 2017
Figure 18Value of NIP Transactions
(N'Billion)
Mill
ion
NB
illio
n
Source: CBN
30,000.0
25,000.0
20,000.0
15,000.0
10,000.0
5,000.0
-
First Half 2016 Second Half 2016 First Half 2017
2.3.3.3 Nigeria Interbank Settlement System Electronic Fund Transfer (NEFT)
During the review period the volume of NEFT transactions decreased slightly by 0.7 per
cent to 12.9 million from 13.0 million in the first half of 2016. The value, however, increased
by 21.6 per cent to N7,050.3 billion from N5,799.4 billion.

Source: CBN
Figure 19Volume of NEFT Transactions
(Million)
14
CBN Economic Report for the First Half of 2017
Source: CBN
15.0
10.0
5.0
-
13.012.3
12.9
First Half 2016 Second Half 2016 First Half 2017
Figure 20Value of NEFT Transactions
(N'Billion)8,000.0
7,000.0
6,000.0
5,000.0
4,000.0
3,000.0
2,000.0
1,000.0
-
NB
illio
n
Mill
ion
First Half 2016 Second Half 2016 First Half 2017
5,799.46,655.6
7,050.3
2.3.4 CURRENCY OPERATIONS
2.3.4.1 Issuance of the Legal Tender
The Bank approved an indent of 2,674.49 million, an increase of 28.6 per cent or 595.46
million above the 2,079.03 million pieces of banknotes ordered in the preceding year to
meet the currency needs of the economy in 2017. The Nigerian Security Printing and
Minting (NSPM) Plc was awarded the entire indent order. The NSPM Plc delivered 987.17
million pieces or 36.9 per cent of the total, compared with 715.54 million pieces or 34.4 per
cent in the corresponding period of 2016. Also, 34.40 million pieces of the N100 centenary
commemorative banknotes were delivered in the period, out of the total of one billion

15
CBN Economic Report for the First Half of 2017
awarded to Crane Currency, Sweden in 2014. This brought total delivery of the
centenary commemorative banknotes to 934.09 million pieces or 93.4 per cent,
leaving a balance of 65.91 million pieces or 6.6 per cent.
In line with the clean notes policy, the Bank continued the processing of banknotes into
fit for re-circulation and unfit/soiled notes for disposal. Consequently, the Bank
produced a draft manual on Banknote Fitness Standards to assist the public and
currency stakeholders identify banknotes fit for re-circulation and those to be
withdrawn from circulation. A total of 1,548.27 million pieces valued at N798.86 billion
were processed and re-injected into circulation, while 1,382.85 million pieces of unfit
banknotes were withdrawn through banknotes accelerated processing activities. The
thrust of the accelerated processing was to reduce banks' deposit processing cycle
time to six months from the hitherto two to five years cycle. Similarly, the Bank withdrew
a total of 32,176 pieces of counterfeit banknotes from circulation during the review
period. To maintain a sustainable disposal of banknote waste, the Bank solicited
proposals from eligible companies to facilitate a recycling arrangement that would
convert polymer banknote waste into plastic products for industrial and household use.
In the review period, the Bank intensified effort at improving cash management in
Nigeria, by organising a stakeholders' retreat from April 27-28, 2017 in Lagos. The retreat
ratified the draft clean note policy, banknote fitness standard and adopted a tiered
pricing model for depositing unprocessed lower denomination banknotes. The model
would prevent the re-circulation of dirty banknotes and incentivise the banks to
deposit the lower denomination banknotes in their vaults. In addition, the Bank
sustained public awareness campaigns on the proper handling of banknotes,
identification of basic security features to deter counterfeiting, inherent dangers of the
illegal sale of new banknotes and usage of coins in the economy.
To strengthen the implementation of the Nigeria Cash Holding Scheme (NCHS), the
Bank, in collaboration with NIBSS, and other stakeholders, deployed the cash activity
reporting portal (CARP). The CARP is expected to facilitate regular cash management
data update within the banking industry and would go live on July 5, 2017. It would
serve as an interim arrangement, utilising NIBBS capacity, pending the deployment of
an Integrated Cash Management Platform (ICMP) that would provide online data
services.
2.3.4.2 Currency-in-Circulation (CIC)
Currency-in-circulation at end-June 2017 stood at N1,873.54 billion, representing an
increase of 11.2 per cent over the corresponding period of 2016. There were 6,176.26

16
CBN Economic Report for the First Half of 2017
Table 4Structure of CIC
2013
Volume Value Volume Value Volume Value Volume Value Volume Value
(million) (N billion) (million) (N billion) (million) (N billion) (million) (N billion) (million) (N billion)
N2 107.68 0.22 107.49 0.21 107.54 0.22 203.41 0.22 107.65 0.22
N 1 616.25 0.62 616.37 0.62 638.87 0.64 734.88 0.62 616.56 0.62
*50k 579.50 0.29 579.77 0.29 579.93 0.29 680.47 0.29 580.13 0.29
*25k 347.80 0.09 348.23 0.09 348.23 0.09 348.25 0.09
*10k 315.31 0.03 315.55 0.03 296.04 0.03 315.65 0.03
*1k 16.70 0.0002 31.24 0.00 31.24 0.00 31.37 0.0003
Sub Total 1,983.24 1.25 1,998.65 1.24 2,001.85 1.26 2,314.03 1.25 1,304.34 1.12
Notes
N1000 954.72 954.72 1,055.14 1,055.14 951.51 951.51 985.13 985.13 1,119.84 1,119.84
N500 599.75 599.88 617.86 308.93 894.52 447.26 1,018.04 511.03 1,058.29 529.15
N200 449.90 89.98 229.86 45.97 367.46 73.49 372.32 76.47 501.11 100.22
N100 286.20 28.62 300.12 30.01 388.25 38.83 546.88 56.70 718.89 71.89
N50 433.07 21.65 516.55 25.83 304.66 15.23 358.30 19.92 397.88 19.89
N20 1,125.14 22.50 1,065.56 21.31 1,169.85 23.40 1,109.93 24.21 1,061.20 21.22
N10 463.81 4.64 612.53 6.13 703.59 7.04 744.93 7.45 722.92 7.23
N5 455.03 2.28 516.72 2.58 906.92 4.53 514.65 2.57 596.13 2.98
Sub-Total 4,767.62 1,724.27 4,914.34 1,495.90 5,686.76 1,561.29 5,650.18 1,683.48 6,176.26 1,872.42
Total 6,750.86 1,725.52 6,912.99 1,497.14 7,688.61 1,562.55 7,964.21 1,684.73 7,480.60 1,873.54
* Note: 1k, 10k, 25k and 50k that were minted in 1991 have been de-monetized by the Management of the Bank
Source: Planning & Logistics Office
Table 2 :Currency Structure, 2013 - June 2016
Jun-17201620152014
Coins
million pieces of banknotes and 1,304.34 million pieces of coins valued at N1,872.24 billion
and N1.12 billion, respectively, in circulation at end-June 2017. Thus, total currency in
circulation declined in value by 6.1 per cent, while the volume increased by 11.2 per cent
over the level in the corresponding period of 2016.
In terms of composition, the combined number of N5, N10, N20 and N50 banknotes as
share of total currency in circulation in the first half of 2017 increased to 37.1 per cent,
compared with 34.3 per cent in the first half of 2016. The value, however, decreased to 2.7
per cent from 3.2 per cent in the corresponding period of 2016. At end-June 2017, the
N1,000, N500, N200, N100, N50 and N5 banknotes in circulation rose by 13.7, 4.0, 34.6, 31.5,
11.0 and 15.8 per cent, respectively. The N20 and N10 denominations, however, fell by 4.4
and 3.0 per cent, respectively, below the levels in the first half of 2016. The N1,000 and
N500 banknotes were dominant with shares of 59.8 and 28.3 per cent, respectively, in
value terms in the first half of 2017.
348.23
315.56
31.24
0.09
0.03
0.0003

17
CBN Economic Report for the First Half of 2017
2.4 Financial Sector Surveillance
2.4.1 Banking Supervision
The Bank continued its supervision and surveillance of the banking system in the first half
of 2017 to sustain the safety and soundness of financial institutions and ensure a stable
financial system. The activities included regular off-site review of banks' returns and
periodic on-site examination (routine monitoring and special investigations) of the level
of compliance with the provisions of extant laws, regulations and guidelines.
The Bank also deployed the redesigned Credit Risk Management System (CRMS) for
commercial, merchant and non-interest banks and issued revised regulatory guidelines
for the system in the review period. The redesigned system eliminates most of the manual
processes, expands the capacity to capture details of all loans (regardless of amount)
and improves overall efficiency of the process towards ensuring financial system stability.
The CRMS remained a valuable platform for the management of credit information in the
banking industry.
At end-June 2017, the number of registered borrowers in the CRMS database was
824,387, compared with 195,159 in the corresponding period of 2016. The significant rise
was due to increased enforcement and the capture of all loans, regardless of amount, as
against only loans of N1.0 million and above. There were 755,076 individuals and 69,311
corporate borrowers at end-June 2017.
Similarly, the number of borrowers with outstanding facilities rose significantly to 1,105,671
at end-June 2017, compared with 104,126 and 93,168 at end-December 2016 and end-
June 2016, respectively. Following the issuance of stricter guidelines, improved
compliance by banks and the capture of historical data on hitherto unreported credit,
the total number of credit facilities on the database rose to 1,905,997, compared with
181,987 at end-December 2016 and 173,050 at end-June 2016, respectively. The number
comprised 1,513,452 individual and 392,545 corporate borrowers.

18
CBN Economic Report for the First Half of 2017
1 Figures include borrower(s) with multiple loans and/or credit lines.
Source: CBN
Figure 21Credit Risk Management System (CRMS) Statistics
(End-June 2017)
No of Registered Borrowers No of Credits
195,159 93,168 173,050 147,828104,126181,987
824,387
1,105671
1905997
The three (3) existing private credit bureaux (PCB) continued to complement the CRMS in
credit administration and risk management process in the industry. Following stricter
enforcement, increased surveillance, awareness campaign on credit bureaux and
collateral registry as well as adoption of the unique identifier, there was sustained
improvement in the operations of the bureaux during the first half of 2017.
2.4.2 Routine/Target Examination
The CBN/NDIC Joint Risk based assessment of banks was conducted in February, 2017 to
ascertain the quality of risk assets and adequacy of loan loss provisioning required for the
approval of publication of their 2016 annual financial statements. Report of the exercise
was being finalised. Similarly, pre-examination preparations for the first stage of the
annual CBN/NDIC Joint Risk-Based Examination of fourteen (14) banks and the three (3)
financial holding companies, as at 30 June, 2017, was concluded in the first half of 2017.
The risk-based examinations of the banks were scheduled to commence at the
beginning of the second half of 2017, while that of the remaining nine (9) banks, was
scheduled to commence in October 2017, for the period ended September 30, 2017.
The Bank conducted routine examination of the three (3) private credit bureaux in the
first half of 2017. Similarly, the target examination of the Asset Management Corporation
of Nigeria (AMCON) was conducted in the review period. Also, the Bank, in collaboration
with the host supervisors, conducted the routine examination of two (2) Nigerian banks'
foreign subsidiaries. The reports of these examinations were being finalised.
End-June, 2016 End-Dec, 2016 End-June, 2017

19
Following the successful completion of the special training code-named “iSight Project”,
for on-site Examiners, the Bank intensified preparation towards the deployment of the
Electronic Line cards software. The software would provide the platform for accurate
evaluation of banks' credit, digital repository of banks' credit performance records and
fast-tracking the process of on-site appraisal of banks' risk assets. The software would be
test-run during the RBS examination at the beginning of the second half of 2017.
2.4.3 Special/Foreign Exchange Examinations
The first of the bi-annual review of the foreign exchange activities of 25 banks (21
commercial banks and 4 merchant banks) was conducted in April 2017 to ascertain the
level of compliance with extant foreign exchange laws and regulations. The review
covered foreign exchange operations for the period, October 1, 2016 to March 31, 2017.
Major infractions observed were: non-compliance with regulations such as the
concessionary rates specifically provided for utilisation of funds sourced from the CBN
Secondary Market Intervention Sales (SMIS) foreign exchange window; and non-
issuance of certificate of capital importation (CCI) to beneficiaries within the allowable
time of 24 hours post receipt of funds. Others included non-repatriation of export
proceeds within the regulated time frame; incorrect rendition of returns to the CBN; non-
compliance with approved Net Foreign Currency Trading Limit Positions; and lapses in
foreign trade documentation. The reports of the examinations were being finalised for
appropriate actions in line with the extant laws and regulations. The Bank also conducted
several ad-hoc investigations in the review period. The reports of the exercises were
provided as input to the policy development process.
2.4.4 Banking Sector Soundness
At end-June 2017, the industry average capital adequacy ratio (CAR) was 11.5 per cent,
compared with 14.8 per cent and 14.7 per cent at end-December 2016 and end-June
2016, respectively. The decline in the ratio was due, mainly, to the reduction in banks'
total qualifying capital arising from the absorption of impairment on non-performing
loans and the increase in risk weighted assets following the depreciation of the naira. The
industry threshold, however, remained at 15.0 per cent for banks with international
authorisation and 10.0 per cent for banks with either national or regional authorisation.
Asset quality of the banking industry, measured by the ratio of non-performing loans to
total loans - NPL ratio - deteriorated further to 15.0 per cent at end-June 2017, compared
with 12.8 per cent and 10.7 per cent at end-December 2016 and end-June 2016,
respectively. It remained significantly above the regulatory threshold of 5.0 per cent. The
increase in the NPL ratio reflected further deterioration in asset quality on account of the
adverse macroeconomic conditions – and the poor performance of three outlier banks.
CBN Economic Report for the First Half of 2017

20
To address this, banks were required to intensify efforts at debt recovery, realisation of
collateral for lost facilities and strengthening of risk management processes. Loan loss
provision was 80.4 per cent at end-June 2017, as against 66.0 per cent in the
corresponding period of 2016.
The industry liquidity ratio increased from 42.6 per cent at end-June 2016 to 45.8 per cent
at the end of the first half of 2017. The rise reflected the increase in the stock of liquid assets
held by banks. With the exception of three (3) commercial banks, all other banks met the
minimum regulatory liquidity ratios of: 30.0 per cent for commercial banks; 20.0 per cent
for merchant banks; and 10.0 per cent for non-interest banks at end-June 2017.
2.4.5 Compliance with the Code of Corporate Governance for Banks
As part of the initiatives to further entrench good corporate governance practices in the
banking industry, the CBN developed a Corporate Governance Scorecard, to monitor
implementation of the Code by banks. The scorecard assesses the extent of banks'
compliance with the extant Code in respect of board and management activities,
disclosure and transparency, treatment of shareholders and stakeholders, risk
management, ethics and professionalism. The different aspects of the scorecard were
assigned weights based on perceived importance.
The scorecard seeks to achieve the following objectives:
· Provide uniform basis for assessment of the status of implementation of the code of
corporate governance principles at individual bank and industry level;
· Facilitate determination of improvement needs and encourage banks to achieve
higher standards;
· Encourage banks to develop internal corporate governance compliance
assessment systems to engender a process of continual improvement towards the
enhancement of their corporate governance reporting to stakeholders;
· Enhance the efficiency and sustainability of good governance practices in the
banking industry;
· Facilitate comparisons among the banks in the industry; and
· Aid banks identify shortcomings in the implementation process and serve as a
catalyst to initiate remedial plans.
Following the launch of the scorecard in March 2017, a pilot run was conducted on 10
banks for all the categories of licences. The key findings were:
· General absence of a unit or department for the implementation of banks'
approved strategy document. In addition, three (3) banks did not have an
approved strategy document, while some of the available ones were not robust
and comprehensive; and
CBN Economic Report for the First Half of 2017

21
· All the banks complied with the requirements of the code on “size of the board”,
“separation of duties” and “disclosure and transparency”, while 13 banks
complied with the requirements on “ethics and professionalism” and “rights of
other stakeholders”.
Overall, two banks failed to comply with the requirements of the Code on: composition of
the board; board meetings; holding company and subsidiary cross directorship;
succession planning; remuneration policy; limits of authority; and risk management.
The CBN also conducted examination of sixteen (16) banks using the Scorecard to
ascertain the level of compliance with good governance practices, while the remaining
banks would be examined in the second half of the year. The exercise was expected to
enhance the supervisory mechanisms and form the basis for further policy formulation in
the banking industry.
2.4.6 Financial Crimes Surveillance/Anti- Money Laundering/Combating the Financing
of Terrorism (AML/CFT)
The Bank conducted an AML/CFT compliance examination of twenty-five (25) reporting
banks. The examination, which covered the period May 1, 2016 to March 31, 2017, was
conducted at the Head offices of the banks. In addition, spot checks were carried out on
two selected Lagos branches of the banks. The examination was guided by the statutory
provisions of the Money Laundering Prohibition Act, 2011 (as amended), the CBN's
AML/CFT Regulations 2013 and recommendations of the Financial Action Task Force
(FATF). The exercise revealed a number of shortcomings in the following areas:
· Customer Due Diligence (CDD): copies of identification documents such as
International passports and national identification cards were not in some
customer's files, while enhanced due diligence (EDD) was either not conducted
or inadequately conducted on high risk customers;
· AML/CFT Reporting software: Collation and reporting of foreign currency
transactions, currency transactions reports and suspicious transaction reports
were not fully automated in some banks. Similarly, the AML/CFT software in some
banks had not been subjected to independent testing to determine their
efficacy, thereby exacerbating the risk of under reporting;
· Verification of Customers' Identities: Apart from the inability to validate the
identities through the National Identity Management Commission and Nigeria
Customs Service portals, the banks complained of the mandatory levy imposed
by the agencies. It was, however, expected that the platform being developed
by the CBN and NIBBS in collaboration with other agencies would address the
complaints;
CBN Economic Report for the First Half of 2017

22
· AML/CFT Manuals/Programmes: The AML/CFT Manuals/programmes in some
banks did not highlight policies to address specific issues such as Shell banks and
evaluation of new technologies for AML/CFT risks, among others;
· Audit of the AML/CFT Function: There were instances of inadequate internal
control oversight over the compliance function as recommended by FATF and
required by the CBN AML/CFT Regulations; and
· Training: AML/CFT knowledge gap existed in many banks. In addition, some banks
were unable to provide satisfactory evidence of undertaking the required
training.
Overall, there was general improvement in the AML/CFT regime of many banks as
reflected in the general reduction in the level of infractions.
In the review period, the Bank reached an advanced stage in the development and
deployment of the AML/CFT Data Rendition, Analysis and Processing Software-
(ADRAPS). The software will facilitate accurate collation, analysis and storage of data
through the automation of banks' AML/CFT returns collation and analysis. It will also
provide a platform for effective off-site surveillance and easy access to data for decision
making purposes.
Following the release of the circular on “Need to Implement Measures to Dissuade the
Issuance of Dud Cheques in the Nigerian Banking System”, banks commenced the
rendition of returns on dud cheques on the CRMS platform in the first half of 2017. The
process was expected to facilitate the collation and analysis of data on serial issuers of
dud cheques and enable the banks take steps to curb the practice.
2.4.7 Financial Literacy and Consumer Protection
Subsequent to the deployment of the Consumer Complaints Management System
(CCMS), the Bank continued to facilitate and promote increased user adoption among
internal customers and banks. It also intensified effort to address the initial challenges of
implementation.
The Bank received 1,141 complaints from consumers of financial services in the first half of
2017, compared with 1,473 complaints received in the corresponding period of 2016. The
complaints were in respect of excess/unauthorised charges, frauds, account
management, funds transfers, ATM dispense errors and dishonored guarantees. A total of
1,270 complaints including those outstanding from 2016, were resolved or closed in the
period, compared with 1,157 complaints resolved in the corresponding period of 2016.
CBN Economic Report for the First Half of 2017

23
CBN Economic Report for the First Half of 2017
Total claims in the review period n local and foreign currencies amounted to N14.72
billion, US$2.42 million and €6,940.00, compared with N6.75 billion, US$81,023.00 and
€19,414.62 in the corresponding period of 2016. The sum of N7.21 billion, US$2.40 million
and €6,940.00 were refunded by financial institutions to their customers as against the
sum of N4.63 billion, US$80,415.46 and €19,263.62, refunded in the corresponding period
of 2016. In addition, the Bank held twelve (12) mediation meetings in the review period
to facilitate the resolution of customer complaints, while seven (7) banks were penalised
for various infractions.
Compliance Examination was conducted on 19 banks in April 2017 to ascertain their
level of compliance with selected provisions of the Revised Guide to Bank Charges
(RGBC) and the consumer protection regulations. The exercise revealed the following
levels of compliance in the areas examined: maximum fees applied on facilities (50.0%);
insurance charges applied on facilities (66.67%); management of dormant accounts
(55.6%); and compliance with directives issued after the last examination & other
directives (52.63%). Areas with dismal compliance levels included, alignment of internal
policies with the consumer protection framework which recorded 0.0 per cent and
outstanding complaints with 26.2 per cent compliance level. Accordingly, the Bank
directed non-compliant banks to implement specific remedial actions, including
refunds to customers where applicable.
As part of the steps to facilitate the implementation of the consumer protection
framework, the Bank exposed the draft guidelines on two principles of the Framework to
stakeholders for comments. The guidelines were in respect of the principles of “Fair
Treatment of Consumers” and “Disclosure & Transparency”.
In continuation of financial literacy activities, the Bank conducted a train-the-trainer
programme, under the NYSC Peer Educator Training Initiatives, at the CBN International
Training Institute (ITI), Maitama, Abuja from February 13 - 17, 2017. The objective of the
programme was to acquaint participants with the knowledge of various financial
literacy concepts and equip them with the skills to transfer the knowledge to the general
public. Participants at the training included representatives from the Federal Ministry of
Youth & Sports Development, Nigeria Deposit Insurance Corporation (NDIC),
Association of non-Bank Micro Finance Institutions of Nigeria (ANMFIN) and the National
Pension Commission (PENCOM).
The pilot phase of the National Youth Service Corps (NYSC) Peer Educator Programme
was held in conjunction with the Federal Ministry of Youth and Sports Development and

24
CBN Economic Report for the First Half of 2017
other stakeholders. The Programme was held at the NYSC orientation camps in twelve (12)
states, namely: Sokoto, Kano, Taraba, Gombe, Plateau, Kwara, Lagos, Oyo, Abia,
Anambra, Edo and Rivers States from May 29 to June 2, 2017. Thirty-five (35) volunteer corps
members and five (5) NYSC staff were trained. The corp members were expected to share
the knowledge acquired with their peers and other members of the general public in their
places of primary assignments, while the NYSC staff would serve as coordinators.
Similarly, the CBN conducted the second pilot run of the targeted financial literacy
programme for Micro, Small and Medium Enterprises at the CBN Awka branch.
Participants were drawn from the Small and Medium Enterprises Development Agency of
Nigeria (SMEDAN), development finance office of CBN Awka branch, non-governmental
organisations (NGOs), women organisations, farmer groups and other stakeholders.
In collaboration with other stakeholders, the Bank celebrated the 2017 Global Money
Week from March 27 to April 2, 2017. Activities to commemorate the event included
Global Money Walk, Financial Literacy Fair/Exhibition and School Mentoring and Reach-
out Programme. A total of 1,696 students across 11 schools were reached through the
various activities to commemorate the 2017 Global Money Week. The CBN also
collaborated with the Bankers' Committee to implement the school mentoring
programme in 36 states. Various school mentoring initiatives were organised for 85,233
students in 626 schools nationwide. In addition, the CBN, in conjunction with the Nigeria
Educational Research and Development Council (NERDC), developed a draft Teachers'
Guide for teaching financial education in basic and senior secondary schools.
2.4.8 Fraud and Forgeries
There were 16,762 reported cases of fraud and forgeries (attempted and successful),
involving N5.52 billion and US$ 0.124 million, compared with 9,164 cases involving N4.36
billion in the corresponding period of 2016. This indicated respective increase of 82.9 and
19.3 per cent above the number and value of cases (attempted and successful) in the first
half of 2016. The actual loss by banks, however, decreased by 43.5 per cent to N0.78 billion
and US$0.03 million, below the N1.38 billion incurred in the first half of 2016. The marked
decline in the actual losses to the banking industry indicated the effect of stronger internal
control measures adopted by the banks, improved use of technology and more thorough
approach in hiring employees for sensitive areas of operation.
Similar to the preceding half-year, fraud and forgeries reported in the review period were
perpetrated, mainly, by outsiders (non-bank staff), although there were instances
involving banks' employees. The fraud cases included pilfering of cash, suppression and
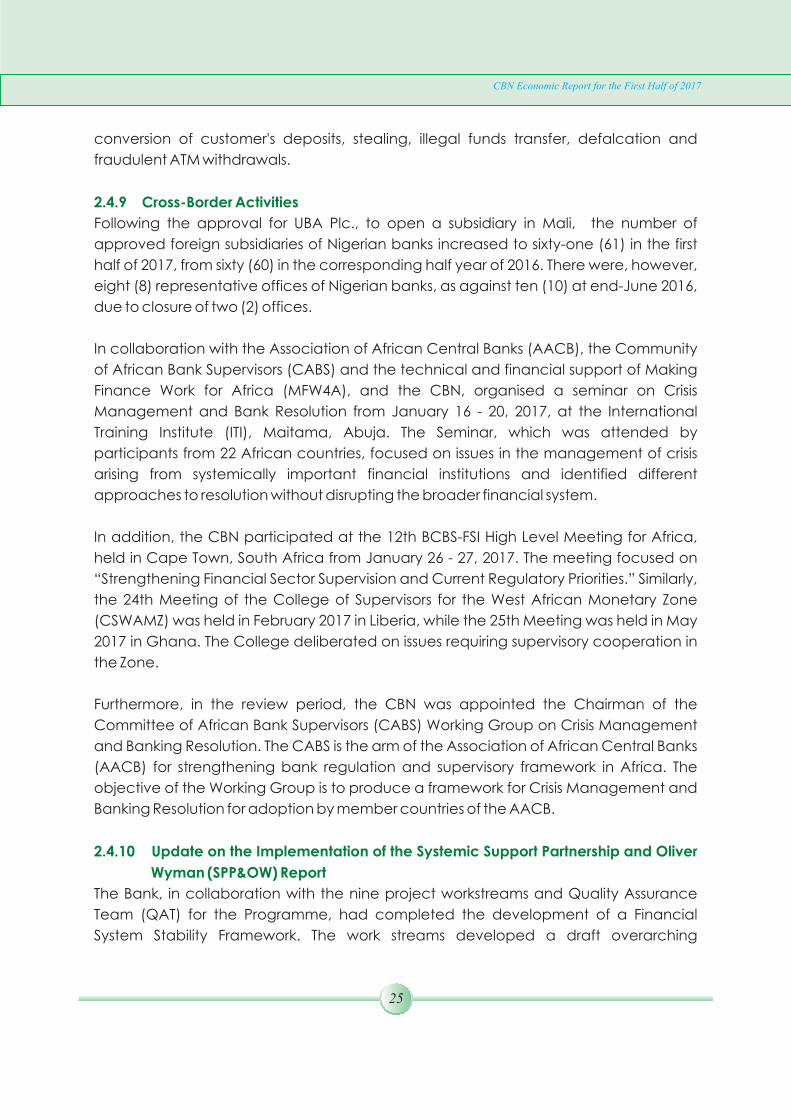
25
CBN Economic Report for the First Half of 2017
conversion of customer's deposits, stealing, illegal funds transfer, defalcation and
fraudulent ATM withdrawals.
2.4.9 Cross-Border Activities
Following the approval for UBA Plc., to open a subsidiary in Mali, the number of
approved foreign subsidiaries of Nigerian banks increased to sixty-one (61) in the first
half of 2017, from sixty (60) in the corresponding half year of 2016. There were, however,
eight (8) representative offices of Nigerian banks, as against ten (10) at end-June 2016,
due to closure of two (2) offices.
In collaboration with the Association of African Central Banks (AACB), the Community
of African Bank Supervisors (CABS) and the technical and financial support of Making
Finance Work for Africa (MFW4A), and the CBN, organised a seminar on Crisis
Management and Bank Resolution from January 16 - 20, 2017, at the International
Training Institute (ITI), Maitama, Abuja. The Seminar, which was attended by
participants from 22 African countries, focused on issues in the management of crisis
arising from systemically important financial institutions and identified different
approaches to resolution without disrupting the broader financial system.
In addition, the CBN participated at the 12th BCBS-FSI High Level Meeting for Africa,
held in Cape Town, South Africa from January 26 - 27, 2017. The meeting focused on
“Strengthening Financial Sector Supervision and Current Regulatory Priorities.” Similarly,
the 24th Meeting of the College of Supervisors for the West African Monetary Zone
(CSWAMZ) was held in February 2017 in Liberia, while the 25th Meeting was held in May
2017 in Ghana. The College deliberated on issues requiring supervisory cooperation in
the Zone.
Furthermore, in the review period, the CBN was appointed the Chairman of the
Committee of African Bank Supervisors (CABS) Working Group on Crisis Management
and Banking Resolution. The CABS is the arm of the Association of African Central Banks
(AACB) for strengthening bank regulation and supervisory framework in Africa. The
objective of the Working Group is to produce a framework for Crisis Management and
Banking Resolution for adoption by member countries of the AACB.
2.4.10 Update on the Implementation of the Systemic Support Partnership and Oliver
Wyman (SPP&OW) Report
The Bank, in collaboration with the nine project workstreams and Quality Assurance
Team (QAT) for the Programme, had completed the development of a Financial
System Stability Framework. The work streams developed a draft overarching
26
framework and stand-alone frameworks on the three component policy areas of
microprudential supervision policy, macroprudential policy and analytical capabilities,
and crisis management and resolution. The supporting frameworks were also developed
on data gathering and storage capabilities, IT infrastructure, stakeholder engagement
and human capital development. The Framework covers major areas of microprudential
supervision policy, macroprudential policy and analytical capabilities, and crisis
management and resolution. To provide legal backing and facilitate operationalisation
of the programme, a draft bill and overarching memorandum of understanding (MoU),
legal/legislative advocacy plan and implementation roadmap for the establishment of
the proposed Nigeria Financial System Stability Council were also developed. The
frameworks had been scheduled for review and approval by the Programme Steering
Committee (PSC), made up of the CEOs of member agencies of the Financial Services
Regulation Coordinating Committee.
2.4.11 Examination of Other Financial Institutions
The Bank conducted on-site examinations of 282 Other Financial Institutions (OFIs) in the
first half of 2017. The exercise involved routine risk-based examination and review of the
institutions' compliance with extant AML/CFT guidelines. Routine risk-based examination
of the five (5) reporting development finance institutions (DFIs) was conducted in the
review period. The examination reports revealed that the Composite Risk Rating of four
(4) institutions was High and one (1) “Moderate”. Earnings of one (1) institution was rated
“acceptable”, one (1) “needs improvement” and three (3) “weak”, arising, mainly, from
significant deterioration in asset quality and high provisions for loan losses. The
Development Bank of Nigeria (DBN) was not examined because it was yet to commence
operations.
Similarly, risk-based examination of 226 microfinance banks (MFBs) was conducted in the
first half of 2017. The prudential analyses of the reports were being finalised for
appropriate regulatory interventions. In addition, risk-based examination of 51 finance
companies (FCs) was conducted in the review period. The exercise excluded 21 FCs
awaiting CBN Board's final approval for revocation of licence. The reports of the
examinations were being finalised for Management approval.
2.5 Foreign Exchange Market and Management
In the first half of 2017, the CBN sustained its intervention in the foreign exchange market
to dampen demand pressure and stabilise the naira exchange rate. The Bank, on
February 20, 2017, introduced a weekly sale of foreign exchange for personal travel
allowance (PTA), business travel allowance (BTA), school fees and medicals to end-users
CBN Economic Report for the First Half of 2017

27
at N375.00/1US$ through banks. On April 21, 2017, the Bank established a special window
to cater for the foreign exchange needs of investors and exporters. Other measures
adopted included the admittance of more BDCs for foreign exchange sales and
increase in the amount of weekly sales to the bureaux. These initiative boosted liquidity in
the foreign exchange market, eased demand pressure, and narrowed the premium
between the interbank and BDC rates from 61.6 per cent at end-January 2017 to 19.8 per
cent at end-June 2017.
Also, on April 18, 2017, the CBN introduced Form 'Q' through which SMEs could purchase
US$20,000 per quarter with the objective of improving access to foreign exchange to
import eligible finished and semi-finished goods for production. In a bid to reassure the
market of continued availability of foreign exchange, the sale of short tenored forwards
of 7-45 day was upheld. The foreign exchange market was further liberalised on June 5,
2017 by allowing authorised dealers to sell their excess foreign currency trading limit
positions without seeking prior approval from the CBN.
2.5.1 Spot Segment of the Foreign Exchange Market
The cumulative sales of foreign exchange by the Bank in the first half of 2017 was US$9.84
billion, increases of 22.8 and 26.1 per cent against the levels in the second and first halves
of 2016. The aggregate foreign exchange supply to the inter-bank and BDC segments in
the review were US$4.01 billion and US$1.20 billion as against US$5.60 billion and US$0.02
billion, respectively, in the first half of 2016. This indicated a decline of 28.4 per cent in total
sales to the inter-bank but, a substantial increase to the BDC segment, compared with
the levels in the corresponding period of 2016. The observed decline in the inter-bank
sales was attributed to the Bank's policy to prioritise foreign exchange access to the
preferred sectors.
2.5.2 Forwards and Swaps
Swaps undertaken in the review period were valued at US$0.20 billion, compared with
US$3.10 billion and US$2.19 billion in the second and first halves of 2016, respectively. The
significant reduction in the value of swaps reflected the increased confidence in the
market. This accounted for 2.0 per cent of the total supply of foreign exchange. The value
of cash-backed forward contracts disbursed at maturity was US$4.43 billion, and
accounted for 45.0 per cent of the total, compared with US$4.17 billion in the preceding
period.
CBN Economic Report for the First Half of 2017

28
CBN Economic Report for the First Half of 2017
Figure 22Demand, Supply and Net Demand of Foreign Exchange
(US$' Billion)
Source: CBN
2.5.3 Exchange Rate Movements
The exchange rate of the naira to the US dollar during the review period was stable both
at the inter-bank and BDC segments of the foreign exchange market. The development
was attributed to increased supply into the Market and the creation of the Investors' and
Exporters' Foreign Exchange (I&E FX) window that reduced the market demand pressure
by facilitating market-driven transactions and catered for the foreign exchange needs of
investors and exporters.
2.5.3.1 Spot Exchange Rates
The average exchange rate of the naira to the US dollar at the inter-bank segment was
N305.70/US$, representing a depreciation of 0.5 and 33.9 per cent relative to the levels in
the second and first halves of 2016, respectively. At the BDC segment, the naira
depreciated by 1.3 and 23.8 per cent, compared with the values in the preceding and
the corresponding halves of 2016, respectively, to N426.85/US$. Consequently, the
premium between the average interbank/BDC rates widened to 39.6 per cent in the first
half of 2017 from 38.4 per cent in the second half of 2016.
The end-period exchange rate of the naira to the US dollar at the inter-bank segment was
N305.90/US$, against N305.00/US$ at end-December 2016 and N283.00/US$ at end-June
2016. At the BDC segment, the naira exchange rate was N366.00/US$, compared with
N490.00/US$ at end-December 2016 and N348.00/US$ at end-June 2016, while the I&E
exchange rate closed at N366.44/US$ at end-June 2017.
7,805.34
5,599.84
2,190.00
-
15.50
8,013.00
704.76
3,097.65
4,167.66
46.31
9,839.01
4,011.98
198.68
4,426.19
- 2,000.00 4,000.00 6,000.00 8,000.00 10,000.00 12,000.00
Interbank
Swaps
Forwards
1st half '2017 2nd half '2016 1st half '2016

29
CBN Economic Report for the First Half of 2017
Figure 23Exchange Rate Movements
(First Half 2015 – First Half 2017) (N/US$)
Source: CBN
600.00
500.00
400.00
300.00
200.00
100.00
0.00
Interbank BDC
Figure 24Interbank/Bureau-de-Change Foreign Exchange (N/US$) Premium
(Per cent)
Source: CBN
2.5.4 Foreign Exchange Flows
Aggregate foreign exchange inflow into the economy in the first half of 2017 was
US$34.82 billion, indicating an increase of 3.7 and 20.0 per cent above the levels in the
second and first halves of 2016, respectively. Of the total, inflow through autonomous
sources at US$18.95 billion accounted for 54.4 per cent, while inflow through the CBN was
US$15.87 billion and accounted for 45.6 per cent. Aggregate foreign exchange outflow
Pe
r c
en
t
80.0
70.0
60.0
50.0
40.0
30.0
20.0
10.0
0.0
N/U
SS
Interbank/BDC Premium 5% International Benchmark
30
CBN Economic Report for the First Half of 2017
from the economy rose by 1.5 and 16.7 per cent to US$13.88 billion above the levels in the
second and first halves of 2016, respectively. Consequently, the net foreign exchange
flow to the economy was US$20.94 billion, as against US$19.90 billion and US$17.12 billion,
in the second and first halves of 2016, respectively.
Foreign exchange inflow through autonomous sources at US$18.95 billion in the first half of
2017, showed a decline of 10.8 and 7.7 per cent, compared with US$21.24 billion and
US$20.51 billion in the second and first halves of 2016, respectively. The decline was mainly
due to the 87.6 per cent reduction in external account purchases from the level in the
preceding period. A disaggregation of the inflow through autonomous sources showed
that, invisible purchases accounted for US$17.00 billion; non-oil export receipts, US$1.91
billion; and external account purchases, US$0.03 billion. Of the invisible purchases,
ordinary domiciliary accounts amounted to US$10.00 billion, and total over-the-counter
(OTC) purchase was US$7.01 billion. A further breakdown of the OTC purchases revealed
that “Others” amounted to US$2.90 billion, capital importation, US$2.82 billion; purchases
by banks from oil companies, US$0.90 billion and home remittances, US$0.39 billion.
Aggregate outflow through autonomous sources amounted to US$1.10 billion, driven
largely by invisible import, which amounted to US$0.67billion, while visible import was
US$0.32 billion. These accounted for 71.1 and 28.9 per cent, respectively, of total outflow
through autonomous sources.
At US$15.87 billion, foreign exchange inflow through the CBN rose by 28.6 and 86.9 per
cent, above their respective levels in the second and first halves of 2016. A
disaggregation of foreign exchange inflow through the Bank, showed that crude oil
receipts was US$4.30 billion, a decline of 22.8 and 1.9 per cent below the levels in the
second and first halves of 2016, respectively. Non-oil receipts through the Bank rose by
70.9 and 181.4 per cent to US$11.57 billion above the levels in the preceding and the
corresponding period of 2016, respectively. The development was attributed mainly to
the significant increase of US$1.55 billion realised from other official receipts and US$1.06
billion from foreign exchange purchases. A further breakdown of non-oil inflow through
the CBN indicated that interbank swaps was US$1.57 billion; TSA and third party receipts,
US$1.50 billion; returned payments (Wired/Cash), US$0.75 billion; unutilised funds, US$0.64
billion; “Others” (unutilised IMTO receipts), US$0.31 billion; and interest on reserves and
investments, US$0.14 billion.
Foreign exchange outflow through the CBN amounted to US$12.78 billion, indicating an
increase of 2.8 and 18.8 per cent, above the levels in the second and first halves of 2016,
respectively. This was due to the increased interventions in the interbank and BDC
segments of the foreign exchange market. Of the total outflow through the Bank,

31
interbank utilisation amounted to US$9.84 billion or 77.0 per cent. This comprised foreign
exchange forwards, US$ 4.43 billion (45.0%); inter-bank sales at US$4.01 billion (40.8%);
BDC sales, US$1.20 billion (12.2%); and swaps, US$0.20 billion (2.0%).
Outflow in respect of 'Other' official payments at US$1.47 billion declined by 44.9 and 13.5
per cent below the levels in the preceding and corresponding period of 2016. Of this,
Joint Venture Cash (JVC) calls was US$0.86 billion; parastatals, US$0.58 billion; and
estacode, US$0.007 billion. Outflow through 3rd party MDA transfers; external debt
service, drawings on letters of credit (L/Cs), Bank and SDR charges; and national priority
projects were US$0.98 billion, US$0.19 billion, US$0.18 billion, US$0.004 billion and US$0.001
billion, respectively.
CBN Economic Report for the First Half of 2017
Figure 25Foreign Exchange Disbursements through the CBN
(First Half 2017)
Overall, foreign exchange transactions through the Bank resulted in a net inflow of
US$3.10 billion in the first half of 2017, compared with a net outflow of US$2.26 billion and
US$0.09 billion, respectively in the first and second halves of 2016.
Interbank Sales32.0%
Drawings on L/Cs1.5%
3rd Party MDA transfers
7.8%External debt
service1.5%
Forex special Payments
0.5%
BDC Sales9.6%
Foreign Exchange Forwards
35.3%
Other Official Payments
11.8%
Source: CBN

32
CBN Economic Report for the First Half of 2017
Figure 26Foreign Exchange Transactions through the CBN
(First Half 2017, US$' Billion)
Source: CBN
20
15
10
5
0
-5
8.71
10.7512.35 12.42
15.87
12.78
3.10
(2.03)
(0.07)
1st Half 2016 2nd Half 2016 1st Half 2017
Inflow Outflow Netflow
2.5.5. Sectoral Utilisation of Foreign Exchange
Aggregate sectoral utilisation of foreign exchange in the first half of 2017 improved by 1.1
per cent to US$12.06 billion when compared with the level in the preceding period but
declined by 8.0 per cent below the level in the corresponding period of 2016. A
disaggregation of sectoral utilisation showed that, visible import contracted by 11.3 and
16.8 per cent to US$7.36 billion, relative to the levels in the preceding and corresponding
halves of 2016, respectively. Foreign exchange utilised for invisible import increased by
29.3 and 10.3 per cent in the second and first halves of 2016.
An analysis of foreign exchange utilisation for visible import showed that utilization by the
industrial sector increased by 11.5 per cent and accounted for US$3.27 billion in the
period under review. Food products, manufactured products, and transport sub-sectors
accounted for US$0.64 billion, US$1.04 billion and US$0.20 billion, indicating a decline of
19.1, 17.2 and 25.7 per cent, respectively, compared with the levels in the second half of
2016. Similarly, foreign exchange utilised by the agricultural sector, minerals and oil
sectors declined by 21.7, 14.1 and 27.8 per cent to US$0.12 billion, US$0.04 billion and
US$2.06 billion, respectively, compared with the levels in the second half of 2016.
A breakdown of foreign exchange utilised for invisibles showed that business services,
communications, educational, tourism and travel and financial services rose by 57.9,
217.1, 103.3, 494.6 and 15.5 per cent to US$0.56 billion, US$0.14 billion, US$0.24 billion,
US$0.04 billion and US$3.12 billion, respectively, compared with the levels in the second
half of 2016. Furthermore, foreign exchange expended on distribution services, health-
related and social services as well as “other services” increased by 236.6, 93.2 and 900.9

33
per cent to US$0.005 billion, US$0.002 billion and US$0.32 billion, respectively, relative to
the levels in the second half of 2016. Foreign exchange utilised for transport services,
however, declined by 27.0 per cent to US$0.27 billion from US$0.38 billion in the
corresponding period of 2016.
A breakdown of foreign exchange utilised for invisibles showed that business services,
communications, educational, tourism and travel and financial services rose by 12.9,
196.7, 94.9, 490.5 and 4.0 per cent to US$0.40 billion, US$0.13 billion, US$0.23 billion, US$0.04
billion and US$2.91 billion, respectively, compared with the levels in the second half of
2016. Furthermore, foreign exchange expended on distribution services, health-related
and social services as well as “other services” increased by 236.8, 79.9 and 858.5 per cent
to US$0.005 billion, US$0.002 billion and US$0.31 billion, respectively, relative to the levels in
the second half of 2016. Foreign exchange utilised for transport services, however,
declined by 35.4 per cent to US$0.26 billion from US$0.40 billion in the corresponding
period of 2016.
CBN Economic Report for the First Half of 2017
Figure 27Sectoral Utilisation of Foreign Exchange (Visibles)
(First Half 2017)
Industrial sub-
sector44.3%
Food Products
8.6%
Manufactured
Products14.1%
Transport sub-
sector2.8%
Agricultural sub -
sector1.6%
Minerals sub-
sector0.6%
Oil sub-sector
28.0%
Source: CBN

34
2.5.6 Nominal Effective Exchange Rate (NEER) and Real Effective Exchange Rate (REER)
Indices
The average 13-currency Nominal Effective Exchange Rate (NEER) index increased by
44.7 per cent to 157.98 above the level in the first half of 2016, but declined by 0.09 per
cent, relative to the level in the second half of 2016. Similarly, the index of average Real
Effective Exchange Rate (REER) was 85.01 per cent in the review period, a decline of 5.9
per cent relative to the level in the second half of 2016, but an increase of 26.7 per cent
above the level in the corresponding half of 2016. The development was attributed to
higher inflation in the domestic economy relative to major trading partners.
CBN Economic Report for the First Half of 2017
Figure 28Sectoral Utilisation of Foreign Exchange (Invisibles)
(First Half 2017)
Source: CBN
Business Services11.9%
Communication Services
3.0%
Distribution Services
0.2%
Educational Services
5.0%Financial Services66.4%
Tourism & Travel Related Services
1.0%
Transport Services
5.8%
Other Services not Included
6.8%

35
CBN Economic Report for the First Half of 2017
Figure 29Nominal Effective Exchange Rate (NEER) and
Real Effective Exchange Rate (REER) January 2016 – June 2017
Source: CBN
200.00
150.00
100.00
50.00
0.00
N/U
SS
Jan-16 Mar-16 May-16 Jul-16 Sep-16 Nov-16 Jan-17 Mar-17 May-17
Nominal Effective Exchange Rate Real Effective Exchange Rate
Table 5Nominal and the Real Effective Exchange Rate indices
(November 2009=100)
2016
Nominal Effective Exchange Rate
(NEER)
Real Effective Exchange Rate
(REER)
Jan
97.70
63.98
Feb
97.79
62.98
Mar
101.65
64.11
Apr
102.19
63.66
May
100.00
60.89
Jun
144.94
87.00
Jul
160.52
95.33
Aug
156.75
92.08
Sep 157.06 91.57
Oct 154.88 89.78
Nov 151.21 87.02
Dec 150.87 86.16
2017
Jan 153.29 86.93
Feb 153.33 85.91
Mar 154.70 85.34
Apr 155.92 84.90
May 156.87 83.88
Jun 157.98 83.08
Source: CBN
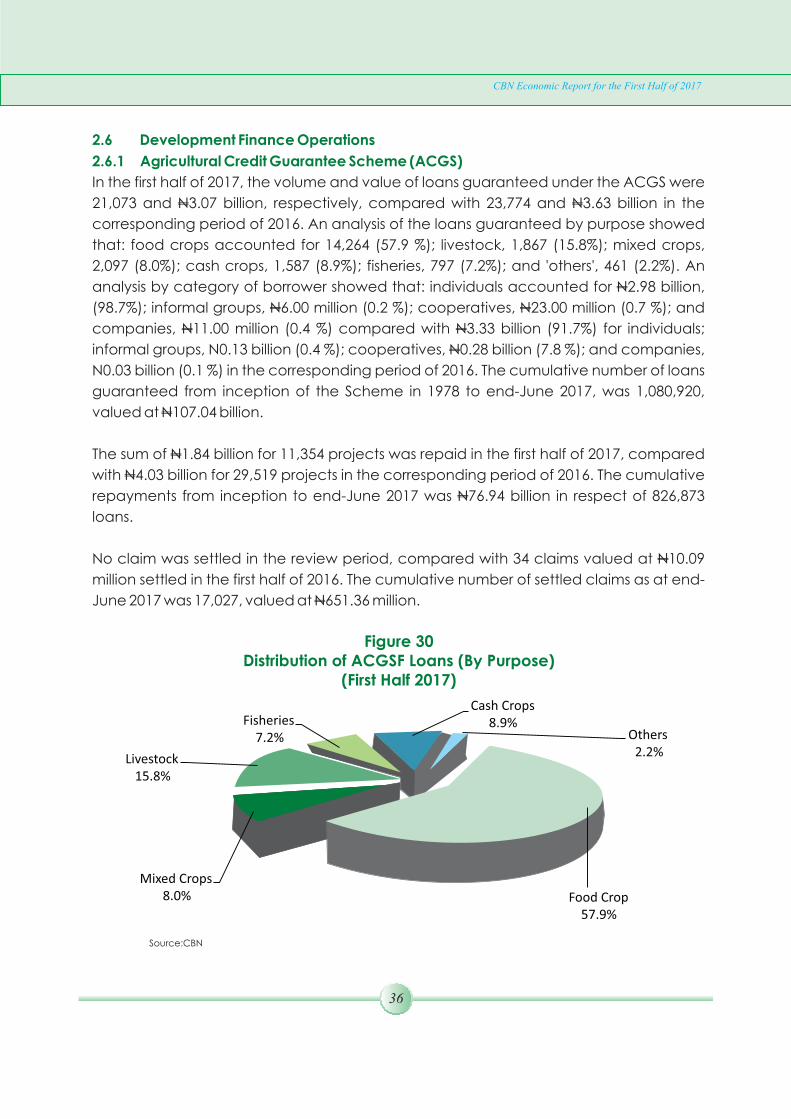
36
CBN Economic Report for the First Half of 2017
2.6 Development Finance Operations
2.6.1 Agricultural Credit Guarantee Scheme (ACGS)
In the first half of 2017, the volume and value of loans guaranteed under the ACGS were
21,073 and N3.07 billion, respectively, compared with 23,774 and N3.63 billion in the
corresponding period of 2016. An analysis of the loans guaranteed by purpose showed
that: food crops accounted for 14,264 (57.9 %); livestock, 1,867 (15.8%); mixed crops,
2,097 (8.0%); cash crops, 1,587 (8.9%); fisheries, 797 (7.2%); and 'others', 461 (2.2%). An
analysis by category of borrower showed that: individuals accounted for N2.98 billion,
(98.7%); informal groups, N6.00 million (0.2 %); cooperatives, N23.00 million (0.7 %); and
companies, N11.00 million (0.4 %) compared with N3.33 billion (91.7%) for individuals;
informal groups, N0.13 billion (0.4 %); cooperatives, N0.28 billion (7.8 %); and companies,
N0.03 billion (0.1 %) in the corresponding period of 2016. The cumulative number of loans
guaranteed from inception of the Scheme in 1978 to end-June 2017, was 1,080,920,
valued at N107.04 billion.
The sum of N1.84 billion for 11,354 projects was repaid in the first half of 2017, compared
with N4.03 billion for 29,519 projects in the corresponding period of 2016. The cumulative
repayments from inception to end-June 2017 was N76.94 billion in respect of 826,873
loans.
No claim was settled in the review period, compared with 34 claims valued at N10.09
million settled in the first half of 2016. The cumulative number of settled claims as at end-
June 2017 was 17,027, valued at N651.36 million.
Figure 30Distribution of ACGSF Loans (By Purpose)
(First Half 2017)
Source:CBN
Food Crop57.9%
Mixed Crops8.0%
Livestock15.8%
Fisheries7.2%
Cash Crops8.9%
Others2.2%
37
CBN Economic Report for the First Half of 2017
2.6.2 Interest Drawback Programme (IDP)
A total of 10,552 IDP rebates valued at N0.10 billion was settled in the first half of 2017,
compared with 6,600 valued at N0.30 billion settled in the corresponding period of 2016.
The total number of IDP rebates settled from inception to end-June 2017 was 319,903,
valued at N4.16 billion. The Scheme was introduced in 2003 to reduce the cost of
borrowing for farmers. Those who repaid as and when due, were entitled to a rebate of
40.0 per cent of the market interest rate at which they borrowed.
2.6.3 Commercial Agriculture Credit Scheme (CACS)
In the review period, the sum of N79.56 billion was released to 35 projects, compared
with N35.99 billion released to 39 private projects and 4 state governments in the first half
of 2016. An analysis of the number of projects financed by value chain revealed that the
entire sum (100%) released for the period was for production. There were no releases for
other aspects of the value chain in the period.
The cumulative amount released under CACS from inception in 2009 to end-June 2017
was N472.98 billion to finance 513 projects.
The sum of N19.78 billion was repaid by thirteen (13) participating banks in respect of 185
projects in the period under review, compared with N22.77 billion for 247 projects in the
first half of 2016. This brought the cumulative repayment from inception to N244.79 billion
at end-June 2017.
2.6.4 Micro, Small and Medium Enterprises Development Fund (MSMEDF)
The implementation of the MSMEDF continued with the disbursement of N1.59 billion in
the review period, compared with N16.53 billion in the corresponding period of 2016. The
financial institutions that participated in the programme were six (6) banks, three (3)
MFBs, six (6) non-governmental organisations microfinance institutions (NGO-MFIs) and
twelve (12) cooperative societies. In addition, one (1) state government accessed funds
under the programme in the review period.
The total sum disbursed from inception in 2012 to date was N87.28 billion, with N63.19
billion (72.4%) to state governments, while the micro, small and medium enterprises
(MSMEs) collectively accessed N24.1 billion (27.6%). The total sum of N15.39 billion was
repaid in the review period. The sum of N23.51 billion had been repaid from inception to
end-June 2017.

Table 6Summary of MSMEDF Activities as at June 30, 2017
Activity
From Inception
to
Dec 31, 2016 Jan –
Jun 2017
Cumulative
(N’billion)
(N’billion)
(N’billion)
Disbursement to MSMEs 23.20 0.89 24.09
Disbursements to State Governments
62.49
0.7
63.19
Total Disbursements
85.69
1.59
87.28
Undisbursed Funds
0.00
0.00
0.00
Repayments Received
7.07
15.52
22.59
Source: CBN
2.6.5 Anchor Borrowers' Programme (ABP)
The implementation of the Anchor Borrowers' Programme continued in the review period
with the disbursement of N12.57 billion to 27 projects, compared with N14.46 billion,
mainly to the Kebbi state government for on-lending to small-holder rice farmers in the
first half of 2016. This brought the cumulative disbursements to N31.52 billion for 80 projects
since inception. Thus far, 183,026 small-holder farmers with a total hectares of 217,750 had
been financed under the Scheme. The programme was being implemented in 27 states
with the participation of ten (10) state-led, forty-seven (47) private-led anchors and
thirteen (13) participating financial institutions (PFIs) (10 banks, 1 DFI, 1 MFB and 1 non-
bank financial institution).
The commodities being financed under the Scheme included: rice, maize, wheat, soya
beans, cotton, cassava, fish and poultry. To improve its outreach and delivery, the CBN
recently approved the:
· Nigeria Incentive-Based Risk-Sharing System for Agricultural Lending (NIRSAL) as a
PFI. Under this window, the CBN would release fund directly to NIRSAL for on-
lending to validated farmers under the ABP;
· NIRSAL Guarantee Model: the CBN would guarantee fifty per cent of the loan in
default, while the remaining fifty per cent would be guaranteed by NIRSAL and
banks in the ratio 75:25 respectively, to encourage the participation of more
banks by reducing their risk exposure under the ABP;
· Prime Anchor Model: Under the model, CBN would release fund directly to the
Anchor as the obligor through the banks for on-lending to its out growers. CBN
would cover 50% of the loan in default while the PFI is expected to take a
maximum additional cover of 70% from the Anchor(s); and
· State Anchor backed with Irrevocable Standing Payment Order (ISPO) Model: For
38
CBN Economic Report for the First Half of 2017

state governments to participate under the ABP, they would submit ISPO as
obtained under CACS and also, provide a copy of signed agreement between
the state government and a processor.
2.6.6 Presidential Fertilizer Initiative
The Initiative commenced in the review period to facilitate the local production of 1.0
million tonnes of blended Nitrogen, Phosphorous and Potassium (NPK) fertilizer for the 2017
wet season farming and 0.5 tonne for the dry-season.
The Initiative was aimed at:
· Enhancing all-year round availability of quality fertilizer at affordable prices;
· Reducing food inflation and stimulating economic activities along the agriculture
value chain;
· Creating jobs by revamping the 28 local blending plants (12 already producing);
· Savings of a projected US$200m in foreign exchange; and
· Savings of about N60.00 billion in budgetary provisions for fertilizer subsidy.
2.6.7 National Food Security Programme (NFSP)
The NFSP was meant to scale-up domestic production of agricultural commodities,
enhance local milling capacity and engage a large number of small-holder farmers
under the out-growers scheme. A total of 8 projects valued at N24.91 billion had been
financed under the Programme.
2.6.8 National Collateral Registry (NCR)
The NCR was given a legal backing with the enactment of the Secured Transactions in
Movable Assets Act in May 2017.
The Registry trained sixty five (65) credit managers of the First Bank of Nigeria Limited, Rand
Merchant Bank and Heritage Bank on how to utilise its services. In addition, a
demonstration on the use of the NCR portal to register statements of farmers under the
Anchor Borrowers' Programme (ABP) was carried out for staff of the Nigerian Incentive-
Based Risk-sharing for Agricultural Lending (NIRSAL) in the review period.
To date, one hundred and seventeen (117) financial institutions had registered on the
Registry comprising, twenty six (26) banks, three (3) development finance institutions and
eighty five (85) microfinance banks.
A total of 15,392 financing statements valued at N315.15 billion and US$20.00 million had
been recorded on the NCR portal by the financial institutions from inception to date. A
breakdown of the number and value of financing statements by category is shown in
Table 7:
39
CBN Economic Report for the First Half of 2017
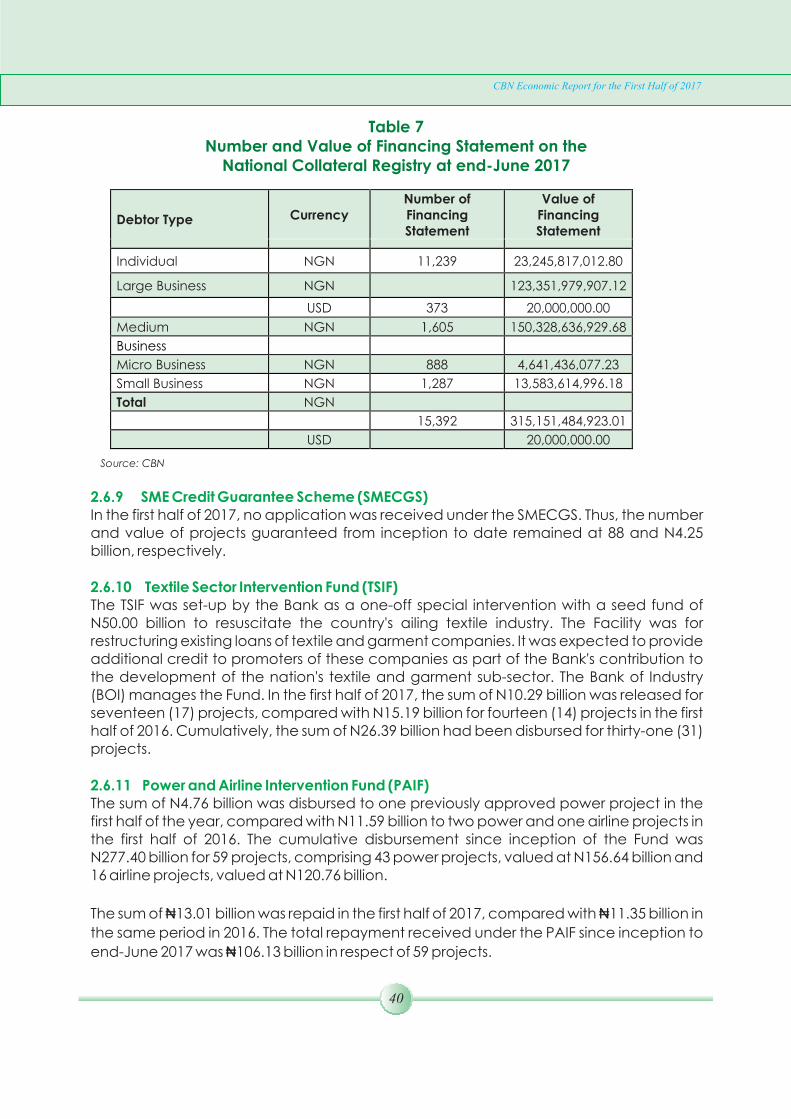
Table 7Number and Value of Financing Statement on the
National Collateral Registry at end-June 2017
Debtor Type Currency
Number of Financing Statement
Value of Financing Statement
Individual NGN 11,239 23,245,817,012.80
Large Business NGN 123,351,979,907.12
USD
373
20,000,000.00
Medium
NGN
1,605
150,328,636,929.68
Business
Micro Business
NGN
888
4,641,436,077.23
Small Business
NGN
1,287
13,583,614,996.18
Total
NGN
15,392
315,151,484,923.01
USD
20,000,000.00
Source: CBN
2.6.9 SME Credit Guarantee Scheme (SMECGS)In the first half of 2017, no application was received under the SMECGS. Thus, the number and value of projects guaranteed from inception to date remained at 88 and N4.25 billion, respectively.
2.6.10 Textile Sector Intervention Fund (TSIF)The TSIF was set-up by the Bank as a one-off special intervention with a seed fund of N50.00 billion to resuscitate the country's ailing textile industry. The Facility was for restructuring existing loans of textile and garment companies. It was expected to provide additional credit to promoters of these companies as part of the Bank's contribution to the development of the nation's textile and garment sub-sector. The Bank of Industry (BOI) manages the Fund. In the first half of 2017, the sum of N10.29 billion was released for seventeen (17) projects, compared with N15.19 billion for fourteen (14) projects in the first half of 2016. Cumulatively, the sum of N26.39 billion had been disbursed for thirty-one (31) projects.
2.6.11 Power and Airline Intervention Fund (PAIF)The sum of N4.76 billion was disbursed to one previously approved power project in the first half of the year, compared with N11.59 billion to two power and one airline projects in the first half of 2016. The cumulative disbursement since inception of the Fund was N277.40 billion for 59 projects, comprising 43 power projects, valued at N156.64 billion and 16 airline projects, valued at N120.76 billion.
The sum of ₦13.01 billion was repaid in the first half of 2017, compared with ₦11.35 billion in
the same period in 2016. The total repayment received under the PAIF since inception to
end-June 2017 was ₦106.13 billion in respect of 59 projects.
40
CBN Economic Report for the First Half of 2017

2.6.12 Nigeria Electricity Market Stabilisation Facility (NEMSF)
The Nigeria Electricity Market Stabilisation Facility (NEMSF) was aimed at putting the
Nigerian Electricity Supply Industry on a path to economic viability and sustainability. The
NEMSF was meant to facilitate the settlement of legacy gas debts and payment of
outstanding obligations due to market participants (Gascos, Gencos, TCN, Discos,
service providers and others along the value chain) that accrued during the Interim Rules
Period (IRP Debts).
During the first half of 2017, there was no disbursement but there were series of
stakeholders meetings geared towards accelerating the disbursement of the remaining
portion of the Facility. Cumulatively, N114.75 billion had been disbursed to twenty nine
(29) eligible electricity market participants. The sum of N4.48 billion principal repayment
was received in the period under review. The total repayment under NEMSF since
inception stood at N11.77 billion.
2.6.13 Financial Inclusion Activities
2.6.13.1 Visit of Delegates from 8 (eight) Alliance for Financial Inclusion (AFI) Member
Countries
The CBN hosted the Alliance for Financial Inclusion (AFI) – a global network of policy
makers/regulators instrumental to developing and promoting financial inclusion
strategies in member-countries. Delegates from Mozambique, Senegal, Lesotho,
Seychelles, Sierra Leone, and Bhutan attended the 5-day programme to understudy the
Nigerian financial inclusion strzategy development & implementation processes.
2.6.13.2 Geospatial Mapping Update
The Financial Inclusion Secretariat was coordinating the development of “Nigeria
Financial Services (NFS) Maps”, a dynamic online geospatial database of financial
services. The database would provide specific benefits to a wide range of stakeholders,
including relevant CBN departments, Nigeria Interbank Settlement System (NIBSS),
government agencies, financial services providers, and the public.
41
CBN Economic Report for the First Half of 2017
Table 8Summary of projects financed under PAIF up to June 30, 2017
S/No
Type
No. of Projects
Amount
(N’billion) %
Repayments
(N’billion)
1 Airline 16 120.76 43.5 55.84
2
Power 41
156.64
56.5
50.29
Total
57
277.40
100.0
106.13
Source: CBN

42
CBN Economic Report for the First Half of 2017
In the review period, the Bank was awarded a US$100,000 innovation grant by a financial
sector deepening organisation, insight2impact (i2i), to support the Project.
Consequently, a project plan was being designed for the development of the envisioned
database.
2.6.14 Entrepreneurship Development Centres (EDCs)
The Bank's engagement with EDCs continued on possible areas of collaboration on
entrepreneurship development in Nigeria. As a fall out, it was agreed that the EDCs
should open discussions with banks especially Sterling Bank Plc. and LAPO Microfinance
Bank that had accessed the CBN's MSMED funds to link the graduates from their centres
to access finance. It was also agreed that the EDCs should send a proposal to the
Director, Corporate Communications Department for collaborations on their enterprise
radio programme.
The number of participants trained by the EDCs during the review period was 6,806,
surpassing the target of 6,600. A total of 3,691 (52.2%) of the participants were females
and 3,115 (45.8%) were males. A total of N2.50 billion had been accessed through banks
and other financial institutions by graduates of EDCs since inception, while a total of
43,350 participants had been trained.
2.6.15 Youth Entrepreneurship Development Programme (YEDP)
In the review period, no additional fund was released to the Youth Entrepreneurship
Development Programme (YEDP). The sum of N618.54 million had been disbursed thus
far, through the Heritage Bank. Engagements with other participating financial
institutions (PFIs) were on-going to make their portals available for the Programme.

43
CBN Economic Report for the First Half of 2017
ECONOMIC REPORT
3.0 GLOBAL ECONOMIC DEVELOPMENTS
3.1 Global Output
Global output picked-up in the first half of 2017. The International Monetary Fund (IMF)
projected global growth to rise from 3.2 per cent in 2016 to 3.5 per cent in 2017. The
growth projection was due, mainly, to the anticipated cyclical recovery in global
manufacturing and trade. Other factors were robust growth in aggregate consumption,
the expectation of a lax fiscal policy stance, appropriate policy mix which buoyed
financial markets and strengthened business confidence, as well as accommodative
financial conditions.
In advanced economies, output growth rebounded, especially in the United States and
Japan. The United States led growth in the second quarter of 2017, despite its
disappointing result in the first quarter, while the euro area and Japan were also
expanding at relatively decent rates. Overall, high-frequency indicators for the second
quarter of 2017 provided signs of a general strengthening of activity in most advanced
economies.
GDP growth in the US picked-up to 2.6 per cent in the second quarter of 2017, from 1.2 per
cent in the first quarter. The improvement was driven largely by buoyant market
expectation of fiscal stimulus. The IMF has, however, marked-down growth rates from 2.3
per cent in 2016 to 2.1 per cent in 2017. The markdown reflected, in part the weak growth
outturn in the first quarter of the year, and the expectation that fiscal policy would be less
expansionary than previously anticipated.
The United Kingdom economy grew by 0.3 per cent and 0.2 per cent in the first and
second quarters of 2017, respectively. The IMF revised UK growth downwards by 0.3
percentage point for 2017, from 2.0 per cent to 1.7 per cent, reflecting a weaker-than-
expected activity in the first quarter as a slump in the pound and a spike in inflation
weighed on growth.
The Japanese economy grew by 1.0 per cent in the second quarter of 2017, from 1.5 per
cent in the first quarter. The country's growth was, however, revised up by the IMF from 1.0
per cent in 2016 to 1.3 per cent in 2017, reflecting the impact of increased private
consumption, investment, and export in boosting activity.

44
CBN Economic Report for the First Half of 2017
In the euro area, economic activity gained momentum, primarily supported by improved
domestic demand and inventories. Real GDP increased by 0.6 per cent, quarter-on-
quarter, in the second quarter of 2017, following a growth of 0.5 per cent in the preceding
quarter.
In emerging market and developing economies, growth outcome was heterogeneous,
and projected to increase to 4.5 per cent in 2017, above 4.3 per cent in 2016. In China,
growth is rebounding, reflecting a better-than-expected performance in the second
quarter of 2017 and the general expectation that the country's slowdown would be less
severe. The expectation reflected existing policy easing, especially expansionary credit
and public investment, as well as supply-side reforms. China's economy grew at 6.9 per
cent apiece in the first and second quarters of 2017, compared with 6.8 per cent in the
fourth quarter of 2016. Growth in China was projected to remain at 6.7 per cent in 2017
same as in 2016.
The Russian economy showed signs of recovery, and was expected to exit recession in
2017, as activity appears to be bottoming-out, reflecting the effect of higher oil prices. In
Brazil, there was a pick-up in activity owing to the firming oil prices and a recovery in
domestic demand, on account of easing financial conditions and buoyed confidence.
However, a lackluster investment activity and idle capacity remained major hindrances
to growth.
The Indian economy grew by 7.3 per cent in the second quarter of 2017, compared with
7.1 per cent in the first quarter and 7.6 per cent year-on-year. Growth was supported
largely by government and private consumption activity as well as a reduced drag from
net exports.
The sub-Saharan African (SSA) economies continued to witness tepid growth, reflecting
softening commodity prices and weak activity in Nigeria and South Africa, the region's
major players. In sub-Saharan Africa, a modest recovery in 2017 was foreseen. Growth was
projected to rise to 2.7 percent in 2017 and 3.5 percent in 2018, driven largely by
idiosyncratic factors in the largest economies, which faced challenging macroeconomic
conditions in 2016. In Nigeria, GDP recorded a positive growth of 0.55 per cent in the
second quarter of 2017, in contrast to a negative 0.91 per cent in the preceding quarter.
Nigeria's growth has been hampered by lower oil prices, and was expected to fully
stabilise by the fourth quarter of 2017.

45
CBN Economic Report for the First Half of 2017
South Africa's economy contracted by 0.7 per cent in the first quarter of 2017, compared
with 0.3 per cent in the fourth quarter of 2016. Growth in South Africa was, however,
projected to rise to 1.0 per cent in 2017, as drought conditions ease, commodity prices
rebound and electricity capacity expands.
3.2 Global Commodity Prices
Global commodity prices also strengthened alongside the pick-up in economic activity.
The rise in oil prices was, in part due to the decision of the Organisation of the Petroleum
Exporting Countries (OPEC) and non-OPEC members to cut production. In Asia and the
United States, prices initially rose because of expectations of a stronger winter demand.
However, a fairly mild winter subdued demand, thereby containing gas prices. The
increased real estate activities in China and the anticipated fiscal policy easing in the
United States supported metal prices. In addition, prices rose for most food items as
excess supply eased.
The Food and Agriculture Organisation (FAO) Food Price Index (FFPI) rose by 5 points or
2.89 per cent to 175.2 points at end-June 2017 above 170.3 points at end-December
2016. The index rose by 11.29 points or 6.89 per cent from 163.9 points to 175.2 points,
compared with the levels in the corresponding period of 2016. The sub-indices of meat,
dairy and cereals rose by 11.56, 8.50 and 8.48 per cent to 175.2, 209.0 and 154.3 points
respectively, at end-June 2017 above 157.1, 192.6 and 142.2 points at end-December
2016. The sub-indices of meat, dairy and vegetable oil rose by 9.57, 51.50 and 0.15 per
cent, while cereals and sugar sub-indices fell by 1.65 and 28.54 per cent, respectively,
compared with the levels in the corresponding period of 2016. Vegetable oil and sugar
sub-indices fell by 11.38 and 24.87 per cent to 162.1 and 197.3 points at end-June 2017
below 183.0 and 262.6 points, respectively at end-December 2016.
3.3 Global Inflation
Global consumer price inflation generally softened reflecting the waning impact of the
recent commodity price rebound. Global inflation was projected to rise to 4.7 per cent in
2017, down 0.1 percentage point from its previous forecast. This downgrade to the global
inflation outlook for 2017 mostly reflected lower estimates for the euro area, China, India
and the United States.
In advanced economies, inflation was estimated at 2.0 per cent in 2017, up from 0.8 per
cent in 2016. Thus, headline inflation picked up due to higher commodity prices, but was
generally below central banks' targets. It increased in the first quarter of 2017 due to rising
energy and food prices. In general, prices, however, moderated in the second quarter of

46
CBN Economic Report for the First Half of 2017
2017, though inflationary pressures intensified in the United Kingdom on the back of a
weaker sterling.
In the OECD area, annual inflation slowed to 1.9 per cent in June 2017, compared with 2.1
per cent in May 2017, reflecting mainly a softening in energy prices. It had increased to
2.5 per cent in February 2017, compared with 2.3 per cent in January 2017.
In the United States, inflation softened from 2.5 per cent in January 2017 to 2.4 per cent in
March 2017, and declined further to 1.9 per cent and 1.6 per cent in May and June,
respectively. Core inflation remained relatively subdued and was projected to rise more
gradually. Euro area inflation declined from a peak of 2.0 per cent in February to 1.4 per
cent in May and 1.3 per cent in June, 2017. Given the negative output gap in the area,
headline inflation was expected to remain below the European Central Bank's target for
some time to come.
In emerging market economies, inflation moderated in both the first and second
quarters of 2017 due to weak demand, more stable economic conditions and foreign
exchange markets. Inflation in emerging market and developing economies (excluding
Argentina and Venezuela) was projected to rise to 4.7 per cent in 2017 from 4.4 per cent
in 2016, mostly reflecting higher commodity prices. China's inflation moderated from 2.5
per cent in January 2017 to 1.5 per cent apiece in April and May, before edging
downwards to 1.4 per cent in June, 2017. In Brazil, inflation declined throughout the first
half of 2017, from 5.4 per cent in January to 4.6 per cent and 3.0 per cent in March and
June, 2017 respectively. Also, Indian inflation declined during the first half, from 3.2 per
cent in January, to 2.2 and 1.5 per cent in May and June 2017, respectively. The decline
was attributed to the general fall in the prices of vegetables and fruits.
In sub-Saharan Africa, inflation was expected to remain in double-digit levels in a few
large economies, namely Nigeria, Angola and Ghana, reflecting the passthrough of
significant currency depreciations. The IMF projected inflation to decelerate in the
region to 10.7 per cent in 2017, from 11.4 per cent in 2016. In Nigeria, inflation has steered
a downward course, declining from 18.7 per cent in January 2017 to 17.2 per cent and
16.1 per cent in April and June 2017, respectively, reflecting primarily the appreciation of
the naira, owing to the effectiveness of recent measures by the Central Bank of Nigeria to
rein-in demand pressures in the foreign exchange market. In South Africa, inflation
generally declined in the first half of 2017, to 6.0, 5.3 and 5.4 per cent in March, April and
May 2017, respectively.

47
CBN Economic Report for the First Half of 2017
3.4 International Financial Markets
The global financial market performance was mixed in the first half of 2017. The
development was due mainly to the impact of a strong dollar, owing to intensified
monetary policy normalisation in the U.S., which widened the monetary policy
divergence in the advanced economies. Other factors were strong expectation of fiscal
stimulus, global growth pick-up led by the U.S. economy, the easing slowdown in the
Chinese economy due to fiscal boost, intensification of inward-looking policies and
protectionism, as well as uncertainty surrounding the UK Government's triggering of
Article 50. These developments impacted investors' confidence and liquidity conditions
in the global financial market. Accordingly, the advanced economies' policy rates
remained largely unchanged in the review period. Despite growth concerns, some
emerging market and developing economies raised rates ostensibly to moderate
domestic prices and stem foreign capital outflow.
Consequently, the global stock market was predominantly bullish. In North America, the
Mexican Bolsa and United States S&P 500 indices increased by 9.2 and 8.2 per cent,
respectively, while the Canadian S&P/TSX Composite index decreased by 0.7 per cent.
In South America, the Argentine Merval, Colombian COLCAP and Brazilian Bovespa
indices increased by 29.5, 8.2 and 4.4 per cent, respectively.
In Europe, the DAX, CAC 40 and FTSE 100 indices increased by 7.4, 5.3 and 2.4 per cent
respectively, while the MICEX index decreased by 15.8 per cent.
In Asia, India's BSE Sensex, Japan's Nikkei 225 and the China's Shanghai Stock Exchange-
A indices increased by 16.1, 4.8 and 2.9 per cent, respectively.
In sub-Saharan Africa, the Nigerian NSE All-Share, Ghanaian GSE ASI, Kenyan Nairobi NSE
20, Egyptian EGX CASE 30 and the South African JSE All-Share indices increased by 23.2,
16.3, 13.2 and 1.9 per cent, respectively.
The performance of global currencies was mixed during the first half of 2017. While some
major currencies appreciated against the U.S. dollar, others depreciated, especially in
an era of a strong dollar. This development was attributed to the growth slowdown in the
United States during the first quarter of 2017, as well as muted recovery in commodity
prices, which moderated activity in Latin America and African markets. In addition, the
divergence of the monetary policy stance in China and Japan continued to cause
fragilities in their financial markets.

48
CBN Economic Report for the First Half of 2017
In advanced economies, most currencies appreciated against the U.S. dollar. The major
European currencies, namely the euro and Russian ruble appreciated against the U.S.
dollar by 4.6 and 23.6 per cent, respectively. The British pound, however, depreciated by
11.7 per cent against the U.S. dollar, reflecting the continued weakening of the sterling in
the aftermath of the Brexit Vote. In North America, the Canadian dollar appreciated by
6.2 per cent. In Asia, the Japanese yen also appreciated against the U.S. dollar by 7.0 per
cent.
In the emerging market economies, the Brazilian real, Colombian peso and Indian rupee
appreciated against the U.S. dollar by 19.6, 4.3 and 2.4 per cent, respectively. The
Mexican peso, Argentine peso and Chinese yuan, however, depreciated by 4.9, 22.3
and 4.3 per cent, respectively, against the U.S. dollar while the South African rand
appreciated against the U.S. dollar by 18.4 per cent.
In sub-Saharan Africa, the Ghanaian cedi, Nigerian naira, Egyptian pound and Kenyan
shilling depreciated against the U.S. dollar by 13.6, 35.6, 56.8 and 1.4 per cent,
respectively.
Figure 31Performance of the Naira against Major Currencies
450.0
400.0
350.0
300.0
250.0
200.0
3.0
2.5
2.0
1.5
1.0
0.5
03/0
1/2
017
09/0
1/2
017
13/0
1/2
017
19/0
1/2
017
25/0
1/2
017
31/0
1/2
017
06/0
2/2
017
10/0
2/2
017
16/0
2/2
017
22/0
2/2
017
28/0
2/2
017
06/0
3/2
017
10/0
3/2
017
16/0
3/2
017
22/0
3/2
017
28/0
3/2
017
07/0
4/2
017
13/0
4/2
017
21/0
4/2
017
27/0
4/2
017
04/0
5/2
017
10/0
5/2
017
16/0
5/2
017
22/0
5/2
017
26/0
5/2
017
02/0
6/2
017
08/0
6/2
017
14/0
6/2
017
20/0
6/2
017
28/0
6/2
017
USD GBP SUR JPY
Source: CBN

49
CBN Economic Report for the First Half of 2017
Figure 32Performance of the Naira against
Regional Currencies
Source: CBN
03/0
1/2
017
09/0
1/2
017
13/0
1/2
017
19/0
1/2
017
25/0
1/2
017
31/0
1/2
017
06/0
2/2
017
10/0
2/2
017
16/0
2/2
017
22/0
2/2
017
28/0
2/2
017
06/0
3//
2017
10/0
3/2
017
16/0
3/2
017
22/0
3/2
017
28/0
3/2
017
03/0
4/2
017
07/0
4/2
017
13/0
4/2
017
21/0
4/2
017
27/0
4/2
017
04/0
5/2
017
10/0
5/2
017
16/0
5/2
017
22/0
5/2
017
26/0
5/2
017
02/0
6/2
017
08/0
6/2
017
14/0
6/2
017
20/0
6/2
017
26/0
6/2
017
30/0
6/2
017
Na
ira
pe
r W
AU
A
WAUA CFA
Na
ira
pe
r C
FA F
ran
c
0.55
0.5
0.45
450
430
410
390
370
350
330
310
290
270
250
Table 9Indices of Selected International Stock Markets (As at June 30, 2017)
Country Index End-June, 2016 End-Dec, 2016 End-June, 2017
% Change
Jun 2016 - Jun
2017
% Change Dec
2016 - Jun
2017
AFRICA
Nigeria ASI 29,597.79 26,874.62 33,117.48 11.9 23.2
South Africa JSE African AS 52,217.72 50,653.54 51,611.01 -1.2 1.9
Kenya Nairobi NSE 20 3,640.61 3,186.21 3,607.18 -0.9 13.2
Egypt EGX CSE 30 6,942.52 12,290.61 13,487.36 94.3 9.7
Ghana GSE All Share 1,787.50 1,689.18 1,964.55 9.9 16.3
NORTH AMERICA
US S&P 500 2,098.86 2,238.83 2,423.41 15.5 8.2
Canada S&P/TSX Composite 14,064.54 15,287.59 15,182.19 7.9 -0.7
Mexico Mexico Bolsa (IPC) 45,966.49 45,642.90 49,857.49 8.5 9.2
SOUTH AMERICA
Brazil Bovespa Stock 51,526.93 60,227.29 62,899.97 22.1 4.4
Argentina Merval 14,683.49 16,917.86 21,912.63 49.2 29.5
Colombia COLCAP 1,313.18 1,351.68 1,462.90 11.4 8.2
EUROPE
UK FTSE 100 6,504.33 7,142.83 7,312.72 12.4 2.4
France CAC 40 4,237.48 4,862.31 5,120.68 20.8 5.3
Germany DAX 9,680.09 11,481.06 12,325.12 27.3 7.4
Russia MICEX 1,891.09 2,232.72 1,879.50 -0.6 -15.8
ASIA
Japan NIKKEI 225 15,575.92 19,114.37 20,033.43 28.6 4.8
China Shanghai SE A 3,066.50 3,249.59 3,343.39 9.0 2.9
India BSE Sensex 26,999.72 26,626.46 30,921.61 14.5 16.1
Source: Bloomberg

50
CBN Economic Report for the First Half of 2017
3.5 Global Economic Outlook for the Rest of 2017
Global output growth was revised by the IMF in its July WEO update, to improve for 2017 at
3.5 per cent, compared with 3.2 per cent in 2016. In the advanced economies, growth is
projected at 2.0 per cent in 2017, up from 1.7 per cent in 2016, due largely to expected
strong consumer demand, investment and trade. Moreover, inflation remains subdued
Table 10Exchange Rates of Selected Countries
(Value in Currency Units to US$)
Currency 31-Dec-15 31-Dec-16 30-Jun-17 MTM % Change Dec
31, 2015 - June 30,
2016 %App/Dep
YTD %
Change
App/Dep
AFRICA
Nigeria Naira 197.00 305.00 305.90 -0.29 -35.60
South Africa Rand 15.48
13.74
13.07 5.13 18.44
Kenya Shilling 102.30 102.51 103.75 -1.20 -1.40
Egypt Pound 7.83 18.14 18.13 0.06 -56.81
Ghana Cedi 3.81 4.24 4.41 -3.85 -13.61
NORTH
AMERICA
Canada Dollar 1.38 1.34 1.30 3.08 6.15
Mexico Peso 17.23 20.73 18.12 14.40 -4.91
SOUTH
AMERICA
Brazil Real 3.96 3.26 3.31 -1.51 19.64
Argentina Peso 12.93 15.88 16.63 -4.51 -22.25
Colombia Peso 3,174.50 3,002.00
3,043.11 -1.35 4.32
EUROPE
UK Pound 0.68 0.81 0.77 5.19 -11.69
Euro Area Euro 0.92 0.95 0.88 7.95 4.55
Russia Ruble 72.85 61.54 58.94 4.41 23.60
ASIA
Japan Yen 120.20 116.96 112.39 4.07 6.95
China Yuan 6.49 6.95 6.78 2.51 -4.28
India Rupee 66.15 67.92 64.58 5.17 2.43
Source: bloomberg
MTM = Month to MonthYTD = Year to Date
51
CBN Economic Report for the First Half of 2017
and generally below targets in most advanced economies. Growth in the euro area was
projected at 1.9 per cent in 2017, compared with 1.8 per cent in 2016. The lower
projection was influenced by uncertainty surrounding the Brexit and the risks of rising
protectionism. Projections for other advanced economies such as Britain, Japan, Spain,
Italy in 2017 have been revised downwards largely on account of weaker-than-
expected activities in the first quarter of 2017.
Growth in the emerging market and developing economies (EMDEs) was projected to
rise to 4.6 per cent in 2017, from 4.3 per cent in 2016, driven largely by Brazil and Russia on
the back of firming oil prices and recovery in commodity export. The projection was
supported by the bottoming-out of economic recession in some countries, the firming up
of international crude oil and other commodity prices, and the waning of China's
economic reforms. China was projected to grow by 6.7 per cent in 2017. Growth in India
was projected to rebound to 7.2 per cent in 2017, above 7.1 per cent in 2016, owing to
higher government spending and data revision that showed stronger momentum in the
first quarter of 2017. In Brazil, growth was projected to rise to 0.3 in 2017, from a contraction
of 3.6 per cent in 2016, due to expected moderate recovery in commodity prices and
upswing in economic activity.
In sub-Saharan Africa, growth was projected to rise to 2.7 per cent in 2017, from 1.3 per
cent in 2016, driven by expected recovery in South Africa and Nigeria. Growth in South
Africa was projected at 1.0 per cent in 2017, from 0.3 per cent in 2016. Nigeria's growth
was projected to expand by 0.8 per cent in 2017, from a contraction of 1.6 per cent in
2016.
Growth in the Middle East and North Africa (MENA) region was projected to decelerate
to 2.6 per cent in 2017, down from 5.0 per cent in 2016, reflecting slowdown in activity in oil
exports and political crisis in a number of countries in the region. Besides, continued
weakness in oil prices, if sustained, could weigh further on the outlook for the region.


53
CBN Economic Report for the First Half of 2017
4.0 DEVELOPMENTS IN THE DOMESTIC ECONOMY
4.1 Monetary and Credit Developments
Global and domestic developments influenced monetary policy environment in the first
half of 2017. At the domestic front, contraction in domestic output eased as real GDP
grew by 0.55 per cent in the second quarter, in contrast to the contraction of 1.49 per
cent in the second quarter of 2016. Nevertheless, high inflation and foreign exchange
demand pressure remained major challenges to monetary policy. Consequently, the
Bank maintained a non-expansionary monetary policy stance with the policy rate
retained at 14.0 per cent; cash reserve ratio at 22.5 per cent; liquidity ratio at 30.0 per
cent, and the asymmetric corridor of +200/-500 basis points around the MPR for the
standing lending and deposit facilities, respectively. The main instrument for liquidity
management was open market operations (OMO), complemented by cash reserve
requirements, repurchase transactions and interventions in the interbank foreign
exchange market.
Growth in monetary aggregates fell below their targets. Broad money (M2) and narrow
money (M1) supply declined, compared with their levels at the end of the corresponding
half year of 2016. Similarly, both reserve money and currency outside banks fell below
their targets. Aggregate credit (net) to the domestic economy grew marginally during
the review period, and was driven by the growth in net claims on the Federal
Government and credit to the private sector. Growth in consumer credit rose in tandem
with the growth in credit to the private sector.
4.1.1 Reserve Money
At N5,480.21 billion, reserve money fell by 6.3 per cent below its level at end-December
2016 and the benchmark of 11.4 per cent for the fiscal 2017, compared with the decline
of 7.6 per cent at the end of the corresponding period of 2016. The development was due
to the decline of 4.7 and 13.5 per cent in net foreign assets and domestic assets of the
CBN, respectively. The corresponding decrease in the uses of reserve money resulted
from the decrease of 14.1and 1.7 per cent in currency-in-circulation and banks'
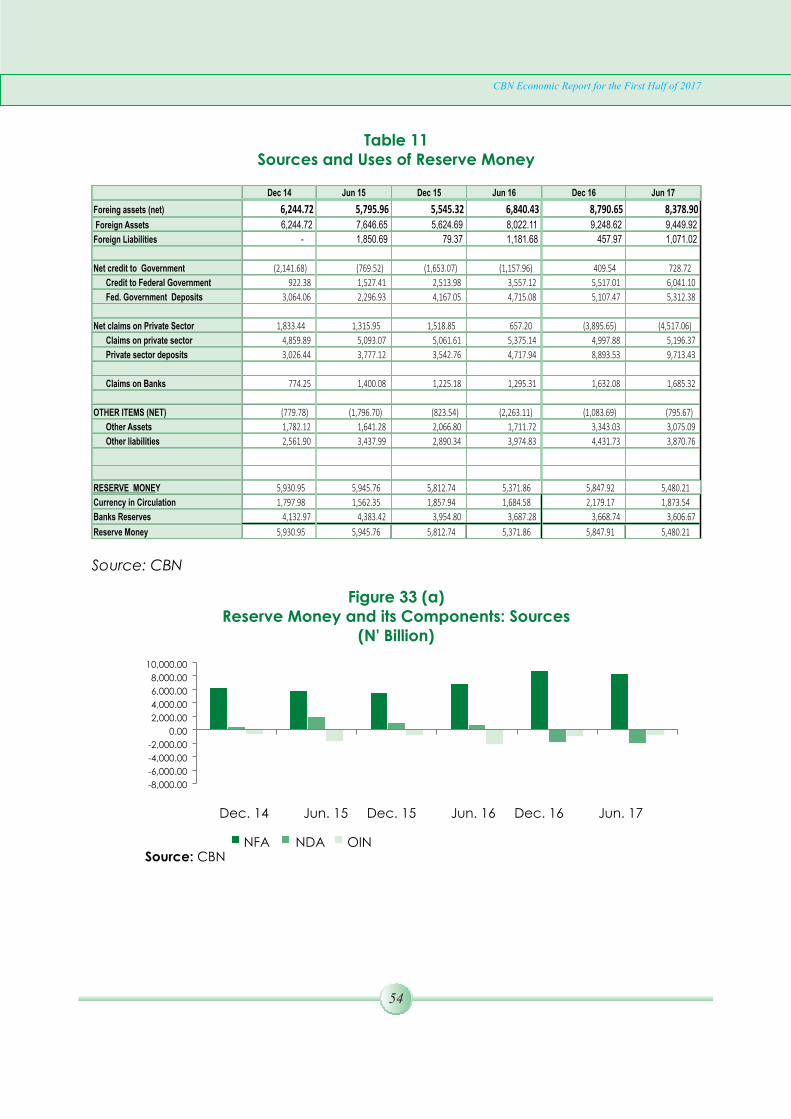
54
CBN Economic Report for the First Half of 2017
Dec 14 Jun 15 Dec 15 Jun 16 Dec 16 Jun 17
Foreing assets (net) 6,244.72 5,795.96 5,545.32 6,840.43 8,790.65 8,378.90 Foreign Assets 6,244.72 7,646.65 5,624.69 8,022.11 9,248.62 9,449.92
Foreign Liabilities - 1,850.69 79.37 1,181.68 457.97 1,071.02
Net credit to Government (2,141.68) (769.52) (1,653.07) (1,157.96) 409.54 728.72
Credit to Federal Government 922.38
1,527.41
2,513.98
3,557.12 5,517.01 6,041.10
Fed. Government Deposits 3,064.06
2,296.93
4,167.05
4,715.08 5,107.47 5,312.38
Net claims on Private Sector 1,833.44
1,315.95
1,518.85
657.20 (3,895.65) (4,517.06)
Claims on private sector 4,859.89
5,093.07
5,061.61
5,375.14 4,997.88 5,196.37
Private sector deposits 3,026.44
3,777.12
3,542.76
4,717.94 8,893.53 9,713.43
Claims on Banks 774.25
1,400.08
1,225.18
1,295.31 1,632.08 1,685.32
OTHER ITEMS (NET) (779.78)
(1,796.70)
(823.54)
(2,263.11) (1,083.69) (795.67)
Other Assets 1,782.12 1,641.28 2,066.80 1,711.72 3,343.03 3,075.09
Other liabilities 2,561.90 3,437.99 2,890.34 3,974.83 4,431.73 3,870.76
RESERVE MONEY 5,930.95 5,945.76 5,812.74 5,371.86 5,847.92 5,480.21
Currency in Circulation 1,797.98 1,562.35 1,857.94 1,684.58 2,179.17 1,873.54
Banks Reserves 4,132.97 4,383.42 3,954.80 3,687.28 3,668.74 3,606.67
Reserve Money 5,930.95 5,945.76 5,812.74 5,371.86 5,847.91 5,480.21
Table 11Sources and Uses of Reserve Money
Source: CBN
Figure 33 (a)Reserve Money and its Components: Sources
(N' Billion)
Source: CBN
10,000.00
8,000.00
6,000.00
4,000.00
2,000.00
0.00
-2,000.00
-4,000.00
-6,000.00
-8,000.00
Dec. 14 Jun. 15 Dec. 15 Jun. 16 Dec. 16 Jun. 17
NFA NDA OIN

55
CBN Economic Report for the First Half of 2017
Figure 33 (b)Reserve Money and its Components: Uses
(N' Billion)
Source: CBN
4.1.2 Broad Money (M2)
The broad measure of money supply, M2, fell by 6.8 per cent to N21,980.58 billion at end-
June 2017, translating to an annualized growth of negative 14.7 per cent, in contrast to
the growth of 10.2 per cent at the end of June 2016. The development resulted from the
decline of 7.5 and 10.5 percent in net foreign assets and other assets (net) of the banking
system, respectively, which offset the 1.0 per cent growth in net domestic credit.
4.1.3 Narrow Money (M1)
Narrow money supply (M1) fell by 9.6 per cent to N10, 190.19 billion at end-June 2017, in
contrast to the growth of 11.1 per cent at the end of the preceding period of 2016. The
development was due to respective decline of 18.9 and 7.8 per cent in currency outside
banks and demand deposits.
4.1.4 Quasi Money (QM)
Quasi money fell by 4.3 per cent to N11,790.4 billion at end-June 2017, in contrast to the
growth of 9.6 per cent at the end of the corresponding period of 2016. This was due to the
decline in savings and time deposits, particularly foreign currency deposits, which fell by
9.2 per cent.
4.1.5 Currency-in–Circulation (CIC) and Deposits at the CBN
Currency-in-circulation and banks' deposits with the CBN fell by 14.0 and 1.7 per cent to
N1,873.5 billion and N3,606.67 billion, respectively, compared with the decline of 9.3 and
6.8 per cent at the end of the corresponding period of 2016. As a proportion of reserve
money, CIC and bank reserves constituted 34.1 and 65.8 per cent, respectively.
De
c. 1
4
Jun
15
De
c 1
5
Jun
16
De
c 1
6
Jun
17
RM CIC Bank Reserve
8,000.00
6,000.00
4,000.00
2,000.00
-

56
CBN Economic Report for the First Half of 2017
4.1.6 Currency Outside Banks (COB)
Currency outside banks fell by 18.9 per cent to N1,477.1 billion at end-June 2017,
compared with the decline of 5.3 per cent at end-June 2016. This reflected increased use
of electronic payments channels during the review period. As a percentage of broad
money, COB constituted 6.7 per cent, a slight increase from 6.2 per cent at the end of the
corresponding period of 2016.
Figure 34Ratio of Currency Outside Bank to Broad Money Supply
0.0
5.0
10.0
15.0
20.0
25.0
Dec 14 Jun 15 Dec 15 Jun 16 Dec 16 Jun 17
Pe
r ce
nt
COB/M2 COB/M1
Source: CBN
Figure 35Growth in Money Supply
(Per cent)
-20.00
-10.00
0.00
10.00
20.00
30.00
40.00
Dec 14 Jun 15 Dec 15 Jun 16 Dec 16 Jun 17
Pe
r ce
nt
Narrow money (M1) Broad Money M2
Source: CBN

57
CBN Economic Report for the First Half of 2017
4.1.7 Drivers of Growth in Money Supply
4.1.7.1 Net Foreign Assets (NFA)
Net foreign assets of the banking system fell by 7.5 per cent to N8, 468.1 billion at the end
of the review period, in contrast to the growth of 25.7 per cent at end-June 2016. As a
percentage of M2, NFA constituted 38.5 per cent, compared with the 32.2 per cent at the
end of the corresponding period of 2016. Also, the contribution of NFA to the growth of M2
was negative 2.9 percentage points, in contrast to the positive contribution of 7.3
percentage points in the corresponding period of 2016.
4.1.7.2 Net Domestic Credit (NDC)
Net domestic credit (NDC) grew by 1.4 per cent to N26, 236.43 billion at end-June 2017,
compared with the growth of 13.9 per cent at the end of the corresponding period of
2016. The development reflected the increase of 7.7 per cent in net claims on the Federal
Government and the 0.02 per cent growth in private sector credit. NDC contributed 1.6
percentage points to the growth in broad money supply, compared with 15.0
percentage points at end-June 2016.
(2,600.00)
(600.00)
1,400.00
3,400.00
5,400.00
7,400.00
9,400.00
11,400.00
13,400.00
15,400.00
17,400.00
Dec 14 Jun 15 Dec 15 Jun 16 Dec 16 Jun 17
N'B
illio
n
Cred. to priv. sector NCLms On Fed.Gov.
Figure 36Distribution of Aggregate Credit to the Economy
(N' Billion)
Source: CBN
4.1.7.2.1 Net Credit to the Government (NCG)
Credit to the Federal Government rose by 7.7 per cent to N5250.48 billion at the end of the
first half of 2017, compared with the growth of 9.7 per cent at the end of the
corresponding half of 2016. The development was due to the growth in holding of
government securities, especially treasury bills by commercial banks, which rose by 9.9
per cent. Net claims on the Federal Government contributed 1.2 percentage points to
the growth of total monetary assets, compared with 0.6 percentage point at end-June
2016.

58
CBN Economic Report for the First Half of 2017
4.1.7.2.2 Credit to the Private Sector (CP)
Credit to the private sector grew by 0.02 per cent to N21, 985.94 billion at end-June 2017,
compared with the 14.6 per cent growth at the end of the corresponding period of 2016.
The development owed wholly, to the 19.3 per cent growth in claims on States and Local
Governments as claims on the core private sector declined by 0.9 per cent. The
contribution of claims on the private sector to the growth of total monetary assets was
0.02 percentage point, compared with 13.6 percentage points at the end of the
corresponding half of 2016.
4.1.7.3 Other Assets (net) (OAN)
Other assets (net) of the banking system fell by 10.5 per cent at end-June 2017,
compared with the decline of 33.4 per cent at the end of the corresponding period of
2016. The development resulted wholly, from the decline in other assets (net) of the CBN.
The contribution of other assets (net) of the banking system to the growth of broad money
was 5.6 percentage points at the end of the review period.
Table 12Growth in Monetary Aggregates Over Preceding December (Per cent)
Dec ‘14 Jun ‘15 Dec ‘15 Jun ‘16 Dec ‘16 Jun ‘17
Domestic Credit (Net)
32.6
11.1
12.1
13.9
23.3
1.4
Claims on Federal Government (Net)
169.3
118.8
152.0
9.7
61.4
7.7
Claims on Private Sector
11.95
4.26
3.28
14.59
17.42
0.02
Foreign Assets (Net) (19.66) (14.44) (18.73) 25.70 61.81 (7.45)
Other Assets (Net) 2.53 (16.88) 1.08 (33.38) (71.51) (10.54)
Total Monetary Assets (M2) 20.55 (0.55) 5.89 10.23 16.76 (6.8)
Quasi-Money
38.73
2.17
(4.58)
9.61 7.52
(4.30)
Money Supply (M1)
(1.82)
(5.25)
24.14
11.05
29.12
(9.59)
Total Monetary Assets (M2)
20.55
(0.54)
5.90
10.23
16.77
(6.8)
Source: CBN
Figure 37Distribution of Private Sector Credit (End-June 2017)
Credit to State and Local Government 5.4%
Credit to core private sector 94.6%
Source: CBN
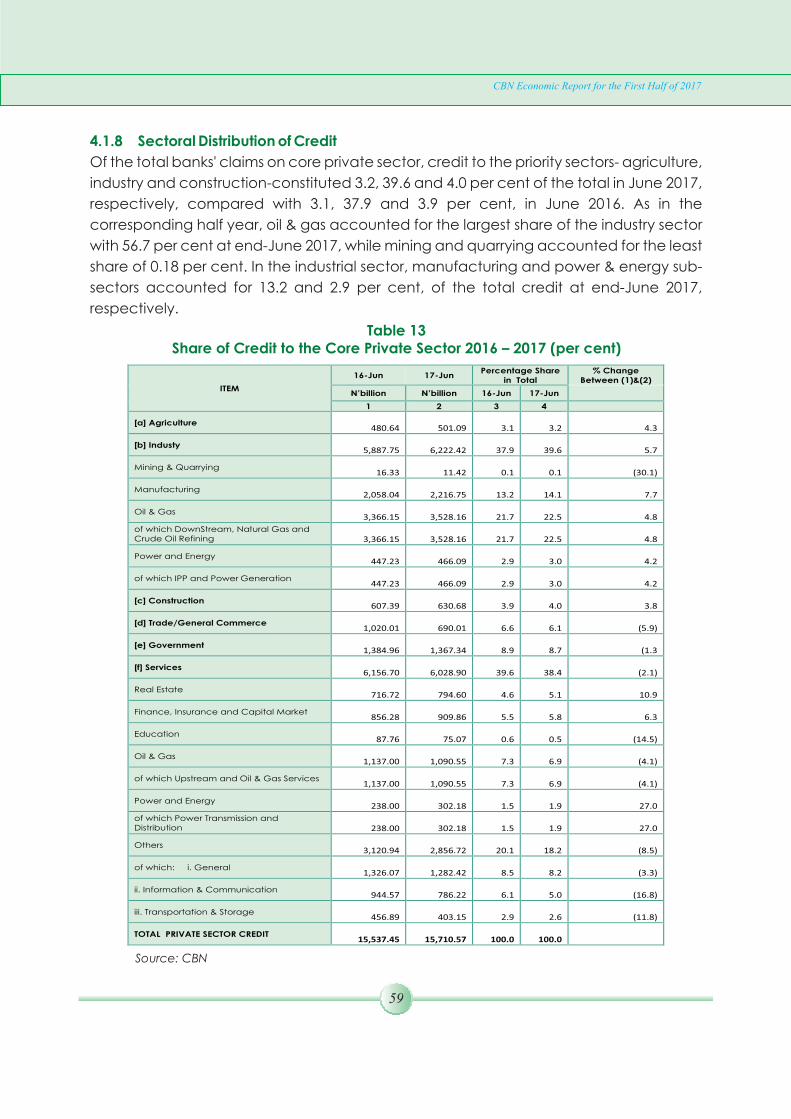
59
CBN Economic Report for the First Half of 2017
Table 13Share of Credit to the Core Private Sector 2016 – 2017 (per cent)
ITEM
16-Jun 17-JunPercentage Share
in Total% Change
Between (1)&(2)
N’billion
N’billion
16-Jun
17-Jun
1
2
3
4
[a] Agriculture
480.64
501.09
3.1
3.2
4.3
[b] Industy
5,887.75
6,222.42
37.9
39.6
5.7
Mining & Quarrying
16.33
11.42
0.1
0.1
(30.1)
Manufacturing
2,058.04
2,216.75
13.2
14.1
7.7
Oil & Gas
3,366.15
3,528.16 21.7 22.5 4.8
of which DownStream, Natural Gas and Crude Oil Refining
3,366.15
3,528.16
21.7
22.5
4.8
Power and Energy
447.23
466.09
2.9
3.0
4.2
of which IPP and Power
Generation
447.23
466.09
2.9
3.0
4.2
[c] Construction
607.39
630.68
3.9
4.0
3.8
[d] Trade/General Commerce
1,020.01
690.01
6.6
6.1
(5.9)
[e] Government
1,384.96
1,367.34
8.9
8.7
(1.3
[f] Services
6,156.70
6,028.90
39.6
38.4
(2.1)
Real Estate
716.72
794.60
4.6
5.1
10.9
Finance, Insurance and Capital Market
856.28
909.86
5.5
5.8
6.3
Education
87.76
75.07
0.6
0.5
(14.5)
Oil & Gas
1,137.00
1,090.55
7.3
6.9
(4.1)
of which Upstream and Oil & Gas Services
1,137.00
1,090.55
7.3
6.9
(4.1)
Power and Energy
238.00
302.18
1.5
1.9
27.0
of which Power Transmission and
Distribution
238.00
302.18
1.5
1.9
27.0
Others3,120.94 2,856.72 20.1 18.2 (8.5)
of which: i. General1,326.07 1,282.42 8.5 8.2 (3.3)
ii. Information & Communication944.57 786.22 6.1 5.0 (16.8)
iii. Transportation & Storage456.89 403.15 2.9 2.6 (11.8)
TOTAL PRIVATE SECTOR CREDIT15,537.45 15,710.57 100.0 100.0
Source: CBN
4.1.8 Sectoral Distribution of Credit
Of the total banks' claims on core private sector, credit to the priority sectors- agriculture,
industry and construction-constituted 3.2, 39.6 and 4.0 per cent of the total in June 2017,
respectively, compared with 3.1, 37.9 and 3.9 per cent, in June 2016. As in the
corresponding half year, oil & gas accounted for the largest share of the industry sector
with 56.7 per cent at end-June 2017, while mining and quarrying accounted for the least
share of 0.18 per cent. In the industrial sector, manufacturing and power & energy sub-
sectors accounted for 13.2 and 2.9 per cent, of the total credit at end-June 2017,
respectively.

60
CBN Economic Report for the First Half of 2017
Figure 38Distribution of Bank Loans and Advances by Maturity
Jun 12 Dec 12 Jun 13 Dec 13 Jun 14 Dec 14 Jun 15 Dec 15' June 16 Dec 16' June '17
Short term Medium-term Long-Term
70605040302010
0
Per
cent
Source: CBN
Similarly, deposits of less than one-year maturity constituted 96.1 per cent (of which 74.9
per cent had maturity of less than 30 days), compared with 95.3 per cent at the end of the
first half of 2016. Further analysis showed that the medium and long-term deposits
constituted 1.0 and 3.0 per cent, respectively, compared with 1.8 and 2.9 per cent at
end-June 2016. Consequently, loan to deposit ratio fell to 79.0 per cent at end June 2017
from 80.5 per cent at end-June 2016, and reflected significant holdings of government
securities by banks as claims on the core private sector also fell.
Although marginal improvements were observed with the long-term deposit and credit
structure during the review period, the continued mis-match of deposits and loans
structure remained a threat to stability of banks and their ability to create long-tenored
assets.
4.1.9 Maturity Structure of DMBs' Outstanding Loans and Advances, and Deposit
Liabilities
The structure of bank's credit in the first half of 2017 indicated that credit of short-term
maturities remained dominant. Credit maturing within one year accounted for 43.7 per
cent, indicating a decline, compared with 46.0 per cent at end-June 2016. The medium-
term (≥1yr and < 3yrs) and long-term (3yrs and above) maturities stood at 18.4 and 37.9
per cent, respectively, compared with 18.1 and 35.9 per cent at the end of the
corresponding period of 2016.

61
CBN Economic Report for the First Half of 2017
Table 14Maturity Structure of Banks Assets and Liabilities
Assets (Loans and Advances) Jun 15 Dec 15 Jun 16 Dec 16 Jun 17
Tenor
0-30 days 24.3 24.4 26.6 27.3 27.9
31-90 days 7.8 8.6 7.1 6.8 6.6
91-181 days 7.7 6.9 7.5 7.2 4.7
181-365 days 4.6 7.2 4.7 5.1 4.4
Short-Term 44.5 47.1 46.0 46.4 43.7
Medium-Term (Above 1yr and below 3yrs)
18.8 16.9 18.1 20.7 18.4
Long-Term (3 Years and Above) 36.7 36.0 35.9 32.9 37.9
100 100 100 100 100
Liabilities
0-30 days 73.01 71.70 75.45 75.91 74.87
31-90 days 13.61 15.04 12.69 11.83 12.88
91-181 days 4.42 3.87 4.02 4.38 4.71
181-365 days 4.45 4.78 3.16 3.51 3.61
Short-Term 95.49 95.40 95.32 95.62 96.07
Medium-Term (Above 1yr and below 3yrs)
1.83 1.83 1.82 1.23 0.98
Long-Term (3 Years and Above) 2.68 2.77 2.85 3.15 2.95
Total 100 100 100 100 100
Figure 39Maturity Structure of Banks Deposits (per cent)
0.0
0.5
1.0
1.5
2.0
2.5
3.0
3.5
0.0
20.0
40.0
60.0
80.0
100.0
Jun 13 Dec 13 Jun 14 Dec 14 Jun 15 Dec 15 Jun 16 Dec 16 Jun 17
Pe
r ce
nt
Pe
r ce
nt
Short-Term Medium-Term Long-Term (RHS)
Source: CBN

62
CBN Economic Report for the First Half of 2017
4.1.10 Market Structure of the Banking Industry
The banking sector exhibited weaker competition among players in the first half of 2017.
The market share of the largest bank, with respect to assets and deposits, stood at 14.8
and 12.9 per cent, respectively, compared with 13.5 per cent and 12.8 per cent at the
end of the first half of 2016. Nineteen smaller banks have market shares ranging from 0.08
to 11.7 per cent of assets and 0.02 to 12.9 per cent of deposits. The Herfindahl-Hirschman 2
Index (HHI) of the industry rose to 783.65 and 737.66 for assets and deposits from 751.17
and 733.37 in assets and deposit, respectively in the first half of 2016.
The concentration ratios of the six largest banks (CR6) were 60.11 (HHI=3,612.97) and 57.1
per cent (HHI=3,254.75) in assets and deposits respectively, compared with 44.89
(HHI=2,011.83) and 51.89 per cent (HHI=2,692.07) at the end of the first half of 2016. This
suggests that oligopoly is possible in the market.
Figure 40aMarket Concentration Ratios of Banks (Assets and Deposits)
Source: CBN
80.00
60.00
40.00
20.00
0.00
CR
June 15 Dec 15 June 16 Dec. 16 June 17
CR 5 (Deposit) CR (Largest Deposit) CR 5 (Assets) CR (Largest Assets)
Figure 40bMeasures of Competition in Banks: Herfindahl- Hirschman Index
850
800
750
700
650Jun 13 Dec 14 Jun ‘14 Dec ‘15 Jun ‘16 Dec ‘16 Jun ‘17
HHI (Deposits) HHI (Assets)
HH
I
Dec ‘14
2 HHI ranges from 0 to 10,000. HHI close to 10,000 suggests a high concentrated market, and HHI close to 0 suggests a more competitive market structure.
Source: CBN

0.00
1.00
2.00
3.00
4.00
5.00
6.00
660680700720740760780800820840860
Dec 13 Jun 14 Dec 14 Jun 15 Dec' 15 Jun 16 Dec' 15 Jun 16 Dec' 16 Jun 17
Rat
io (
%)
N' B
illio
n
Consumer Credit Ratio of claims on core private sector (rhs)
63
CBN Economic Report for the First Half of 2017
4.1.11 Consumer Credit
At N736.19 billion, consumer credit rose by 1.8 per cent at the end of the review period,
compared with the growth of 11.04 per cent at the end of the corresponding period of
2016. At that level, consumer loans constituted 3.5 per cent of total credit to the core
private sector in the first half of 2017, compared with 3.8 per cent at the end of the
corresponding half of 2016. Thus, consumer credit constituted low risk to commercial
banks' exposure to the core private sector.
4.1.12 Money Market Developments
Activities in the money market in the first half of 2017 reflected liquidity conditions in the
banking system. Liquidity was influenced by the fiscal operations of the Federal
Government, operational modalities of CRR, settlements of foreign exchange
interventions, monthly statutory allocation to the three-tiers of government, maturity of
CBN bills and frequent conduct of open market operations. Nonetheless, demand and
supply of funds in the interbank market showed a preference for collateralised
transactions. Average short-term interest rates generally rose relative to their levels in the
corresponding period of 2016.
In addition, in an effort to achieve convergence of the various exchange rates of the
naira to the US dollar at the foreign exchange market, special windows were opened for
foreign exchange transactions to accommodate investors and exporters, end-users for
invisible transactions (excluding international airlines ticket sales remittances) and Bills for
Collection as well as any other trade related payment obligations under the SME
window.
Figure 41Consumer Credit and Ratio of Claims on Core Private Sector
(N' Billion)
Source: CBN

4.1.12.1 Money Market Assets Outstanding
Provisional data indicated that money market assets outstanding at the end of the first
half of 2017 was N11,661.90 billion, showing increase of 7.3 and 11.5 per cent, above the
levels at end-December 2016 and the corresponding half of 2016, respectively. The
development relative to the corresponding half year reflected, mainly, the increase of
6.2 per cent and 27.6 per cent in FGN Bonds and treasury bills outstanding, respectively.
A breakdown of the money market assets outstanding at the end of the first half of 2017
showed that 68.0 per cent was held in FGN Bonds, 32.0 per cent were in NTBs, while
Commercial Papers and Bankers Acceptances accounted for the balance.
Figure 42Money Market Assets Outstanding
(End-June 2017)
32%
68%
NTB FGN Bond Others
Source: CBN
4.1.12.2 Primary Market
At the Nigerian Treasury bill auction, N521.24 billion and N471.81 billion worth of 91-day
bills were subscribed to and allotted, respectively, with bid rates ranging from 9.00 to
25.00 per cent, compared with the range of 3.00 to 13.00 per cent in the corresponding
half of 2016. At the 182-day auction, N576.06 billion and N499.13 billion worth of bills were
subscribed to and allotted at the bid rates of 13.50 to 21.00 per cent, compared with the
64
CBN Economic Report for the First Half of 2017
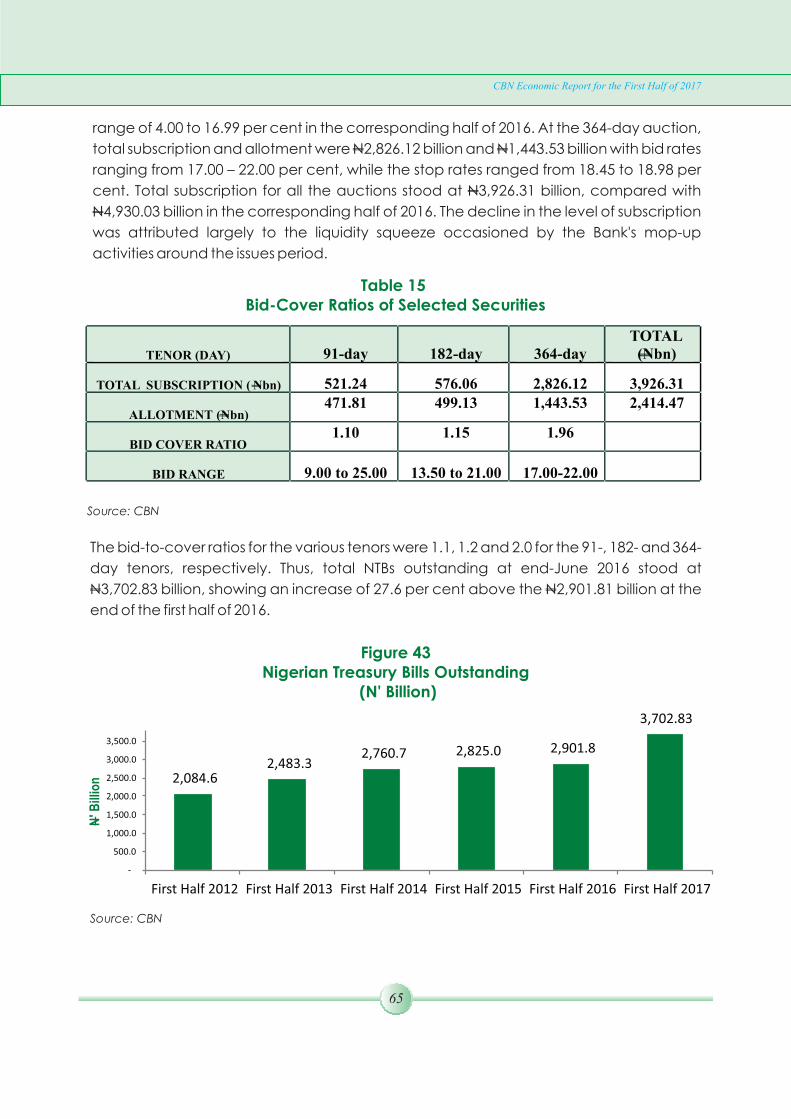
65
CBN Economic Report for the First Half of 2017
Table 15 Bid-Cover Ratios of Selected Securities
TENOR (DAY) 91-day 182-day 364-day TOTAL
(Nbn)
TOTAL SUBSCRIPTION ( Nbn) 521.24 576.06 2,826.12 3,926.31
ALLOTMENT (Nbn) 471.81 499.13 1,443.53 2,414.47
BID COVER RATIO 1.10 1.15 1.96
BID RANGE 9.00 to 25.00 13.50 to 21.00 17.00-22.00
Source: CBN
The bid-to-cover ratios for the various tenors were 1.1, 1.2 and 2.0 for the 91-, 182- and 364-
day tenors, respectively. Thus, total NTBs outstanding at end-June 2016 stood at
N3,702.83 billion, showing an increase of 27.6 per cent above the N2,901.81 billion at the
end of the first half of 2016.
Figure 43Nigerian Treasury Bills Outstanding
(N' Billion)
2,084.6 2,483.3
2,760.7 2,825.0 2,901.8
3,702.83
-
500.0
1,000.0
1,500.0
2,000.0
2,500.0
3,000.0
3,500.0
First Half 2012 First Half 2013 First Half 2014 First Half 2015 First Half 2016 First Half 2017
N' B
illio
n
Source: CBN
range of 4.00 to 16.99 per cent in the corresponding half of 2016. At the 364-day auction,
total subscription and allotment were N2,826.12 billion and N1,443.53 billion with bid rates
ranging from 17.00 – 22.00 per cent, while the stop rates ranged from 18.45 to 18.98 per
cent. Total subscription for all the auctions stood at N3,926.31 billion, compared with
N4,930.03 billion in the corresponding half of 2016. The decline in the level of subscription
was attributed largely to the liquidity squeeze occasioned by the Bank's mop-up
activities around the issues period.

66
CBN Economic Report for the First Half of 2017
4.1.12.3 Federal Government of Nigeria Bonds
In the review period, the CBN in collaboration with the Debt Management Office, issued
a new tranche of the 10-year FGN Bond, while 5-, 10- and 20-year tranches were re-
opened. The term-to-maturity of the bonds ranged from 4 years, 1 month to 19 years, 10
months. Total FGN Bonds offered was N785.00 billion, while public subscription and sale
stood at N1,237.94 billion and N849.53 billion, respectively. The high demand for the
securities was attributed to the liquidity surfeit in the banking system and renewed
investors' confidence. There was no maturity in the period. Thus, the total value of FGN
bonds outstanding at end-June 2017 was N8,614.75 billion, compared with N8,153.96
billion at end-June 2016, representing an increase of 5.7 per cent.
Banks&DHs36%
Non -Bank Pub64%
Banks&DHs Non-Bank Pub
Figure 44Distribution of FGN Bonds (End-June 2017, per cent)
Source: CBN
4.1.12.4 Open Market Operations (OMO)
Open Market Operations remained the main instrument for liquidity management
during the review period, using CBN bills.
4.1.12.5 OMO Auctions
Total amount of CBN bills worth N3,702.96 billion was issued, while public subscription and
sale amounted to N4,593.93 billion and N3,871.27 billion, respectively, compared with
N1,922.45 billion, N3,867.94 billion and N2,329.75 billion offered, subscribed to and sold,
respectively in the second half of 2016. The tenors to maturity of the instruments ranged
from 140 to 364 days in the review period, and the bid rates ranged from 16.00 - 18.86 per
cent. The high level of activity was attributed, largely, to the monthly disbursements to
the three tiers of government, CBN bills maturities, yields on CBN bills and increased

67
CBN Economic Report for the First Half of 2017
number of auctions during the period. The cost of liquidity management in the review
period rose to N577.46 billion, compared with N122.99 billion in the corresponding period
of 2016.
4.1.12.6 The Two-Way Quote Trading in NTBs
Trading at the two-way quote trading platform remained passive in the review period.
There was no trading at the two-way quote platform in the review period same as in the
corresponding half of 2016.
4.1.12.7 Tenored Repurchase Transactions
The market accessed the sum of N352.66 billion at the tenored repurchase window
between January and June 2017. The tenors ranged from 4 to 90 days while total interest
that accrued was N10.31 billion at rates ranging from 18.50 to 19.50 per cent. There was
no Repo transaction in the corresponding period of 2016.
4.1.12.8 Discount Window Operations
CBN Bills worth N5.29 billion with days to maturity ranging from 6 to 129 were rediscounted
at 18.00 to 19.10 per cent in the corresponding period of 2016. Securities valued at N35.36
billion with tenors of 27 – 188 days were rediscounted at rates ranging from 16.25 to 17.15
per cent.
4.1.12.9 Central Bank of Nigeria (CBN) Standing Facilities
To aid short term liquidity needs of the financial market, intraday liquidity facility was
made accessible as a temporary credit window to banks to meet their funding needs
during the operating hours of the CBN Interbank Funds Transfer System (CIFTS). The
Standing Lending Facility (SLF) and the Standing Deposit Facility (SDF) were also available
for players to square up their positions at the close of business. Request for the Standing
Lending Facility (SLF) was more predominant in the review period than the standing
Deposit facility (SDF). Applicable rates at the SLF and SDF windows were 16.00 per cent,
and 9.00 per cent respectively.
4.1.12.9.1 Standing Lending Facility (SLF)
The average request for SLF, inclusive of intra-day liquidity facility (ILF) in the first half of
2017, amounted to N227.52 billion, in 122 transactions, while the actual daily requests
ranged from N83.61 billion to N478.54 billion. Total interest earned was N21.13 billion. In
comparison with the first half of 2016, SLF amounted to N42.55 billion in the 85 transaction
days with a total of N2.92 billion earned as interests.

68
CBN Economic Report for the First Half of 2017
4.1.12.9.2 Standing Deposit Facility (SDF)
The total SDF granted in the review period stood at N45.12 billion, with interest cost at
N1.99 billion, compared with the SDF of N102.46 billion and the interest cost of N2.84 billion
in the corresponding period of 2016.
4.1.12.10 Inter-Bank Funds Market
The total value of funds traded in the market stood at N16,681.97 billion in the first half of
2017, compared with N513.11 billion in the corresponding period of 2016. The value of
unsecured call transactions amounted to N1,063.36 billion or 6.37 per cent, while open
buy back (OBB) transactions stood at N16,681.97 billion or 93.63 per cent. The lower level
of transactions at the unsecured segment was attributed, largely, to the dealers'
preference for the secured transactions.
4.1.13 Interest Rate Developments
4.1.13.1 Money Market Rates
Average money market rates for interbank call and Open-Buy- Back (OBB) moved in
tandem with the level of liquidity in the banking system for most part of the first half of
2017. Short-term rates in all the segments of the money market were volatile and higher
than their levels in the corresponding period of 2016, due to fluctuation in liquidity in the
system. Average inter-bank and OBB rates ranged from 3.00 to 200.00 per cent and 2.51
to 162.4 per cent, respectively. The weighted average monthly inter-bank rate and the
OBB rate for the first half of 2017 were 22.94 per cent and 26.66 per cent, compared with
8.50 per cent and 7.63 per cent in the corresponding half of 2016, respectively. The
weighted average of the Nigeria Inter-Bank Offered Rate (NIBOR) was 29.26 per cent,
compared with 18.64 per cent in the corresponding half of 2016.
Table 16Money Market Rates
(Per cent)
WEIGHTED AVERAGE
Month
MPR Call
Rate
OBB NIBOR 30-
days
Jan-16 14.00 8.29 8.26 8.89
Feb-16 14.00 27.68 23.81 26.18
Mar-16 14.00 12.16 22.85 21.79 Apr-16 14.00 58.73 46.07 57.40 May-16 14.00 18.4 33.46 36.58 Jun-16
14.00
12.37
25.53
24.71
Average 2017
First Half
14.00
22.94
26.66
29.26
Average 2016
First Half
14.00
8.50
7.63
18.64
Source: CBN

69
CBN Economic Report for the First Half of 2017
Figure 45Money Market Rates
(Per cent)
Source: CBN
0
10
20
30
40
50
60
70
Jan 17 Feb 17 Mar 17 Apr 17 May 17 Jun 17
Pe
r ce
nt
MPR Call Rate OBB NIBOR Call
4.1.13.1.1 Deposit Rates
Deposit rates moved in tandem with the level of banking system liquidity and generally
rose in the first half of 2017. The average term deposit rate increased by 3.29 percentage
points to 8.69 per cent above its level in the corresponding half of 2016. Average rates on
deposits of various maturities rose from a range of 2.79 to 6.86 per cent in the first half of
2016 to a range of 8.51 to 9.10 per cent at the end of the first half of 2017. With the year-on-
year inflation rate at 16.1 per cent in June 2017, all deposit rates were negative in real
terms.
4.1.13.1.2 Lending Rates
The weighted average prime and the maximum lending rates rose to 17.35 and 30.05 per
cent, from 16.63 and 26.83 per cent in the first half of 2016. Consequently, the spread
between the average term deposits and maximum lending rates narrowed by 0.05
percentage points to 21.38 percentage points.

70
CBN Economic Report for the First Half of 2017
4.1.14 Institutional Savings
Aggregate financial savings declined by 4.4 per cent to N12,380.00 billion in the first half
of 2017, compared with N12,953.7 billion at the end of the corresponding period of 2016.
DMBs remained the dominant depository institutions in the financial system, accounting
for 95.2 per cent of the total financial savings, the same as in the preceding half year.
Other saving institutions, namely PMBs, life insurance companies, pension fund
custodians, the Nigerian Social Insurance Trust Fund (NSITF), and MFBs accounted for the
balance.
4.1.15 Other Financial Institutions
4.1.15.1 Development Finance Institutions
Total assets of the five (5) reporting development finance institutions (DFIs) namely: Bank
of Industry (BOI), Federal Mortgage Bank of Nigeria (FMBN), Nigerian Export-Import Bank
(NEXIM), Bank of Agriculture (BOA) and The Infrastructure Bank (TIB) increased marginally
by 2.1 per cent to N984.32 billion at end-June 2017, compared with N964.24 billion at end-
December 2016. The Development Bank of Nigeria (DBN) was excluded as it was yet to
commence operations. Similarly, net loans and advances and paid-up share capital of
the sub-sector rose by 18.3 per cent and 0.7 per cent to N676.64 billion and N232.42 billion,
respectively. The shareholders' funds, however, declined by 3.3 per cent to N198.61 billion
at the end of the first half of 2017 due, mainly, to increase in loan provisioning arising from
high loan defaults. A disaggregation of the total assets by institution indicated that BOI,
FMBN, NEXIM, BOA and TIB accounted for 67.7, 21.3, 6.9, 3.4 and 0.7 per cent,
respectively, of the total. Similarly, the respective institutions accounted for 74.5, 19.2, 6.1,
0.1 and 0.1 per cent of the net loans and advances.
Table 17DMBs Deposits and Lending Rates
(Per cent)
Month
Savings
Average Term Deposit Rates
Prime Lending
Maximum Lending
Spread (AVTD-MXLR)
Jan-17 4.22 8.51 16.91 28.88 20.37
Feb-17 4.22 8.51 17.13 29.26 20.75
Mar-17 4.23 8.54 17.43 30.18 21.64 Apr-17 4.24 9.1 17.44 30.31 21.21 May-17 4.08 8.65 17.58 30.75 22.10 Jun-17 4.08 8.72 17.59 30.94 22.22 Average 2016 First Half
3.43
5.4
16.63
26.83
21.43
Average 2017 First Half
4.18
8.67
17.35
30.05
21.38
Source: CBN

71
CBN Economic Report for the First Half of 2017
4.1.15.2 Microfinance Banks (MFBs)
Total assets of the 999 licensed microfinance banks (MFBs), based on provisional data at
end-June 2017, stood at N375.17 billion and represented 6.0 per cent increase over the
level at end-December 2016. Similarly, paid-up capital and shareholders' funds of MFBs
increased by 1.0 per cent and 14.4 per cent to N63.50 billion and N91.24 billion at end-
June 2017, respectively. The increase in paid-up capital and shareholders' fund was
attributed to additional capital injection and increased operating surplus. Total deposit
liabilities and net loans/advances increased by 7.3 and 1.5 per cent to N185.11 billion
and N193.20 billion at end-June 2017, compared with N172.45 billion and N190.31 billion
at end-December 2016, respectively. Aggregate reserves in the first half of 2017
amounted to N27.72 billion, indicating a 64.1 per cent increase over N16.89 billion at end-
December 2016.
Investible funds available to the sub-sector in the review period amounted to N31.36
billion. The funds were sourced, mainly, from N12.66 billion increase in deposits, additional
N10.83 billion accretion to reserves, N2.39 billion in takings from banks and realisation of
other assets worth N4.87 billion. The funds were used, mainly, to increase bank balances
by N9.52 billion, placement with banks (N7.91 billion), short term investment (N3.28 billion),
loans and advances (N2.89 billion) and acquisition of fixed assets (N1.33 billion). The funds
were also used to reduce other liabilities and long-term loans by N3.76 billion and N1.64
billion, respectively.
4.1.15.3 Finance Companies (FCs)
The number of finance companies (FCs) at end-June 2017 stood at 77, inclusive of two (2)
newly licensed institutions that were yet to commence operations and five (5) that had
returned their licences to the CBN, pending liquidation. The total assets and liabilities of
finance companies (FCs) decreased marginally by 0.63 per cent to N121.02 billion at
end-June 2017, compared with N121.79 billion at end-December 2016. The decrease in
total assets was attributed to operational losses arising from the effect of the economic
downturn. Loans/advances increased by 1.01 per cent to N40.98 billion at the end of the
first half of 2017, compared with N40.57 billion at end-December 2016. Similarly,
shareholders' funds increased marginally to N21.87 billion at end-June 2017, above
N21.60 billion at end-December 2016, reflecting the effect of the regulatory induced
recapitalisation exercise. Investments, balances with banks and fixed assets, however,
decreased by 7.2, 18.8 and 3.2 per cent to N14.29 billion, N2.12 billion and N13.47 billion at
end-June 2017 below the N15.40 billion, N2.61 billion and N13.91 billion at end-December
2016, respectively.

Investible funds available to the sub-sector in the review period amounted to N2.42
billion. The funds were sourced from reduction in investments worth N1.09 billion, N0.49
billion in balances with banks, realisation of fixed assets worth N0.43 billion and increase in
long-term borrowing of N0.075 billion. The funds were utilised, mainly, to reduce other
liabilities (N1.05 billion), acquire other assets (N0.63 billion) and increase loans and
advances (N0.40 billion).
72
CBN Economic Report for the First Half of 2017
Table 18Key Finance Companies Financial Highlights, June 30, 2017
June 2017
(N’ billion) December 2016
(N’ billion) % Change
Total Assets 121.02 121.79 (0.63)
Cash in Vault 1.69 1.69 0
Balances with Banks 2.12 2.61 (18.8)
Loans and Advances 40.98 40.57 1.0
Borrowings 71.47 71.53 0.09
Investments 14.29 15.40 (7.2) Fixed Assets 13.47 13.91 (3.2) Reserves 2.75 2.43 13.2 Paid-up Capital 19.11 19.18 (0.3)
Source: CBN
4.1.15.4 Primary Mortgage Banks (PMBs)
The number of PMBs in operation was thirty-four (34) at end-June 2017, same as at end-
December 2016. Following the upgrade of Safetrust Mortgage Bank Limited from state to
a national PMB, there were 11 national PMBs and 23 state PMBs at end-June 2017,
compared with ten (10) national and 24 state PMBs in the first half of 2016. Total loans and
advances, short-term investments, non-current assets held for sale, and placement with
banks increased by 10.0, 7.0, 3.0 and 4.0 per cent, respectively, to N169.83 billion, N9.48
billion, N68.03 billion and N37.20 billion at end-June 2017. Total assets of PMBs, however,
fell marginally by 0.8 per cent to N380.51 billion at end-June 2017, compared with N383.67
billion at end-December 2016, reflecting, mainly, the decline in deposits. Shareholders'
funds amounted to N127.30 billion at end-June 2017, compared with N132.18 billion at
end-December 2016, indicating 3.7 per cent decrease due, mainly, to operating losses.
Investible funds available to the sub-sector at end-June 2017 amounted to N39.10 billion.

73
CBN Economic Report for the First Half of 2017
The funds were sourced, mainly, from decrease in placement with banks (N20.49 billion),
increase in other liabilities (N10.53 billion), increase in long-term loans (N4.06 billion) and
decline in cash balances (N3.58 billion). The funds were utilised to increase loans and
advances by N15.37 billion, fund decline in placement from banks worth N14.08 billion,
finance increase in non-current asset investments held for sale valued at N1.67 billion and
increased placements with banks by N1.26 billion.
Table 19Key PMB Financial Highlights as at June 30, 2017
June 2017
(N’ billion)
December 2016
(N’ billion) % Change
Total Assets
380.51
383.67
(0.8)
Loans and Advances 169.83
154.46
10.0
Placement with Banks 37.20 35.94 4.0
Deposit Liabilities 114.98 115.77 (0.7)
Other Liabilities
80.58
68.06
18.0
Shareholders’ funds
127.30
132.18
(3.7)
Source: CBN
4.1.15.5 Bureaux-De-Change (BDCs)
There were 3,292 BDCs in operation in the first half of 2017, compared with 3,147 at end-
December 2017. The increase was due to the licensing of 89 new BDCs and the
reinstatement of 56 previously licensed BDCs following their successful recapitalisation. In
the review period, the Bank established an inter-departmental committee for effective
coordination and information sharing on BDCs to guide policy decision.
4.1.15.6 Asset Management Corporation of Nigeria (AMCON)
Total recoveries by AMCON was N39.70 billion as at May 31, 2017, made up of cash
recovery (N28.52 billion) and asset forfeiture (N11.18 billion). Contributions to the Banking
Sector Resolution Cost Fund for 2017 amounted to N184.98 billion at end-June 2017, while
arrears for 2016 worth N5.91 billion were collected in the review period.

74
CBN Economic Report for the First Half of 2017
4.1.16 Capital Market Developments
4.1.16.1 Institutional Developments
The Securities and Exchange Commission (SEC) sustained the implementation of market
deepening polices and on-going engagements with stakeholders to further consolidate
the rally in the capital market during the review period. In this regard, the Commission
conducted target inspection of three (3) capital market operators and selected
registrars to verify the value of unclaimed dividends paid by registrars from November
2015 to October 2016. In addition, the SEC approved the 2017 joint Anti-Money
Laundering/Combating the Financial Terrorism (AML/CFT) and Prudential Inspection Plan
on capital market operators with head offices in Abuja. Furthermore, the final report on
National Risk Assessment was considered to highlight capital market-related findings for
consideration by the Commission.
In furtherance of the investor education initiative, the Commission considered the
proposal by the Nigeria Educational Research and Development Council (NERDC) for
the introduction of capital market studies in the basic and senior secondary school
curricula. Other major activities of the Commission in the first half of 2017 were:
· Training of bank officials and other stakeholders on e-dividend mandate
management process and resolution of impediments in the process;
· Development of framework on collaboration with financial market dealers
quotation (FMDQ) to enhance synergy and efficiency on product innovations;
and
· Participation at the 3rd AML/CFT Stakeholders' Consultative Workshop and
Recognition Award at the CBN International Training Institute on March 22-23,
2017.
With respect to investor protection, the Commission received 164 complaints against
capital market operators in the first half of 2017, compared with 312 complaints received
in the corresponding half of 2016. A total of 220 cases were resolved in the review period,
including complaints carried over from the previous year.

75
CBN Economic Report for the First Half of 2017
Figure 46Complaints received and resolved, end-June 2017
312
164
421
220
0
100
200
300
400
500
First Half 2016 First Half 2017complaints received complaints resolved
Nu
mb
er
of
Co
mp
lain
ts
Source: CBN
4.1.16.2 The Nigerian Stock Exchange (NSE)
Developments in the Nigerian stock market during the first half of 2017 were mixed. In the
primary market segment, there were twelve (12) new issues, comprising eight (8) rights
issues, three (3) bonus issues and one (1) equity conversion. No new listing was recorded
in the debt securities segment in the review period. In the secondary segment of the
market, aggregate volume of traded securities fell by 29.0 per cent to 44.2 billion shares,
while the value of traded securities rose by 50.1 per cent to N468.80 billion, compared
with 62.0 billion shares valued at N312.2 billion in the corresponding period of 2016.
Relative to the levels at end-June 2016, aggregate market capitalisation and All-Share
Index (ASI) rose by 10.0 and 11.9 per cent to N19.0 trillion and 33,117.48 at end-June 2017,
respectively.
4.1.16.3 The New Issues Market
The Exchange recorded twelve (12) new equity listings in the first half of 2017. The new
equity issues comprised eight (8) rights issues worth N68.38 billion, three (3) bonus issues
worth N8.99 billion and one (1) equity conversion valued at N1.98 billion. Overall, a total
of N79.35 billion was raised from new listings in the review period.
4.1.16.4 The Secondary Market
Developments in the secondary segment of the Nigerian Stock market were mixed in the
first half of 2017. The aggregate volume of traded securities fell by 29.0 per cent to 44.2
billion shares, while the value of traded securities rose by 50.1 per cent to N468.8 billion,

76
CBN Economic Report for the First Half of 2017
compared with 62.0 billion shares valued at N312.2 billion in the corresponding period of
2016. The equities sub-sector maintained its dominance in the market, accounting for
99.9 per cent and 99.8 per cent of the aggregate volume and value of transactions,
respectively, while the debt market accounted for the balance. Sectoral analysis of the
developments in the market indicated that the financial services sector (measured by
volume of transactions), remained the most active, accounting for 36.6 billion shares in
traded securities (82.8% of the total), valued at N214.7 billion (45.8% of the total), in
263,465 deals, compared with 48.9 billion shares, valued at N175.9 billion in 252,377 deals
in the first half of 2016. This was followed by the conglomerates with 2.2 billion shares
valued at N5.4 billion in 20,862 deals. The banking sub-sector was the most active on the
Exchange (measured by volume) with traded volume of 23.7 billion shares, valued at
N203.3 billion in 215,587 deals.
Figure 47Volume and Value of Transactions at the NSE
0.0
100.0
200.0
300.0
400.0
500.0
600.0
0.0
10.0
20.0
30.0
40.0
50.0
60.0
70.0
First half 2015 First half 2016 First half 2017V
alu
e in
Nai
ra (
bill
ion
)
Vo
lum
e in
Nu
me
r (B
illio
n)
Volume of traded securities (LHS) Value of securities (RHS)
Source: Securities and Exchange Commission (SEC)/Nigerian Stock Exchange (NSE)
4.1.16.5 All-Share Index and Aggregate Market Capitalisation
The NSE All Share Index rose by 23.2 per cent and 11.9 per cent to 33,117.48 at end-June
2017, compared with 26,874.6 and 29,597.79 at end-December 2016 and end-June 2016,
respectively. Aggregate market capitalisation of listed securities closed at N19.03 trillion,
indicating an increase of 17.5 and 10.1 per cent over the levels at end-December 2016
and the corresponding period of 2016, respectively. Listed equities accounted for 60.2
per cent of the aggregate market capitalisation, while the debt component accounted
for the balance of 39.8 per cent. The top twenty (20) most capitalised companies on the
Exchange accounted for 86.8 per cent (N9.94 trillion) of the total equity capitalisation

77
and 52.2 per cent of the aggregate (equity plus debt) market capitalisation. Eight (8)
banks made the list of the top twenty (20) most capitalised companies and accounted
for N2.6 trillion (16.8%) of the total equity market capitalisation, compared with 18.6 per
cent in the corresponding period of 2016. As a percentage of nominal GDP, aggregate
market capitalisation stood at 35.9 per cent at end-June 2017, compared with 37.8 per
cent in the corresponding period of 2016. The development indicated lower growth of
the total market capitalisation as a result of the slowness in the emergence of the capital
market from the era of depressed investor appetite.
CBN Economic Report for the First Half of 2017
4.2 FISCAL OPERATIONS
4.2.1 Federation Account Operations
Provisional federally-collected revenue (gross) in the first half of 2017 stood at N2,992.83
billion or 5.6 per cent of GDP. The amount was lower than the proportionate budget
estimate by 44.3 per cent, but was above the level in the corresponding period of 2016 by
24.9 per cent. The drop in federally-collected revenue relative to the budget estimate
was attributed to the decline in both oil and non-oil revenue. Of the total revenue, oil
constituted 53.9 per cent, while non-oil accounted for the balance of 46.1 per cent.
Figure 48Aggregate Market Capitalisation and NSE Value Index
15.5
16
16.5
17
17.5
18
18.5
19
19.5
-
5,000.00
10,000.00
15,000.00
20,000.00
25,000.00
30,000.00
35,000.00
40,000.00
45,000.00
1st
Hal
f 2
01
4
1st
Hal
f 2
01
5
1st
Hal
f 2
01
6
1st
Hal
f 2
01
7
Nai
ra T
rilli
on
Ind
ex
NSE Index Aggregate Market Capitalisation
Source: SEC/NSE

78
CBN Economic Report for the First Half of 2017
Figure 49Structure of Federation Revenue Gross (Per cent),
First Half 2013 - 2017
Sources: Computation based on data from: The Office of Accountant General of the Federation (OAGF) and the Federal Ministry of Finance (FMF
75.9 70.5 59.4
50.2 53.9
24.1 29.5 40.6
49.8 46.1
15.0 25.0 35.0 45.0 55.0 65.0 75.0 85.0 95.0
2013 2014 2015 2016 2017
Oil Revenue Non-Oil Revenue
At N1,613.02 billion or 3.0 per cent of GDP, provisional oil revenue (gross) fell below the
proportionate budget estimate by 40.2 per cent, but rose above the level in the first half
of 2016 by 34.0 per cent. The drop in oil revenue relative to the proportionate budget
estimate was attributed to the decline in the volume of production and exports during
the period. Relative to the budgeted benchmark of 2.2 million barrels per day (mbd),
crude oil production averaged 1.62 mbd. The oil revenue gross comprised: Domestic
Crude Oil/Gas Sales, N723.25 billion (44.8%); PPT/Royalties, N645.86 billion (40.0%); Crude
Oil and Gas Exports, N213.17 billion (13.2%); and “Others”, N30.74 billion (2.0%),
respectively.
Earnings lodged in Federation Account by virtue of Section 161 of the Federal Republic of Nigeria Constitution 1999 as amended

79
CBN Economic Report for the First Half of 2017
Figure 50Composition of Oil Revenue, (Per cent)
First Half 2017
Sources: The OAGF and the FMF
The sum of N460.65 billion and N13.89 billion from the oil revenue (gross) were utilised by
the Joint Venture Cash (JVC) calls and cost of collection by the Department of Petroleum
Resources (DPR), respectively, while N157.06 billion was transferred to “Others”. The
balance of N981.43 billion was, however, retained in the Federation Account for
distribution among the three tiers of government and the 13% Derivation Fund.
At N1,379.80 billion or 2.6 per cent of GDP, the provisional non-oil Revenue (gross) was
below the proportionate budget estimate by 48.3 per cent, but was above the level in
the corresponding period of 2016 by 15.7 per cent. The decline in non-oil revenue relative
to the budget estimate was attributed to the lull in economic activities and was reflected
in all its components. The non-oil revenue gross comprised: Value Added Tax (VAT),
N465.31 billion (33.7%); Corporate Tax, N365.33 billion (26.5%); Customs and Excise Duties,
N294.84 billion (21.4%); FGN Independent Revenue, N119.38 billion (8.7%) and “Others”,
N134.94 billion (9.7%).
4 Include Excess Crude Revenue, Excess PPT/Royalty & NNPC Refunds5 Include Education Tax Fund; Customs Special Levies (Federation and Non-Federation); and National Information Technology
Development Fund (NITDF).
Crude Oil / Gas Exports13.2%
PPT & Royalties40.0%
Domestic Crude Oil / Gas Sales
44.8%
Others2.0%

80
CBN Economic Report for the First Half of 2017
Figure 51Composition of Non-Oil Revenue, (Per cent)
First Half 2017
Sources: The OAGF and the FMF
Corporate
Tax26.5%
Customs &
Excise Duties21.4%
Value-Added
Tax33.7%
FGN
Independent Revenue
8.7%
'Others'
9.7%
The sum of N54.64 billion, N25.42 billion, and N0.08 billion were deducted from the non-oil
revenue as combined cost of collection for the Federal Inland Revenue Service (FIRS)
and Nigeria Customs Service (NCS), FIRS Tax refunds and NCS refunds, respectively,
leaving a net distributable balance of N1,299.67 billion.
Overall, of the N2,281.09 billion federally-collected revenue (net), N446.70 billion (19.6%),
N134.94 billion (5.9%) and N119.38 billion (5.2%), were transferred to the VAT Pool
Account, Other Transfers and FG Independent Revenue, respectively. The balance of
N1,580.07 billion (69.3%) was retained in the Federation Account for distribution to the
three tiers of government and the 13% Derivation Fund.
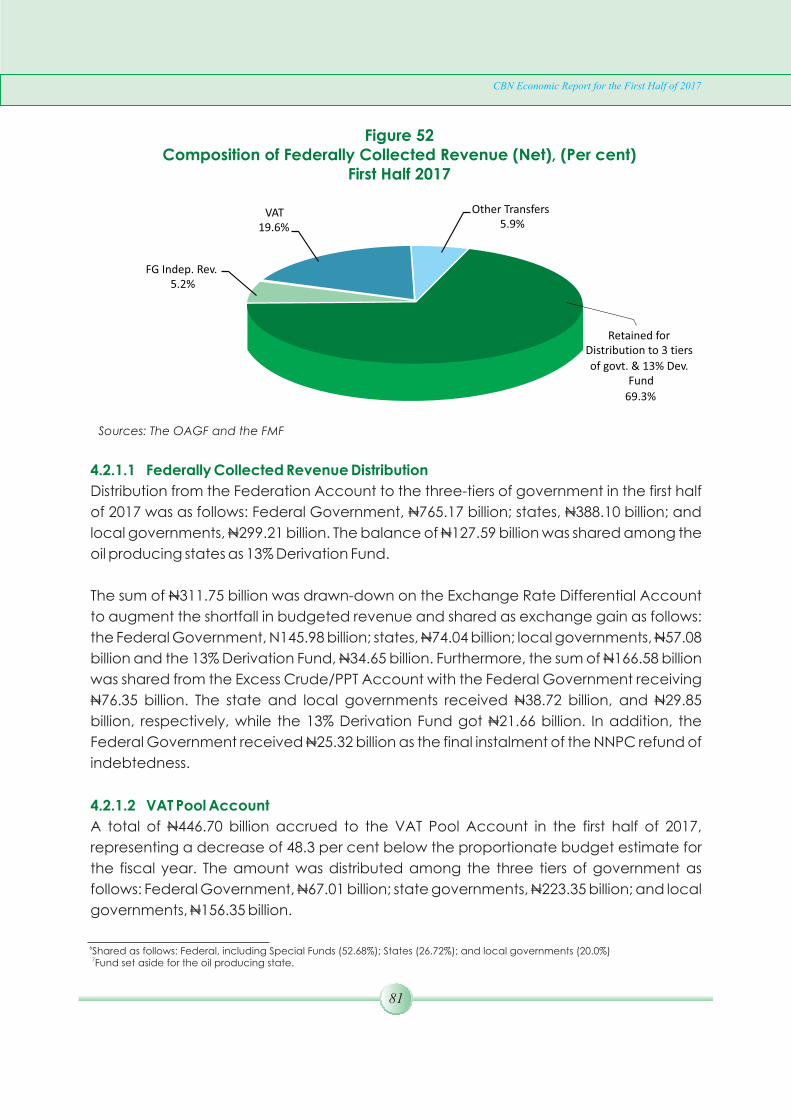
81
CBN Economic Report for the First Half of 2017
Figure 52Composition of Federally Collected Revenue (Net), (Per cent)
First Half 2017
Retained for Distribution to 3 tiers
of govt. & 13% Dev. Fund
69.3%
FG Indep. Rev.5.2%
VAT19.6%
Other Transfers5.9%
Sources: The OAGF and the FMF
4.2.1.1 Federally Collected Revenue Distribution
Distribution from the Federation Account to the three-tiers of government in the first half
of 2017 was as follows: Federal Government, N765.17 billion; states, N388.10 billion; and
local governments, N299.21 billion. The balance of N127.59 billion was shared among the
oil producing states as 13% Derivation Fund.
The sum of N311.75 billion was drawn-down on the Exchange Rate Differential Account
to augment the shortfall in budgeted revenue and shared as exchange gain as follows:
the Federal Government, N145.98 billion; states, N74.04 billion; local governments, N57.08
billion and the 13% Derivation Fund, N34.65 billion. Furthermore, the sum of N166.58 billion
was shared from the Excess Crude/PPT Account with the Federal Government receiving
N76.35 billion. The state and local governments received N38.72 billion, and N29.85
billion, respectively, while the 13% Derivation Fund got N21.66 billion. In addition, the
Federal Government received N25.32 billion as the final instalment of the NNPC refund of
indebtedness.
4.2.1.2 VAT Pool Account
A total of N446.70 billion accrued to the VAT Pool Account in the first half of 2017,
representing a decrease of 48.3 per cent below the proportionate budget estimate for
the fiscal year. The amount was distributed among the three tiers of government as
follows: Federal Government, N67.01 billion; state governments, N223.35 billion; and local
governments, N156.35 billion.
6Shared as follows: Federal, including Special Funds (52.68%); States (26.72%); and local governments (20.0%)7 Fund set aside for the oil producing state.

82
4.2.1.3 Cumulative Distribution
The total statutory revenue distributed to the three-tiers of government and the 13%
Derivation Fund amounted to N2,530.42 billion in the first half of 2017. This was below the
2017 proportionate budget estimate of N4,701.45 billion by 46.2 per cent, but was above
the N1,984.65 billion distributed in the first half of 2016 by 27.5 per cent. The amount
comprised the Federation Account, N1,580.07 billion (62.4%); other statutory revenue
(including Exchange Gain, Excess Crude/PPT and NNPC Refunds), N503.66 billion (19.9%);
and VAT Pool Account, N446.70 billion (17.7%).
CBN Economic Report for the First Half of 2017
8 Shared as follows: Federal (15.0%); States (50.0%) and local governments (35.0%)
Figure 53Cummulative Distributions to the Tiers of Government and
13% Derivation Fund (N' Billion)First Half 2017
Sources: The OAGF and the FMF
13% Derivation Fund
Local Governments
State Governments
Federal Governmment
183.90
542.49
724.22
1,079.82
0 200 400 600 800 1000 1200
4.2.2 Federal Government Finances
4.2.2.1 Federal Government Fiscal Balance
Provisional Data showed that the fiscal operations of the Federal Government in the first
half of 2017 resulted in an estimated overall deficit of N379.72 billion or 0.7 per cent of
GDP, compared with that of the proportionate budget estimate and the corresponding
period of 2016 at N1,178.39 billion and N1,211.46 billion, respectively. The deficit was
financed mainly from domestic sources.

83
CBN Economic Report for the First Half of 2017
4.2.2.2 Federal Government Retained Revenue
At N2,505.53 billion or 4.7 per cent of GDP, the provisional retained-revenue of the Federal
Government was lower than the proportionate budget estimate by 7.1 per cent. It was,
however, higher than the level in the first half of 2016 by 91.9 per cent. The development
relative to the proportionate budget estimate was attributed to the drop in revenue from
oil and non-oil sources. A breakdown of the retained-revenue revealed that the share
from the Federation Account was N765.17 billion (30.5%); Federal Government
Independent Revenue, N119.38 billion (4.8%); Exchange Gain, N145.98 billion (5.8%); VAT
Pool Account, N67.01 billion (2.7%); Excess Crude, N106.60 billion (4.3%); NNPC Refund,
N25.32 billion (1.0%) and 'Others', N1,276.09 billion (50.9%).
Figure 54FGN Fiscal Balance (N' Billion)
First Half 2013 - 2017
-1400.00
-1200.00
-1000.00
-800.00
-600.00
-400.00
-200.00
0.00
2013 2014 2015 2016 2017
-415.40
-247.66
-676.47
-1,211.46
-379.72
Source: The OAGF and the FMF

Federation
Account30.5%
FGN IR
4.8%Exchange
Gain 5.8%
VAT
2.7%
Excess
Crude/PPT4.3%
NNPC
Refund1.0%
Others
50.9%
84
CBN Economic Report for the First Half of 2017
Figure 55Composition of Federal Government Retained Revenue, (Per cent)
First Half 2017
Sources: The OAGF and the FMF
4.2.2.3 Federal Government Expenditure
Provisional data indicated that the aggregate expenditure of the Federal Government
in the first half of 2017 was N2,885.25 billion or 5.4 per cent of GDP. This was below the
proportionate budget estimate by 25.6 per cent, but was above the level in the
corresponding period of 2016 by 14.6 per cent. The development relative to the
proportionate budget estimate reflected largely, non-capital releases owing to the
delay in the passage of the 2017 budget, extension of 2016 capital budget
implementation to May 5, 2017 and the need for MDAs to finalise their procurement
processes. Non-debt expenditure was below the proportionate budget estimate by 33.8
per cent and constituted 67.8 per cent of total expenditure. Total interest payments
amounted to N927.74 billion, representing 37.0 and 32.2 per cent of Federal Government
retained revenue and total expenditure, respectively.

85
CBN Economic Report for the First Half of 2017
Figure 56Composition of Federal Government Expenditure, (Per cent)
First Half 2017
Sources: The OAGF
At N2,676.23 billion, provisional recurrent expenditure rose by 4.1 per cent above the
proportionate budget estimate and accounted for 92.8 per cent of total expenditure. As
a percentage of GDP, recurrent expenditure was 5.0 per cent, compared with 3.3 per
cent in the first half of 2016. A breakdown of the recurrent expenditure showed that the
goods and services component, at N1,323.06 billion or 49.4 per cent of the total, fell
below the proportionate budget estimate by 11.5 per cent owing largely, to the decline
in personnel cost. Further analysis of the goods and services component showed that
personnel cost accounted for N723.89 billion (54.7%), while overhead cost and pension
were N455.89 billion (34.5%) and N143.28 billion (10.8%), respectively.
Interest payments, which was 34.7 per cent of total recurrent expenditure or 1.7 per cent
of GDP, rose by 0.8 per cent to N927.74 billion, compared with the proportionate budget
estimate of N920.67 billion. Of this amount, N871.94 billion (94.0%) was expended on
domestic debt service, while the balance of N55.80 billion (6.0%) was for external debt
service. Transfers to special funds (FCT, Stabilisation Fund, Development of Natural
Resources and Ecology Fund) and “Others” accounted for N425.44 billion or 15.9 per
cent of total recurrent expenditure.
Recurrent 92.8%
Transfers7.2%
9 Include interest payments on CBN Overdraft.
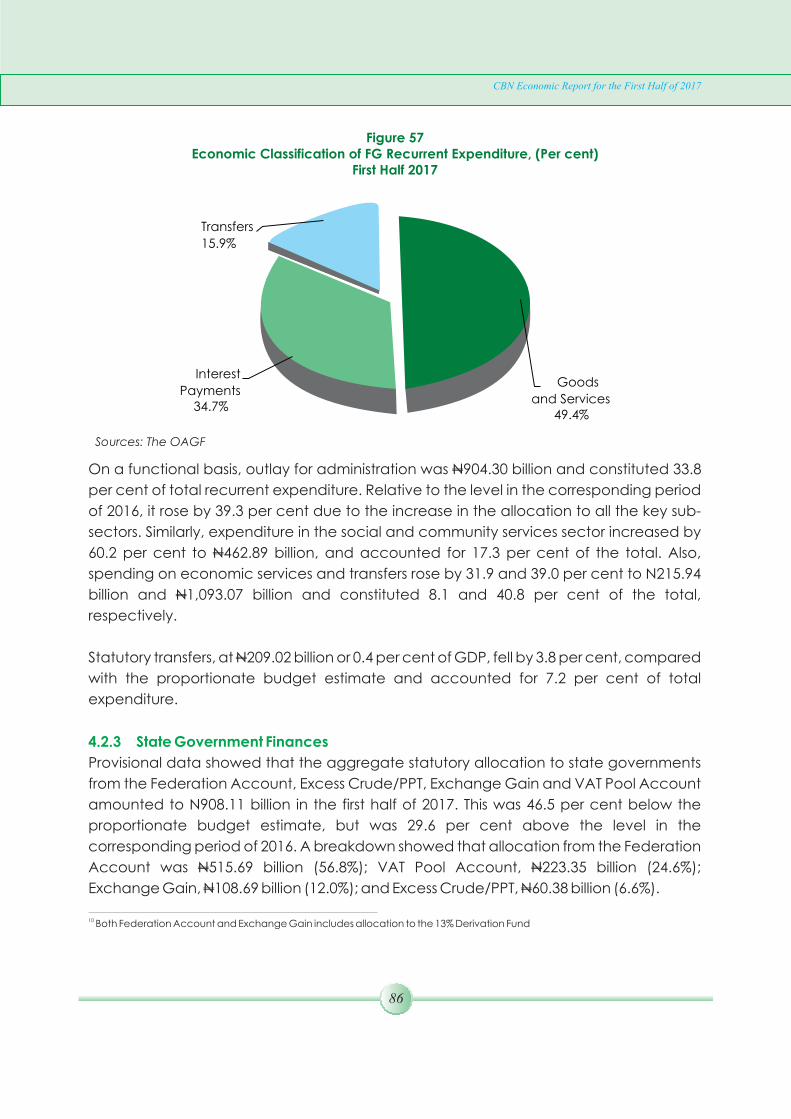
86
CBN Economic Report for the First Half of 2017
Figure 57Economic Classification of FG Recurrent Expenditure, (Per cent)
First Half 2017
10 Both Federation Account and Exchange Gain includes allocation to the 13% Derivation Fund
On a functional basis, outlay for administration was N904.30 billion and constituted 33.8
per cent of total recurrent expenditure. Relative to the level in the corresponding period
of 2016, it rose by 39.3 per cent due to the increase in the allocation to all the key sub-
sectors. Similarly, expenditure in the social and community services sector increased by
60.2 per cent to N462.89 billion, and accounted for 17.3 per cent of the total. Also,
spending on economic services and transfers rose by 31.9 and 39.0 per cent to N215.94
billion and N1,093.07 billion and constituted 8.1 and 40.8 per cent of the total,
respectively.
Statutory transfers, at N209.02 billion or 0.4 per cent of GDP, fell by 3.8 per cent, compared
with the proportionate budget estimate and accounted for 7.2 per cent of total
expenditure.
4.2.3 State Government Finances
Provisional data showed that the aggregate statutory allocation to state governments
from the Federation Account, Excess Crude/PPT, Exchange Gain and VAT Pool Account
amounted to N908.11 billion in the first half of 2017. This was 46.5 per cent below the
proportionate budget estimate, but was 29.6 per cent above the level in the
corresponding period of 2016. A breakdown showed that allocation from the Federation
Account was N515.69 billion (56.8%); VAT Pool Account, N223.35 billion (24.6%);
Exchange Gain, N108.69 billion (12.0%); and Excess Crude/PPT, N60.38 billion (6.6%).
Sources: The OAGF
Goods
and Services49.4%
Interest
Payments34.7%
Transfers
15.9%

87
CBN Economic Report for the First Half of 2017
Figure 58Composition of Total Allocations to State Governments, (Per cent)
First Half 2017
Source: The FMF
The sum of N112.92 billion was, however, deducted as state governments' contractual 11obligations from the share of Federation Account, leaving a net distributable balance
of N402.77 billion. Of the net sum, N275.18 billion was distributed to the 36 states of the
Federation and the balance of N127.59 billion, being 13% Derivation Fund, was allocated
to the oil-producing states. In addition, the state governments received N112.76 billion
from the distributions from Exchange Gain and Excess Crude/PPT Accounts, while the
13% Derivation Fund got N56.31billion.
Overall, the net aggregate allocation, including the VAT Pool Account to the states and
13% Derivation Fund, was above the level in the first half of 2016 by 53.2 per cent. Further
analysis of the state governments' aggregate allocation showed that Akwa Ibom, Rivers
and Lagos states received 8.1, 6.9 and 6.2 per cent of the total, respectively. Kwara,
Ebonyi and Ekiti states received the least with approximately 1.8 per cent each.
4.2.4 Local Government Finances
Provisional aggregate statutory allocation to the 774 local governments from the
Federation Account, Exchange Gain, Excess Crude/PPT and VAT Pool Account was
N542.49 billion in the first half of 2017, indicating a decrease of 47.1 per cent relative to the
proportionate budget estimate. The breakdown revealed that allocations from the
Federation Account was N299.21 billion (55.2%); Exchange Gain, N57.08 billion (10.5%);
Federation Acct
56.8%
Exchange Gain
12.0%
VAT
24.6%
Ecess Crude/PPT
6.6%
11 Include contribution to external debt service fund, payments for fertilizer, State Agricultural Project, National Fadama Project
and the National Agricultural Technology Support Programme.

88
CBN Economic Report for the First Half of 2017
Excess Crude/PPT, N29.85 billion (5.5%); and VAT Pool Account, N156.35 billion (28.8%).
Allocation to local governments on state basis indicated that Lagos, Kano and Katsina
ranked highest with 6.5, 5.8 and 4.1 per cent of the total, respectively. Conversely, Ebonyi,
Gombe and Bayelsa ranked least with 1.6, 1.5 and 1.2 per cent, respectively.
Figure 59Composition of Statutory Allocations to Local Governments, (Per cent)
First Half 2017
VAT
28.8%
Exchange Gain
10.5%
Federation
Account 55.2%
Excess Crude
5.5%
Source: The FMF
24.2.5 Public Debt
4.2.5.1 Consolidated Federal Government Debt
The consolidated debt stock of the Federal Government at end-June 2017 stood at
N16,636.33 billion or 15.6 per cent of GDP. This represented an increase of 14.4 per cent
over the level at end-December 2016. Of the total debt stock, domestic debt was
N12,033.45 billion or 72.3 per cent, while external debt amounted to N4,602.88 billion
(US$15.05 billion) or 27.7 per cent of the total.
12 Public Debt Data are sourced from the Debt Management Office (DMO)

89
CBN Economic Report for the First Half of 2017
Figure 60Composition of Federal Government Consolidated Debt, (Per cent)
End-March 2017
Source: The Debt Management Office (DMO)
External27.7%
Domestic72.3%
4.2.5.2 Domestic Debt
At N12,033.45 billion or 11.3 per cent of GDP, the Federal Government securitised
domestic debt at end-June 2017 was above the level at end-December 2016 by 8.8 per
cent. The increase was due to the issuance of additional FGN Bonds and Nigeria Treasury
Bills (NTBs) to bridge Federal Government of Nigeria financing gap and further deepen
the domestic bond market. Consequently, the stock of FGN Bonds and NTBs increased
by 13.0 and 7.5 per cent to N8,134.9 and N3,702.8 billion, respectively, above the levels at
end-December, 2016.
Further analysis indicated that the holders of the total outstanding domestic debt
instruments were: banking system, including Sinking Fund (67.9%); and non-bank public
(32.1 %).
4.2.5.3 External Debt
Total external debt stock (Federal and states, including the Federal Capital Territory) at
end-June 2017 was US$15.05 billion or 4.3 per cent of GDP. This represented an increase of
31.9 per cent above the level at end-December 2016, reflecting largely, additional
multilateral loan of US$1.69 billion for infrastructure funding. A decomposition by holders
indicated that 64.3 per cent of the total debt stock was owed to the multilateral creditors,
while the balance of 35.7 per cent was for non-Paris bilateral and commercial debt.
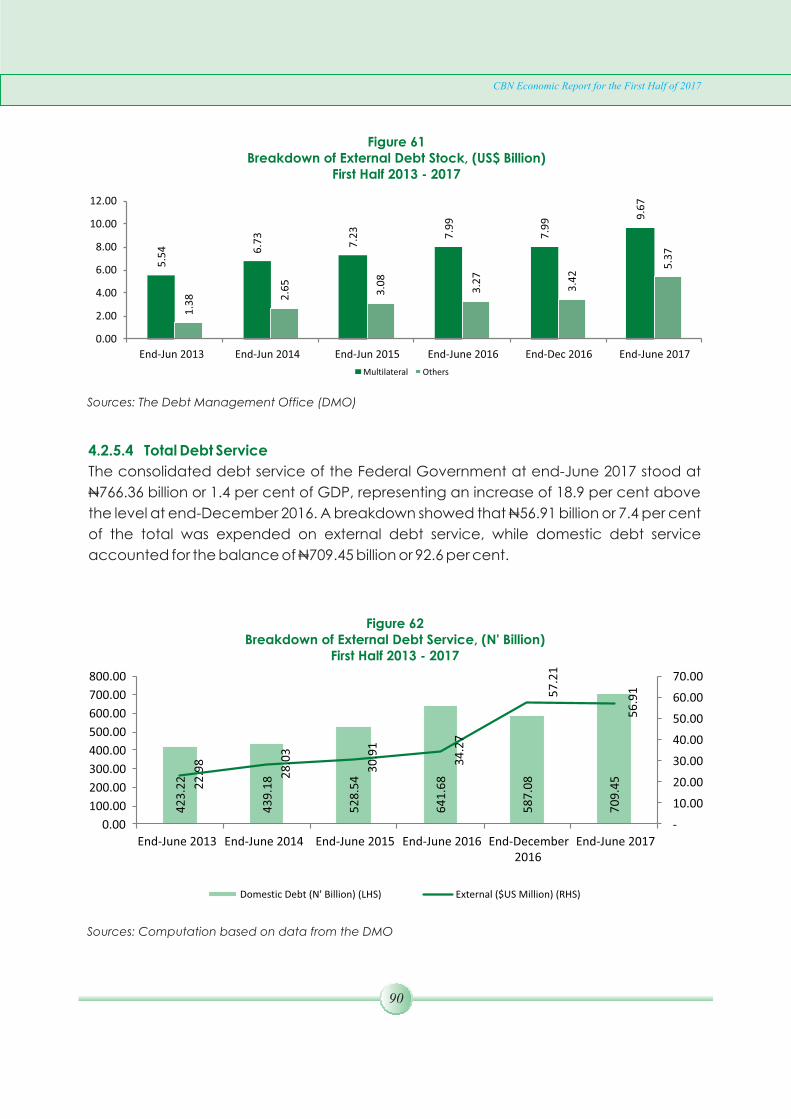
90
CBN Economic Report for the First Half of 2017
Figure 61Breakdown of External Debt Stock, (US$ Billion)
First Half 2013 - 20175
.54 6.7
3
7.2
3
7.9
9
7.9
9 9.6
7
1.3
8 2.6
5
3.0
8
3.2
7
3.4
2
5.3
7
0.00
2.00
4.00
6.00
8.00
10.00
12.00
End-Jun 2013 End-Jun 2014 End-Jun 2015 End-June 2016 End-Dec 2016 End-June 2017
Multilateral Others
Sources: The Debt Management Office (DMO)
4.2.5.4 Total Debt Service
The consolidated debt service of the Federal Government at end-June 2017 stood at
N766.36 billion or 1.4 per cent of GDP, representing an increase of 18.9 per cent above
the level at end-December 2016. A breakdown showed that N56.91 billion or 7.4 per cent
of the total was expended on external debt service, while domestic debt service
accounted for the balance of N709.45 billion or 92.6 per cent.
Figure 62Breakdown of External Debt Service, (N' Billion)
First Half 2013 - 2017
42
3.2
2
43
9.1
8
52
8.5
4
64
1.6
8
58
7.0
8
70
9.4
5
22
.98
28
.03
30
.91
34
.27
57
.21
56
.91
-
10.00
20.00
30.00
40.00
50.00
60.00
70.00
0.00
100.00
200.00
300.00
400.00
500.00
600.00
700.00
800.00
End-June 2013 End-June 2014 End-June 2015 End-June 2016 End-December2016
End-June 2017
Domestic Debt (N' Billion) (LHS) External ($US Million) (RHS)
Sources: Computation based on data from the DMO

91
4.3 REAL SECTOR DEVELOPMENTS
The real sector continued to contend with the challenges arising from economic
downturn. There were, however, indications that the economy was gradually recovering
from recession. Available data from NBS indicated that the Gross Domestic Product
(GDP), at 2010 constant basic prices, contracted by 0.18 per cent in the first half of 2017,
relative to 1.08 per cent contraction in the corresponding period of 2016. The non-oil
sector output grew by 0.58 per cent, while the oil sector output declined by 7.47 per cent.
On quarter on quarter basis, real GDP contracted by 0.91 per cent in the first quarter of
2017, but grew by 0.55 per cent in the second quarter of 2017. The year-on-year headline
inflation maintained downward trend during the period under review. The improvement
in economic condition in the first half of 2017 was on account of the gradual increase in
aggregate demand, moderate rise in production across the sectors and the sustained
Government's effort to tackle lingering energy challenges.
CBN Economic Report for the First Half of 2017
Figure 63GDP Growth Rate
(Per cent)
Source: National Bureau of Statistics (NBS)
4.3.1 Agriculture
4.3.1.1 Agricultural Policies and Institutional Support
The Federal Government continued with the implementation of the Agricultural
Promotion Policy Framework (APPF) in the review period. This was aimed to diversify the
economy, ensure food security and reduce the level of poverty.
-1.49 -1.73
-0.52-0.18
-0.38 -0.33
0.72 0.58
-1.14-1.43 -1.17
-7.47-8.00
-7.00
-6.00
-5.00
-4.00
-3.00
-2.00
-1.00
0.00
1.00
2.00
1st
Hal
f 2
01
6
2n
d H
alf
20
16
1st
Qu
arte
r 2
01
7
1st
Hal
f 2
01
7
Total GDP Non-Oil GDP Oil-GDP

92
The federal government launched the 10-year Agricultural Sector Food Security and
Nutrition Strategy to guide the activities of the Ministry of Agriculture and the wider
agricultural sector for improved nutrition in support of food security and nutrition in the
country. The Strategy would ensure effective advocacy for mobilising necessary human,
material, and financial resources and encourage sustained commitment to improved
nutrition. The Policy set out eight (8) priority areas: enhance value chains for improved
nutrition; diversify household food production and consumption, especially, target
women and increase access to food rich in micronutrients; improve food safety along
the value chain; and build resilience and social protection net through food nutrition
systems for vulnerable groups. Others include: promotion of nutrition research and
information system; improving the agricultural sector capacity to address food security
and nutrition problems; nutrition education, social marketing, behaviour change
communication, and advocacy; and nutrition surveillance, monitoring and evaluation.
The Federal Government trained 3,000 personnel under the Agro Rangers programme to
protect farmers and their investments from attacks. The Agro Rangers, drawn from the
Nigeria Security and Civil Defence Corps (NSCDC) arms squad, were trained by the
Nigerian Army in weapon handling and, thereafter, deployed to guard and protect
farms and ranches. The development would boost farmers' confidence to work on their
farms without fear of attack.
The Raw Materials Research and Development Council (RMRDC) provided four (4)
tonnes of improved cotton seeds to the National Cotton Association of Nigeria
(NACOTAN) and 10,000 seedlings of improved oil palm to farmers' Associations. This
would increase the availability of improved seedlings for use by farmers.
The Federal Government revived the School of Agriculture in Rivers State to build
capacity of youths in the south-south geopolitical zone on agricultural activities. Also, the
Federal Universities of Agriculture were returned to the supervisory purview of Federal
Ministry of Agriculture and Rural Development. The initiative was aimed at refocusing the
institutions to achieve their core mandates of developing capacity in the sector.
Furthermore, the Nigerian Export Promotion Council (NEPC) endorsed a processing and
logistic facility in Lily Pond, Lagos to boost export performance in the country. The Facility
would provide a conducive environment to service providers in shipping, warehousing,
and inspection by customs and certification agencies to facilitate the clearance of
goods for export.
CBN Economic Report for the First Half of 2017

93
As part of the gains of the diversification drive, the country for the first time, exported
seventy-two (72) tonnes of certified yams to the United Kingdom and United States during
the review period. The development would boost non-oil export contribution to foreign
exchange earnings.
The sugar sub-sector was boosted with the provision of 12, 000 hectares of land to
Chinese investors by the Jigawa State Government to establish a sugar estate in Garki,
Taura, Sule Tankarkar and Gagarawa local government areas. Also, the Dangote group
signed a memorandum of understanding (MoU) for an investment of N220.00 billion
towards the establishment of sugar estates in Obi, Awei and Doma local government
areas of Nasarawa State. The investment involves 60,000 hectares of sugar plantation
and two sugar factories.
As part of their contributions to boost capacity and increase output in the agricultural
sector, the African Development Bank (AfDB) group, Centres for Disease Control and
Prevention (CDC) group and the Dutch Good Growth Fund jointly committed US$31.00
million to the “Fund Agricultural Finance in Nigeria” (FAFIN). The funds would be invested
over a two-year period to support sustainable businesses that would revolutionize the
Agri-business landscape, improve productivity, create new jobs and strengthen the
value chain.
4.3.1.2 Agricultural Production and Prices
Agriculture recorded positive growth in output in the first half of 2017. At 131.5 (2010=100),
the provisional index of agricultural production grew by 3.2 per cent, but was lower than
the 3.8 per cent growth in the first half of 2016. The increase in agricultural output during
the first half of 2017 was attributed largely to the sustained effort to strengthen domestic
production through the implementation of the Agricultural Promotion Policy framework,
especially the CBN sponsored Anchor Borrowers Programme, strong commitment to
economic diversification and favourable weather conditions.
All the sub-sectors contributed to the improvement in growth of agricultural output during
the period. The output of fishery improved remarkably from a negative growth of 1.6 per
cent in the first half of 2016 to 1.4 per cent in the first half of 2017. The crops sub-sector grew
by 3.4 per cent; output of staples, 3.4 per cent, and “other” crops, 3.3 per cent. The output
of forestry and livestock grew by 3.2 and 2.0 per cent, compared with 3.1, and 5.1 per
cent, respectively, in the first half of 2016.
A survey conducted by the Central Bank of Nigeria indicated that the domestic retail
prices of all selected agricultural commodities increased, compared with their levels in
CBN Economic Report for the First Half of 2017
94
CBN Economic Report for the First Half of 2017
the first half of 2016. The price increase ranged from 5.1 per cent for cocoa to 69.0 per
cent for groundnut oil. The development was attributed largely to the cost of production,
including transportation.
The all-commodities price index (in dollar-terms) of Nigeria's major agricultural export
commodities decreased during the first half of 2017. At 67.3 (2010=100), it declined by
28.2 per cent in contrast to an increase of 3.1 per cent in the corresponding period of
2016. The decline was due largely to the fall in the price of cocoa by 33.0 per cent, having
the highest weight in the basket of monitored commodities. Cocoa prices declined due
largely to excessive market supply against the back drop of sales by hedge funds.
However, five (5) of the six (6) commodities monitored recorded price increases of 1.4,
4.4, 7.9, 18.5 and 24.2 per cent, for soyabeans, coffee, palm oil, copra, and cotton,
respectively. The development was driven by supply deficit, and seasonal factors arising
from unfavourable weather conditions in major producing countries.
The all-commodities price index (in naira-terms) of Nigeria's major agricultural export
commodities increased during the first half of 2017. At 136.83 (2010=100), it increased by
8.2 per cent compared with 7.3 per cent in the corresponding period of 2016. The
increase was due largely to the movements of domestic currency vis a vis the US dollar.
4.3.2 Industry
4.3.2.1 Industrial Policy and Institutional Support
The Federal Government constituted the Presidential Industrial Policy and
Competiveness Advisory Council to drive the nation's industrial agenda to boost the
contribution of the manufacturing sector to the country's Gross Domestic Product (GDP).
The terms of reference were to: make input to sectoral and industrial policy; provide
feedback on government policies and programmes affecting the sector; recommend
and propose initiatives to promote competitiveness and growth of the sector; as well as
carry out periodic review of the performance and trends of the sector. Others were:
propose output targets and investments for major industrial sub-sectors in the country;
and serve as envoys of the industrial sector as a platform to facilitate effective
communication on the current and emerging issues affecting the sector.
To support the development of Nigeria's gas reserve and improve the supply of gas to
thermal power stations, the General Electric (GE) commenced the construction of a
US$100.00 million gas turbine assembly plant. The Plant, located in Calabar, Cross River
State, would also provide repairs and servicing for gas turbines in the country. The project
was expected to be completed in December, 2017 and would commence operations in
2018.

95
In continuation of the privatisation process, the 80.0 per cent equity holding of the
Federal Government in the ten (10) National Integrated Power Projects (NIPP), plants
were being offered. The process would be done in phases, starting with the four plants
that do not have gas supply and have internal constraints. An offer of US$5.6 billion
(about N1.76 trillion) was made for the assets built at a cost of US$4.00 billion (about N1.25
trillion). These included the: 561mw Calabar NIPP; 500mw Omotosho NIPP; 434mw
Geregu NIPP; and 450mw Ihovbor NIPP.
4.3.2.2 Industrial Production
The data indicated a decline in activities in the industrial sector in the first half of 2017. At
104.4 (2010=100), index of industrial production fell by 1.2 per cent, relative to the level in
the corresponding period of 2016. This development could be attributed to decline in the
activities in mining sub-sector which recorded a decline of 3.8 per cent, as a result of fall in
crude oil and gas production.
CBN Economic Report for the First Half of 2017
Figure 64Industrial Production Index
(First Half 2015 - 2017, 2010=100)
Source: Computed based on data from NBS and Manufacturing Association of Nigeria (MAN)
-
50.00
100.00
150.00
200.00
First Half 2015 First Half 2016 First Half 2017
Manufacturing Mining Electricity Industry
4.3.2.3 Manufacturing
At 174.7 (2010=100), the index of manufacturing production in the first half of 2017, rose
marginally by 0.64 per cent, above the level in the corresponding period of 2016. Similarly,
capacity utilisation during the period rose 0.3 percentage points to 52.0 per cent,
compared with the level in the corresponding period of 2016. The marginal growth was as
a result of increased supply of foreign exchange which aided importation of raw material
and intermediate inputs as well as easing in Inflationary pressures which decelerated in
input and output prices.

96
CBN Economic Report for the First Half of 2017
Figure 65Average Manufacturing Capacity Utilisation
(First Half 2013-2017, Per cent)
Source: Computed based on data from NBS and Manufacturing Association of Nigeria (MAN)
4.3.3 Crude Oil
To enhance regulatory efficacy in the nation's oil and gas industry, the Senate in the first
half of 2017 passed the Petroleum Industry Governance Bill (PIGB). The Bill covers the
administrative aspects, which is one of the four components of the proposed Petroleum
Industry Bill (PIB). The PIGB would provide a legal framework for the creation of a more
efficient, competitive and transparent industry that would create conducive business
environment for the operations of the petroleum industry and support the restructuring of
the Nigerian National Petroleum Corporation (NNPC).
4.3.3.1 Crude Oil Production and Demand
Aggregate crude oil production, including natural gas liquids (NGLs) and condensates
by the Organisation of Petroleum Exporting Countries (OPEC), averaged 38.44 million
barrels per day (mbd) in the first half of 2017. This represented a decrease of 1.4 and 1.1
per cent below the levels in the preceding and the corresponding halves of 2016,
respectively. The agreement between OPEC and some non-OPEC countries to a
production cut led to a decline in production from Ecuador, Iraq, Iran, Venezuela and
the United Arab Emirates. Non-OPEC supply was estimated at an average of 57.71 mbd,
indicating a 0.9 per cent increase over the corresponding half of 2016. The production
increase was due mainly to the return of the US oil into the market as a result of higher
drilling efficiencies, better “well” performance and lower wellhead breakeven prices.
Total world supply averaged 96.15 mbd, indicating a slight increase of 0.01 per cent
above the level in the first half of 2016.
57.659.3 56.8
51.7 52.0
46.0
48.0
50.0
52.0
54.0
56.0
58.0
60.0
First Half 2013 First Half 2014 First Half 2015 First Half 2016 First Half 2017
Pe
r ce
nt

97
CBN Economic Report for the First Half of 2017
World crude oil demand was estimated at an average of 95.39 mbd in the first half of
2017, compared with 95.38 mbd in the corresponding half of 2016. This was a marginal
increase of 0.01 per cent, compared with the corresponding half of 2016. Of this,
demand from the Organisation for Economic Co-operation and Development (OECD)
countries averaged 46.73 mbd, while non-OECD was 48.66 mbd. The increase in
demand was driven largely by the demand for LPG and naphtha for the petrochemical
industry in China as well as jet/kerosene for the aviation sector. Demand for oil from Iran,
Iraq, UAE and Qatar also grew. Furthermore, jet/kerosene, gasoline, gas/diesel oil and
LPG demand in Kuwait, Brazil and India; LPG, naphtha and diesel oil in Indonesia, Japan,
and US, as well as rising demand in the transportation sector and industrial fuel
requirements in Canada contributed to increased global demand.
At an average daily production of 1.62 mbd or 293.2 million barrels (mb), Nigeria's crude
oil output increased by 0.07 mbd or 4.5 per cent above the level of 1.55 mbd or 285.2 mb
in the preceding half of 2016. The development was due mainly to improved security in
the Niger Delta region occasioned by the ongoing peace deal between the Federal
Government and the key stakeholders in the region. It however, decreased by 0.06 mbd
or 3.6 per cent below the levels of 1.68 mbd or 305.8 mb in the corresponding period of
2016. Aggregate export of crude oil for the review period was estimated at 211.7 mb or
1.17 mbd, compared with 202.4 mb or 1.10 mbd and 223.9 mb or 1.23 mbd in the
preceding and corresponding halves of 2016, respectively.
Figure 66Crude Oil Production and Exports
1.68 1.55 1.62
1.23 1.10 1.17
0.45 0.45 0.45
0.0
1.0
2.0
First Half 2016 Second Half 2016 First Half 2017Mill
ion
bar
rels
pe
r d
ay
Output Exports Domestic Consumption
Source: Nigerian National Petroleum Corporation (NNPC)

98
4.3.3.2 Crude Oil Prices
The average spot price of Nigeria's reference crude, the Bonny Light (37o API), at
US$52.19 per barrel, increased by 7.4 and 28.8 per cent above its levels in the preceding
half and the first half of 2016, respectively. Similarly, the average prices of the Forcados,
the UK Brent, and the West Texas Intermediate rose by 8.2, 8.9, and 9.4 per cent, to
US$51.74, US$51.23, and US$49.43 per barrel, respectively. The marginal price increase
was attributed largely to the continued cooperation between OPEC and some non-
OPEC producers for a production cut. The average price of the OPEC basket of fourteen
(14) crude streams was US$50.21 per barrel, compared with US$45.18 per barrel and
US$36.32 per barrel in the preceding and the corresponding halves of 2016, representing
an increase of 11.1 and 38.24 per cent, respectively.
CBN Economic Report for the First Half of 2017
Figure 67Average Spot Prices of Selected Crudes
Source: Reuters
4.3.4 Gas
The West African Gas Limited, a joint venture company of the Nigerian National
Petroleum Corporation (NNPC) and Sahara Energy, took delivery of two (2) liquefied
petroleum gas (LPG) carriers from the Hyundai Mipo Dockyard in Ulsan, South Korea in the
first half of 2017. The vessels, “MT Africa Gas” and “MT Sahara Gas”, have combined
capacity of 38,000 cubic meters (m3) and would enhance the supply of (LPG), also
known as domestic cooking gas.
In the first half of 2017, the NNPC re-opened the Aba, Mosimi, Atlas-Cove and Kano
Depots. The re-opening of the depots has enhanced availability of the products across
the country. Also, various repairs were carried out on vandalised pipelines. Accordingly,
all gas plants that were hitherto shut-down including, the Oredo Gas Plant, Sapele Gas
Plant, Ovade Gas Plant, Oben and NGC Gas Compressors, were reactivated.
Furthermore, the issue of condensate evacuation was addressed, resulting in increased
gas supply across the gas plants.
40
.51
48
.59
52
.19
39
.51
47
.03
51
.23
40
.12
47
.80
51
.74
39
.29
45
.17
49
.43
36
.32
45
.18
50
.21
0
20
40
60
First Half 2016 Second Half 2016 First Half 2017
US
Do
llar
pe
r b
arre
l
BONNY LIGHT U.K. BRENT FORCADOS WEST TEXAS INTERMEDIATE OPEC BASKET

99
CBN Economic Report for the First Half of 2017
Figure 68Gas Production and Utilisation
Total associated gas produced in the first half of 2017 was estimated at 1,382,734.13
million standard cubic feet (mmscf), indicating an increase of 24.7 per cent and 12.5 per
cent above the level in the corresponding period of 2016 and the preceding period,
respectively. Total volume of gas utilised and flared during the period was estimated at
1,273,582.49 mmscf and 109,151.64 mmscf, indicating an increase of 24.8 and 23.6 per
cent above their respective levels in the first half of 2016.
4.3.5 Petroleum Products
The estimated quantity of petroleum products distributed by the major and independent
marketing companies in the period under review was 7,905.8 million litres, representing
an increase of 65.0 per cent above the level in the first half of 2016. A disaggregation by
product type showed that 6,864.8 million litres of Premium Motor Spirit (PMS), 706.2 million
litres of Automotive Gas Oil (AGO), 334.8 million litres of Dual Purpose Kerosene (DPK) and
123.3 million litres of Low Pour Fuel Oil (LPFO) were distributed.
4.3.6 Solid Minerals
In the review period, the Federal Government approved N30.00 billion from the Natural
Resources Development Fund (NRDF) for the Ministry of Mines and Steel Development
(MMSD) to tackle the challenges in the sector and ensure that it plays a key role in the
economic diversification agenda. The Fund would provide cheap loans and grants to
industry participants and promote direct investment in the sector.
In addition, the World Bank approved US$150.00 million credit to help increase the mining
sector's contribution to the Nigerian economy. The funds would assist in building a strong
1,1
08
,52
5.0
9
1,2
29
,35
9.4
6
1,3
82
,73
4.1
3
1,0
20
,22
5.6
6
1,0
96
,31
9.7
3
1,2
73
,58
2.4
9
88
,29
9.4
3
13
3,0
39
.73
10
9,1
51
.64
-
500,000
1,000,000
1,500,000
First Half 2016 Second Half 2016 First Half 2017
Mill
ion
Sta
nd
ard
Cu
bic
Fe
et (
mm
scf)
Gas Produced Gas Utilised Gas Flared
Source: NNPC

100
CBN Economic Report for the First Half of 2017
foundation for mining sector development in the country. It would also enhance
competitiveness by improving information infrastructure and knowledge of mining as
well as strengthen key government institutions and foster domestic investments in the
sector.
Provisional data from the Ministry of Mines and Steel Development indicated that solid
minerals production in the first half of 2017 decreased by 11.3 per cent from the level in
the corresponding period of 2016 to 15.32 million tonnes. The decrease in the production
of some principal minerals such as clay, coal, lead/zinc and laterite accounted for the
decline in production.
4.3.7 Electricity Generation
Average electricity generation in the first half of 2017, at 3,511.62 MW/h, declined by 9.0
per cent, compared with 3,857.28 MW/h in the first half of 2016. The decrease was
attributed to fall in gas supply to thermal plants and decreased generation from Shiroro
Hydro Power Plant following major repair undertaken in the review period.
4.3.8 Electricity Consumption
Average electricity consumed at 3,171 MW/h, grew by 10.7 per cent, compared with the
level in the same period of 2016. The increase in consumption was attributed to
improvement in transmission and distribution network the review period.
4.3.9 Industrial Financing
4.3.9.1 The Bank of Industry (BOI)
The total disbursed by the Bank of Industry (BOI) to various beneficiaries in the review
period was N54.2 billion. This amount was 81.4 per cent higher than the level of
disbursement in the corresponding period of 2016. Of the total, Micro Enterprise, Small
and Medium Enterprises and Large Enterprise sub-sectors received 10.3, 11.8 and 77.9 per
cent, respectively.
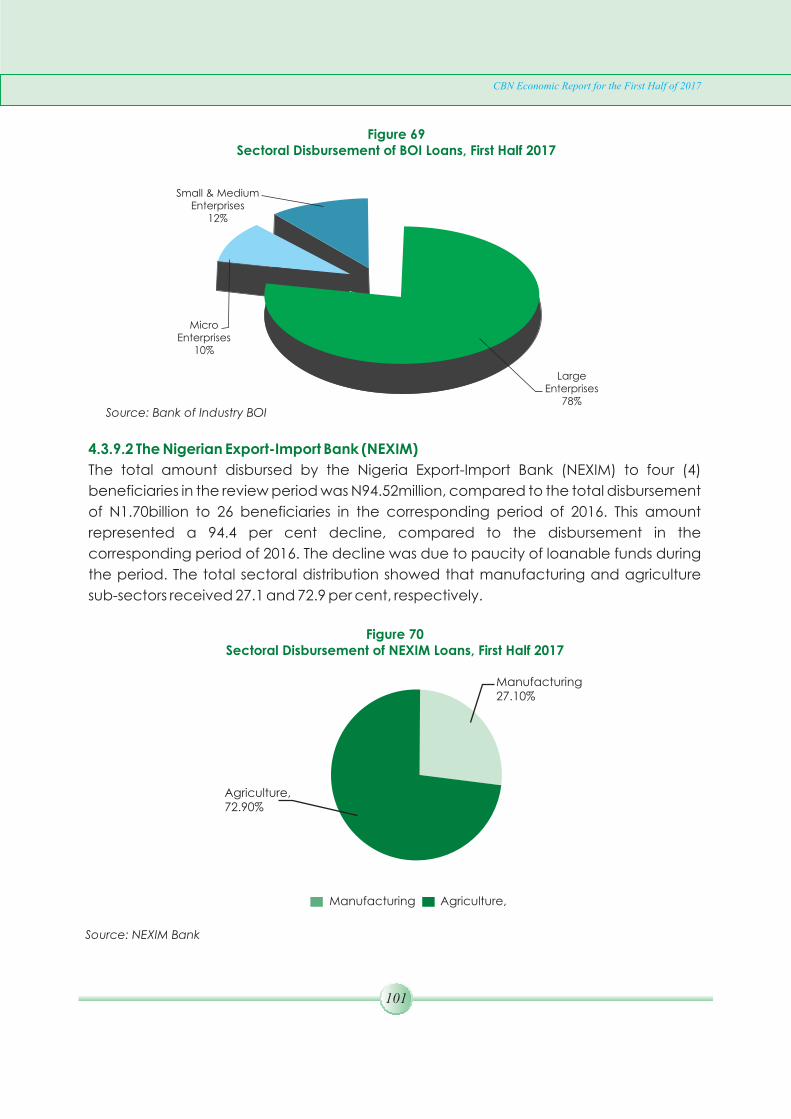
101
CBN Economic Report for the First Half of 2017
Figure 69Sectoral Disbursement of BOI Loans, First Half 2017
4.3.9.2 The Nigerian Export-Import Bank (NEXIM)
The total amount disbursed by the Nigeria Export-Import Bank (NEXIM) to four (4)
beneficiaries in the review period was N94.52million, compared to the total disbursement
of N1.70billion to 26 beneficiaries in the corresponding period of 2016. This amount
represented a 94.4 per cent decline, compared to the disbursement in the
corresponding period of 2016. The decline was due to paucity of loanable funds during
the period. The total sectoral distribution showed that manufacturing and agriculture
sub-sectors received 27.1 and 72.9 per cent, respectively.
Source: Bank of Industry BOI
Figure 70Sectoral Disbursement of NEXIM Loans, First Half 2017
Source: NEXIM Bank
Agriculture,72.90%
Manufacturing 27.10%
Agriculture,Manufacturing
Small & MediumEnterprises
12%
Micro Enterprises
10%
LargeEnterprises
78%

102
CBN Economic Report for the First Half of 2017
4.3.10 Telecommunications
The Telecommunications sub-sector experienced a decline in the first half of 2017,
compared with the corresponding period of 2016. Data obtained from the National
Communications Commission (NCC) showed that the number of active telephone lines
stood at 143.1 million at end-June 2017, compared with 149.8 and 154.5 million at end-
June and end-December 2016, respectively. The development represented a decrease
of 4.5 per cent of active telephone lines during the review period. In addition, the
number of internet users in the country declined slightly to 91.6 million at end-June 2017,
from 92.1 million at end-June 2016. Similarly, teledensity stood at 102.2 per 100 inhabitants
at end-June 2017, a decrease of 4.8 percentage points, compared with 107.0 per 100
inhabitants recorded at end-June 2016. However, teledensity in Nigeria continued to
exceed the International Telecommunication Union (ITU) minimum standard of 1:100.
The subdued growth in the number of active telephone lines (active subscriber base) in
the review period, compared with end-June 2016 was largely attributed to the
regulatory directive to all GSM operators and other network providers to deactivate all
unregistered, pre-registered, and poorly registered SIM cards. This became necessary
following the criminal activities carried out against members of the public using
unregistered SIM cards across networks.
Figure 71Total Active Lines and Teledensity
Source: Nigerian Communication Commission (NCC)
14
9.8
2
15
4.5
3
14
3.0
6
107.01 110.38102.2
115,451
127,648
125,452
108,000
110,000
112,000
114,000
116,000
118,000
120,000
122,000
124,000
126,000
128,000
130,000
0
20
40
60
80
100
120
140
160
180
End-June 2016 End-Dec. 2016 End-June 2017
Mill
ion
s
Mobile Phones (LHS) Teledensity (LHS) Fixed (RHS)

103
4.3.11 Consumer Prices
The all-items composite Consumer Price Index (CPI) was 234.2 (November 2009=100) at
end-June 2017, compared with 213.6 and 201.7 at end-December and end-June 2016,
respectively. The all-items less farm produce CPI was 223.0 at end-June 2017, compared
with 208.6 and 198.3 at end-December and end-June 2016, respectively. Food CPI stood
at 246.3 at end-June 2017, compared with 218.6 and 205.4 at end-December and end-
June 2016, respectively.
CBN Economic Report for the First Half of 2017
0
50
100
150
200
250
300
1st Half 2016 2nd Half 2016 1st Half 2017
CP
I
Composite Core Food
Figure 72Consumer Price Indices(November 2009 = 100)
Source: NBS
4.3.11.1 Headline Inflation
The year-on-year headline inflation maintained a consistent decline throughout the first
half of 2017. It declined from 18.7 per cent in January to 17.3 per cent in March and
closed at 16.1 per cent in June 2017, relative to 18.6 and 16.5 per cent in December and
June 2016, respectively. The deceleration in headline inflation was attributed largely to
moderation in non-food prices arising from improved access to foreign exchange which
more than offset the upward trend in food inflation. However, the 12-month moving
average inflation rose from 16.4 per cent in January to 17.3 per cent in March and closed
at 17.6 per cent in June 2017, compared with 15.7 and 11.4 per cent in December and
June 2016.
4.3.11.2 Core Inflation
The year-on-year core inflation (all-item less farm produce) decelerated from 17.9 per
cent in January to 15.4 per cent in March and closed at 12.5 per cent in June 2017,
compared with 18.1 and 16.2 per cent at end-December and end-June 2016,
respectively. Core inflation, on a 12-month moving average basis, however, rose from
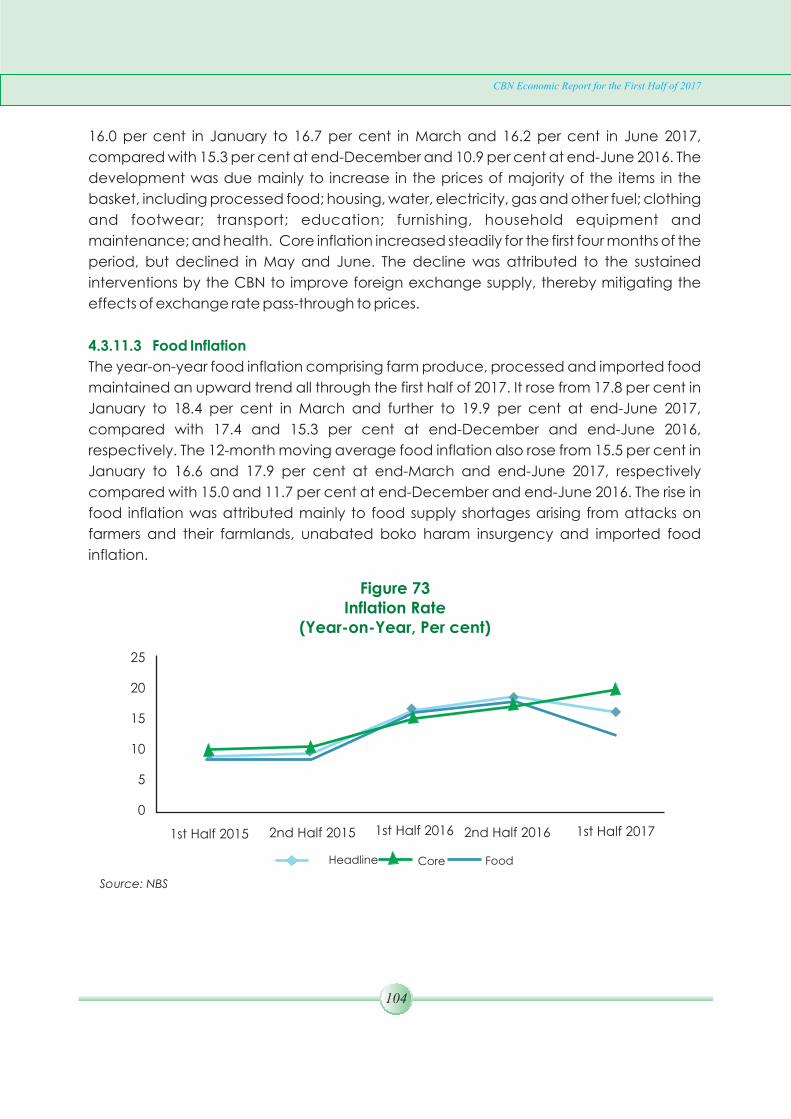
104
CBN Economic Report for the First Half of 2017
16.0 per cent in January to 16.7 per cent in March and 16.2 per cent in June 2017,
compared with 15.3 per cent at end-December and 10.9 per cent at end-June 2016. The
development was due mainly to increase in the prices of majority of the items in the
basket, including processed food; housing, water, electricity, gas and other fuel; clothing
and footwear; transport; education; furnishing, household equipment and
maintenance; and health. Core inflation increased steadily for the first four months of the
period, but declined in May and June. The decline was attributed to the sustained
interventions by the CBN to improve foreign exchange supply, thereby mitigating the
effects of exchange rate pass-through to prices.
4.3.11.3 Food Inflation
The year-on-year food inflation comprising farm produce, processed and imported food
maintained an upward trend all through the first half of 2017. It rose from 17.8 per cent in
January to 18.4 per cent in March and further to 19.9 per cent at end-June 2017,
compared with 17.4 and 15.3 per cent at end-December and end-June 2016,
respectively. The 12-month moving average food inflation also rose from 15.5 per cent in
January to 16.6 and 17.9 per cent at end-March and end-June 2017, respectively
compared with 15.0 and 11.7 per cent at end-December and end-June 2016. The rise in
food inflation was attributed mainly to food supply shortages arising from attacks on
farmers and their farmlands, unabated boko haram insurgency and imported food
inflation.
Figure 73Inflation Rate
(Year-on-Year, Per cent)
25
20
15
10
5
0
1st Half 2015 2nd Half 2015 1st Half 2016 2nd Half 2016 1st Half 2017
Headline Core Food
Source: NBS

105
4.3.11.4 Urban and Rural Consumer Price Indices and Inflation Rates
The all-items Urban CPI increased to 236.2 at end-June 2017, from 216.3 and 203.4 at end-
December and end-June 2016, respectively. The development was attributed largely to
the increase in the prices of food (11.6 per cent); food and non-alcoholic beverages
(11.6 per cent); clothing and footwear (8.3 per cent); furnishing and household
equipment (7.4 per cent); recreation and culture (7.2 per cent); imported food (7.1 per
cent); transport (6.8 per cent) and; miscellaneous goods and services (6.7 per cent).
Others were: health (6.1 per cent); education (5.7 per cent); restaurant and hotels (5.6
per cent); alcoholic beverages (4.5 per cent); housing, water and electricity (4.2 per
cent); and, communication (2.0 per cent). The year-on-year urban inflation stood at 16.1
per cent at end-June 2017, compared with 20.1 and 18.1 per cent at end-December and
end-June 2016, respectively.
Similarly, the all-items rural CPI rose to 232.66 at end-June 2017, above 212.2 at end-
December and 200.55 at end-June 2016. The increase was driven by the rise in the prices
of food (10.9 per cent); food and non-alcoholic beverages (10.9 per cent); clothing and
footwear (7.1 per cent); imported food (6.5 per cent); furnishing and household (5.3 per
cent) and; education (5.3per cent). Others were: housing and utilities (5.3 per cent);
transport (5.0 per cent); recreation and culture (4.8 per cent); miscellaneous goods and
services (4.7 per cent); health (4.7 per cent); alcohol beverages (4.0 per cent); restaurant
(3.9 per cent) and; communications (1.0 per cent).
Urban headline inflation was higher than the rural headline inflation by 0.2 percentage
point in the period under review. Urban core inflation stood at 13.6 per cent at end-June
2017, compared with 19.6 per cent at end-December and 17.1 per cent at end-June
2016. Urban food inflation was 20.5 per cent at end-June 2017, compared with 17.6 and
15.7 per cent at end-December and end-June 2016, respectively.
Rural core inflation was 11.6 per cent at end-June 2017, compared with 16.8 per cent at
end-December and 15.5 per cent at end-June 2016. Rural food inflation was 19.5 per
cent at end-June 2017, compared with 17.1 and 14.9 per cent at end-December and
end-June 2016, respectively.
CBN Economic Report for the First Half of 2017

106
CBN Economic Report for the First Half of 2017
Figure 74Urban and Rural Consumer Price Indices
(November 2009 = 100)
20
3.4 2
15
.3 23
6.2
20
0.5 2
12
.2 23
2.6
180
200
220
240
First Half 2016 Second Half 2016 First Half 2017
Urban Consumer Price Index Rural Consumer Price Index
Source: NBS
4.3.12 Aviation Services
4.3.12.1 REAL SECTOR DEVELOPMENTS
Policy and Airport Development
To improve the safety of airline operations in the country, the Federal Government
reconstructed the Nnamdi Azikiwe International Airport's runway as well as embarked on
extensive renovation of the airport facilities within the period. The Airport was shut down
for six weeks to allow for reconstruction of its runway, while the Kaduna International
Airport was rehabilitated and used as an alternate airport during the period of closure.
Furthermore, the standardisation process of Nnamdi Azikiwe International Airport, Abuja
and the Murtala Mohammed International Airport, Lagos, by the International Civil
Aviation Organisation (ICAO), in conjunction with the Nigerian Civil Aviation Authority
(NCAA) commenced during the period with the implementation of the Africa Indian
Flight Region (AFI) Plan Aerodrome Certification Project. The Plan addresses three focal
areas: establish and maintain a sustainable oversight system (infrastructure/capacity
building); assist countries to resolve identified deficiencies within reasonable time; and
enhance aviation safety culture of African aviation service providers.
4.3.12.2 Domestic Operations
A total of 4,365,140 passengers were airlifted by domestic airlines in the first half of 2017.
This represented a 5.7 per cent decline below the 4,627,816 passengers airlifted in the
corresponding period of 2016. Total aircraft movement for the first half of 2017 was 89,268
representing an increase of 8.3 per cent above the 82,448 recorded in the corresponding
period of 2016.

107
CBN Economic Report for the First Half of 2017
4.3.12.3 International Operations
The number of passengers airlifted by airlines on international routes in the first half of 2017
declined by 14.2 per cent to 1,864,775 compared with 2,172,588 recorded in the first half
of 2016. Aircraft movement reduced by 2.7 per cent to 22,309 in the review period,
compared with 22,932 recorded in the corresponding period of the preceding year.
Cargo movement at designated airports grew by 122.1 per cent to 167 million kg from
75.2 million kg recorded in the first half of 2016. Mail movement grew by 2,470 per cent to
29.6 million kg in the first half of 2017, compared with 1.2 million kg recorded in the
corresponding period of 2016.
4.3.13 Maritime Services
The Nigerian Maritime Administration and Safety Agency (NIMASA) recorded a milestone
during the review period. The agency improved in International Ships and Port Facility
Security (ISPS) Code compliance. The country recorded a compliance rate of about 80
per cent as 114 Port facilities out of the total 145 ports in Nigeria are now fully ISPS
compliant. Additionally, the agency engaged some schools abroad to build capacity of
1,045 beneficiaries on sea time training.
During the review period, the Federal Government granted approval to the agency to
acquire assets that would be deployed at strategic locations to enhance its ability to
improve the safety of vessels within the nation's maritime domain. In view of that, the
Agency procured 12 intervention vessels and 3 helicopters for the Nigerian Maritime
Administration and Safety Agency (NIMASA) to fight piracy and other illegal activities on
the country's territorial waters. Consequently, the agency operates 24-hour surveillance
system, which captures all vessels in the Nigerian maritime domain irrespective of weather
conditions.
A total of 1,540 ocean going vessels berthed at Nigerian ports, compared with 2,208
vessels in the corresponding period of 2016, representing a decrease of 30.1 per cent
decrease.
Cargo throughput stood at 13,487,851 tonnes in the first half of 2017, compared with
35,256,845 tonnes recorded in the corresponding period of 2016, representing a decline
of 61.7 per cent.
4.3.14 Railway Services
During the review period, a total of 1,364,885 passengers and 53,055 tonnes of freight
were moved by trains operated by the Nigeria Railway Corporation compared with
108
1,409,597 passengers and 58,403 tonnes of freight moved during the corresponding
period of 2016. In other developments, the Corporation awarded contracts for the
design, manufacture and supply of ten (10) standard gauge coaches for the Abuja-
Kaduna rail service. The haulage of fertilizers from Apapa port to Kaduna City and the
construction of the Lagos-Ibadan standard gauge rail project also commenced.
4.4 SOCIAL SECTOR DEVELOPMENTS
4.4.1 Health
During the review period, the Federal Government approved the third National Health
Policy aimed at promoting health care delivery to accelerate socio-economic
development in the country. The Policy lays emphasis on primary healthcare as the
bedrock of the national health system in addition to the provision of financial risk
protection to all Nigerians, particularly, the poor and vulnerable group.
The Federal Government disbursed the N16.9 billion World Bank grant to the 36 states and
the FCT for the implementation of the Save-One-Million-Lives (SOML) programme-for-
Results. The objective of the Programme was to increase the utilisation and quality of high
impact reproductive, child health, and nutrition interventions. To further boost the health
sector, the Government signed a Memorandum of Understanding (MoU) with the
European Union (EU) on a 70 million Euro Fund to strengthen the nation's health care
system and eradicate polio.
However, the health sector experienced a meningitis epidemic in some parts of the
country during the period under review. The Nigerian Centre for Disease Control (NCDC)
reported a total of 14,473 suspected cases and 1,155 deaths from 25 states. The Federal
Ministry of Health, the NCDC, the National Primary Healthcare Development Agency
(NPHCDA), World Health Organisation (WHO), and other international development
partners worked to control and reduce the impact of the outbreak on affected
communities. Consequently, the government officially declared the end of the meningitis
outbreak in the country in June, 2017. The declaration came four weeks after the number
of new meningitis cases reported each week fell below the epidemic and alert thresholds
in all the affected local government areas.
To improve the quality of health care delivery in the country, the Federal Government
flagged off the “National Primary Healthcare Revitalisation Programme” to improve over
10,000 healthcare centres across the country. The Federal Government, through the
NPHCDA and the Federal Ministry of Health, would make at least one primary health care
centre in each ward across the country fully functional to deliver several health care

109
CBN Economic Report for the First Half of 2017
services.
The Government also flagged off the Health and Nutrition Emergency Response
Initiative. Consequently, the Federal Ministry of Health delivered materials worth N4.33
billion to victims of insurgency in Borno State. Similarly, the United Nations Children's Funds
(UNICEF) donated medical equipment worth N1.20 billion to the Adamawa State
Government to save mothers and children at birth. This was necessitated by the high rate
of maternal mortality in the North East as a result of the onslaught of the Boko Haram
insurgency.
4.4.2 Environment
The Federal Government in protecting human health, intensified effort to reduce
emission with the adoption of the low sulphur policy. The Federal Ministry of Environment,
in collaboration with Ministry of Trade and Investment/Standard Organisation of Nigeria
(SON), successfully reviewed the standards of sulphur content in diesel and petro-
products.
The World Bank continued to assist affected states in the country to address flood and
erosion challenges. During the review period, the Nigeria Erosion and Watershed
Management Project (NEWMAP), under the auspices of the World Bank earmarked
about N6.5 billion for the restoration of the Watershed in the Lugu Dam in Sokoto State.
The state also committed the sum of N1.33 billion as counterpart contribution to the
project.
4.4.3 Housing and Urban Development
The housing sector recorded a milestone during the review period. The World Bank and
the International Development Association (IDA), earmarked US$300 million to fast-track
provision of accommodation for the country's teeming population. The Nigeria Housing
Finance Programme (NHFP) is driven by the CBN. The Bank would manage the Fund,
which would be channeled towards effective development of the housing sector in the
country.
Furthermore, to address the housing deficit in the country, the Government flagged off
the Federal Integrated Staff Housing (FISH) programme during the period under review.
The FISH is a strategic initiative designed as an intervention project for massive housing
delivery to federal civil servants. It is also a Special Purpose Vehicle for housing delivery for
federal workers. The Programme which has a Federal Government seed fund of N30.00
billion was being driven through strategic partnership involving relevant stakeholders in
the country.

110
CBN Economic Report for the First Half of 2017
4.5 EXTERNAL SECTOR DEVELOPMENTS
The performance of the external sector in the review period improved with an overall
balance of payments (BOP) and current account surpluses of 1.9 and 2.4 per cent of
gross domestic product (GDP), respectively. The development was as a result of
improvement in crude oil price and domestic production, and gradual economic
recovery in the emerging markets which bolstered global aggregate demand. The
capital and financial account recorded a net incurrence of financial liabilities of 3.3 per
cent of GDP. The stock of external reserves recorded an accretion of US$3.27 billion and
stood at US$30.34 billion at end-June, 2017. The level could finance 11.1 months of current
level of import of goods and 7.7 months of goods and services. External debt stood at
US$15.05 billion equivalent to 8.6 per cent of GDP at end-June 2017, and remained within
the sustainable threshold of 40.0 per cent of GDP. The exchange rate remained stable in
the first half of 2017, as the premium between the inter-bank and BDC rates narrowed to
19.8 per cent at end-June 2017 from 61.6 per cent at end-January 2017.
4.5.1 Current Account
Available data showed that the current account position improved significantly with a
surplus of N1,265.77 billion or 2.4 per cent of GDP as against a deficit of N134.16 billion, or
0.3 per cent of GDP in the corresponding period in 2016. The development was attributed
to the trade surplus recorded in the goods account occasioned by the improvement in
crude export; and higher net surplus in the current transfers as a result of the increased
inflow of home remittance.
4.5.1.1 Trade
In the first half of 2017, the value of aggregate external trade increased to N11,340.49
billion or 21.2 per cent of GDP, above the N10,196.42 billion or 18.1 per cent of GDP and
N7,401.03 billion, or 16.0 per cent of GDP recorded in the preceding and the
corresponding periods of 2016, respectively. A disaggregation of total trade showed that
export at N6,339.61 billion increased from N5,424.19 billion and N3,426.50 billion in the
second and first halves of 2016, respectively. Further analysis revealed that crude oil and
gas component which constituted 90.6 per cent of total export increased significantly to
N5,745.99 billion in the review period, from N3,115.99 billion in the first half of 2016. The
development was as a result of improvement in crude oil export. Similarly, non-oil
component, representing 1.1 per cent of GDP, increased by 91.2 per cent above N310.51
billion in the first half of 2016 to N593.62 billion in the review period, accounting for 9.4 per
cent of total export. This was attributed to increased export of agricultural produce and
manufactured goods.

111
The value of total import increased by 25.8 per cent to N5,000.88 billion in the first half of
2017 above the level of N3,974.53 billion in the corresponding period of 2016, on account
of increased petroleum product import. Oil and gas import, representing 27.5 per cent of
total import, increased by 49.1 per cent to N1,375.41 billion or 2.6 per cent of GDP, above
its level in the corresponding half of 2016. Non-oil import at N3,625.47 billion constituted
72.5 per cent of total import and represented 6.8 per cent of GDP in the review period.
This indicated an increase of 18.8 per cent above the level of N3,052.23 billion in the first
half of 2016.
Overall, the trade account resulted in a trade surplus of N1,338.73 billion in the review
period as against a deficit of N548.03 billion in the corresponding period of 2016.
CBN Economic Report for the First Half of 2017
Figure 75Export, Import and Trade Balance
(N' Billion)
Source: CBN
A further breakdown of visible import by sector using data on sectoral utilisation of foreign
exchange by banks indicated that industrial sector import accounted for 44.3 per cent,
and oil sector, 28.0 per cent. Manufactured products, food products, transport,
agriculture and mineral products accounted for 14.1, 8.6, 2.8, 1.6 and 0.6 per cent of total
import, respectively.
3,4
26
,49
8.3
6
5,4
24
,19
1.3
6
6,3
39
,61
2.0
0
3,9
74
,53
3.1
6
4,7
72
,22
4.0
2
5,0
00
,87
9.0
6
(1,000,000.00)
-
1,000,000.00
2,000,000.00
3,000,000.00
4,000,000.00
5,000,000.00
6,000,000.00
7,000,000.00
1st Half 2016 2nd Half 2016 1st Half 2017
Nb
illio
n
Exports Imports Trade Balance

112
A disaggregation of non-oil export by products revealed that agricultural, other
products, manufactured, semi-manufactured and mineral products accounted for 37.6,
27.6, 20.3, 13.2 and 1.3 per cent of total, respectively.
CBN Economic Report for the First Half of 2017
Figure 76Foreign Exchange Utilisation in the First Half 2017
(Per cent)
Figure 77Non-Oil Export by Products
(First Half 2017, Per cent)
Source: CBN
Mineral Products
0.6%
Industrial
44.3%
Manufacturig
14.1%
Food Product
8.9%
Transport
2.8%
Agriculture
1.6%
Agricultural Produce
37.6%
Others27.6% Manufactured
13.2%
Semi-Manufactured2
20.3%Minerals1.3%
Source: CBN
Oil Sector
28.0%
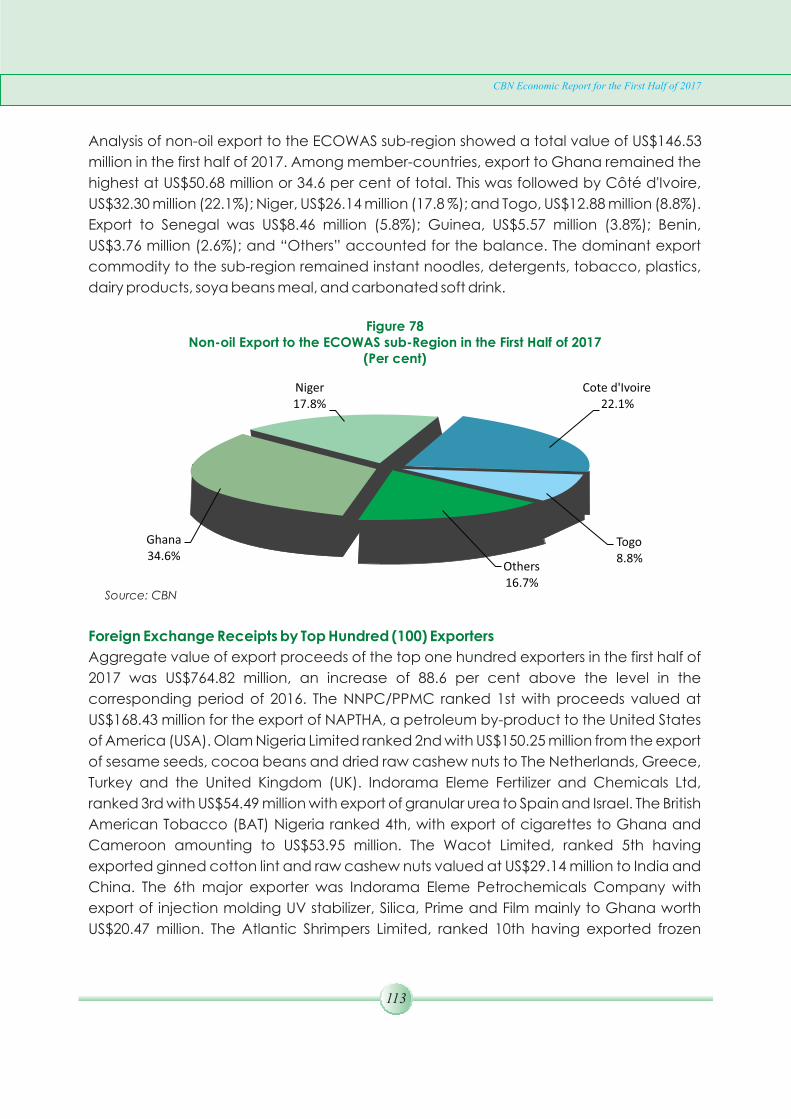
113
Analysis of non-oil export to the ECOWAS sub-region showed a total value of US$146.53
million in the first half of 2017. Among member-countries, export to Ghana remained the
highest at US$50.68 million or 34.6 per cent of total. This was followed by Côté d'Ivoire,
US$32.30 million (22.1%); Niger, US$26.14 million (17.8 %); and Togo, US$12.88 million (8.8%).
Export to Senegal was US$8.46 million (5.8%); Guinea, US$5.57 million (3.8%); Benin,
US$3.76 million (2.6%); and “Others” accounted for the balance. The dominant export
commodity to the sub-region remained instant noodles, detergents, tobacco, plastics,
dairy products, soya beans meal, and carbonated soft drink.
CBN Economic Report for the First Half of 2017
Figure 78Non-oil Export to the ECOWAS sub-Region in the First Half of 2017
(Per cent)
Others16.7%
Ghana34.6%
Niger17.8%
Cote d'Ivoire22.1%
Togo8.8%
Source: CBN
Foreign Exchange Receipts by Top Hundred (100) Exporters
Aggregate value of export proceeds of the top one hundred exporters in the first half of
2017 was US$764.82 million, an increase of 88.6 per cent above the level in the
corresponding period of 2016. The NNPC/PPMC ranked 1st with proceeds valued at
US$168.43 million for the export of NAPTHA, a petroleum by-product to the United States
of America (USA). Olam Nigeria Limited ranked 2nd with US$150.25 million from the export
of sesame seeds, cocoa beans and dried raw cashew nuts to The Netherlands, Greece,
Turkey and the United Kingdom (UK). Indorama Eleme Fertilizer and Chemicals Ltd,
ranked 3rd with US$54.49 million with export of granular urea to Spain and Israel. The British
American Tobacco (BAT) Nigeria ranked 4th, with export of cigarettes to Ghana and
Cameroon amounting to US$53.95 million. The Wacot Limited, ranked 5th having
exported ginned cotton lint and raw cashew nuts valued at US$29.14 million to India and
China. The 6th major exporter was Indorama Eleme Petrochemicals Company with
export of injection molding UV stabilizer, Silica, Prime and Film mainly to Ghana worth
US$20.47 million. The Atlantic Shrimpers Limited, ranked 10th having exported frozen

114
CBN Economic Report for the First Half of 2017
shrimps and crab valued at US$5.30 million. The Metka Power West Africa Limited and
Vahl International & Natural Goods Limited were at the 98th and 99th positions with
US$0.26 million and US$0.25 million, respectively. Their major exports were cement and
dried split ginger to Ghana and the USA, respectively. The Exclusive Connect Nigeria
Limited, ranked 100th with US$0.25 million for export of charcoal dust to the UK.
4.5.1.2 Services
The net deficit in the services account widened significantly to N1,639.19 billion or 3.1 per
cent of GDP, from N763.42 billion or 1.7 per cent of GDP in the corresponding period of
2016. This was due to higher out-payments in respect of the major components of the
services sub-account. A disaggregation of service payments showed that transportation
services constituted the bulk at N837.05 billion or 37.6 per cent of total out-payments,
travels was N559.26 billion and accounted for 25.1 per cent of the total, while other
business services, at N465.92 billion accounted for 20.9 per cent. Payments in respect of
insurance services, N153.32 billion; financial services, N53.41 billion; government services,
N40.49 billion; royalties and licence fees, N38.58 billion; and communication services,
N32.99 billion; accounted for 6.9, 2.4, 1.8, 1.7, and 1.5 per cent of the total, respectively.
Others accounted for the balance.
Figure 79Share of Services Out-Payments
(First Half 2017, Per cent
Transport46.6%
Government2.6%
Travel12.5%
Other Business 22.6%
Financial3.3%
Insurance7.0%
Royalties & Licence Fees2.1%
Communications1.5%
Others2.1%
Source: CBN

115
CBN Economic Report for the First Half of 2017
4.5.1.3 Income
Transactions in the income account resulted in a higher net deficit of N1,544.84 billion or
2.9 per cent of GDP, compared with N835.34 billion or 1.8 per cent of GDP and N1,369.76
billion or 2.4 per cent of GDP, respectively, in the first and second halves of 2016. The
development was attributed to increased payment of dividends and distributed
branch profits as well as other payments to non-resident investors. The investment
income sub-account recorded a higher net deficit of N1,579.08 billion, compared with
N1,399.43 billion and N852.00 billion in the preceding and corresponding periods of
2016. On the contrary, compensation of employees' sub-component maintained a net
surplus balance increasing to N34.24 billion in the review period, above the levels of
N33.11billion and N19.05 billion in the second and first halves of 2016, respectively.
4.5.1.4 Current Transfers
Available data showed a net surplus of N3,111.07 billion or 5.8 per cent of GDP in the
current transfers account during the review period. This was above the N3,014.55 billion
(5.3 % of GDP) and N2,012.64 billion, (4.4% of GDP) in the second and first halves of 2016,
respectively. The development was due to the higher inflow of home remittances which
accounted for 98.0 per cent of total inflow. At N57.88 billion in the first half of 2017, the
net surplus in the general government transfers (comprising payments to foreign
embassies and international organisations) declined significantly below the level in the
corresponding period of 2016.
Figure 80Private Home Remittances
(N'billion)
1,886.76
3,096.21 3,155.93
-
1,000.0
2,000.0
3,000.0
4,000.0
First Half 2016 Second Half 2016 First Half 2017
Source: CBN
116
CBN Economic Report for the First Half of 2017
4.5.2 Capital and Financial Account
In the first half of 2017, the capital and financial account recorded a higher net foreign
financial liability of N1,739.66 billion or 3.3 per cent of GDP, compared to N545.22 billion or
1.0 per cent of GDP and N57.01billion or 0.11 per cent of GDP in the second and first halves
of 2016, respectively.
Aanalysis of the capital and financial account showed that aggregate financial assets
(financial outflow) increased to N1,453.83 billion in the review period above the level of
N328.91 billion and N410.97 billion in the second and first halves of 2016. Aggregate
foreign liabilities (financial inflows by non-resident investors into the economy) maintained
an upward trend increasing to N3,193.49 billion above the levels of N874.13 billion and
N467.98 billion, respectively, in the second and first halves of 2016, occasioned by
increased inflow of loans and portfolio investment in the review period.
4.5.2.1 Foreign Direct Investment
Inflow of FDI into the economy increased to N532.63 billion in the first half of 2017, above
the level of N363.38 billion in the first half of 2016. This was as a result of increased fresh
equity capital and higher retained earnings in Nigerian companies by non-resident
investors. It, however, declined by 34.0 per cent below the N807.15 billion recorded in the
second half of 2016. In terms of share in total inflow, FDI accounted for 16.7 per cent.
Residents' outward direct investment decreased to N196.07 billion from N211.57 billion
recorded in the second half of 2016, but increased relative to N196.07 billion recorded in
the first half of 2016. This accounted for 13.5 per cent of total financial assets abroad.
Further analysis revealed that FDI component accounted for 13.5 per cent of total
financial assets.
4.5.2.2 Portfolio Investment
Portfolio investment inflow comprising equity and debt securities rose to N892.06 billion
from the levels of N333.12 billion and N162.12 billion in the preceding and corresponding
halves of 2016, respectively, in the review period. This was due largely to increased
investment in government debt securities occasioned by the attractive returns on
investment. A further analysis showed that, portfolio investment inflow accounted for 27.9
per cent of total investment in the review period. The ratio of portfolio investment to
external reserves as a measure of the level of exposure of the external sector to short-term
liabilities, was 147.0 per cent, above the 100.0 per cent international benchmark. On the
other hand, portfolio investments abroad driven by investment in equity securities,
declined during the review period to N0.51 billion from N26.27 billion and N14.41 billion in
the first and second halves of 2016, respectively. Its share in total assets was low at 0.03 per
cent, reflecting the risk-averseness of resident investors.
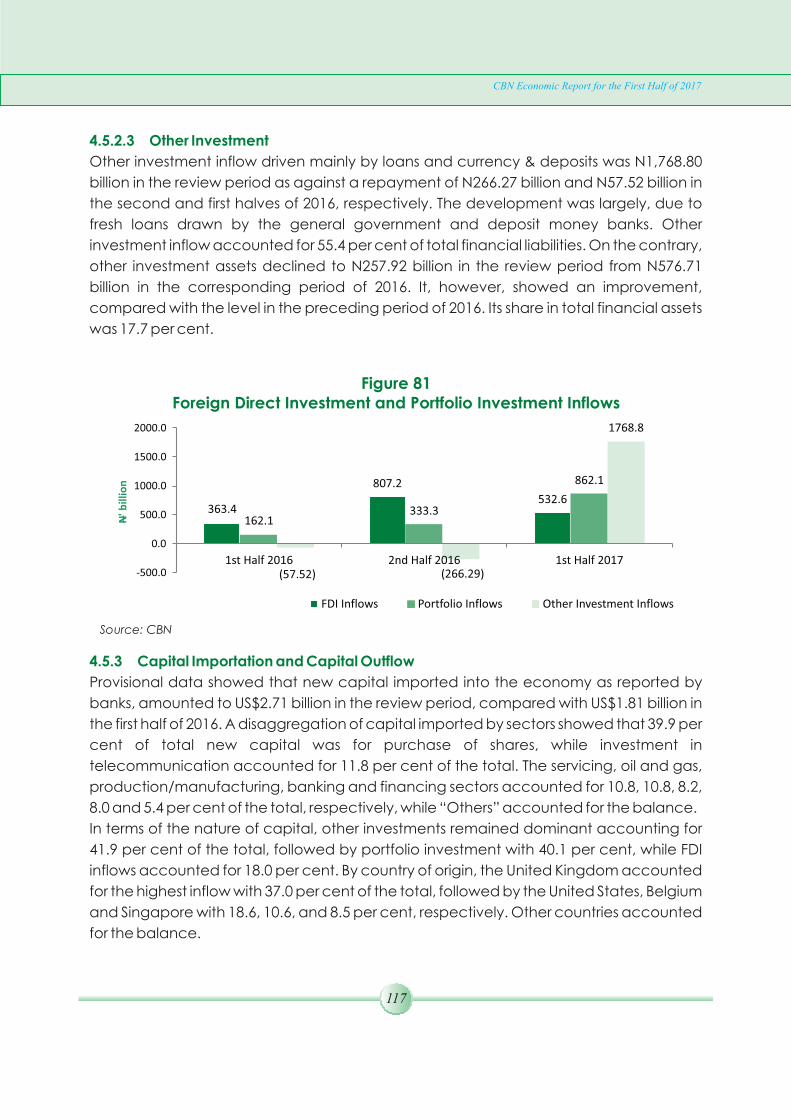
117
CBN Economic Report for the First Half of 2017
4.5.2.3 Other Investment
Other investment inflow driven mainly by loans and currency & deposits was N1,768.80
billion in the review period as against a repayment of N266.27 billion and N57.52 billion in
the second and first halves of 2016, respectively. The development was largely, due to
fresh loans drawn by the general government and deposit money banks. Other
investment inflow accounted for 55.4 per cent of total financial liabilities. On the contrary,
other investment assets declined to N257.92 billion in the review period from N576.71
billion in the corresponding period of 2016. It, however, showed an improvement,
compared with the level in the preceding period of 2016. Its share in total financial assets
was 17.7 per cent.
Figure 81Foreign Direct Investment and Portfolio Investment Inflows
363.4
807.2532.6
162.1333.3
862.1
(57.52) (266.29)
1768.8
-500.0
0.0
500.0
1000.0
1500.0
2000.0
1st Half 2016 2nd Half 2016 1st Half 2017
N' b
illio
n
FDI Inflows Portfolio Inflows Other Investment Inflows
Source: CBN
4.5.3 Capital Importation and Capital Outflow
Provisional data showed that new capital imported into the economy as reported by
banks, amounted to US$2.71 billion in the review period, compared with US$1.81 billion in
the first half of 2016. A disaggregation of capital imported by sectors showed that 39.9 per
cent of total new capital was for purchase of shares, while investment in
telecommunication accounted for 11.8 per cent of the total. The servicing, oil and gas,
production/manufacturing, banking and financing sectors accounted for 10.8, 10.8, 8.2,
8.0 and 5.4 per cent of the total, respectively, while “Others” accounted for the balance.
In terms of the nature of capital, other investments remained dominant accounting for
41.9 per cent of the total, followed by portfolio investment with 40.1 per cent, while FDI
inflows accounted for 18.0 per cent. By country of origin, the United Kingdom accounted
for the highest inflow with 37.0 per cent of the total, followed by the United States, Belgium
and Singapore with 18.6, 10.6, and 8.5 per cent, respectively. Other countries accounted
for the balance.
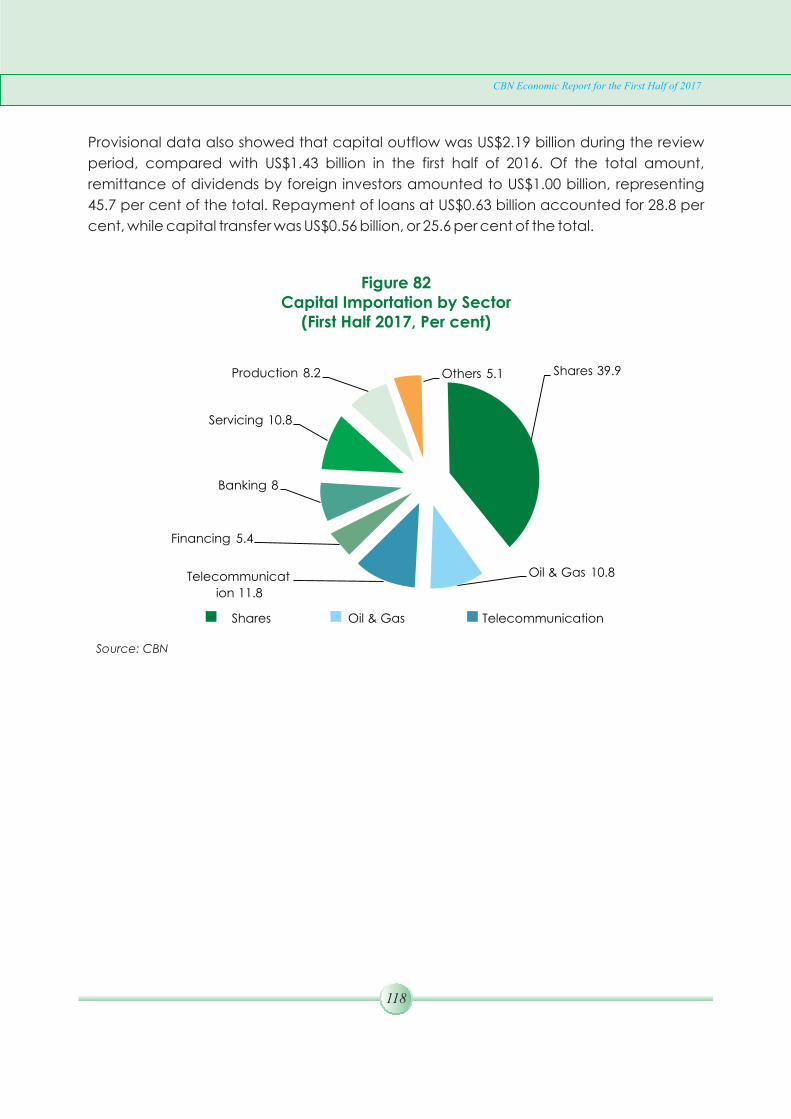
118
CBN Economic Report for the First Half of 2017
Provisional data also showed that capital outflow was US$2.19 billion during the review
period, compared with US$1.43 billion in the first half of 2016. Of the total amount,
remittance of dividends by foreign investors amounted to US$1.00 billion, representing
45.7 per cent of the total. Repayment of loans at US$0.63 billion accounted for 28.8 per
cent, while capital transfer was US$0.56 billion, or 25.6 per cent of the total.
Figure 82Capital Importation by Sector
(First Half 2017, Per cent)
Shares 39.9
Oil & Gas 10.8Telecommunicat
ion 11.8
Financing 5.4
Banking 8
Servicing 10.8
Production 8.2 Others 5.1
Shares Oil & Gas Telecommunication
Source: CBN

119
CBN Economic Report for the First Half of 2017
Figure 83Capital Outflow and Outward Transfers
(First Half 2017, Per cent)
Capital Transfers25.8
Dividends 45.4
Loans 28.8
Capital Transfers Dividends Loans
4.5.4 External Reserves
Gross external reserves at end-June 2017 stood at US$30.34 billion, compared with
US$26.99 billion and US$26.51 billion at end-December and end-June 2016, respectively.
The improvement in external reserves was attributed mainly to crude oil-related receipts,
and federal government loans, Eurobond proceeds and cash collateral. The external
reserves position could cover 7.7 months of import of goods and services and 11.1 months
of import of goods only. A breakdown of the external reserves by ownership showed that
Federation was US$2.62 billion (8.6%); Federal Government, US$7.07 billion (23.3%); and
the CBN, US$20.64 billion (68.1%) of the total.
Source: CBN

120
CBN Economic Report for the First Half of 2017
Figure 84External Reserves Stock and Months of Import Commitments
26.51 26.9930.34
0
10
20
30
40
First Half 2016 Second Half 2016 First Half 2017
US$
bill
ion
External Reserves
Months of Import Commitments (Goods only)
Months of Import Commitments (Goods and Services)
Source: CBN

121
CBN Economic Report for the First Half of 2017
5.0 INTERNATIONAL ECONOMIC RELATIONS
5.1 Global Institutions
5.1.1 International Monetary Fund (IMF)
5.1.2 The World Bank/IMF Spring Meetings
The 2017 Spring Meetings of the Board of Governors of the World Bank Group (WBG) and
the International Monetary Fund (IMF) were held in Washington D. C., USA from April 17 –
23, 2017. In parallel with the Meetings, were the Ministers of the Inter-Governmental
Group of Twenty-Four (G-24) on International Monetary Affairs and Developments and
the International Monetary and Finance Committee (IMFC) Meetings.
The highlights of the discussions included:
· Increased momentum in global economic growth. It was expected that the
Emerging Market and Developing Countries (EMDCs) would continue to
contribute significantly to global growth. However, downside risks from economic
and non-economic sources remained high, including sharper than expected
tightening of global financial conditions, inward-looking policies, and a reversal of
financial regulatory reforms in systemically important advanced economies;
· Efficient fiscal frameworks was essential to mobilize domestic resources to
effectively support development efforts. There has been progress in improving tax
revenue-to-GDP ratios and enhancing spending efficiency in EMDCs.
Nevertheless, international partners have an important role to play in supporting
capacity building for revenue mobilization. The EMDCs were encouraged to
engage in more peer learning and collaboration; and
· The IMF has a key role to play in supporting member countries to sustain recovery
through monetary, fiscal, and structural policies.
The G-24 Ministers:
Expressed support for a quota-based, adequately-resourced IMF that is less
dependent on borrowed resources; and
Called for the full implementation of the 2010 Governance Reforms on Board
Representation as well as the completion of the 15th General Review of Quotas,
including a new quota formula.
The International Monetary and Finance Committee (IMFC):
Welcomed initiatives by the IMF in providing country-specific advice on the policy
mix that would sustain the ongoing recovery and address excessive global

122
CBN Economic Report for the First Half of 2017
imbalances; and
Called on the IMF to promote policies that would expand opportunities; facilitate
multilateral solutions to meet global challenges; and strengthen the international
monetary system.
5.1.3 G24 Technical Group Meeting
The 2017 Spring Technical Group Meeting (TGM) was held in Addis-Ababa, Ethiopia from
February 27 - 28, 2017. The Meeting discussed investment in infrastructure and managing
structural transformation; mobilising domestic resources for development; and
international tax cooperation.
On infrastructure financing, there was a consensus that given the huge infrastructural
deficits in member-countries, budget appropriations have become grossly inadequate
to meet the financing requirements. Thus, other domestic and external financing sources
have become germane.
Policy actions to promote long-term investments by domestic institutions were suggested
as follows:
· Government support for long-term investments involving designing policy
frameworks that were supportive of long-term investing. The limited number and
sporadic nature of investment opportunities in the infrastructure sector were
perceived as the main barrier preventing investors from including infrastructure in
their long-term investment strategy;
· Government support, such as long-term policy planning, tax incentives and risk
transfer mechanisms may be required to engage investors in less liquid, long term
investments in infrastructure; and
· There was need for reforming the regulatory framework for long-term investment.
Policymakers need to promote greater professionalism and expertise in the
governance of institutional investors. Collaboration and resource-pooling can
also be encouraged to create institutions of sufficient scale that can implement a
broader investment strategy and more effective risk management systems that
take into account long-term risks.
On transformative industrial policy, the following broad lessons for industrial policymakers
in member-countries were noted:
· The importance of productive capability building in economic development was
highlighted. If a policy limits the possibilities of building productive capabilities in
the long run, as policies like free trade or unconditional participation in global
value chains (GVCs) are likely to do, it should not be adopted, or, at least,

123
CBN Economic Report for the First Half of 2017
adopted with a deliberate plan to phase it out as soon as possible;
= Industrial policy-makers need to acquaint themselves with a range of industrial policy
experiences, if they were to design policies with the greatest possible effectiveness;
and
= The recent changes in global industrial policy environment, the shrinkage in 'policy
space' and the rise of GVCs, have not made industrial policy irrelevant. If anything,
they have made it even more important for developing countries' industrial
policymakers to be 'smarter'.
The challenge that governments in developing countries face in mobilising tax revenues,
which usually result in a gap between potential and actual revenues mobilised, was
recognised.
The key recommendations were that:
l Domestic revenue mobilisation effort should take a broader and longer-term
perspective; and
l Effort should also be targeted at creating an environment conducive to sustainable
revenue mobilisation as part of a social contract between the government and the
citizens. This means promoting efficient, effective, equitable and sustainable revenue
policy and administrative strategies, and a strengthened legal framework to support
them.
5.2 Regional Institutions
5.2.1 Ordinary Meeting of the Bureau of the Association of African Central Banks
(AACB), Dakar, Senegal, March 8, 2017
The Bureau of the Association of African Central Banks (AACB) held its Ordinary Meeting
in Dakar, Senegal on March 8, 2017. The Meeting was preceded by the Technical
Meeting of the Bureau from March 6 – 7, 2017.
The Meeting:
= Examined the amended report of the Experts Group on the refinement of the
convergence criteria of the African Monetary Cooperation Programme (AMCP) and
instructed the Experts Group to:
= Provide justifications on the selected criteria and thresholds;
= Present timelines for the creation of the African Central Bank (ACB);
= Submit the report to the member central banks and to the Regional Economic
Communities (RECs) for comment; and
= Present the report to the 40th Session of the Assembly of Governors scheduled
for August 2017 in South Africa.

124
CBN Economic Report for the First Half of 2017
· Selected "Monetary Integration Prospects in Africa: Lessons from the Experience
of the European Monetary and Financial Integration", as the theme for the 2017
Symposium, with the following sub-themes:
Monetary integration: African Experience and European Experience;
Coordinating and Merging Monetary and non-Monetary Blocs in Africa for
Monetary Integration; and
Banking and Financial Reforms in the Post Global Financial Crisis Era:
Lessons for Africa.
· Selected "Credible Communication Strategies for Central Banks in the Framework
of Monetary Policy and Financial Stability", as the theme for the 2017 Continental
Seminar, with the following sub-themes:
Central Bank Communication and Monetary Policy Credibility;
Central Bank Communication and Financial Stability; and
Cross-Country Analysis on Central Banks Communication: Lessons for
African Central Banks.
5.2.2 2017 Association of African Central Banks (AACB) Continental Seminar
The 2017 Association of African Central Banks (AACB) Continental Seminar was held in
Accra, Ghana from May 3 – 5, 2017. The theme of the Seminar was “Credible
Communication Strategies for Central Banks in the Framework of Monetary Policy and
Financial Stability”.
Key recommendations proposed at the Seminar included:
· Training journalists and engaging the media on reporting emerging crisis, its
implications and how it is being managed;
· Having a team of experts ready to be used in public engagement in times of
crises;
· Ensuring coordinated communication to advise management on the
implications of a chosen course of action;
· Having a full-fledged and functional communication department in central
banks with adequate budget allocation to carry out their mandate;
· Having a definitive communication strategy for monetary policy and financial
stability;
· Communication officials should have adequate authorisation to execute their
mandate;
· Ensuring a blend of communication experts and economists where necessary,
with strong collaboration between monetary policy and financial stability
departments; and
· Ensuring the use of appropriate methodologies for measuring the effectiveness of
monetary policy communication.

125
CBN Economic Report for the First Half of 2017
5.3 Sub-Regional Institutions
5.3.1 Economic Community of West African States (ECOWAS)
The Mid-Year Statutory Meeting of the Economic Community of West African States
(ECOWAS) was held at Monrovia, Liberia from May 25 – June 4, 2017. The objective of the
meeting was to highlight the major areas of concern with respect to the implementation
of the ECOWAS Monetary Cooperation Programme (EMCP), assess the progress made,
as well as identify important areas that require urgent attention towards the 2020
monetary integration.
The major outcome of the Meeting was the adoption of Morocco as a member in
principle. The President of Liberia, Mrs. Ellen Johnson Sirleaf, handed over the mantle of
leadership to the President of Togo, Faure Gnassingbé, in line with the rotational principle
of the Community.
5.3.2 West African Monetary Zone (WAMZ) Committee of Governors
The 34th Meeting of the Committee of Governors of the Central Banks of the West African
Monetary Zone (WAMZ) was held in Freetown, Sierra Leone on February 9, 2017, to
deliberate on the status of implementation of the WAMZ Work Programme. The Report of
the 40th Meeting of the Technical Committee formed the basis for the deliberations.
After deliberations, the Committee of Governors endorsed the following
recommendations for the consideration of the Convergence Council:
i. The Report on macroeconomic developments and convergence in the WAMZ at
end-June 2016 and urged member-states to:
· endeavour to diversify their economies so as to minimise the impact of
shocks, domestic or external, as well as stimulate their economies through
targeted spending in growth-enhancing sectors for employment-
generation and poverty-reduction;
· strengthen fiscal consolidation through expenditure rationalisation and
revenue mobilisation measures. Tax administration should be
strengthened, including enforcement strategies aimed at curbing tax
evasion and excessive duty waivers in a bid to enhance revenue
collection and consequently improving on the fiscal deficit to GDP ratio;
· restrain the rising wage bill in some member countries through the
development and implementation of public financial management
reforms; and
· ensure full implementation of the CET, making efforts to resolve issues
hindering the take-off as countries which have implemented the CET have
not suffered any revenue losses;

126
CBN Economic Report for the First Half of 2017
ii. Directed WAMI to undertake a study on the implications of fragility of member-
states' economies on the convergence process with implementable
recommendations at the next statutory meetings;
iii. Directed WAMI to finalise and re-present the paper on “Managing Commodity
Price Shocks in the WAMZ: The Role of Fiscal, Monetary and Exchange Rate
Policies” to the Technical Committee;
iv. Endorsed the transformation of WAMI into a Commission;
v. Approved the roadmap leading to the establishment of the proposed WAMZ
Commission, including the preparation of a project document, proposals for the
amendment of the WAMZ Agreement and the convening of WAMZ Heads of
State Summit to consider and approve the establishment of the Commission;
vi. Urged the beneficiary member-states to fund, on equal basis, the shortfall for the
WAMZ Payments System Project arising from the exchange rate losses due to
appreciation of the US-dollar against the Unit of Account;
vii. Directed WAMI to prepare a proposal and seek funding for the WAMZ Payments
and Settlement System (WAMZPSS), which will establish, among other functions,
an inter-linkage between the RTGS of the WAMZ member-states via SWIFT to
facilitate cross-border trade through efficient and safe transfer of funds and also
serve as a platform for quoting and trading in WAMZ national currencies;
viii. Noted the Report on the progress made in capital market integration in West
Africa and urged member-states to redouble efforts to address the constraints to
deepening the market in the WAMZ; and
ix. Directed WAMI to establish three sub-committees, namely Legal and Institutional,
Payments System, and Operations, to facilitate the work of the Experts
Committee on Quoting and Trading in WAMZ National Currencies.
5.3.3 West African Institute for Financial and Economic Management (WAIFEM)
The 32nd Board of Governors Meeting of the West African Institute for Financial and
Economic Management (WAIFEM) was held in Freetown, Sierra Leone on February 9,
2017. The Meeting was preceded by the 35th meeting of the Technical Committee held
on February 5, 2017. The Meeting was chaired by the Deputy Governor, Bank of Liberia
and Chairman, Board of Governors of WAIFEM. The report of the Technical Committee
formed the basis for the Board of Governors' deliberations.
After deliberating on the report, the Board of Governors:
· adopted the draft minutes of the 31st Meeting of the Board of Governors;
· noted the Progress Report by the Director General;
· approved the Draft Revised Budget for the Year 2017;
· noted the Report on studies conducted by the Research Unit;
· noted the Progress Report on the implementation of the WAIFEM's Strategic Plan;
and

127
CBN Economic Report for the First Half of 2017
· noted the Status Report on WAIFEM as an ECOWAS Training Institute.
5.3.4 Meeting of the Committee of Governors of ECOWAS Member Central Banks
The 49th Ordinary Meeting of the Committee of Governors (CoG) of Central Banks of
ECOWAS member-states was held on February 9, 2017 in Freetown, Sierra Leone. The
Meeting was preceded by the 30th Meeting of the Technical Committee held from
February 3 - 4, 2017. The CoG Meeting reviewed and discussed the report of the 30th
meeting of the Technical Committee. After deliberations, the CoG endorsed the
following recommendations:
I. On the ECOWAS Monetary Cooperation Programme in 2015 Report, the CoG
urged Member Countries to:
I. Improve the business climate with the aim of diversifying the economy,
strengthening growth prospects and boosting exports through:
· acceleration of on-going reforms with a view to overcoming the
constraints impeding the development of certain sectors of the
economy and enhancing dynamism of economic activities and
diversifying the sources of growth;
· stepping up effort to boost energy production and the
development of modern infrastructure with a view to increasing
capacity for processing raw materials and reducing dependence
on commodity export;
· implementation of appropriate measures to curb the spread of
terrorism through, inter alia, strengthening security arrangements,
improving the education system, combating youth unemployment
and developing vulnerable areas; and
· consolidation of ongoing actions to resolve the socio-political and
security crises in the region.
ii. Take all necessary measures to contain the budget deficits, curtail the
rapid growth in public debt and improve the impact of government
expenditure especially by:
· increasing tax revenue through modernisation of the tax
administration, expanding the tax base, strengthening control
procedures and minimising exemptions;
· rationalising public sector institutions by modernising administrative
systems and operational procedures to minimise recurrent
expenditure, in particular the wage bill as well as transfers and
subsidies; and
· enhancing the effectiveness and efficiency of public investment to
increase their impact on growth.

128
CBN Economic Report for the First Half of 2017
iii. To show more commitment to the monetary integration agenda by
ensuring compliance with the convergence criteria on a sustainable
basis;
iv. Liberia should fast-track effort at the de-dollarisation of its economy;
v. WAMA urged to conduct the following studies:
a. The Relationship between GDP, Growth in Money Supply and
Inflation in ECOWAS member-countries; and
b. The Sufficiency of the Convergence Criteria as Basis for Monetary
Integration in ECOWAS.
II. The CoG considered the Report on Exchange Rate Developments of ECOWAS
Currencies at end-2015 and in the first half of 2016 and urged Member States to:
i. undertake structural reforms aimed at diversifying exports to
increase the foreign exchange earning capacity of member-states
of ECOWAS;
ii. take measures to encourage local production and consumption as
part of the process of import substitution;
iii. promote the use of local currencies in domestic transactions; and
iv. strengthen economic policies of member states by enhancing the
collaboration between monetary and fiscal authorities.
III. The CoG considered the Report on Financial Sector Developments and Stability in
ECOWAS (First half 2016) and recommended that member countries should:
i. adopt risk-based supervision and set up deposit insurance schemes
to safeguard depositors' funds, reinforce public confidence in the
banking system and contribute towards financial stability; and
ii. initiate the establishment of colleges of supervisors for systemically
important financial institutions to guard against financial instability.
IV. On the Study on the Mechanisms for Transition to Inflation Targeting Lite (ITL) in
ECOWAS, the CoG directed WAMA to:
i. confirm whether ITL would be the optimal framework for ECOWAS
monetary policy; and
ii. undertake a study on the compatibility of the ITL framework with
exchange rate regimes of ECOWAS member-countries.
V. On the Proposal for the Establishment of an Exchange Rate Mechanism for
ECOWAS, it was recommended that WAMA should:
i. Update the report, taking into account, recent developments of ECOWAS

129
CBN Economic Report for the First Half of 2017
currencies;
ii. Review the strengths and weaknesses of the currencies of ECOWAS
member countries and evaluate movements towards convergence;
iii. Conduct a study project with a view to assessing the impact of the
proposed exchange rate mechanism on the economies of Member
States; and
iv. Organise a meeting of exchange rate specialists to share the technical
aspects of the report.
5.3.5 Convergence Council of Ministers and Governors of Central Banks of the WAMZ
The 37th Meeting of the Convergence Council of Ministers and Governors of the Central
Banks of the West African Monetary Zone (WAMZ) was held in Freetown, Sierra Leone on
February 10, 2017, to deliberate on the status of implementation of the WAMZ Work
Programme. The Report of the 34th Meeting of the Committee of Governors formed the
basis for the deliberations. In a unanimous decision, the Republic of Sierra Leone was
elected as Chair of the Convergence Council.
Following deliberations on the presentations by the Committee of Governors of the
WAMZ members, Council approved the recommendations of the Committee of
Governors.

130
CBN Economic Report for the First Half of 2017
6.0 OUTLOOK FOR THE SECOND HALF OF 2017
The outlook for Nigeria's economy for the rest of the year signals moderate improvement,
premised largely on expected fiscal expansion, slowdown in inflationary pressure,
stability in the foreign exchange market and increase in non-oil receipts. The cautious
optimism was against the backdrop of persisting structural rigidities and sluggish recovery
of the global economy.
The outlook for the real sector for the remaining half of 2017 is largely positive. The
commitment of the Federal Government to implement the Economic Recovery and
Growth Plan (ERGP) and close dilapidated infrastructure gap is expected to increase
domestic production, dampen inflationary pressure and moderate unemployment. In
addition, the CBN interventions in critical sectors, the commitment of the government to
enhance ease of doing business through the signing of three (3) executive orders, as well
as the sustained effort to stem insurgency in the North Eastern, would improve the
macroeconomic environment for increased real sector productivity, thereby returning
the economy to positive growth path.
The improved performance of the external sector was expected to be sustained into the
second half of 2017. The positive outlook is premised on the fact that crude oil price and
production increase in 2017. With the peace deal in the Niger Delta region, it is expected
that this favourable scenario would continue in the near future. On the foreign exchange
market, the CBN remains committed to provide the required liquidity to support domestic
production.
On the fiscal side, there are indications that government revenue target would be met.
The passage of the 2017 appropriation bill would stimulate economic activities, through
capital releases to address infrastructure deficits and the Paris Club refund to state
governments to settle the accumulated salaries and pension arrears. These
developments would provide the necessary fiscal stimulus for the economy and boost
aggregate demand and output. The downside risk, however, is the likelihood of
bunching capital spendings with implication for banking system liquidity. This should be
contained by effective fiscal/monetary policy coordination.
In the financial sector, with the continued monetary policy tightening stance of the Bank,
the prospect of achieving its objectives of monetary and price stability is bright. Also, the
prospect for improvement in the banking sector in particular will rest, largely, on the
gradual reversal of deterioration in asset quality of banks, which remained significantly
above the regulatory benchmark in the review period. The effort by the banks, in debt
recovery, realisation of collateral for lost facilities and strengthening of risk management

131
CBN Economic Report for the First Half of 2017
functions, coupled with measures being taken by the CBN, are likely going to lead to a
rebound in the sector. The sector, however, witnessed the emergence of digital
currencies, innovation in financial technology which poses risks to monetary policy
effectiveness. An understanding of this development alongside approaches to
overcome its downside risks is critical for the monetary authority in the coming months in
the year, to maintain a balance in the financial sector and ensure the achievement of
the Bank's mandate of price and financial system stability.
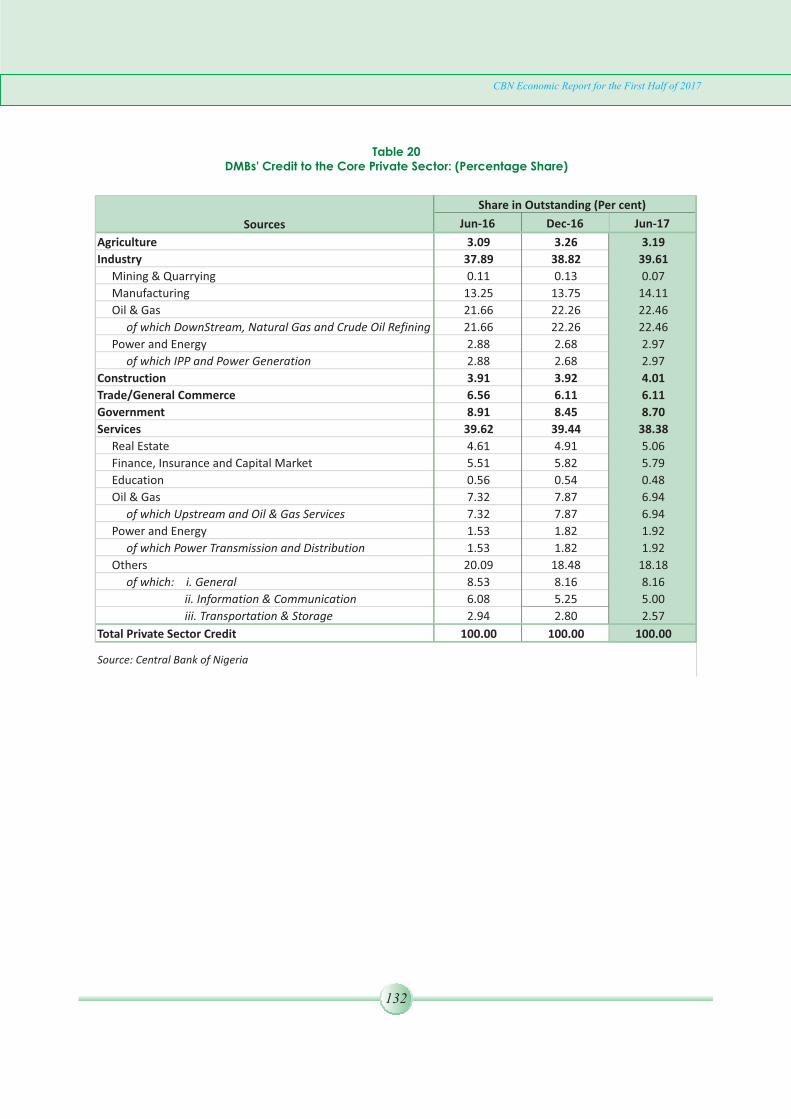
132
CBN Economic Report for the First Half of 2017
Table 20DMBs' Credit to the Core Private Sector: (Percentage Share)
Sources Jun-16 Dec-16 Jun-17
Agriculture 3.09 3.26 3.19
Industry 37.89 38.82 39.61
Mining & Quarrying 0.11 0.13 0.07
Manufacturing 13.25 13.75 14.11
Oil & Gas 21.66 22.26 22.46
of which DownStream, Natural Gas and Crude Oil Refining 21.66 22.26 22.46
Power and Energy 2.88 2.68 2.97
of which IPP and Power Generation 2.88 2.68 2.97
Construction 3.91 3.92 4.01
Trade/General Commerce 6.56 6.11 6.11
Government 8.91 8.45 8.70
Services 39.62 39.44 38.38
Real Estate 4.61 4.91 5.06
Finance, Insurance and Capital Market 5.51 5.82 5.79
Education 0.56 0.54 0.48
Oil & Gas 7.32 7.87 6.94
of which Upstream and Oil & Gas Services 7.32 7.87 6.94
Power and Energy 1.53 1.82 1.92
of which Power Transmission and Distribution 1.53 1.82 1.92
Others 20.09 18.48 18.18
of which: i. General 8.53 8.16 8.16
ii. Information & Communication 6.08 5.25 5.00
iii. Transportation & Storage 2.94 2.80 2.57
Total Private Sector Credit 100.00 100.00 100.00
Source: Central Bank of Nigeria
Share in Outstanding (Per cent)

133
CBN Economic Report for the First Half of 2017
Table 21Money Market Rates: First Half 2017 /1
(Per cent)
Month MPRInterbank Call
RateOBB NIBOR: Call NIBOR: 30 Days NIBOR: 90 Days
Jan - 17 14.00 8.15 8.69 9.70 16.95 18.44
Feb - 17 14.00 27.46 23.60 23.94 16.87 19.14
Mar - 17 14.00 12.56 21.60 22.08 19.99 20.45
Apr - 17 14.00 64.58 51.04 58.51 55.47 56.61
May - 17 14.00 21.29 39.29 41.35 30.48 31.33
Jun - 17 14.00 13.46 29.57 32.88 30.84 31.55
1st Half 2017 Average 14.00 24.58 28.97 31.41 28.43 29.59
1st Half 2016 Average 11.67 9.28 6.75 6.73 9.03 10.16
Sources: Central Bank of Nigeria and Financial Markets Dealers Association 1/ Revised n. a. means not available
WEIGHTED AVERAGE
Table 22Selected Interest Rates: First Half 2017
(Per cent)
Month SavingsAverage
Term Deposit
Prime
Lending
Maximum
Lending
Jan - 17 4.22 7.81 16.91 28.88
Feb - 17 4.22 7.85 17.13 29.26
Mar - 17 4.23 7.85 17.43 30.18
Apr - 17 4.24 7.97 17.44 30.31
May - 17 4.08 7.98 17.58 30.75
Jun - 17 4.08 7.86 17.59 30.94
1st Half 2017 Average 4.18 7.89 17.35 30.06
1st Half 2016 Average 3.43 5.76 16.63 26.83
Source: Central Bank of Nigeria
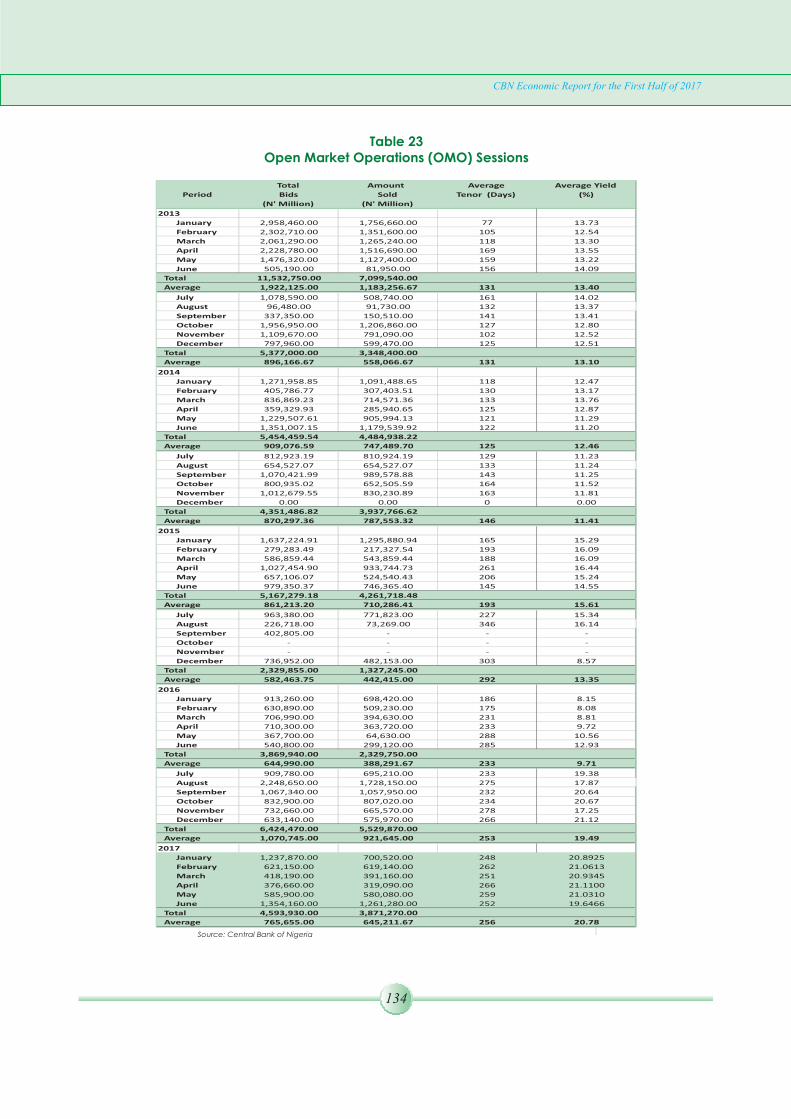
134
CBN Economic Report for the First Half of 2017
Table 23Open Market Operations (OMO) Sessions
Source: Central Bank of Nigeria
Total Amount Average Average Yield
Bids Sold Tenor (Days) (%)
(N' Million) (N' Million)
2013
January 2,958,460.00 1,756,660.00 77 13.73
February 2,302,710.00 1,351,600.00 105 12.54
March 2,061,290.00 1,265,240.00 118 13.30
April 2,228,780.00 1,516,690.00 169 13.55
May 1,476,320.00 1,127,400.00 159 13.22
June 505,190.00 81,950.00 156 14.09
Total 11,532,750.00 7,099,540.00
Average 1,922,125.00 1,183,256.67 131 13.40
July 1,078,590.00 508,740.00 161 14.02
August 96,480.00 91,730.00 132 13.37
September 337,350.00 150,510.00 141 13.41
October 1,956,950.00 1,206,860.00 127 12.80
November 1,109,670.00 791,090.00 102 12.52
December 797,960.00 599,470.00 125 12.51
Total 5,377,000.00 3,348,400.00
Average 896,166.67 558,066.67 131 13.10
2014
January 1,271,958.85 1,091,488.65 118 12.47
February 405,786.77 307,403.51 130 13.17
March 836,869.23 714,571.36 133 13.76
April 359,329.93 285,940.65 125 12.87
May 1,229,507.61 905,994.13 121 11.29
June 1,351,007.15 1,179,539.92 122 11.20
Total 5,454,459.54 4,484,938.22
Average 909,076.59 747,489.70 125 12.46
July 812,923.19 810,924.19 129 11.23
August 654,527.07 654,527.07 133 11.24
September 1,070,421.99 989,578.88 143 11.25
October 800,935.02 652,505.59 164 11.52
November 1,012,679.55 830,230.89 163 11.81
December 0.00 0.00 0 0.00
Total 4,351,486.82 3,937,766.62
Average 870,297.36 787,553.32 146 11.41
2015
January 1,637,224.91 1,295,880.94 165 15.29
February 279,283.49 217,327.54 193 16.09
March 586,859.44 543,859.44 188 16.09
April 1,027,454.90 933,744.73 261 16.44
May 657,106.07 524,540.43 206 15.24
June 979,350.37 746,365.40 145 14.55
Total 5,167,279.18 4,261,718.48
Average 861,213.20 710,286.41 193 15.61
July 963,380.00 771,823.00 227 15.34
August 226,718.00 73,269.00 346 16.14
September 402,805.00 - - -
October - - - -
November - - - -
December 736,952.00 482,153.00 303 8.57
Total 2,329,855.00 1,327,245.00
Average 582,463.75 442,415.00 292 13.35
2016
January 913,260.00 698,420.00 186 8.15
February 630,890.00 509,230.00 175 8.08
March 706,990.00 394,630.00 231 8.81
April 710,300.00 363,720.00 233 9.72
May 367,700.00 64,630.00 288 10.56
June 540,800.00 299,120.00 285 12.93
Total 3,869,940.00 2,329,750.00
Average 644,990.00 388,291.67 233 9.71
July 909,780.00 695,210.00 233 19.38
August 2,248,650.00 1,728,150.00 275 17.87
September 1,067,340.00 1,057,950.00 232 20.64
October 832,900.00 807,020.00 234 20.67
November 732,660.00 665,570.00 278 17.25
December 633,140.00 575,970.00 266 21.12
Total 6,424,470.00 5,529,870.00
Average 1,070,745.00 921,645.00 253 19.49
2017
January 1,237,870.00 700,520.00 248 20.8925
February 621,150.00 619,140.00 262 21.0613
March 418,190.00 391,160.00 251 20.9345
April 376,660.00 319,090.00 266 21.1100
May 585,900.00 580,080.00 259 21.0310
June 1,354,160.00 1,261,280.00 252 19.6466
Total 4,593,930.00 3,871,270.00
Average 765,655.00 645,211.67 256 20.78
Period

135
CBN Economic Report for the First Half of 2017
Table 24Treasury Bills: Issues and Allotments
(Naira Million)
Deposit Money
Banks
Non-Bank
Public
2013
June 397,845.75 0.00 152,626.18 245,219.57
December 400,605.12 0.00 139,214.85 261,390.28
Annual Total 3,650,881.21 0.00 1,853,716.30 1,797,164.91
Annual Average 304,240.10 0.00 154,476.36 149,763.74
2014
June 440,713.48 0.00 165,215.22 275,498.26
December 378,130.00 21,260.00 132,010.00 224,850.00
Annual Total 3,879,469.09 88,240.00 1,985,031.81 1,806,194.96
Annual Average 323,289.09 7,353.33 165,419.32 150,516.25
2015
June 380,023.16 0.00 212,850.32 167,172.84
December 352,034.71 0.00 344,843.52 7,191.20
Annual Total 3,845,317.30 0.00 2,686,460.16 1,158,857.14
Annual Average 320,443.11 0.00 223,871.68 96,571.43
2016
June 480,753.95 28,000.00 260,910.92 191,843.03
December 347,920.69 43,511.80 157,769.48 146,639.42
Annual Total 4,555,502.05 163,590.48 2,329,090.90 2,062,820.67
Annual Average 379,625.17 13,632.54 194,090.91 171,901.72
2017
January 441,808.31 -
340,747.79
101,060.52
February 504,833.44 -
388,414.89
116,418.55
March 698,966.18 14,130.18
330,783.44
354,052.56
April 402,411.43 113,050.28
163,504.05
125,857.10
May 367,605.89 -
158,014.69
209,591.19
June 513,625.88 -
244,465.98
269,159.90
Half Year Total 2,929,251.12 127,180.46 1,625,930.84 1,176,139.83
Half Year Average 488,208.52 21,196.74 270,988.47 196,023.30
Source: Central Bank of Nigeria
Period IssuesCentral
Bank
Allotment to Subscriber

136
CBN Economic Report for the First Half of 2017
Table 25Monetary and Credit Developments 3/
(N' Million)
Item Jun 2013 Dec 2013 Jun 2014 Dec 2014 Jun 2015 Dec 2015 Jun 2016 Dec 2016 Jun 2017 /4
(1) Domestic Credit (Net) 13,149,382.49 14,535,204.72 16,689,493.70 19,273,756.71 21,409,774.20 21,612,452.09 24,623,626.70 26,857,719.34 27,236,433.60
(a) Claims on Federal Government (Net) -2,542,654.43 -1,656,265.28 -238,488.87 1,147,707.24 2,511,101.09 2,891,946.66 3,171,443.45 4,875,570.30 5,250,486.41
By Central Bank -3,519,920.52 -2,289,104.87 -2,913,883.11 -2,141,684.16 -769,517.43 -1,653,067.50 -1,185,761.66 109,158.25 232,806.35
By Commecial Banks 937,527.48 596,989.86 2,629,128.88 3,214,435.52 3,219,301.45 4,470,267.34 4,179,939.12 4,563,266.39 4,821,703.05
By Merchant Banks 39,738.60 36,606.47 46,265.36 74,955.88 61,317.08 74,746.83 177,266.00 203,145.66 195,977.01
By Non Interest Banks 0.00 -756.74 0.00 0.00 0.00 0.00 0.00 0.00 0.00
(b) Claims on Private Sector 15,692,036.93 16,191,470.00 16,927,982.57 18,126,049.46 18,898,673.11 18,720,505.43 21,452,183.25 21,982,149.04 21,985,947.18
By Central Bank 4,703,313.19 4,599,388.32 4,702,335.98 4,859,887.74 5,093,071.50 5,061,611.28 5,402,940.93 5,298,255.90 5,692,288.30
By Commercial Banks 10,949,139.46 11,543,649.93 12,168,761.86 13,179,598.11 13,712,964.87 13,568,543.70 15,903,577.86 16,500,150.26 16,092,233.81
By Merchant Banks 32,218.12 37,919.13 40,749.44 62,646.43 68,535.18 62,845.80 111,828.57 145,180.11 161,090.01
By Non Interest Banks 7,366.15 10,512.62 16,135.29 23,917.18 24,101.56 27,504.65 33,835.89 38,562.77 40,335.06
(i) Claims on State and Local Govts 661,034.92 779,126.93 489,324.37 538,767.32 472,792.84 585,060.12 729,427.54 989,541.97 1,180,310.12
By Central Bank 0.00 0.00 0.00 0.00 0.00 0.00 27,800.00 300,379.00 495,915.00
By Commercial Banks 660,341.02 776,698.03 486,924.37 536,367.32 471,430.12 583,817.73 698,822.78 681,830.36 678,439.76
By Merchant Banks 693.90 1,428.90 0.00 0.00 0.00 0.00 1,650.14 6,272.36 4,996.57
By Non Interest Banks 0.00 1,000.00 2,400.00 2,400.00 1,362.72 1,242.40 1,154.62 1,060.25 958.80
(ii) Claims on Non-Financial Public Ent's 0.00 23,578.28 23,587.73 25,590.35 51,033.53 25,588.01 319,694.07 25,603.30 32,984.48
By Central Bank 0.00 23,578.28 23,587.73 25,590.35 51,033.53 25,588.01 319,694.07 25,603.30 32,984.48
By Commercial Banks 0.00 0.00 0.00 0.00 0.00 0.00 0.00 0.00 0.00
By Merchant Banks 0.00 0.00 0.00 0.00 0.00 0.00 0.00 0.00 0.00
By Non Interest Banks 0.00 0.00 0.00 0.00 0.00 0.00 0.00 0.00 0.00
(iii) Claims on Other Private Sector 15,031,002.01 15,388,764.78 16,415,070.47 17,561,691.79 18,374,846.74 18,109,857.30 20,403,061.64 20,967,003.77 20,772,652.59
By Central Bank 4,703,313.19 4,575,810.04 4,678,748.26 4,834,297.39 5,042,037.96 5,036,023.27 5,055,446.86 4,972,273.60 5,163,388.82
By Commercial Banks 10,288,798.44 10,766,951.89 11,681,837.48 12,643,230.79 13,241,534.75 12,984,725.98 15,204,755.08 15,818,319.90 15,413,794.05
By Merchant Banks 31,524.22 36,490.23 40,749.44 62,646.43 68,535.18 62,845.80 110,178.43 138,907.76 156,093.44
By Non Interest Banks 7,366.15 9,512.62 13,735.29 21,517.18 22,738.84 26,262.25 32,681.27 37,502.52 39,376.27
(2) Foreign Assets (Net) 9,164,430.15 8,658,649.73 7,673,096.58 6,954,214.77 5,951,452.90 5,653,320.37 7,105,663.47 9,149,659.29 8,468,080.62
By Central Bank 7,561,183.53 7,043,927.36 6,343,984.91 6,244,718.92 5,795,959.61 5,545,320.51 6,840,426.38 8,790,652.82 8,378,904.55
By Commecial Banks 1,599,504.06 1,611,727.94 1,317,873.30 712,557.52 159,892.93 125,384.36 254,493.47 346,200.38 101,695.18
By Merchant Banks 1,936.05 1,089.63 8,419.57 -6,373.02 -5,946.22 -18,785.78 8,455.14 11,711.36 -21,000.64
By Non Interest Banks 1,806.50 1,904.80 2,818.80 3,311.35 1,546.58 1,401.28 2,288.47 1,094.72 8,481.53
(3) Other Assets (Net) -6,720,640.13 -7,504,890.90 -6,785,949.98 -7,314,942.50 -8,549,797.70 -7,235,941.34 -9,651,276.71 -12,415,646.05 -13,723,931.86
Total Monetary Assets 15,593,172.51 15,688,963.55 17,576,640.29 18,913,028.98 18,811,429.40 20,029,831.12 22,078,013.46 23,591,732.58 21,980,582.35
Quasi-Money /1 8,653,623.30 8,656,124.80 10,480,203.25 12,008,237.57 12,269,037.20 11,458,129.82 12,559,032.07 12,320,225.75 11,790,391.44
Money Supply 6,939,549.21 7,032,838.75 7,096,437.05 6,904,791.41 6,542,392.20 8,571,701.30 9,518,981.39 11,271,506.82 10,190,190.92
Currency Outside Banks 1,127,804.88 1,446,660.40 1,211,563.93 1,437,397.09 1,183,988.38 1,456,096.85 1,379,045.17 1,820,415.90 1,477,147.44
Demand Deposits /2 5,811,744.33 5,586,178.35 5,884,873.12 5,467,394.32 5,358,403.82 7,115,604.46 8,139,936.23 9,451,090.92 8,713,043.48
Total Monetary Liabilities 15,593,172.51 15,688,963.55 17,576,640.29 18,913,028.98 18,811,429.40 20,029,831.12 22,078,013.46 23,591,732.58 21,980,582.35
GROWTH RATE OVER THE PRECEDING
DECEMBER (In Percentages)
Credit to the Domestic Economy (Net) 3.55 14.47 14.82 32.60 11.08 12.13 13.93 24.27 1.41
Credit to the Private Sector 3.57 6.86 4.55 11.95 4.26 3.28 14.59 17.42 0.02
Claims on Federal Government (Net) -3.63 32.50 85.60 169.29 118.79 151.98 9.66 68.59 7.69
By Central Bank 1.52 35.96 -27.29 6.44 64.07 22.81 28.27 106.60 113.27
Claims on State and Local Governments -0.73 17.01 -37.20 -30.85 -12.25 8.59 24.68 69.14 19.28
Claims on Non-Financial Public Enterprises 0.04 8.53 99.42 -0.01 1,149.39 0.06 28.83
Claims on Other Private Sector 3.76 6.23 6.67 14.12 4.63 3.12 12.66 15.78 -0.93
Foreign Assets (Net) 1.34 -4.26 -11.38 -19.68 -14.42 -18.71 25.69 61.85 -7.45
Quasi-Money 7.33 7.36 21.07 38.73 2.17 -4.58 9.61 7.52 -4.30
Money Supply (M1) -6.49 -5.23 0.90 -1.82 -5.25 24.14 11.05 31.50 -9.59
Broad Money (M2) 0.71 1.32 12.03 20.55 -0.54 5.90 10.23 17.78 -6.83
Other Assets (Net) -7.39 -19.92 9.58 2.53 -16.88 1.08 -33.38 -71.58 -10.54
Source: Central Bank of Nigeria
/1 Quasi-Money consists of Time, Savings and Foreign Currency Deposits of Deposit Money Banks excluding takings from Discount Houses.
/2 Demand Deposits consist of state and local government as well as parastatals deposits at the CBN on the one hand, and state and local government and private sector deposits as well as demand deposits of non-financial public
enterprises at the Deposit Money Banks on the other.
/3 Adoption of International Financial Reporting Standard (IFRS) and bank returns in compliance with the IFRS commenced in March 2015.
/4 Provisional

137
CBN Economic Report for the First Half of 2017Ta
ble
26
Va
lue
of M
on
ey
Ma
rke
t A
sse
ts 1
/(N
air
a M
illio
n)
20
17
/2
Jun
eD
ec
Jun
eD
ec
Jun
eD
ec
Jun
eD
ec
Jun
e
Tre
asu
ry B
ills
2,4
83
,28
5.1
12
,58
1,5
50
.64
2,7
35
,86
9.0
92
,81
5,5
23
.75
2,8
24
,95
2.2
52
,77
2,8
67
.04
2,9
01
,80
7.0
53
,27
7,2
78
.83
3,7
02
,83
1.6
8
Ce
rtif
icat
es
of
De
po
sits
23
,00
0.0
02
0,5
00
.00
51
,50
0.0
05
0,9
54
.00
38
,69
3.1
07
5,7
02
.83
55
,02
0.0
40
.00
0.0
0
Co
mm
erc
ial P
ape
rs1
5,0
02
.10
9,3
24
.80
10
,08
8.3
19
,82
2.1
76
,67
9.0
06
,29
1.8
53
,54
6.1
04
90
.47
49
7.3
4
Ban
kers
' Acc
ep
tan
ces
16
,01
2.3
42
0,4
69
.96
7,3
50
.82
8,7
57
.23
8,5
96
.28
28
,41
7.8
92
9,7
55
.86
27
,79
5.3
04
1,0
39
.93
FGN
Bo
nd
s4
,03
2,9
03
.13
4,2
22
,03
7.7
14
,36
9,8
37
.71
4,7
92
,28
1.2
25
,30
0,4
18
.82
5,8
08
,14
0.8
27
,47
3,5
39
.17
7,5
64
,93
7.4
77
,96
2,1
93
.05
FGN
Sav
ings
Bo
nd
s /
34
,75
4.0
8
Tota
l6
,57
0,2
02
.67
6,8
53
,88
3.1
07
,17
4,6
45
.94
7,6
77
,33
8.3
78
,17
9,3
39
.46
8,6
91
,42
0.4
31
0,4
63
,66
8.2
21
0,8
70
,50
2.0
61
1,7
11
,31
6.0
7
Tre
asu
ry B
ills
16
.97
21
.60
5.9
89
.06
0.3
3-1
.52
4.6
51
8.1
92
7.6
0
Ce
rtif
icat
es
of
De
po
sits
-32
.35
-39
.71
15
1.2
21
48
.56
-24
.06
48
.57
-27
.32
-10
0.0
0-1
00
.00
Co
mm
erc
ial P
ape
rs1
,32
8.2
87
87
.77
8.1
95
.33
-32
.00
-35
.94
-43
.64
-92
.20
-85
.98
Ban
kers
' Acc
ep
tan
ces
62
.33
10
7.5
3-6
4.0
9-5
7.2
2-1
.84
22
4.5
14
.71
-2.1
93
7.9
2
FGN
Bo
nd
s-1
.16
3.4
83
.50
13
.51
10
.60
21
.20
28
.67
30
.25
6.5
4
FGN
Sav
ings
Bo
nd
/3
Pe
rce
nta
ge C
han
ge o
f To
tal
5.1
69
.70
4.6
81
2.0
16
.54
13
.21
20
.39
25
.07
7.7
3
Pe
rce
nta
ge C
han
ge O
ver
Pre
ced
ing
De
cem
be
r
Inst
rum
en
t2
01
42
01
32
01
62
01
5
Sou
rce
: C
en
tra
l Ba
nk o
f N
ige
ria
/1 R
evis
ed
/2 P
rov
isio
na
l/3
A n
ew
FG
N s
ec
urity
intr
od
uc
ed
in M
arc
h 2
017.
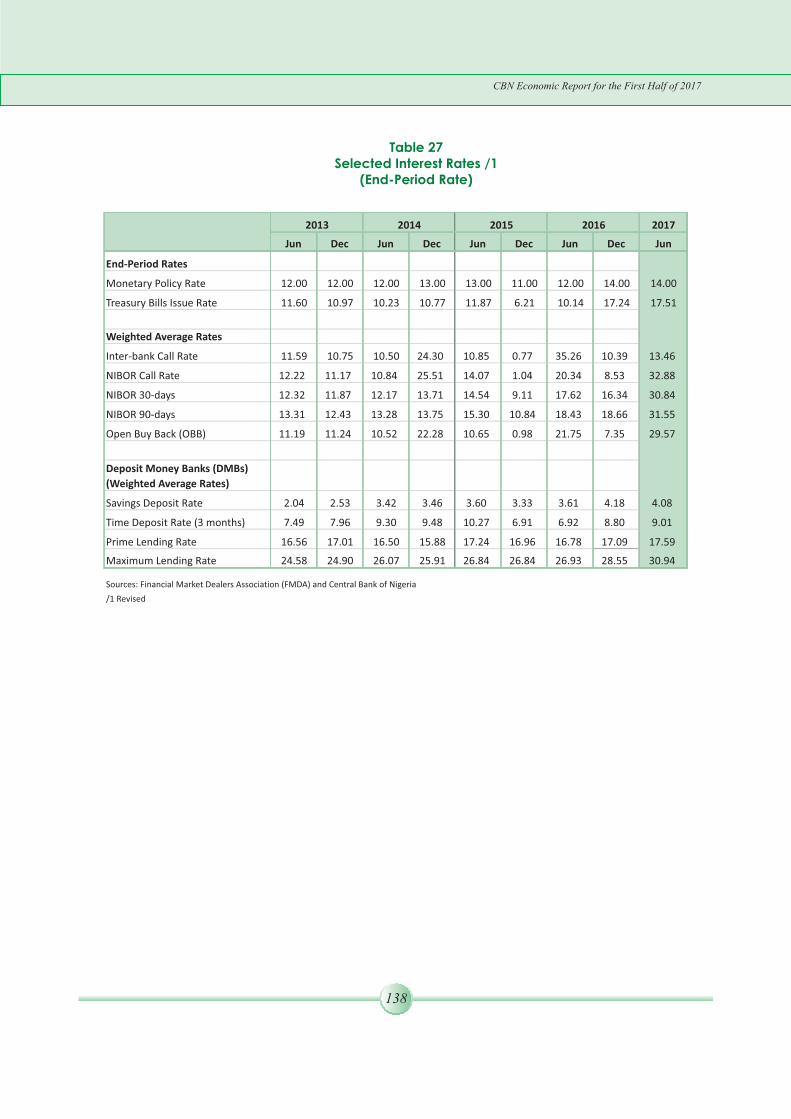
138
CBN Economic Report for the First Half of 2017
Table 27Selected Interest Rates /1
(End-Period Rate)
2017
Jun Dec Jun Dec Jun Dec Jun Dec Jun
End-Period Rates
Monetary Policy Rate 12.00 12.00 12.00 13.00 13.00 11.00 12.00 14.00 14.00
Treasury Bills Issue Rate 11.60 10.97 10.23 10.77 11.87 6.21 10.14 17.24 17.51
Weighted Average Rates
Inter-bank Call Rate 11.59 10.75 10.50 24.30 10.85 0.77 35.26 10.39 13.46
NIBOR Call Rate 12.22 11.17 10.84 25.51 14.07 1.04 20.34 8.53 32.88
NIBOR 30-days 12.32 11.87 12.17 13.71 14.54 9.11 17.62 16.34 30.84
NIBOR 90-days 13.31 12.43 13.28 13.75 15.30 10.84 18.43 18.66 31.55
Open Buy Back (OBB) 11.19 11.24 10.52 22.28 10.65 0.98 21.75 7.35 29.57
Deposit Money Banks (DMBs)
(Weighted Average Rates)
Savings Deposit Rate 2.04 2.53 3.42 3.46 3.60 3.33 3.61 4.18 4.08
Time Deposit Rate (3 months) 7.49 7.96 9.30 9.48 10.27 6.91 6.92 8.80 9.01
Prime Lending Rate 16.56 17.01 16.50 15.88 17.24 16.96 16.78 17.09 17.59
Maximum Lending Rate 24.58 24.90 26.07 25.91 26.84 26.84 26.93 28.55 30.94
Sources: Financial Market Dealers Association (FMDA) and Central Bank of Nigeria
/1 Revised
20142013 20162015

Table 28Federation Account Operations
(N' Billion)
139
CBN Economic Report for the First Half of 2017
2013 2014 2015 1/ 2016 2/ 2017 2/ 'Half Year
1st Half 1st Half 1st Half 1st Half 1st Half Budget
2017 Total Revenue (Gross) 4,806.50 5,109.04 3,452.84 2,395.44 2,992.83 5,368.55
Oil Revenue (Gross) 3,648.04 3,604.39 2,049.78 1,203.32 1,613.02 2,697.72
Crude Oil and Gas Exports 842.94 1,094.04 489.49 194.98 213.17 841.64
PPT and Royalties etc. 2,003.29 1,713.36 898.33 526.82 645.86 1,002.69
Domestic Crude Oil / Gas Sales 785.17 748.21 607.21 440.37 723.25 343.87
Other Oil Revenue 16.64 48.78 54.76 41.15 30.74 479.02
Dividend by NLNG 0.00 0.00 0.00 0.00 0.00 30.50
Less:
Deductions 1,281.47 1,124.72 450.66 241.04 631.60 152.50
Oil Revenue (Net) 2,366.57 2,479.67 1,599.12 962.28 981.43 2,545.22
Non-oil Revenue 1,158.46 1,504.64 1,403.06 1,192.12 1,379.80 2,670.83
Corporate Tax 341.37 582.31 334.30 347.97 365.33 871.02
Customs & Excise Duties 207.20 257.91 265.67 242.05 294.84 307.69
Value-Added Tax (VAT) 379.18 407.95 398.84 391.18 465.31 900.00
Independent Revenue of Fed. Govt. 82.20 134.01 290.93 106.62 119.38 403.79
Education Tax 51.80 18.57 16.38 25.39 41.17 97.41
Customs Special Levies (Federation Account) 92.91 44.93 36.32 23.11 30.09 50.89
National Information Technology Dev. (NITDF) 3.80 2.04 2.70 3.95 0.72 12.06
Customs Special Levies (Non-Federation Account) 5/ 0.00 56.91 57.92 51.85 62.97 26.72
Solid Mineral & Other Mining Revenue 0.00 0.00 0.00 0.00 0.00 1.26
Less:
Cost of Collection 43.33 217.35 48.54 46.87 80.14 103.64
Non-Oil Revenue (Net) 1,115.14 1,287.29 1,354.52 1,145.24 1,299.67 2,567.02
Estmiated Balances in Special Accounts for the previous year 0.00 0.00 0.00 0.00 0.00 6.85
Federally-collected revenue (Net) 3,481.71 3,766.96 2,953.64 2,107.52 2,281.09 5,119.09
Federation Account Allocation: 3,481.71 3,766.96 2,953.64 2,107.52 2,281.09 5,119.09
Transfer to Federal Govt. Ind. Revenue 82.20 134.01 290.93 106.62 119.38 403.79
Transfer to VAT Pool Account 364.01 391.63 382.88 375.53 446.70 864.00
Other Tranfers 3/ 148.51 122.46 113.32 104.30 134.94 131.69
Amount Distributed 2,886.98 3,118.87 2,166.51 1,521.07 1,580.07 3,719.45
Federal Government 1,358.79 1,473.20 1,031.80 735.40 765.17 1,787.19
State Government 689.20 747.23 523.34 373.00 388.10 906.49
Local Government 531.34 576.08 403.48 287.57 299.21 698.86
13% Derivation 307.65 322.36 207.89 125.10 127.59 326.91
Solid Mineral Revenue 0.00 0.00 0.00 0.00 0.00 0.16
Federal Government 0.00 0.00 0.00 0.00 0.00 0.00
State Government 0.00 0.00 0.00 0.00 0.00 0.00
Local Government 0.00 0.00 0.00 0.00 0.00 0.00
13% Derivation (Solid Mineral) 0.00 0.00 0.00 0.00 0.00 0.16
Vat Pool Account 364.01 391.63 382.88 375.53 446.70 864.00
FG 54.60 58.75 57.43 56.33 67.01 129.60
SG 182.00 195.82 191.44 187.77 223.35 432.00
LG 127.40 137.07 134.01 131.44 156.35 302.40
Special Funds (FGN) 107.49 116.89 81.87 58.30 60.71 141.81
Federal Capital Territory 25.71 27.97 19.59 13.91 14.52 33.93
Ecology 25.71 27.97 19.59 13.96 14.52 33.93
Statutory Stabilization 12.86 13.98 9.79 6.98 7.26 16.96
Natural Resources 43.20 46.98 32.90 23.45 24.40 56.99
FCT VAT 3.64 3.92 3.83 3.76 4.47 8.64
Overall Balance 0.00 0.00 0.00 0.00 0.00 0.00
Memorandum Items
Deductions 1,281.47 1,124.72 450.66 241.04 631.60 152.50
JVC Cash calls 571.43 684.05 383.66 194.98 460.65 0.00
Excess Crude Proceeds 0.00 182.50 0.00 0.00 14.37 0.00
Excess PPT & Royalty 674.07 206.85 15.50 0.00 117.17 0.00
Domestic Subsidy 0.00 0.00 0.00 0.00 0.00 0.00
DPR Cost of Collection 0.00 0.00 13.52 8.09 13.89 0.00
Others 35.96 51.33 37.98 37.98 25.52 152.50
Total Non-Oil Revenue Deductions 43.33 217.35 48.54 46.87 80.14 103.64
Cost of Collection 43.33 57.66 48.54 46.59 54.64 93.64
7% NCS 14.50 18.05 18.60 16.92 20.60 26.97
4% FIRS 13.65 23.29 13.99 14.02 15.42 30.67
V.A.T. 15.17 16.32 15.95 15.65 18.61 36.00
Non Oil Revenue (Excess) 0.00 159.69 0.00 0.00 0.00 0.00
FIRS Tax Refunds 0.00 0.00 0.00 0.00 25.42 10.00
NCS Refunds 0.00 0.00 0.00 0.29 0.08 0.00
1/ Revised2/Provisional3/ Includes Education Tax, Customs Levies and NITDFSource: Office of the Accountant-General of the Federation (OAGF)

140
CBN Economic Report for the First Half of 2017
Table 29Federally Collected Revenue Distribution
(N' Billion)
2013 2014 2015 1/ 2016 2/ 2017 2/ 'Half Year
1st Half 1st Half 1st Half 1st Half 1st Half Budget
2017 Statuory Allocation 2,886.98 3,118.87 2,166.51 1,521.07 1,580.07 3,719.45
Federal Government 1,358.79 1,473.20 1,031.80 735.40 765.17 1,787.19
State Government 689.20 747.23 523.34 373.00 388.10 906.49
Local Government 531.34 576.08 403.48 287.57 299.21 698.86
13% Derivation 307.65 322.36 207.89 125.10 127.59 326.91
Solid Mineral Revenue 0.00 0.00 0.00 0.00 0.00 0.16
Federal Government 0.00 0.00 0.00 0.00 0.00 0.00
State Government 0.00 0.00 0.00 0.00 0.00 0.00
Local Government 0.00 0.00 0.00 0.00 0.00 0.00
13% Derivation (Solid Mineral) 0.00 0.00 0.00 0.00 0.00 0.16
Vat Pool Account 364.01 391.63 382.88 375.53 446.70 864.00
FG 54.60 58.75 57.43 56.33 67.01 129.60
SG 182.00 195.82 191.44 187.77 223.35 432.00
LG 127.40 137.07 134.01 131.44 156.35 302.40
Distribution from Excess Crude/PPT 309.48 0.00 15.63 0.00 166.58 0.00
Federal Government 141.84 0.00 7.16 0.00 76.35 0.00
State Government 71.94 0.00 3.63 0.00 38.72 0.00
Local Government 55.46 0.00 2.80 0.00 29.85 0.00
13% Derivation 40.23 0.00 2.03 0.00 21.66 0.00
Provisional Dist & Actual Budget (Diff)/Non-Oil Excess Revenue 0.00 0.00 0.00 1.59 0.00 0.00
Federal Government 0.00 0.00 0.00 0.84 0.00 0.00
State Government 0.00 0.00 0.00 0.42 0.00 0.00
Local Government 0.00 0.00 0.00 0.33 0.00 0.00
13% Derivation 0.00 0.00 0.00 0.00 0.00 0.00
Exchange Rate Gain 0.00 0.00 210.43 19.08 311.75 0.00
Federal Government 0.00 0.00 96.44 8.91 145.98 0.00
State Government 0.00 0.00 48.92 4.52 74.04 0.00
Local Government 0.00 0.00 37.71 3.48 57.08 0.00
13% Derivation 0.00 0.00 27.36 2.17 34.65 0.00
SURE-P/ SIGNATURE BONUS 6/ 213.30 213.30 0.00 0.00 0.00 117.83
Federal Government 97.76 97.76 0.00 0.00 0.00 62.07
State Government 49.58 49.58 0.00 0.00 0.00 31.49
Local Government 38.23 38.23 0.00 0.00 0.00 24.27
13% Derivation 27.73 27.73 0.00 0.00 0.00 0.00
NNPC Refund 45.70 30.47 37.98 37.98 25.32 0.00
Federal Government 0.00 0.00 37.98 37.98 25.32 0.00
State Government 22.45 14.97 0.00 0.00 0.00 0.00
Local Government 17.31 11.54 0.00 0.00 0.00 0.00
13% Derivation 5.94 3.96 0.00 0.00 0.00 0.00
Federation Revenue Augmentation/NNPC Additional Rev. 613.88 0.00 14.68 29.40 0.00 0.00
Federal Government 281.35 0.00 6.73 15.49 0.00 0.00
State Government 142.71 0.00 3.41 7.86 0.00 0.00
Local Government 110.02 0.00 2.63 6.06 0.00 0.00
13% Derivation 79.80 0.00 1.91 0.00 0.00 0.00
Total Excluding VAT 4,069.34 3,362.63 2,445.23 1,609.11 2,083.72 3,837.28
Federal Government 1,879.74 1,570.96 1,180.12 798.61 1,012.81 1,849.26
State Government 975.88 811.78 579.30 385.80 500.87 937.97
Local Government 752.36 625.85 446.62 297.44 386.15 723.14
13% Derivation 461.36 354.05 239.19 127.26 183.90 326.91
Total Statutory Revenue and VAT Distribution 3/ 4,433.35 3,754.26 2,828.11 1,984.65 2,530.42 4,701.45
Federal Government 1,934.34 1,629.70 1,237.55 854.94 1,079.82 1,978.86
State Government 1,157.89 1,007.60 770.74 573.57 724.22 1,369.97
Local Government 879.76 762.92 580.63 428.87 542.49 1,025.54
13% Derivation 461.36 354.05 239.19 127.26 183.90 327.08
1/ Revised2/Provisional3/ Includes Education Tax, Customs Levies and NITDFSource: Office of the Accountant-General of the Federation (OAGF)

141
CBN Economic Report for the First Half of 2017
Table 30Money Market Rates: First Half 2017 /1
(Per cent)
1/ Revised2/ Provisional3/ Includes FGN balance of special accounts, transfers to CRF and payments to FGN and other statutory benefits4/ Include Ways and Means Advances5/ Includes FCT share of VAT6/ Includes net deductions for loans on lent to State,local governments and Federal parastatals/companies.Source: Office of the Accountant-General of the Federation (OAGF)
2013 2014 2015 2016 1/ 2017 2/ Half Year
1st Half 1st Half 1st Half 1st Half 1st Half Budget
2016 Total Federal Government Retained Revenue 1,960.17 1,881.04 1,583.19 1,305.75 2,505.53 2,697.57 Share of Federation Account (Gross) 1,358.79 1,473.20 1,031.80 735.40 765.17 1,787.19
Share of VAT Pool Account 54.60 58.75 57.43 56.33 67.01 129.60
Federal Government Independent Revenue 82.20 134.01 290.93 106.62 119.38 403.79
Share of Excess Crude Account (incl. Augment.) 423.19 0.00 7.16 0.00 106.60 0.00
Share from SURE-P Distribution 97.76 97.76 0.00 15.49 0.00 62.07
Share from Excess Non-Oil 0.00 84.12 0.00 0.84 0.00 0.00
NNPC Refund (Incl. Additional NNPC Share) 0.00 0.00 44.71 37.98 25.32 0.00
Subsidy 0.00 0.00 0.00 0.00 0.00 0.00
Exchange Gain 0.00 0.00 96.44 8.91 145.98 0.00
Others 3/ (56.38) 33.20 54.72 344.19 1,276.09 314.93
Total Expenditure 2,375.56 2,128.70 2,259.66 2,517.21 2,885.25 3,875.96
Recurrent Expenditure 1,714.39 1,610.20 1,872.80 1,885.36 2,676.23 2,571.51
Goods and Services 1,080.61 979.27 1,166.06 1,178.01 1,323.06 1,495.46 Personnel Cost 775.06 753.13 860.15 890.81 723.89 942.03
Pension 66.27
73.88
96.01
79.18 143.28 95.82
Overhead Cost 239.28 152.26 209.90 208.02 455.89 457.61
Interest Payments 390.61 477.80 592.17 609.52 927.74 920.67 Foreign 29.59
36.37
35.82
30.71 55.80 87.94
Domestic 4/ 361.02
441.44
556.35
578.81 871.94 832.73
Transfers 243.17 153.13 114.57 97.83 425.44 155.37 Special Funds and others 5/ 243.17
153.13
114.57
97.83 425.44 155.37
Capital Expenditure & Net Lending 6/ 499.69 353.15 274.53 346.18 0.00 1,087.25
Domestic Financed Budgets 499.69 353.15 274.53 346.18 0.00 1,087.25
Budgetary 401.93 255.40 57.43 90.79 0.00 1,087.25
Subsidy 0.00 0.00 61.00 0.00 0.00 0.00
SURE-P/ Loan to Ex Dom Naira Account 97.76 97.76 156.10 0.00 0.00 0.00
Capital release 2015 7/ 0.00 0.00 0.00 255.39 0.00 0.00
Transfers 161.49 165.34 112.33 285.67 209.02 217.21
NDDC 0.00 15.49 7.71 20.53 10.23 32.01
NJC 33.50 27.92 39.71 35.00 10.83 50.00
UBE 38.99 29.36 10.30 38.56 15.41 47.59
Refund of Signature Bonuses/Others 89.01 92.58 54.61 191.59 172.55 87.60
Balance Of Revenue And Expenditure
Primary Surplus (+)/Deficit (-) (24.79) 230.14 (84.30) (601.94) 548.02 (257.71)
Current Surplus(+)/Deficit(-) 245.78 270.84 (289.61) (579.61) (170.70) 126.07
Overall Surplus(+)/Deficit(-) (415.40) (247.66) (676.47) (1,211.46) (379.72) (1,178.39)
Financing: 415.40 247.66 676.47 1,211.46 379.72 1,178.39
Foreign(Net) 0.00 0.00 0.00 0.00 0.00 533.75
Domestic(Net) 415.40 247.66 676.47 1,211.46 379.72 644.64
Banking System 0.00 0.00 0.00 0.00 0.00 0.00
CBN 0.00 0.00 421.20 0.20 0.20 0.00
DMBs 0.00 0.00 0.00 0.00 0.00 0.00
Non Bank Public 521.43 504.00 330.00 524.60 0.00 627.14
Privatization Proceeds 0.00 0.00 72.60 5.92 0.00 17.50
Loans from Special Accts 151.26 36.70 24.01 296.51 0.00 0.00
Excess Crude 0.00 0.00 0.00 0.00 0.00 0.00
Recoveries of Misappropriated Funds 0.00 0.00 0.00 0.00 0.00 0.00
Other Funds (257.30) (293.04) 249.86 384.42 379.72 533.75

Table 31Functional Classification of Federal Government Recurrent and Capital Expenditure
(Naira Billion)
142
CBN Economic Report for the First Half of 2017
2013 2014 2015 2016 2017
Half - Year Half - Half - Year 1/ Half - Year 1/ Half - Year 1/
TOTAL EXPENDITURE 2,375.56 2,128.70 2,259.65 2,631.65 2,885.22
A. RECURRENT EXPENDITURE 1,714.39 1,610.20 1,872.80 1,888.19 2,676.20
A1. ADMINISTRATION 626.12 512.59 607.41 649.01 904.30
General Administration 313.47 203.22 206.57 280.36 377.36
Defence 117.52 112.80 150.73 137.62 196.22
Internal Security 195.14 196.57 250.12 231.03 330.72
A2. ECONOMIC SERVICES 178.34 106.50 123.33 163.75 215.94
Agriculture 19.01 19.33 23.28 24.76 33.90
Roads & Construction 21.31 20.53 23.47 25.13 35.41
Transport & Communications 46.72 46.29 53.98 57.65 80.24
Others 91.30 20.35 22.61 56.21 66.38
A3. SOCIAL & COMMUNITY SERVICES 300.67 293.52 339.31 288.91 462.89
Education 138.21 136.39 158.83 160.03 225.24
Health 64.80 64.55 76.78 77.36 107.56
Others 97.66 92.58 103.69 51.52 130.09
A4. TRANSFERS 609.26 697.60 802.75 786.53 1,093.07
Public Debt Charges (Int) 390.61 477.80 592.17 609.52 927.74
Domestic 361.02 441.44 556.35 578.81 871.94
Foreign 29.59 36.37 35.82 30.71 55.80
Pensions & Gratuities 66.27 66.66 96.01 79.18 106.41
FCT & Others 152.38 153.13 114.57 97.83 58.92
Contingencies (Others) - - - - -
External Obligations - - - - -
Extra-Budgetary Expenditure - - - - -
Deferred Customs Duties - - - - -
Unspecified Expenditure - - - - -
Others - - - - -
B. CAPITAL EXPENDITURE 499.69
353.15
274.53 457.78 -
B1. ADMINISTRATION 176.19
136.65
106.64 172.38 -
General Administration 110.77
86.20
66.72 107.85 -
Defence 26.41
19.89
15.80 25.54 -
Internal Security 39.01
30.56
24.12 38.99 -
B2 ECONOMIC SERVICES 221.44
142.68
112.05 194.81 -
Agriculture & Natural Resources 38.22
26.04
21.20 34.28 -
Manuf., Mining & Quarrying 12.23 8.53 6.48 10.56 -
Transport & Communications 51.97 36.65 29.51 47.67 -
Housing - - - - -
Roads & Construction 71.15 47.40 38.30 62.07 -
National Priority Projects - - - - -
JVC Calls/NNPC Priority Projects - - - - -
PTF - - - - -
Counterpart Funding - - - - -
Others 47.86 24.06 16.55 40.24 -
B3 SOCIAL & COMMUNITY SERVICES 79.11 57.90 43.48 70.54 -
Education 30.32 23.23 18.53 30.06 -
Health 24.82 18.96 15.03 24.39 -
Others 23.97 15.71 9.92 16.10 -
B4 TRANSFERS 22.94 15.92 12.36 20.05 -
Financial Obligations - - - - -
Capital Repayments - - - - -
Domestic - - - - -
Foreign - - - - -
External Obligations - - - - -
Contingencies 2/ - - - - -
Capital Supplementation 17.99 12.06 9.31 15.09 -
Net Lending to States/L.G.s/Parast. - - - - -
Grants to States - - - - -
Others 4.95 3.86 3.05 4.95 -
C. STATUTORY TRANSFERS 161.49 165.34 112.33 285.67 209.02
NDDC 0.00 15.49 7.71 20.53 10.23
NJC 33.50 27.92 39.71 35.00 10.83
UBE 38.99 29.36 10.30 38.56 15.41
Others 89.01 92.58 54.61 191.59 172.55
1/ ProvisionalSources: Federal Ministry of Finance, Office of the Accountant-General of the Federation Central Bank of Nigeria

Tab
le 3
2 Su
mm
ary
of Sta
tuto
ry &
VA
T R
ev
en
ue
Allo
ca
tio
n t
o S
tate
Go
ve
rnm
en
ts: Fi
rst
ha
lf 2
017 1
/ (
Na
ira
Bill
ion
)
143
CBN Economic Report for the First Half of 2017
Gro
ss S
tat.
Allo
c.
De
du
ctio
ns
13
%
De
riv
atio
n
Tota
l N
et
Sta
t. A
lloc
.
Au
gm
en
tatio
n
Ex
ce
ss C
rud
e
2/
NN
PC
Re
fun
dSU
RE-P
VA
T
Tota
l G
ross
Allo
c.
Tota
l N
et
Allo
c.
Gro
ss S
tat.
Allo
c.
De
du
ctio
ns
13
%
De
riv
atio
n
Tota
l N
et
Sta
t. A
lloc
.N
NP
C R
efu
nd
SU
RE-P
VA
T
Tota
l G
ross
Allo
c.
Tota
l N
et
Allo
c.
Gro
ss S
tat.
Allo
c.
De
du
ctio
ns
13
%
De
riv
atio
n
Tota
l N
et
Sta
t. A
lloc
.
NN
PC
Re
fun
d/A
dd
it
ion
al Fu
nd
Ex
ce
ss C
rud
e
Ex
ch
an
ge
Ga
inV
AT
Tota
l G
ross
Allo
c.
Tota
l N
et
Allo
c.
1A
BIA
16.6
10.4
64.9
421.0
93.4
41.7
30.5
51.2
03.7
632.2
331.7
618.4
50.8
73.8
121.3
90.3
71.2
04.0
727.9
027.0
312.9
20.7
72.2
514.4
10.1
10.1
11.5
23.9
820.9
020.1
3
2A
DA
MA
WA
18.5
40.0
5-
18.4
93.8
41.9
40.6
21.3
33.9
130.1
830.1
219.6
30.4
6-
19.1
70.4
11.3
34.1
625.5
325.0
713.7
50.9
3-
12.8
20.0
90.1
01.2
94.1
519.3
718.4
4
3A
KW
A IB
OM
18.7
64.9
3121.5
2135.3
53.8
81.9
60.6
11.3
54.7
4152.8
2147.8
919.8
12.4
4106.4
6123.8
20.4
11.3
54.4
2132.4
4130.0
013.8
80.7
060.8
374.0
10.6
80.7
39.4
64.6
890.2
589.5
5
4A
NA
MB
RA
18.7
30.2
3-
18.5
03.8
81.9
60.6
21.3
54.3
430.8
730.6
419.5
90.5
8-
19.0
20.4
11.3
54.7
426.0
925.5
213.7
20.2
3-
13.4
90.0
90.1
01.2
84.5
519.7
419.5
0
5B
AU
CH
I21.7
31.4
4-
20.2
84.5
02.2
70.6
91.5
64.4
735.2
233.7
823.5
72.7
1-
20.8
60.4
61.5
64.8
230.4
227.7
116.5
13.4
713.0
30.1
10.1
11.5
44.7
523.0
219.5
5
6B
AY
ELS
A14.8
811
.43
95.9
299.3
63.0
81.5
50.4
81.0
73.7
6120.7
4109.3
017.4
414.0
169.0
772.5
00.3
21.0
73.9
191.8
077.7
912.2
19.6
240.2
142.8
10.4
40.4
66.2
83.4
963.0
953.4
7
7B
EN
UE
20.0
32.1
2-
17.9
04.1
52.0
90.6
61.4
44.2
732.6
430.5
122.1
03.1
1-
18.9
90.4
41.4
44.6
528.6
325.5
215.4
83.0
9-
12.3
80.1
00.1
11.4
54.4
721.6
018.5
1
8B
OR
NO
22.1
00.2
0-
21.8
94.5
82.3
10.7
01.5
94.2
535.5
235.3
224.4
80.2
5-
24.2
30.4
71.5
94.6
031.1
430.8
917.1
50.0
9-
17.0
60.1
10.1
21.6
04.4
223.4
023.3
1
9C
RO
SS
RIV
ER
17.4
10.9
20.3
216.8
13.6
01.8
20.5
81.2
53.8
528.8
327.9
119.8
21.5
20.2
918.5
90.3
81.2
54.1
925.9
324.4
113.8
83.5
2-
10.3
60.0
90.1
01.3
04.1
319.4
915.9
7
10
DE
LTA
18.7
57.8
195.4
7106.4
03.8
81.9
60.6
21.3
54.7
2126.7
4118.9
220.0
18.8
074.2
085.4
00.4
11.3
54.9
0100.8
692.0
614.0
18.4
049.9
455.5
50.5
30.5
67.9
34.9
077.8
869.4
8
11E
BO
NY
I15.3
72.9
3-
12.4
53.1
81.6
00.5
21.1
13.5
425.3
322.4
017.6
33.6
8-
13.9
50.3
51.1
13.7
922.8
719.1
912.3
54.4
5-
7.9
00.0
80.0
91.1
53.6
817.3
412.9
0
12
ED
O17.5
03.4
99.3
523.3
63.6
21.8
30.6
11.2
64.1
438.3
134.8
218.4
34.9
38.8
022.2
90.4
11.2
64.3
333.2
228.2
912.9
04.7
36.0
614.2
40.1
30.1
51.9
94.2
625.4
920.7
7
13
EK
ITI
15.5
12.2
2-
13.2
93.2
11.6
20.5
21.1
23.6
225.5
923.3
717.6
23.6
3-
13.9
90.3
51.1
23.7
922.8
719.2
312.3
43.4
5-
8.8
90.0
80.0
91.1
53.7
217.3
813.9
3
14
EN
UG
U17.5
00.0
8-
17.4
23.6
21.8
30.5
71.2
63.9
828.7
528.6
819.8
20.6
4-
19.1
80.3
81.2
64.2
825.7
425.1
013.8
80.9
8-
12.9
00.0
90.1
01.3
04.3
919.7
518.7
7
15
GO
MB
E16.4
52.4
3-
14.0
13.4
11.7
20.5
31.1
83.5
826.8
624.4
318.5
63.1
6-
15.4
00.3
51.1
83.7
623.8
520.6
913.0
04.0
2-
8.9
80.0
80.0
91.2
23.7
718.1
614.1
5
16
IMO
18.6
82.2
25.0
921.5
63.8
71.9
50.6
11.3
44.2
735.8
133.5
920.4
92.9
8
3.5
4
21.0
5
0.4
0
1.3
4
4.4
930.2
627.2
914.3
52.7
42.1
413.7
40.1
10.1
21.6
24.3
822.7
219.9
8
17
JIG
AW
A20.5
20.3
6-
20.1
64.2
52.1
40.6
71.4
84.4
733.5
333.1
722.0
40.6
5
-
21.3
9
0.4
5
1.4
8
4.9
328.8
928.2
415.4
30.1
3-
15.3
00.1
00.1
11.4
44.6
521.7
421.6
0
18
KA
DU
NA
23.3
81.9
4-
21.4
54.8
42.4
40.7
51.6
85.1
738.2
736.3
325.8
23.1
0
-
22.7
2
0.5
0
1.6
8
5.5
433.5
430.4
418.0
83.2
1-
14.8
80.1
20.1
31.6
95.4
025.4
122.2
1
19
KA
NO
29.3
10.5
8-
28.7
36.0
73.0
60.9
22.1
16.9
248.3
847.8
131.2
61.3
4
-
29.9
2
0.6
1
2.1
1
7.4
441.4
240.0
821.8
90.4
2-
21.4
70.1
40.1
52.0
57.2
631.4
931.0
7
20
KA
TS
INA
22.2
90.5
3-
21.7
64.6
22.3
30.7
21.6
04.9
236.4
735.9
424.2
20.7
3
-
23.4
9
0.4
8
1.6
0
5.3
731.6
730.9
416.9
60.7
1-
16.2
50.1
10.1
21.5
95.3
524.1
323.4
2
21
KE
BB
I18.6
40.2
1-
18.4
33.8
61.9
50.6
01.3
43.9
830.3
730.1
520.8
10.7
2
-
20.0
8
0.4
0
1.3
4
4.3
626.9
026.1
814.5
70.2
2-
14.3
50.1
00.1
01.3
64.1
120.2
420.0
2
22
KO
GI
18.6
00.0
9-
18.5
13.8
51.9
40.6
01.3
43.9
730.2
930.2
021.7
81.3
7-
20.4
10.4
01.3
44.2
127.7
326.3
515.2
51.6
2-
13.6
40.1
00.1
11.4
34.1
121.0
019.3
8
23
KW
AR
A16.9
50.0
9-
16.8
53.5
11.7
70.5
51.2
23.5
827.5
727.4
817.5
40.7
8-
16.7
60.3
61.2
23.8
222.9
522.1
612.2
90.7
0-
11.5
90.0
80.0
91.1
53.7
617.3
616.6
6
24
LA
GO
S26.4
78.9
3-
17.5
45.4
82.7
60.8
71.9
032.6
970.1
861.2
426.4
014.5
4-
11.8
50.5
81.9
037.4
466.3
251.7
818.4
913.9
3-
4.5
60.1
20.1
31.7
336.7
457.2
143.2
7
25
NA
SA
RA
WA
15.8
81.7
9-
14.0
93.2
91.6
60.5
21.1
43.3
425.8
324.0
418.1
71.7
9-
16.3
80.3
41.1
43.6
023.2
521.4
612.7
30.8
7-
11.8
50.0
80.0
91.1
93.5
317.6
216.7
4
26
NIG
ER
21.6
91.8
8-
19.8
14.4
92.2
60.7
01.5
64.1
934.8
933.0
123.3
43.7
1-
19.6
30.4
61.5
64.5
129.8
726.1
616.3
53.2
0-
13.1
40.1
10.1
11.5
34.4
022.4
919.2
9
27
OG
UN
18.1
20.1
1-
18.0
13.7
51.8
90.5
91.3
04.2
029.8
629.7
418.3
10.4
7-
17.8
30.3
91.3
04.4
424.4
423.9
712.8
20.9
9-
11.8
30.0
80.0
91.2
04.4
918.6
817.7
0
28
ON
DO
17.3
82.7
118.0
232.6
93.6
01.8
10.5
81.2
54.0
346.6
743.9
618.3
45.6
314.1
326.8
40.3
81.2
54.2
838.3
932.7
512.8
56.3
67.3
913.8
80.1
50.1
72.1
84.2
026.9
420.5
8
29
OS
UN
17.1
92.6
9-
14.5
03.5
61.7
90.5
61.2
44.0
128.3
625.6
717.9
76.2
5-
11.7
20.3
81.2
44.3
923.9
817.7
312.5
96.7
5-
5.8
40.0
80.0
91.1
84.1
718.1
011.3
6
30
OY
O21.6
60.3
8-
21.2
84.4
82.2
60.7
01.5
64.9
735.6
435.2
522.1
01.2
5-
20.8
50.4
71.5
65.4
129.5
428.2
915.4
81.6
9-
13.7
90.1
00.1
11.4
55.6
022.7
321.0
4
31
PLA
TE
AU
18.1
90.4
86.6
024.3
13.7
71.9
00.6
01.3
14.0
836.4
435.9
620.5
81.3
95.5
024.6
90.4
01.3
14.3
032.0
830.6
914.4
12.8
0-
11.6
20.0
90.1
01.3
54.2
420.1
917.4
0
32
RIV
ER
S20.3
30.8
0104.0
6123.5
94.2
12.1
20.6
61.4
67.0
1139.8
7139.0
621.2
57.6
868.2
181.7
90.4
41.4
66.5
697.9
390.2
514.8
88.3
639.0
745.6
00.4
60.4
86.4
65.9
067.2
658.9
0
33
SO
KO
TO
19.3
40.2
6-
19.0
84.0
02.0
20.6
31.3
94.1
931.5
731.3
121.7
20.9
1-
20.8
00.4
21.3
94.5
628.0
927.1
815.2
10.2
5-
14.9
60.1
00.1
11.4
24.2
721.1
120.8
6
34
TA
RA
BA
18.3
10.2
9-
18.0
33.7
91.9
10.5
91.3
23.5
429.4
629.1
718.9
80.4
5-
18.5
30.3
91.3
23.7
924.4
924.0
313.2
91.1
1-
12.1
80.0
90.0
91.2
43.7
518.4
617.3
5
35
YO
BE
18.1
80.1
1-
18.0
73.7
61.9
00.5
81.3
13.5
729.2
929.1
819.5
70.2
5-
19.3
20.3
81.3
13.8
025.0
624.8
113.7
00.1
1-
13.5
90.0
90.1
01.2
83.6
818.8
518.7
4
36
ZA
MFA
RA
18.2
30.3
7-
17.8
63.7
81.9
00.6
01.3
14.0
129.8
329.4
619.6
10.6
5-
18.9
60.4
01.3
14.1
925.5
124.8
613.7
32.4
1-
11.3
20.0
90.1
01.2
84.1
019.3
016.8
9
37
Dis
pute
d D
eriv.
--
0.0
50.0
5-
--
--
0.0
50.0
5-
0.0
60.0
4(0
.02)
--
-0.0
4(0
.02)
Riv
ers
/Akw
a D
ispute
d F
und
--
0.0
10.0
1-
--
--
0.0
10.0
1-
-0.0
10.0
1-
--
0.0
10.0
1
TO
TA
L689.2
067.6
0461.3
61,0
82.9
6142.7
171.9
422.4
549.5
8182.0
01,6
19.2
51,5
51.6
5747.2
3107.5
1354.0
5993.7
714.9
749.5
8195.8
21,3
61.6
41,2
54.1
4523.3
4107.0
6207.8
9624.1
75.3
25.6
776.2
7191.4
41,0
09.9
3902.8
8
FIR
ST
HA
LF 2
01
4FI
RST
HA
LF 2
01
5
1/
Pro
vis
ion
al
2/
Inc
lud
es
the
sh
are
of
Oil-
pro
du
cin
g s
tate
s fr
om
th
e e
xce
ss c
rud
eSo
urc
e: Fe
de
ratio
n A
cc
ou
nt
Allo
ca
tio
n, Fe
de
ral M
inis
try o
f Fi
na
nc
e.
S/N
STA
TES
FIR
ST
HA
LF 2
01
3
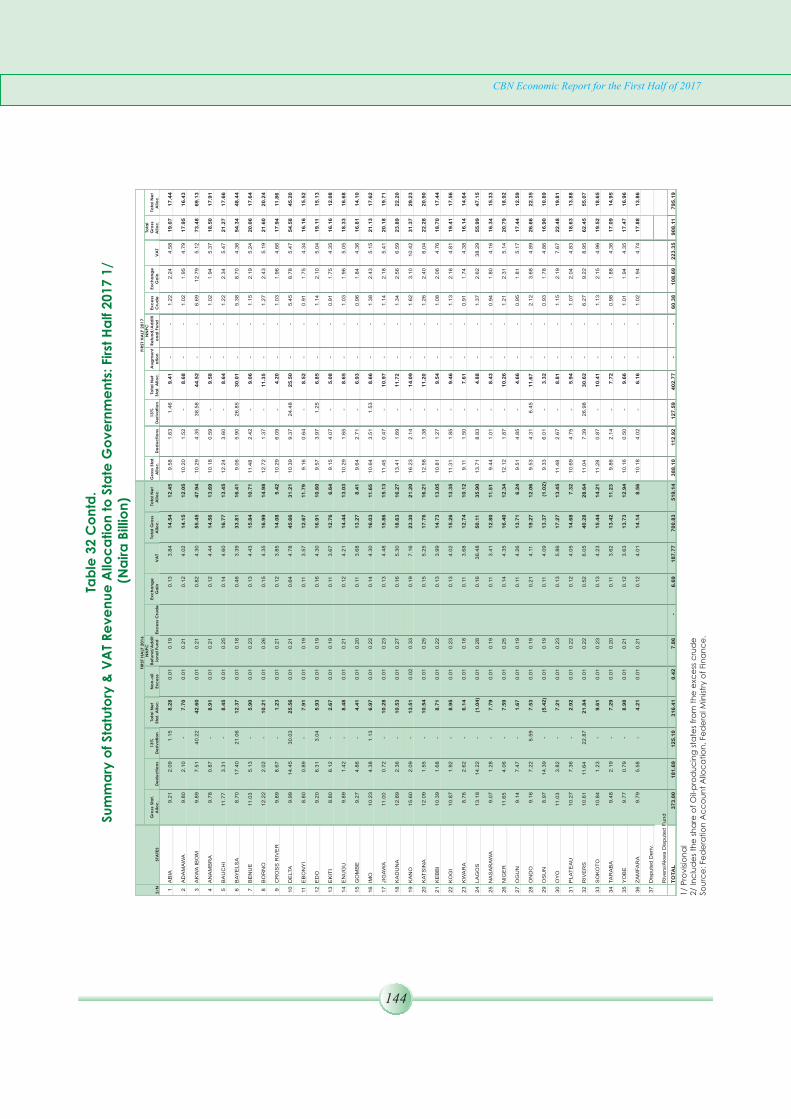
144
CBN Economic Report for the First Half of 2017Ta
ble
32
Co
ntd
. Su
mm
ary
of Sta
tuto
ry &
VA
T R
ev
en
ue
Allo
ca
tio
n t
o S
tate
Go
ve
rnm
en
ts: Fi
rst
Ha
lf 2
017 1
/ (
Na
ira
Bill
ion
)
1/
Pro
vis
ion
al
2/
Inc
lud
es
the
sh
are
of
Oil-
pro
du
cin
g s
tate
s fr
om
th
e e
xce
ss c
rud
eSo
urc
e:
Fed
era
tio
n A
cc
ou
nt
Allo
ca
tio
n, Fe
de
ral M
inis
try o
f Fi
na
nc
e.
Gro
ss S
tat.
Allo
c.
De
du
ctio
ns
13%
De
riva
tio
n
Tota
l N
et
Sta
t. A
llo
c.
No
n-o
il
Exc
ess
NN
PC
Re
fun
d/A
dd
it
ion
al Fu
nd
Exc
ess
Cru
de
Exc
ha
ng
e
Ga
inV
AT
Tota
l G
ross
Allo
c.
Tota
l N
et
Allo
c.
Gro
ss S
tat.
Allo
c.
De
du
ctio
ns
13%
De
riva
tio
n
Tota
l N
et
Sta
t. A
llo
c.
Au
gm
en
t
atio
n
NN
PC
Re
fun
d/A
dd
iti
on
al Fu
nd
Exc
ess
Cru
de
Exc
ha
ng
e
Ga
inV
AT
Tota
l
Gro
ss
Allo
c.
Tota
l N
et
Allo
c.
1A
BIA
9.2
1
2.0
91
.15
8.2
80
.01
0.1
90
.13
3.8
41
4.5
41
2.4
59
.58
1.6
31
.46
9.4
1-
-1
.22
2.2
44
.58
19
.07
17
.44
2A
DA
MA
WA
9.8
0
2.1
0-
7.7
00
.01
0.2
10
.12
4.0
21
4.1
51
2.0
51
0.2
01
.52
-8
.68
--
1.0
21
.95
4.7
91
7.9
51
6.4
3
3A
KW
A I
BO
M9
.89
7.5
14
0.2
24
2.6
00
.01
0.2
10
.82
4.3
05
5.4
54
7.9
41
0.2
94
.35
38
.58
44
.52
--
6.6
91
2.7
95
.12
73
.48
69
.13
4A
NA
MB
RA
9.7
80
.87
-8
.91
0.0
10
.21
0.1
24
.44
14
.56
13
.69
10
.18
0.5
9-
9.5
8-
-1
.02
1.9
45
.37
18
.50
17
.91
5B
AU
CH
I11
.77
3.3
1-
8.4
50
.01
0.2
50
.14
4.6
01
6.7
71
3.4
51
2.2
43
.60
-8
.64
--
1.2
22
.34
5.4
72
1.2
71
7.6
6
6B
AY
EL
SA
8.7
01
7.4
02
1.0
61
2.3
70
.01
0.1
80
.46
3.3
93
3.8
11
6.4
19
.06
5.9
02
6.8
53
0.0
1-
-5
.38
8.7
04
.36
54
.34
48
.44
7B
EN
UE
11
.03
5.1
3-
5.9
00
.01
0.2
30
.13
4.4
31
5.8
41
0.7
111
.48
2.4
2-
9.0
6-
-1
.15
2.1
95
.24
20
.06
17
.64
8B
OR
NO
12
.22
2.0
2-
10
.21
0.0
10
.26
0.1
54
.35
16
.99
14
.98
12
.72
1.3
7-
11
.35
--
1.2
72
.43
5.1
92
1.6
02
0.2
4
9C
RO
SS
RIV
ER
9.8
98
.67
-1
.23
0.0
10
.21
0.1
23
.85
14
.08
5.4
21
0.2
96
.09
-4
.20
--
1.0
31
.96
4.6
61
7.9
411
.86
10
DE
LTA
9.9
91
4.4
53
0.0
32
5.5
60
.01
0.2
10
.64
4.7
84
5.6
63
1.2
11
0.3
99
.37
24
.48
25
.50
--
5.4
58
.78
5.4
75
4.5
84
5.2
0
11
EB
ON
YI
8.8
00
.89
-7
.91
0.0
10
.19
0.1
13
.57
12
.67
11
.79
9.1
60
.64
-8
.52
--
0.9
11
.75
4.3
41
6.1
61
5.5
2
12
ED
O9
.20
6.3
13
.04
5.9
30
.01
0.1
90
.16
4.3
01
6.9
11
0.6
09
.57
3.9
71
.25
6.8
5-
-1
.14
2.1
05
.04
19
.11
15
.13
13
EK
ITI
8.8
06
.12
-2
.67
0.0
10
.19
0.1
13
.67
12
.76
6.6
49
.15
4.0
7-
5.0
8-
-0
.91
1.7
54
.35
16
.16
12
.08
14
EN
UG
U9
.89
1.4
2-
8.4
80
.01
0.2
10
.12
4.2
11
4.4
41
3.0
31
0.2
91
.65
-8
.65
--
1.0
31
.96
5.0
51
8.3
31
6.6
8
15
GO
MB
E9
.27
4.8
6-
4.4
10
.01
0.2
00
.11
3.6
81
3.2
78
.41
9.6
42
.71
-6
.93
--
0.9
61
.84
4.3
61
6.8
11
4.1
0
16
IMO
10
.23
4.3
81
.13
6.9
70
.01
0.2
20
.14
4.3
01
6.0
311
.65
10
.64
3.5
11
.53
8.6
6-
-1
.38
2.4
35
.15
21
.13
17
.62
17
JIG
AW
A11
.00
0.7
2-
10
.28
0.0
10
.23
0.1
34
.48
15
.86
15
.13
11
.45
0.4
7-
10
.97
--
1.1
42
.18
5.4
12
0.1
81
9.7
1
18
KA
DU
NA
12
.89
2.3
6-
10
.53
0.0
10
.27
0.1
65
.30
18
.63
16
.27
13
.41
1.6
9-
11
.72
--
1.3
42
.56
6.5
92
3.8
92
2.2
0
19
KA
NO
15
.60
2.0
9-
13
.51
0.0
20
.33
0.1
97
.16
23
.30
21
.20
16
.23
2.1
4-
14
.09
--
1.6
23
.10
10
.42
31
.37
29
.23
20
KA
TS
INA
12
.09
1.5
5-
10
.54
0.0
10
.25
0.1
55
.25
17
.76
16
.21
12
.58
1.3
8-
11
.20
--
1.2
62
.40
6.0
42
2.2
82
0.9
0
21
KE
BB
I1
0.3
91
.68
-8
.71
0.0
10
.22
0.1
33
.99
14
.73
13
.05
10
.81
1.2
7-
9.5
4-
-1
.08
2.0
64
.76
18
.70
17
.44
22
KO
GI
10
.87
1.9
2-
8.9
50
.01
0.2
30
.13
4.0
21
5.2
61
3.3
511
.31
1.8
5-
9.4
6-
-1
.13
2.1
64
.81
19
.41
17
.56
23
KW
AR
A8
.76
2.6
2-
6.1
40
.01
0.1
80
.11
3.6
81
2.7
41
0.1
29
.11
1.5
0-
7.6
1-
-0
.91
1.7
44
.38
16
.14
14
.64
24
LA
GO
S1
3.1
81
4.2
2-
(1.0
4)
0.0
10
.28
0.1
63
6.4
85
0.1
13
5.9
01
3.7
18
.83
-4
.88
--
1.3
72
.62
38
.29
55
.99
47
.15
25
NA
SA
RA
WA
9.0
71
.28
-7
.79
0.0
10
.19
0.1
13
.41
12
.80
11
.51
9.4
41
.01
-8
.43
--
0.9
41
.80
4.1
61
6.3
41
5.3
3
26
NIG
ER
11
.65
4.0
6-
7.5
90
.01
0.2
50
.14
4.3
51
6.4
01
2.3
41
2.1
21
.87
-1
0.2
6-
-1
.21
2.3
15
.14
20
.79
18
.92
27
OG
UN
9.1
47
.47
-1
.67
0.0
10
.19
0.1
14
.26
13
.71
6.2
49
.51
4.8
5-
4.6
6-
-0
.95
1.8
15
.17
17
.44
12
.59
28
ON
DO
9.1
67
.22
5.5
97
.53
0.0
10
.19
0.2
14
.11
19
.27
12
.06
9.5
34
.31
6.4
511
.67
--
2.1
23
.68
4.8
92
6.6
62
2.3
5
29
OS
UN
8.9
71
4.3
9-
(5.4
2)
0.0
10
.19
0.1
14
.09
13
.37
(1.0
2)
9.3
36
.01
-3
.32
--
0.9
31
.78
4.8
61
6.9
01
0.8
9
30
OY
O11
.03
3.8
2-
7.2
10
.01
0.2
30
.13
5.8
61
7.2
71
3.4
511
.48
2.6
7-
8.8
1-
-1
.15
2.1
97
.67
22
.48
19
.81
31
PL
AT
EA
U1
0.2
77
.36
-2
.92
0.0
10
.22
0.1
24
.05
14
.68
7.3
21
0.6
94
.75
-5
.94
--
1.0
72
.04
4.8
31
8.6
31
3.8
8
32
RIV
ER
S1
0.6
111
.64
22
.87
21
.84
0.0
10
.22
0.5
26
.05
40
.28
28
.64
11
.04
7.3
92
6.9
83
0.6
2-
-6
.27
9.2
28
.95
62
.45
55
.07
33
SO
KO
TO
10
.84
1.2
3-
9.6
10
.01
0.2
30
.13
4.2
31
5.4
41
4.2
111
.28
0.8
7-
10
.41
--
1.1
32
.15
4.9
61
9.5
21
8.6
5
34
TA
RA
BA
9.4
82
.19
-7
.29
0.0
10
.20
0.1
13
.62
13
.42
11
.23
9.8
62
.14
-7
.72
--
0.9
81
.88
4.3
61
7.0
91
4.9
5
35
YO
BE
9.7
70
.79
-8
.98
0.0
10
.21
0.1
23
.63
13
.73
12
.94
10
.16
0.5
0-
9.6
6-
-1
.01
1.9
44
.35
17
.47
16
.96
36
ZA
MFA
RA
9.7
95
.58
-4
.21
0.0
10
.21
0.1
24
.01
14
.14
8.5
61
0.1
84
.02
-6
.16
--
1.0
21
.94
4.7
41
7.8
81
3.8
6
37
Dis
pu
ted
De
riv.
Riv
ers
/Akw
a D
isp
ute
d F
un
d
TO
TA
L3
73
.00
18
1.6
91
25
.10
31
6.4
10
.42
7.8
6-
6.6
91
87
.77
70
0.8
35
19
.14
38
8.1
011
2.9
21
27
.59
40
2.7
7-
-6
0.3
81
08
.69
22
3.3
59
08
.11
79
5.1
9
FIR
ST
HA
LF 2
016
FIR
ST
HA
LF 2
017
S/N
STA
TES

Tab
le 3
3A
lloc
atio
n t
o L
oc
al G
ov
ern
me
nts
fro
m t
he
Fe
de
ratio
n a
nd
VA
T P
oo
ls A
cc
ou
nts
(Na
ira
Bill
ion
)
145
CBN Economic Report for the First Half of 2017
1/
Re
vis
ed
2/
Pro
vis
ion
al
VA
T: V
alu
e A
dd
ed
Ta
xLG
A:
Loc
al G
ov
ern
me
nts
Are
as
So
urc
e: Fe
de
ratio
n A
cc
ou
nt
Allo
ca
tio
n, Fe
de
ral M
inis
try
of Fi
na
nc
e (
FMF)
S/N
Stat
eFe
d. A
cct.
Exce
ss
Crud
e
Budg
et
Augm
enta
tion
Exch
ange
Gain
NNPC
Refu
nds
SURE
-PVA
TTo
tal
Fed.
Acc
t.Ex
cess
Crud
e
Budg
et
Augm
enta
tion
Exch
ange
Gain
NNPC
Refu
nds
SURE
-PVA
TTo
tal
Fed.
Acc
t.Ex
cess
Crud
e
Budg
et
Augm
enta
tion
Exch
ange
Gain
NNPC
Refu
nds
SURE
-PAd
ditio
nal
Reve
nue
VAT
Tota
l
1 A
bia
11.1
1.15
2.3-
0.36
0.80
2.217
.911
.96
--
-0.2
40.8
02.4
15.4
8.37
0.06
-0.7
8-
-0.0
52.4
11.6
2 A
dam
awa
14.3
1.45
2.9-
0.48
1.03
2.722
.815
.08
--
-0.3
21.0
32.8
19.3
10.56
0.07
-0.9
9-
-0.0
72.8
14.5
3 A
kwa-
Ibom
18.8
1.93
3.8-
0.58
1.35
4.030
.520
.09
--
-0.3
91.3
53.9
25.7
14.07
0.10
-1.3
2-
-0.0
94.0
19.6
4 A
nam
bra
14.1
1.46
2.9-
0.50
1.02
3.023
.015
.16
--
-0.3
31.0
23.2
19.7
10.62
0.07
-0.9
9-
-0.0
73.1
14.9
5 B
auch
i16
.31.6
63.3
-
0.49
1.18
3.025
.917
.21
--
-0.3
31.1
83.2
21.9
12.06
0.08
-1.1
3-
-0.0
83.2
16.5
6 B
ayels
a6.0
0.67
1.3-
0.19
0.43
1.410
.17.0
1
--
-0.1
30.4
31.5
9.04.9
10.0
3-
0.46
--
0.03
1.26.7
7 B
enue
16.6
1.80
3.6-
0.55
1.20
3.126
.818
.73
--
-0.3
71.2
03.4
23.7
13.12
0.09
-1.2
3-
-0.0
93.2
17.8
8 B
orno
19.1
1.96
3.9-
0.61
1.37
3.430
.320
.34
--
-0.4
01.3
73.7
25.8
14.24
0.10
-1.3
3-
-0.0
93.6
19.3
9 C
ross
-Rive
r11
.91.2
62.5
-
0.40
0.85
2.419
.313
.11
--
-0.2
70.8
52.6
16.8
9.18
0.06
-0.8
6-
-0.0
62.5
12.7
10 D
elta
15.7
1.62
3.2-
0.53
1.13
3.525
.716
.80
--
-0.3
61.1
33.7
21.9
11.77
0.08
-1.1
0-
-0.0
83.6
16.7
11 E
bony
i8.5
0.93
1.9-
0.28
0.61
1.813
.99.7
0
--
-0.1
80.6
11.9
12.4
6.79
0.05
-0.6
3-
-0.0
41.8
9.3
12 E
do11
.91.2
42.5
-
0.43
0.85
2.619
.412
.85
--
-0.2
90.8
52.7
16.7
9.00
0.06
-0.8
4-
-0.0
62.6
12.6
13 E
kiti
9.70.9
81.9
-
0.32
0.70
2.115
.710
.21
--
-0.2
10.7
02.1
13.3
7.15
0.05
-0.6
7-
-0.0
52.1
10.0
14 E
nugu
11.5
1.26
2.5-
0.37
0.82
2.418
.813
.06
--
-0.2
40.8
22.6
16.7
9.15
0.06
-0.8
5-
-0.0
62.6
12.7
15 G
ombe
8.40.8
61.7
-0.2
60.6
01.6
13.4
8.95
--
-0.1
70.6
01.7
11.4
6.27
0.04
-0.5
9-
-0.0
41.7
8.6
16 Im
o16
.61.6
93.3
-0.5
21.1
93.4
26.7
17.50
--
-0.3
51.1
93.6
22.6
12.26
0.09
-1.1
5-
-0.0
83.5
17.1
17 Ji
gawa
17.4
1.77
3.5-
0.56
1.25
3.528
.018
.39-
--
0.37
1.25
3.923
.912
.880.0
9-
1.20
--
0.08
3.717
.9
18 K
adun
a18
.71.9
93.9
-0.6
11.3
43.7
30.2
20.68
--
-0.4
11.3
44.0
26.4
14.48
0.10
-1.3
5-
-0.0
93.9
19.9
19 K
ano
30.6
3.17
6.3-
0.97
2.20
6.649
.832
.92-
--
0.64
2.20
7.142
.823
.060.1
6-
2.16
--
0.15
6.932
.4
20 K
atsin
a22
.42.4
14.8
-0.7
31.6
14.4
36.4
25.06
--
-0.4
81.6
14.8
32.0
17.55
0.12
-1.6
4-
-0.1
14.8
24.2
21 K
ebbi
13.9
1.52
3.0-
0.45
1.00
2.722
.615
.82-
--
0.30
1.00
3.020
.111
.080.0
8-
1.04
--
0.07
2.815
.1
22 K
ogi
14.4
1.57
3.1-
0.45
1.04
2.723
.316
.35-
--
0.30
1.04
2.920
.611
.450.0
8-
1.07
--
0.07
2.815
.5
23 K
wara
11.1
1.11
2.2-
0.37
0.80
2.017
.611
.57-
--
0.25
0.80
2.214
.88.1
00.0
6-
0.76
--
0.05
2.111
.1
24 L
agos
18.6
1.90
3.8-
0.65
1.34
19.3
45.5
19.71
--
-0.4
31.3
421
.743
.213
.800.1
0-
1.29
--
0.09
20.6
35.9
25 N
assa
rawa
8.90.9
92.0
-0.2
90.6
41.6
14.4
10.32
--
-0.1
90.6
41.7
12.9
7.23
0.05
-0.6
8-
-0.0
51.7
9.7
26 N
iger
18.0
1.84
3.6-
0.58
1.29
3.228
.519
.10-
--
0.39
1.29
3.424
.213
.380.0
9-
1.25
--
0.09
3.418
.2
27 O
gun
13.3
1.31
2.6-
0.44
0.96
2.821
.413
.63-
--
0.30
0.96
2.917
.89.5
50.0
7-
0.89
--
0.06
3.013
.5
28 O
ndo
12.3
1.25
2.5-
0.40
0.88
2.519
.813
.02-
--
0.27
0.88
2.716
.89.1
20.0
6-
0.85
--
0.06
2.612
.7
29 O
sun
16.7
1.70
3.4-
0.58
1.20
3.527
.017
.63-
--
0.39
1.20
3.823
.012
.350.0
9-
1.15
--
0.08
3.617
.3
30 O
yo21
.42.1
44.2
-0.7
01.5
44.4
34.4
22.24
--
-0.4
61.5
44.7
29.0
15.58
0.11
-1.4
6-
-0.1
04.8
22.0
31 P
latea
u12
.21.3
42.7
-0.3
90.8
82.4
19.9
13.94
--
-0.2
60.8
82.6
17.7
9.76
0.07
-0.9
1-
-0.0
62.5
13.3
32 R
ivers
16.0
1.66
3.3-
0.51
1.15
4.727
.317
.28-
--
0.34
1.15
4.523
.312
.100.0
8-
1.13
--
0.08
4.117
.5
33 S
okot
o15
.41.6
83.3
-0.5
01.1
03.0
25.0
17.41
--
-0.3
41.1
03.3
22.1
12.19
0.08
-1.1
4-
-0.0
83.1
16.6
34 Ta
raba
12.2
1.26
2.5-
0.39
0.88
2.019
.213
.05-
--
0.26
0.88
2.116
.39.1
40.0
6-
0.85
--
0.06
2.112
.2
35 Y
obe
11.9
1.26
2.5-
0.39
0.85
2.119
.013
.12-
--
0.26
0.85
2.216
.59.1
90.0
6-
0.86
--
0.06
2.212
.3
36 Z
amfa
ra11
.11.1
42.3
-0.3
40.8
02.2
17.8
11.85
--
-0.2
30.8
02.2
15.1
8.30
0.06
-0.7
8-
-0.0
52.2
11.4
37 F
CT A
buja
4.70.5
01.0
-0.1
40.3
45.6
12.3
5.23
--
-0.0
90.3
46.5
12.2
3.67
0.03
-0.3
4-
-0.0
27.2
11.3
TOTA
L53
1.34
55.46
110.0
2-
17.31
38.23
127.4
087
9.76
576.0
8-
--
11.54
38.23
137.0
776
2.92
403.4
82.8
0-
37.71
--
2.63
134.0
158
0.63
Firs
t Half
, 201
3-20
17
1st H
alf 20
13
1st H
alf 20
14 1
/ 1s
t Half
2015
1/

146
CBN Economic Report for the First Half of 2017Ta
ble
33
Co
ntd
.A
lloc
atio
n t
o L
oc
al G
ov
ern
me
nts
fro
m t
he
Fe
de
ratio
n a
nd
VA
T P
oo
ls A
cc
ou
nts
(Na
ira
Bill
ion
)
1/
Re
vis
ed
2/
Pro
vis
ion
al
VA
T: V
alu
e A
dd
ed
Ta
xLG
A: Lo
ca
l Go
ve
rnm
en
ts A
rea
sSo
urc
e:
Fed
era
tio
n A
cc
ou
nt
Allo
ca
tio
n, Fe
de
ral M
inis
try
of Fi
na
nc
e (
FMF)
S/N
Stat
eFe
d. A
cct.
Exce
ss
Crud
e
Non-
Oil
Exce
ss
Budg
et
Augm
enta
tion
Exch
ange
Gain
NNPC
Refu
nds
NLNG
Divi
dend
SURE
-PAd
ditio
nal
Reve
nue
VAT
Tota
lFe
d. A
cct.
Exce
ss
Crud
e
Non-
Oil
Exce
ss
Budg
et
Augm
enta
tion
Exch
ange
Gai
nNN
PC R
efun
dsNL
NG D
ivid
end
SURE
-PAd
ditio
nal
Reve
nue
VAT
Tota
l
1 A
bia
5.97
0.01
-0.
07-
0.13
--
2.3
8.5
6.21
0.62
-1.
18-
-2.
710
.7
2 A
dam
awa
7.53
0.01
-0.
09-
0.16
--
2.7
10.5
7.83
0.78
-1.
49-
-3.
313
.4
3 A
kwa-
Ibom
10.0
30.
01-
0.12
-0.
21-
-3.
814
.210
.43
1.04
-1.
99-
-4.
518
.0
4 A
nam
bra
7.57
0.01
-0.
09-
0.16
--
3.0
10.9
7.88
0.79
-1.
50-
-3.
713
.8
5 B
auch
i8.
590.
01-
0.10
-0.
18-
-3.
111
.98.
940.
89-
1.71
--
3.6
15.2
6 B
ayel
sa3.
500.
00-
0.04
-0.
07-
-1.
24.
83.
640.
36-
0.69
--
1.6
6.3
7 B
enue
9.35
0.01
-
0.11
-
0.20
--
3.2
12.9
9.73
0.97
-1.
86-
-3.
816
.3
8 B
orno
10.1
50.
01
-
0.12
-
0.21
--
3.5
14.0
10.5
61.
05-
2.02
--
4.2
17.8
9 C
ross
-Riv
er6.
540.
01 -
0.08
-
0.14
--
2.4
9.1
6.81
0.68
-1.
30-
-2.
911
.7
10 D
elta
8.39
0.01
-
0.10
-
0.18
--
3.6
12.2
8.73
0.87
-1.
66-
-4.
115
.4
11 E
bony
i4.
840.
01
-
0.06
-
0.10
--
1.8
6.8
5.04
0.50
-0.
96-
-2.
18.
6
12 E
do6.
420.
01
-
0.08
-
0.14
--
2.6
9.3
6.68
0.67
-1.
27-
-3.
111
.7
13 E
kiti
5.09
0.01
-
0.06
-
0.11
--
2.1
7.4
5.30
0.53
-1.
01-
-2.
59.
3
14 E
nugu
6.52
0.01
-
0.08
-
0.14
--
2.5
9.3
6.78
0.68
-1.
29-
-3.
011
.8
15 G
ombe
4.47
0.01
-
0.05
-
0.09
--
1.7
6.3
4.65
0.46
-0.
89-
-2.
08.
0
16 Im
o8.
740.
01
-
0.11
-
0.18
--
3.5
12.5
9.09
0.91
-1.
73-
-4.
115
.9
17 J
igaw
a9.
180.
01
-
0.11
-
0.19
--
3.6
13.1
9.55
0.95
-1.
82-
-4.
316
.6
18 K
adun
a10
.32
0.01
-
0.13
-
0.22
--
3.8
14.5
10.7
41.
07-
2.05
--
4.7
18.5
19 K
ano
16.4
30.
02-
0.20
-0.
35-
-6.
823
.817
.10
1.71
-3.
26-
-9.
131
.2
20 K
atsi
na12
.51
0.01
-0.
15-
0.26
--
4.7
17.6
13.0
21.
30-
2.48
--
5.5
22.3
21 K
ebbi
7.90
0.01
-0.
10-
0.17
--
2.7
10.9
8.22
0.82
-1.
57-
-3.
313
.9
22 K
ogi
8.16
0.01
-0.
10-
0.17
--
2.8
11.2
8.49
0.85
-1.
62-
-3.
314
.2
23 K
wara
5.78
0.01
-0.
07-
0.12
--
2.1
8.1
6.01
0.60
-1.
15-
-2.
510
.2
24 L
agos
9.84
0.01
-0.
12-
0.21
--
21.1
31.2
10.2
41.
02-
1.95
--
22.3
35.5
25 N
assa
rawa
5.15
0.01
-0.
06-
0.11
--
1.7
7.0
5.36
0.53
-1.
02-
-2.
08.
9
26 N
iger
9.54
0.01
-0.
12-
0.20
--
3.3
13.2
9.92
0.99
-1.
89-
-3.
916
.7
27 O
gun
6.80
0.01
-0.
08-
0.14
--
2.8
9.9
7.08
0.71
-1.
35-
-3.
412
.6
28 O
ndo
6.50
0.01
-0.
08-
0.14
--
2.6
9.3
6.76
0.67
-1.
29-
-3.
011
.8
29 O
sun
8.80
0.01
-0.
11-
0.19
--
3.6
12.7
9.16
0.91
-1.
75-
-4.
216
.1
30 O
yo11
.10
0.01
-0.
13-
0.23
--
4.9
16.4
11.5
51.
15-
2.20
--
6.2
21.2
31 P
late
au6.
960.
01-
0.08
-0.
15-
-2.
49.
67.
240.
72-
1.38
--
2.9
12.2
32 R
iver
s8.
630.
01-
0.10
-0.
18-
-4.
113
.18.
980.
90-
1.71
--
5.9
17.5
33 S
okot
o8.
690.
01-
0.11
-0.
18-
-3.
112
.09.
040.
90-
1.72
--
3.6
15.3
34 T
arab
a6.
510.
01-
0.08
-0.
14-
-2.
08.
86.
780.
68-
1.29
--
2.5
11.2
35 Y
obe
6.55
0.01
-0.
08-
0.14
--
2.1
8.9
6.81
0.68
-1.
30-
-2.
611
.4
36 Z
amfa
ra5.
920.
01-
0.07
-0.
12-
-2.
28.
36.
160.
61-
1.17
--
2.5
10.5
37 F
CT A
buja
2.61
0.00
-0.
03-
0.06
--
6.3
9.0
2.72
0.27
-0.
52-
-7.
410
.9
TOTA
L28
7.57
0.33
-3.
48-
6.06
--
131.
4442
8.87
299.
2129
.85
-57
.08
--
-15
6.35
542.
49
1st
Hal
f 201
6 2
/ 1
st H
alf 2
017
2/

147
CBN Economic Report for the First Half of 2017
Table 34Consolidated Debt of the Federal Government
(Naira Billion)
Type
1st Half
2013
1st Half
2014
1st Half
2015
1st Half
2016
End-
December
2016
End-June
2017
External Debt 1,088.60 1,474.93 2,031.90 3,187.12 3,478.91 4,602.88
Domestic Debt 6,850.75 7,421.10 8,396.59 10,606.33 11,058.20 12,033.45
Total 7,939.35 8,896.02 10,428.49 13,793.45 14,537.12 16,636.33
Item
1st Half
2013
1st Half
2014
1st Half
2015
1st Half
2016
End-
December
2016
End-June
2017
COMPOSITION OF DEBT.
Instruments
Treasury Bills 2,483.3
2,735.9 2,825.0
2,901.8
3,277.3 3,702.8
Treasury Bonds 334.6
315.4 271.2
231.0
216.0 191.0
Development Stocks 0.00 0.00 0.00 0.00 0.00 0.00
FGN Bonds 4,032.9
4,369.8 5,300.4
7,473.5
7,564.9 8,134.9
Special FGN Savings Bond 0.00 0.00 0.00 0.00 0.00 4.75
Promisory Notes 2/ 0.00 0.00 0.00 0.00 0.00 0.00
6,850.7
7,421.1 8,396.6
10,606.3
11,058.2 12,033.5
HOLDERS
Banking System 5,243.8
5,747.1
6,040.09
6,927.25
5,625.86 7,859.34
Central Bank 761.0 832.1 948.97 689.42 710.74 782.18
Deposit Money Banks (DMBs) 4,166.1 4,568.7 5,091.12 6,237.83 4,915.12 7,077.15
Sinking Fund 316.7 346.3 394.90 271.75 231.75 308.32
Non-Bank Public 1,607.0 1,674.0 1,961.60 3,407.33 5,200.59 3,865.79
Total Debt Outstanding 6,850.7 7,421.1 8,396.59 10,606.33 11,058.20 12,033.45
**Figures for 2012 have been revised1/ Provisional2/ Introduced 30th September, 2009
Domestic Public Debt (end - Period)

148
CBN Economic Report for the First Half of 2017
Table 35External Public Debt Outstanding
External Debt Stock
1st Half 2013 1st Half 2014 1st Half 2015 1st Half 2016
End-
December
2016
End-June
2017 1st Half 2013 1st Half 2014 1st Half 2015 1st Half 2016
End-
December
2016
End-June
2017
MULTILATERAL 5,538.70 6,730.45 7,232.86 7,991.00 7,988.21 9,673.99 871.29 1,058.63 1,424.51 2,261.45 2,436.40 2,959.27
IBRD - - - 7.25 3.88 124.18 - - - 2.05 1.18 37.99
IDA 4,777.40 5,772.77 6,091.45 6,844.97 6,669.57 7,596.11 751.53 908.00 1,199.71 1,937.13 2,034.22 2,323.65
IFAD 83.70 91.57 94.80 103.01 107.42 121.21 13.17 14.40 18.67 29.15 32.76 37.08
ADB Group 559.50 748.24 946.53 938.91 1,118.62 1,740.70 88.01 117.69 186.42 265.71 341.18 532.48
ADB 21.20 150.00 350.00 400.73 403.34 1,002.33 3.33 23.59 68.93 113.41 123.02 306.61
ADF 538.30 598.24 596.53 538.18 715.28 738.37 84.68 94.10 117.49 152.30 218.16 225.87
Others 2/ 118.10 117.87 100.08 96.86 88.72 91.79 18.58 18.54 19.71 27.41 27.06 28.08
BILATERAL 845.40 1,140.79 1,583.95 1,770.90 1,918.06 2,073.02 132.99 179.43 311.96 501.16 585.01 634.14
Exim Bank of China 825.40 1,031.84 1,388.87
1,495.85
1,638.06
1,768.95
129.84
162.30
273.54 423.33 499.61 541.12
French Devt. Agency (AFD) 20.00 108.95 140.25
182.95
198.25
218.25
3.15
17.14
27.62 51.77 60.47 66.76
Others 3/ - -
54.83
92.10
81.75
85.82
-
-
10.80 26.06 24.93 26.25
COMMERCIAL 4/ 36.00 5.88
-
-
-
300.00
5.66
0.92
- - - 91.77
EUROBOND 500.00 1,500.00 1,500.00
1,500.00
1,500.00
3,000.00
78.66
235.94
295.43 424.50 457.50 917.70
Total Debt Outstanding 6,920.10 9,377.12 10,316.81
11,261.90
11,406.27
15,047.01
1,088.60
1,474.93
2,031.90 3,187.12 3,478.91 4,602.88
1st Half 2013 1st Half 2014 1st Half 2015 1st Half 2016
End-
December
2016 1st Half 2017 1st Half 2013 1st Half 2014 1st Half 2015 1st Half 2016
End-
December
2016 1st Half 2017
MULTILATERAL 70.91 82.43
63.39
77.01
88.31
85.64
11.15
12.97
12.30 15.93 26.95 26.18
IBRD - -
-
-
-
0.06
-
-
- - - 0.02
IDA 46.99 58.66
50.46
63.95
72.90
69.01
7.39
9.23
9.79 13.23 22.25 21.10
IFAD 1.76 1.62
1.48
1.66
1.70
2.09
0.28
0.25
0.29 0.34 0.52 0.64
ADB Group 18.96 18.75 7.60 8.59 9.50 11.34 2.98 2.95 1.47 1.78 2.90 3.47
ADB 11.97 11.76 0.79 1.54 2.12 3.88 1.88 1.85 0.15 0.32 0.65 1.19
ADF 7.00 7.00 6.80 7.05 7.39 7.46 1.10 1.10 1.32 1.46 2.25 2.28
Others 2/ 3.21 3.40 3.86 2.81 4.21 3.15 0.50 0.54 0.75 0.58 1.29 0.96
BILATERAL 19.48 23.17 29.43 30.75 32.63 34.02 3.06 3.64 5.71 6.36 9.96 10.40
Exim Bank of China - 22.79 26.65 28.76 30.03 31.48 - 3.59 5.17 5.95 9.17 9.62
French Devt. Agency (AFD) 0.04 0.37 1.83 1.90 2.38 2.39 0.01 0.06 0.36 0.39 0.73 0.73
Others 3/ 19.43 - 0.94 0.09 0.22 0.15 3.06 - 0.18 0.02 0.07 0.04
COMMERCIAL 4/ 38.82 6.08 - - - - 6.11 0.96 - - - -
EUROBOND 16.88 45.63 45.63 45.63 45.63 45.63 2.65 7.18 8.85 9.44 13.93 13.95
OTHERS 5/ 0.01 20.87 20.86 12.26 20.86 20.86 0.00 3.28 4.05 2.54 6.37 6.38
Total Debt Service Payments 146.09 178.18 159.31 165.66 187.43 186.15 22.98 28.03 30.91 34.27 57.21 56.91
1/ Provisional2/ Includes ABEDA, IDB and EDF3/ Exim Bank of Korea and Nig. ICT Infrast. Backbone Project.4/ Includes Papalanto &Omotosho, ZTE, Arcatel and SBI Holdings.5/ Includes Bank of England and CITIbank Lazards agency fees and Oil warrantsSource: Debt Management Office, The Presidency, Abuja.
External Debt Service Payments
Holder
US $ Million Naira Billion
Naira BillionUS $ Million
Holder

149
CBN Economic Report for the First Half of 2017
Table 36Consolidated Debt Service Payment 1/
(Naira Billion)
Holders
1st Half
2013
1st Half
2014
1st Half
2015
1st Half
2016
End-
December
2016
1st Half
2017
External Debt 22.98
28.03
30.91
34.27 57.21 56.91
Domestic Debt 423.22 439.18 528.54
641.68 587.08 709.45
Total Consolidated Debt 446.20 467.21 559.45
675.96 644.29 766.36
1/ Provisional
Source: Debt Management Office (DMO)
Table 37Debt Service Payment by the Federal Government 1/
(By Instrument) (Naira Billion)
1st Half
2013
1ST HALF
2014
1ST HALF
2015
1ST HALF
2016
End-
December
2016
1st Half
2017
i Treasury Bills 170.34
173.08
191.04
219.93
115.65
201.57
ii Treasury Bonds 18.75
18.75
43.75
40.63
13.37
34.62
iii Development Stocks 0.00 0.00 0.00 0.00 0.00 0.00
iv FGN Bonds 234.13 247.35 293.74 381.13 458.05 473.19
v Savings Bonds -
-
-
-
-
0.07
Total 423.22
439.18
528.54 641.68 587.08
709.45
1/ 2008 to 2013 Figures are Revised
NB: Debt Service excludes sinking fund charges
Source: Debt Management Office

Tab
le 3
8G
ross
Do
me
stic
Pro
du
ct
at
20
10
Co
nst
an
t B
asi
c P
ric
es
(Na
ira
Bill
ion
un
less
oth
erw
ise
sta
ted
)
150
CBN Economic Report for the First Half of 2017
1st
Hal
f 2
01
52
nd
Hal
f 2
01
51
st H
alf
20
16
1/
2n
d H
alf
20
16
2/
1st
Hal
f 2
01
7 2
/
1. A
gric
ult
ure
6,3
94
.42
8
,98
5.9
7
6,6
54
.44
9
,29
7.7
8
6,9
10
.26
9,6
97
.08
7,1
30
.69
20
.47
25
.47
21
.49
27
.11
22
.21
(a)
Cro
p P
rod
uct
ion
5,6
27
.04
8,1
66
.41
5,8
40
.32
8
,43
4.6
1
6
,06
8.9
58
,82
5.5
06
,27
2.0
21
7.9
62
3.1
01
8.8
72
4.6
71
9.5
4
(b
) Li
vest
ock
51
5.3
75
71
.48
54
7.9
6
60
3.3
7
57
5.6
56
09
.47
58
7.1
31
.69
1.6
51
.79
1.7
01
.83
(c)
Fo
rest
ry7
7.8
58
3.4
98
1.0
9
86
.17
83
.61
88
.03
86
.36
0.2
50
.24
0.2
60
.25
0.2
7
(d
) Fi
shin
g1
74
.17
16
4.5
91
85
.08
17
3.6
2
18
2.0
51
74
.08
18
5.1
80
.57
0.4
80
.57
0.4
90
.58
2. I
nd
ust
ry6
,88
6.4
7
6,9
04
.78
6,5
50
.29
6,7
68
.84
6,0
96
.27
5,9
65
.78
5,9
03
.52
20
.15
18
.54
18
.95
16
.68
18
.39
(a)
Cru
de
Petr
ole
um
& N
atu
ral G
as3
,55
8.0
53
,45
3.7
73
,29
1.6
1
3,3
38
.36
3,0
23
.25
2,6
48
.96
2,7
97
.40
10
.12
9.1
49
.40
7.4
18
.71
(b
) So
lid M
iner
als
45
.12
50
.10
49
.28
53
.26
31
.09
56
.52
33
.77
0.1
50
.15
0.1
00
.16
0.1
1
(c)
Man
ufa
ctu
rin
g3
,28
3.3
03
,40
0.9
23
,20
9.4
1
3,3
77
.21
3,0
41
.94
3,2
60
.30
3,0
72
.36
9.8
79
.25
9.4
69
.11
9.5
7
3. C
on
stru
ctio
n1
,32
2.8
51
,24
5.6
11
,43
7.5
7
1,2
42
.65
1,3
53
.69
1,1
67
.16
1,3
55
.54
4.4
23
.40
4.2
13
.26
4.2
2
4. T
rad
e5
,37
6.2
75
,74
9.5
25
,68
6.3
9
6,0
11
.20
5,7
42
.90
5,9
26
.17
5,6
07
.42
17
.49
16
.46
17
.86
16
.57
17
.47
5. S
erv
ice
s1
1,5
43
.29
12
,74
3.6
0
12
,18
5.2
5
13
,18
9.5
3
12
,05
9.1
41
3,0
12
.80
12
,10
8.5
23
7.4
83
6.1
33
7.4
93
6.3
83
7.7
1
(a)
Tra
nsp
ort
35
1.0
54
19
.64
36
6.4
8
43
8.9
8
38
0.3
14
28
.29
38
8.7
41
.13
1.2
01
.18
1.2
01
.21
(b
) In
form
atio
n a
nd
Co
mm
un
icat
ion
3,5
79
.50
3,6
77
.56
3,8
57
.96
3,8
50
.16
3,9
60
.18
3,8
98
.51
3,9
89
.00
11
.87
10
.55
12
.31
10
.90
12
.42
(c)
Uti
litie
s1
89
.15
19
3.2
91
65
.58
20
1.7
41
38
.01
19
7.2
31
59
.16
0.5
10
.55
0.4
30
.55
0.5
0
(d
) A
cco
mm
od
atio
n a
nd
Fo
od
Ser
vice
s2
82
.12
35
7.6
03
12
.49
34
1.7
2
29
0.4
93
28
.93
27
8.8
90
.96
0.9
40
.90
0.9
20
.87
(e)
Fin
ance
& In
sura
nce
1,0
35
.35
94
7.3
21
,11
5.1
3
1,0
08
.77
99
1.8
81
,03
5.6
31
,04
6.5
83
.43
2.7
63
.08
2.9
03
.26
(f)
Rea
l Est
ate
2,3
03
.72
2,8
52
.01
2,3
73
.28
2,8
91
.42
2,2
54
.40
2,6
49
.21
2,1
79
.27
7.3
07
.92
7.0
17
.41
6.7
9
(g)
Pro
fess
ion
al, S
cien
tifi
c &
Tec
hn
ical
Ser
vice
s1
,09
1.5
31
,29
8.9
11
,16
2.0
71
,35
4.0
01
,16
2.9
91
,37
3.3
01
,16
1.2
23
.57
3.7
13
.62
3.8
43
.62
(h
) A
dm
inis
trat
ive
and
Su
pp
ort
Ser
vice
s B
uss
ines
s Se
rvic
es6
.68
7.3
06
.96
7.5
16
.78
7.5
96
.77
0.0
20
.02
0.0
20
.02
0.0
2
(i)
Pu
blic
Ad
min
istr
atio
n9
15
.64
95
9.3
18
09
.79
83
4.9
97
66
.92
80
2.5
97
65
.66
2.4
92
.29
2.3
82
.24
2.3
8
(j)
Ed
uca
tio
n5
82
.10
80
9.8
66
23
.37
87
5.3
36
44
.44
87
4.4
96
43
.30
1.9
22
.40
2.0
02
.44
2.0
0
(k)
Hu
man
Hea
lth
& S
oci
al S
ervi
ces
22
8.8
42
43
.79
23
4.0
02
50
.33
23
1.3
72
44
.32
23
1.4
10
.72
0.6
90
.72
0.6
80
.72
(l)
Art
s, E
nte
rtai
nm
ent
& R
ecre
atio
n6
7.3
26
1.8
67
5.4
76
5.8
67
9.3
96
7.1
98
4.0
70
.23
0.1
80
.25
0.1
90
.26
(m
) O
ther
Ser
vice
s9
10
.29
91
5.1
61
,08
2.6
71
,06
8.7
11
,15
1.9
61
,10
5.5
11
,17
4.4
63
.33
2.9
33
.58
3.0
93
.66
TOTA
L (G
DP
)3
1,5
23
.30
35
,62
9.4
83
2,5
13
.94
36
,50
9.9
93
2,1
62
.26
35
,76
8.9
83
2,1
05
.70
10
0.0
01
00
.00
10
0.0
01
00
.00
10
0.0
0
NO
N-O
IL (
GD
P)
27
,96
5.2
63
2,1
75
.72
29
,22
2.3
43
3,1
71
.63
29
,13
9.0
13
3,1
20
.02
29
,30
8.3
08
9.8
89
0.8
69
0.6
09
2.5
99
1.2
9
NET
IND
IREC
T TA
XES
ON
PR
OD
UC
TS3
27
.11
49
7.5
63
12
.91
44
3.8
52
74
.26
44
6.9
32
64
.39
TOTA
L G
DP
AT
20
10
CO
NST
AN
T M
AR
KET
PR
ICES
31
,85
0.4
23
6,1
27
.04
32
,82
6.8
63
6,9
53
.84
32
,43
6.5
23
6,2
15
.91
32
,37
0.0
9
TOTA
L G
DP
GR
OW
TH R
ATE
(%
)3
.14
2.4
7(1
.08
)(2
.03
)(0
.18
)
O
IL G
DP
GR
OW
TH R
ATE
(%
)(7
.49
)(3
.34
)(8
.15
)(2
0.6
5)
(7.4
7)
N
ON
-OIL
GD
P G
RO
WTH
RA
TE (
%)
4.5
03
.10
(0.2
9)
(0.1
6)
0.5
8
Gro
wth
in T
ota
l GD
P
Ag
ricu
ltu
re (
%)
4.0
73
.47
3.8
44
.29
3.1
9
I
nd
ust
ry (
%)
(4.8
8)
(1.9
7)
(6.9
3)
(11
.86
)(3
.16
)
C
on
stru
ctio
n (
%)
8.6
7(0
.24
)(5
.83
)(6
.07
)0
.14
T
rad
e (%
)5
.77
4.5
50
.99
(1.4
1)
(2.3
6)
S
ervi
ces
(%)
5.5
63
.50
(1.0
4)
(1.3
4)
0.4
1
Sou
rce
: N
atio
na
l Bu
rea
u o
f St
atist
ics
1/
Re
vis
ed
2/
Pro
vis
ion
al
Shar
e o
f To
tal G
DP
(P
er
Ce
nt)
Act
ivit
y Se
cto
r1
st H
alf
20
14
2n
d H
alf
20
14
1st
Hal
f 2
01
52
nd
Hal
f 2
01
51
st H
alf
20
16
1/
2n
d H
alf
20
16
2/
1st
Hal
f 2
01
7 2
/

Tab
le 3
9G
ross
Do
me
stic
Pro
du
ct
at
Cu
rre
nt
Ba
sic
Pri
ce
s /1
(Na
ira
Bill
ion
un
less
oth
erw
ise
sta
ted
)
151
CBN Economic Report for the First Half of 2017
1st
Hal
f 2
01
52
nd
Hal
f 2
01
51
st H
alf
20
16
1/
2n
d H
alf
20
16
2/
1st
Hal
f 2
01
7 2
/
1. A
gric
ult
ure
7,2
25
.24
10
,79
3.3
7
7,8
27
.50
11
,80
9.4
7
8,8
97
.75
12
,62
5.7
69
,89
6.3
71
7.8
32
3.5
01
9.4
32
2.6
61
8.6
7
(a)
Cro
p P
rod
uct
ion
6,1
73
.67
9,6
38
.90
6,6
52
.62
10
,53
7.3
5
7,6
01
.06
11
,28
2.0
28
,49
9.6
41
5.1
52
0.9
71
6.6
02
0.2
51
6.0
3
(b
) Li
vest
ock
73
6.2
2
83
6.8
3
82
1.9
2
92
6.1
1
90
2.8
09
72
.99
96
2.0
81
.87
1.8
41
.97
1.7
51
.81
(c)
Fo
rest
ry9
8.7
7
10
8.9
7
10
8.1
6
11
4.6
7
11
3.2
81
22
.98
12
5.2
20
.25
0.2
30
.25
0.2
20
.24
(d
) Fi
shin
g2
16
.58
20
8.6
7
24
4.8
0
23
1.3
4
28
0.6
12
47
.78
30
9.4
20
.56
0.4
60
.61
0.4
40
.58
2. I
nd
ust
ry9
,53
0.2
1
8,8
71
.98
7,4
55
.57
7,6
18
.21
6,0
61
.42
8,3
11
.37
9,4
26
.22
16
.98
15
.16
13
.24
14
.92
17
.78
(a)
Cru
de
Petr
ole
um
& N
atu
ral G
as5
,24
5.3
9
4,3
71
.09
3,1
37
.49
2,8
52
.92
1,8
47
.05
3,5
20
.27
4,5
18
.07
7.1
55
.68
4.0
36
.32
8.5
2
(b
) So
lid M
iner
als
47
.37
52
.90
52
.68
56
.91
34
.45
67
.77
47
.05
0.1
20
.11
0.0
80
.12
0.0
9
(c)
Man
ufa
ctu
rin
g4
,23
7.4
5
4,4
47
.98
4,2
65
.40
4,7
08
.38
4,1
79
.91
4,7
23
.33
4,8
61
.09
9.7
29
.37
9.1
38
.48
9.1
7
3. C
on
stru
ctio
n1
,62
5.2
2
1,5
63
.60
1,8
35
.19
1,6
37
.06
1,8
81
.22
1,7
25
.34
2,2
44
.43
4.1
83
.26
4.1
13
.10
4.2
3
4. T
rad
e7
,43
1.1
5
8,2
72
.98
8,5
38
.49
9,4
90
.41
9,7
66
.09
10
,90
9.7
71
0,4
65
.20
19
.45
18
.89
21
.33
19
.58
19
.74
5. S
erv
ice
s1
6,0
92
.79
17
,63
7.0
71
8,2
44
.10
19
,68
8.9
61
9,1
76
.31
22
,13
4.4
72
0,9
82
.13
41
.56
39
.19
41
.89
39
.73
39
.58
(a)
Tra
nsp
ort
55
0.7
16
46
.73
61
4.5
87
46
.49
71
6.3
18
57
.21
82
2.2
01
.40
1.4
91
.56
1.5
41
.55
(b
) In
form
atio
n a
nd
Co
mm
un
icat
ion
4,9
86
.20
4,6
02
.37
5,6
85
.01
5,0
96
.07
5,6
91
.91
5,7
87
.59
6,0
17
.28
12
.95
10
.14
12
.43
10
.39
11
.35
(c)
Uti
litie
s2
79
.71
34
2.2
92
84
.54
35
8.0
0
25
9.4
74
02
.36
33
6.7
70
.65
0.7
10
.57
0.7
20
.64
(d
) A
cco
mm
od
atio
n a
nd
Fo
od
Ser
vice
s3
55
.21
46
4.5
74
24
.48
46
9.1
9
42
6.7
54
98
.32
44
6.5
80
.97
0.9
30
.93
0.8
90
.84
(e)
Fin
ance
& In
sura
nce
1,4
31
.02
1,3
60
.38
1,6
74
.24
1,5
86
.26
1,6
86
.93
1,9
06
.40
1,9
53
.33
3.8
13
.16
3.6
83
.42
3.6
8
(f)
Rea
l Est
ate
3,2
78
.91
4,1
96
.63
3,6
26
.21
4,5
61
.34
3,6
78
.47
4,6
61
.96
3,9
77
.91
8.2
69
.08
8.0
38
.37
7.5
0
(g)
Pro
fess
ion
al, S
cien
tifi
c &
Tec
hn
ical
Ser
vice
s1
,55
8.7
11
,84
2.8
41
,79
9.1
62
,12
8.1
41
,97
9.7
42
,52
8.0
22
,16
7.2
24
.10
4.2
44
.32
4.5
44
.09
(h
) A
dm
inis
trat
ive
and
Su
pp
ort
Ser
vice
s B
uss
ines
s Se
rvic
es9
.24
10
.48
10
.46
11
.79
11
.55
13
.97
12
.63
0.0
20
.02
0.0
30
.03
0.0
2
(i)
Pu
blic
Ad
min
istr
atio
n1
,26
5.9
11
,37
8.3
21
,21
6.6
11
,33
5.8
41
,30
5.8
81
,47
7.9
51
,42
9.0
32
.77
2.6
62
.85
2.6
52
.70
(j)
Ed
uca
tio
n7
38
.40
1,0
66
.01
85
3.4
91
,26
2.8
59
89
.74
1,4
56
.21
1,1
01
.79
1.9
42
.51
2.1
62
.61
2.0
8
(k)
Hu
man
Hea
lth
& S
oci
al S
ervi
ces
29
1.6
23
23
.40
32
2.1
13
60
.58
35
1.5
03
94
.08
38
2.0
00
.73
0.7
20
.77
0.7
10
.72
(l)
Art
s, E
nte
rtai
nm
ent
& R
ecre
atio
n9
0.2
58
6.7
41
09
.93
10
0.4
91
26
.39
11
2.9
91
43
.77
0.2
50
.20
0.2
80
.20
0.2
7
(m
) O
ther
Ser
vice
s1
,25
6.9
01
,31
6.3
11
,62
3.2
71
,67
1.9
31
,95
1.6
82
,03
7.4
12
,19
1.6
23
.70
3.3
34
.26
3.6
64
.13
TOTA
L (G
DP
)4
1,9
04
.61
47
,13
9.0
14
3,9
00
.85
50
,24
4.1
14
5,7
82
.78
55
,70
6.7
15
3,0
14
.36
10
0.0
01
00
.00
10
0.0
01
00
.00
10
0.0
0
NO
N-O
IL (
GD
P)
36
,65
9.2
14
2,7
67
.91
40
,76
3.3
64
7,3
91
.18
43
,93
5.7
35
2,1
86
.44
48
,49
6.2
99
2.8
59
4.3
29
5.9
79
3.6
89
1.4
8
NET
IND
IREC
T TA
XES
ON
PR
OD
UC
TS4
34
.74
65
8.6
34
22
.60
61
0.1
83
89
.98
69
5.9
54
36
.64
TOTA
L G
DP
AT
CU
RR
ENT
MA
RK
ET P
RIC
ES4
2,3
39
.35
47
,79
7.6
44
4,3
23
.45
50
,85
4.2
84
6,1
72
.76
56
,40
2.6
65
3,4
51
.00
TOTA
L G
DP
GR
OW
TH R
ATE
(%
)4
.76
6.5
94
.29
10
.87
15
.80
O
IL G
DP
GR
OW
TH R
ATE
(%
)(4
0.1
9)
(34
.73
)(4
1.1
3)
23
.39
14
4.6
1
N
ON
-OIL
GD
P G
RO
WTH
RA
TE (
%)
11
.20
10
.81
7.7
81
0.1
21
0.3
8
Gro
wth
in T
ota
l GD
P
Ag
ricu
ltu
re (
%)
8.3
49
.41
13
.67
6.9
11
1.2
2
I
nd
ust
ry (
%)
(21
.77
)(1
4.1
3)
(18
.70
)9
.10
55
.51
C
on
stru
ctio
n (
%)
12
.92
4.7
02
.51
5.3
91
9.3
1
T
rad
e (%
)1
4.9
01
4.7
21
4.3
81
4.9
67
.16
S
ervi
ces
(%)
13
.37
11
.63
5.1
11
2.4
29
.42
Sou
rce
: N
atio
na
l Bu
rea
u o
f St
atist
ics
1/
Re
vis
ed
2/
Pro
vis
ion
al
Shar
e o
f To
tal G
DP
(P
er
Ce
nt)
Act
ivit
y Se
cto
r1
st H
alf
20
14
2n
d H
alf
20
14
1st
Hal
f 2
01
52
nd
Hal
f 2
01
51
st H
alf
20
16
1/
2n
d H
alf
20
16
2/
1st
Hal
f 2
01
7 2
/

Table 40Selected Real Sector Indicators
(Per cent, except otherwise indicated)
152
CBN Economic Report for the First Half of 2017
2012 2013 2014 2015 2016 2017 /2
First Half First Half First Half First Half First Half First Half
Agricultural Production Index (2010 = 100)
Aggregate 109.9 112.7 117.9 123.4 126.5
Crops 109.5 111.6 116.3 121.5 124.3
Staples 109.9 112.0 116.6 122.0 124.9
Other Crops 109.7 118.9 124.2 129.5 132.2
Livestock 112.9 120.5 126.6 134.7 139.8
Fishery 112.5 123.3 131.5 140.7 141.5
Forestry 111.7 118.3 125.1 130.5 136.0
Indices of Average World Prices of Nigeria's Major Agricultural
Export Commodities (2010 = 100) (Dollar Based)
All Commodities 80.5 74.7 96.1 92.2 93.6 67.3
Cocoa 73.8 72.1 96.3 95.5 97.0 65.1
Coffee 102.7 75.8 98.3 86.1 78.7 82.2
Cotton 92.0 88.1 90.0 68.1 66.6 82.8
Palm Oil 122.0 89.6 93.6 71.4 71.8 77.5
Copra 114.2 74.2 121.3 99.6 124.9 148.0
Soya Bean 128.2 138.9 134.4 93.0 92.1 93.4
Indices of Average World Prices of Nigeria's Major Agricultural
Export Commodities (2010 = 100) (Naira Based)
All Commodities 84.4 78.2 100.6 117.8 126.4 136.8
Cocoa 77.4 75.5 100.8 122.1 131.1 132.4
Coffee 107.7 79.4 102.9 109.6 106.4 167.1
Cotton 96.5 92.2 94.2 87.1 90.1 168.3
Palm Oil 127.9 93.8 97.9 91.1 96.9 157.6
Copra 119.8 77.6 126.9 127.1 169.0 301.0
Soya Bean 134.5 145.3 140.7 118.7 124.8 189.9
GROWTH RATE OVER THE PRECEDING PERIOD (%)
Agricultural Production Index (2010 = 100)
Aggregate 4.1 2.5 4.6 4.7 3.1
Crops 3.8 1.9 4.2 4.5 3.0
Staples 4.1 1.9 4.1 4.6 3.2
Other Crops 4.0 8.4 4.4 4.3 2.8
Livestock 6.1 6.7 5.1 6.4 3.9
Fishery 6.0 9.6 6.7 7.0 3.3
Forestry 5.9 5.9 5.7 4.3 2.3
Indices of Average World Prices of Nigeria's Major Agricultural
Export Commodities (2010 = 100) (Dollar Based)
All Commodities -25.4 -7.2 28.7 -4.1 1.6 -28.2
Cocoa -28.0 -2.3 33.7 -0.9 1.6 -33.0
Coffee -29.4 -26.1 29.6 -12.5 -8.6 4.4
Cotton -51.1 -4.2 2.2 -24.4 -2.1 24.2
Palm Oil -9.8 -26.5 4.4 -23.7 0.6 7.9
Copra -37.0 -35.0 63.4 -17.9 25.5 18.5
Soya Bean -1.6 8.3 -3.2 -30.8 -1.0 1.4
Indices of Average World Prices of Nigeria's Major Agricultural
Export Commodities (2010 = 100) (Naira Based)
All Commodities -7.4 28.7 17.1 7.3 8.2
Cocoa -2.5 33.6 21.1 7.3 1.0
Coffee -26.3 29.6 6.5 -2.9 57.1
Cotton -4.5 2.2 -7.5 3.5 86.9
Palm Oil -26.6 4.3 -6.9 6.3 62.7
Copra -35.2 63.4 0.2 33.0 78.1
Soya Bean 8.1 -3.2 -15.6 5.2 52.1
Industrial Production Index (2010 = 100)
Industrial Production Index 115.77 114.52 120.58 114.23 107.30
Manufacturing Production Index 133.72 162.99 186.98 182.78 169.80
Mining Production Index 106.78 92.36 91.35 84.69 77.80
Electricity Production Index 181.44 191.95 173.58 138.73 111.10
Capacity Utilization Rate (%) 57.0 57.6 59.3 55.5 51.7
Inflation Rate (12-Month Moving Average) 11.3 10.4 8.0 8.4 11.4 17.6
Inflation Rate (Year-on-Year) 12.9 8.4 8.2 9.2 16.5 16.1
Food Inflation Rate (Year-on-Year) 12.0 9.6 9.8 10.0 15.3 19.9
Non-Food Inflation Rate (Year-on-Year) 12.7 5.5 8.1 8.4 16.2 12.5
1/Revised2/Provisional
Item

Tab
le 4
0 c
on
t'd
Se
lec
ted
Re
al Se
cto
r In
dic
ato
rs(P
er
ce
nt,
ex
ce
pt
oth
erw
ise
in
dic
ate
d)
153
CBN Economic Report for the First Half of 2017
20
17
2/
Firs
t H
alf
Seco
nd
Hal
fFi
rst
Hal
fSe
con
d H
alf
Firs
t H
alf
(1)
(2)
(3)
(1)
& (
3)
(2)
& (
3)
(1)
& (
3)
(2)
& (
3)
Wo
rld
Cru
de
Oil
Pro
du
ctio
n
mill
ion
bar
rels
pe
r d
ay (
mb
d)
OP
EC3
7.5
43
8.4
63
8.8
63
8.9
73
8.4
4-0
.42
-0.5
3-1
.08
-1.3
6
Cru
des
31
.48
32
.26
32
.60
32
.84
32
.21
-0.3
9-0
.63
-1.2
0-1
.92
NG
Ls a
nd
co
nd
ensa
tes
6.0
66
.20
6.2
66
.13
6.2
3-0
.03
0.1
0-0
.48
1.6
3
Tota
l no
n-O
PEC
57
.00
57
.28
57
.13
57
.17
57
.71
0.5
80
.54
1.0
20
.94
Tota
l Wo
rld
Su
pp
ly9
4.5
49
5.7
49
5.9
99
6.1
49
6.1
50
.16
0.0
10
.17
0.0
1
De
man
d
OEC
D4
5.9
34
6.4
44
6.1
34
6.9
94
6.7
30
.60
-0.2
61
.30
-0.5
5
No
n-O
ECD
46
.06
47
.53
47
.04
48
.39
48
.66
1.6
20
.27
3.4
40
.56
Tota
l Wo
rld
De
man
d9
1.9
99
3.9
79
3.1
79
5.3
89
5.3
92
.22
0.0
12
.38
0.0
1
Nig
eri
a
Ou
tpu
t1
.89
1.9
21
.68
1.5
51
.62
-0.0
60
.07
-3.5
74
.52
Exp
ort
s1
.44
1.4
71
.23
1.1
01
.17
-0.0
60
.07
-4.8
86
.36
Do
mes
tic
Co
nsu
mp
tio
n0
.45
0.4
50
.45
0.4
50
.45
0.0
00
.00
0.0
00
.00
Ave
rage
Sp
ot
Pri
ce o
f Se
lect
ed
Cru
de
Oil
at t
he
Inte
rnat
ion
al O
il M
arke
t (U
S$)
UK
Bre
nt
57
.47
46
.89
39
.51
47
.03
51
.23
11
.72
4.2
02
9.6
68
.93
Wes
t Te
xas
Inte
rmed
iate
(W
TI)
52
.40
44
.68
39
.29
45
.17
49
.43
10
.14
4.2
62
5.8
19
.43
Bo
nn
y Li
ght
58
.63
47
.73
40
.51
48
.59
52
.19
11
.68
3.6
02
8.8
37
.41
Forc
ado
s5
8.9
44
7.8
64
0.1
24
7.8
05
1.7
41
1.6
23
.94
28
.96
8.2
4
OP
EC B
aske
t5
5.1
04
4.0
23
6.3
24
5.1
85
0.2
11
3.8
95
.03
38
.24
11
.13
Gas
Act
ivit
ies
0.0
00
.00
(MM
m3)
0.0
00
.00
Gas
Pro
du
ced
40
,43
0.5
9
35
,64
3.4
5
32
,47
2.4
3
35
,64
3.4
5
32
,47
2.4
3
0
.00
-3,1
71
.02
(19
.68
)
(8.9
0)
Tota
l Gas
Uti
lised
34
,23
8.5
83
2,0
75
.79
28
,00
9.6
53
2,0
75
.79
28
,00
9.6
50
.00
-4,0
66
.14
(18
.19
)(1
2.6
8)
Gas
Uti
lised
as
% o
f G
as P
rod
uce
d8
4.6
88
9.9
98
6.2
68
9.9
98
6.2
60
.00
-3.7
31
.86
(4.1
5)
Gas
Fla
red
6,1
92
.01
3,5
25
.43
4,4
62
.79
3,5
25
.43
4,4
62
.79
0.0
09
37
.36
(27
.93
)2
6.5
9
Gas
Fla
red
as
% G
as P
rod
uce
d1
5.3
29
.89
13
.74
9.8
91
3.7
40
.00
3.8
5(1
0.2
4)
38
.92
Ite
m
20
15
1/
Ab
solu
te C
han
ge
Bet
we
en
Pe
rce
nta
ge
Ch
ange
Bet
we
en
20
16
1/
Sou
rce
s: O
PEC
, N
NP
C,
Re
ute
rs &
CB
N E
stim
ate
s1
/ R
ev
ise
d2
/ P
rov
isio
na
l
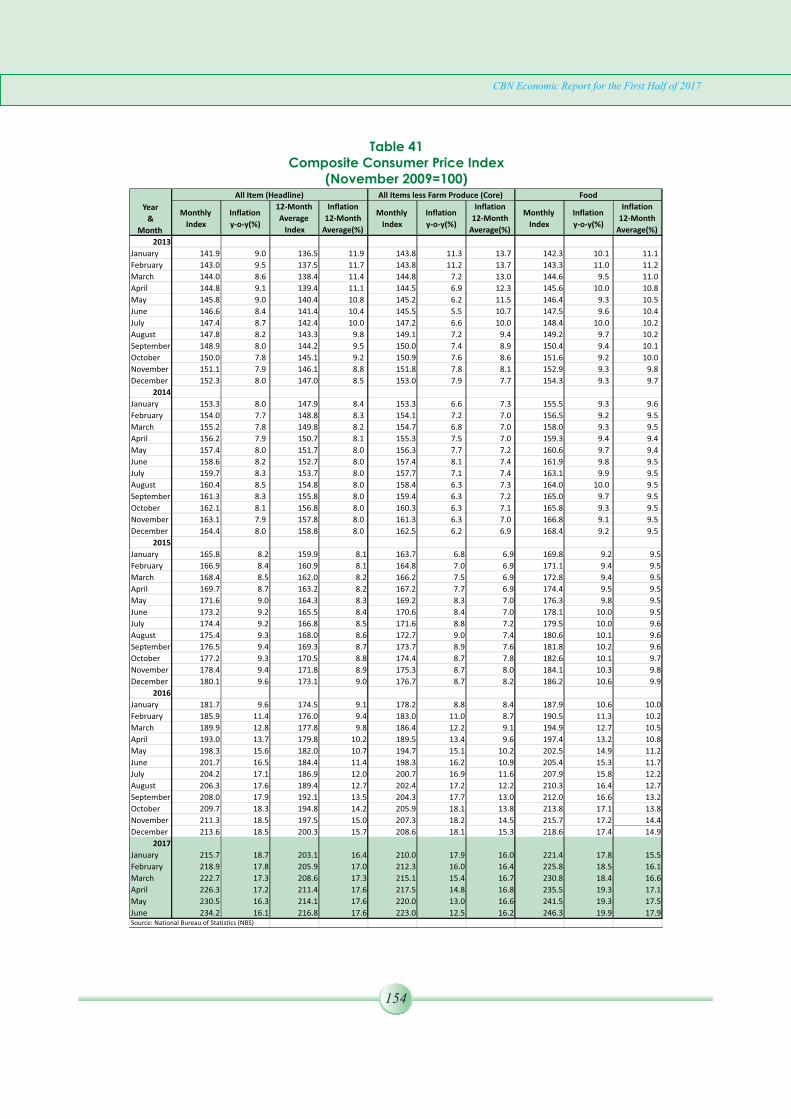
Table 41Composite Consumer Price Index
(November 2009=100)
154
CBN Economic Report for the First Half of 2017
Monthly
Index
Inflation
y-o-y(%)
12-Month
Average
Index
Inflation
12-Month
Average(%)
Monthly
Index
Inflation
y-o-y(%)
Inflation
12-Month
Average(%)
Monthly
Index
Inflation
y-o-y(%)
Inflation
12-Month
Average(%)
2013
January 141.9 9.0 136.5 11.9 143.8 11.3 13.7 142.3 10.1 11.1
February 143.0 9.5 137.5 11.7 143.8 11.2 13.7 143.3 11.0 11.2
March 144.0 8.6 138.4 11.4 144.8 7.2 13.0 144.6 9.5 11.0
April 144.8 9.1 139.4 11.1 144.5 6.9 12.3 145.6 10.0 10.8
May 145.8 9.0 140.4 10.8 145.2 6.2 11.5 146.4 9.3 10.5
June 146.6 8.4 141.4 10.4 145.5 5.5 10.7 147.5 9.6 10.4
July 147.4 8.7 142.4 10.0 147.2 6.6 10.0 148.4 10.0 10.2
August 147.8 8.2 143.3 9.8 149.1 7.2 9.4 149.2 9.7 10.2
September 148.9 8.0 144.2 9.5 150.0 7.4 8.9 150.4 9.4 10.1
October 150.0 7.8 145.1 9.2 150.9 7.6 8.6 151.6 9.2 10.0
November 151.1 7.9 146.1 8.8 151.8 7.8 8.1 152.9 9.3 9.8
December 152.3 8.0 147.0 8.5 153.0 7.9 7.7 154.3 9.3 9.7
2014
January 153.3 8.0 147.9 8.4 153.3 6.6 7.3 155.5 9.3 9.6
February 154.0 7.7 148.8 8.3 154.1 7.2 7.0 156.5 9.2 9.5
March 155.2 7.8 149.8 8.2 154.7 6.8 7.0 158.0 9.3 9.5
April 156.2 7.9 150.7 8.1 155.3 7.5 7.0 159.3 9.4 9.4
May 157.4 8.0 151.7 8.0 156.3 7.7 7.2 160.6 9.7 9.4
June 158.6 8.2 152.7 8.0 157.4 8.1 7.4 161.9 9.8 9.5
July 159.7 8.3 153.7 8.0 157.7 7.1 7.4 163.1 9.9 9.5
August 160.4 8.5 154.8 8.0 158.4 6.3 7.3 164.0 10.0 9.5
September 161.3 8.3 155.8 8.0 159.4 6.3 7.2 165.0 9.7 9.5
October 162.1 8.1 156.8 8.0 160.3 6.3 7.1 165.8 9.3 9.5
November 163.1 7.9 157.8 8.0 161.3 6.3 7.0 166.8 9.1 9.5
December 164.4 8.0 158.8 8.0 162.5 6.2 6.9 168.4 9.2 9.5
2015
January 165.8 8.2 159.9 8.1 163.7 6.8 6.9 169.8 9.2 9.5
February 166.9 8.4 160.9 8.1 164.8 7.0 6.9 171.1 9.4 9.5
March 168.4 8.5 162.0 8.2 166.2 7.5 6.9 172.8 9.4 9.5
April 169.7 8.7 163.2 8.2 167.2 7.7 6.9 174.4 9.5 9.5
May 171.6 9.0 164.3 8.3 169.2 8.3 7.0 176.3 9.8 9.5
June 173.2 9.2 165.5 8.4 170.6 8.4 7.0 178.1 10.0 9.5
July 174.4 9.2 166.8 8.5 171.6 8.8 7.2 179.5 10.0 9.6
August 175.4 9.3 168.0 8.6 172.7 9.0 7.4 180.6 10.1 9.6
September 176.5 9.4 169.3 8.7 173.7 8.9 7.6 181.8 10.2 9.6
October 177.2 9.3 170.5 8.8 174.4 8.7 7.8 182.6 10.1 9.7
November 178.4 9.4 171.8 8.9 175.3 8.7 8.0 184.1 10.3 9.8
December 180.1 9.6 173.1 9.0 176.7 8.7 8.2 186.2 10.6 9.9
2016
January 181.7 9.6 174.5 9.1 178.2 8.8 8.4 187.9 10.6 10.0
February 185.9 11.4 176.0 9.4 183.0 11.0 8.7 190.5 11.3 10.2
March 189.9 12.8 177.8 9.8 186.4 12.2 9.1 194.9 12.7 10.5
April 193.0 13.7 179.8 10.2 189.5 13.4 9.6 197.4 13.2 10.8
May 198.3 15.6 182.0 10.7 194.7 15.1 10.2 202.5 14.9 11.2
June 201.7 16.5 184.4 11.4 198.3 16.2 10.9 205.4 15.3 11.7
July 204.2 17.1 186.9 12.0 200.7 16.9 11.6 207.9 15.8 12.2
August 206.3 17.6 189.4 12.7 202.4 17.2 12.2 210.3 16.4 12.7
September 208.0 17.9 192.1 13.5 204.3 17.7 13.0 212.0 16.6 13.2
October 209.7 18.3 194.8 14.2 205.9 18.1 13.8 213.8 17.1 13.8
November 211.3 18.5 197.5 15.0 207.3 18.2 14.5 215.7 17.2 14.4
December 213.6 18.5 200.3 15.7 208.6 18.1 15.3 218.6 17.4 14.9
2017
January 215.7 18.7 203.1 16.4 210.0 17.9 16.0 221.4 17.8 15.5
February 218.9 17.8 205.9 17.0 212.3 16.0 16.4 225.8 18.5 16.1
March 222.7 17.3 208.6 17.3 215.1 15.4 16.7 230.8 18.4 16.6
April 226.3 17.2 211.4 17.6 217.5 14.8 16.8 235.5 19.3 17.1
May 230.5 16.3 214.1 17.6 220.0 13.0 16.6 241.5 19.3 17.5
June 234.2 16.1 216.8 17.6 223.0 12.5 16.2 246.3 19.9 17.9Source: National Bureau of Statistics (NBS)
Year
&
Month
All Item (Headline) All Items less Farm Produce (Core) Food

Table 42Urban and Rural Consumer Price Index
(November 2009=100)
155
CBN Economic Report for the First Half of 2017
All Items
(Headline)
Monthly Index
Headline
Inflation
y-o-y(%)
All Items less Farm
Produce (Core)
Monthly Index
Core
Inflation
y-o-y(%)
Food
Monthly
Index
Food
Inflation
y-o-y(%)
All Items
(Headline)
Monthly Index
Headline
Inflation
y-o-y(%)
All Items less Farm
Produce (Core)
Monthly Index
Core
Inflation
y-o-y(%)
Food
Monthly
Index
Food
Inflation
y-o-y(%)
2013
January 140.8 9.2 142.3 11.0 138.6 10.5 143.2 9.1 144.9 11.6 145.7 10.0
February 142.0 9.8 142.3 10.9 139.9 10.8 144.1 9.5 144.9 11.5 146.4 11.1
March 142.8 9.3 142.0 7.1 140.7 9.0 145.3 8.1 147.1 7.2 148.2 9.9
April 143.7 9.7 142.6 7.2 142.0 9.7 146.4 8.9 146.5 6.9 149.2 10.5
May 144.5 9.4 142.7 6.5 142.7 8.9 147.1 8.6 147.2 6.0 149.8 9.7
June 145.5 8.4 143.1 5.4 143.9 9.5 147.9 8.3 147.6 5.6 150.8 9.7
July 146.3 8.8 145.4 7.3 145.0 10.1 148.6 8.6 148.8 6.0 151.7 10.0
August 146.8 8.4 147.7 8.0 145.8 10.0 148.9 8.1 150.2 6.6 152.3 9.5
September 147.9 8.0 147.7 7.3 147.1 9.6 150.0 8.0 151.9 7.5 153.6 9.3
October 149.1 7.9 148.6 7.5 148.3 9.6 151.1 7.8 152.8 7.7 154.8 9.0
November 150.2 8.1 149.4 7.6 149.6 9.8 152.2 7.8 153.8 7.9 156.0 8.9
December 151.4 8.1 150.4 7.6 151.0 9.8 153.3 7.9 155.2 8.1 157.4 8.9
2014
January 152.2 8.2 150.7 5.8 152.3 9.8 154.4 7.8 155.5 7.3 158.6 8.8
February 153.0 7.8 151.6 6.5 153.2 9.5 155.1 7.7 156.1 7.7 159.5 9.0
March 154.2 7.9 152.1 7.1 154.7 10.0 156.4 7.6 156.8 6.6 161.2 8.7
April 155.1 7.9 152.6 7.0 156.1 9.9 157.3 7.5 157.6 7.5 162.3 8.8
May 156.4 8.2 153.6 7.7 157.4 10.3 158.5 7.8 158.6 7.7 163.6 9.2
June 157.6 8.4 154.6 8.0 158.8 10.3 159.7 8.0 159.7 8.2 164.9 9.3
July 158.7 8.5 155.3 6.8 160.1 10.4 160.7 8.1 159.8 7.4 166.0 9.4
August 159.5 8.67 156.1 5.7 161.1 10.5 161.4 8.37 160.3 6.7 166.8 9.5
September 160.3 8.36 156.9 6.2 162.0 10.1 162.4 8.24 161.5 6.3 167.9 9.3
October 161.1 8.06 157.9 6.2 162.7 9.7 163.3 8.02 162.4 6.3 168.8 9.0
November 162.1 7.90 158.8 6.3 163.8 9.5 164.2 7.90 163.3 6.2 169.7 8.8
December 163.4 7.95 160.1 6.4 165.4 9.5 165.5 7.96 164.6 6.1 171.2 8.8
2015
January 164.7 8.2 161.2 7.0 166.9 9.6 166.9 8.09 165.8 6.6 172.7 8.9
February 165.9 8.4 162.4 7.1 168.2 9.8 168.0 8.29 166.9 6.9 173.9 9.0
March 167.4 8.6 163.7 7.6 169.9 9.8 169.5 8.40 168.3 7.3 175.6 9.0
April 168.7 8.7 164.7 7.9 171.6 9.9 170.8 8.56 169.3 7.4 177.1 9.1
May 170.6 9.1 166.8 8.6 173.5 10.3 172.6 8.90 171.2 8.0 178.9 9.4
June 172.2 9.2 168.2 8.8 175.4 10.5 174.2 9.10 172.6 8.1 180.8 9.7
July 173.3 9.2 169.2 9.0 176.7 10.4 175.5 9.24 173.7 8.7 182.2 9.8
August 174.3 9.2 170.2 9.0 177.8 10.4 176.6 9.38 174.8 9.0 183.3 9.9
September 175.5 9.5 171.3 9.2 179.2 10.6 177.5 9.30 175.7 8.7 184.3 9.8
October 176.2 9.4 172.0 8.9 180.1 10.7 178.2 9.16 176.4 8.6 185.1 9.7
November 177.4 9.4 172.8 8.8 181.5 10.8 179.4 9.26 177.4 8.7 186.5 9.9
December 179.2 9.7 174.3 8.9 183.8 11.1 181.1 9.41 178.7 8.6 188.6 10.1
2016
January 180.8 9.7 175.8 9.1 185.5 11.1 182.7 9.48 180.2 8.7 190.3 10.2
February 186.2 12.3 181.2 11.6 187.8 11.7 186.0 10.69 184.6 10.6 193.2 11.1
March 190.0 13.5 184.6 12.8 192.1 13.1 189.9 12.04 188.0 11.7 197.5 12.5
April 194.1 15.1 188.0 14.1 194.3 13.2 192.6 12.77 190.8 12.7 200.3 13.1
May 199.8 17.1 193.3 15.9 199.8 15.2 197.4 14.35 195.9 14.4 205.0 14.5
June 203.4 18.1 197.0 17.1 203.0 15.8 200.5 15.09 199.3 15.5 207.6 14.9
July 206.1 18.9 199.7 18.1 205.7 16.4 202.8 15.5 201.5 16.0 209.9 15.2
August 208.0 19.3 201.4 18.4 207.7 16.8 205.0 16.1 203.2 16.3 212.7 16.0
September 209.6 19.5 203.6 18.9 209.4 16.9 206.7 16.4 205.0 16.7 214.4 16.3
October 211.3 19.9 205.1 19.3 211.3 17.3 208.4 16.9 206.5 17.1 216.2 16.8
November 213.0 20.1 206.7 19.6 213.2 17.4 210.1 17.1 207.8 17.1 218.0 16.9
December 215.3 20.1 208.5 19.6 216.2 17.6 212.2 17.2 208.7 16.8 220.8 17.1
2017
January 217.5 20.3 210.0 19.5 219.1 18.1 214.4 17.3 210.0 16.6 223.6 17.5
February 220.8 18.6 212.7 17.4 223.6 19.0 217.5 17.0 212.1 14.9 228.0 18.0
March 224.7 18.3 215.7 16.9 228.8 19.1 221.2 16.5 214.6 14.2 232.8 17.8
April 228.3 17.6 217.9 15.9 233.6 20.2 224.7 16.7 217.1 13.8 237.4 18.5
May 232.5 16.3 220.5 14.1 239.7 19.9 229.0 16.0 219.7 12.1 243.3 18.7
June 236.2 16.2 223.7 13.6 244.6 20.5 232.6 16.0 222.4 11.5 248.0 19.4Source: National Bureau of Statistics (NBS)
Year
&
Month
Urban Rural

Table 43Balance of Payments Analytic Presentation
(US$ Million
156
CBN Economic Report for the First Half of 2017
1st Half 2016 1/ 2nd Half 2016 2/ 1st Half 2017 2/
CURRENT ACCOUNT -576.56 3,298.54 4,147.40
Goods -2,675.15 2,139.09 4,386.28
Exports (fob) 16,865.39 17,838.51 20,771.12
Oil and Gas 15,344.74 16,684.30 18,826.24
Non-oil 1,520.65 1,154.21 1,944.88
Imports (fob) -19,540.54 -15,699.41 -16,384.84
Oil -4,533.21 -4,417.21 -4,506.46
Non-oil -15,007.33 -11,282.20 -11,878.38
Unrecorded(TPAdj) 0.00 0.00 0.00
Services(net) -3,764.55 -4,250.11 -5,370.50
Credit 2,060.45 1,683.20 1,918.89
Transportation 890.24 774.26 761.59
Travel 677.30 393.00 616.92
Insurance Services 35.16 44.45 10.75
Communication Services 62.11 55.54 136.04
Construction Services 0.00 0.00 0.00
Financial Services 107.61 140.49 124.89
Computer & information Services 0.00 0.00 0.00
Royalties and License Fees 0.00 0.00 0.00
Government Services 249.71 249.10 241.75
Personal, cultural & recreational services 0.00 0.00 0.00
Other Bussiness Services 38.32 26.36 26.94
Debit -5,825.00 -5,933.31 -7,289.39
Transportation -3,092.03 -2,836.01 -2,742.50
Travel -593.93 -485.18 -1,832.25
Insurance Services -383.90 -310.49 -502.35
Communication Services -125.13 -72.15 -108.08
Construction Services -0.26 0.00 -0.12
Financial Services -131.24 -236.99 -174.98
Computer & information Services -69.87 -78.85 -104.15
Royalties and License Fees -126.42 -126.42 -126.42
Government Services -234.92 -178.45 -132.67
Personal, cultural & recreational services -9.28 -6.63 -39.39
Other Bussiness Services -1,058.03 -1,602.13 -1,526.48
Income(net) -4,111.13 -4,505.33 -5,061.47
Credit 625.46 625.28 817.38
Investment Income 537.41 522.04 705.19
Compensation of employees 88.04 103.25 112.20
Debit -4,736.58 -5,130.62 -5,878.85
Investment Income -4,730.67 -5,124.97 -5,878.85
Compensation of employees -5.91 -5.65 0.00
Current transfers(net) 9,974.27 9,914.90 10,193.09
Credit 10,523.93 10,418.72 10,553.32
General Government 1,191.08 215.89 189.64
Other Sectors 9,332.85 10,202.84 10,363.68
Workers Remittance 9,323.15 10,183.49 10,340.08
Debit -549.66 -503.83 -360.23
General Government 0.00 -7.63 0.00
Other Sectors -549.66 -496.20 -360.23
Workers Remittance -364.36 -368.85 -236.08
CAPITAL AND FINANCIAL ACCOUNT -174.11 1,825.10 5,699.45
Capital account(net) 0.00 0.00 0.00
Credit 0.00 0.00 0.00
Capital Transfers(Debt Forgiveness) 0.00 0.00 0.00
Debit 0.00 0.00 0.00
Capital Transfers 0.00 0.00 0.00
Financial account(net) -174.11 1,825.10 5,699.45
Assets -2,514.81 -1,064.27 -4,763.83
Direct investment (Abroad) -608.97 -696.06 -642.40
Portfolio investment -129.92 -47.50 -1.66
Other investment -3,330.01 252.58 -845.12
Change in Reserve 1,554.09 -573.28 -3,274.65
Liabilities 2,340.70 2,889.36 10,463.27
Direct Invesment in reporting economy 1,793.30 2,655.43 1,745.12
Portfolio Investment 790.24 1,097.44 2,922.77
Other investment liabilities -242.85 -863.51 5,795.38
NET ERRORS AND OMISSIONS 750.67 -5,123.64 -9,846.84
Memorandum Items: 1st Half 2016 1/ 2nd Half 2016 2/ 1st Half 2017 2/
Current Account Balance as % of G.D.P -0.29 1.78 2.37
Capital and Financial Account Balance as % of G.D.P 0.12 0.97 3.25
Overall Balance as % of G.D.P -0.68 0.32 1.87
External Reserves - Stock (US $ million) 26,505.50 26,990.58 30,340.96
Number of Months of Imports Equivalent 8.14 10.32 11.11
External Debt Stock (US$ million) 11,261.89 11,406.28 15,047.01
Debt Service Due as % of Exports of Goods Non Factor Services
Effective Central Exchange Rate (N/$) 202.29 303.69 305.20
Average Exchange Rate (N/$) 202.79 304.19 305.70
End-Period Exchange Rate (N/$) 283.00 305.00 305.90
Source: Central Bank of Nigeria1/ Revised2/ Provisional

Table 44Balance of Payments Analytic Presentation
(N' Million)
157
CBN Economic Report for the First Half of 2017
1st Half 2016 1/ 2nd Half 2016 2/ 1st Half 2017 2/
CURRENT ACCOUNT -134,155.41 1,005,123.54 1,265,774.32
Goods -548,034.80 651,967.35 1,338,732.94
Exports (fob) 3,426,498.36 5,424,191.36 6,339,612.00
Oil and Gas 3,115,986.89 5,073,181.09 5,745,989.51
Non-oil 310,511.46 351,010.27 593,622.50
Imports (fob) -3,974,533.16 -4,772,224.02 -5,000,879.06
Oil -922,303.64 -1,342,664.89 -1,375,409.45
Non-oil -3,052,229.52 -3,429,559.13 -3,625,469.61
Unrecorded(TPAdj) 0.00 0.00 0.00
Services(net) -763,421.17 -1,291,633.35 -1,639,191.99
Credit 416,336.04 511,747.53 585,671.15
Transportation 179,239.58 235,337.32 232,446.59
Travel 137,329.79 119,508.50 188,294.04
Insurance Services 7,237.59 13,523.18 3,282.36
Communication Services 12,356.27 16,898.72 41,521.46
Construction Services 0.00 0.00 0.00
Financial Services 21,780.34 42,742.13 38,119.50
Computer & information Services 0.00 0.00 0.00
Royalties and License Fees 0.00 0.00 0.00
Government Services 50,576.77 75,723.71 73,784.84
Personal, cultural & recreational services 0.00 0.00 0.00
Other Bussiness Services 7,815.70 8,013.98 8,222.36
Debit -1,179,757.21 -1,803,380.88 -2,224,863.14
Transportation -626,795.57 -862,105.52 -837,045.24
Travel -120,507.28 -147,403.34 -559,261.44
Insurance Services -77,844.30 -94,490.72 -153,323.60
Communication Services -24,850.25 -21,931.90 -32,985.41
Construction Services -54.00 -1.28 -36.02
Financial Services -26,500.33 -72,107.09 -53,405.86
Computer & information Services -14,187.93 -23,963.57 -31,789.78
Royalties and License Fees -25,608.83 -38,430.74 -38,584.79
Government Services -47,553.11 -54,222.58 -40,491.68
Personal, cultural & recreational services -1,882.02 -2,015.14 -12,023.65
Other Bussiness Services -213,973.59 -486,708.98 -465,915.67
Income(net) -835,338.31 -1,369,758.94 -1,544,838.06
Credit 126,222.58 190,144.74 249,479.18
Investment Income 108,362.24 158,756.39 215,235.32
Compensation of employees 17,860.34 31,388.35 34,243.87
Debit -961,560.89 -1,559,903.69 -1,794,317.24
Investment Income -960,366.92 -1,558,184.80 -1,794,317.24
Compensation of employees -1,193.97 -1,718.88 0.00
Current transfers(net) 2,012,638.88 3,014,548.49 3,111,071.42
Credit 2,124,012.18 3,167,722.11 3,221,012.46
General Government 235,294.11 65,629.21 57,879.42
Other Sectors 1,888,718.07 3,102,092.90 3,163,133.04
Workers Remittance 1,886,757.94 3,096,213.04 3,155,929.36
Debit -111,373.30 -153,173.62 -109,941.03
General Government 0.00 -2,312.82 0.00
Other Sectors -111,373.30 -150,860.81 -109,941.03
Workers Remittance -73,753.58 -112,126.29 -72,049.67
CAPITAL AND FINANCIAL ACCOUNT 57,010.71 545,221.79 1,739,662.60
Capital account(net) 0.00 0.00 0.00
Credit 0.00 0.00 0.00
Capital Transfers(Debt Forgiveness) 0.00 0.00 0.00
Debit 0.00 0.00 0.00
Capital Transfers 0.00 0.00 0.00
Financial account(net) 57,010.71 545,221.79 1,739,662.60
Assets -410,967.44 -328,905.34 -1,453,832.17
Direct investment (Abroad) -123,261.96 -211,568.19 -196,066.93
Portfolio investment -26,273.49 -14,405.81 -506.08
Other investment -576,713.47 75,588.09 -257,916.43
Change in Reserve 315,281.48 -178,519.43 -999,342.73
Liabilities 467,978.15 874,127.13 3,193,494.77
Direct Invesment in reporting economy 363,381.59 807,147.87 532,632.03
Portfolio Investment 162,119.57 333,264.43 892,064.64
Other investment liabilities -57,523.02 -266,285.17 1,768,798.10
NET ERRORS AND OMISSIONS 77,144.70 -1,550,345.33 -3,005,436.92
Memorandum Items: 1st Half 2016 1/ 2nd Half 2016 2/ 1st Half 2017 2/
Current Account Balance as % of G.D.P -0.29 1.78 2.37
Capital and Financial Account Balance as % of G.D.P 0.12 0.97 3.25
Overall Balance as % of G.D.P -0.68 0.32 1.87
External Reserves - Stock (US $ million) 26,505.50 26,990.58 30,340.96
Number of Months of Imports Equivalent 8.14 10.32 11.11
External Debt Stock (US$ million) 11,261.89 11,406.28 15,047.01
Debt Service Due as % of Exports of Goods Non Factor Services
Effective Central Exchange Rate (N/$) 202.29 303.69 305.20
Average Exchange Rate (N/$) 202.79 304.19 305.70
End-Period Exchange Rate (N/$) 283.00 305.00 305.90
Source: Central Bank of Nigeria1/ Revised2/ Provisional

Table 45Foreign Exchange Flows Through the Economy
(US$ Million)
158
CBN Economic Report for the First Half of 2017
1st Half 1st Half 1st Half 1st Half 2nd Half 1st Half
CATEGORY 2013 2014 2015 2016 /2 2016 /3 2017 /3
INFLOW 72,277.13 75,643.39 52,124.57 29,154.54 33,594.01 34,816.93
A. Through the Central Bank 19,747.39 22,888.76 15,283.04 8,713.12 12,353.07 15,871.01
1. Oil 18,971.59 21,027.88 9,237.67 4,613.69 5,566.80 4,299.49
2.Non-oil 775.80 1,860.88 6,045.36 4,099.43 6,786.27 11,571.51
(i) Drawings on Loans/Grants - - - 0.00 0.00
(ii) RDAS/WDAS Purchases 20.00 270.00 645.04 30.00 106.33 1,163.81
(iii) Swaps - 500.00 4,060.00 1,850.00 2,305.02 1,567.00
(iv) Interest on Reserves & Investments 30.32 79.07 70.41 120.19 100.86 138.82
(v) Interest Repatriated from Overseas 0.29 0.12 0.24 0.15 0.08 0.00
(vi) Refund on World Bank/IBRD/IMF Loans/SDR Allocation - - - 0.00 0.00 0.00
(vii) Cash Swap IRO BDC Sales 0.00 48.70 10.00
(vii) Eurobond Proceeds - Fixed Income Securities 7.40 1.34 0.00 7.75 0.00
(viii) Returned Payments [Wired/Cash] 11.21 10.56 194.71 92.71 753.67
(ix) Unutilised funds from DAS 134.02 94.00 49.97 92.13 644.73
(x) Recovered Funds 226.39 0.00 0.00 0.00
(xi) Other Official Receipts 725.19 632.67 1,163.78 1,854.40 3,938.14 864.88
(xii) CBN Interbank Transactions 0.00 0.00 0.00
(xiiii) Return of Unutilised IMTO Funds 0.00 94.55 310.09
(xv) TSA and Third Party Funds 1,498.09
(xvi) Others (FGN Loans) 4,620.42
B. Through Autonomous Sources 52,529.74
52,754.63
36,841.53
20,441.42 21,240.94 18,945.92
1. Non-Oil Exports 1,898.23
3,650.25
2,431.21
1,592.34 1,706.13 1,910.83
2. Capital Inflow 151.82
271.85
41.17
58.78 273.03 33.80
3. Invisibles 50,479.70
48,832.53
34,369.15
18,790.30 19,261.78 17,001.29
(a) Ordinary Domiciliary Accounts 11,959.46 12,174.88 9,994.31
(b) Total OTC Purchases 6,830.83 7,086.90 7,006.99
(i) Oil Companies 3,328.12 1,690.19 897.39
(ii) Capital Importations 1,738.94 3,373.25 2,817.11
(iii) Home Remittances 152.73 268.08 389.50
(iv) Other OTC Purchases 1,611.04 1,755.38 2,902.98
OUTFLOW 18,964.82
29,092.93
21,837.26
11,880.58 13,673.02 13,879.61
A. Through the Central Bank 18,763.71
28,501.99
21,070.35
10,742.85 12,421.35 12,775.68
1. WDAS/RDAS Utilisation 15,440.47
25,172.86
18,273.40
7,805.33 8,013.01 9,835.84
(i) WDAS/RDAS Sales 10,711.04 17,233.85 3,184.55 0.00 0.00 0.00
(ii) WDAS Forward/Inter-Bank FWD -
1,075.86
1,339.82
0.00 4,167.66 4,426.20
(iii) BDC Sales 2,263.61
3,518.15
1,825.41
15.49 42.93 1,198.98
(iv) Inter-bank Sales 2,461.50
3,345.00
9,673.62
5,599.84 704.76 4,011.98
(v) Swaps 4.33
-
2,250.00
2,190.00 3,097.65 198.68
(vi) Invisibles IFEM -
-
-
0.00 0.00 0.00
2. Drawings on L/C 204.13
194.70
142.62
57.13 92.63 184.66
3. External Debt Service 150.09
178.18
207.16
166.11 185.03 189.83
(i) Principal 94.35
95.88
90.99
84.45 0.00 0.00
(ii) Interest 5.25
5.21
-
0.00 0.00 0.00
(iii) Others 1/ 50.49
77.09
116.17
81.67 185.03 189.83
4. Professional Fees/Commission -
-
0.00 0.00 0.00
5. Govt and Int'l Grants / Contributions, Grants & Equity Invests. (AFC Equity Participation)-
135.55
-
0.00 0.00 29.99
6. National Independent Priority Projects (Niger-Delta Payments) 33.33
42.52
91.00
21.58 3.58 0.61
7. Forex Special Payment (NSA) (Cash Swap/FX Advance/To MDAs) 0.00 252.74 57.48
8. Other Official Payments 2,885.14 2,427.90 1,847.36 1,699.91 2,675.48 1,473.57
(i) Int'l Organisations & Embassies /4 308.03 176.51 290.44 118.19 50.89
(ii) Estacode 57.62 106.26 522.96 38.56 87.72 29.55
(iii) Parastatals (Public Sector Uses) 545.56 458.29 120.20 278.77 585.51 581.35
(iv) NNPC/JVC (JVC) Cash Calls 1,932.07 1,564.81 892.52 1,155.09 1,847.41 862.67
(v) Miscellaneous (CBN Uses) 41.85 122.02 21.24 109.30 103.93
9. Bank Charges 0.55 0.05 0.04 0.09 0.43 4.72
10. NSIA Transfer 50.00 - - 0.00 0.00
11. Funds Returned to Remitters 0.23 45.96 10.04 79.93 23.38
12. 3rd Party MDA Transfer 350.00 462.79 982.65 1,118.53 975.60
B. Through Autonomous Sources 201.11 590.94 766.92 1,137.74 1,251.67 1,103.93
1. Imports 179.91 577.23 385.05 326.18 394.19 319.12
2. Invisibles 21.21 13.71 381.87 811.56 857.48 784.81
NETFLOW THROUGH THE CBN 983.68 (5,613.23) (5,787.31) -2,029.72 -68.28 3,095.32
NETFLOW 53,312.31 46,550.46 30,287.31 17,273.96 19,920.99 20,937.32
Source: Central Bank of Nigeria
1/ Includes penalty and service charges
2/ Revised
3/ Provisional
4/ Includes IMF (SDR charges)

Table 46Nigeria's Gross External Reserves
(US$ Million)
159
CBN Economic Report for the First Half of 2017
Month 2013 2014 2015 2016 2017
January 45,824.44
40,667.56
32,385.71
27,607.85
28,592.98
February 47,295.85
36,923.61
29,566.99
27,811.82
29,990.36
March 47,884.12
37,399.22
29,357.21
27,336.38
29,996.38
April 47,903.09
37,105.27
29,829.75
26,598.85
30,749.28
May 47,702.88
35,398.10
28,566.54
26,594.39
29,811.85
June 44,957.00 37,330.03 28,335.21 26,505.50 30,340.96
July 45,834.11
39,065.42
31,222.81
25,581.58
August 45,428.84
38,705.71
30,637.17
25,031.93
September 44,108.48
38,278.62
29,880.21
23,806.51
October 44,155.11
36,280.25
30,336.36
23,689.87
November 43,414.20
35,248.66
29,263.02
25,081.22
December 42,847.31
34,241.54
28,284.82
26,990.58
Source: Central Bank of Nigeria

Table 47Nigeria's Foreign Exchange Cross Rates
Naira per Unit of Foreign Currency (Monthly Average)
160
CBN Economic Report for the First Half of 2017
2013 Pounds Euro CFAFr US$ (DAS/WDAS) US$ (BDC)
Jan 248.72 206.97 0.31 157.30 159.12
Feb 241.10 208.16 0.32 157.30 158.70
Mar 234.75 201.95 0.31 157.31 159.80
Apr 238.49 202.88 0.31 157.31 159.81
May 238.34 202.34 0.31 157.30 159.57
Jun 241.11 205.47 0.31 157.31 160.98
1st Half Average 240.42 204.63 0.31 157.30 159.66
Jul 236.40 203.77 0.31 157.32 162.43
Aug 241.35 207.23 0.31 157.31 162.28
Sep 246.97 207.95 0.32 157.32 163.14
Oct 250.86 212.74 0.32 157.42 165.00
Nov 250.76 210.17 0.32 157.27 167.14
Dec 255.13 213.41 0.32 157.27 171.40
2nd Half Average 246.91 209.21 0.32 157.32 165.23
2014 Pounds Euro CFAFr US$ (DAS/WDAS) US$ (BDC)
Jan 256.59 212.10 0.32 157.29 171.71
Feb 257.81 212.72 0.32 157.31 169.45
Mar 258.95 215.39 0.33 157.30 171.52
Apr 260.67 215.14 0.33 157.29 170.30
May 262.41 213.98 0.33 157.29 166.85
Jun 263.29 211.68 0.32 157.29 167.17
1st Half Average 259.95 213.50 0.32 157.29 169.50
Jul 265.93 211.24 0.32 157.29 167.71
Aug 260.12 207.41 0.32 157.29 170.36
Sep 254.06 201.00 0.31 157.30 168.64
Oct 250.27 197.63 0.30 157.31 169.43
Nov 249.96 197.60 0.30 160.00 175.85
Dec 262.86 207.16 0.32 169.68 188.45
2nd Half Average 257.20 203.67 0.31 159.81 173.41
2015 Pounds Euro CFAFr US$ (RDAS/IFEM) US$ (BDC)
Jan 254.39 194.85 0.30 169.68 196.13
Feb 274.79 204.78 0.31 178.54 213.03
Mar 295.20 213.64 0.32 197.07 222.93
Apr 294.73 212.54 0.32 197.00 210.70
May 304.79 219.85 0.34 197.00 219.55
Jun 306.37 220.74 0.34 196.92 218.98
1st Half Average 288.38 211.07 0.32 189.37 213.55
Jul 306.41 216.87 0.33 196.97 237.15
Aug 307.21 219.33 0.33 197.00 216.64
Sep 302.55 221.22 0.34 197.00 222.68
Oct 302.26 221.45 0.34 196.99 224.98
Nov 299.38 211.53 0.32 196.99 232.40
Dec 295.39 214.00 0.32 196.99 258.30
2nd Half Average 302.20 217.40 0.33 196.99 232.02
2016 Pounds Euro CFAFr US$ (IFEM) US$ (BDC)
Jan 283.62 214.09 0.33 197.00 289.78
Feb 281.79 218.55 0.33 197.00 329.83
Mar 280.40 218.89 0.33 197.00 320.93
Apr 282.07 223.46 0.34 197.00 320.71
May 286.33 222.85 0.34 197.00 336.93
Jun 328.53 260.03 0.38 231.76 351.82
1st Half Average 290.46 226.31 0.34 202.79 325.00
Jul 388.37 325.90 0.49 294.57 364.47
Aug 406.13 347.33 0.53 309.73 396.15
Sep 401.08 342.17 0.52 305.23 431.10
Oct 375.71 336.21 0.51 305.21 462.03
Nov 379.49 329.83 0.50 305.18 415.36
Dec 381.39 322.13 0.47 305.22 455.26
2nd Half Average 388.70 333.93 0.50 304.19 420.73
2017 Pounds Euro CFAFr US$ (IFEM) US$ (BDC)
Jan 376.32 324.37 0.49 305.20 493.29
Feb 381.17 324.95 0.50 305.31 494.70
Mar 378.13 327.35 0.50 306.40 429.48
Apr 386.92 328.15 0.50 306.05 392.89
May 395.04 337.72 0.51 305.54 384.48
Jun 391.57 343.24 0.52 305.72 366.25
1st Half Average 384.86 330.96 0.50 305.70 426.85
Source: Central Bank of Nigeria
Note: The Interbank exchange rate became the reference official rate on February 18, 2015 when the RDAS segment of the FOREX market was closed by the CBN.

Table 48Monthly Average Exchange Rate Movements
(N/US$ 1.00)
161
CBN Economic Report for the First Half of 2017
2013 W/RDAS Interbank BDC
Jan 157.30 156.96 159.12
Feb 157.30 157.52 158.70
Mar 157.31 158.38 159.80
Apr 157.31 158.20 159.81
May 157.30 158.02 159.57
Jun 157.31 160.02 160.98
1st Half 157.30 158.18 159.66
End-Period 157.31 162.60 162.00
Jul 157.32 161.12 162.43
Aug 157.31 161.15 162.28
Sep 157.32 161.96 163.14
Oct 157.42 159.83 165.00
Nov 157.27 158.79 167.14
Dec 157.27 159.05 171.40
2nd Half 157.32 160.32 165.23
End-Period 157.26 159.90 172.00
2014 W/RDAS Interbank BDC
Jan 157.29 160.23 171.71
Feb 157.31 163.62 169.45
Mar 157.30 164.62 171.52
Apr 157.29 162.19 170.30
May 157.29 161.86 166.85
Jun 157.29 162.82 167.17
1st Half 157.29 162.56 169.50
End-Period 157.29 162.95 168.00
Jul 157.29 162.25 167.71
Aug 157.29 161.99 170.36
Sep 157.30 162.93 168.64
Oct 157.31 164.64 169.43
Nov 160.00 171.10 175.85
Dec 169.68 180.33 188.45
2nd Half 159.81 167.21 173.41
End-Period 169.68 180.00 191.50
2015 RDAS Interbank BDC
Jan 169.68 181.78 196.13
Feb 169.68 194.48 213.03
Mar Closed 197.07 222.93
Apr Closed 197.00 210.70
May Closed 197.00 219.55
Jun Closed 196.92 218.98
1st Half Closed 194.04 213.55
End-Period Closed 196.95 225.50
Jul Closed 196.97 237.15
Aug Closed 197.00 216.64
Sep Closed 197.00 222.68
Oct Closed 196.99 224.98
Nov Closed 196.99 232.40
Dec Closed 196.99 258.30
2nd Half Closed 196.99 232.02
End-Period Closed 197.00 267.00
2016 RDAS Interbank BDC
Jan Closed 197.00 289.78
Feb Closed 197.00 329.83
Mar Closed 197.00 320.93
Apr Closed 197.00 320.71
May Closed 197.00 336.93
Jun Closed 231.76 351.82
1st Half Closed 202.79 325.00
End-Period Closed 283.00 348.00
Jul Closed 294.57 364.47
Aug Closed 309.73 396.15
Sep Closed 305.23 431.10
Oct Closed 305.21 462.03
Nov Closed 305.18 415.36
Dec Closed 305.22 455.26
2nd Half Closed 304.19 420.73
End-Period Closed 305.00 490.00
2017 RDAS Interbank BDC
Jan Closed 305.20 493.29
Feb Closed 305.31 494.70
Mar Closed 306.40 429.48
Apr Closed 306.05 392.89
May Closed 305.54 384.48
Jun Closed 305.72 366.25
1st Half Closed 305.90 366.00
End-Period Closed 305.72 366.25
Source: Central Bank of Nigeria
CBN closed the RDAS segment of the FOREX market on February 18, 2015.

Tab
le 4
9D
em
an
d a
nd
Su
pp
ly o
f Fo
reig
n E
xc
ha
ng
e(U
S$
Mill
ion
)
162
CBN Economic Report for the First Half of 2017
Year
/Mon
th
RDAS
BD
CRD
AS -
RDAS
BD
CRD
AS -
Dem
and
Dem
and
Forw
ard
Dem
and
Dem
and
Dem
and
Forw
ard
Dem
and
Janu
ary
Clos
ed-
--
-Cl
osed
15.4
9-
972.
7230
0.00
1,28
8.21
Clos
ed-
-Cl
osed
42.8
237
0.11
33.0
044
5.93
Febr
uary
Clos
ed-
--
-Cl
osed
--
676.
0119
0.00
866.
01Cl
osed
--
Clos
ed88
.54
374.
9712
4.16
587.
67
Mar
chCl
osed
--
--
Clos
ed0.
01-
1,10
4.11
250.
00
1,35
4.12
Clos
ed-
-
Clos
ed89
.50
835.
0221
9.41
24.0
61,
167.
99
April
Clos
ed-
--
-Cl
osed
--
780.
36
400.
00
1,18
0.36
Clos
ed-
-
Clos
ed13
6.25
824.
5758
7.41
1,54
8.22
May
Clos
ed-
--
-Cl
osed
--
782.
83
500.
00
1,28
2.83
Clos
ed-
-
Clos
ed-
1,08
0.39
2,20
2.18
144.
623,
427.
19
June
Clos
ed-
3,48
7.76
-3,
487.
76Cl
osed
--
1,
283.
81
550.
00
1,
833.
81Cl
osed
-
-
Clos
ed84
5.04
941.
1384
5.82
30.0
02,
662.
00
Firs
t Hal
fCl
osed
-3,
487.
76-
3,48
7.76
Clos
ed15
.50
0.00
5,59
9.83
2,19
0.00
7,80
5.34
Clos
ed-
-
Cl
osed
1,20
2.15
4,42
6.20
4,01
1.98
198.
689,
839.
00
July
Clos
ed-
--
Clos
ed-
698.
89
51
0.00
37
5.00
1,
583.
89
Augu
stCl
osed
-35
2.15
-35
2.15
Clos
ed-
1,10
6.05
59.0
0
308.
21
1,47
3.26
Sept
embe
rCl
osed
--
-Cl
osed
-1,
565.
1931
.50
458.
052,
054.
74
Octo
ber
Clos
ed-
--
Clos
ed-
352.
1539
.76
1,15
7.62
1,54
9.53
Nove
mbe
rCl
osed
--
-Cl
osed
-10
0.00
36.0
027
3.42
412.
81
Dece
mbe
rCl
osed
--
-Cl
osed
-34
5.38
28.5
052
5.35
938.
77
Seco
nd H
alf
Clos
ed-
352.
15-
352.
15Cl
osed
-4,
167.
6670
4.76
3,09
7.65
8,01
3.00
Inte
rban
k
Dem
and
RDAS
Sale
s
BDC
Sale
s
Tota
l
Supp
ly
2017
Firs
t Hal
f
Tota
l
Dem
and
RDAS
Sale
s
BDC
Sale
s
Tota
l
Dem
and
2016
Inte
rban
k
Sale
s*Sw
aps
Inte
rban
k -
Forw
ard
Sale
s*
Inte
rban
k
Dem
and
Swap
sTo
tal
Supp
ly
Inte
rban
k -
Forw
ard
Sale
s*
Inte
rban
k
Sale
s*
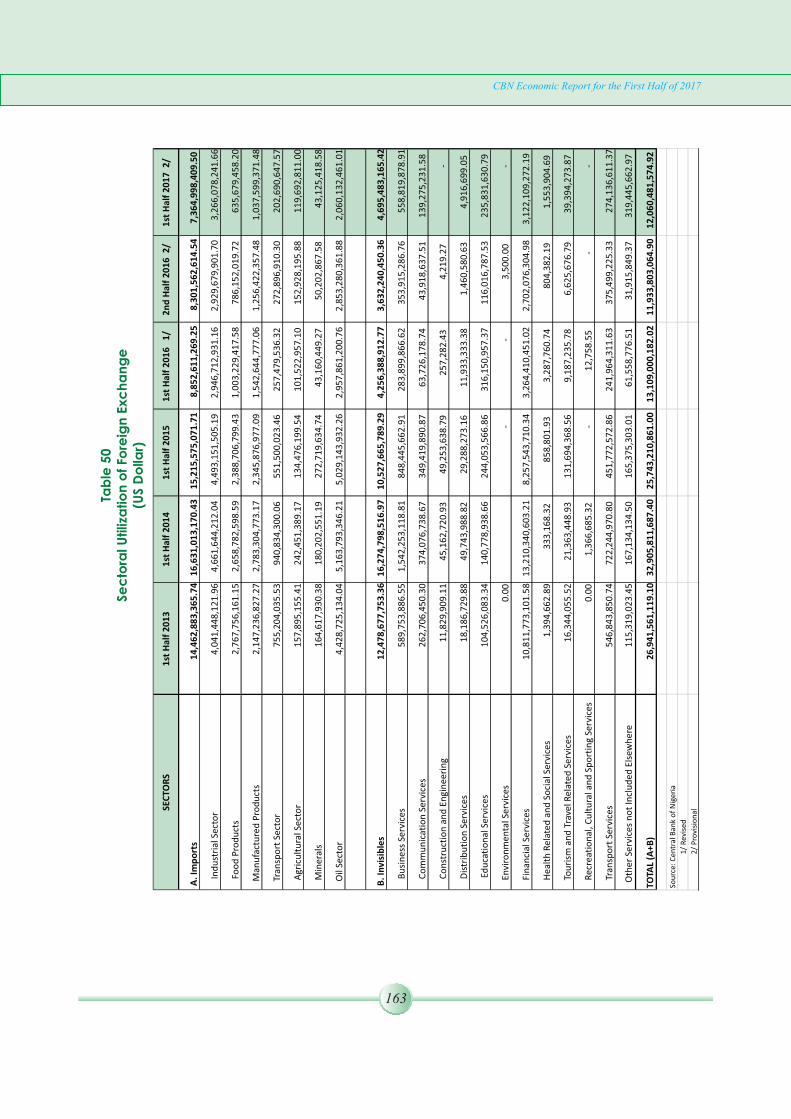
Tab
le 5
0Se
cto
ral U
tiliz
atio
n o
f Fo
reig
n E
xc
ha
ng
e(U
S D
olla
r)
163
CBN Economic Report for the First Half of 2017
A. I
mp
ort
s1
4,4
62
,88
3,3
65
.74
16
,63
1,0
13
,17
0.4
31
5,2
15
,57
5,0
71
.71
8,8
52
,61
1,2
69
.25
8,3
01
,56
2,6
14
.54
7,3
64
,99
8,4
09
.50
In
du
stri
al S
ecto
r4
,04
1,4
48
,12
1.9
6
4,6
61
,64
4,2
12
.04
4,4
93
,15
1,5
05
.19
2,9
46
,71
2,9
31
.16
2,9
29
,67
9,9
01
.70
3
,26
6,0
78
,24
1.6
6
F
oo
d P
rod
uct
s2
,76
7,7
56
,16
1.1
5
2,6
58
,78
2,5
98
.59
2,3
88
,70
6,7
99
.43
1,0
03
,22
9,4
17
.58
7
86
,15
2,0
19
.72
6
35
,67
9,4
58
.20
M
anu
fact
ure
d P
rod
uct
s2
,14
7,2
36
,82
7.2
7
2,7
83
,30
4,7
73
.17
2,3
45
,87
6,9
77
.09
1,5
42
,64
4,7
77
.06
1,2
56
,42
2,3
57
.48
1
,03
7,5
99
,37
1.4
8
Tr
ansp
ort
Sec
tor
75
5,2
04
,03
5.5
3
9
40
,83
4,3
00
.06
5
51
,50
0,0
23
.46
2
57
,47
9,5
36
.32
2
72
,89
6,9
10
.30
2
02
,69
0,6
47
.57
Agr
icu
ltu
ral S
ecto
r1
57
,89
5,1
55
.41
24
2,4
51
,38
9.1
7
13
4,4
76
,19
9.5
4
10
1,5
22
,95
7.1
0
15
2,9
28
,19
5.8
8
11
9,6
92
,81
1.0
0
Min
eral
s1
64
,61
7,9
30
.38
18
0,2
02
,55
1.1
9
27
2,7
19
,63
4.7
4
4
3,1
60
,44
9.2
7
5
0,2
02
,86
7.5
8
43
,12
5,4
18
.58
O
il Se
cto
r4
,42
8,7
25
,13
4.0
4
5,1
63
,79
3,3
46
.21
5,0
29
,14
3,9
32
.26
2,9
57
,86
1,2
00
.76
2,8
53
,28
0,3
61
.88
2
,06
0,1
32
,46
1.0
1
B. I
nvi
sib
les
12
,47
8,6
77
,75
3.3
6 1
6,2
74
,79
8,5
16
.97
1
0,5
27
,66
5,7
89
.29
4,2
56
,38
8,9
12
.77
3,6
32
,24
0,4
50
.36
4
,69
5,4
83
,16
5.4
2
B
usi
nes
s Se
rvic
es5
89
,75
3,8
86
.55
1
,54
2,2
53
,11
8.8
1
84
8,4
45
,66
2.9
1
28
3,8
99
,86
6.6
2
35
3,9
15
,28
6.7
6
55
8,8
19
,87
8.9
1
C
om
mu
nic
atio
n S
ervi
ces
26
2,7
06
,45
0.3
0
3
74
,07
6,7
38
.67
3
49
,41
9,8
90
.87
63
,72
6,1
78
.74
43
,91
8,6
37
.51
1
39
,27
5,2
31
.58
C
on
stru
ctio
n a
nd
En
gin
eeri
ng
11
,82
9,9
09
.11
4
5,1
62
,72
0.9
3
4
9,2
53
,63
8.7
9
25
7,2
82
.43
4
,21
9.2
7
-
D
istr
ibu
tio
n S
ervi
ces
18
,18
6,7
29
.88
4
9,7
43
,98
8.8
2
2
9,2
88
,27
3.1
6
1
1,9
33
,33
3.3
8
1
,46
0,5
80
.63
4,9
16
,69
9.0
5
Ed
uca
tio
nal
Ser
vice
s1
04
,52
6,0
83
.34
14
0,7
78
,93
8.6
6
24
4,0
53
,56
6.8
6
31
6,1
50
,95
7.3
7
11
6,0
16
,78
7.5
3
23
5,8
31
,63
0.7
9
En
viro
nm
enta
l Ser
vice
s0
.00
-
-
3,5
00
.00
-
Fin
anci
al S
ervi
ces
10
,81
1,7
73
,10
1.5
8 1
3,2
10
,34
0,6
03
.21
8,2
57
,54
3,7
10
.34
3,2
64
,41
0,4
51
.02
2,7
02
,07
6,3
04
.98
3,1
22
,10
9,2
72
.19
Hea
lth
Rel
ated
an
d S
oci
al S
ervi
ces
1,3
94
,66
2.8
9
3
33
,16
8.3
2
85
8,8
01
.93
3,2
87
,76
0.7
4
80
4,3
82
.19
1,5
53
,90
4.6
9
To
uri
sm a
nd
Tra
vel R
elat
ed S
ervi
ces
16
,34
4,0
55
.52
2
1,3
63
,44
8.9
3
13
1,6
94
,36
8.5
6
9
,18
7,2
35
.78
6,6
25
,67
6.7
9
3
9,3
94
,27
3.8
7
Rec
reat
ion
al, C
ult
ura
l an
d S
po
rtin
g Se
rvic
es0
.00
1
,36
6,6
85
.32
-
1
2,7
58
.55
-
-
Tra
nsp
ort
Ser
vice
s5
46
,84
3,8
50
.74
72
2,2
44
,97
0.8
0
45
1,7
72
,57
2.8
6
24
1,9
64
,31
1.6
3
37
5,4
99
,22
5.3
3
27
4,1
36
,61
1.3
7
Oth
er S
ervi
ces
no
t In
clu
ded
Els
ewh
ere
11
5,3
19
,02
3.4
5
1
67
,13
4,1
34
.50
1
65
,37
5,3
03
.01
61
,55
8,7
76
.51
31
,91
5,8
49
.37
3
19
,44
5,6
62
.97
TOTA
L (A
+B)
26
,94
1,5
61
,11
9.1
03
2,9
05
,81
1,6
87
.40
25
,74
3,2
10
,86
1.0
01
3,1
09
,00
0,1
82
.02
11
,93
3,8
03
,06
4.9
01
2,0
60
,48
1,5
74
.92
Sou
rce:
Cen
tral
Ban
k o
f N
iger
ia
1/
Rev
ised
2/
Pro
visi
on
al
1st
Hal
f 2
01
6
1/
1st
Hal
f 2
01
4SE
CTO
RS
1st
Hal
f 2
01
51
st H
alf
20
13
2n
d H
alf
20
16
2/
1st
Hal
f 2
01
7 2
/

Table 51Total External Assets of Financial Institutions
(Naira Million)
164
CBN Economic Report for the First Half of 2017
1st Half 2013 1st Half 2014 1st Half 2015 1st Half 2016 1/ 2nd Half 2016 1/ 1st Half 2017 2/
1. Monetary Authorities 7,614,112.49 6,724,347.45 7,646,654.46 8,022,108.88 9,248,623.81 9,449,922.16
Foreign Assets 7,614,112.49 6,724,347.45 7,646,654.46 8,022,108.88 9,248,623.81 9,449,922.16
Gold 19.01 19.01 19.01 19.01 19.01 19.01
IMF Reserve Tranche 22.62 22.62 22.62 22.62 22.62 22.62
Foreign Currencies 34,538.05 57,913.74 50,119.83 80,286.35 38,126.50 152,856.43
Demand Deposits at Foreign Banks 7,188,388.24 6,264,354.82 7,132,975.63 7,348,315.40 6,165,074.42 6,390,693.98
of which: Domicilliary Accounts 683,696.66 716,973.32 216,467.10 1,934,552.48 3,296,417.53 2,079,248.89
Securities of Foreign Governments 1.05 51.36 702.76 828.21 2,199,617.46 2,205,283.74
SDR Holdings 391,143.51 401,985.90 462,814.61 592,637.30 611,930.37 631,681.32
Foreign Equity 742.55 744.55
FX Swap/Forward/Futures 233,090.87 68,620.51
Regional Monetary Cooperation Funds
Other Foreign Assets
2. Semi Official Institutions
i) BOI -
-
-
-
- -
ii) Others -
-
-
-
- -
3. Deposit Money Banks 1,986,111.81 2,234,406.82 1,748,403.66 2,379,967.15 2,076,561.44 2,447,082.43
Total Assets 9,600,224.30 8,958,754.27 9,395,058.12 10,402,076.02 11,325,185.25 11,897,004.59
Total Assets (US$' Million) 61,028.40 56,957.90 47,702.76 36,756.45 37,131.75 38,915.34
Exchange Rate (End-period) 157.31 157.29 196.95 283.00 305.00 305.72
Source: Central Bank of Nigeria1/ Revised2/ Provisional