Center for Naval Analyses - DTIC
28
CAB 96-0005 / March 1996 Maritime Economic Interests & the Sea Lines of Communication Through the South China Sea The Value of Trade in Southeast Asia John H. Noer with David Gregory Cleared for Public Release DISTRIBUTION STATEMENT A Approved for Public Release Distribution Unlimited Center for Naval Analyses 4401 Ford Avenue • Alexandria, Virginia 22302-1498 DTIC QUALITY INSPECTED 4
Transcript of Center for Naval Analyses - DTIC

CAB 96-0005 / March 1996
Maritime Economic Interests & the Sea Lines of Communication Through the South China Sea
The Value of Trade in Southeast Asia
John H. Noer with David Gregory
Cleared for Public Release DISTRIBUTION STATEMENT A
Approved for Public Release Distribution Unlimited
Center for Naval Analyses 4401 Ford Avenue • Alexandria, Virginia 22302-1498
DTIC QUALITY INSPECTED 4

Approved for distribution:
Jerome H. Kahan, Director Regional Issues Team Policy, Strategy, and Forces Division
The Research Memorandum represents the best opinion of CNA at the time of issue. It does not necessarily r< opinion of the Department of the Navy.
CLEARED FOR PUBLIC RELEASE
For copies of this document call: CNA Document Control and Distribution Section at 703-824-2943.
Copyright © 1996 The CNA Corporation

REPORT DOCUMENTATION PAGE Form Approved
OMB No. 074-0188 Public reporting burden for this collection of Information Is estimated to average 1 hour per response, Including the time for reviewing Instructions, searching existing data sources, gathering and maintaining the data needed, and completing and reviewing this collection of information. Send comments regarding this burden estimate or any other aspect of this collection of information, including suggestions for reducing this burden to Washington Headquarters Services, Directorate for Information Operations and Reports, 1215 Jefferson Davis Highway, Suite 1204, Arlington, VA 22202-4302, and to the Office of Management and Budget, Paperwork Reduction Project (0704-0188), Washington, DC 20503
1. AGENCY USE ONLY (Leave blank)
2. REPORT DATE March 1996
3. REPORT TYPE AND DATES COVERED Final
4. TITLE AND SUBTITLE Maritime Economic Interests & the Sea Lines of Communication Through the South China Sea: The Value of Trade in Southeast Asia
6. AUTHOR(S) JH Noer
5. FUNDING NUMBERS
7. PERFORMING ORGANIZATION NAME(S) AND ADDRESS(ES)
Center for Naval Analyses 4401 Ford Avenue Alexandria, Virginia 22302-1498
8. PERFORMING ORGANIZATION REPORT NUMBER
CAB 96-0005
9. SPONSORING / MONITORING AGENCY NAME(S) AND ADDRESS(ES) 10. SPONSORING / MONITORING AGENCY REPORT NUMBER
11. SUPPLEMENTARY NOTES
12a. DISTRIBUTION / AVAILABILITY STATEMENT Distribution unlimited
12b. DISTRIBUTION CODE
13. ABSTRACT (Maximum 200 Words) The U.S. Navy has long been assigned the mission of helping to protect the Sea Lines of Communication (SLOCs) of Southeast Asia. During the Cold War, the mission was viewed in strategic military terms: the U.S. needed to be able to move military supplies through the region in crises, and deny the SLOCs to the Soviets. Now that the Soviet threat has diminished, what national economic interests are at stake? In early 1995, Secretary of State Christopher issued a warning to the nations quarreling over the Spratly Islands. The U.S. does not take sides in this dispute, but will not accept the disruption of trade passing through the South China Sea. This study shows that the American position is based on direct national economic interest, as well as quasi-altruistic concern for the welfare of other nations.
14. SUBJECT TERMS economics, international relations, international trade, naval operations, post cold war, sea lines of communication (SLOC), South China Sea, Southeast Asia, Spratly Islands
15. NUMBER OF PAGES 37
16. PRICE CODE
17. SECURITY CLASSIFICATION OF REPORT
Unclassified
18. SECURITY CLASSIFICATION OF THIS PAGE
Unclassified
19. SECURITY CLASSIFICATION OF ABSTRACT
Unclassified
20. LIMITATION OF ABSTRACT
NSN 7540-01-280-5500 Standard Form 298 (Rev. 2-I Prescribed by ANSI Std. 239-18 298-102

■S-s
OS II ^ O
(0 Q) (0 > (0
<D c
z £*£
0) c Ü

m Maritime Economic Interests &
the Sea Lines of Communication
The Value of Trade in Southeast Asia
Sponsor: VADM Reason (N3/N5) Under the direction of RADM Mazach (N51)
John Noer January 1996
Center for Naval Analyses
The Economic and Strategic Interests of the U.S.
The US Navy has long been assigned the mission of helping to protect the SLOCs of Southeast Asia (SEA). During the Cold War, the mission was viewed in strategic military terms: the US needed to be able to move military supplies through the region in crises, and deny the SLOCs to the Soviets. Now that the Soviet threat has diminished, what national economic interests are at stake?
Does it matter if merchant ships are forced to detour? Whose ships and whose trade use these trade routes? What are American interests? To answer the question "Who benefits from free access to SEA SLOCs?", we gathered extensive data on shipping and trade to analyze what would happen on the high seas if these SLOCs were closed.
In early 1995, Secretary of State Christopher issued a warning to the nations quarreling over the Spratly Islands. The US does not take sides in this dispute, but will not accept the disruption of trade passing through the South China Sea. This study shows that the American position is based on direct national economic interest, as well as quasi-altruistic concern for the welfare of other nations. The United States has direct and immediate economic interests to protect in the region, as SLOC closure could immediately and directly disrupt the US economy. The US also needs to protect its trade links to healthy, prosperous trading partners to maintain its own prosperity.
Page 1
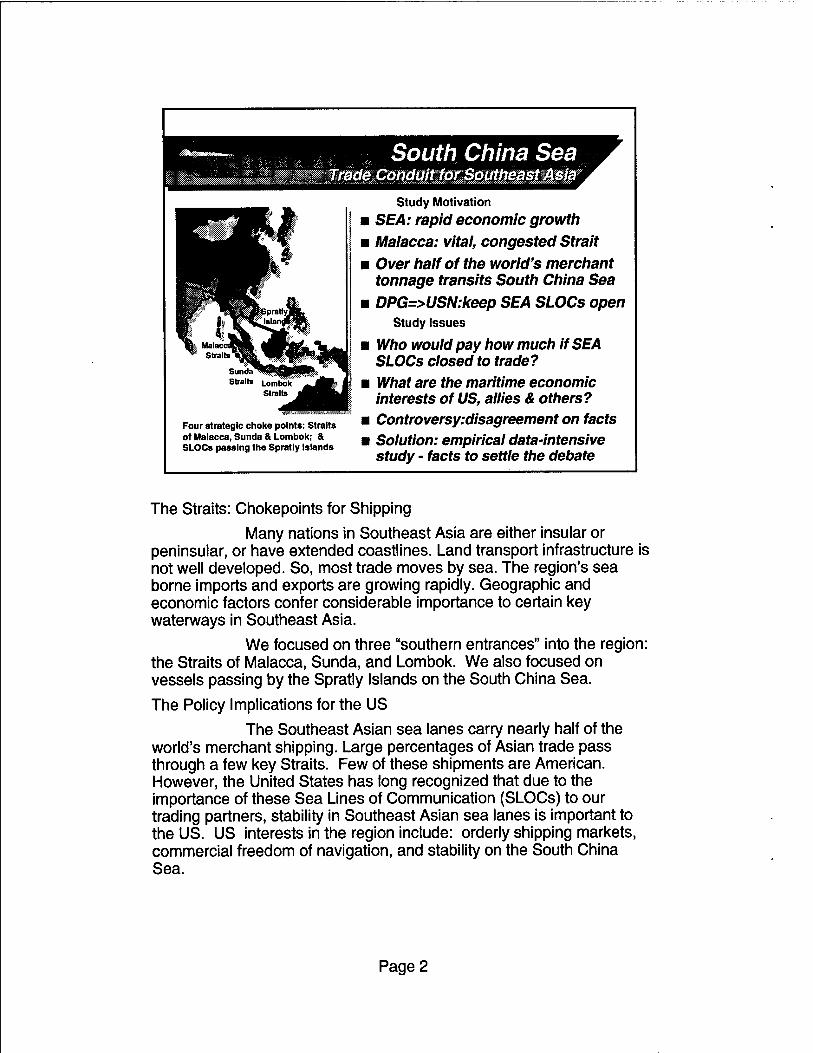
*——- South China Sea
Study Motivation
■ SEA: rapid economic growth m Malacca: vital, congested Strait ■ Over half of the world's merchant
tonnage transits South China Sea ■ DPG=>USN:keep SEA SLOCs open
Study Issues
■ Who would pay how much if SEA SLOCs closed to trade?
■ What are the maritime economic interests of US, allies & others?
■ Controversy:disagreement on facts m Solution: empirical data-intensive
study - facts to settle the debate
Four strategic choke points: Straits of Malacca, Sunda & Lombok; & SLOCs passing the Spratly Islands
The Straits: Chokepoints for Shipping
Many nations in Southeast Asia are either insular or peninsular, or have extended coastlines. Land transport infrastructure is not well developed. So, most trade moves by sea. The region's sea borne imports and exports are growing rapidly. Geographic and economic factors confer considerable importance to certain key waterways in Southeast Asia.
We focused on three "southern entrances" into the region: the Straits of Malacca, Sunda, and Lombok. We also focused on vessels passing by the Spratly Islands on the South China Sea.
The Policy Implications for the US
The Southeast Asian sea lanes carry nearly half of the world's merchant shipping. Large percentages of Asian trade pass through a few key Straits. Few of these shipments are American. However, the United States has long recognized that due to the importance of these Sea Lines of Communication (SLOCs) to our trading partners, stability in Southeast Asian sea lanes is important to the US. US interests in the region include: orderly shipping markets, commercial freedom of navigation, and stability on the South China Sea.
Page 2

Study Approach Maritime Economic interests
Quantitative Study Approach
■ Study Design: Counterfactual Approach
u Quantitative Method: Transportation Economics
m Data Output: Statistics on Maritime Trade Patterns
m Analytic Output: what happens ifSLOCs close?
■ Assumption: most vessels would detour=>extra cost
m Detour Cost Analysis: 1) Ship Operating Costs 2) Hull Financing 3) Cargo Holding Costs
■ First reroute the vessels, then calculate incremental costs to shipping, then link to cargoes
■ Focus: direct maritime impacts, not total impact
m SLOC closures are just assumed, not explained
Intensive Data Inputs
■ Ship file: 8,800+ ships in SEA SLOCs in 1993
m Voyage file: 95k+ in SEA origins to destinations
m Integrated Trade & Ship data - what goes where on whose ship?
Study Method The "counterfactual method" is a kind of sensitivity analysis. Approach: use real world data, change one key fact by assumption, and trace through the logical consequences of that "counterfactual assumption." We also made extensive use of transportation economics and cost analyses. We focused on quantitatively estimating the tangible, immediate impacts of a hypothesized SLOC closure on the shipping industry and maritime trade.
The Data We started with a data base containing 2.2 million port calls by ships, looking for pairs of port calls which implied a voyage across the four "choke points." With the vessels identified, we accessed a vessel characteristics file of the world merchant fleet, containing data on type, owner, flag and size for over 26,000 vessels greater than 1,000 DWT. We generated nearly 90,000 voyage histories for 1993 for over 8,800 ships. This method of "derived transits" has the distinct advantage of tracing ships from origin to destination and positively identifying individual ships. We generated estimates of trade flows through the Straits, by the ship types carrying each commodity. This permitted us to link shipping patterns to trade flows. We are unaware of any other study which builds upon such a large, precise data base on individual vessel movements.
Page 3

Shipping in the SEA SLOCs : mm
TONNAGE
% of World Capacity in Study Region (353.3 Million Dead Weight Tonnes)
51%
COMPARATIVE TRAFFIC LEVELS (Inter-regional Voyages Only)
100 -f
£■ 80 O X 60
S 40
20
0
i ■
■ m . m Spratlys Lombok Malacca Sunda
SHIPS
% of World Fleet in Study Region (8,842 Ships)
34%
WORLD FLEET IN SEA SLOCS 1993
Ship Type Vessels DWT
(millions)
World Vessels
'percentage)
World Capacity
(percentaRe)
LarRe Cellular 230 10.00 69 68
Small Cellular 431 9.00 40 46
Cargo 2710 33.30 29 43
LarRe Dry Bulk 272 42.60 75 77
Other Dry Bulk 2301 85.00 52 55
Combo 121 16.60 35 48
Supertankers 297 77.80 63 59
Tankers 494 32.10 23 34
Product 912 29.10 33 46
Special 1094 17.50 22 42
TOTAL 8842 353.30 34 51
• We collected data on all merchant vessels over 1,000 deadweight tons carrying cargo on international interregional voyages in 1993 in our study region. We omit local shipping, small shipping, and non-trade activity such as fishing or passenger ships. • These statistics describe the population of vessels which transited at least one of the four SLOCs of interest in 1993: Straits of Malacca, Sunda and Lombok; or the sea lanes passing the Spratly Islands. • UPPER LEFT, PIE CHART - capacity in the study region
• Over half the world's merchant capacity transited at least one of the SLOCs in 1993
• UPPER RIGHT, PIE CHART - ships in the region • Over a third of the world's merchant vessels transited the SLOCs
• LOWER LEFT, BAR CHART - ships through the SLOCs • The main southern entrance to the South China Seas is the Straits of Malacca, which carried 114 ships per day.
• Many also pass the Spratlys. • LOWER RIGHT, TABLE - Detail on ships by type in the region
• The SEA SLOCs are mainly serviced by large vessels. Many of the world's supertankers, large cellular (container) ships and large dry bulk ships operate there.
Page 4

Cargoes in the SEA SLOCs
Volume of Cargo Via Choke Points
HAuto/Metals/Machine ■ Consumer Goods D Dry Bulk D industrial Goods ■ Liquid Bulk HOther
Value of Cargo Via Choke Points
500
4S0
400
350
•? 300 o = 250
* 200-|
150
100
50
0
• Tonnage figures are dominated by liquid & dry bulk, industrial inputs.
• Over half a billion tonnes went past the Spratlys in 1993. • Crude oil is the biggest single cargo in volume terms. • Lombok tonnage is dominated by Australian dry bulk - iron ore & coal. • Value figures (in US dollars) are dominated by finished products, industrial outputs. • Nearly half trillion dollars of cargo went past the Spratlys in 1993.
Page 5

Ship Owners and Flags mjw&ish*
"Top Five " Owners in Malacca (by Capacity)
Parent's Capacity Capacity of Fled ■ Country (MDWT) Flagged Out Japan 432 62% Greece 102 67% United Statas 07 77% Great Brltian so 81% Singapore 88 50%
Japan owns four times the tonnage in Malacca as #2, Greece The U.S. is third in capacity owned
"Top Five" Flags in Malacca (by Capacity)
Vessel Capacity Percent Capacity Registry (MDWT) Foreign Owned Panama 351 100% Liberia 228 100% Japan 176 7% Singapore 101 56% Bahamas 84 100%
uThree of the top five flags in Malacca are "flags of convenience" *The Japanese flag is flown by few foreigners
Most vessels plying the region fly flags of convenience. The most common flag in the region is Panamanian, the second is Liberian. Japanese interests own more ships operating in the region than any other country. Most are "flagged out," so Japanese presence is discretely understated. US interests were third, behind Greece. Over three quarters of US ships in SEA flag out.
There is often little correlation between nationality of registration and nationality of owners, and these factors often have little relationship to the economies shipping or receiving cargoes. The concept of "nationality" as applied to shipping is thus ambiguous. Policies that would try to discriminate among shipping on the basis of nationality are based on faulty premises. "Nationality" is not always a meaningful concept when applied to merchant shipping.
Page 6

Long Haul Maritime Trade via SEA SLOCs
Percent Percent Exports Imports Exoorts Imports Billions Billions
Japan 42.4% 42.0% $153.4 $101.5 Australia 39.5% 52.8% $16.9 $24.0 NIEs 25.7% 28.3% $77.7 $84.9 China 21.8% 10.3% $19.8 $10.6 Europe 6.8% 10.5% $107.1 $162.0 U.S.A. 3.3% 4.5% $15.2 $27.3 S.E.Asia 55.4% 525% $114.3 $117.6 All World 15.1% 152% $567.8 $567S
TfcSaSlDCs=MaUcci,Saida&LanhokStiaitsphisSpiaySLOCs. NIEs:HOTgKDi$,T«wi,&Soul]Korca. China (PflC)(nulcviiHongKofig sivusupis^ME*. EiropestitislicscÄ'l«4a«st<uiD|KsanfMiBtties. Nete that &£Ancitdutks<lo mt iidufciimvngional ordomatic tradtatdthui grmtlytMlrrstBliSEAnmühiiettukinthtSEASl.ÖCt. Numentoi; &lef( columi»:tntritine infer regimrf trade Men* Bed in die SLOCs, Den on into! til of 4iein(»nsmlErn*»nilliideby*llnio<fes*3 «pored by thelMT.
SEA SLOCs: Crossroads for; World Trade
»Inter-regional maritime trade via key Straits: a measure of importance to the world economy mlnter-regional seaborne trade via SEA SLOCs is 15% of all world trade » Japan & Australia are very dependent on SEA SLOCs mJapan, Europe send huge volumes via SEA SLOCs »In general, the closer an economy is to the SLOCs the more dependent it is on them »China has relatively small (but growing) trade flows in the South China Sea
Trade Through the Straits Well over one half trillion dollars worth of long haul
interregional sea borne shipments passed through these key "chokepoints" in 1993. This $568 billion was over 15% of all the world's cross-border trade, and doesn't include trade within the region. Malacca and the Spratly SLOCs are the main routes.
Japan, Australia, and the nations of Southeast Asia send over 40% of their trade by sea through these chokepoints. Their economic vitality clearly depends on free access to these sea lanes. American prosperity in turn relies on the economic health of our trade partners.
Page 7

£ 3 O
E£ V
"55 c
< "O s m V) V
HP ■a: u o
u o —I t/J
#o M c V u
t/3

The Scenarios
1. Malacca Straits closed Reroute via Sunda
Detours only, no trade stopped
2. Malacca closed, port of Singapore blocked
Detours ßud trade Interruption
3. Spratly SLOCs closed - Reroute via Lombok-Makassar - Detours only, no trade
interruption.
4. Malacca, Sunda and Lombok Straits closed
Reroute south of Australia - Many SEA ports also blocked
SLOC Closure vs Port Blockage
SLOC closures increase demand for shipping
••• Same cargoes steam farther
- More ton-miles required Cost: extra shipping
Trade interruptions (port blockages) reduce the demand for shipping - Trade drives demand for ships - Less trade => less ton-miles demanded - Cost not estimated in this study: loss of
"value added" of lost trade
#1, #3 are "pure detour" Demand increases
#2, #4 are "mixed" - Increased demand due to detours offset by
demand reduction due to lost trade
The previous few slides have given the base case: real- world data for 1993. We now change one key fact (for each scenario) SLOC closure and/or port blockage - and trace through the consequences of that "counterfactual" assumption.
We look at three economic consequences for these four scenarios: the short-run impact of diversion (SLOC closed), the long- run impact of diversion, and the impact of port blockage.
Page 8

■*««__. Short Run Impact: Freight Rates Up A Caoacitv demanded absorbs excess SUOPIV JM
-. . . _ , ■ onon nun: nates equate Global Capacity Demand to Available Capacity
versus Demand Impact ••• Longer voyages => more ton-mile demand. Impacts world market?
-•• Short run: rates determined by Normal —Extra Demand- supply-demand balance, not costs Excess Malacca Spratly Finding: increase is sianificant
Capacity Straits SLOCs m Close Malacca: Rates Up Sftipfype 1990-94 Closed Closed Most of usual bulk capacity
overhang absorbed
Cellular 24.3% 11.7% 23.6% ■ Close Spratly SLOCs: World Liner 19.8% 13.0% 23.8% Rates Up Even More. Big shock
Dry Bulk 14.3% 8.8% 165% All unused capacity used up
Tankers 13.7% 13.7% 233% Some bulk cargoes won't move
m Strongest Impact: Bulk Cargoes
All Ships 15.4% 11.8% 215% ~ Smaller excess capacity available - Higher transport costs affect low
value caraoes more
World shipping markets directly link Southeast Asian sea lanes to the US economy. If events threatened trade in the South China Sea, ships could simply detour. Ships would travel farther to deliver their cargoes, albeit at higher cost, raising demand for global shipping capacity. If the disturbance happens on the South China Sea, freight rates could rise dramatically worldwide, due to the concentration of world shipping there. Shippers on the east and west coasts of the US would be forced to pay higher shipping rates, or lose service.
Nearly half the world fleet would be required to sail farther, increasing demand for vessel capacity. All excess capacity of the world fleet might be absorbed. The effect would be strongest for crude oil shipments and dry bulk such as iron ore and coal. Closure of the Straits of Malacca would immediately raise freight rates. Denial of the SLOCs passing the Spratly Islands to merchant shipping would disrupt world shipping markets even more severely. Freight rates around the world would be affected, thus adding costs to American imports and exports. All trading nations have a vested interest in preserving stability on the SEA SLOCs.
Note that military or physical SLOC closure is not required. Suppose war-related uncertainty over the Spratlys caused maritime insurers to either increase rates or deny coverage in the region. Shippers might be motivated to reroute shipping via safer sea lanes. The factor that converts a localized maritime concern (SLOC blockage) to a global economic event (freight rate crisis cum capacity shortfall) is the large volume of shipping involved on the South China Sea.
Page 9

Long Run Impact,
DETOUR COSTS TO SHIPPING BY SCENARIO
Total increased voyage costs, & costs as a percent of cargo value
Closed SLOCs
- Malacca Straits - Spratly SLOCs - Malacca, Sunda, & Lombok Straits
Detour Costs*
$1.3 Btl. $3.1 Bit. $7.4 Bil.
"Average Tax Equivalent"
0.3% 0.7% 2.2%
* annualized
Note: last scenario assnnvs semis porli £r carport are blocked.
Trade intern plum s generate econcmiie losses but no'detour cash'
Right coin mn is loLd extra stealing casts, divided by value of
cur ones diverted. Osrresbonds to Scenario 1, Ü and -t. Casts
tilde: vessel otierabno costs (including crors and fuel); the
incremental cost of capital foe financing the ship, and tile
inventory costs oflnlding cargoes cm longer itosagcs.
uLong Run Impact: Freight Rates are determined by costs
Longer voyages= >higher costs -Fleet size adjusts to demand -Route specific, not global
mLarge costs to shipping: $3.6 (Malacca closed) to $20.3 million (around Australia) per day uCan be analyzed as a "tax"
-Large costs spread over huge volumes of cargo Small "average tax"
m The lower the cargo value, the greater the closure impact
Shipping costs are per ton -Impact is "ad valorem"
In principle, closure of shipping lanes might not be a serious matter. Alternate routes are usually available. For example, ships denied access to the Malacca Straits might use Sunda. The Straits of Lombok and Makassar offer an alternative to the South China Seas. These detours are not so large, and after all, merchant vessels offer one of the cheapest modes of transport.
In the long run, if the merchant maritime transport market fully adjusted to a closed SEA SLOC, the extra sailing costs of the detours would indeed be insignificant. In most cases, only a few cents on the dollar would be added to the landed price of most goods. It is difficult, however, to suppose that adjusting to a disruption of the type hypothesized would be easy.
In practice, however, it turns out that closure of these particular SLOCs would matter a great deal due to the disruption of the balance of supply and demand for merchant shipping. It's a fleet capacity issue, not a steaming cost issue.
Page 10

~- Long Run Impact of Detours
S2BQQ- MWL. f}etrurr.e&t ts'AVatm
MALACCA CLOSED Iron Ore India-Japan $162 mil 4.0%
Crude Oil Arab Gulf-Japan $542 mil 0.7% ElecEq. Japan-N.Europe $17/21 mil 0.1%
SPRATLYSLOCs CLOSED Iron Ore India-Japan $22.6 mil 5.5%
Crude Oil Arab Gulf-Japan $192.3 mil 03% JteLEq Japan-N, Europa $22fl£jiiil (L2%_
MALACCA, SUNDA & LOMBOK CLOSED Iron Ore Australia-Japan $725 mil 24.4%
Crude Oil Arab Gulf-Japan $1.2 bj 5.6% Gas Arab Gulf-Japan $322.7 mil 12.7%
ElficEq Japan-N. Europa $112-141 mil QÜ2L. Detour costs include incremental vessel operating cosis and
financing for hulls & cargo holding cosis, due to longer voyages,
Costs are reported on an annual basis, and are specific to
commodities by route. Bulk cargoes are eosted round trip, including
ballast leg. Range given iorfinished goods by liner or container.
The long run "tax-like" cost impact varies greatly by scenario, route & cargo Some routes, cargoes are hard hit... shipping patterns would change for some commodities Crude oil would cost $3.3 million per day more to ship from Arab Gulf to Japan if SEA SLOCs were closed Strongest Impact on Bulk
Higher transport costs affect low value cargoes more Some bulk cargoes could be priced out of the market by extended closures
Bulk cargoes are generally much more vulnerable to the extra steaming costs due to vessel detours. Since they are typically much lower in value than finished goods on a per-ton basis, a few extra dollars of shipping cost can make a big difference. Commodities also typically compete on the basis of price, so a few dollars of price difference might cause a major reordering of the world trade patterns in certain commodities. Also, there is simply less excess capacity in the bulk carrier fleet than there is in the container and liner trades. So the short run impact would hit hard, and adjustment of the merchant marine fleet would take longer.
Above we show 'lax equivalence" calculations for selected trade routes for some typical cargoes: • iron ore, the cheapest commodity per ton sailing the high seas;
• crude oil, the commodity most often found on the high seas; and
• electrical equipment, one of the more valuable cargoes per ton.
Page 11

Detour Costs & Cargo Blocked iH
Detour Costs by Destination Extra Costs Via Alternative Routes
Scenario 1 Scenario 2 Scenario 3 Scenario 4
Shipments Blocked by Destination Value of Cargo "Stuck" (Ports Blocked)
2501
I 150 o
50i
S
Scenario 2 Scenario 4
B Arab Gulf 0 Japan ■ Iß
lAsiaNIEs I Other
D Europe & Med H S.E.Asia
LEFT-HAND CHART: Extra Shipping Costs by Scenario
This chart shows the distribution by destination of annualized costs due purely to detours and longer voyages. The cost elements are: extra vessel operating costs, extra holding costs for cargo in transit, and extra cost of capital for vessels. On a daily basis, that is $3.5 to $20 million per day.
RIGHT-HAND CHART: Value of Blocked Trade
Finally, having examined the short-term and long-term impacts of detours, we address the magnitude of blocked trade. Two of our scenarios assume port blockages which prevent shipments from moving. This chart gives the distribution of blocked trade by destination.
Note two features: blocked shipments, on the right, are very large compared to detour costs; and their impact is very concentrated on the Southeast Asian nations near the SLOCs.
Page 12
fMia&Mmp'Sfmtx; ü.:VM.
■ mmttm
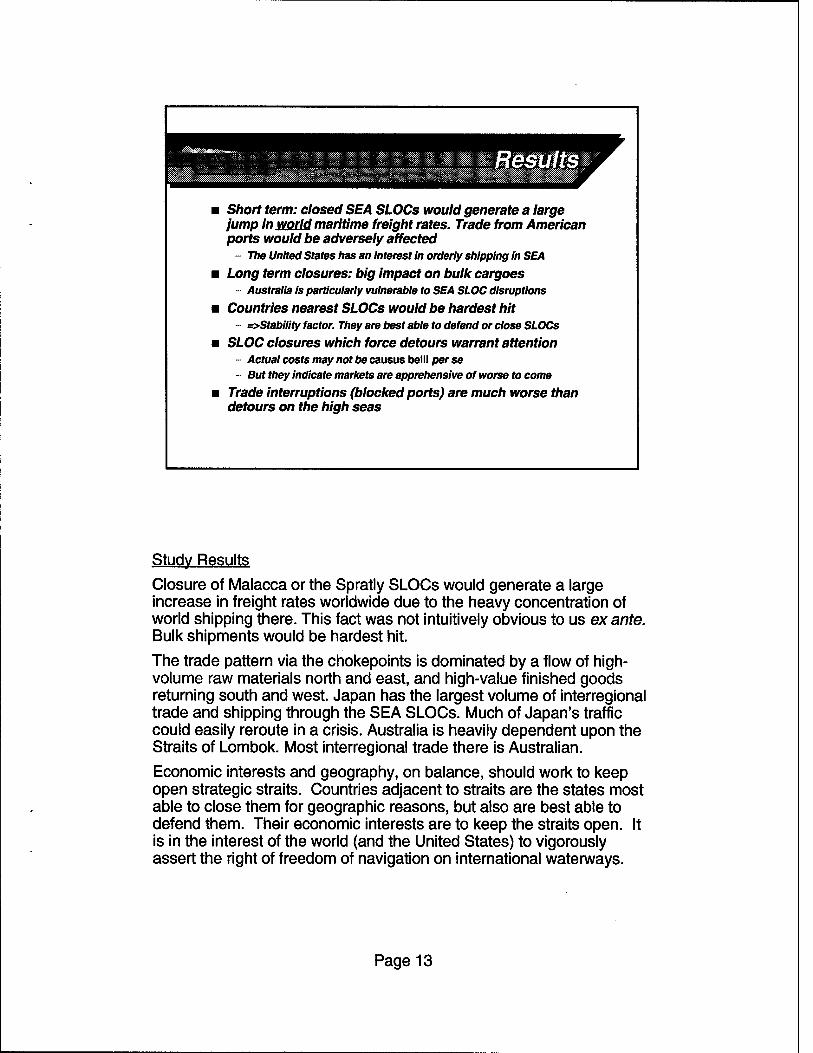
.i^avfW.w^ws'JSiPg
Short term: closed SEA SLOCs would generate a large jump in world maritime freight rates. Trade from American ports would be adversely affected - The United States has an interest in orderly shipping in SEA
Long term closures: big impact on bulk cargoes - Australia is particularly vulnerable to SEA SLOC disruptions
Countries nearest SLOCs would be hardest hit - =>Stability factor. They are best able to defend or close SLOCs
SLOC closures which force detours warrant attention Actual costs may not be causus belli per se But they indicate markets are apprehensive of worse to come
Trade interruptions (blocked ports) are much worse than detours on the high seas
Study Results Closure of Malacca or the Spratly SLOCs would generate a large increase in freight rates worldwide due to the heavy concentration of world shipping there. This fact was not intuitively obvious to us ex ante. Bulk shipments would be hardest hit.
The trade pattern via the chokepoints is dominated by a flow of high- volume raw materials north and east, and high-value finished goods returning south and west. Japan has the largest volume of interregional trade and shipping through the SEA SLOCs. Much of Japan's traffic could easily reroute in a crisis. Australia is heavily dependent upon the Straits of Lombok. Most interregional trade there is Australian.
Economic interests and geography, on balance, should work to keep open strategic straits. Countries adjacent to straits are the states most able to close them for geographic reasons, but also are best able to defend them. Their economic interests are to keep the straits open. It is in the interest of the world (and the United States) to vigorously assert the right of freedom of navigation on international waterways.
Page 13

Post-Cold War economic-based interests are more complex, less obvious than during the East-West confrontation
Economic interests vary from nation to nation Politically different nations can have mutual interests Multi-polarization => can yield international consensus
FON has hath economic & strategic significance - Freedom of maritime shipping is required for free trade
Naval SLOC protection mission has merit in it's own right ~ Economic benefits - not just a military "enabling mission"
US maritime interests in SEA are significant - US directly linked to SEA shipping via transport markets - Trade links are largely indirect, via trade partners....
=>implies Division of Labor - partners motivated to help
Interpretations
'Threat analysis" no longer answers the questions of force size and mix now that the Cold War is over. We no longer face a bipolar world of stable ideology-based alliances. We need to know our own national interests and those of other nations, if we are to deploy our forces to best advantage.
The concept of "Freedom of Navigation" has both economic and strategic significance. Naval sea lane protection is a mission with economic merit in its own right. Forward presence yields benefits in terms of US national interests via the component missions, which include protection of shipping and trade.
The US has immediate and direct maritime interests in stability in the South China Sea SLOCs, as disruptions there would be transmitted to the US economy. This is true even if most of the trade there does not come from or go to the United States. However, the nations in SEA would be affected more directly by such disruptions. These nations have more at stake in the free movement of shipping on SEA SLOCs than does the US. These nations should be natural allies, motivated to cooperate, and to share the costs of naval SLOC protection. Commercial FON in the SLOCs should be a rallying issue for international cooperation and consensus.
Page 14

Appendix Backup Slides
m Traffic in the Malacca Straits & Spratly SLOCs by vessel type, 1993
■ Japanese ships & the Panamanian flag in Malacca, 1993
m VLCCs in the Malacca Straits ■ Interregional trade by origin & destination,
1993 m Economic Model of the Short Run
Freight rates determined by capacity & demand
* Long Run Impact of Closed SLOCs u Straits of Lombok & Makassar
~ Preferred Alternative to the South China Sea
This appendix provides additional data on shipping in the region. Also presented are the economic models used to generate the economic impact analysis reported in the main body of the brief. The main section is intended as a "flag-level brief"; the detail in this appendix combines to give a longer "staff brief.
Page 15

*fty*:Wf'&'&w.j'*:'r..rr Malacca & Spratlys Shipping
Eastbound MALACCA STRAITS Voyages Mil. DWT
SPRATLY IS. SLOCs Voyages Mil. DWT
VLCCs Tankers Large Bulk Bulk Product Combo Cellular General Cargo Special* Total Eastbound
Total Westbound
Total Transits
(Crude >160K DWT) (Crude <160K DWT) (> 100K DWT) (< 100K DWT) (petroleum & chemical) (wet & dry bulk) (container)
1,122 1,895
130 2,589 2,514
82 3,611 6,174 2,801 20,918
286 80 19 88 74 10 86 65 64
773
931 830 325
2,004 2,028 118
3,330 5,257
2,621 17,444
234 56 49 70 76 1 7 94 57 76 729
20,591 793
41,509 1,566
18,583 756
36,027 1,485
Note: Includes only merchant vessels greater than 1.000 DWT on international voyages. Does not include smaller vessels, fishing boats, ferries, warships, or local/domestic trade. "Special- includes Ro/Ro, gas tankers, reefer, vehicle carriers & 'others'. 'Malacca transit' means between the Indian Ocean & Singapore.
This table provides detail by vessel type of the individual ships identified as passing through key study SLOCs in 1993. About 1.5 billion deadweight tons of shipping capacity passed through these main routes. Tankers provided the largest capacity throughput; cellular & general cargo vessels generated the most movements.
Page 16

JapaneseShips&
Flags flown by Japanese owned vessels (by capacity)
Japan owns by far the most tonnage passing through Malacca Most Japanese owned vessels fly flags of convenience
Owners of Panamanian flagged shipping (by capacity)
B PANAMA
■ JAPAN 20
DLIBERIA
Q SINGAPORE
■ OTHER
BJAPAN
S. KOREA
D BERMUDA
SINCAPORE
HONG KONG
OTHER
■ The Panamanian flag is the most common flag in the Straits of Malacca
m Most of these vessels are owned by Asian interests
• Most Japanese-owned tonnage which sailed through the Straits of Malacca in 1993 flew a flag of convenience. Only 38% of this Japanese-owned tonnage flew the Japanese flag. • Of the"top five" nations in terms of ownership of tonnage throughput in Malacca, all flagged out half or more of their capacity. • Over half of Panamanian flagged tonnage was Japanese owned; most of the rest was owned by other Asians.
Page 17

Supertankers in Malacca
SUPERTANKERS IN THE STRAITS OF MALACCA, 1993
VLCC Size (OWT): W0-250K >250K Average Draft (meters) 19.4 215 m Draft Standard Deviation 1.0 1.4 m Depth In Malacca Straits 21.1- 22.9 m Desired Keei Clearance 1.0- 3.5 m Transits Eastbound-Uirim Vl.cCn Supertankers Passing 452 669 ship: Deadweight Tons (DWT) 105.6 179.8 mil *
Crude Oil Cargoes Eastboimd Millions of Tons 102.6 168.6 mt Value (SBilllons) $13.6 $21.7
Distribution by Trade Route Arab Gulf to Japan 24.8% 30.0% Arab Gulf to NIEs' 8.0% 14.9% Arab Gulf to Singapore 4.8% 17.0% Other Oil by VLCC 0.3% 0.3%
* NIE = Hong Kong, Taiwan, & South Korea
Few VLCCs via Lombok-Makassar Malacca VLCCs test the draft limit 1100+ laden VLCCs pass carrying 1/4 billion tons of oil, $35+ billion Most oil moves to north Asia
but the international Straits are in Malaysian & Indonesian waters
Dense ship traffic in Malacca 113+ inter regional large ships daily
narrow channel - collisions occur
Are the Malacca Straits "an accident waiting to happen?" Malaysia wants VTS guidance
proposed Vessel Traffic System (VTS) like English Channel., but "control"? may conduct vessel traffic counts....
The Straits of Malacca Our findings support concern for maritime safety in the
crowded, shallow, and narrow Straits of Malacca. We identified 114 large merchant vessels per day on interregional voyages in the Malacca Straits in 1993. Local and other shipping increases the total.
Indonesia and Malaysia prefer that deep-draft supertankers use the deeper and less crowded Straits of Lombok and Makassar. We found that they do not. Over 1,100 fully laden supertankers annually pass eastbound through the Straits, many with only a meter or two of clearance between their keels and the channel bottom. Most go to Japan or north Asia, while about 20% are going to Singapore.
Indonesia and Malaysia have coastlines and fisheries that could suffer in the event of an oil spill or similar disaster. In contrast, Singapore has little environment at risk, is highly dependent upon international shipping through the Straits, and now hosts the world's largest oil refinery. Singapore has very different national interests at stake in the Straits of Malacca than her neighbors.
Page 18
i/olume of Trade in SEA SLOCs
Origins of Cargo Via Choke Points Destinations of Cargo Via Choke Points
B Arab Gulf «Asia NIEs DAustralia Q Europe & Med ■ Japan B Other B S.E.Asia
600
« 500
£ 400
£ 300
= 200
h 100
Si E
ic rc
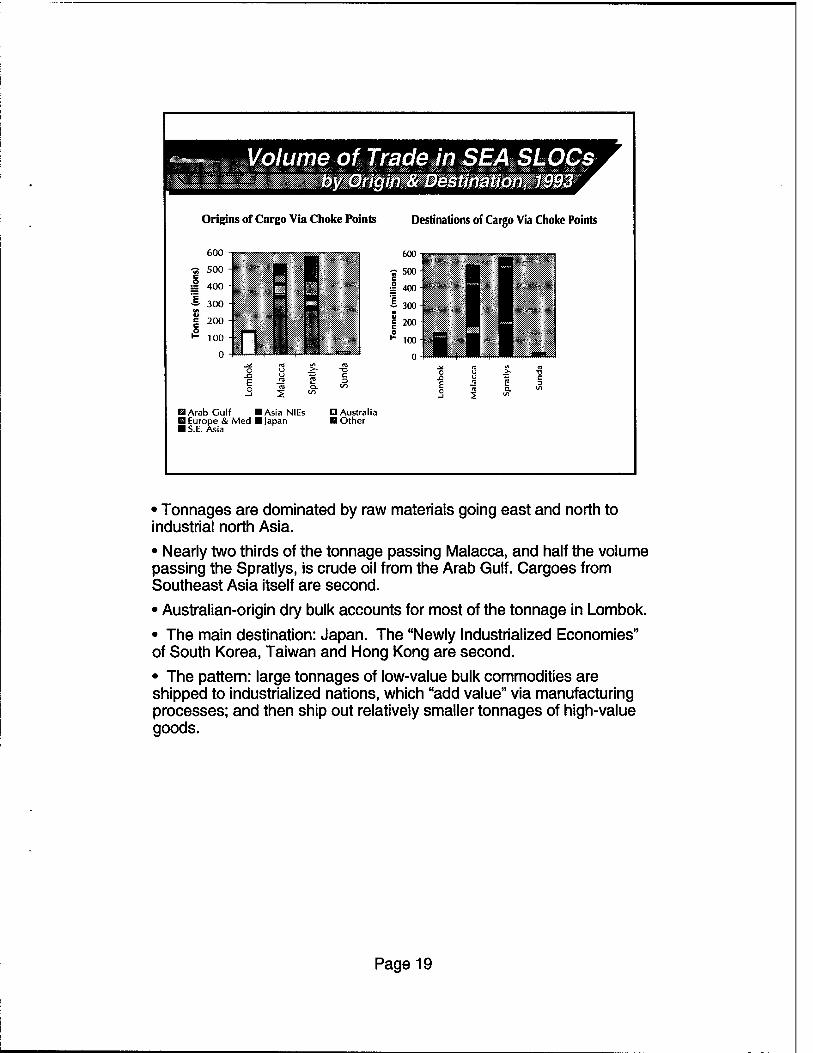
• Tonnages are dominated by raw materials going east and north to industrial north Asia. • Nearly two thirds of the tonnage passing Malacca, and half the volume passing the Spratlys, is crude oil from the Arab Gulf. Cargoes from Southeast Asia itself are second. • Australian-origin dry bulk accounts for most of the tonnage in Lombok. • The main destination: Japan. The "Newly Industrialized Economies" of South Korea, Taiwan and Hong Kong are second. • The pattern: large tonnages of low-value bulk commodities are shipped to industrialized nations, which "add value" via manufacturing processes; and then ship out relatively smaller tonnages of high-value goods.
Page 19

ValueofTradeinSEASLOCs
Origins of Cargo Via Choke Points Destinations of Cargo Via Choke Points
■ Arab Gulf Q Europe & Med ■ S.E.Asia
• Japan ships most of the cargo by value past the Spratlys. Europe and the other Asian economies are also big players. • The biggest single destination is Europe, which is half way around the world, mainly receiving Japanese goods. Japan is the second biggest destination. • Note that tonnage statistics, from the last slide, are dominated by bulk. The bulk shipments are "one-way". In contrast, the finished goods shipments which dominate the value statistics are "two-way" in nature.
Page 20

McmomieModeMMeShotiMun
Short Run Supply Cum (FkMt held constant)
Long Run Supply (FlMtSIzs Adjusts)
hwmaMd QUUIIatlonQ Transport Services
Ton-Miles
Is this increase in demand big enough to drive up rates?
In the Short Run what matters is Supply & Demand of ships In the short run, the number of ships is fixed - it takes time to build fleet capacity Usually there is "supply overhang" of shipping, forcing freight rates down to vessel operating costs Key Study Question: is the increased demand for ton-miles of shipping service enough to absorb the available excess fleet capacity, & generate a shortage which drives up rates?
FOR SEA SLOC Closures: YES
The Model. Freight Rates are the "Price" of maritime transport, vessel operating costs are the main "production cost", and ton-miles of cargo moved is a measurement of "Quantity" supplied in the market. In the short run, supply is "inelastic" or "rigid" because only commissioned vessels are available. Demand is generally price inelastic (or "insensitive"). The combination of inelastic supply and demand makes freight rates very volatile over a wide range in the short run. What matters is the balance of available supply versus desired demand worldwide. This is a global market. Usually rates are just enough to cover costs, but rates can soar very high under pressure. Fleet Operating Tempo. Merchants generally operate at "slow service speed" to save costs when rates are low (the usual case). When rates are high they steam faster, turnaround in port quicker, and load fully. At this higher operating tempo, the fleet generates more ton-miles of service with the same number of ships. Of course, vessel operating costs are much higher - but higher rates ensure profits. The Impact of SLOC Closures. Suppose shipping is motivated - perhaps by apprehension - to avoid the shortest course between two major markets. The detour requires vessels to sail farther in order to deliver the same cargoes, increasing the ton-miles demanded. Normally there is some excess shipping available to the market, often older vessels. The quantitative question is whether the extra capacity requirement is enough to absorb all the excess available capacity, and put upward pressure on freight rates. If so, rates will go up worldwide.
Page 21

Long Run Impact
Demand and Supply for Imports & Exports on a Trade Route
Exchang« Rat« Adjuatad World Commodity Prlca
%
Avarage Datour Coat par Ton {
Deman* for Import*
Detour Costs (em economic distortion)
upply Exports
Cl-.lXnSy r>< >";,;* by
c.cmrr.o-My A .'.-.M:C
Q Tons ot a specific commodity
on a specific route.
"Tax Equivalence" = Detour costs divided by the value of the cargo
In the long run, the fleet size adjusts. Supply = demand. Costs determine freight rates If SLOC closure persists - it impacts only those trade routes through the SLOC Longer voyages = higher cost
more fuel, more crew wages more capacity must be financed cargoes held in transit longer
Producers and consumers must pay extra shipping costs Detour costs are like a "tax"
separates price received by exporter from price paid by importer - but no government receives the revenue
Shipping markets are very competitive. The increase in freight rates caused by a capacity shortage will eventually be offset as vessel owners add capacity to the fleet in pursuit of profits. In the long run, supply is very elastic, as with time any number of vessels can be added to the world fleet. After the fleet capacity adjusts, freight rates will again be determined by costs. Only ships sailing longer routes around closed SLOCs will then be affected.
The extra detour costs will act like a 'lax", driving a wedge-like distortion between suppliers and demanders of the cargoes being shipped. Whether exporters or importers pay the 'lax" (or share it) depends upon market conditions.
This tax-like effect is likely to be small in our scenarios compared with the affect of a freight rate distortion. Note that the added shipping-cost effect compounds any impact on freight rates, and both effects kick in immediately. The shipping cost effect, which is local to the trade route, lasts as long as the detour is in effect. The freight rate effect depends on supply & demand of ships, and is global, impacting shipping markets worldwide.
Page 22

Straits ofrLombok & Makassar "referred Alternative to the South China Sea
FON for merchants in the South China Sea (SCS) is clearly a priority If SCS SLOCs close, the economic benefits of keeping open Lombok- Makassar (L-M) are large - avoid detour south around Australia But - events closing SCS SLOCs might spill over to L-M without naval containment Naval Mission: L-M SLOC protection ■ convoy exercises can be low -
profile, benign - suitable for loose coalitions with developing navies
Opportunity: Regional consensus? - it's in the interests of all players
to keep open the L-M option - less complex than SCS
The most important routes to protect are through Malacca and past the Spratlys. However, if troubles occur in the South China Sea, the Lombok-Makassar route might turn out to be the preferred alternative. Should world events lead merchant shipping to be wary of the main routes via Malacca and by the Spratly Islands, the availability of alternate routes (via the Straits of Lombok and Makassar) could greatly mitigate the negative impacts to the world economy.
Perhaps cooperating navies could practice escorting vessels along the routes, protecting international shipping and the sea lanes. Practical considerations, such as interoperability issues and geographic areas of responsibility could be worked out, creating a real multinational naval capability that would be available should disruption occur. Actually escorting and passing off groups of cooperating merchant ships could add realism to the exercise.
Note that the high traffic levels probably render convoying impractical under many circumstances. In only a few days, fleets of hundreds of merchant could assemble, with considerable delay and expense, to be guarded by a handful of escorts. Other methods of shipping and SLOC protection are probably better. But, naval exercises focused on SLOC protection could help generate a regional consensus. All trading nations in the area have a vested interest in stability on the sea lanes.
Page 23