CENTER FOR INFRASTRUCTURE ENGINEERING … papers... · di barre cilindriche che vengono inserite...
360
CIES 03-40 Strengthening of Masonry: Opportunities and Challenges in the Use of Composites By Marco Casareto Alessandro Oliveri Alessandro Romelli University of Missouri-Rolla CENTER FOR INFRASTRUCTURE ENGINEERING STUDIES
-
Upload
hoangkhuong -
Category
Documents
-
view
218 -
download
2
Transcript of CENTER FOR INFRASTRUCTURE ENGINEERING … papers... · di barre cilindriche che vengono inserite...

����� �
CIES 03-40
Strengthening of Masonry: Opportunities and Challenges in the Use of Composites
By
Marco Casareto Alessandro Oliveri Alessandro Romelli
University of Missouri-Rolla
CENTER FOR INFRASTRUCTURE ENGINEERING STUDIES

UNIVERSITA’ DEGLI STUDI DI GENOVA
FACOLTA’ DI INGEGNERIA
Dipartimento di Ingegneria Strutturale e Geotecnica
D.I.S.E.G.
U.M.R. - University of Missouri - Rolla, U.S.A.
FACULTY OF ENGINEERING
Center for Infrastructure Engineering Studies
C.I.E.S.
TESI DI LAUREA
Strengthening of Masonry: Opportunities and Challenges in the Use of Composites
- Rinforzo della Muratura: Campi di Applicazione e Prospettive
nell’Utilizzo dei Materiali Compositi Relatori: Chiar.mo Prof. Ing. Sergio Lagomarsino Chiar.mo Prof. Ing. Antonio Nanni Correlatore: Ph.D. Gustavo Jaime Tumialan Candidati: Marco Casareto Aprile 2002 Alessandro Oliveri Alessandro Romelli

2
Disclaimer
The contents of this report reflect the views of the author(s), who are
responsible for the facts and the accuracy of information presented herein. This
document is disseminated under the sponsorship of the Center for Infrastructure
Engineering Studies (CIES), University of Missouri -Rolla, in the interest of
information exchange. CIES assumes no liability for the contents or use thereof.

3
The mission of CIES is to provide leadership in research and education for solving society's problems affecting the nation's infrastructure systems. CIES is the primary conduit for communication among those on the UMR campus interested in infrastructure studies and provides coordination for collaborative efforts. CIES activities include interdisciplinary research and development with projects tailored to address needs of federal agencies, state agencies, and private industry as well as technology transfer and continuing/distance education to the engineering community and industry.
Center for Infrastructure Engineering Studies (CIES) University of Missouri-Rolla
223 Engineering Research Lab 1870 Miner Circle
Rolla, MO 65409-0710 Tel: (573) 341-6223; fax -6215
E-mail: [email protected] www.cies.umr.edu

University of Missouri - Rolla - C.I.E.S. Università degli studi di Genova - D.I.S.E.G.
I
TABLE OF CONTENTS
SOMMARIO________________________________________________________ 1
ABSTRACT ________________________________________________________ 5
1. INTRODUCTION _________________________________________________ 7
1.1. General ______________________________________________________ 7
1.2. Problem Statement: Out-of-Plane and In-Plane Behavior of URM Walls11
1.3. Problem Statement: Post Tensioning of Masonry __________________ 18
1.4. Conventional Retrofit Techniques _______________________________ 20
1.5. Scope and Objectives __________________________________________ 23
1.6. Thesis Layout ________________________________________________ 24
2. THE FRP MATERIALS ___________________________________________ 25
2.1. Composite Materials __________________________________________ 25
2.2. FRP Composites______________________________________________ 28
2.3. FRP Reinforcement Forms _____________________________________ 35
2.4. FRP Physical and Mechanical Properties _________________________ 40
2.5. Durability of FRP Materials ____________________________________ 47
3. FRP INSTALLATION TECHNIQUE ________________________________ 53
3.1. The Wet-lay-up System ________________________________________ 53
3.2. Near-surface Mounted FRP Rod System__________________________ 59
4. MATERIALS AND BOND CHARACTERIZATION ____________________ 65
4.1. Materials Characterization_____________________________________ 65 4.1.1. Introduction_______________________________________________ 65 4.1.2. Concrete blocks (arching test) ________________________________ 65 4.1.3. Dark clay bricks (arching test) ________________________________ 67 4.1.4. Light clay bricks (in-plane test) _______________________________ 69 4.1.5. Mortar ___________________________________________________ 73 4.1.6. AFRP and GFRP laminates __________________________________ 74 4.1.7. CFRP Strips ______________________________________________ 78 4.1.8. GFRP Rods _______________________________________________ 80 4.1.9. Primer and Saturant_________________________________________ 81

University of Missouri - Rolla - C.I.E.S. Università degli studi di Genova - D.I.S.E.G.
II
4.1.10. GFRP G1 Rods ___________________________________________ 81
4.2. Bond Characterization ________________________________________ 82 4.2.1. Test Specimens ____________________________________________ 82 4.2.2. Test Setup ________________________________________________ 87 4.2.3. Test Results_______________________________________________ 89 4.2.4. Strain Data _______________________________________________ 92 4.2.5. Analitycal Work ___________________________________________ 98 4.2.6. Conclusions______________________________________________ 107 4.2.7. Design __________________________________________________ 107
4.3. Durability of Putty and Its Characterizazion With and Without Fillers 109 4.3.1. Background______________________________________________ 109 4.3.2. Test Specimens ___________________________________________ 109 4.3.3. Durability _______________________________________________ 119 4.3.4. Conclusions______________________________________________ 130
4.4. Bond Test Controlling the Thickness of Putty ____________________ 131 4.4.1. Test Specimens ___________________________________________ 132 4.4.2. Test Setup _______________________________________________ 134 4.4.3. Test Results______________________________________________ 135 4.4.4. Conclusions______________________________________________ 136
5. INFLUENCE OF ARCHING MECHANISM IN MASONRY WALLS STRENGTHENED WITH FRP LAMINATES __________________________ 137
5.1. Previous Results _____________________________________________ 137
5.2. Experimental Program _______________________________________ 148
5.3. Test Setup __________________________________________________ 154
5.4. Test Results_________________________________________________ 157
5.5. Analytical Study_____________________________________________ 168
6. IN-PLANE BEHAVIOR OF MASONRY WALLS STRENGTHENED WITH FRP LAMINATES AND RODS ______________________________________ 176
6.1. Previous Results _____________________________________________ 177
6.2. Test Specimens ______________________________________________ 184
6.3. Test Setup __________________________________________________ 189
6.4. Test Results_________________________________________________ 191
6.5. Mechanism of Failure ________________________________________ 198
6.6. Conclusions_________________________________________________ 202

University of Missouri - Rolla - C.I.E.S. Università degli studi di Genova - D.I.S.E.G.
III
7. POST - TENSIONING ___________________________________________ 205
7.1. Background ________________________________________________ 205
7.2. Tensioning and Anchor Devices ________________________________ 215
7.3. Test Setup __________________________________________________ 224
7.4. Test Results_________________________________________________ 225
7.5. Validation of the System ______________________________________ 226 7.5.1. Test Setup _______________________________________________ 227 7.5.2. Test Results______________________________________________ 229
7.6. Conclusions_________________________________________________ 233
8. CONCLUSIONS AND FUTURE WORKS____________________________ 235
8.1. Conclusions_________________________________________________ 235
8.2. Future works _______________________________________________ 235
8.3. New frontiers for FRP composites (Blast upgrading) ______________ 237
APPENDIX A: ARCHING EFFECT __________________________________ 239
Appendix A.1: Beams design ______________________________________ 240
Appendix A.2: Strengthening scheme_______________________________ 247
Appendix A.3: Test Setup ________________________________________ 250
Appendix A.4: Test results________________________________________ 251
Appendix A.5: Analitycal study____________________________________ 264
APPENDIX B: IN - PLANE _________________________________________ 277
APPENDIX B.1: Test Specimens___________________________________ 278
APPENDIX B.2: Test Setup_______________________________________ 280
APPENDIX B.3: Test Results _____________________________________ 281
APPENDIX B.4: Mechanism of Failure _____________________________ 290
APPENDIX C: POST -TENSIONING _________________________________ 293
APPENDIX C.1: Tensioning and Anchor Devices ____________________ 294
APPENDIX C.2: Tensile Tests_____________________________________ 299
APPENDIX C.3: Long Term Tests _________________________________ 300
APPENDIX C.4: Validation of the System___________________________ 302

University of Missouri - Rolla - C.I.E.S. Università degli studi di Genova - D.I.S.E.G.
IV
APPENDIX C.5: Patent Disclosure_________________________________ 305
APPENDIX D: MATERIALS AND BOND CHARACTERIZATION ________ 307
APPENDIX D.1: Specimens Preparation (Bond Tests) ________________ 308
APPENDIX D.2: Test Setup (Bond Tests) ___________________________ 309
APPENDIX D.3: Test Results (Bond Tests) __________________________ 311
APPENDIX D.4: Photographs (Bond Tests) _________________________ 317
APPENDIX D.5: Specimens Preparation (Putty Tensile Tests)__________ 319
APPENDIX D.6: Test Setup (Putty Tensile Tests) ____________________ 320
APPENDIX D.7: Test Results (Putty Tensile Tests) ___________________ 321
APPENDIX D.8: Durability Tests (Putty) ___________________________ 327
APPENDIX D.9: Test Specimens (Controlling the Putty) ______________ 336
APPENDIX D.10: Test Setup (Controlling the Putty) _________________ 337
APPENDIX D.11: Test Results (Controlling the Putty) ________________ 338
BIBLIOGRAPHY__________________________________________________ 341

University of Missouri - Rolla - C.I.E.S. Università degli studi di Genova - D.I.S.E.G.
III


University of Missouri - Rolla - C.I.E.S. Università degli studi di Genova - D.I.S.E.G.
1
SOMMARIO L’elaborato di tesi dal titolo: “Strengthening of masonry: opportunities and
challenges in the use of composites / Rinforzo della muratura: campi di applicazione
e prospettive nell’utilizzo dei materiali compositi” è stato svolto nell’ambito di un
programma a carattere sperimentale dell’Università del Missouri – Rolla (USA),
utilizzando i laboratori del dipartimento di Ingegneria Civile C.I.E.S. (Center for
Infrastructure Engineering Studies) diretti dal Prof. Ing. Antonio Nanni. Per questo
motivo esso è presentato interamente in lingua inglese.
Con i test sperimentali svolti non ci si è limitati allo studio di una sola problematica
riguardante il rinforzo delle murature, ma si è cercato di sviluppare più argomenti al
fine di fornire una metodologia di progettazione e di realizzazione del rinforzo nel
campo del recupero e del mantenimento delle opere in muratura. Tutto questo è stato
possibile grazie alle enormi potenzialità dell’Università Americana che ha permesso
di disporre appieno di attrezzature, laboratori, materiali e mano d’opera, ma
soprattutto grazie all’appoggio di una organizzazione pressoché perfetta.
La tesi ha avuto quindi un carattere prettamente sperimentale con lo sviluppo di
modelli teorici di interpretazione per i risultati ottenuti. Questo sommario vuole
essere un breve riepilogo del lavoro presentato nei seguenti capitoli.
Sono state affrontate le seguenti problematiche:
• Sperimentazione su murature rinforzate con FRP soggette a forze agenti nel
piano
• Sperimentazione su murature rinforzate con FRP soggette a forze agenti fuori
dal piano
• Invenzione di un nuovo metodo di post-tensione per barre termoplastiche in
fibra di vetro al fine di sostituire, nel campo del rinforzo, le catene in acciaio
• Studio dell’aderenza sviluppata tra gli FRP e la muratura
• Prove di durabilità inerenti i materiali utilizzati per l’applicazione dei
materiali compositi

University of Missouri - Rolla - C.I.E.S. Università degli studi di Genova - D.I.S.E.G.
2
La comunità internazionale degli ingegneri ha individuato nel collasso di murature
non rinforzate una delle maggiori cause di danni materiali e perdite di vite umane in
occasione di eventi sismici. Le convenzionali tecniche di rinforzo sono generalmente
invasive ed apportano un notevole incremento delle masse, aumentando così le forze
sismiche ed il peso complessivo della struttura. Inoltre, queste tecniche, richiedono
tempi di installazione lunghi che non permettono l’immediata messa in sicurezza
dell’edificio. E’ quindi necessario sviluppare metodologie di rinforzo strutturale
affidabili, durabili e di veloce installazione.
Gli FRP appartengono alla vasta famiglia dei “compositi strutturali”, ossia, di quei
materiali costituiti da due o più fasi di cui almeno una - il rinforzo - è presente in
forma discontinua ed è caratterizzata da elevate prestazioni meccaniche, mentre
l’altra - la matrice - è identificabile come un elemento continuo e meccanicamente
più debole (capitolo 2). Nel settore delle costruzioni si è assistito, nell’ultima decade,
ad un notevole incremento dell’utilizzo di compositi strutturali a matrice polimerica.
In Giappone, paese che per primo ha eseguito sperimentazioni e realizzato
applicazioni pratiche di materiali FRP in edilizia, il consumo delle fibre per uso
strutturale è passato dalle 6 tonnellate del 1993 alle 250 tonnellate del 1997. Analogo
andamento è stato registrato negli ultimi anni negli Stati Uniti, altro paese trainante
nell’utilizzo degli FRP nel campo delle costruzioni. Il maggiore utilizzo degli FRP
nell’edilizia, come si è accennato precedentemente, riguarda essenzialmente il settore
del restauro statico delle strutture degradate o danneggiate e, in particolare, quello
dell’adeguamento sismico. Le fibre più adatte ad essere utilizzate nel restauro delle
strutture in cemento armato sono quelle in carbonio a media-alta resistenza e medio-
alto modulo elastico. Le fibre di aramide e, ancor di più quelle in vetro, trovano un
utilizzo più limitato nelle strutture in cemento armato a causa del loro più basso
modulo elastico e alla conseguente minore capacità di assumere carichi, a parità di
deformazioni impresse. Il loro impiego risulta essere più estensivo ed appropriato nel
campo della riqualificazione degli edifici in muratura dove un modulo elastico
particolarmente elevato non costituisce un’esigenza primaria e può, invece,
rappresentare, in alcuni casi, una problematica. Inoltre, un aspetto non trascurabile, è
che le fibre di aramide e di vetro hanno costi notevolmente inferiori rispetto a quelle

University of Missouri - Rolla - C.I.E.S. Università degli studi di Genova - D.I.S.E.G.
3
in carbonio e sperimentazioni sui muri rinforzati con questo tipo di compositi hanno
mostrato notevoli incrementi in resistenza e duttilità.
I principali vantaggi degli FRP rispetto ai materiali tradizionali si possono riassumere
in: leggerezza, alto rapporto resistenza/peso specifico, durabilità in ambienti umidi ed
aggressivi, velocità di installazione, possibilità di adattarsi a superfici curve (capitolo
2). I compositi strutturali vengono utilizzati nel restauro delle costruzioni sotto forma
di tessuti unidirezionali o pluridirezionali che vengono impregnati direttamente in
opera (wet-lay-up, capitolo 3), oppure sotto forma di elementi rigidi già impregnati
con la resina, ottenuti per mezzo di un processo industriale di estrusione che prende il
nome di pultrusione (capitolo 3). I pultrusi vengono utilizzati sottoforma di piastre o
di barre cilindriche che vengono inserite nella struttura da restaurare mediante metodi
come quello delle Near Surface Mounted Rods (capitolo 3).
Per quanto la letteratura tecnica abbondi di ricerche eseguite in laboratorio e sul
campo, non esiste ancora una conoscenza sufficientemente attendibile sui modelli di
comportamento di elementi compressi o inflessi rinforzati con fasce o barre di FRP,
soprattutto nel campo delle murature. Conoscenza che deve tenere conto di diversi
fattori che possono influenzare gli FRP quali, ad esempio, quelli trattati nel presente
elaborato, ovvero: la delaminazione dei laminati prima della rottura delle fibre stesse
(capitolo 4), l’influenza delle condizioni di vincolo e della snellezza (rapporto
altezza/spessore) delle murature soggette a carichi fuori dal piano (capitoli 1 e 5), le
percentuali di rinforzo in grado di fornire un comportamento duttile ed un
contemporaneo aumento di resistenza alle murature soggette a carichi nel piano
(capitoli 1 e 6), la durabilità degli elementi costituenti la preparazione della superficie
per l’installazione dei laminati (capitolo 4).
L’utilizzo degli FRP può inoltre essere esteso anche ad altri interventi, quali per
esempio la sostituzione di catene in acciaio per operazioni di post-tensione. Il
materiale tradizionalmente usato in questo tipo di applicazioni è appunto l’acciaio, al
cui utilizzo sono connessi problemi legati a fenomeni quali: creep, rilassamento,
invecchiamento e corrosione. La post-tensione richiede la creazione di ancoraggi alle
estremità delle barre per trasmettere lo stato di tensione e nel caso delle barre in FRP
quest’aspetto costituisce il problema principale.
University of Missouri - Rolla - C.I.E.S. Università degli studi di Genova - D.I.S.E.G.
4
La tecnica di post-tensione proposta nella tesi (capitolo 7), utilizza barre
termoplastiche in fibra di vetro (GFRP) mediante particolari dispositivi di ancoraggio
in grado di ridurre i problemi connessi alla durabilità e all’invecchiamento e di
garantire un miglior comportamento strutturale d’insieme grazie al basso modulo di
elasticità, molto più vicino a quello delle murature. L’efficacia di questa tecnica è
stata dimostrata mediante prove sperimentali di laboratorio.
Per ogni argomento affrontato all’interno del seguente elaborato sono fornite
conclusioni e raccomandazioni per lavori futuri.
Nota: Il lavoro esposto nell’elaborato di tesi ha già ottenuto i seguenti riconoscimenti
scientifici:
• 8-11 Giugno 2001: “National Science Foundation Industry meeting”,
University of Missouri Rolla. Esposizione dei lavori svolti e riportati nei
capitoli 4-5 e 7.
• 29-31 Maggio 2002: “Durability of fiber reinforced polymer (FRP)
composites for construction”, Hotel Delta Centre Ville, Montréal Québec
(Canada), esposizione dell’articolo titolato “Tensile Characterization and
Durability of Putty Used for Externally Bonded FRP Strengthening”.
• 10-12 Giugno 2002: “Third international conference on composites in
infrastructure , ICCI 2002”, San Francisco (California), esposizione
dell’articolo titolato “Influence of Arching Mechanism in Masonry Walls
Strengthened with FRP Laminates”.
• Il giornale “L’edilizia” ha chiesto di pubblicare l’articolo dal titolo:
“L’Utilizzo di Barre Termoplastiche in FRP negli Interventi di Riabilitazione
Strutturale” in uno dei suoi prossimi numeri.
• Per il metodo di ancoraggio proposto nel capitolo 7 è stata inoltrata domanda
di brevetto internazionale.

University of Missouri - Rolla - C.I.E.S. Università degli studi di Genova - D.I.S.E.G.
5
ABSTRACT The worldwide engineering community has identified failures of Unreinforced
masonry (URM) walls as one of the major causes of material damage and loss of
human life due to seismic events. Therefore, the development of effective and
affordable retrofitting techniques for masonry members is an urgent need. To date,
previous works on URM and reinforced masonry walls strengthened with fiber
reinforced polymeric (FRP) materials have shown notable increases in capacity and
ductility. Unfortunately, field applications involving the use of FRP laminate on
masonry members may be carried out even if not supported by rigorous experimental
background. The cause of that is the implicit assumption that the high performances
of FRP should always benefit a compromised structural situation. Part of the present
experimental programs (i.e. bond tests, out-of-plane behavior with arching effect, in-
plane behavior) shows the detrimental effects produced by inaccurate design.
Conclusions and recommendations are provided for all the studied issues.
Use of FRP materials is not limited to strengthen walls subjected to out-of-plane and
in-plane loads, but can be in the form of tendons in pre-stressing applications. This
could be a new fronteer for the FRP materials because of advantages over steel
tendons such as light weight, resistance to corrosion, lower or higher elastic modulus
etc. A major problem facing the use of FRP in pre-stressing applications is the
anchorage. The new anchor system showed in section 7 demonstrated that FRP can be
succefully used for the postensioning of masonry in substitution of steel.
A technical obstacle preventing the extended use of FRP materials in construction is a
lack of long-term and durability performance data comparable to the body of
knowledge available for traditional construction materials. A durability test was
conducted as part of this thesis on a type of putty (used to prepare the surface) to
demonstrate the implications of this concern.

University of Missouri - Rolla - C.I.E.S. Università degli studi di Genova - D.I.S.E.G.
6

University of Missouri - Rolla - C.I.E.S. Università degli studi di Genova - D.I.S.E.G.
7
1. INTRODUCTION
1.1. General Masonry is one of the oldest construction materials. For thousand years masonry was
the predominant building material until modern materials such as concrete, steel and
wood appeared in the nineteenth century. Masonry constitutes approximately 70% of
the existing building inventory in the United States. Most of these buildings possess
unreinforced masonry (URM) walls. URM buildings have features that can threaten
human integrity. Structural weakness, overloading, dynamic vibrations, settlement,
in-plane and out-of-plane overstresses can cause failure of masonry structures.
Organizations such as the Federal Emergency Management Agency (FEMA) and The
Masonry Society (TMS) in the United States have identified that failure of URM
walls results in most of the material damage and loss of human life. Figure 1.1
illustrates the collapse of URM walls due to out-of-plane and in-plane loads after the
earthquake in Izmit, Turkey in 1999. These kinds of failure are a potential threat to
bystanders.
(a) Out-of-plane failure (b) In-plane failure
Fig. 1.1. Failure of URM walls In 1986 a building evaluation carried out in the state of California, U.S.ci on URM
buildings showed that 96% of these needed to be retrofitted, which would result in
approximately $4 billion in retrofit expenditures. To date, it has been estimated that
only half of the owners have taken remedial actions, which may be attributed to high
University of Missouri - Rolla - C.I.E.S. Università degli studi di Genova - D.I.S.E.G.
8
retrofitting costs. Thereby, the development of an effective and affordable retrofitting
technique for masonry elements is an urgent need.
In the United States there are three typical masonry walls:
• Panel walls
• Curtain walls
• Bearing walls
Panel walls
Panel walls are single-story walls and are common façade elements in buildings
conformed by frames or steel or reinforced concrete. These kinds of walls consist of
two whytes separated by at least 50.8 mm (2 inches) air space, commonly referred to
as cavity walls. The air space in the cavity improves the thermal performance of the
wall, which can be enhanced by inserting insulation in the cavity. In most
applications the inner wythe supports the weight of floors and the outer is non load
bearing. These walls may also consist of single wythe or multiple wythes in contact
with each other (composite walls).
When built in reinforced concrete (RC) or steel frames, these walls are called infill
walls and they protect the interior from the external environment. Infill walls can be
subjected to in-plane loads caused by their interaction with the surrounding frame.
Due to vertical spans of 3.3 m (11 feet) or less, panel walls can satisfactorily resist
out-of-plane loading and are generally unreinforced. However, during a seismic
event, excessive damage due to in-plane seismic loading can lead to significant
stiffness reduction in the lateral direction making, therefore, these walls susceptible to
out-of-plane collapse.
Curtain walls
Curtain walls are multi-story walls that also resist out-of-plane loads due to
earthquake or wind. If a single wythe is used, horizontal steel, in the form of welded
reinforcement, is placed in the mortar joints to increase the resistance. This kind of
construction is commonly referred to as “partially reinforced”.

University of Missouri - Rolla - C.I.E.S. Università degli studi di Genova - D.I.S.E.G.
9
Bearing walls
Bearing walls are arranged at fairly uniform spacing to resist out-of-plane loads, in-
plane loads and vertical loads from self–weight and upper derived from floor areas.
Cavity and composite walls can also lie on this category. Depending on the load
solicitations, bearing walls can be unreinforced or reinforced.
Masonry in backup walls
Commonly two different masonry units are found in backup or inner walls; clay tiles
and concrete units. A clay tile is a hollow unit, which is characterized by possessing
parallel cores and thin webs and faceshells. Clay materials were mixed with water to
create a homogeneous mass and then formed into brick units by pressing into a mold.
Structural clay tiles have been first manufactured in the United States approximately
since 1875.
In the beginning, structural tile was used in building floors and as fireproofing
material for steel frame constructions. Due to its lightweight, large unit size and ease
of handling during constructions, the use of clay tiles was extended to load-bearing
walls, wall facings, silos, columns, etc.
In the early 1900’s, structural clay tiles were used in infill walls throughout the
United States.
Some notable structures where it is possible to observe this kind of construction are
the New York Chrysler building (New York) and the Los Angeles City Hall Building
(California).

University of Missouri - Rolla - C.I.E.S. Università degli studi di Genova - D.I.S.E.G.
10
Fig. 1.2. Los Angeles City Hall Building (California)
Today, the whole brickmaking process (mining, forming, drying, firing, cooling and
delivery) is highly mechanized and can be completed in less than a week.
Can be observed that the production of clay tiles decreased during the 1960’s, when
concrete units began to be widely used. It is important to point out that the use of
concrete units was not new in the United States. Concrete blocks were first
manufactured in the United States at about the turn of the 20th century in small one-at-
a-time machine that could be operated by hand. Using this kind of machine, the
production was limited to 10 blocks per man-hour. Concrete blocks were not widely
used until the 1920’s when the manufacturing process was improved; however due to
the recession many plants had close or merge. It was not until the 1960’s that the
market started to change. This change is attributed to the automation of plant
equipment, which increased the production capability of concrete blocks. The
manufacturing process of concrete units allowed a better quality control of the
products and also concrete units showed more uniformity since they were not fired
during their fabrication. Also, the brittle characteristics of clay tiles when being
handled and transported increased the demand of concrete units. Modern concrete
blocks are generally manufactured by vibrating a mixture of Portland cement, sand
and aggregate in a mold under pressure, curing with low-pressure or high-pressure
steam and then, in some cases, exposing them to carbon dioxide in the curing
chamber to reduce subsequent shrinkage of the units. To date there is a large use of
concrete blocks inside the USA, for different kinds of buildings.

University of Missouri - Rolla - C.I.E.S. Università degli studi di Genova - D.I.S.E.G.
11
1.2. Problem Statement: Out-of-Plane and In-Plane Behavior of URM Walls Out-of-plane behavior Masonry walls may be subjected to out-of-plane loads. These walls are referred to as
flexural walls since the mode of deformation is primarily flexure with little or no
externally applied load. The load can be permanent, such as earth pressure against a
retaining wall or basement wall or they can be transient, such as wind or earthquake.
Walls must be also sufficiently robust to not cause disproportionate amounts of
damage or failure. In ancient masonry buildings walls were generally thick enough
that flexural stresses from the lateral load were much lower than axial compressive
stresses from self-weight and other gravity loads. To date, the tensile strength of
masonry has become upon to provide flexural resistance to out-of-plane loads.
The load-resisting mechanisms for the unreinforced masonry walls depend on the
tensile strength of masonry, in-plane compressive strength, boundary conditions and
slenderness ratio (height/thickness).
Walls that are simply supported and span in only the vertical direction must resist
lateral action by bending action. The bending capacity is directly related to the axial
compression and the moment capacity is different if the flexural tensile strength of
masonry is taken in account or no. If the tensile strength is neglected (figure 1.3a), the
bending capacity is directly related to the axial compression and the moment capacity
is:
M = fa S
Where:
fa = axial compressive stress = P/An
An = effective mortar bedded area
S = section modulus for out-of-plane bending
If the tensile strength of masonry can be taken in account (figure 1.3b) the
moment capacity becomes:
M = (fa + ft’)S

University of Missouri - Rolla - C.I.E.S. Università degli studi di Genova - D.I.S.E.G.
12
Where:
ft’ = flexural tensile strength normal to bed joints.
Note: fm’ = maximum compressive strength of the masonry Fig. 1.3. Flexural behavior of unreinforced section (linear elastic material)
When the tensile stress reaches the limiting tensile strength, this is usually defined as
the flexural tensile capacity. However, if cracking is allowed additional lateral load
can be applied.
When a wall is built between supports that restrain the outward movement, axial
compressive forces accompanied by the shear forces (Fv and Fh in figure 1.4) are
induced as the wall bends. The in-plane compression forces can delay cracking. After
cracking the so-called arching action can be observed, which in many cases increases
several times the capacity of the wall. Analysis (L.R. Baker, 1978; A.W. Hendry,
1981) have shown that the induced forces can increase the cracking load by a factor
of about 2.5 if the end supports are completely rigid.
(a) (b)

University of Missouri - Rolla - C.I.E.S. Università degli studi di Genova - D.I.S.E.G.
13
Fig. 1.4. Wall subjected to Arching Effect (Scheme)
Investigations have shown that the resultant force between Fv and Fh (Fr in figure 1.4)
could cause the fracture of the corner. It has been reported also that for slenderness
ratio (h/t) larger than 20, the arching action is small (Angel et al., 1994).
Once that the wall has been cracked at mid-height, it can be assumed that the two
resulting segments can rotate as rigid bodies like shown in figure 1.4, forming a three
hinged arch.
Analyzing the top segment of the wall, the following consideration can be derived:
Being BC equal to B’C’ for simple geometric considerations (figure 1.5) the arm for
the resistance moment (figure 1.6) can be assumed, for very small angle θ, equal to:
0a − ∆

University of Missouri - Rolla - C.I.E.S. Università degli studi di Genova - D.I.S.E.G.
14
Fig. 1.5. Geometric considerations for the top segment of the wall
Fig. 1.6. Free body diagram of upper part of the wall Where:
P = out-of-plane-load
Pv = clamping force
PV
P/2
PV
P/2 θ
∆ο
h/2
t
a
b
f 'm
o

University of Missouri - Rolla - C.I.E.S. Università degli studi di Genova - D.I.S.E.G.
15
h = height of the wall
t = thickness of the wall
a = arm distance between clamping forces
b = bearing width
∆0 = wall deflection
fm’ = compressive strength of masonry
Taking moment about “O” can be calculated the equilibrium that is:
v oP h P (a )2 2
⋅ = ⋅ − ∆
So, the out-of-plane force allows on the wall is:
v 04 P (a )Ph
⋅ − ∆=
In general the wall behavior can be controlled by crushing of the mortar joints in the
boundary regions. However, in the case of walls built with masonry units with brittle
characteristics such as clay tiles, the wall behavior can be controlled by fracture of the
units (Tumialan, 2001).
If a masonry wall is separated from the top by a small gap due to poor construction,
wall shrinkage etc., arching can still develop, but to a lesser extent.

University of Missouri - Rolla - C.I.E.S. Università degli studi di Genova - D.I.S.E.G.
16
In-Plane Behavior of Infill Walls Masonry walls are widely used as interior partitions within steel and RC frame
structures as exterior walls to form part of the building envelope. For the latter case,
depending on design considerations, the infill walls may or not may resist to lateral
and vertical loads. In order to simplify the design, the potential interaction between
the infill walls and the structural frame has been ordinarily ignored. Ignoring the
contribution of the masonry infill walls does not always represent a conservative
design. Their presence can lead to stiffening their frames (Sabnis, 1976) and thereby
cause a redistribution of the lateral loads in the building plan.
Fig. 1.7. Load deflection curves of frames with and without infill walls (Sabnis)
Infill walls can be totally enclosed in a surrounding frame of beams and columns, as
typical in a multi story building. These walls can be subjected to high in-plane loads
during exceptional events such as high wind or earthquake. These loads are due to the
interaction between the infill walls and the surrounding structural frames. Previous
investigations (Sabnis, 1976) have demonstrated that the composite action between
the masonry infill and the surrounding frame is depending on the level of the in-plane
load, degree of bond or anchorage at the interfaces and geometric and stiffness
characteristics of the two components. At very low levels of lateral load, a full
composite action between the infill wall and the frame is observed (Figure 1.8).

University of Missouri - Rolla - C.I.E.S. Università degli studi di Genova - D.I.S.E.G.
17
Fig. 1.8. Full composite action between frame and infill panel As the load increases, deformations increase and separation between the wall and the
frame takes place except in the vicinity of the two corners where compression forces
are transmitted through the wall. This leads the formation of a diagonal compression
strut (Figure 1.9).
Fig. 1.9. Diagonal compression strut
Full contact
Diagonal compression
Diagonal tension

University of Missouri - Rolla - C.I.E.S. Università degli studi di Genova - D.I.S.E.G.
18
This resulting structural system is usually analyzed as a truss. The stiffness of the
infill starts decreasing once cracking is developed.
Alternatively, the wall may fail in shear along a bed joint rather than by diagonal
compression. This could happen at a lower load level as compared to the load causing
the latter mentioned failure. The formation of the shear crack separates the panel into
two parts and the behavior in this case is controlled by either the flexural or shear
capacity of the columns. This failure mechanism is commonly know as Knee Brace or
Joint Slip (Figure 1.10).
Fig. 1.10. Joint-Slip failure
1.3. Problem Statement: Post Tensioning of Masonry During their life walls could show cracks due to past seismic events or differential
settlement that compromise the building stability and aesthetic sense. Pre-stressing
forces are used in masonry to reduce or eliminate tensile stresses due to externally
applied loads or to close the cracks caused by passed events by using controlled
University of Missouri - Rolla - C.I.E.S. Università degli studi di Genova - D.I.S.E.G.
19
precompression. The precompression is generated by prestressing tendons, either
bars, wires, or strands, that are contained in openings in the masonry, which may be
grouted. The prestressing tendons can be pre-tensioned (stresses against external
abutments prior to placing the masonry), or post-tensioned (stresses against the
masonry after it has been placed). Internal pre tensioning has been used successfully
to increase strength and provide ductility to existing URM masonry structures. In
situations where internal pre-tensioning is not feasible, post-tensioning of URM
masonry is often a viable option. Most construction application to date have involved
post-tensioned. The prestressing bars or strands can be installed in pairs on opposite
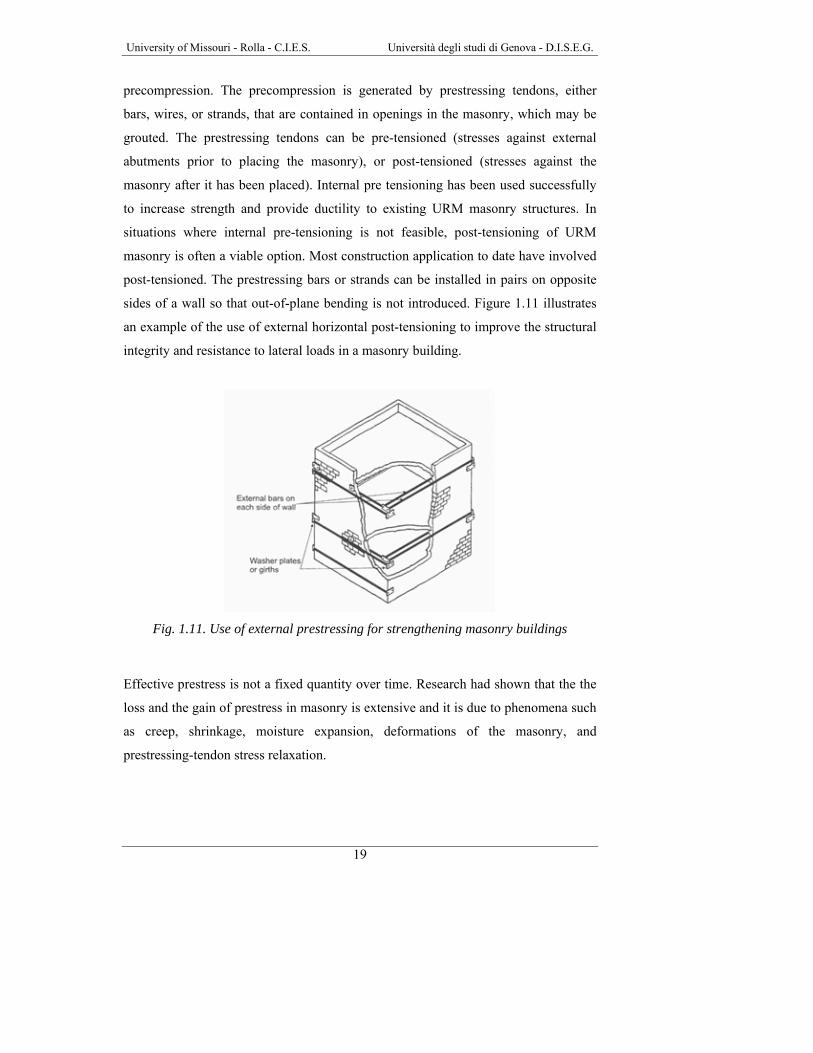
sides of a wall so that out-of-plane bending is not introduced. Figure 1.11 illustrates
an example of the use of external horizontal post-tensioning to improve the structural
integrity and resistance to lateral loads in a masonry building.
Fig. 1.11. Use of external prestressing for strengthening masonry buildings
Effective prestress is not a fixed quantity over time. Research had shown that the the
loss and the gain of prestress in masonry is extensive and it is due to phenomena such
as creep, shrinkage, moisture expansion, deformations of the masonry, and
prestressing-tendon stress relaxation.
University of Missouri - Rolla - C.I.E.S. Università degli studi di Genova - D.I.S.E.G.
20
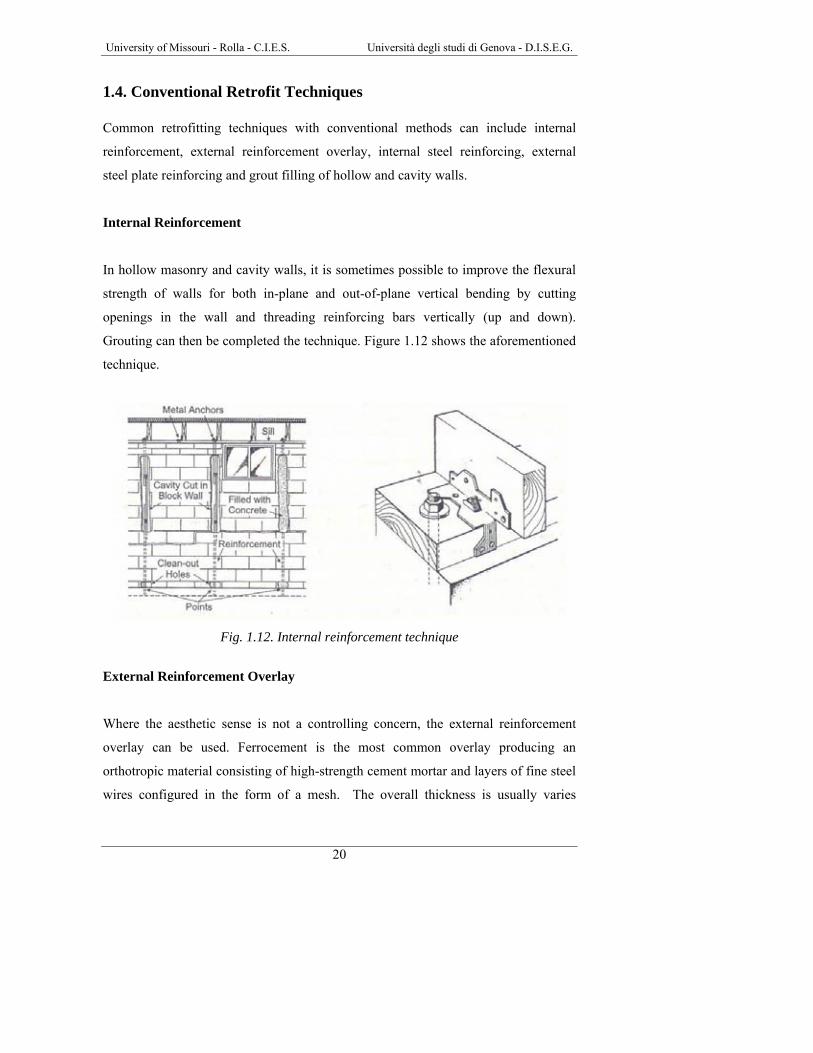
1.4. Conventional Retrofit Techniques Common retrofitting techniques with conventional methods can include internal
reinforcement, external reinforcement overlay, internal steel reinforcing, external
steel plate reinforcing and grout filling of hollow and cavity walls.
Internal Reinforcement
In hollow masonry and cavity walls, it is sometimes possible to improve the flexural
strength of walls for both in-plane and out-of-plane vertical bending by cutting
openings in the wall and threading reinforcing bars vertically (up and down).
Grouting can then be completed the technique. Figure 1.12 shows the aforementioned
technique.
Fig. 1.12. Internal reinforcement technique
External Reinforcement Overlay
Where the aesthetic sense is not a controlling concern, the external reinforcement
overlay can be used. Ferrocement is the most common overlay producing an
orthotropic material consisting of high-strength cement mortar and layers of fine steel
wires configured in the form of a mesh. The overall thickness is usually varies

University of Missouri - Rolla - C.I.E.S. Università degli studi di Genova - D.I.S.E.G.
21
between 12 to 25 mm (1 to 2 in.). These overlays are used to increase in-plane and
out-of-plane resistance.
Internal Steel Reinforcing
This technique consists to repair the URM walls subjected to in-plane loads by
horizontal and vertical steel reinforcement. The installation procedure includes
grooving of the bed joints followed by placement of the steel and sealing with the
mortar.
Fig. 1.13. Internal steel reinforcing
External Steel Plate Reinforcing
Steel plates and angles can be used to strengthen walls subjected to in-plane and out-
of-plane loads. Figure 1.14 shows a strengthening method proposed by Taghdi et al.
(2000), used for in-plane loads. This method could be also effective for out-of-plane
loads.

University of Missouri - Rolla - C.I.E.S. Università degli studi di Genova - D.I.S.E.G.
22
Fig. 1.14. External steel plate reinforcing
Grout Filling of Hollow and Cavity Walls
Filling the cells of hollow units with grout increases the compressive capacity and,
because of the greater tensile strength of grout compared to mortar bond, also
produces a significant improvement in flexural and in-plane shear capacities. Filling
voids with grout can also improve the resistance to water penetration, particularly for
single-wythe construction. Except for very large cells or cavity widths, gravity
placement of grout is typically not reliable due to obstructions from mortar fins and
droppings and because of the difficulty of providing vibration for consolidation.
Therefore, pressure grouting from the bottom up is usually the most reliable method
for achieving complete filling. The vertical spacing is limited by the ability of the
masonry to withstand internal pressure., by the capacity of the pump, and by the
desire to limit the height of lifts to allow for some consolidation due to water
absorption and compaction of the grout. Fine grout, often incorporating a plasticizer,
is typically used and commercially available products that also recommended to
avoid shrink-back of the grout and creation of voids in the grout or between the grout
and the masonry.
The FRP Materials
Although the concept of fiber reinforced materials can be traced back to the use of
straw as reinforcement in bricks manufactured by the Israelites in 800 B.C., and in
more recent times to the use of short glass fiber reinforcement in cement in United

University of Missouri - Rolla - C.I.E.S. Università degli studi di Genova - D.I.S.E.G.
23
States in the early 1930’s, fiber reinforced resin matrix materials (or fiber reinforced
composites as we know them today) were not developed until the early 1940’s.
After World War II, US manufacturers began producing fiberglass and polyester
resin composite boat hulls and radomes (radar cover). The automotive industry first
introduced composites into vehicle bodies in the early 1950s. Because of the highly
desirable light weight, corrosion resistance, and high strength characteristics in
composites; research emphasis went into improving the material science and
manufacturing process. That effort led to the development of two new manufacturing
techniques known as filament winding and pultrusion, which helped advance the
composite technology into new markets. There was a great demand by the recreation
industry for composite fishing rods, tennis rackets, ski equipment and golf clubs. The
aerospace industry began to use composites in pressure vessels, containers, and non-
structural aircraft components. The US Navy applied composites in mine sweeping
vessels, crew boats and submarine parts. The domestic consumers began installing
composite bath tubs, covers, railings, ladders and electrical equipment. The first civil
application in composites was a dome structure built in Benghazi in 1968, and other
structures followed slowly.
1.5. Scope and Objectives To date, previous works on URM and reinforced masonry walls strengthened with
fiber reinforced polymeric (FRP) materials have shown notable increases in capacity
and ductility (Hamilton et al., Tumialan, Morbin, Velazquez). During a seismic event
URM walls located at upper building stories can collapse due to higher seismic
accelerations, walls located at the bottom story could be overstressed because the
shear forces at that level could be larger than any other story.
During their life walls could show cracks due to past seismic events or differential
settlement that compromise the building stability and aesthetic sense.
The main objectives of this research are to evaluate the effectiveness of different
kinds of commercially available and experimental forms of FRP composite materials
to illustrate the ability of FRP to increase the flexural and shear capacity of the walls,

University of Missouri - Rolla - C.I.E.S. Università degli studi di Genova - D.I.S.E.G.
24
to demonstrate that FRP can be used for the postensioning in substitution of steel, and
to provide design guidelines and recommendations.
1.6. Thesis Layout
Section One introduces several issues that could be encountered in the masonry
buildings and the significance of the strengthening of masonry elements.
In Section Two, material properties of different FRP materials are presented. Section
Three shows the installation process of FRP composites on the masonry walls. Since
debonding of FRP laminates from masonry has been identified as the predominant
mode of failure, Section Four deals with bond between FRP laminates and masonry.
The influence of putty on the bond between FRP laminates and masonry is also
discussed in this section.
The experimental program on flexural strengthening due to out-of-plane loads is
discussed in the Section Five. The experimental program on shear strengthening due
to in-plane loads is shown in Section Six.
Section Seven, introduces a new anchor system for post-tensioning Glass FRP
(GFRP) bars. Due to anchorage limitations, the use of GFRP bars in post-tensioning
applications has been limited.
Finally, Section Eight provides conclusions and recommendations for future works in
the area of masonry strengthening with FRP composites.

University of Missouri - Rolla - C.I.E.S. Università degli studi di Genova - D.I.S.E.G.
25
2. THE FRP MATERIALS
2.1. Composite Materials Composite materials are a unique class of materials made by combining two or more
materials to obtain a new material that has properties from both components.
These materials offer some significant advantages to metals in many structural
applications due to the ability to select various combinations of fiber reinforcement
and resin material. A composite material can be selected from this spectrum to
provide the optimal choice to meet application requirements.
Composite materials are composed of a matrix material reinforced with any of a
variety of fibers (reinforcing phase) made from ceramics, metals, or polymers. The
reinforcing fibers are the primary load carriers of the material, with the matrix
component transferring the load from fiber to fiber. Reinforcement of the matrix
material may be achieved in a variety of ways: fibers may be either continuous or
discontinuous, and the reinforcement may also be in the form of particles (Figure
2.1).
Selection of the optimal reinforcement form and material is dependent on the property
requirements of the finished part.
Fig. 2.1. Reinforcement of matrix material

University of Missouri - Rolla - C.I.E.S. Università degli studi di Genova - D.I.S.E.G.
26
The advantages of composite materials over metals are:
• Light weight
• Can tailor the fiber/resin mix to meet
• Meet stiffness/strength/manufacturing requirements
• Reduced machining
• Resistance to corrosion
• Resistance to fatigue damage
• Good damping characteristics
• Low coefficient of thermal expansion
Weight: A weight savings of 27% is attainable in most structures. This is due to the
lower density of composites, which range (depending on material form) from 1246
kg/m3 (0.045 lb/in3) to 1800 kg/m3 (0.065 lb/in3) as compared to 2768 kg/m3 (0.10
lb/in3) for aluminum. Some applications may require thicker composite sections to
meet strength/stiffness requirements, however, a weight savings will still result.
Part consolidation: Consolidating many parts in an assembly into one part is a major
benefit gained by using composite materials. It enables the designer to go beyond
mere material substitution and produce true composite parts. Complex shapes can be
produced. Part consolidation reduces part count, fasteners and assembly time. The
attachment areas of parts are where the majority of failures occur, due to high point
loads and stress concentrations; elimination of these interfaces improves the
reliability of the structure.
Cost: Low cost, high volume manufacturing methods are used to make composites
cost competitive with metals: tooling costs for high volume production of metals and
composites parts are similar and also the production labor time is similar, so the
higher cost of composite parts is mostly due to high raw material costs; a judicious
selection of the optimal material for the part (not the best material) and of the
suppliers will control these costs and can minimize the cost penalty.
Composite performance: Composites have inherent properties that provide
performance benefits over metals. A wide range of fibers and resins are available to

University of Missouri - Rolla - C.I.E.S. Università degli studi di Genova - D.I.S.E.G.
27
select the optimal material combination to meet the structural requirements. The
strength-to-weight and stiffness-to-weight ratios are the primary reasons composites
are used. The fiber reinforcements provide good damping characteristics and high
resistance to fatigue and most resins provide very good resistance to chemicals and
corrosion. The fracture toughness of composites is better than aluminum castings; by
their nature, castings basically have built-in notches that can catastrophically fracture
under impact. The fiber reinforcement of composites alter this failure sequence;
resulting in an increased resistance to impact. The impact toughness of composites
can be maximized by fiber selection, length of fiber and use of tougher resin such as
thermoplastics.
Composite materials will provide structure that saves weight and has better
performance over the competing metallic structure. The structure will be more
durable and tougher. Composites will enable the consolidation of parts thus
improving the reliability of the structure and keeping the costs competitive with
metallic structure. In the passed thirty years, new composite materials appeared in the
market: the fiber reinforced polymeric (FRP) materials.
The composite industry associations and materials producers track the FRP
composites shipments in eight primary markets like shown in figure 2.2.
Note: Includes shipments of reinforced thermoset and thermoplastic resin composites, reinforcements
and fillers.
Fig. 2.2. SPI Composites Institute, May 1999
10.1%
3.3%
31.6%
20.8%
11.8% 0.6% 6.3% 5.5% 10.0%
Marine
Other
Transportation
Construction
Corrosion/Resistant
Aircraft
Consumer
Appliance/BuisnessEquipmentElectrical/Electronic

University of Missouri - Rolla - C.I.E.S. Università degli studi di Genova - D.I.S.E.G.
28
The composites industry has shown growth over the past ten years and is projected to
increase as FRP composites are accepted in new markets. Figure 1.3 shows the
growth of FRP composites during these years.
Fig. 2.3. Growth of FRP composites from 1970 to 2000
2.2. FRP Composites
Fiber reinforced polymers (FRP) are a particular typology of composite materials,
made of high resistance fibers impregnated with polymeric resins. The mixing result
is a material with tensile properties between fiber’s and resin’s one (Figure 2.4).
Fig. 2.4. Comparison among fiber’s, resin’s and composite’s tensile properties
0
500
1000
1500
2000
2500
3000
3500
4000
1969 1979 1989 1999
Years
Poun
ds S
hipp
ed (i
n m
illio
ns)
Resin
Fiber
FRP Composite
STRAIN
TEN
SILE
STR
ESS
University of Missouri - Rolla - C.I.E.S. Università degli studi di Genova - D.I.S.E.G.
29
They are characterized by excellent tensile strength in the direction of the fibers and
by negligible strength in the direction transverse to the fibers; this illustrates the
anisotropic nature of these materials. FRP composites do not exhibit yielding, but
instead are elastic up to failure and they are also characterized by relatively low
modulus of elasticity in tension and low compressive properties.
Their function usually consists in adsorbing tensile stress due to shear and flexural
actions. Often, among the reachable advantages, are also the increase of the overall
stiffness and ductility.
FRP’s properties make these materials particularly suitable for structural applications,
especially in support or substitution of steel.
The general advantages of FRP reinforcement compared to steel are:
• Durability in aggressive environments
• High strength-to-density ratio
• Magnetic and electric neutrality
• Low specific weight
• Low axial coefficient of thermal expansion
Without underlining the importance of a lower installation cost, the use of FRP
composites possesses some advantages compared to traditional retrofitting methods;
as an example, the disturbance of the occupants is minimal and there is no loss of
valuable space. In addition, from the structural point of view, the dynamic properties
of the structure remain unchanging because there is no addition of weight that would
lead to increases in seismic forces.
FRP products are commercialized in different shapes: rods, tendons, laminates and
three-dimensional components.
FRP reinforcement comes in the shape of rods of circular cross-sections, strips of
rectangular cross-sections, strands, and laminates, which enable different types of
applications. Figure 2.5 shows different kinds of FRP.

University of Missouri - Rolla - C.I.E.S. Università degli studi di Genova - D.I.S.E.G.
30
Fig. 2.5. Different kinds of FRP
The Fibers
The three most common types of FRP used in construction are made of carbon,
aramid or glass fibers.
• Carbon Fibers: Fiber produced by heating organic precursor materials
containing a substantial amount of carbon (93÷95%), such as rayon,
polyacrylonitrile (PAN), or pitch (a black residue from the distillation of
petroleum) in an inert environment. This kind of fibers is the strongest,
stiffest, and most durable; they are more expensive than glass fibers but offer
an excellent combination of strength, low weight, high modulus and fatigue
properties.
• Aramid Fibers (ex. Kevlar): Highly oriented organic fiber derived from
polyamide incorporating into aromatic ring structure. This kind of fibers
offers excellent impact resistance, a good electric and temperature insulating
properties and they are also resistant to organic solvents, fuels and lubricants.
They have a medium modulus and a very low density as compared to glass
and carbon.
It is available in tows, yarns and various woven cloth products.
• Glass Fibers: Fiber drawn from an inorganic product of fusion that has
cooled without crystallizing. E-Glass fibers are considered the predominant
reinforcement for polymer matrix composites, due to their high electrical
University of Missouri - Rolla - C.I.E.S. Università degli studi di Genova - D.I.S.E.G.
31
insulating properties and low susceptibility to moisture. Other commercial
composition includes S-Glass, with higher strength, heat resistance and
modulus, as well as some specialized glass reinforcements with improved
chemical resistance, such as AR Glass (alkali resistant). On the other hand,
these products are very expensive. Glass produces a common, low-cost
reinforcing fiber, but they weight more than carbon or aramid and the lower
modulus requires special design treatment where stiffness is critical. Glass has
been the predominant fiber for many civil engineering applications because of
an economical balance of cost and specific strength properties.
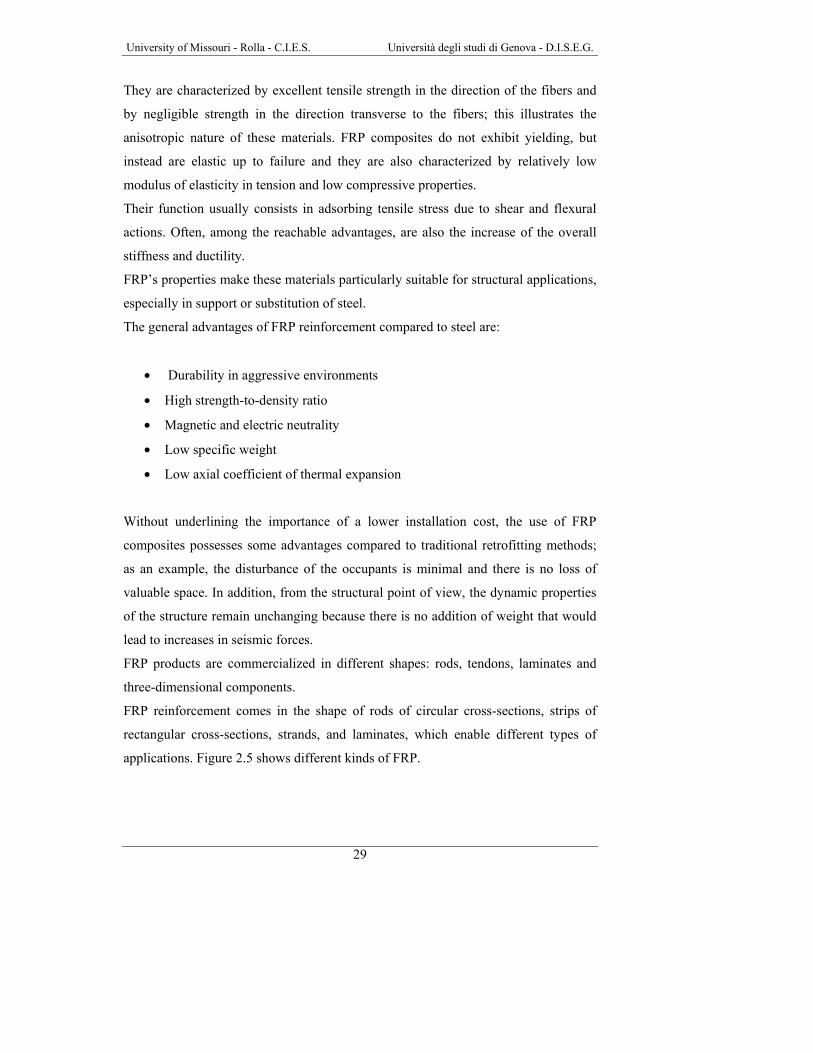
A comparison based on fiber area only among sheets made of carbon (CFRP), aramid
(AFRP), glass (GFRP) and reinforcing steel in terms of stress-strain relationship is
illustrated figure 2.6.
Note: 1 ksi = 6.89 MPa
Fig. 2.6. Comparison among AFRP, CFRP, GFRP and Steel
FRP Sheets

University of Missouri - Rolla - C.I.E.S. Università degli studi di Genova - D.I.S.E.G.
32
The matrix
The FRP matrix consists of a polymer, or resin, used as a binder for the reinforcing
fibers, and it has two main functions: it enables the load to be transferred among
fibers and protects the fibers from environmental effects.
The resin is fundamental for interlaminate and in-plane shear strength: the
interlaminate strength is important for the structures inflection and the in-plane
strength is important for the torsion. Furthermore, FRP workability and defects
depend of some physical-thermal resin’s properties like viscosity, vulcanization temp
and melting point.
Polymeric resins are subdivided in two big categories, thermosetting and
thermoplastic:
• The thermosetting polymers after the vulcanization (with energy under
appearances of heat energy or with catalysts) are insoluble and not melt also
with high temperature.
• The thermoplastic polymers are instead soluble, because they have a low
molecular bond; so, these resins can be weak, melted and mold infinite times.
The glass transition temperature (Tg) is used to measure the softening of cured resin.
Generally the resins are isotropic and they have an elastic-brittle behavior.
Also if the thermoplastic resins had a large development as for thermosetting
polymers, there are still many problems to soak the fibers. Thus, in the field, there are
three types of commonly available thermo-setting resins: epoxy, vinyl ester and
phenolic.
• Epoxy resins are the most common and have excellent structural properties as
well as excellent adhesion characteristics; a major benefit of epoxy resins is
their lower shrinkage. Epoxy can also be formulated with different materials
or blended with other epoxy resins to achieve specific performance features.
Epoxies are used primarily for fabricating high performance composites with

University of Missouri - Rolla - C.I.E.S. Università degli studi di Genova - D.I.S.E.G.
33
superior mechanical properties and good performance at elevated
temperatures; this kind of resin has particularly good UV resistance and their
maximum use temperature is on the order of 93° C (200° F). Epoxy resins are
available in a range of viscosities, and will work with a number of curing
agents or hardeners.
• Vinyl ester resins are a lower cost matrix material with good durability
characteristics, excellent corrosion resistance and very good mechanical
toughness, but they have lower structural performance and low resistance to
heat. Vinyl esters were developed to combine the advantages of epoxy resin
with the better handling/faster cure, which are typical for unsaturated
polyester resins.
• Phenolic are a class of resins commonly based on phenol and formaldeyde.
Phenolic composites have many desirable performance qualities include high
temperature resistance, creep resistance, excellent thermal insulation and
sound damping properties, corrosion resistance and excellent fire/smoke
toxicity properties.
Phenolic appears the most important resin, but epoxy and vinyl ester are the most
commonly used because of durability and adhesion properties.
For example, table 2.1 reports the main mechanical properties of a common epoxy
resin. Tab. 2.1. Typical properties of the epoxy resin
Properties Values Density 1200 kg/m3
Elastic modulus 3.4 GPa Shear modulus 1.308 GPa Tensile strength 72 MPa
Note: 1000 kg/m3 = 0.036 lb/in3; 1 MPa = 145 psi
Thermosetting resins are generally heat activated, or cured, from an initial liquid
state. Resins are often combined with additives and fillers for environmental

University of Missouri - Rolla - C.I.E.S. Università degli studi di Genova - D.I.S.E.G.
34
resistance, flame resistance, appearance, and cost reduction.
Fillers The use of inorganic fillers in composites is increasing; they not only reduce the cost
of composites, but also frequently impart performance that might not otherwise be
achieved by the reinforcement and resin ingredients alone.
These materials improve the following performance:
• They reduce the shrinkage of the composites part
• They influence the fire resistance
• They can influence the mechanical strengths of composites
• Crack resistance and crack prevention properties are improved with filled
resin systems
• Uniformity of the laminates can be enhanced by use of fillers
There are a lot of inorganic filler materials that can be used with composites including
Calcium Carbonate (the most used), Kaolin, Alumina trihydrate, Calcium sulfate
etc…
Additives A wide of additives are used in composites to modify materials properties and tailor
the FRP performance. Additive used in thermosetting composites include the
following:
• Fire resistance (in place of fillers)
• Viscosity control
• Toughness
• Heat stabilizers
• Ultraviolet stabilizers

University of Missouri - Rolla - C.I.E.S. Università degli studi di Genova - D.I.S.E.G.
35
2.3. FRP Reinforcement Forms
Reinforcements are available in forms to serve a wide range of processes and end-
product requirements and they can be obtained using multi-end or single-end roving.
Multi-end roving consists of many individual strands or bundles of filaments, which
are than chopped and randomly deposited into the resin matrix; these products can be
used in pultrusion application.
The single-end roving consists of many individual filaments wound into a single
strand. The product is generally used in processes that utilize a unidirectional
reinforcement.
Materials supplied as reinforcement include:
• Mats
• Woven, stitched, braided & 3D fabrics
• Unidirectional
• Bars
• Laminates
Mats Reinforcing mats are usually described by weight-per-unit-of-area; the type and
amount of binder that is used to hold the mat together dictate differences between mat
products.
Woven, stitched, braided & 3D fabrics There are many types of fabrics that can be used to reinforce resin in a composite.
Multidirectional reinforcements are produced by weaving, knitting, stitched or
braiding continuous fibers into a fabric form twisted and plied yarn.
Fabrics allow the precise placement of the reinforcement.
- Woven fabrics are fabricated on looms in a variety of weights, weaves and widths.
In a plain weave, each fill yarn or roving is alternately crosses over and under each
University of Missouri - Rolla - C.I.E.S. Università degli studi di Genova - D.I.S.E.G.
36
warp fiber. This work allows the fabric to be more drapeable and conform to curved
surface.
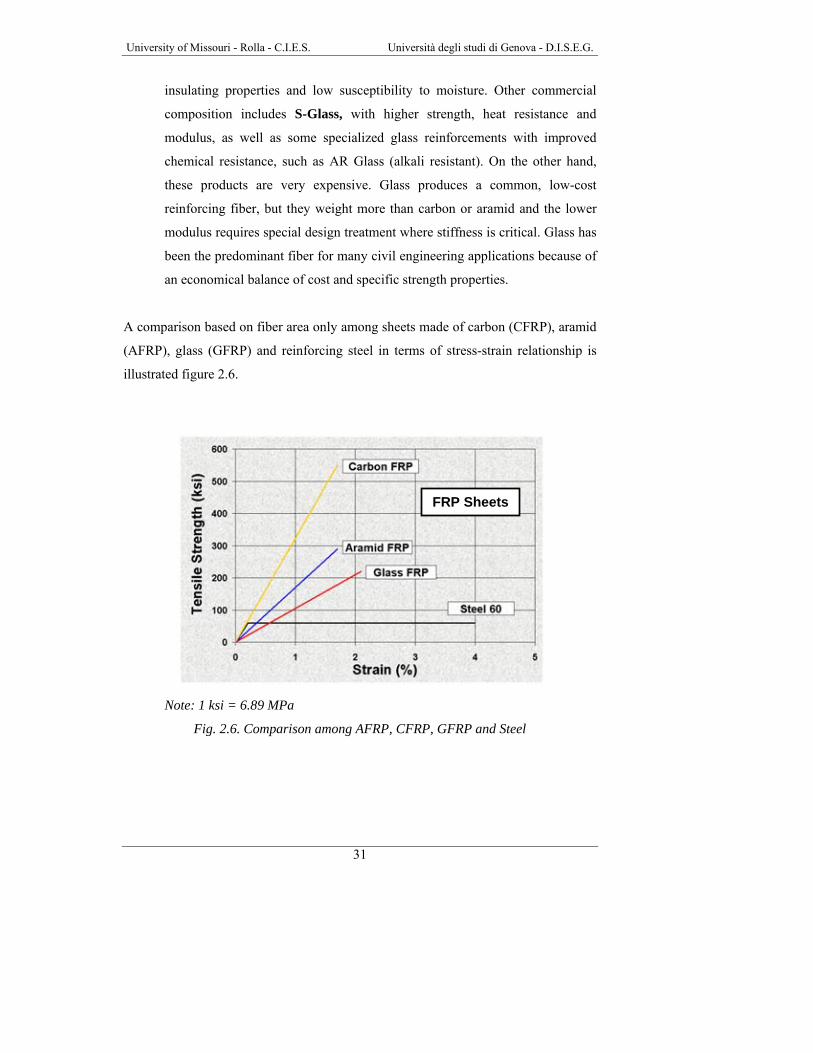
- Stitched fabrics have optimized strength properties because of the fiber architecture.
Stitched fabrics are produced by assembling successive layers of aligned fibers.
Typically, the available fiber orientations include the 0° direction (warp), 90°
direction (weft) and 45° direction (bias). This type of construction allows for load
sharing between fibers so that a higher modulus, both tensile and flexural, is typically
observed. Multiple orientations provide a quasi-isotropic reinforcement. Figure 2.7
shows the typical fiber’s orientation.
Fig. 2.7. Diagram of stitched triaxial and quadriaxial fabrics
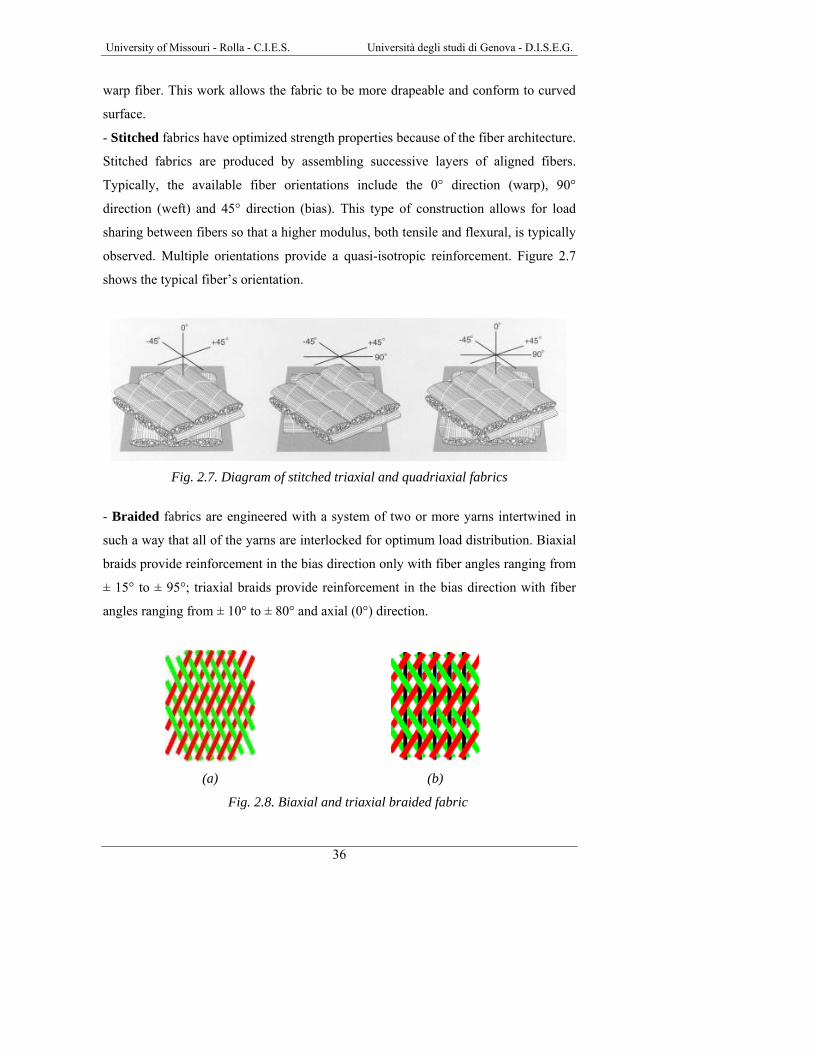
- Braided fabrics are engineered with a system of two or more yarns intertwined in
such a way that all of the yarns are interlocked for optimum load distribution. Biaxial
braids provide reinforcement in the bias direction only with fiber angles ranging from
± 15° to ± 95°; triaxial braids provide reinforcement in the bias direction with fiber
angles ranging from ± 10° to ± 80° and axial (0°) direction.
(a) (b)
Fig. 2.8. Biaxial and triaxial braided fabric

University of Missouri - Rolla - C.I.E.S. Università degli studi di Genova - D.I.S.E.G.
37
- A 3-D fabrics use a special weaving process that ties multiple layers and multiaxial
fibers together with “Z-yarns”. This Z improves the integrity of the fabric. This
technology is capable to make forms for panels and structural profiles.
Fig. 2.9. 3-D fabric weaving process
Unidirectional
Unidirectional reinforcements include tapes, tows and roving. Fibers in this form are
all aligned parallel in one direction and the composites that use this method have high
strength in the fiber direction. Unidirectional sheets are thin and multiple layers are
required for most structural application.
Bars
FRP bars are anisotropic, with the longitudinal axis being the major axis. Their
mechanical properties can vary significantly from one manufacturer to another and
within the same product. They are made for braiding, weaving or pultrusion that is a
continuous molding process that combines fiber reinforcements and thermosetting
resin. Figure 2.10 illustrates the pultrusion process that is used in the fabrication of
composite parts that have a constant cross-section profile.

University of Missouri - Rolla - C.I.E.S. Università degli studi di Genova - D.I.S.E.G.
38
Fig. 2.10. Manufacturing process: pultrusion
The pultrusion process is normally continuous and highly automated: reinforcement
materials are positioned in a specific location using preforming shapers or guides to
form the profile. The reinforcements are drawn through a resin bath or wet-out where
the material is thoroughly coated or impregnated with a liquid thermosetting resin;
than the resin-saturated reinforcements enter a heated metal pultrusion die; the
dimensions and shape of the die will define the finished part being fabricated. Inside
the metal die, heat is transferred initiated by precise temperature control to the
reinforcements and liquid resin. The heat energy activates the curing or
polymerization of the thermoset resin changing it from a liquid to a solid; the solid
laminate emerges from the pultrusion die to the exact shape of the die cavity. The
laminate solidifies when cooled and it is continuously pulled through the pultrusion
machine and cut to the desired length.
The process is driven by a system of caterpillar or tandem pullers located between the
die exit and the cut-off mechanism.
In order to improve the bond performance through mechanical interlock, the rods are
produced by manufacturers in various types and with different deformation systems,
including exterior wound fibers, sand coating and separately formed deformations.
Figure 2.11 shows different kinds of FRP bars.

University of Missouri - Rolla - C.I.E.S. Università degli studi di Genova - D.I.S.E.G.
39
Fig. 2.11. Different kinds of FRP bars
Laminates
Lamination technology is based on the joining or bonding of two or more laminae to
form a laminate. The materials can vary in type and mechanical properties in addition
to property specific orientation; there are three types of laminated construction, these
include sandwich lamination consisting of at least two high stiffness and strength
outer layers connected by a core.
All laminate constructions utilize relatively high strength/stiffness materials.
Figure 2.12 illustrates an example of multi-ply construction. The figure shows the
different orientation of the layers.
Fig. 2.12. Multi-ply Construction

University of Missouri - Rolla - C.I.E.S. Università degli studi di Genova - D.I.S.E.G.
40
2.4. FRP Physical and Mechanical Properties In the following paragraphs a brief description of the main mechanical and physical
properties for some kinds of FRP is presented.
FRP Bars
FRP bars offer advantages over steel reinforcement because FRP bars are non-
corrosive and non conductive; the available FRP bars are made of aramid, carbon or
glass.
Factors, such as fiber volume, type of fiber, type of resin, fiber orientation,
dimensional effects and manufacturing methods play a major role in establishing
product characteristics.
The relative volume of fibers and resin in the product affects the properties of FRP
rods; a usual fiber volume is between 0.5 and 0.7. Furthermore, the mechanical
properties of FRP bars, like all structural materials, are affected by factors such as
loading history and duration, temperature and moisture.
FRP bars have a density ranging from four to six times smaller than that of steel; the
reduced weight leads to lower transportation costs and decreased handling and
installation time per bar on the job site.
Coefficient of thermal expansion and effects of high temperatures
The coefficients of thermal expansion of FRP bars vary in the longitudinal and
transverse directions depending on the types of fiber, resin and volume fraction fiber.
Table 2.2 lists the longitudinal and transverse coefficients of thermal expansion for
typical FRP bars and steel bars: note that a negative coefficient of thermal expansion
indicates that the material contracts with increased temperature and expands with
decreased temperature.

University of Missouri - Rolla - C.I.E.S. Università degli studi di Genova - D.I.S.E.G.
41
Tab. 2.2. Typical coefficients of thermal expansion for reinforcing bars
Direction Steel GFRP CFRP AFRP
Long, αl 11.7x10⁻⁶ °C (6.5x10⁻⁶ /°F)
6 to 10x10-6 °C (3.3 to 5.6 x10⁻⁶/°F)
-2 to 0x10-6°C (-4 to 0 x10-6 /°F)
-6 to 2x10⁻⁶/°C (-3.3 to –1.1x10⁻⁶/°F)
Trans, αT 11.7x10⁻⁶/°C (6.5x10⁻⁶ /°F)
21 to 23x10-6 /°C (11.7 to 12.8x10⁻⁶/°F)
23 to 32x10-6/°C (41 to 58 x10-6 /°F)
60 to 80x10-6 /°C (33.3 to 44.4x10⁻⁶/°F)
The use of FRP reinforcement is not recommended for structures in which fire
resistance is essential to maintain structural integrity, because the polymers will
soften due to the excessive heat. Beyond the glass-transition temperature, the elastic
modulus of a polymer is significantly reduced due to changes in its molecular
structure; however, the tensile properties of the overall composite are reduced due to
a reduction in force transfer between fibers through bond to the resin.
Other properties more directly affected by the shear transfer through the resin, such as
shear and bending strength, are reduced significantly at temperatures above the Tg.
Structural collapse can be avoided if high temperatures are not reached at the end
regions of FRP bars allowing anchorage to be maintained.
Mechanical properties and behavior
• Tensile behavior
Ultimate tensile strength of FRP bars is reached without exhibiting any plastic
yielding; the tensile behavior is characterized by a linearly elastic stress-strain
relationship until failure.
Unlike steel bars, some FRP bars exhibit a substantial size effect: the fibers located
near the center of the bar cross section are subjected at less stress as for the fibers that
are near the outer surface. This phenomenon results in reduced strength and
efficiency in large diameter bars; for example, in a study GFRP bars from three
different manufacturers show tensile strength reductions of up to 40% as the diameter
increases proportionally from 9.5 to 22.2 mm (0.375-0.875 in.).

University of Missouri - Rolla - C.I.E.S. Università degli studi di Genova - D.I.S.E.G.
42
Table 2.3 illustrates the tensile properties of some commonly used FRP bars.
Tab. 2.3. Usual tensile properties of reinforcing bars
Steel GFRP CFRP AFRP Tensile strength,
(MPa) 483-690
483-1600
600-3690
1720-2540
Elastic modulus
(GPa) 200
35-51
120-580
41-125
Yield strain, % 0.14-0.25 N/A N/A N/A
Rupture strain, % 0.6-0.12 1.2-3.1 0.5-1.7 1.9-4.4 Note: 1 MPa = 145 psi.
Strength and stiffness variations will occur in bars with various fiber-volume
fractions, even in bars with the same diameter, appearance, and constituents.
• Compressive behavior
Compressive strengths of 55%, 78%, and 20% of the tensile strength have been
reported for GFRP, CFRP, and AFRP, respectively.
The compressive modulus of elasticity of FRP reinforcing bars appears to be smaller
than its tensile modulus of elasticity; according to reports, the compressive modulus
of elasticity is approximately 80% for GFRP, 85% for CFRP, and 100% for AFRP of
the tensile modulus of elasticity for the same product.
Standard test methods are not yet established to characterize the compressive
behavior of FRP bars; if the compressive properties of a particular FRP bar are
needed, these should be obtained from the bar manufacturer.
However it is not recommended to rely on FRP bars to resist compressive stresses.
• Shear behavior
Most FRP bar composites are relatively weak in interlaminar shear where layers of
unreinforced resin lie between layers of fibers, because there is usually no
reinforcement across layers, and the interlaminar shear strength is governed by the
University of Missouri - Rolla - C.I.E.S. Università degli studi di Genova - D.I.S.E.G.
43
relatively weak polymer matrix. This shortcoming can be overcome by orienting the
FRP bars so that they resist the applied loads through axial tension.
Standard test methods are not yet established to characterize the shear behavior of
FRP bars.
• Bond behavior
Bond performance of an FRP bar is dependent on the design, manufacturing process,
mechanical properties of the bar itself, and the environmental conditions.
The bond force of an embedded bar can be transferred by:
• Adhesion resistance of the interface, also known as chemical bond
• Frictional resistance of the interface against slip
• Mechanical interlock due to interface irregularity.
Handling of FRP bars
FRP reinforcing bars are susceptible to surface damage and the puncturing their
surface can significantly reduce the strength capacity; in the case of glass FRP bars,
the surface damage can cause a loss of durability due to infiltration of alkalis. The
following handling guidelines are recommended to minimize damage to both the bars
and the bar handlers:
• FRP-reinforcing bars should be handled with work gloves to avoid personal
injuries from either exposed fibers or sharp edges
• FRP bars should not be stored on the ground, pallets should be placed under
the bars to keep them clean and to provide easy handling
• High temperatures, ultraviolet rays, and chemical substances should be
avoided
• When necessary, cutting should be performed with a high-speed grinding
cutter or a fine blade saw. FRP bars should never be sheared. Dust masks,
gloves, and glasses for eye protection are recommended when cutting because
there is insufficient research available to make any recommendation on
treatment of saw-cut bar ends.

University of Missouri - Rolla - C.I.E.S. Università degli studi di Genova - D.I.S.E.G.
44
FRP laminates, sheets and fabrics
One of the bests quality of these materials is the thickness because this property is
often requested for rehabilitate or restore the strength of a weakened structural
element, or retrofit or strengthen a sound structural element to resist increased loads
due to changes in use of the structure.
Coefficient of thermal expansion and effects of high temperatures
The coefficients of thermal expansion of unidirectional FRP materials differ in the
longitudinal and transverse directions, depending on the types of fiber, resin, and
volume fraction of fiber. Table 2.4 illustrates the typical coefficients of thermal
expansion for unidirectional materials.
Tab. 2.4. Typical coeff. of thermal expansion for unidirectional FRP materials
Direction Steel GFRP CFRP AFRP Long,
αl 11.7x10⁻⁶ °C (6.5x10⁻⁶ /°F)
6 to 10x10-6 °C (3.3 to 5.6 x10⁻⁶/°F)
-1 to 0x10-6°C (0.6 to 0 x10-6 /°F)
-6 to 2x10⁻⁶/°C (-3.3 to –1.1x10-
6/°F) Trans,
αT 11.7x10⁻⁶/°C (6.5x10⁻⁶ /°F)
19 to 23x10-6 /°C (10.4 to 12.6x10⁻⁶/°F)
22 to 50x10-6/°C (12 to 27 x10-6 /°F)
60 to 80x10-6 /°C (33 to 44x10-6/°F)
When there is high temperature, beyond the Tg, the elastic modulus of a polymer is
significantly reduced due to changes in its molecular structure; due to a reduction in
force transfer between fibers through bond to the resin, the tensile properties of the
overall composite are reduced. Test results have indicated that temperatures of 250°C
(480 °F), much higher than the resin Tg, will reduce the tensile strength of GFRP and
CFRP materials in excess of 20%.
Other properties affected by the shear transfer through the resin, such as bending
strength, are reduced significantly at lower temperatures.

University of Missouri - Rolla - C.I.E.S. Università degli studi di Genova - D.I.S.E.G.
45
Mechanical properties and behavior
• Tensile behavior
The properties of an FRP system should be characterized as a composite, recognizing
not just the material properties of the individual fibers but also the efficiency of the
fiber-resin system and fabric architecture.
The tensile properties of some commercially available FRP-strengthening systems are
summarized in table 2.5.
Tab. 2.5. Properties of some commercially available FRP systems
Fabric weight Ultimate strength(1) FRP-system description (fiber type/saturating resin/fabric type) g/m2 kN/m General purpose carbon/epoxy/ unidirectional sheet
200 400
500 625
High-strength carbon/epoxy/ unidirectional sheet
230 300 620
315 700 960
High-modulus carbon/epoxy/ unidirectional sheet 300 600
General-purpose carbon/epoxy/ balanced fabric 300 175
E-glass/epoxy/ unidirectional sheet
900 350
720 230
E-glass/epoxy/ balanced fabric 300 120
Aramid/epoxy/ unidirectional sheet 415 700
High-strength carbon/epoxy/ precured, unidirectional laminate 2385 3300
E-glass/vinyl ester/ precured, unidirectional shell 1695 1575
(1) Ultimate tensile strength per unit of sheet or fabric Note: 1000 g/m2 = 0.023 oz/in2 ; 1 kN/m = 5.7 Pd/in
Table 2.6 shows the typical tensile properties of FRP laminates with fiber volumes
between 40% to 60%.

University of Missouri - Rolla - C.I.E.S. Università degli studi di Genova - D.I.S.E.G.
46
Tab. 2.6. Tensile properties of FRP laminates with fiber volumes of 40% to 60%
(zero degrees represent unidirectional fiber orientation, zero/ninety degrees [or ±45 degrees] represents
fiber balanced in two orthogonal directions, where zero degrees is the direction of the load)
Young’s modulus Ultimate tensile strength Property at 0
degrees Property at 90
degrees Property at 0
degrees Property at 90
degrees
Rupture strain
at 0 degrees
FRP-system description (fiber orientation)
(GPa) (MPa) (MPa) (MPa) (%) High-strength carbon/epoxy, degrees 0 0/90 +45/-45
100-145 55-76 14-28
2-7 55-75 14-28
1025-2075 700-1025 175-275
35-70 525-1025 175-275
1.0-1.5 1.0-1.5 1.5-2.5
E-glass/epoxy, degrees 0 0/90 +45/-45
20-40 14-34 14-21
2-7 14-35 14-20
525-1400 525-1025 175-275
35-70 525-1025 175-275
1.5-3.0 2.0-3.0 2.5-3.5
High-perform. aramid/ epoxy, degrees 0 0/90 +45/-45
48-68 28-34 7-14
2-7 28-35 7-14
700-1725 275-550 140-205
35-70 275-550 (140-200
2.0-3.0 2.0-3.0 2.0-3.0
Note: 1 MPa = 145 psi.
• Compressive behavior
Generally, compressive strength are higher for materials with higher tensile strengths
except in the case of AFRP where the fibers exhibit nonlinear behavior in
compression at relatively low level of stress. For all others compressive behaviors,
see the paragraph on FRP bars.
Handling of FRP laminates, sheets and fabrics

University of Missouri - Rolla - C.I.E.S. Università degli studi di Genova - D.I.S.E.G.
47
Each FRP-system-constituent material has different handling and storage
requirements to prevent damage, so, the better way is the consults with the material
manufacturer for guidance.
There are precautions that should be observed when handling thermosetting resins
and their component materials. The workforce has to wear suits and gloves;
disposable rubber or plastic gloves are recommended and should be discarded after
each use. Gloves should be resistant to resins and solvents. Respiratory protection,
such as dust masks or respirators, should be used when fiber fly, dust, or organic
vapors are present.
2.5. Durability of FRP Materials The most significant technical obstacle preventing the extended use of FRP is a lack
of long-term and durability performance data comparable to the data available for
more traditional construction materials. Although there have been numerous studies
on creep, stress corrosion, fatigue, environmental fatigue, chemical and physical
ageing and natural weathering of composites, most of these are not related for civil
engineering application. Therefore the lack of durability data generate, at the moment,
a big obstacle: a majority of civil engineers are not familiar with composites and are
skeptical about using of FRP to replace conventional materials in the structures.
It was already mentioned that corrosion problems of steel reinforcement and the good
mechanical properties of FRP materials opened a large field for the use of composite
in new constructions and for repairing purposes, but the determination of the
durability is one of the most important issues.
Durability of material can be defined as its ability to resist cracking, oxidation,
chemical degradation, delamination, wear and the effects of foreign object damage
for a specified period of time under specified environmental conditions.
Damage tolerance is defined as the ability of a material or structure to resist failure
and continue performing at prescribed levels of performance in the presence of
damage for a specified period of time under specified environmental conditions.
The overall concept is illustrated schematically in the figure 2.13.

University of Missouri - Rolla - C.I.E.S. Università degli studi di Genova - D.I.S.E.G.
48
Fig. 2.13. Concepts of durability and damage tolerance design
The performance of FRP composites is given on the interactions between the selected
constituent materials (fibers, resin, fillers and additives), determination of
microstructure/architecture and geometrical configuration and influences of the
appropriate manufacturing process.
Moisture (water) absorption
All resins adsorb moisture with the percentage of moisture absorption depending on
the resin structure, degree of cure and water temperature. In general moisture effects
over the short-term cause degradation in strength rather than stiffness levels in a
composite.
Moisture absorption in FRP composite depends on type of resins, laminate
composition, thickness, laminate quality, curing condition, fiber/resin interface and
manufacturing process. In some applications, performance is improved with the use
of corrosion barrier.
Alkaline solutions Alkaline solutions, such as the pore water of concrete, have a high pH and high
concentration of alkali ions. This combination has no relevant effect on carbon
reinforcement but may lead to degradation at the resin matrix and/or interface levels
(strength and stiffness have been reported to each decrease between 0-20%).

University of Missouri - Rolla - C.I.E.S. Università degli studi di Genova - D.I.S.E.G.
49
Tensile strength reductions in GFRP bars ranging from zero to 75% of initial values
have been reported in literature, while tensile stiffness reductions in GFRP bars range
between zero and 20%.
Tensile strength and stiffness of AFRP rods in elevated temperature alkaline solutions
either with and without tensile stress applied has been reported to decrease between
10-50% and 0-20% of initial values, respectively.
Resin damage via alkali is generally more severe than that due to moisture.
Aggressive chemical solutions
FRP composites generally exhibit a variable performance when exposed to solution
such as acids or corrosives; the resin type primarily influences this performance.
In the case of CFRP immersed in hydrochloric acid at the temperature of 80°C, the
tensile strength reduced about 20% after 120 days.
Reports have reported that the tensile stress of glass fiber reduced rapidly with time
when immersed in any of the solution (NaOH, HCl, H2O) at the temperature of 80°C
and when immersed in sodium hydroxide (Uomoto et al., 1999). For the AFRP
(Technora fiber), has been reported that after immersing for 90 days, strength reduced
about 80% in hydrochloric acid and about 45% in sodium hydroxide solution.
However no particular sign of degradation were observed when the AFRP were
immersed in distilled water at temperatures of 20, 40 and 80°C (Uomoto et al., 1999).
Sub-zero and freeze-thaw exposure
Composites display excellent freeze-thaw resistance and are expected to withstand
years of sub-zero conditions and hundreds of freeze-thaw cycles, with minimal loss of
properties.
In general, freeze-thaw exposure does not affect fibers although it can affect the resin
and the fiber/resin interface.

University of Missouri - Rolla - C.I.E.S. Università degli studi di Genova - D.I.S.E.G.
50
Temperature and thermal cycling (above zero)
The primary effects of temperature are on viscoelastic response of the resin and hence
of the composites. If the temperature exceeds the glass transition temperature (Tg),
FRP composite performance can be expected to drop.
Thermal cycling in general does not cause deleterious effects, although extended
cycles of brittle resin systems can result in microcrack formation.
Creep and relaxation
FRP subjected to a constant load over time can suddenly fail after a time period called
the endurance time. This phenomenon is known as creep rupture (or static fatigue).
Creep rupture is not an issue with steel bars in reinforced concrete except in
extremely high temperatures such as those encountered in a fire.
The creep rupture endurance time can also irreversibly decrease under sufficiently
adverse environmental conditions, such as high temperature, ultraviolet radiation
exposure, high alkalinity, wet and dry cycles, or freezing-thawing cycles.
In general, carbon fibers are the least susceptible to creep rupture. Aramid fibers are
moderately susceptible, and glass fibers are most susceptible to creep rupture.
Results indicated that a linear relationship exists between creep rupture strength and
the logarithm of time for times up to nearly 100 hr. The ratios of stress level at creep
rupture to the initial strength of the GFRP, AFRP, and CFRP bars after 500,000 hours
(more than 50 years) were linearly extrapolated to be 0.29, 0.47, and 0.93,
respectively.
Creep will not be a significant factor if the load to the structure is kept within
manufacturer recommended stress levels.
For a typical civil infrastructure composite application, the creep-stress relaxation
properties are dominated by the resin-dependent properties, rather than on the fiber or
interfacial properties.

University of Missouri - Rolla - C.I.E.S. Università degli studi di Genova - D.I.S.E.G.
51
Traditionally glass-fiber reinforced composites have been designed to ensure that
stress levels under sustained do not exceed 25-30% of ultimate to avoid premature
failure due to stress rupture.
Fatigue
FRP composites show significantly enhanced fatigue resistance over metallic
materials. However, FRP composites structures are still susceptible to failure at joints
and connections under fatigue loading and must be designed to reduce stress
concentrations and geometrical discontinuities, which decrease overall fatigue
resistance. Fatigue failure in FRP composites is usually initiated through fiber/matrix
debonding and matrix microcracking.
Although the data on fatigue is in large structural application is limited, the data that
is available indicates that fatigue failure is unlikely to occur at the lower stress levels
used in design except at the joints and connection details.
Of all types of current FRP composites for infrastructure application, CFRP is
generally thought to be the least prone to fatigue failure like E-glass and S-glass, but,
for the last two types, environmental factors play an important role in the fatigue
behavior due to their susceptibility to moisture, alkaline and acidic solutions.
Aramid fibers, for which substantial durability data are available, appear to behave
similarly to carbon and glass fibers in fatigue.
Ultraviolet (UV) radiation
In general, effects are rarely severe in terms of mechanical performance, although
some resins can show significant embrittlement and surface erosion.
The most deleterious effect of UV exposure is probably not the UV-related damage,
but the potential for increased penetration of moisture and other agents via the
damaged region.
FRP composites can be protected from UV-related degradation through the use of
appropriate additives in the resin and/or use of appropriate coatings.

University of Missouri - Rolla - C.I.E.S. Università degli studi di Genova - D.I.S.E.G.
52
Fire and high thermal exposure
All polymeric systems degrade in the presence of extreme heat over prolonged
periods. The primary effect in most fires is that of resin degradation and softening
followed by charring of surface layers, which often causes the FRP composites to
self-extinguish.
In critical applications, the FRP may be fireproofed with the use of special fire-
resistant additives, intumescent coatings and the addition of inorganic fillers, but
these increases the costs and however depending on the application (may not be
possible). The usual method to achieve the necessary structural fire rating is to use the
FRP reinforcement as supplemental reinforcement: with this concept, the existing
structure will not be able of total collapse without FRP reinforcement.
In FRP reinforced concrete the concrete itself acts as a thermal barrier reducing
effects of thermal load.

University of Missouri - Rolla - C.I.E.S. Università degli studi di Genova - D.I.S.E.G.
53
3. FRP INSTALLATION TECHNIQUE
3.1. The Wet-lay-up System The use of Fiber Reinforced Polymer (FRP) materials for external strengthening of
RC, PC, and masonry structures has emerged as one of the most exciting and
promising technologies in materials and structural engineering.
As a result, their use in repair/rehabilitation can present many significant advantages
with respect to the conventional methods.
Externally bonded FRP laminates have been successfully used to increase the flexural
and/or shear capacity (sometimes also the stiffness) of RC beams, to provide
confinement to RC columns, and to strengthen masonry walls subjected to out-of-
plane as well as in-plane loading. A notable amount of experimental research has
been carried out and is currently ongoing towards the characterization of RC and
masonry structures strengthened with this technique (De Lorenzis, 1999).
With wet-lay-up, the strengthening system can easily be installed in a series of few
steps; the fiber materials (like fabrics, sheets etc.) are placed on the surface dry and
then impregnated with epoxy resins to form an FRP laminate.
The integrity of the system depends on the quality and strength of the masonry as
well as the bond between the FRP and the masonry. The following list provides
general guidelines for the FRP reinforcement, because many bond-related failures
may be avoided with few recommendations:
• Fibers cannot turn inside corners
• Provides a minimum of ≅13 mm (½ inch) radius when the sheets turn outside
the corners
• Inject all cracks prior to FRP installation
• Avoid surface irregularities

University of Missouri - Rolla - C.I.E.S. Università degli studi di Genova - D.I.S.E.G.
54
Fig. 3.1. FRP Laminates
The procedure can be summarized as follows:
• Preparation of the substrate
• Application of primer
• Application of putty
• Application of the first coat of saturant
• Application of reinforcement
• Application of the second coat of saturant
• Application of additional reinforcement plies
Preparation of the substrate First of all, the substrate must be prepared to accept the system, so, the surface of the
masonry should be free of unsound materials; dust, dirt, oil etc. should be removed.
Masonry generally does not need to be roughened with sandblasting or something
similar because is a porous structure (not like concrete). However, if the FRP is
applied directly on the plaster, the surface needs to become roughened using
sandblasting or a grinder.
Masonry Substrate or Retooled Surface
Primer
1° coat of saturantFiber sheet
2° coat of saturant

University of Missouri - Rolla - C.I.E.S. Università degli studi di Genova - D.I.S.E.G.
55
Application of primer After surface preparation, the primer is applied on the surface using a short nap roller.
Fig. 3.2. Application of the primer
The primer is a 100% solid epoxy and is applied to provide adequate bond to the base
masonry (it is formulated to penetrate the pores).
Application of putty The putty is applied, when required, on a surface using a trowel. It should be used to
fill any surface defects so complete coverage is not necessary. When surface defects
are not present, putty is not required.
Fig. 3.3. Application of the putty

University of Missouri - Rolla - C.I.E.S. Università degli studi di Genova - D.I.S.E.G.
56
The putty can also be used for leveling and patching small holes and it has to be
applied on a freshly primed surface without waiting for the primer to cure.
Application of the first coat of saturant The saturant is applied to the primed and puttied surface with a medium nap roller.
Fig. 3.4. Application of the first coat of saturant
It is used to impregnate the dry fibers and it maintains the fibers in their intended
orientation, distributes the stress and protects them from abrasion and environmental
effects. The saturant is formulated to quickly wet the fibers and hold the sheet in
place while the system cures. The volume of saturant depends on the FRP sheets
used.
Application of reinforcement Reinforce is prepared before, using a scissors, in sheets and is placed on the masonry
surface, dry of saturant, with a delicate pressure into the saturant.
The reinforcement should be cut to the appropriate length and width prior to
application. The dry sheets are then placed into the saturant in the proper orientation
by delicately pressing them into place.

University of Missouri - Rolla - C.I.E.S. Università degli studi di Genova - D.I.S.E.G.
57
(a) (b) Fig. 3.5. FRP sheets and placement of the sheet
After placement, a ribbed roller must be used to remove any air bubbles and to
facilitate impregnation of the saturant by separating fibers.
(a) (b)
Fig. 3.6. Pressing of the FRP into the saturant and removing air bubbles
The ribbed roller should never be used in a direction transverse to the fibers since the
fibers could be damaged. Streaks of saturant should be visible on the fiber sheet after
rolling.
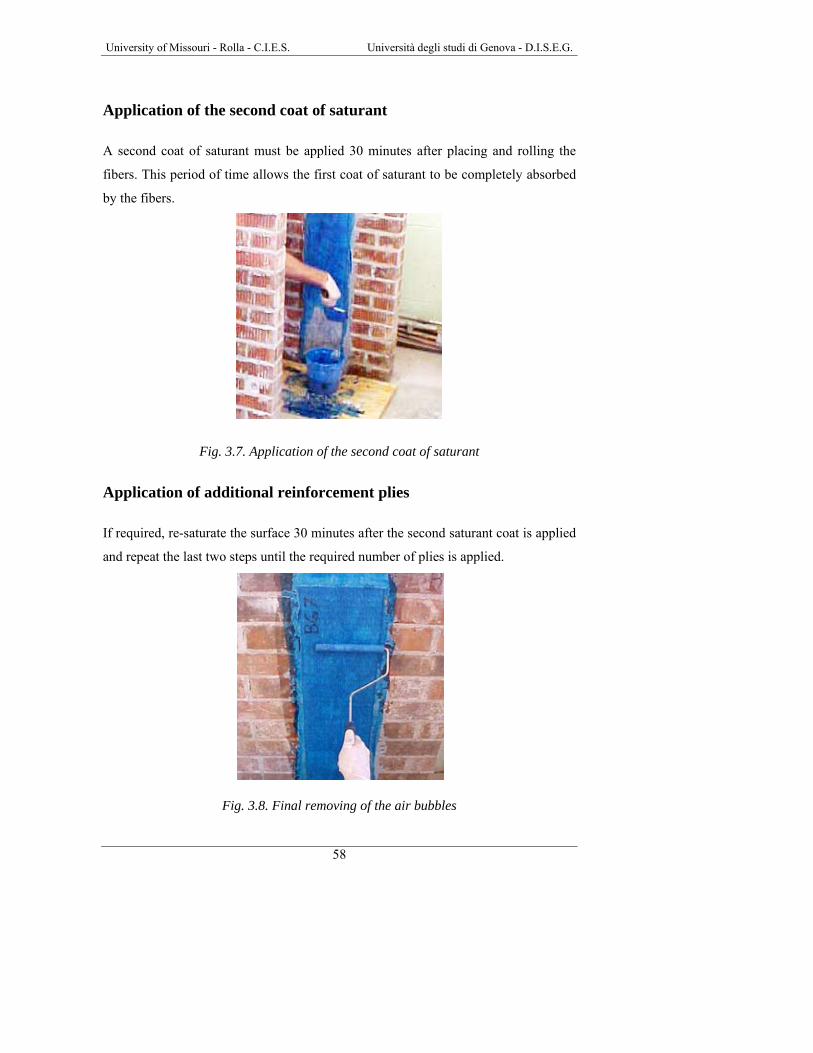
University of Missouri - Rolla - C.I.E.S. Università degli studi di Genova - D.I.S.E.G.
58
Application of the second coat of saturant
A second coat of saturant must be applied 30 minutes after placing and rolling the
fibers. This period of time allows the first coat of saturant to be completely absorbed
by the fibers.
Fig. 3.7. Application of the second coat of saturant
Application of additional reinforcement plies
If required, re-saturate the surface 30 minutes after the second saturant coat is applied
and repeat the last two steps until the required number of plies is applied.
Fig. 3.8. Final removing of the air bubbles

University of Missouri - Rolla - C.I.E.S. Università degli studi di Genova - D.I.S.E.G.
59
3.2. Near-surface Mounted FRP Rod System A new FRP-based strengthening technique is emerging as a valid alternative to
externally bonded FRP laminates. From this point forward, it will be referred to as
Near-Surface Mounted (NSM) FRP rods. Although the use of FRP rods for this
application is very recent, NSM steel rods have been used in Europe for strengthening
of RC structures since the early 50's. In 1948, an RC bridge in Sweden experienced
excessive settlement of the negative moment reinforcement during construction, so
that the negative moment capacity needed to be increased. This was accomplished by
grooving the surface, filling the grooves with cement mortar and embedding steel
rebars in them.To date, FRP rods can be used in place of steel and epoxy paste can
replace the cement mortar. The advantage is primarily the resistance of FRP to
corrosion. This property is particularly important in this case due to the position of
the rods being very close to the surface, which exposes them to the environmental
attacks (De Lorenzis, 1999).
The use of NSM FRP rods is an attractive method for increasing the flexural and
shear strength of deficient RC members and masonry walls and, in certain cases, can
be more convenient than using FRP laminates. Application of NSM FRP rods does
not require surface preparation work (other than grooving) and minimal installation
time compared to FRP laminates is required.
Another advantage is the feasibility of anchoring these rods into members adjacent to
the one to be strengthened.
Fig. 3.9. NSM rods explanation with section (measure in mm)
9.5
to 1
2.7
9.5 to 12.7
FRP rod
Epoxy Paste
Masonry Unit
Mortar Joint
FRP Rods
Masonry Surface
Epoxy Paste
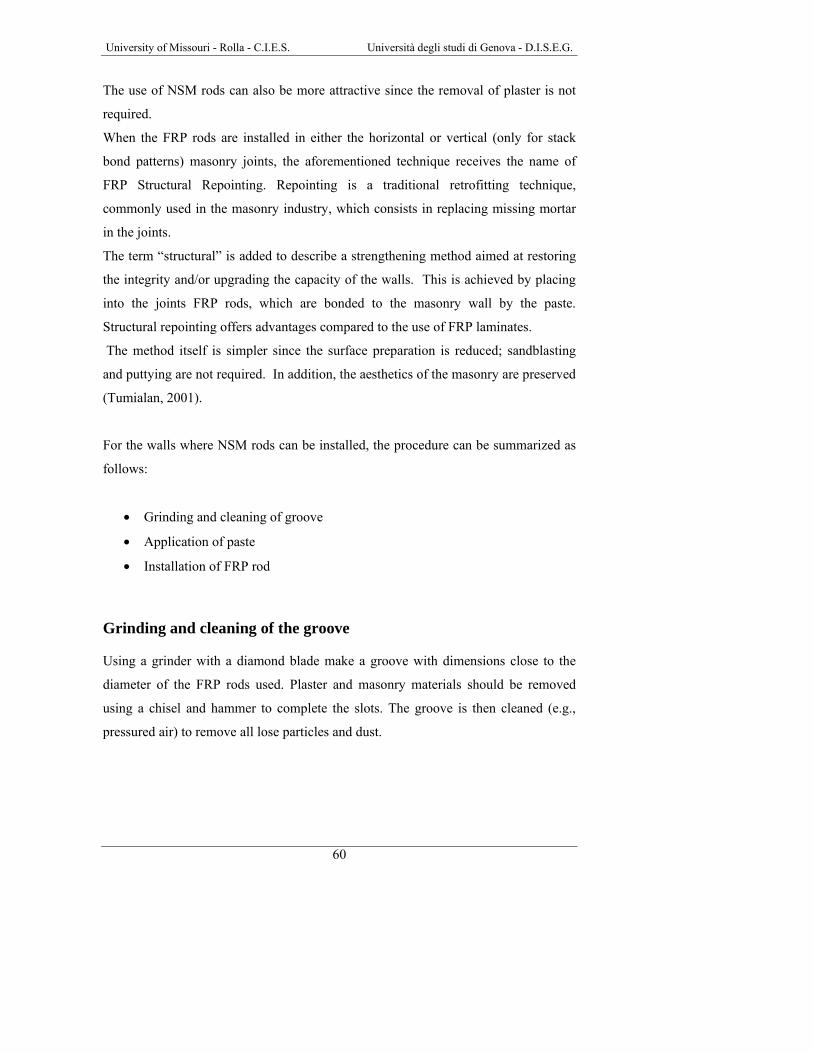
University of Missouri - Rolla - C.I.E.S. Università degli studi di Genova - D.I.S.E.G.
60
The use of NSM rods can also be more attractive since the removal of plaster is not
required.
When the FRP rods are installed in either the horizontal or vertical (only for stack
bond patterns) masonry joints, the aforementioned technique receives the name of
FRP Structural Repointing. Repointing is a traditional retrofitting technique,
commonly used in the masonry industry, which consists in replacing missing mortar
in the joints.
The term “structural” is added to describe a strengthening method aimed at restoring
the integrity and/or upgrading the capacity of the walls. This is achieved by placing
into the joints FRP rods, which are bonded to the masonry wall by the paste.
Structural repointing offers advantages compared to the use of FRP laminates.
The method itself is simpler since the surface preparation is reduced; sandblasting
and puttying are not required. In addition, the aesthetics of the masonry are preserved
(Tumialan, 2001).
For the walls where NSM rods can be installed, the procedure can be summarized as
follows:
• Grinding and cleaning of groove
• Application of paste
• Installation of FRP rod
Grinding and cleaning of the groove Using a grinder with a diamond blade make a groove with dimensions close to the
diameter of the FRP rods used. Plaster and masonry materials should be removed
using a chisel and hammer to complete the slots. The groove is then cleaned (e.g.,
pressured air) to remove all lose particles and dust.

University of Missouri - Rolla - C.I.E.S. Università degli studi di Genova - D.I.S.E.G.
61
(a) (b) Fig. 3.10. Preparation of the grooves and cleaning of the wall
Application of paste An epoxy-based paste is used to provide bond between the masonry and the rods.
Using a mason gun, a layer of paste is placed into the groove.Masking of the masonry
surface will avoid staining when the aesthetics are a concern.
Fig. 3.11. Placing the epoxy-based paste into the slot

University of Missouri - Rolla - C.I.E.S. Università degli studi di Genova - D.I.S.E.G.
62
Installation of FRP rod Once the groove is filled half-way with epoxy paste, then the FRP rod is placed in the
groove and lightly pressed, forcing the paste to flow around the bar and fill
completely the space between the bar and the sides of the groove.
Fig. 3.12. Drawn of the bar into the epoxy-based paste
Then, the groove is filled with more of the same paste and the surface is leveled.
Fig. 3.13. Filling and leveling of the surface

University of Missouri - Rolla - C.I.E.S. Università degli studi di Genova - D.I.S.E.G.
63
After approximatly 30 minutes, remove the masking around the groove.
The following figure illustrates the final product, detailing both the overall and cross-
sectional views.
Fig. 3.14. Final product

University of Missouri - Rolla - C.I.E.S. Università degli studi di Genova - D.I.S.E.G.
64

University of Missouri - Rolla - C.I.E.S. Università degli studi di Genova - D.I.S.E.G.
65
4. MATERIALS AND BOND CHARACTERIZATION
4.1. Materials Characterization
4.1.1. Introduction This section presents the properties of the materials used in the experimental
program. These materials included concrete blocks, clay bricks, mortar, GFRP rods,
AFRP and GFRP laminates, carbon strips, epoxy paste, primer, putty and saturant.
Standard tests were performed to determine the compressive strength of mortar cubes
and concrete and clay prisms. Tests on concrete unit and clay unit triplets were
performed for the purpose of measuring the shear strength along mortar bed joints.
4.1.2. Concrete blocks (arching test) Compression tests following ASTM C1314 standard protocol were performed. The
concrete masonry units involved in this investigation are commonly employed in a
particular masonry typology called infill panels, utilised as exterior walls in
reinforced concrete frame structures to form part of the building envelope. A Tinius
Olsen Universal Testing Machine was used to apply the compression load.
The nominal dimensions of the concrete units are 102x203x305 mm (4x8x12 in), see
figure 4.1. The specified block dimensions are 3/8 in. (10 mm) less than the nominal
values to allow for a standard mortar joint thickness.
Fig. 4.1. Concrete block unit

University of Missouri - Rolla - C.I.E.S. Università degli studi di Genova - D.I.S.E.G.
66
Five prisms consisting of two units incorporating one full mortar bedding in 10mm
(3/8 in) flush joint were constructed and tested. In order to create a uniform
distribution of compression stresses on the edges of the specimens one plywood strips
and two steel plates were cut and inserted between the edges and the two cross-heads
of the machine, Figure 4.2 illustrates the test setup; in this manner undesirable
crushing failures at the borders were also prevented.
Fig. 4.2. Test preparation
An LVDT was also fixed to the steel plate on the top and the movement was
measurement relativity the bottom fixed cross-heads of the machine in order to
calculate the average vertical strain of the masonry sample. Applied load and strain,
values were recorded by a data acquisition system, consisting of Data general
Conditioner Rack and LABTECH (Laboratory Technologies Corp.) data acquisition
software. The sampling rate was set to 1 Hz. Table 4.1 gathers concrete unit
geometrical data and the table 4.2 summarizes the test results.
Tab. 4.1. Concrete unit specifications
Designation Concrete hollow two-cells unitNominal dimensions [mm] 102x203x305 Gross Area [mm²] 31110 Net Area [mm²] 21058 Percentage of solid [%] 68

University of Missouri - Rolla - C.I.E.S. Università degli studi di Genova - D.I.S.E.G.
67
Note:1 mm = 0.03937 in Tab. 4.2. Test results
Prism # Compressive Strength f’m [MPa]
1 11.4 2 18.7 3 16.8 4 15.2 5 10.9
Average 14.6
Concrete blocks [MPa] Compressive Strength 14.6
Standard Deviation 3.4 Modulus of elasticity 13140
Note: 1 MPa = 145 psi
The Modulus of elasticity was calculated in according with the MSJC Code (1999)
like 900* f’m.
4.1.3. Dark clay bricks (arching test)
Compression tests were performed on five prisms made of dark molded bricks.
Modern clay units often have compressive strengths much higher than required to
satisfy product specifications and generally exceed by large margins the requirements
for member design strengths. However, in order to calculate the experimental plastic-
moment in the midspan of the walls subjected to out-of-plane loading, this type of
tests was required by the experimental program.
Tab. 4.3. Specifications for clay bricks
Designation Clay solid unit Nominal dimensions [mm] 102x203x64 Gross Area [mm²] 20706 Net Area [mm²] 15231 Percentage of solid [%] 74
Note:1 mm = 0.03937 in

University of Missouri - Rolla - C.I.E.S. Università degli studi di Genova - D.I.S.E.G.
68
Fig. 4.3. Dark clay brick unit
ASTM C1314 standard protocol was followed. Similarly to compression tests on
concrete coupons a Tinius Olsen machine was used. Applied load and vertical strain
of the masonry specimens were recorded with the same instrumentation. The tests
were performed in displacement control mode.
(a) (b)
Fig. 4.4. Dark clay prism before (a) and after failure (b)

University of Missouri - Rolla - C.I.E.S. Università degli studi di Genova - D.I.S.E.G.
69
Test results are illustrated in table 4.4.
Tab. 4.4. Test results
Prism # Compressive Strength f’m [MPa]
1 25.6 2 24.0 3 18.0 4 16.4 5 16.8
Average 20.2
Dark clay bricks [MPa] Compressive Strength 20.2 Standard Deviation 4.3 Modulus of elasticity 14140
Note: 1 MPa = 145 psi
The Modulus of elasticity was calculated in according with the MSJC Code (1999)
like 700* f’m.
4.1.4. Light clay bricks (in-plane test) Compression tests were also performed on seven prisms made of light extruded
bricks. This type of tests was required by the experimental program in order to
calculate the correct amount of FRP reinforcement for walls subjected to in-plane
loading. Nominal dimensions, gross area, net are and percentage of solid are similar
to dark brick specifications. The difference are the manufacturing process and the
type of clay. No differences were applied in the test procedure.
Tab. 4.5. Specifications for clay bricks
Designation Clay solid unit Nominal dimensions [mm] 102x203x64 Gross Area [mm²] 20706 Net Area [mm²] 14215 Percentage of solid [%] 69
Note: 1 mm = 0.03937 in;

University of Missouri - Rolla - C.I.E.S. Università degli studi di Genova - D.I.S.E.G.
70
Fig. 4.5. Light clay brick unit
Applied load and vertical strain of the masonry specimens were recorded with the
same apparatus utilized for the dark clay brick tests.
(a) (b) Fig. 4.6. Light clay prism before (a) and after failure (b)

University of Missouri - Rolla - C.I.E.S. Università degli studi di Genova - D.I.S.E.G.
71
Test results are presented in table 4.6.
Tab. 4.6. Test results
Prism # Compressive Strength f’m [MPa]
1 16.4 2 18.7 3 26.8 4 12.9 5 15.0 6 14.9 7 21.8
Average 18.1
Dark clay bricks [MPa] Compressive Strength 18.1 Standard Deviation 4.8 Modulus of elasticity 12670
Note: 1 MPa = 145 psi
The Modulus of elasticity was calculated in according with the MSJC Code (1999)
like 700* f’m.
Nineteen triplets were also constructed in order to extimate the shear stresses along
the bed mortar joints. They were tested and constructed as shown in figure 4.7.
applied load
join
t len
gth
Fig. 4.7. Scheme of bed joint shear test (measure in mm)

University of Missouri - Rolla - C.I.E.S. Università degli studi di Genova - D.I.S.E.G.
72
Four confinement stresses were chosen: 0.05, 0.1, 0.3, 0.5 MPa (7, 14, 42, 70 psi).
Cohesion and coefficient of friction according to Coulomb criterion expression
τ = το + µ σn were calculated by means of linear interpolation of the data provided by
the tests. Test results are showed in figure 4.8.
According to Coulomb criterion τ = 824.42+ 1.35σn [kPa] for σn < 483 kPa
y = 1.35x + 824.42
0
200
400
600
800
1000
1200
1400
1600
1800
0 100 200 300 400 500 600
Confinement Stress [kPa]
Shea
r Str
ess
[kPa
]
Fig. 4.8. Test results from clay triplets
Fig. 4.9. Clay triplet under loading

University of Missouri - Rolla - C.I.E.S. Università degli studi di Genova - D.I.S.E.G.
73
4.1.5. Mortar The mortar used for the walls was available in bags in a dry premixed composition of
cement and sand, and was classified as Type N according to the standard ASTM
C270. Table 4.7 illustrates property specifications requirements for Type N masonry
mortar.
Tab. 4.7. Specifications for Type N masonry mortar
Mortar
Type
Average compressive strengthat 28 days [MPa]
Water Retention [%]
Air Content
[%] Masonry cement
N 5.2 75 20
Note: 1 MPa = 145 psi
According to ASTM C1019 six cubes of dimensions 51x51x51 mm (2x2x2 in) were
built using a special plastic grid. This mortar was used for the construction of the
walls used in the arching tests with dark clay bricks and concrete blocks and the
construction, with light clay bricks, of clay panels for in-plane experimental program.
The load was applied by means of a Tinius Olsen Machine. The test setup is showed
in the figure 4.10 and in figure 4.11 is shown the cubes after tested.
Fig. 4.10. Mortar cube under loading
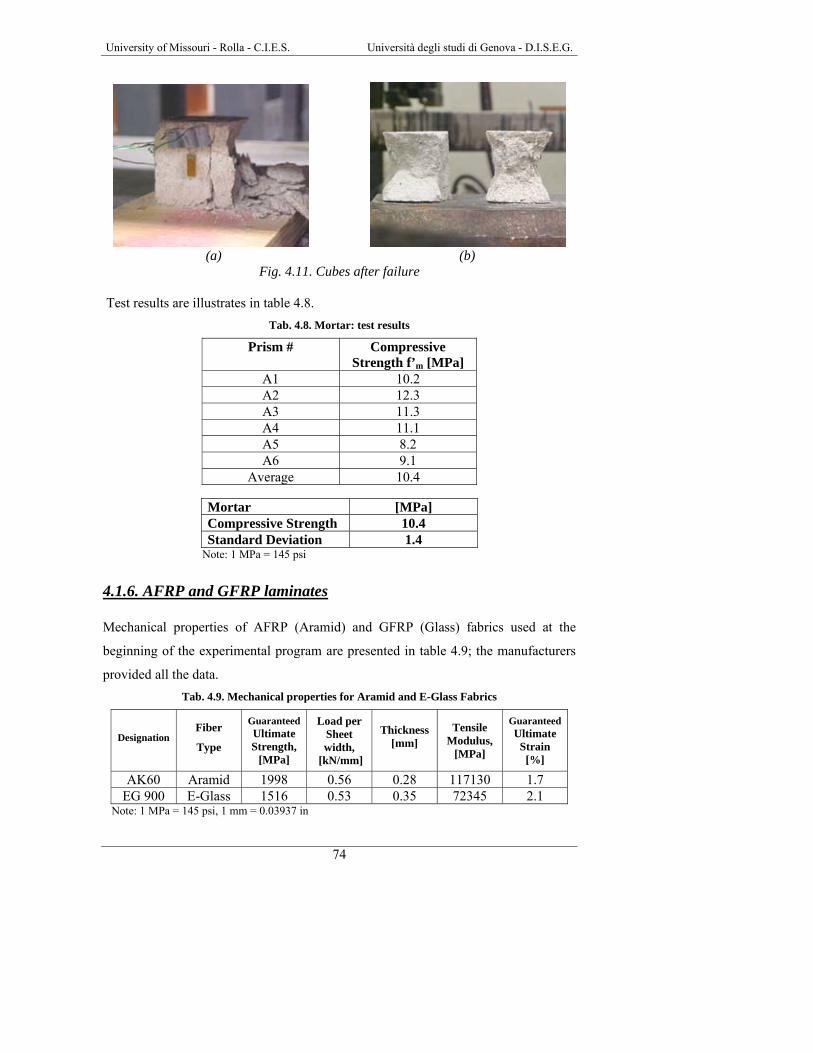
University of Missouri - Rolla - C.I.E.S. Università degli studi di Genova - D.I.S.E.G.
74
(a) (b)
Fig. 4.11. Cubes after failure Test results are illustrates in table 4.8.
Tab. 4.8. Mortar: test results
Prism # Compressive Strength f’m [MPa]
A1 10.2 A2 12.3 A3 11.3 A4 11.1 A5 8.2 A6 9.1
Average 10.4
Mortar [MPa] Compressive Strength 10.4 Standard Deviation 1.4
Note: 1 MPa = 145 psi
4.1.6. AFRP and GFRP laminates Mechanical properties of AFRP (Aramid) and GFRP (Glass) fabrics used at the
beginning of the experimental program are presented in table 4.9; the manufacturers
provided all the data. Tab. 4.9. Mechanical properties for Aramid and E-Glass Fabrics
Designation Fiber
Type
Guaranteed Ultimate Strength,
[MPa]
Load per Sheet width,
[kN/mm]
Thickness
[mm] Tensile
Modulus, [MPa]
Guaranteed Ultimate
Strain [%]
AK60 Aramid 1998 0.56 0.28 117130 1.7 EG 900 E-Glass 1516 0.53 0.35 72345 2.1
Note: 1 MPa = 145 psi, 1 mm = 0.03937 in

University of Missouri - Rolla - C.I.E.S. Università degli studi di Genova - D.I.S.E.G.
75
In order to verify the mechanical properties provided by the manufacturers of AFRP
and GFRP laminates, tensile tests on thin flat strip of material having a constant
rectangular cross section were performed in laboratory environment, following
specifications provided by ASTM D3039.
Laminate panels were fabricated by the well-known wet lay-up technique and
coupons were cut from the panels after complete cure. A 610x460x13 mm
(24x18x1/2 in) plywood sheet was set as the base of the mold which was a
rectangular plastic plate covered with a thin polyethylene film as the release agent.
After the mold was prepared, a thin layer of saturant was placed on it with a roller.
Then the aramid and glass fiber plies were spread on the saturant layer and a plastic
roller was used to remove air entrapped between fiber plies and saturant.
Fig. 4.12. Final impregnation of laminate plies After approximately 30 minutes, a second layer of saturant was applied and the
plastic roller was used again to work the resin into the fibers. The wet laminates were
left to cure for seven days and then released from the mold. The laminate panels were
then ready to be cut into coupons along predetermined lines in order to obtain equal
widths of 38 mm (1.5 in). All the specimens had a length of 381 mm (15 in) as shown
in figure 4.13.

University of Missouri - Rolla - C.I.E.S. Università degli studi di Genova - D.I.S.E.G.
76
Fig. 4.13. Coupons to be tested An extensometer with a gauge length of 25.4 mm (1 in) was attached to the mold-side
surface of each specimens in the longitudinal direction. A built-in hydraulic pressure
transducer of the Universal Testing Machine INSTRON 4485 under displacement
control acquired the load. The testing frame is shown in figure 4.14, the loading head
is rotationally self-aligning, which eliminates the potential of bending and twisting
the specimen.
Fig. 4.14. Test apparatus
The wedge grips are self-tightening, to keep a constant pressure, so the clamping
conditions do not change due to laminate contraction. All specimens were tested
under displacement control with a constant loading speed of 2mm/min. The same
mode of building and testing the specimens was used for GFRP and AFRP. In the

University of Missouri - Rolla - C.I.E.S. Università degli studi di Genova - D.I.S.E.G.
77
following figures are showed the laminates before and after failure for both type of
tests.
(a) (b)
Fig. 4.15. Test setup and coupon failure of GFRP
(a) (b)
Fig. 4.16. Test setup and coupon failure of AFRP
In table 4.10 test results for AFRP and GFRP laminates respectively are presented.

University of Missouri - Rolla - C.I.E.S. Università degli studi di Genova - D.I.S.E.G.
78
Tab. 4.10. AFRP laminates: test results
Designation Maximum Strain [%]
Maximum Stress [MPa]
Modulus of Elasticity [MPa]
A1 1.48 1670 117700 A2 1.64 1940 141000 A3 1.52 1760 120200 A4 1.74 2070 118000 A5 1.76 1980 115900 A6 1.66 1860 114060
Average 1.63 1880 121140 Standard deviation 0.11 140 9940
Note: 1 MPa = 145 psi
Tab. 4.11. GFRP laminates: test results
Designation Maximum Strain [%]
Maximum Stress [MPa]
Modulus of Elasticity [MPa]
G1 2.14 1750 78750 G2 1.63 1700 82370 G3 2.16 1710 85480 G4 1.59 1680 85460 G5 1.80 1500 83700 G6 1.60 1760 83000
Average 1.82 1690 83130 Standard deviation 0.26 97 2496
Note: 1 MPa = 145 psi
4.1.7. CFRP Strips In order to calculate the mechanical properties of CFRP (Carbon) strips, used in two
walls tested with in-plane load, tensile tests on thin flat strip of material having a
constant rectangular cross section, were performed in laboratory environment,
following specifications provided by ASTM D3039. The mechanical properties from
manufactures were not available because of the newly of the material.
The tests were conducted with the same apparatus that tested the AFRP and the GFRP
Since the lack of the date relative the mechanical properties, eight strips were
prepared and tested, an electronic extensometer with 25.4 mm (1 in) gauge length and
1/10000 accuracy was clamped at mid-lenght of the test region to measure strain. All

University of Missouri - Rolla - C.I.E.S. Università degli studi di Genova - D.I.S.E.G.
79
the specimens had a total length of 381 mm (15 in) and the nominal dimensions of the
strips were 15.24x2.11 mm (0.6x0.083 in) and their were cut from a coil 30000 mm
(1181 in) long.
Figure 4.17 illustrates the strips ready to be tested.
Fig. 4.17. Strips In the following figures are shown the strips before and after failure.
(a) (b) Fig. 4.18. Test setup and coupon failure of CFRP strips
Particular
Strips

University of Missouri - Rolla - C.I.E.S. Università degli studi di Genova - D.I.S.E.G.
80
Fig. 4.19. Failure of the specimens
In table 4.12 the test results for the CFRP strips are presented.
Tab. 4.12. CFRP strips: test results
Designation Maximum Strain [%]
Maximum Stress [MPa]
Modulus of Elasticity [MPa]
A1 1.18 1370 133804 A2 0.86 1470 147968 A3 1.47 1370 142160 A4 0.88 1450 149401 A5 0.78 1270 144975 A6 0.91 1370 141293 A7 0.87 1420 141088 A8 0.87 1410 141194
Average 0.98 1390 142735 Standard deviation 0.23 6.1 4842
Note: 1 MPa = 145 psi
4.1.8. GFRP Rods In table 4.13 the experimental mechanical properties of GFRP rods utilized as Near
Surface Mounted rods (see Section 3.2 ) are illustrated (Micelli, 2001). Tab. 4.13. Mechanical properties of GFRP rod #2
Bar diameter [mm]
Cross-Sectional Area
[mm2]
Nominal Diameter
[mm]
Tensile Strength,
[MPa]
Tensile Modulus of Elasticity
[MPa] 6 33.23 6.35 760 40789

University of Missouri - Rolla - C.I.E.S. Università degli studi di Genova - D.I.S.E.G.
81
4.1.9. Primer and Saturant In table 4.14 the mechanical properties of primer and saturant are exposed. The
manufacturers provided all the data.
Tab. 4.14. Mechanical properties for primer, putty and saturant
Material Tensile
Strength [MPa]
Tensile Elastic Modulus
[MPa]
Tensile Strain
[%]
Compressive Strength
[kPa]
Compressive Modulus
[MPa]
Primer 12.41 723.9 3 24.13 655.00
Saturant 54.46 3033.0 2.5 86.10 26.20 Note: 1 Mpa = 145 psi
4.1.10. GFRP G1 Rods In table 4.15 the experimental mechanical properties of GFRP rods are illustrated
(Micelli, 2001).
Tab. 4.15. Material properties for GFRP G1 Rods
Bar diameter
[mm]
Cross-Sectional
Area [mm2]
Tg [°C]
Tensile Strength,
[MPa]
Tensile Strain
[%]
Tensile Modulus of Elasticity
[MPa]
12.7 127 138 924 2.17 42574 Note: 1 Mpa = 145 psi

University of Missouri - Rolla - C.I.E.S. Università degli studi di Genova - D.I.S.E.G.
82
4.2. Bond Characterization FRP laminates are successfully used for strengthening of existing RC and PC
structures. Bond of the external FRP reinforcement to the concrete substrate is of
critical importance for the effectiveness of this technique. Bond mechanism consists
of shear transfer mechanism and local region tension at the interface between the
concrete and FRP. Delamination before ultimate FRP strain may be encountered.
In the case of masonry, have shown that debonding of FRP laminates is the
predominant mode of failure(Tumialan, 2001; Morbin, 2001 etc.). Therefore, the
issue of bond is also one of the ultimate states to consider in the design of
strengthening with externally bonded FRP laminates. To date there has been few
bond research conducted on masonry elements (Roko et al., 1999); the objective of
this section is to develop an analytical model to determine the proper bonded length
for FRP laminates. Debonding has a direct relationship with the porosity of the
masonry, the type of masonry, the umidity, the type of fiber, the quantity of saturant
used etc..
4.2.1. Test Specimens Standard hollow concrete blocks and clay bricks (see also description in sections
4.1.2 and 4.1.3) specimens were tested, to investigate the bond behavior of AFRP
sheets on different types of masonry surface.
The FRP sheets used were AK60 Master builders technologies with the following
properties from the material characterization (section 4.1.6):
Tab. 4.15. Properties of AK60 Master builders technologies sheet
Rupture [MPa] 1880 Tensile Elastic Modulus [GPa] 121
Tensile strain [%] 1.63 Thickness [mm] 0.28*
Note: 1 MPa = 145 psi; 1 mm = 0.03937 in; * = value from manufacturer

University of Missouri - Rolla - C.I.E.S. Università degli studi di Genova - D.I.S.E.G.
83
According with the manufacturer the tensile properties of primer, putty and saturant
are reported in table 4.16. The resin was allowed to cure for at least 4 days prior to
testing the specimens.
Tab. 4.16. Properties of MBrace primer, putty and saturant
Material Tensile strength [MPa]
Tensile elastic
modulus [MPa]
Tensile strain [%]
Compressive strength [MPa]
Compressive Modulus
[MPa]
Primer 12.41 723.9 3 24.13 655 Putty 12.41 1792 1.5 24.13 1068
Saturant 54.46 3033 2.5 86.18 2620 Note: 1 MPa = 145 psi
To determine the effective bonded length several lengths were investigated; different
widths of AFRP sheets were employed to evaluate the different behavior and size
effect. Depending on these variables, the configurations of the blocks were different,
as shown in figure 4.20.
(A) (B) (C) (D)
Fig. 4.20. Specimens configuration
Two prisms were used for each test; figure 4.21 shows the configuration utilized for
the tests explaining in what way the generic blocks (X and Y) were positioned:

University of Missouri - Rolla - C.I.E.S. Università degli studi di Genova - D.I.S.E.G.
84
Fig. 4.21. Generic test configuration
Tables 4.17 and 4.18 summarizes the test configurations:
Tab. 4.17. Test configuration for concrete blocks
Test name FRP width [mm]
Bonded length [mm]
Unbonded length [mm]
Blocks used (X - Y)
CA3-4 76.2 101.6 101.6 A - B CA3-8 76.2 203.2 101.6 A - A
CA3-12 76.2 304.8 101.6 A - A CA6-4 152.4 101.6 101.6 A - B CA6-8 152.4 203.2 101.6 A - A
CA6-12 152.4 304.8 101.6 A - A Note: 1 mm = 0.03937 in
Tab. 4.18. Test configuration for clay bricks
Test name FRP width [mm]
Bonded length [mm]
Unbonded length [mm]
Blocks used (X - Y)
BA3-4 76.2 101.6 101.6 C - C BA3-8 76.2 203.2 101.6 C - C
BA3-12 76.2 304.8 101.6 C - C BA6-4 152.4 101.6 101.6 D - D BA6-8 152.4 203.2 101.6 D - D
BA6-12 152.4 304.8 101.6 D - D Note: 1 mm = 0.03937 in
The dimensions of the blocks were described in sections 4.1.2 and 4.1.3. One FRP
sheet was applied to each face of the blocks in the longitudinal direction, connecting
(X) (Y)
SIDE VIEW OF THE SPECIMENS
FRP SHEET
GENERIC BLOCKS
UNBONDED ZONE
BONDED ZONE
FRP WIDTH

University of Missouri - Rolla - C.I.E.S. Università degli studi di Genova - D.I.S.E.G.
85
the two blocks together. Only one block was instrumented, this area called test region
had the AFRP laminate with a limited bonded length and being unbonded the
remaining part (using adhesive tape) to force the delamination in the test region.
Length and position of the bonded part were the same on both faces of the test block.
However, to avoid failure in the non-instrumental regions, transversal sheets were
applied as can be seen in figure 4.22 where there are illustrated the two side views of
the specimens.
Fig. 4.22. Side views of the specimens
The test specimens were laid on the floor, after they were aligned along the major
axis (figure 4.23).
Fig. 4.23. Specimens aligned
(X)
TEST REGION
UNBONDED ZONE
(Y)
(X)
UNBONDED ZONE
(Y)
TRANSVERSE SHEET
TRANSVERSE SHEET
TRANSVERSE SHEET

University of Missouri - Rolla - C.I.E.S. Università degli studi di Genova - D.I.S.E.G.
86
Then, the specimens were prepared following the wet-lay-up technique (see section
3.1).
Fig. 4.24. Specimens ready
The only difference between concrete blocks and bricks were the application of putty
on the bricks surfaces, but in the test region it was applied only to cover the surfaces
irregularities, to not influence significantly the bond behavior.
Strain gages were applied on the AFRP laminates to monitor the strain distribution
along the laminate during the tests. All the strain gages had a gage length of 12.7 mm
(1/2 inch) to ensure localized strain measurement. The surface of laminate was
smoothed and conditioned to assure a perfect bond between strain gage and sheet.
Two strain gages were applied on the unbonded region at 25.4 mm (1 in) from the
beginning of the unbonded region; their spacing was 50.8 mm (2 in). The unbonded
regions were taken 101.6 mm (4 in) for all the specimens.
The others strain gages in the bonded region were applied from 25.4 mm (1 in) from
the beginning of this region, their distance were 50.8 mm (2 in) except for the bond
length of 101.6 mm (4 in) where the distance was only 25.4 mm (1 in).
Figure 4.25 indicates the typical location of the strain gages on the AFRP laminates.

University of Missouri - Rolla - C.I.E.S. Università degli studi di Genova - D.I.S.E.G.
87
Fig. 4.25. Typical location of the strain gages
4.2.2. Test Setup
The test bed consisted of a steel plate with dimensions 1524 mm (5 ft.) by 609.6 mm
(2 ft.) and thickness of 3.175 mm (1/8 in.). Five steel angles were bolted on the plate
to delimitate the position where the blocks had to be placed. The purpose of the plate
was to ensure the proper positioning of the specimens during preparation and testing.
Grease was placed between the plate and the bottom surface of the blocks, in order to
minimize the friction between the two surfaces during testing.
Load was applied by means of a 12-ton hydraulic jack connected to a hydraulic
pump. The jack was placed horizontally between the two blocks.
A Sensotek pressure transducer connected to the hydraulic jack recorded the load.
Load and strains were all recorded with a one-Hertz sampling rate by a LABTECH
data acquisition system. Figures 4.26 and 4.27 illustrate the test setup.
UNBONDED ZONE
TEST REGION
STRAIN GAGE
TENSILE FORCE
BONDED LENGTH
1 2 3 4 5 6

University of Missouri - Rolla - C.I.E.S. Università degli studi di Genova - D.I.S.E.G.
88
Fig. 4.26. Test setup scheme
Fig. 4.27. Test setup

University of Missouri - Rolla - C.I.E.S. Università degli studi di Genova - D.I.S.E.G.
89
Fig. 4.28. Detail of hydraulic jack and pressure transducer
4.2.3. Test Results General Results. Test results in terms of ultimate load and failure mode are
summarized in table 4.19 and 4.20. The value of the ultimate load was obtained
dividing by two the maximum load registered by the load cell. Tab. 4.19. Test results for Concrete Masonry
Test name Sheet width Bonded length Ultim. load Failure mode [mm] [mm] [KN]
CA3-4 76.2 101.6 23.7 D CA3-8 76.2 203.2 26.5 D
CA3-12 76.2 304.8 24.6 R+D CA6-4 152.4 101.6 37.5 D CA6-8 152.4 203.2 48.2 D
CA6-12 152.4 304.8 48.9 D Legend: D = Delamination; R = Fiber rupture Note: 1 mm = 0.03937 in; 1 KN = 0.2248 Kip
Tab. 4.20. Test results for Clay Masonry
Test name Sheet width Bonded length Ultim. load Failure mode [mm] [mm] [KN]
BA3-4 76.2 101.6 29.0 D BA3-8 76.2 203.2 27.9 D
BA3-12 76.2 304.8 24.0 R+D BA6-4 152.4 101.6 46.4 D BA6-8 152.4 203.2 31.3 D
BA6-12 152.4 304.8 46.6 D Legend: D = Delamination ; R = Fiber rupture Note: 1 mm = 0.03937 in ; 1 KN = 0.2248 Kip

University of Missouri - Rolla - C.I.E.S. Università degli studi di Genova - D.I.S.E.G.
90
As indicated in tables 4.19 and 4.20, two different failure modes were observed. In
the specimens CA3-12 and BA3-12 with 304.8 mm (12 in.) of bonded length, failure
occurred by fiber delamination (not complete, the fiber did not detach completely
from the specimens) in the test region followed by fiber rupture on the other side.
This can be explained as follows: during delamination process, load switched in the
backside of the specimens because of eccentricity causing suddenly the fiber rupture.
Fig. 4.29. Cause of failure in tests CA3-12 and BA3-12

University of Missouri - Rolla - C.I.E.S. Università degli studi di Genova - D.I.S.E.G.
91
In the remaining specimens failure occurred only for delamination. Due to
geometrical imperfections, the tensile force was not perfectly centered. These
imperfections were evident when the specimens were not perfectly aligned. This
eccentrical force introduced an additional bending moment. Previous study on this
phenomenon (Van Gemert D. et al., 2001) had shown that no significant differences
were recorded. Due to the eccentricity, a premature peeling off of the FRP laminates
could be observed, which can explain the mode of failure observed in specimens
CA6-4 and BA6-8.
In figure 4.30 can be seen the debonding for several specimens and can be seen also
that some concrete blocks and masonry bricks surrounding the fiber were damaged,
meaning that a good engagement was created between FRP laminates and masonry
surface.
(a) Test CA3-8 (b) Test CA6-4
(c) Test BA6-12 (d) Test BA6-8
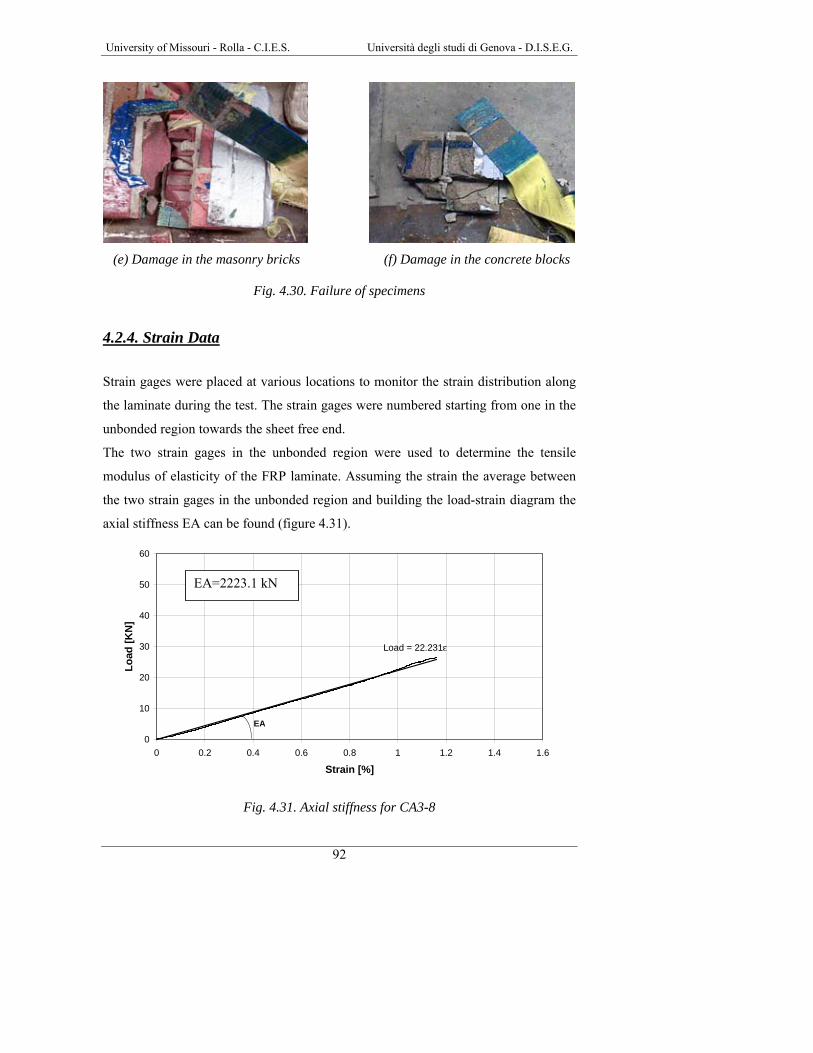
University of Missouri - Rolla - C.I.E.S. Università degli studi di Genova - D.I.S.E.G.
92
(e) Damage in the masonry bricks (f) Damage in the concrete blocks
Fig. 4.30. Failure of specimens
4.2.4. Strain Data
Strain gages were placed at various locations to monitor the strain distribution along
the laminate during the test. The strain gages were numbered starting from one in the
unbonded region towards the sheet free end.
The two strain gages in the unbonded region were used to determine the tensile
modulus of elasticity of the FRP laminate. Assuming the strain the average between
the two strain gages in the unbonded region and building the load-strain diagram the
axial stiffness EA can be found (figure 4.31).
Fig. 4.31. Axial stiffness for CA3-8
Load = 22.231ε
0
10
20
30
40
50
60
0 0.2 0.4 0.6 0.8 1 1.2 1.4 1.6
Strain [%]
Load
[KN
]
EA
EA=2223.1 kN

University of Missouri - Rolla - C.I.E.S. Università degli studi di Genova - D.I.S.E.G.
93
Then, can be calculated the FRP tensile modulus simply dividing the axial stiffness
by the FRP area relating to that test.
Tables 4.21 and 4.22 show the values of the AFRP tensile elastic modulus calculated
for all the specimens.
Tab. 4.21. Exp. tensile modulus of elasticity for AFRP on concrete blocks
Specimen Width [mm]
Bond Length [mm]
Thickness* [mm]
Axial Stiffness EA [KN]
E [GPa]
CA3-4 76.2 101.6 0.28 2263.1 106.1 CA3-8 76.2 203.2 0.28 2223.1 104.2
CA3-12 76.2 304.8 0.28 2236.9 104.8 CA6-4 152.4 101.6 0.28 3826.5 89.7 CA6-8 152.4 203.2 0.28 4701.8 110.2
CA6-12 152.4 304.8 0.28 3985.9 93.4 Note: 1 mm = 0.03937 in; 1 KN = 0.2248 Kip; 1 MPa = 145 Psi * = Values from manufacturer
Tab. 4.22. Exp. tensile modulus of elasticity for AFRP on masonry bricks
Specimen Width [mm]
Bond Length [mm]
Thickness* [mm]
Axial Stiffness [KN]
E [GPa]
BA3-4 76.2 101.6 0.28 N/A N/A BA3-8 76.2 203.2 0.28 2381.4 111.6 BA3-12 76.2 304.8 0.28 1855.7 87.0 BA6-4 152.4 101.6 0.28 4081.4 95.6 BA6-8 152.4 203.2 0.28 N/A N/A BA6-12 152.4 304.8 0.28 4518.4 105.9
Note: 1 mm = 0.03937 in; 1 KN = 0.2248 Kip; 1 MPa = 145 Psi * = Values from manufacturer N/A = Not available
The experimental tensile modulus of elasticity is computed as by the average of all
these values and it is equal to 100.8 GPa (14616 ksi).
This value is lower that provided by manufacturer value that is 117.2 GPa (17000
ksi). The strain gages in the bonded region were used to determine the bond behavior
for the FRP sheet.

University of Missouri - Rolla - C.I.E.S. Università degli studi di Genova - D.I.S.E.G.
94
Assuming that the strain at the beginning of the bonded region at determinate values
of load is:
AEN
tb =ε
Where:
Ν = load
Et = experimental modulus of elasticity (average)
A = AFRP area
The strain-location graphics can be found.
Figure 4.32 and figure 4.33 shown the strain-location graphics for two specimens;
from the experimental results, it can be observed that the strain vs. location graphics
for concrete blocks and masonry bricks have similar behavior. From table 4.19 and
4.20 can be observed that the bonded length does not significantly influence the
ultimate load.
Fig. 4.32. Typical strain vs. location graph for concrete blocks (specimen CA3-8)

University of Missouri - Rolla - C.I.E.S. Università degli studi di Genova - D.I.S.E.G.
95
Fig. 4.33. Typical strain-location graph for masonry bricks (specimen BA6-12)
In order to determine the effective bond length, the ultimate load is not very
significant because FRP is already detached at this value of load. Peeling load is the
load when the fiber starts the delamination. It is identified as the load level at which
the strain distribution becomes linear. Figure 4.34 shows different theoretical stages.
It can be observed that after the peeling load the effective bond length slip towards
the end of the fiber, but has always the same length.

University of Missouri - Rolla - C.I.E.S. Università degli studi di Genova - D.I.S.E.G.
96
Fig. 4.34. Theoretical peeling load
Figure 4.35 illustrates how the load corresponding to imminent peeling was
determined. To that effect specimen CA3-8 was used. From the figure 4.34 the
theoretical behavior after the peeling load can be assumed parallel to the straight line
that characterize the peeling load. The theoretical behavior after the peeling load can
be found following the experimental behavior. Figure 4.35 shows that the fiber is
already detached, like the theoretical behavior explains. Tracking the parallel lines the

University of Missouri - Rolla - C.I.E.S. Università degli studi di Genova - D.I.S.E.G.
97
peeling load can be found and also the imminent peeling load that is the closest
experimental behavior.
Fig. 4.16. Determination of imminent peeling load for CA3-8
Fig. 4.35. Determination of imminent peeling load for specimen CA3-8
Table 4.23 shows the imminent peeling load values estimated for the test specimens Tab. 4.23. Imminent peeling load estimated for the specimens
Specimen Imm. peeling [kN]
Specimen Imm. peeling [kN]
CA3-4 22.1 BA3-4 N/A CA3-8 22.1 BA3-8 24.2
CA3-12 24.0 BA3-12 N/A CA6-4 37.4 BA6-4 N/A CA6-8 44.0 BA6-8 41.7
CA6-12 46.4 BA6-12 N/A Note: 1 kN = 0.2248 kip
Because of imperfections in the clay masonry specimens (such as misalignment of the
laminate), it was not possible to clearly determine the strain distribution over the
bonded length of the FRP laminate. Also, it was not possible to determine the peeling
load for several specimens. As a consequence, the analytical model proposed in the
Theoretical behavior
Imminent peeling load = 22.1 kN

University of Missouri - Rolla - C.I.E.S. Università degli studi di Genova - D.I.S.E.G.
98
next paragraph could not be validated in this case. However, the overall test trends
indicated the following:
• The bonded length does not significantly influence the ultimate load
• The bonded length could be about 100 mm (4 in.)
• In some specimens, the strain versus location behavior is similar to that
specimens made with concrete blocks
4.2.5. Analitycal Work
The bond issue is an important limit stated to consider in the strengthening design of
externally bonded FRP laminates. When failure is bond-controlled, the maximum
stress in the FRP cannot be considered equal to the tensile strength of the FRP
material. To reach a possible design, the ACI committee 440 seems to indicate a
reduced ultimate strain level in the FRP reinforcement:
urub k ε⋅=ε (4.1)
Where:
uε = ultimate strain of the FRP laminate
kr = reduction factor
In order to determine the kr coefficient and then the bonded length, a model
developed by De Lorenzis et al. (2000) can also be used for masonry, since the
hypotheses are fundamentally the same:
• Linear elastic behavior of materials
• Flexural stiffness of sheets negligible
• The masonry strain is negligible if compared to that of FRP
The bond failure load can be found using non-linear fracture mechanics approach
(Taljsten, 1994). It has been observed that with an energy approach, the same results
of classical Volkersen’s theory can be found. This theory was used like starting point
for the bond.

University of Missouri - Rolla - C.I.E.S. Università degli studi di Genova - D.I.S.E.G.
99
τ
ffffub GtE2bP ⋅⋅⋅= (4.2)
Where:
bf, Ef, tf = width, tensile elastic modulus and thickness of FRP sheet
Gf = fracture energy per unit area of the joint
The energy needed to bring a connection with a certain area to failure is called
fracture energy and it is determined building the τ-slip curve. The fracture energy is
the area underneath this graphic ( fG dsτ= ∫ ).
Fig. 4.36. Infinitesimal part of adhesive layer subjected to angular distorsion
Because the slip “s” value is more used in civil engineering than the “γ” value, it was
decided to was use the τ-slip relationship rather than the τ-γ relationship, also because
the slip value is much easier to record experimentally, and the thickness of the glue
layer “h” is in most cases unknown or it is difficult to determine.
The local τ-slip curve can be obtained from the experimental data. The bond stress (τ)
can be found by equilibrium of forces:
P2 P1
d
s
τ τ
γττ
Undeformed Deformed
s = γ h h

University of Missouri - Rolla - C.I.E.S. Università degli studi di Genova - D.I.S.E.G.
100
Being the generic force P equal to:
fff btP ⋅⋅σ= (4.3)
The follow equation can be obtained:
dxb(x)PP f21 ⋅⋅τ=− (4.4)
The force P can be expressed in terms of strain (elastic-linear behavior):
ffff btEP ⋅⋅⋅ε= (4.5)
So the equation (4.4) becomes:
dxb(x)btE)( ffff21 ⋅⋅τ=⋅⋅⋅ε−ε (4.6)
Substituting )( 21 ε−ε with (x)d fε and solving for (x)τ the average bond stress can
be obtained:
dx(x)dEt(x) f
ffε
⋅⋅=τ (4.7)
Where fε is the strain in the FRP laminate. Therefore, the τ - location can be obtained
from equation of the strain-location multiplied by the elastic modulus Ef and the
thickness tf of FRP sheet. To calculate the (x)fε is used a cubic approximation for the
experimental results with the hypothesis that the strain to the end of the fiber is zero
( 0)(L)f =ε .
Figure 4.37 shows a typical approximation for (x)fε obtained with Maple 6.0.

University of Missouri - Rolla - C.I.E.S. Università degli studi di Genova - D.I.S.E.G.
101
Fig. 4.37. Approximation of ε(x) for the specimen CA6-12
The graphics were developed at imminent peeling load level, because after this load
the Gf is not significant since the first part of fiber is already detached. As an example
shown the τ versus location behavior for specimen CA3-8 is shown in figure 4.38:
Fig. 4.38. τ vs. location at peeling load for the specimen CA6-8
0
0.2
0.4
0.6
0.8
1
1.2
1.4
1.6
0 40 80 120 160 200 240 280 320
distance [mm]
stra
in [%
]
Experimental data
Approximation
0
2
4
6
8
10
0 40 80 120 160 200 240 280 320
distance [mm]
τ [M
Pa]

University of Missouri - Rolla - C.I.E.S. Università degli studi di Genova - D.I.S.E.G.
102
For the slip “s” it can be assumed that the strain in masonry is negligible compared to
the FRP strain, so the follow equation can be used to measure the slip:
fdxds ε= (4.8)
from which:
∫ ε+=x
0r dx)x()0(s)x(s (4.9)
Assuming s(0) the slip at the end of the laminate equal to zero (can be consider
negligible prior to delamination), the slip-location diagram can be obtained only from
the integration of the strain-location curve. Figure 4.39 shows the behavior for
specimen CA3-8:
Fig. 4.39. Slip vs.s location behavior for specimen CA3-8
0
0.2
0.4
0.6
0 40 80 120 160 200 240 280 320
distance [mm]
slip
[mm
]

University of Missouri - Rolla - C.I.E.S. Università degli studi di Genova - D.I.S.E.G.
103
To the end, the local τ-slip relationship can be achieved by combining the two curves
(x)τ and s(x). This diagram can be done for all the loads; figure 4.40 shows the τ-slip
curves of a tested specimens at a load level corresponding to imminent peeling.
Fig. 4.40. τ vs. slip behavior for the specimen CA3-12 Following this procedure the experimental graphics for all the specimens can be
found. Figure 4.41 and following show the comparison from the experimental data.
Fig. 4.41. Experimental results in terms of τ vs. location for the concrete blocks
0
2
4
6
8
10
0 0.2 0.4 0.6
Slip [mm]
τ [M
Pa]
0
2
4
6
8
10
0 40 80 120 160 200 240 280 320
distance [mm]
τ [M
Pa]
CA3-4CA3-8CA3-12CA6-4CA6-8CA6-12
CA6-8
CA3-12
CA3-8
CA6-12
CA3-4
CA6-4

University of Missouri - Rolla - C.I.E.S. Università degli studi di Genova - D.I.S.E.G.
104
Fig. 4.42. Experimental results in terms of slip vs. location for concrete blocks
Fig. 4.43. Experimental results in terms of τ vs. slip for concrete blocks
Fig. 4.43 illustrates the τ-slip curves obtained for the specimens at load level
corresponding to imminent peeling. An ascending branch is followed by a second
region characterized by plastic or softening behavior, until an ultimate value of slip is
0
0.2
0.4
0.6
0 40 80 120 160 200 240 280 320
distance [mm]
slip
[mm
]
CA3-4CA3-8CA3-12CA6-4CA6-8CA6-12CA3-8
CA6-12
CA6-8
CA3-4
CA6-4
CA3-12
0
1
2
3
4
5
6
7
8
9
10
0 0.2 0.4 0.6
slip [mm]
τ [M
Pa]
CA3-4CA3-8CA3-12CA6-4CA6-8CA6-12
CA6-4
CA3-12
CA3-8
CA6-12CA3-4
CA6-8

University of Missouri - Rolla - C.I.E.S. Università degli studi di Genova - D.I.S.E.G.
105
reached. The plastic branch of the curve explains the attainment of a linear strain
distribution close to peeling. The limited value of ultimate slip suggests a brittle
behavior of the joint, that is, the localization of load transfer within a short effective
area even for long bonded lengths.
The fracture energy per unit area of the bonded joint “Gf”, its corresponding slip “Sm”
and the value of “τm” (i.e. the maximum value of τ in the τ-slip curve) can be found.
Tab. 4.24. Values of Gf , Sm, and τm for the concrete blocks
Specimen Gf
[N·mm/mm2]Sm
[mm] τm
[MPa] CA3-4 1.500 0.261 7.278 CA3-8 1.486 0.374 4.674
CA3-12 1.757 0.433 4.905 CA6-4 1.252 0.211 8.346 CA6-8 1.477 0.289 6.954
CA6-12 1.642 0.344 7.095 Note: 1 Nmm/mm2 = 5.71 lbs in./in2; 1 mm = 0.03937 in; 1 MPa = 145 psi
It can be noted that the fracture energies are almost the same for all the specimens. To
determine the FRP ultimate strain (see equation 4.1) the follow procedure can be
used:
Being ubfub E ε⋅=σ (assuming a elastic-linear behavior) the ultimate peeling
strength, combining the last equations and the 4.2 the equation for ultimate strain of
FRP laminate before peeling ubε can be found:
ff
fub tE
G2⋅
⋅=ε (4.10)
Using the Gf average “Gfm” for the concrete block specimens, the ultimate strain
before peeling can be found. Being Gfm = 1.519 N·mm/mm2 (8.67 lbs·in/in2)
ubε becomes:

University of Missouri - Rolla - C.I.E.S. Università degli studi di Genova - D.I.S.E.G.
106
ub2 1.519 0.0104 1.04 %
100800 0.28ε ⋅= = =
⋅
So, the experimental reduction factors can be found with the equation shown below:
61.07.104.1 ===
u
ubrk
εε (4.11)
Previous works on reinforced concrete (Chajes et al., 1999; Maeda et al., 1997;
Talijsten, 1994; and De Lorenzis, 2000) have shown that the reduction factor kr
becomes very low if the stiffness of the laminate increases. From this, is evident that
further research on this area needs to be considered. Anyway, the value of kr found at
Et = 28224 N/mm (160.7 kips/in) is in according with the previous researches.
Effective bond length
The effective bond length can be expressed as follows:
peel
ubeff
dxd
lεε= (4.12)
The τ-slip curve can be modeled having an initial ascending branch followed by a
perfectly plastic behavior at value τm then:
ff
m
peel tEdxd
⋅= τε (4.13)
Using the equations 4.10, 4.12 and 4.13, the equation 4.10 can be modifed:
m
fmeff
GEl
τ⋅⋅
= t2 (4.14)

University of Missouri - Rolla - C.I.E.S. Università degli studi di Genova - D.I.S.E.G.
107
Using the average of τm (τma) the effective bonded length can be found. Taking τma
equal to 6.54 MPa (948 psi) the effective bond length is:
eff2 100800 1.533l 85 mm (3.35 in.)
6.54⋅ ⋅= =
4.2.6. Conclusions Several specimens were prepared to study bond between masonry and FRP sheets.
Failure occurred in the masonry-adhesive interface, sometimes with signs of damage
into the masonry. The experimental bonded length did not affect the ultimate load, as
shown in previous works on concrete specimens (i.e. De Lorenzis et al., 2000). This
confirms the existence of an effective bonded length beyond which no stress is
transferred after peeling occurs. No significance increase in resistance to peeling is
attainable.
4.2.7. Design To date, there are few investigations conducted on the bond between FRP sheets and
masonry; the reported work represents intends to establish a limit for the FRP strain
and for determination of an effective development length. The extent of the
experimental work is not sufficient for the calibration of the model but allows for its
validation.
It can be seen from the experimental results that the τ values are included in a range
of values between 8.346 MPa (1210 psi) and 4.674 MPa (678 psi) (see figure 4.44).
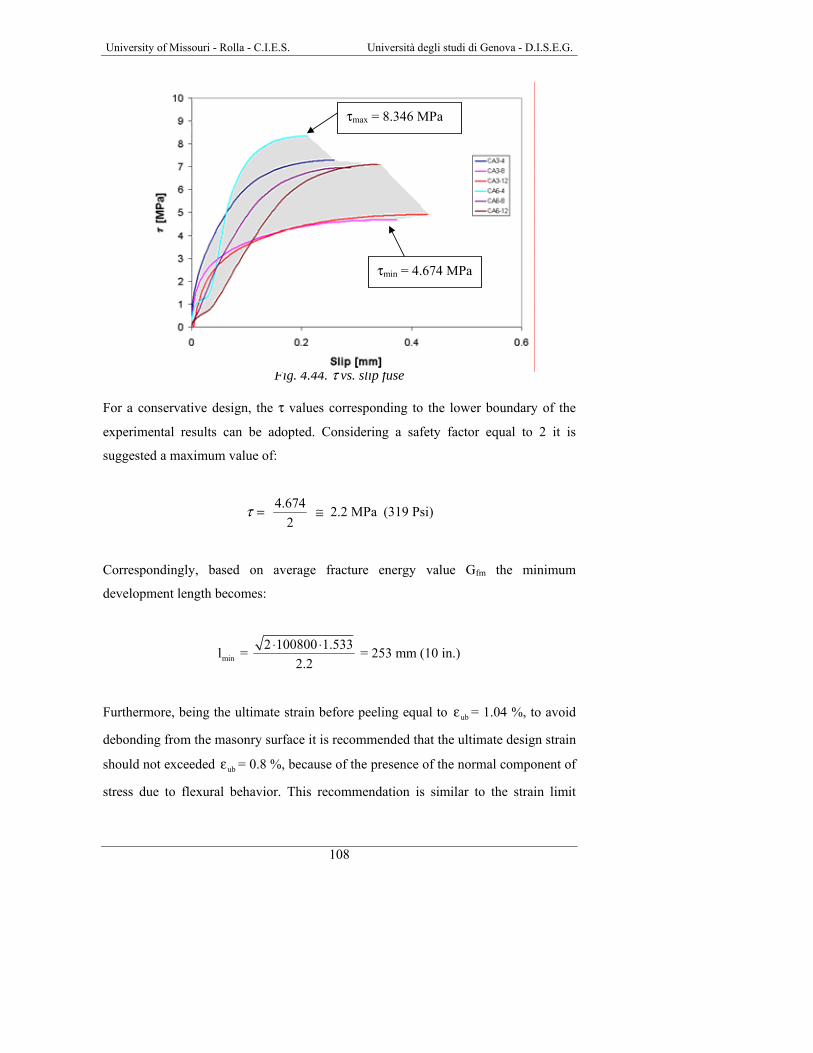
University of Missouri - Rolla - C.I.E.S. Università degli studi di Genova - D.I.S.E.G.
108
Fig. 4.44. τ vs. slip fuse For a conservative design, the τ values corresponding to the lower boundary of the
experimental results can be adopted. Considering a safety factor equal to 2 it is
suggested a maximum value of:
4.674 2.2 MPa2
τ = ≅ (319 Psi)
Correspondingly, based on average fracture energy value Gfm the minimum
development length becomes:
min2 100800 1.533l = = 253 mm (10 in.)
2.2⋅ ⋅
Furthermore, being the ultimate strain before peeling equal to ubε = 1.04 %, to avoid
debonding from the masonry surface it is recommended that the ultimate design strain
should not exceeded ubε = 0.8 %, because of the presence of the normal component of
stress due to flexural behavior. This recommendation is similar to the strain limit
τmin = 4.674 MPa
τmax = 8.346 MPa

University of Missouri - Rolla - C.I.E.S. Università degli studi di Genova - D.I.S.E.G.
109
adopted by a previous work on flexural strengthening of masonry elements
(Tumialan, 2001).
4.3. Durability of Putty and Its Characterizazion With and Without
Fillers
4.3.1. Background FRP laminates are bonded on concrete and masonry surfaces for strengthening
purposes. A typical installation procedure for manual lay-up includes the following
phases: surface cleaning (e.g., sand blasting), primer application, putty application,
first layer of saturant, fiber application and second layer of saturant (see section 3).
The putty applied by trowel is used to prepare the surface filling any defect before
applying the FRP laminate. It can also be used for leveling and patching small holes.
So, putty may have a primary influence on bond behavior between FRP and surfaces.
In particular, the thickness and the mechanical properties of the putty might influence
the bond behavior. For this purpose, tensile tests were conducted on one type of putty
currently used with one of the commercially available FRP strengthening systems.
Specimens were fabricated with glass beads and sand as fillers. The function of the
filler is to change the workability of the putty and to allow the installer to control its
thickness when single-size particles are used. Virgin and pre-conditioned tensile
specimens were tested for a preliminary investigation on durability. In addition,
gravimetric measurements were conducted to determine a correlation between tensile
properties changes and sorption for conditioned samples.
4.3.2. Test Specimens In order to control the thickness of the putty on the masonry surface, glass beads with
diameters of 0.8, 1, 1.25, 1.75, 2.25 mm ( 0.0315, 0.0394, 0.0492, 0.0689, 0.0886 in)
were included in the mixture. To determine the best workability, percentages in
weight of 1, 2, 3, 4, 5, 8, and 10 of beads were considered and tensile tests were
conduced to measure the losses of mechanical properties, compared to the putty

University of Missouri - Rolla - C.I.E.S. Università degli studi di Genova - D.I.S.E.G.
110
without fillers. The dimensions of the specimens were 6.35 mm (¼ in) deep by 12.7
mm (½ in) wide by 76.2 mm (3 in) long. Figure 4.45 shows a typical specimen.
76.2
12.7
6.35
Fig. 4.45. Specimen configuration Specimens with sand were also prepared because various amounts of sand (from 10%
to 20% in weight) are used in the field to increase the viscosity of the putty. So, a loss
of mechanical and bond properties could be expected.
The beads used were E-glass, with the properties as provided by the manufacturer
illustrates in table 4.25.
Tab. 4.25. Mechanical properties for the beads
Vickers hardness [MPa]
Abrasion index [%]
Compressive strength [MPa]
6600 1 390
(a) (b)
Fig. 4.46. Packing and beads with different diameters The sand used was siliceous sand passing through sieve number 40 (0.425 mm).
Table 4.26 Illustrates the mechanical properties of the putty obtained from the
manufacturer.

University of Missouri - Rolla - C.I.E.S. Università degli studi di Genova - D.I.S.E.G.
111
Tab. 4.26. Mechanical properties for the putty
Material Tensile strength [MPa]
Elastic modulus [MPa]
Tensile strain [%]
Compressive strength [MPa]
Compressive modulus [MPa]
Putty 12.41 1792 1.5 24.13 1068 Note: 1MPa = 145 psi
To calculate the percentage in weight for the beads and the sand, a precision scale
(± 0.1 g) was used. Also five specimens were prepared with no filler. For the
preparation of the specimens a wooden gang mold with 42 openings was built. Each
opening was about 76 by 76 mm (3 by 3 in). A trowel was used to level the surface
and to make it smooth.
Figure 4.47 shows the preparation of the specimens.
(a) (b)
Fig. 4.47. Preparation of the specimens After curing each specimen was cut into five strips using a saw. Figure 4.48 illustrates
the frame and several specimens ready to be tested.
(a) (b)
Fig. 4.48. Specimens ready

University of Missouri - Rolla - C.I.E.S. Università degli studi di Genova - D.I.S.E.G.
112
Five samples for each kind of combination were prepared. Three samples were used
to perform a tensile test without chemical conditioning and two of them were used to
conduct a durability test (section 4.3.3). Specimens were tested using a Universal
Testing Machine INSTRON 4469 under displacement control. The rate of loading
crosshead motion was 2.6 mm/min (0.1 in/min) according to ASTM 638-00. The data
were recorded automatically by a SATEC TCS 1200 data acquisition system.
Figure 4.49 illustrates a picture of the tensile testing apparatus.
Fig. 4.49. Test apparatus An electronic extensometer with 25.4 mm (1 in) gauge length and 1/10000 accuracy
was clamped at mid-lenght of the test region to measure strain. Figure 4.50 shows a
generic specimen with the extensometer.

University of Missouri - Rolla - C.I.E.S. Università degli studi di Genova - D.I.S.E.G.
113
Fig. 4.50. Tensile test configuration Temperature and humidity were taken into account for each test. The testing machine
had a passive grip interfaces. Generally this type of grip has the load applied by the
test machine to the test specimen through a direct mechanical link. In this case the
link was manual. The self-aligning grip was attached to the movable member of the
testing machine in such a manner that it could move freely into alignment as soon as
any load was applied. The specimens had to be aligned as perfectly as possible with
the direction of pull, so that no rotary motion, that might induce slippage, occurred in
the grips. Almost all specimens failed at mid-lenght. The rupture of the specimens
had to occur in the uniformly stressed gage leght. Tests where rupture occurred
outside the gage lenght were reject and interpreted as failed tests due to stress
concentration close to the gripping.
Figure 4.51 Illustrates several specimens after failure.
(a) (b)
Fig. 4.51. Failure of the specimens
At the completion of every test, the grips were controlled to evaluate possible
slipping. No slip was encountered for all the specimens tested.
In two cases, failure was due to voids inside the specimens, due to poor consolidation.
Those specimens were rejected. Figure 4.52 illustrates the specimens after their
removal from the testing machine.

University of Missouri - Rolla - C.I.E.S. Università degli studi di Genova - D.I.S.E.G.
114
(a) (b)
Fig. 4.52. Specimen after the test Test results showed an elasto-plastic behavior for all the specimens. As an example,
figure 4.53 shows a typical behavior for one specimen.
Fig. 4.53. Example of experimental behavior of the specimens
The modulus of elasticity was calculated following the ASTM E111-97 (Standard test
Method for Young’s Modulus, Tangent Modulus, and Chord Modulus) that uses a
mathematical implementation. It allows to have an estimation of the precision of the
Young’s modulus value, based on the summation of the precision of the respective
value.
0
1
2
3
4
5
6
7
8
9
10
0 0.02 0.04 0.06 0.08 0.1 0.12 0.14 0.16
Strain [mm/mm]
Stre
ss [M
Pa]

University of Missouri - Rolla - C.I.E.S. Università degli studi di Genova - D.I.S.E.G.
115
The stress is defined as:
APσ =
Where:
P = Uniaxial tensile load [N]
A = Cross-section area [mm2]
The strain is defined as:
o
o
l)l(l
ε−
=
Where:
l = Gage length at any time [mm]
l o = Original gage length [mm]
All valid specimens, 123 in total, were analyzed with this method. The results are
summarized in tables 4.27, 4.28, 4.29, where the average for each combination is
presented. Tab. 4.27. Young’s Modulus values [MPa]
Beads % Beads diameters
0
1
2
3
4
5
8
10
0.8 mm 1352 1250 1191 1214 1203 1312 1309
1 mm 1237 1376 1251 1167 1256 1413 1299 1.25 mm 1078 1134 1053 1249 1218 1437 1286
1.75 mm 1275 1200 1352 1256 1180 1375 1228 2.25 mm
1319
1239 1350 1373 1433 1050 1233 1070 Note: 1 MPa = 145 psi; 1 mm = 0.03937 in
Tab. 4.28. Stress values [MPa]
Beads % Beads diameters
0
1
2
3
4
5
8
10
0.8 mm 9.595 9.485 9.368 9.407 9.464 9.835 9.896 1 mm 10.650 9.817 9.675 8.295 7.960 9.585 9.272 1.25 mm 9.037 8.610 8.041 9.441 9.284 9.369 9.551 1.75 mm 9.004 9.626 9.160 9.473 9.429 9.467 9.378 2.25 mm
10.398
10.070 8.188 8.079 8.422 7.608 6.999 7.485 Note: 1 MPa = 145 psi; 1 mm = 0.03937 in

University of Missouri - Rolla - C.I.E.S. Università degli studi di Genova - D.I.S.E.G.
116
Tab. 4.29. Strain values [mm/mm]
Beads % Beads diameters
0
1
2
3
4
5
8
10
0.8 mm 0.202 0.199 0.200 0.194 0.189 0.138 0.143 1 mm 0.174 0.178 0.180 0.223 0.221 0.162 0.153 1.25 mm 0.225 0.232 0.232 0.182 0.149 0.147 0.116 1.75 mm 0.177 0.172 0.173 0.165 0.149 0.175 0.172 2.25 mm
0.190
0.196 0.145 0.136 0.136 0.121 0.107 0.135 Note: 1 MPa = 145 psi; 1 mm = 0.03937 in
With regard to accuracy, the coefficients of variation have ranges of 14-23%, 5-7%,
and 12-18% for the Young’s Modulus, strength, and strain, respectively. Figure 4.54,
4.55 and 4.56 illustrate the graphs of the mechanical properties for all the specimens
tested, with and without glass bead filler.
Fig. 4.54. Young’s Modulus as a function of beads percentage
0
200
400
600
800
1000
1200
1400
1600
0 1 2 3 4 5 6 7 8 9 10
Percentage of beads
You
ng's
Mod
ulus
[MP
a]
0.8 mm
1 mm
1.25 mm
1.75 mm
2.25 mm

University of Missouri - Rolla - C.I.E.S. Università degli studi di Genova - D.I.S.E.G.
117
Fig. 4.55. Strength as a function of beads percentage
Fig. 4.56. Strain as a function of beads percentage
The experimental values show that there is not a significant decreasing trend in
mechanical properties for specimens with increasing percentages of glass beads. An
exception can be seen for the specimens with beads of 2.25 mm in diameter. For these
0.00
0.05
0.10
0.15
0.20
0.25
0 1 2 3 4 5 6 7 8 9 10
Percentage of beads
Stra
in [m
m/m
m]
0.8 mm
1 mm
1.25 mm
1.75 mm
2.25 mm
0
2
4
6
8
10
12
0 1 2 3 4 5 6 7 8 9 10
Percentage of beads
Stre
ss [M
Pa]
0.8 mm1 mm1.25 mm1.75 mm2.25 mm

University of Missouri - Rolla - C.I.E.S. Università degli studi di Genova - D.I.S.E.G.
118
kinds of specimens a loss of mechanical properties bigger than in the other specimens
is noted. It is reasonable to think that the loss was due to the dimensions of the beads.
The data of the specimens with different percentages of sand are summarized in table
4.30. Tab. 4.30. Values for the specimens with the sand
0% 5% 10% 15% 20% Young’s Modulus [MPa] 1319 1226 1248 1227 1096
Stress [MPa] 10.40 8.88 8.71 8.94 8.52
Strain [mm/mm] 0.190 0.163 0.126 0.118 0.126 Note: 1 MPa = 145 psi; 1 mm = 0.03937 in
Figure 4.57 illustrates the graphs of the normalized mechanical properties for all the
specimens with and without sand.
Fig. 4.57. Young’s Modulus, strength and strain as a function of sand percentage
A slight decrease of tensile mechanical properties can be seen comparing the
specimen with and without sand. For example, the loss of mechanical properties for
the data obtained from specimens with 20% of sand, is shown in the following table.
0
0.2
0.4
0.6
0.8
1
1.2
1.4
0 5 10 15 20
Percentage of sand
Nor
mal
ized
Str
ain,
Str
ess
and
You
ng's
M
odul
us
Ei/Eo
Si/So
ei/eo

University of Missouri - Rolla - C.I.E.S. Università degli studi di Genova - D.I.S.E.G.
119
Tab. 4.31. Losses of mechanical properties
Virgin Specimen 20% Sand Loss (%)
Young’s Modulus [MPa] 1319 1096 17
Stress [MPa] 10.40 8.52 18
Strain [mm/mm] 0.190 0.126 34
4.3.3. Durability
Beyond the cost issues, the most significant technical obstacle preventing the
extended use of FRP materials in construction is a lack of long-term and durability
performance data comparable to the data available for traditional construction
materials.
In general durability of a structure or a material can be defined as the ability to resist
cracking, oxidation, chemical degradation, delamination, wear, and/or the effects of
foreign object damage for a specific period of time, under the specified load and
environmental conditions.
The effect of moisture or alkaline solutions sorption in the materials varies and may
produce in general, a loss in strength and stiffness (Micelli et al., 2001). The study of
the alkaline attack has particular importance in construction applications. Usually
putty is necessary when the laminates are used. So, its durability may have an
influence on bond behavior between FRP laminates and surface.
The alkaline solutions in general produce an embrittlement of the materials and a
damage at the fiber resin interface level by chemical attack and growth of hydration
products. These effects lead to a loss in tensile strength and interlaminar properties
(Devalapura, 1997; Franke et al., 1987). Previous studies (Litherland et al., 1981;
Vijay et al., 1999; Ganga Rao et al., 1997) showed how temperature influences the
sorption and diffusive properties of alkaline solutions in FRP composites, comparing
natural aging and accelerated test results. Therefore, it may be possible to conduct
accelerated tests in which the long-term behavior can be simulated with satisfactory

University of Missouri - Rolla - C.I.E.S. Università degli studi di Genova - D.I.S.E.G.
120
accuracy. The following equation is used to relate the temperature and time used for
conditioning to real conditions:
95
0.0558 ( 32)N =0.098 eC
T +⋅ (4.15)
Where:
N = age in natural days
T = conditioning temperature in °C
C = days of accelerated exposure at temperature T
The diagram in figure 4.58 represents the relationship.
Fig. 4.58. Accelerated aging in alkaline solutions for T = 60 ºC (140 ºF)
Infrastructure systems are exposed to external agents during their life cycle, so the
mechanical behavior under natural weathering needs to be understood.
0
5
10
15
20
25
30
35
0 5 10 15 20 25 30 35 40 45 50
Accelerate aging (days)
Rea
l con
ditio
ns (y
ears
)

University of Missouri - Rolla - C.I.E.S. Università degli studi di Genova - D.I.S.E.G.
121
Alkaline Solution Exposure An attempt has been made in this study to reproduce the alkaline pore water in or
from the concrete, rather than a solution with high pH.
The solution used was the following:
0.012% Ca(OH)2+0.073% Na(OH)+0.103% K(OH) (4.16)
Where:
Ca(OH)2 = calcium hydroxide
Na(OH) = sodium hydroxide
K(OH) = potassium hydroxide
The selected amounts represent the percentages in weight that were solved in distilled
water. The pH measurements showed that a pH = 12.6 was the constant value, before
and after the conditioning.
To replicate the exposure of putty to an alkaline environment, 84 specimens were
immersed in the alkaline solution with pH 12.6 at temperature of 60 oC (140 oF).
Specimens were tested in direct tension after 21 and 42 days of exposure, which
correspond to real times of 14 and 28 years respectively.
Young’s modulus, strength and strain behavior were measured and compared with the
properties of the control specimens. Problems occurred during the tests of the
specimens at 42 days and the data can not be utilized.
Test results of the specimens after 21 days
The 42 specimens were analyzed with the same method used for the unconditioned
specimens. The results are summarized in tables 4.32, 4.33 and 4.34 where the
average for each diameter and percentage of beads is represented.

University of Missouri - Rolla - C.I.E.S. Università degli studi di Genova - D.I.S.E.G.
122
Tab. 4.32. Young’s Modulus values [MPa]
Beads % Beads diameters
0
1
2
3
4
5
8
10
0.8 mm 561 552 581 587 547 687 581
1 mm 676 685 631 594 587 576 606
1.25 mm 569 596 554 698 658 616 685 1.75 mm 629 608 692 564 552 495 522
2.25 mm
687
656 658 641 621 601 565 502 Note: 1 MPa = 145 psi; 1 mm = 0.03937 in
Tab. 4.33. Stress values [MPa]
Beads % Beads diameters
0
1
2
3
4
5
8
10
0.8 mm 4.742 4.492 4.663 4.655 4.337 4.113 4.058
1 mm 4.960 4.775 4.764 3.822 4.224 4.150 4.384 1.25 mm 3.731 3.835 4.150 4.303 4.442 4.415 3.571 1.75 mm 4.122 3.644 3.463 3.879 3.489 3.378 3.252 2.25 mm
4.497
3.307 3.152 2.901 3.408 3.066 3.313 2.672 Note: 1 MPa = 145 psi; 1 mm = 0.03937 in
Tab. 4.34. Strain values [mm/mm]
Beads % Beads diameters
0
1
2
3
4
5
8
10
0.8 mm 0.122 0.117 0.123 0.106 0.116 0.087 0.075
1 mm 0.121 0.121 0.118 0.123 0.140 0.103 0.112 1.25 mm 0.128 0.132 0.127 0.102 0.098 0.103 0.095 1.75 mm 0.106 0.092 0.090 0.105 0.107 0.124 0.118 2.25 mm
0.098
0.121 0.101 0.069 0.092 0.082 0.089 0.086 Note: 1 MPa = 145 psi; 1 mm = 0.03937 in

University of Missouri - Rolla - C.I.E.S. Università degli studi di Genova - D.I.S.E.G.
123
Figure 4.59, 4.60 and 4.61 illustrate the graphs of the mechanical properties for all the
specimens compared with those specimens without filler at same days of cure in the
alkaline bath.
Fig. 4.59. Young’s Modulus for specimens with and without beads
Fig. 4.60. Stresses for specimens with and without beads
0
200
400
600
800
1000
1200
1400
1600
0 1 2 3 4 5 6 7 8 9 10
Percentage of beads
Youn
g's
Mod
ulus
[MPa
]0.8 mm
1 mm
1.25 mm
1.75 mm
2.25 mm
0
2
4
6
8
10
12
0 1 2 3 4 5 6 7 8 9 10
Percentage of beads
Stre
ss [M
Pa]
0.8 mm
1 mm1.25 mm
1.75 mm2.25 mm

University of Missouri - Rolla - C.I.E.S. Università degli studi di Genova - D.I.S.E.G.
124
Fig. 4.61. Strains for specimens with and without beads
Specimens containing glass beads and left for 21 days in the alkaline solution
experienced a significant loss in mechanical properties in comparison with specimens
without filler. Behavior similar to that obtained from the unconditioned specimens
can be observed in the specimen with different percentages of glass beads. An
exception was observed for the specimens with beads of 2.25 mm where their
relatively large diameter causes a relevant decrease of mechanical properties.
As an example the percentile difference between the values of the specimens without
filler at 0 days and 21 days is summarized in table 4.35.
Tab. 4.35. Losses of mechanical properties between the results at 21 and 0 days
Variation Young’s Modulus [MPa] 48 %
Stress [MPa] 57 %
Strain [mm/mm] 48 %
These values could be also assumed for the other specimens, seeing that the
mechanical properties obtained from the tests are almost equal.
0.00
0.05
0.10
0.15
0.20
0.25
0 1 2 3 4 5 6 7 8 9 10
Percentage of beads
Stra
in [m
m/m
m]
0.8 mm1 mm1.25 mm1.75 mm2.25 mm

University of Missouri - Rolla - C.I.E.S. Università degli studi di Genova - D.I.S.E.G.
125
From the experiments an embrittlement of the material was also observed.
Figure 4.62 shows a different behavior as for the specimens at 0 days (figure 4.52)
and can be noted that the specimen showed a stretching along the free gage length but
not a clearly failure of the cross section like the specimens at 0 days (see also figure
4.52)
(a) (b) Fig. 4.62. Failure of the specimens
As an example, figure 4.63 shows the experimental behavior of a specimen at 0 and
21 days of exposure.
Fig. 4.63. Example of experimental behavior of a specimen at 0 and 21 days
0
2
4
6
8
10
0 0.02 0.04 0.06 0.08 0.1 0.12 0.14 0.16
Strain [mm/mm]
Stre
ss [M
Pa]
0 days
21 days

University of Missouri - Rolla - C.I.E.S. Università degli studi di Genova - D.I.S.E.G.
126
Data for specimens with different percentage of sand are summarized in table 4.36.
Tab. 4.36. Values for the specimens with the sand
0% 5% 10% 15% 20% Young’s Modulus [MPa] 680.6 687.0 677.4 760.8 876.8
Stress [MPa] 4.497 3.786 3.584 3.631 3.433
Strain [mm/mm] 0.098 0.113 0.078 0.073 0.081 Note: 1 MPa = 145 psi; 1 mm = 0.03937 in
Fig. 4.64. Mechanical properties for specimens with and without sand
A decrease in mechanical properties can be also seen for the specimens with sand
comparing unconditioned specimens and those exposed for 21 days. To have an order
of magnitude of the losses of mechanical properties, in the table 4.37 the data
0
0.2
0.4
0.6
0.8
1
1.2
1.4
0 5 10 15 20
Percentage of sand
Nor
mal
ized
Stra
in, S
tress
and
You
ng's
M
odul
us
Ei/Eo
Si/So
ei/eo

University of Missouri - Rolla - C.I.E.S. Università degli studi di Genova - D.I.S.E.G.
127
obtained from the specimens were compared with those obtained from unconditioned
specimens. Tab. 4.37. Losses of mechanical properties
Virgin SpecimenYoung’s Modulus [MPa] 41 % Stress [MPa] 57 % Strain [mm/mm] 36 %
The experimental data show that after the conditioning not substantial difference of
mechanical properties between the 0% sand specimen and the specimen with the sand
were encountered. This could mean that the long term behavior is governed by the
putty itself.
Problems occurred during the tests of the specimens at 42 days and the data can not
be utilized, however the results of these tests are sufficient to say that there would be
some durability problems and a thorought investigation utilizing more than one
material is necessary since the putty occupy an important place on the bond behavior
between FRP and surfaces.
Gravimetric Measurements
Putty specimens were also used for gravimetric measurements; 84 specimens were
immersed in the alkaline solution at temperature of T = 60 ºC (140 ºF) for 21 and 42
days and weighted every seven days. The weight change investigation presents
important information. In fact, absorption properties such as diffusivity of the putty
can be easily computed once the weight increase is known. The fluid content was
measured as follows:
100(%) ⋅−=d
dt W
WWM (4.17)
Where:
Mt(%) = percentage of fluid content at time t
Wd = weight of the dry specimen at time t = 0
W = weight of the moist specimen at time t

University of Missouri - Rolla - C.I.E.S. Università degli studi di Genova - D.I.S.E.G.
128
If the absorption is linear, as usually happens in the first part of the exposure, the
diffusivity δ can be computed using the following equation with reference to figure
4.65, in which the typical absorption of FRP composites is shown: 2
12
2
122 1
16 ⎟⎟
⎠
⎞
⎜⎜
⎝
⎛
−⋅⎟⎟
⎠
⎞⎜⎜⎝
⎛ −⋅=ttM
MMR
m
πδ (4.18)
Where:
δ = diffusivity [mm2/min] (in2/min)
R = radius of the rod [mm] (in)
M1 = percentage of fluid content at time t1
M2 = percentage of fluid content at time t2
Mm = percentage of fluid content at the end of the linear behavior
t1 = starting time of observation (min)
t2 = end time of observation (min)
Fig. 4.65. Typical absorption behavior of FRP composites
Since the specimen cross section is rectangular, an equivalent radius was used
imposing an equal perimeter length between the specimen and the “equivalent
cylinder”.
Moi
stur
e co
nten
t (%
)
Square root of time (min)
Mm
M2
M1
√t2 √t1
Fickian Diffusion

University of Missouri - Rolla - C.I.E.S. Università degli studi di Genova - D.I.S.E.G.
129
In correspondence of Mm, the slope of the curve changes dramatically because a
particular phenomena occurs: the fluid penetration after a time tm causes a
macroscopic mechanical degradation of the system. This means that cracks open and
allow a fast fluid penetration that is represented by the second curve with increased
slope. Therefore, after the fickian diffusion region the absorption behavior is
controlled by the fluid penetration in the open cracks developed from the surface to
the inner part of the sample. The behavior of the putty has been different. In
particular, test results showed that after the first fast penetration of the fluid occurred
in the first 14 days with an increase of the weight, the slope of the curve changed
dramatically in opposite direction finishing after 42 days close to the starting weight
or, in many cases, to a lower one. This means that the fluid penetration causes a
macroscopic mechanical degradation of putty and beads with a dispersion of material
in the solution. Some beads used to make the specimens were also weighted at t = 0
days and at t = 42 days; the result was that in a sample of about 4 g. the percentage of
glass lost was 2.19% in weight. Thereby is also presumable that after the 42 days of
the test, the weight could still be descendent, because of the increment of degradation
of putty and beads.
In figure 4.66 an example of the behavior observed in the tests is shown.
Fig. 4.66. Example of typical absorption behavior of putty with beads
-1
-0.5
0
0.5
1
1.5
2
2.5
0 50 100 150 200 250
Square root of time (min)
Moi
stur
e co
nten
t (%
)
P 0P 2,25-1P 2,25-2P 2,25-3P 2,25-4P 2,25-5P 2,25-8P 2,25-10

University of Missouri - Rolla - C.I.E.S. Università degli studi di Genova - D.I.S.E.G.
130
From the graphs, it is possible to see that the specimens with higher percent of beads
lost more weight than the others. It is also possible to see that the weight loss for the
specimens without beads was lower than the one of all the other specimens. In
general, this behavior is common to all the other tests apart from some cases,
probably caused by the imperfection of the specimens that can determine an
infiltration of more solution.
The figure 4.67 shows the state of moisture for the specimens with various percentage
of sand.
Fig. 4.67. Typical absorption behavior of putty with sand
4.3.4. Conclusions Experimental values from this research show that there is not a significant decreasing
trend for each kind of unconditioned specimens with different percentages of glass
beads. This means that the beads do not significantly affect the tensile mechanical
properties. A trend can be seen for the specimens with beads of 2.25 mm (0.0886 in)
in diameter. For these specimens, a loss of mechanical properties greater than in the
other specimens was noted. For the specimens with sand as filler, a slight decrease of
-1
-0.5
0
0.5
1
1.5
2
2.5
0 50 100 150 200 250
Square root of time (min)
Moi
stur
e co
nten
t (%
)
P S-0P S-5P S-10P S-15P S-20

University of Missouri - Rolla - C.I.E.S. Università degli studi di Genova - D.I.S.E.G.
131
tensile mechanical properties could be seen as a function of sand content. For the pre-
conditioned specimens left for 21 days in the alkaline solution, a significant loss of
mechanical properties and an embrittlement of the material were noted as compared
to a specimen without fillers. From the experimental values, it can be observed that
the specimens with beads have a behavior similar to the one obtained from the
unconditioned specimens, which means that there is not significant influence of the
beads. Beads of 2.25 mm (0.0886 in) diameter may be a threshold size as they caused
a relevant decrease of mechanical properties. A decrease of mechanical properties due
to alkaline exposure can also be seen for the specimens with sand. From the
experimental data recorded at 21 days, there was no effect due to sand content and
this could mean that the long term behavior is governed by the putty itself. The
results of these tests are a warning with respect to durability. An in-depth
investigation of this and other types of putty may be warranted. The gravimetric test
results showed that after the initial rapid sorption of the fluid that occurred in the first
14 days with an increase of weight, the slope of the curve ( t vs. moisture) changed
dramatically in the opposite direction, finishing after 42 days close to or lower than
the starting weight. This may mean that the fluid penetration causes a macroscopic
mechanical degradation of putty and glass beads with a dispersion of material in the
solution. From the graphs it is possible to see that the specimens with higher percent
of beads lost more weight than the ones without fillers.
4.4. Bond Test Controlling the Thickness of Putty Putty may have a primary influence on bond behavior between FRP and surfaces; the
scope of this investigation is verifying it. Glass beads with different diameters were
included into the mixture to control the thickness of the putty on the masonry surface.
In particular, after the previous results, the glass beads with diameter 2.25 mm
(0.0886 in) were discarded because of consistent loss of mechanical properties of the
material founded. Because of this, the beads with diameter 0.8 mm (0.0315 in) were
chosen, and to have a significant difference between the thickness of putty applied on
the surface of the specimens, the beads with diameter 1.75 mm (0.0689 in) were also
used in the tests.

University of Missouri - Rolla - C.I.E.S. Università degli studi di Genova - D.I.S.E.G.
132
4.4.1. Test Specimens Standard hollow clay bricks and AFRP sheets were used to investigate the bond
behavior in order to understand it as function of the thickness of putty. Nine
specimens were built, three control specimens without beads inside the putty and the
others specimens with beads diameters 0.8 and 1.75 mm (0.0315, 0.0689 in). A
percentile of beads of 5% in weight was chosen because it was the best compromise
between work-ability of the mixture and the creation a unique layer without
imperfections like holes or hollows.
Table 4.38 illustrates the configuration of the specimens.
Tab. 4.38. Thickness of the putty for each specimen
Specimens Thickness of the putty [mm]
P-0-1 0
P-0-2 0
P-0-3 0
P-0.8-1 0.8
P-0.8-2 0.8
P-0.8-3 0.8
P-1.75-1 1.75
P-1.75-2 1.75
P-1.75-3 1.75
Note: 1 mm = 0.03937 in The AFRP sheets used were AK60 Master Builders technologies with the following
properties from the material characterization (see also section 4.1.6):
Tab. 4.39. Properties of AK60 Master builders technologies sheet
Rupture [MPa] 1880 Tensile Elastic Modulus [GPa] 121
Tensile strain [%] 1.63 Thickness [mm] 0.28*
Note: 1 MPa = 145 psi; 1 mm = 0.03937 in; * = value from manufacturer
The preparation of the specimens is represented in figure 4.68 where are shown all
the specimens (a) and a particular sight of the specimen P-0.8-1 (b). All the phases of
the preparation of the specimens are reported in appendix D.

University of Missouri - Rolla - C.I.E.S. Università degli studi di Genova - D.I.S.E.G.
133
(a) (b)
Fig. 4.68. Preparation of the specimens
In order to simplify the setup and to do fast tests, just two clay bricks were used for
each test; figure 4.69 shows the configuration utilized.
FRP WIDTH
CLAY BRICKS
AFRP SHEETTEST REGION
Fig. 4.69. Generic test configuration
One FRP sheet was applied to each face of the clay bricks in the longitudinal
direction, connecting two clay bricks together. Only one clay brick was considered
with a limited bonded length, called test region, of 50.8 mm (2 in); this was chosen to
force the delamination only in that area. About a double bonded length, respect the
test region, was chosen and made to avoid failure in others zones.
The specimens were prepared following the wet-lay-up technique (see section 3.1).
The specimens were left to cure for 4 days prior to testing.

University of Missouri - Rolla - C.I.E.S. Università degli studi di Genova - D.I.S.E.G.
134
(a) (b)
Fig. 4.70. Preparation of the specimens
4.4.2. Test Setup
The test bed consisted of a wood plate with four wood angles nailed on the plate to
delimitate the position where the clay bricks had to be placed. The purpose of the
plate was to ensure the proper positioning of the specimens during preparation and
testing. Load was applied by means of a 12-ton hydraulic jack connected to a
hydraulic pump. The jack was placed horizontally between the two blocks.
A Sensotek pressure transducer connected to the hydraulic jack recorded the load.
Loads were all recorded with a one-Hertz sampling rate by a LABTECH data
acquisition system. Figures 4.71 illustrate the test setup.
Fig. 4.71. Generic test configuration

University of Missouri - Rolla - C.I.E.S. Università degli studi di Genova - D.I.S.E.G.
135
4.4.3. Test Results All the results are summarized in the table 4.40.
Tab. 4.40. Values for the specimens
Specimens Load [kN] Load Average [kN]
P-0-1 13,5
P-0-2 n.d.
P-0-3 10,1
11.8
P-0.8-1 12,7
P-0.8-2 12,3
P-0.8-3 13,5
11.7
P-1.75-1 12,5
P-1.75-2 11,9
P-1.75-3 14,1
12.8
Two different types of delamination were observed; the first type in the specimens
P-1.75-2, P-1.75-3, P-0.8-3 between the putty and the fiber and the second type for all
the others specimens was between the putty and the brick with removal of a layer of
brick. These phenomena are shown in figure 4.72.
(a) (b)
Fig. 4.72. Different modes of failure Anyway, issues were encountered in the test setup because of high tensile stresses in
the brick due to the force transferred by means of FRP sheets. One of the specimens
has been lost and there were also some problems with the others. In almost all the
tests there was the rupture of the brick after the delamination.

University of Missouri - Rolla - C.I.E.S. Università degli studi di Genova - D.I.S.E.G.
136
Maybe the different mode of failure must be found in an imperfect setup.
In the figure 4.73 is shown the graph thickness of putty versus load.
Fig. 4.73. Behavior of the load in function of the thickness of putty
4.4.4. Conclusions Seeing the results, it can be observed a light increase of about 8% of the load between
the specimens with the higher thickness of putty and the specimen without beads
inside. However, setup issues and a limited number of tests do not allow to say
whether the putty influences the bond behavior. Therefore, further investigations and
a new setup are needed.
10
11
12
13
14
0 0.2 0.4 0.6 0.8 1 1.2 1.4 1.6 1.8
thickness of putty [mm]
Load
[kN
]

University of Missouri - Rolla - C.I.E.S. Università degli studi di Genova - D.I.S.E.G.
137
5. INFLUENCE OF ARCHING MECHANISM IN MASONRY WALLS STRENGTHENED WITH FRP LAMINATES
5.1. Previous Results The previous results shown in this paragraph are researches on simply supported
walls, meaning that boundary conditions such as presence of slabs or surrounded
concrete frames are not taken into consideration; in other words, masonry walls with
high slenderness ratio in which the arching effect (section 1.2) can be ignored.
Ehsani et al. (1996) investigated the flexural behavior of URM walls strengthened
with GFRP sheets. Their dimensions were 0.22 m (8.5in) wide, 0.1 m (4in) high, and
1.48 m (57in) long. Two different kinds of mortars were used for their construction,
type M with cement: lime sand ratios of 1:1/4:3 and a compressive strength of 32.04
MPa (4.65 ksi); and type M* with ratios of 1:1/4:5 and a compressive strength of 28.25
MPa (4.1 ksi). The specimens were subjected to four-point bending. The primarily
failure was a tension failure, which was observed when a low amount of
strengthening was used. When the number of plies was increased, the masonry failed
in compression. It was observed that the flexural capacity was increased up to 24
times compared to the control specimen. As observed in figure 5.1, the effect of the
mortar strength appeared to be negligible, both specimens failed by crushing of the
masonry.
Fig. 5.1. Test results (Ehsani, 1996)

University of Missouri - Rolla - C.I.E.S. Università degli studi di Genova - D.I.S.E.G.
138
Hamilton et al. (1999) investigated the flexural behavior of URM walls strengthened
with different composite materials. The walls were built with standard concrete
blocks, with an overall dimension of 0.61 m (2 ft) by 1.83 m (6 ft). The use of high
strength composite materials such as CFRP and AFRP led to undesirable modes of
failure such as delamination and shear in the masonry. In order to use the material
efficiently, two alternatives were recommended: the first one was to increase the
spacing of the material until observing the rupture of the laminate and the second one
was to use less expensive materials such as GFRP. Four modes of failure were
identified: debonding, laminate rupture, shear, and face shell pull out. It was reported
that debonding from the masonry substrate caused the failure of most of the test
specimens (see figure 5.2).
Fig. 5.2. Debonding of FRP laminate (Hamilton, 1999) Velazquez et al. (2000) reported test results of half-scale URM walls tested under out-
of-plane cyclic loading. The test specimens had a width of 1.22 m (48 in) and a height
of 1.42 m (56 in), with a slenderness ratio of 28. Two of the walls were strengthened
on both faces with GFRP strips. By understanding that the balanced condition
represents the failure of masonry and rupture of composite laminate at the same time,
one wall had the reinforcement equivalent to the balanced ratio (100% ρb). The other
wall had three times the amount of reinforcement as compared to the first wall (300%
ρb). The specimen reinforced with 100% ρb showed extensive delamination at failure.
The first delaminated areas were observed on the central strip above the middle brick
FRP
Laminate
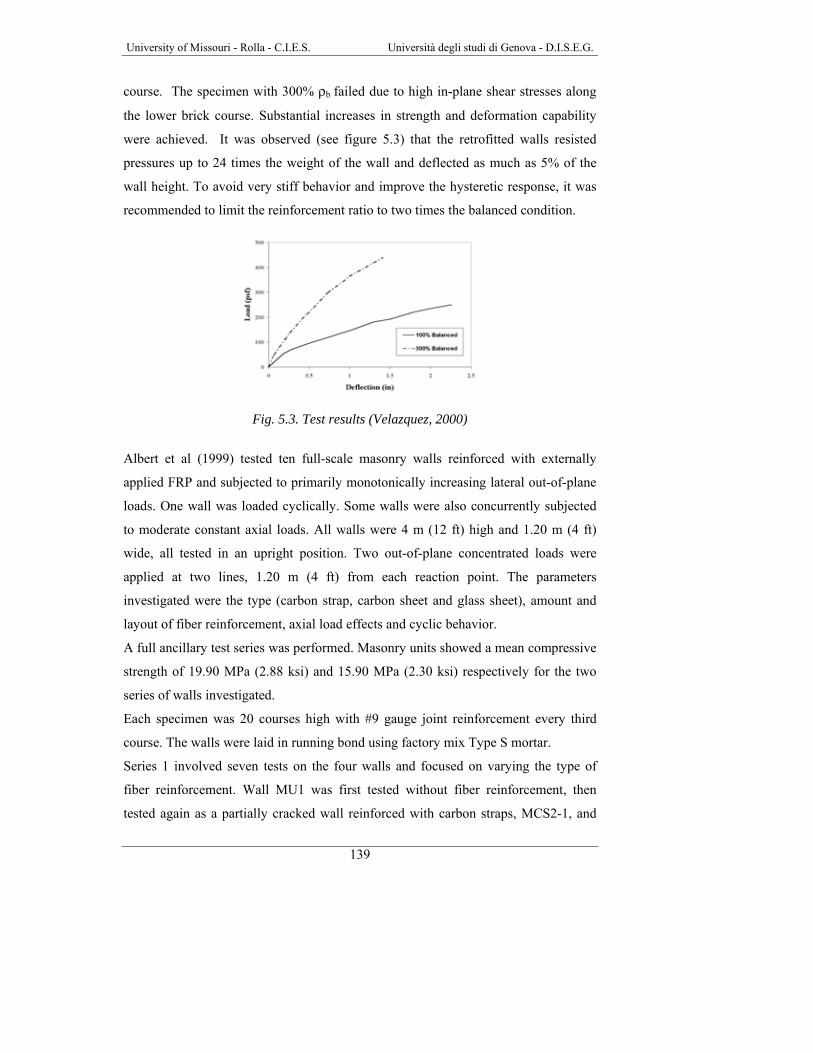
University of Missouri - Rolla - C.I.E.S. Università degli studi di Genova - D.I.S.E.G.
139
course. The specimen with 300% ρb failed due to high in-plane shear stresses along
the lower brick course. Substantial increases in strength and deformation capability
were achieved. It was observed (see figure 5.3) that the retrofitted walls resisted
pressures up to 24 times the weight of the wall and deflected as much as 5% of the
wall height. To avoid very stiff behavior and improve the hysteretic response, it was
recommended to limit the reinforcement ratio to two times the balanced condition.
Fig. 5.3. Test results (Velazquez, 2000)
Albert et al (1999) tested ten full-scale masonry walls reinforced with externally
applied FRP and subjected to primarily monotonically increasing lateral out-of-plane
loads. One wall was loaded cyclically. Some walls were also concurrently subjected
to moderate constant axial loads. All walls were 4 m (12 ft) high and 1.20 m (4 ft)
wide, all tested in an upright position. Two out-of-plane concentrated loads were
applied at two lines, 1.20 m (4 ft) from each reaction point. The parameters
investigated were the type (carbon strap, carbon sheet and glass sheet), amount and
layout of fiber reinforcement, axial load effects and cyclic behavior.
A full ancillary test series was performed. Masonry units showed a mean compressive
strength of 19.90 MPa (2.88 ksi) and 15.90 MPa (2.30 ksi) respectively for the two
series of walls investigated.
Each specimen was 20 courses high with #9 gauge joint reinforcement every third
course. The walls were laid in running bond using factory mix Type S mortar.
Series 1 involved seven tests on the four walls and focused on varying the type of
fiber reinforcement. Wall MU1 was first tested without fiber reinforcement, then
tested again as a partially cracked wall reinforced with carbon straps, MCS2-1, and

University of Missouri - Rolla - C.I.E.S. Università degli studi di Genova - D.I.S.E.G.
140
finally as a fully cracked wall, MCS3-2. One was reinforced on one side with carbon
sheet and tested until fully cracked, MCST4, then additional carbon sheet fiber
reinforcement was placed on the opposite side and the wall was tested again in a
cyclic manner, MCST7-4. One test in the series involved a wall reinforced with four
carbon straps , MCS-6, and another was reinforced with two glass sheets, MGST5.
Overall results showed that the strength and ductility of the specimens were increased
significantly when strengthened. The overall behavior of the specimens was similar.
The load-midspan deflection response for all the specimens was found to be divided
into two phases. The first phase, nonlinear, represented the stiffness contribution of
the masonry materials. The second phase was linear and represented the stiffness
contribution from the fiber reinforcement.
The type and amount of reinforcement used affected the overall stiffness of a
specimen. The layout of the fiber reinforcement had more of a direct effect on the
local joint strain behavior than the overall behavior. The introduction of axial load
increased the first phase stiffness and reduced the second phase stiffness. Series 2
involved six tests on the six walls and focused on varying the layout and amount of
carbon fiber sheet. The fiber reinforcement was primarily oriented in the vertical
direction to optimize the strength of the fibers. ICST12 was tested with the strips
oriented diagonally. The purpose of this test was to determine the out-of-plane
resistance of a wall reinforced primarily for in-plane loads. Axial load effects were
also investigated in the series, ICST9 and ICST13.
Fig. 5.4. Patterns and placement of FRP (Albert, 1999)

University of Missouri - Rolla - C.I.E.S. Università degli studi di Genova - D.I.S.E.G.
141
Fig. 5.5. Load-deflection response for series 1 (Albert, 1999)
Fig. 5.6. Load-deflection response for series 2 (Albert, 1999)
Morbin A. et al. (2001) conducted work on simply supported walls at University of
Missouri – Rolla just before the work shown in the next paragraphs.
Twenty unreinforced masonry walls were constructed for the experimental program:
half of them were built with 0.102 by 0.203 by 0.305 m (4x8x12in) concrete blocks
and half with 0.64 by 0.102 by 0.203m (2.5x4x8in) dark molded clay bricks in a
running bond pattern, six and eighteen courses respectively. The specimens were 1.22
m (48 in) high, 0.61 m (24 in) wide and 0.102 m (4 in) thick. The mortar used was
classified as Type N according to the standard ASTM C270.
The average compressive strength of the concrete masonry was 9.74 MPa (1414 psi)
with a standard deviation of 1.04 MPa (151 psi), whereas the compressive strength of
the clay masonry was 17.22 MPa (2500 psi) with a standard deviation of 0.35 MPa
(50 psi). The reinforcement was applied just on one side of the walls. The fiber
reinforcement strategy is shown in table 5.1 and 5.2; the amount of reinforcement was

University of Missouri - Rolla - C.I.E.S. Università degli studi di Genova - D.I.S.E.G.
142
chosen as a function of the balanced conditions ρb (It represents the failure of
masonry and rupture of composite laminate at the same time. Further information is
in section 5.2).
Tab. 5.1. Test matrix for series CO (concrete specimens) - Morbin, 2001
Specimen Strengthening System Reinforcing Scheme COA3
AFRP laminates
COG3
GFRP laminates
One strip (w=3 in)
COA5
AFRP laminates
COG5
GFRP laminates
One strip (w=5 in)
COA7
AFRP laminates
COG7
GFRP laminates
One strip (w=7 in)
COA9
AFRP laminates
COG9
GFRP laminates
One strip (w=9 in)
COA12
AFRP laminates
COG12
GFRP laminates
One strip (w=12 in)

University of Missouri - Rolla - C.I.E.S. Università degli studi di Genova - D.I.S.E.G.
143
Tab. 5.2. Test matrix for series CL (clay specimens) – Morbin, 2001
Masonry specimens were tested under four point bending, following the ASTM
standard E518. Each was tested as a simply supported beam, meaning that boundary
conditions such as presence of corners or joint interferences were not taken into
consideration. Figure 5.7 and 5.8 illustrates the test setup.
Specimen Strengthening System Reinforcing Scheme
CLA3
AFRP laminates
CLG3
GFRP laminates
One strip (w=3 in)
CLA5
AFRP laminates
CLG5
GFRP laminates
One strip (w=5 in)
CLA7
AFRP laminates
CLG7
GFRP laminates
One strip (w=7 in)
CLA9
AFRP laminates
CLG9
GFRP laminates
One strip (w=9 in)
CLA12
AFRP laminates
CLG12
GFRP laminates
One strip (w=12 in)

University of Missouri - Rolla - C.I.E.S. Università degli studi di Genova - D.I.S.E.G.
144
distribution beam
20 kip hydraulic jack
load plates
50 kip load cell
high strength steel rod
reaction beam
platebolt
gravity supports
masonry specimen
1''1''48''
18'' 18''8''
Fig. 5.7. Load scheme (Morbin, 2001)
Fig. 5.8. Test set-up (Morbin, 2001) The load was applied in cycles of loading and unloading. Table 5.3 illustrates a
summary of the load cycles.

University of Missouri - Rolla - C.I.E.S. Università degli studi di Genova - D.I.S.E.G.
145
Tab. 5.3. Load cycles – Morbin, 2001
Cycle Load Range (kips)
1 0-0.5 2 0.5-1.5-0.5 3 0.5-2.5-0.5 4 0.5-3.5-0.5 5 0.5-failure
In the figures 5.9 a and b, 5.10 a and b are shown the results for all the specimens
tested.
(a)
0
5
10
15
20
25
30
35
40
0 5 10 15 20 25 30 35 40
Midspan deflection (mm)
Load
(kN)
COG12 COG9
COG7 COG5
COG3

University of Missouri - Rolla - C.I.E.S. Università degli studi di Genova - D.I.S.E.G.
146
(b)
Fig. 5.9. Envelopes of series COG (a) and COA (b)
(a)
0
5
10
15
20
25
30
35
40
0 5 10 15 20 25 30 35 40
Midspan deflection (mm)
Load
(kN)
COA3
COA5
COA7 COA9
0
5
10
15
20
25
30
35
40
0 5 10 15 20 25 30 35 40
Midspan deflection (mm)
Load
(kN)
CLG3
CLG5
CLG7 CLG9
CLG12

University of Missouri - Rolla - C.I.E.S. Università degli studi di Genova - D.I.S.E.G.
147
(b)
Fig. 5.10. Envelopes of series CLG (a) and CLA (b) Out of the 20 tests, three general modes of failure were observed:
(1) Debonding of the FRP laminates
(2) Tension failure of the FRP reinforcement
(3) Shear failure in the masonry units
All the experimental data are summarized in Table 5.4. Tab. 5.4. Mode of failure (Morbin, 2001)
Wall Failure Wall Failure COG3 Delamination CLG3 Delamination COG5 Delamination CLG5 Delamination COG7 Delamination CLG7 Delamination COG9 Shear CLG9 Shear
COG12 Shear CLG12 Shear COA3 Delamination CLA3 Delamination COA5 Delamination CLA5 Rupture COA7 Shear CLA7 Delamination COA9 Shear CLA9 Rupture COA12 Shear CLA12 Shear
The conclusions are that FRP laminates have been proven to remarkably increase the
flexural capacities of simply supported URM walls. Significant increases in flexural
capacities, compared to the less strengthened wall, ranging between 50% and 300%,
0
5
10
15
20
25
30
35
40
0 5 10 15 20 25 30 35 40
Midspan deflection (mm)
Load
(kN
)
CLA3
CLA5 CLA7
CLA9
CLA12

University of Missouri - Rolla - C.I.E.S. Università degli studi di Genova - D.I.S.E.G.
148
can be achieved in concrete and clay walls. Test results showed that debonding of
FRP laminates has been proven to be the controlling mechanism of failure. When a
large amount of FRP is provided, shear failure occurred.
5.2. Experimental Program URM walls depend on the tensile strength of masonry to resist out-of-plane loads
(section 1.2) caused by high wind pressure or earthquakes. URM walls can collapse
due to this limitation. In addition, relatively stiff frames may restrain the movement
of the wall when subjected to out-of-plane loading. As a consequence, in-plane
compressive forces are built, and produce a load resisting mechanism referred to as
arching action (section 1.2) that improve the flexural behavior of the wall. The in-
plane compression forces can delay cracking. Due to this action, the capacity of the
wall can be much larger than that computed assuming simply supported conditions.
Experimental works (Tumialan et al., 2001) have shown that the resultant force
between the out-of-plane load and the induced membrane force could cause the
crushing of the masonry units at the boundary. In this case, the application of the FRP
did not exhibit the same effectiveness as in the case of walls having simply supported
conditions. Thereby, the influence of arching mechanisms in the behavior of
retrofitted walls needs to be taken into account to fully realize the effectiveness of
strengthening strategies. Arching action becomes significant for height/thickness ratio
less than 20 (Angel, 1994).
Ten specimens were built (five in concrete blocks and five in clay bricks) in order to
investigate the FRP effectiveness in walls exhibiting arching action.
Standard hollow concrete blocks and clay bricks were used (see sections 4.1.2 and
4.1.3). The nominal dimensions of these walls were 1.22 m (48 in.) by 0.61 m (24
in.); their overall thickness was 0.095 m (3 3/4 in) for clay specimens and 0.092 m (3
5/8 in) for concrete specimens. Figure 5.11 illustrates the configuration of the walls.

University of Missouri - Rolla - C.I.E.S. Università degli studi di Genova - D.I.S.E.G.
149
Fig. 5.11. Configuration of the walls Generally, three ultimate states can be considered in flexural strengthening with FRP
laminates:
State 1: Debonding of the FRP laminate from the masonry substrate
State 2: Rupture of the FRP laminate
State 3: Crushing of masonry in compression
Previous investigations (Tumialan, 2000, Velazquez, 1998, Hamilton et al., 1999,
Morbin, 2001) suggest that the controlling state is the state 1 (section 4). If a large
amount of FRP is provided, shear failure may be observed. Theoretical flexural
capacities of the strengthened walls were estimated based on the assumption that no
premature failure was observed. This means that either rupture of the laminate or
crushing of masonry would control the wall behavior. For simplicity and similarly to
the flexural analysis of RC members, a parabolic distribution was used in the
computation of the flexural capacity of the strengthened masonry. Thus:
2
m mm m
m m
f f ' 2' '
ε εε ε
⎡ ⎤⎛ ⎞ ⎛ ⎞⎢ ⎥= −⎜ ⎟ ⎜ ⎟⎢ ⎥⎝ ⎠ ⎝ ⎠⎣ ⎦
( 5.1)
24"
48''
4'' 24" 4''
48''
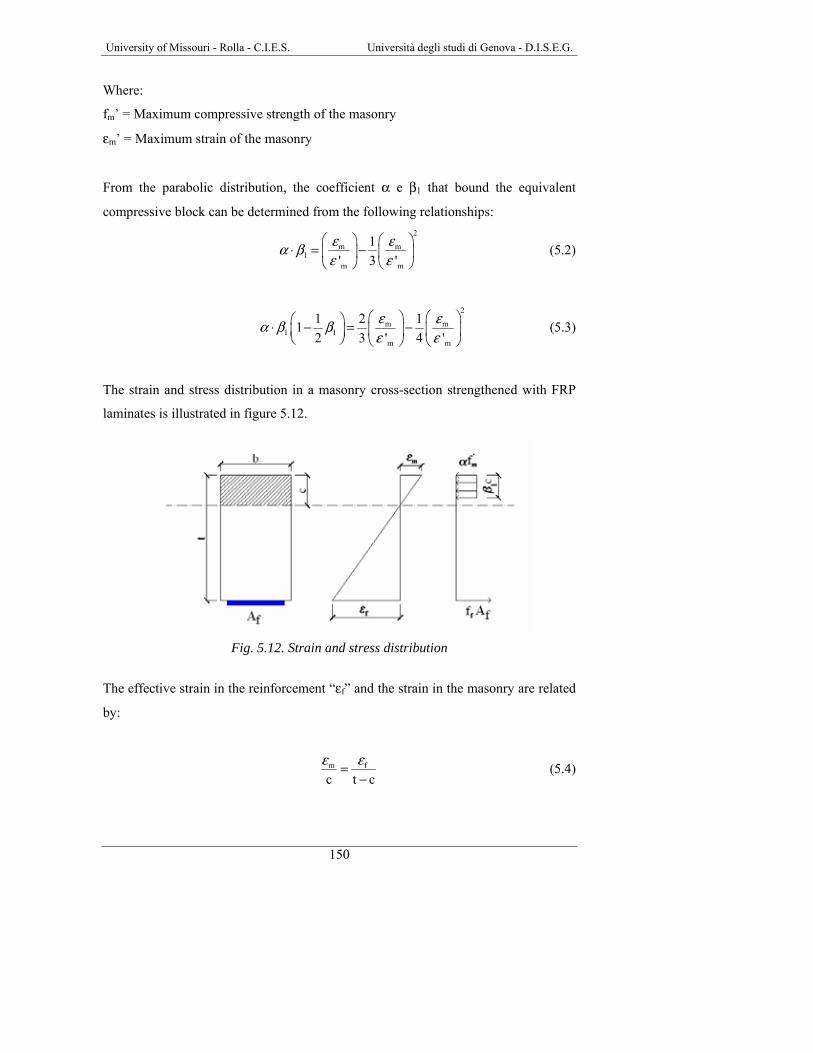
University of Missouri - Rolla - C.I.E.S. Università degli studi di Genova - D.I.S.E.G.
150
Where:
fm’ = Maximum compressive strength of the masonry
εm’ = Maximum strain of the masonry
From the parabolic distribution, the coefficient α e β1 that bound the equivalent
compressive block can be determined from the following relationships: 2
m m1
m m
1' 3 '
ε εα βε ε
⎛ ⎞ ⎛ ⎞⋅ = −⎜ ⎟ ⎜ ⎟
⎝ ⎠ ⎝ ⎠ (5.2)
2
m m1 1
m m
1 2 112 3 ' 4 '
ε εα β βε ε
⎛ ⎞ ⎛ ⎞⎛ ⎞⋅ − = −⎜ ⎟ ⎜ ⎟⎜ ⎟⎝ ⎠ ⎝ ⎠ ⎝ ⎠
(5.3)
The strain and stress distribution in a masonry cross-section strengthened with FRP
laminates is illustrated in figure 5.12.
Fig. 5.12. Strain and stress distribution
The effective strain in the reinforcement “εf” and the strain in the masonry are related
by:
m f
c t cε ε=
− (5.4)

University of Missouri - Rolla - C.I.E.S. Università degli studi di Genova - D.I.S.E.G.
151
where “c” is the height of the neutral axis. In order to satisfy the internal force
equilibrium:
( )( )m 1 f ff ' c b A fα β = (5.5)
f f ff E ε= (5.6)
where ff, Ef and εf are the FRP strength, modulus of elasticity and strain.
Neglecting the tensile strength in the masonry, the theoretical flexural capacity can be
estimated by:
1theoretical f f
cM A f t2
β⎛ ⎞= −⎜ ⎟⎝ ⎠
(5.7)
To study modes of failure, different amounts of glass (GFRP) reinforcement were
chosen and expressed as a function of the balanced reinforced ratio ρb. The balanced
condition was the parameter to determine the FRP amount. The balanced condition
was assumed to occur when the compressive failure of the masonry is reached at the
same time that the laminate fails in tension.
The following assumptions provided by Masonry Standards Joint Committee (MSJC)
were considered:
• The maximum usable strain was assumed 0.0035 mm/mm (in/in) for clay
masonry, and 0.0025 mm/mm (in/in) for concrete masonry.
• The tensile strength of masonry was neglected.
• The compressive strength of the clay masonry must be at least 17.0 MPa
(2500 psi) for the clay masonry and 10.4 MPa (1500 psi) for the concrete
masonry.
Table 5.5 Illustrates the material properties assumed in the design. Tab. 5.5. Material properties for GFRP, clay masonry and concrete masonry
Material Ultimate Strain
[%]
Compr. Strength[MPa]
Tensile Strength [MPa]
E [GPa]
EG900 M.B. 2.1 - 1517 72 Clay Masonry 0.35 17 - -
Concrete Masonry 0.25 10.4 - - Note: 1MPa = 145 psi; for the experimental values see section 4

University of Missouri - Rolla - C.I.E.S. Università degli studi di Genova - D.I.S.E.G.
152
Considering εm = εm’, from the equations 5.2 and 5.3 the α and β1 coefficients for the
ultimate state can be found.
0.890.75
αβ
==
From the equation 5.4 the position of the neutral axis for clay masonry “cb” and
concrete masonry “cc” at ultimate strength can be found.
b
c
c 13.6 mm (0.536 in)c 9.8 mm (0.385 in)
==
Dividing the FRP area found from the equation 5.5 by the thickness of the laminate
(section 4) the FRP width related to the balanced condition can be calculated.
bb
bc
W 178 mm (7 in)W 76 mm (3 in)
==
Where:
Wbb = FRP width related to the clay masonry
Wbc = FRP width related to the concrete masonry
For simplicity, the different GFRP widths were chosen as multiples of inches.
Table 5.6 shows the test matrix.
Tab. 5.6. Test matrix
Specimen Material Dimensions [m]
GFRP width [mm]
% ρb
h/t ratio
Control B Clay 1.22x0.61x0.095 - - 12.8 BG3 Clay 1.22x0.61x0.095 76.2 43 12.8 BG5 Clay 1.22x0.61x0.095 127.0 72 12.8 BG7 Clay 1.22x0.61x0.095 177.8 100 12.8 BG9 Clay 1.22x0.61x0.095 228.6 130 12.8
Control C Concrete 1.22x0.61x0.092 - - 13.2 CG3 Concrete 1.22x0.61x0.092 76.2 100 13.2 CG5 Concrete 1.22x0.61x0.092 127.0 167 13.2 CG7 Concrete 1.22x0.61x0.092 177.8 233 13.2 CG9 Concrete 1.22x0.61x0.092 228.6 300 13.2
Note: 1 mm = 0.03937 in; ρb = balanced condition; h = height of the wall; t = thickness of the wall
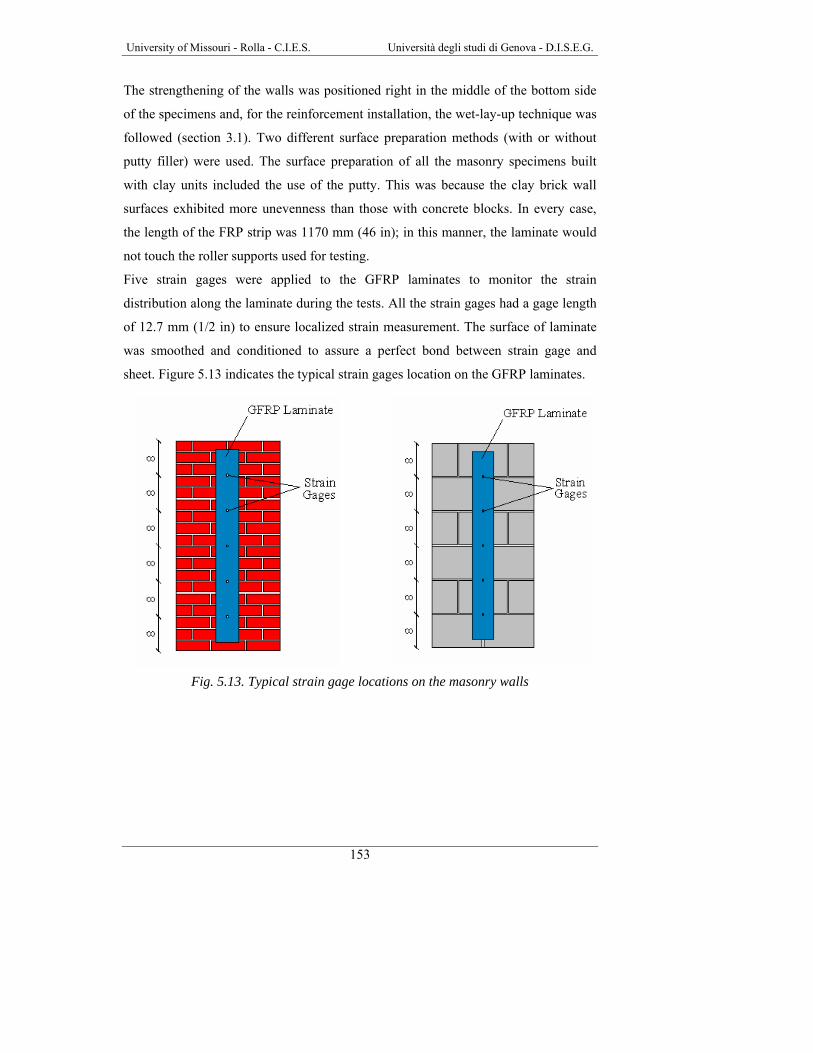
University of Missouri - Rolla - C.I.E.S. Università degli studi di Genova - D.I.S.E.G.
153
The strengthening of the walls was positioned right in the middle of the bottom side
of the specimens and, for the reinforcement installation, the wet-lay-up technique was
followed (section 3.1). Two different surface preparation methods (with or without
putty filler) were used. The surface preparation of all the masonry specimens built
with clay units included the use of the putty. This was because the clay brick wall
surfaces exhibited more unevenness than those with concrete blocks. In every case,
the length of the FRP strip was 1170 mm (46 in); in this manner, the laminate would
not touch the roller supports used for testing.
Five strain gages were applied to the GFRP laminates to monitor the strain
distribution along the laminate during the tests. All the strain gages had a gage length
of 12.7 mm (1/2 in) to ensure localized strain measurement. The surface of laminate
was smoothed and conditioned to assure a perfect bond between strain gage and
sheet. Figure 5.13 indicates the typical strain gages location on the GFRP laminates.
Fig. 5.13. Typical strain gage locations on the masonry walls

University of Missouri - Rolla - C.I.E.S. Università degli studi di Genova - D.I.S.E.G.
154
Fig. 5.14. Specimens ready
All the material properties are summarized in section 4.
5.3. Test Setup The masonry walls were tested under two out-of-plane loads, which were distributed
by 50.8 x 609.6 x 12.7 mm (2 x 24 x ½ in.) steel plates to the external face of the wall
(figure 5.15). Their distance was 101.6 mm (4 in.) from the midspan. The loads were
generated by means of a 12 ton hydraulic jack activated by a manual pump. The force
created by this jack reacted against a steel frame (figure 5.15).
To reproduce the real boundary conditions when the wall is restrained inside a
reinforced concrete (RC) frame, and to separate the two reaction forces (Fv and Fh in
section 1.2), four concrete beams were built. The bottom beams provided the vertical
reaction. The top beams were built to be resistant at the horizontal load, created by
the arching effect of the wall. Their design is reported in appendix A. High strength
steel rods were used to connect these to the steel test frame. Figure 5.15 illustrates the
test setup scheme and figure 5.16 illustrates a picture of the real test.
1
2
3
4
5
1
2
3
4
5

University of Missouri - Rolla - C.I.E.S. Università degli studi di Genova - D.I.S.E.G.
155
LONGITUDINAL VIEW
WallTop Beam
Bottom Beam
Steel Plates
(a)
FRONT VIEW
WallTop Beam
Bottom Beam
(b)
Fig. 5.15. Test setup scheme

University of Missouri - Rolla - C.I.E.S. Università degli studi di Genova - D.I.S.E.G.
156
Fig. 5.16. Test setup
LVDTs were positioned in the middle of the walls to measure the midspan deflection
during the tests. In the specimens “Control B”, “BG3”, and “BG5”, five LVDTs
intended to record out-of-plane deflections along the walls (see appendix A).
Two load cells were used to record the in-plane (load cell 2) and the out-of-plane
(load cell 1) loads. A horizontal load of 2.9 kN/m (200 lb/ft) was applied before
testing to hold the walls in place. This load was selected in accordance with the
Masonry Joint Standard Committee (MSJC, 1999) recommendations, which specify
that level of load as the limit between non load-bearing and load-bearing walls.
In order to determine the cyclic behavior of the walls, different load cycles were
chosen as a function of FRP width and masonry mechanical properties.
Load cell 1
Wall
Roller
Top beam
Bottom beam
Load cell 2

University of Missouri - Rolla - C.I.E.S. Università degli studi di Genova - D.I.S.E.G.
157
Tab. 5.7. Load cycles
Specimen 1st cycle [kN]
2nd cycle [kN]
3rd cycle [kN]
4th cycle [kN]
5th cycle [kN]
6th cycle [kN]
Control B 0-Failure - - - - -
BG3 0-2.2 2.2-6.7-2.2 2.2-11.1-2.2 2.2-15.6-2.2 2.2-20.0-2.2 2.2-Failure BG5 0-2.2 2.2-6.7-2.2 2.2-11.1-2.2 2.2-15.6-2.2 2.2-20.0-2.2 2.2-Failure
BG7 0-2.2 2.2-6.7-2.2 2.2-11.1-2.2 2.2-20.0-2.2 2.2-Failure - BG9 0-2.2 2.2-6.7-2.2 2.2-11.1-2.2 2.2-20.0-2.2 2.2-Failure -
Control C 0-Failure - - - - -
CG3 0-2.2 2.2-6.7-2.2 2.2-11.1-2.2 2.2-15.6-2.2 2.2-Failure - CG5 0-2.2 2.2-6.7-2.2 2.2-11.1-2.2 2.2-15.6-2.2 2.2-Failure -
CG7 0-2.2 2.2-6.7-2.2 2.2-11.1-2.2 2.2-20.0-2.2 2.2-Failure -
CG9 0-2.2 2.2-6.7-2.2 2.2-11.1-2.2 2.2-20.0-2.2 2.2-Failure - Note: 1 kN = 0.2248 Kip
5.4. Test Results
Three different modes of failure were observed:
• Flexural failure: after developing flexural cracks primarily located at mortar
joints, a wall failed by either rupture (or debonding) of the FRP laminate or
masonry crushing depending on the reinforcement ratio, ρ, and arching effect.
• Crushing of the masonry at the supports: this is the most common mode of
failure in walls in which arching mechanism occurs. This kind of failure is due
to the resultant force from shear and the in-plane forces at the supports.
• Shear failure: cracking started with a development of fine vertical cracks at
the maximum bending region. Only flexural shear failure was observed. The
sliding shear was not observed because of the in-plane force at the supports.
Tests results in terms of ultimate loads and maximum midspan deflection are
summarized in table 5.8 and table 5.9. The average value of the two LVDTs was
assumed for the midspan deflection. The horizontal load (H) values for the H/Vmax
ratio were chosen at the corresponding values of Vmax (maximum vertical load).
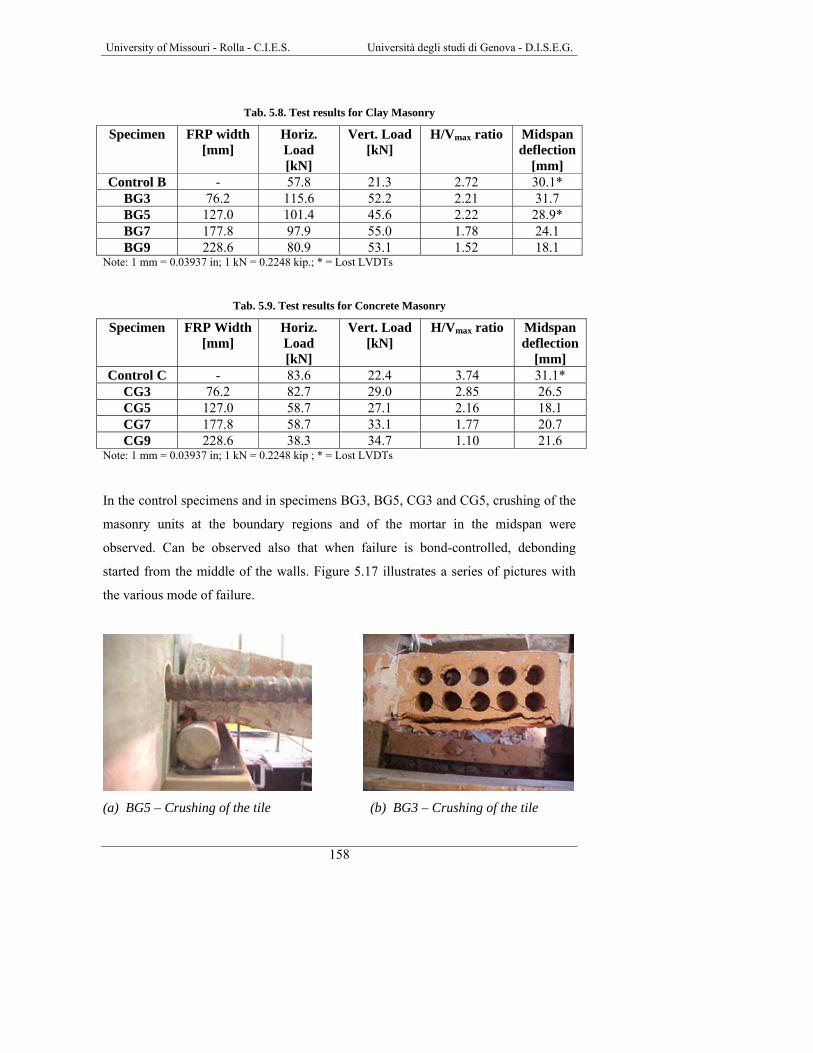
University of Missouri - Rolla - C.I.E.S. Università degli studi di Genova - D.I.S.E.G.
158
Tab. 5.8. Test results for Clay Masonry
Specimen FRP width [mm]
Horiz. Load [kN]
Vert. Load [kN]
H/Vmax ratio Midspan deflection
[mm] Control B - 57.8 21.3 2.72 30.1*
BG3 76.2 115.6 52.2 2.21 31.7 BG5 127.0 101.4 45.6 2.22 28.9* BG7 177.8 97.9 55.0 1.78 24.1 BG9 228.6 80.9 53.1 1.52 18.1
Note: 1 mm = 0.03937 in; 1 kN = 0.2248 kip.; * = Lost LVDTs
Tab. 5.9. Test results for Concrete Masonry
Specimen FRP Width [mm]
Horiz. Load [kN]
Vert. Load [kN]
H/Vmax ratio Midspan deflection
[mm] Control C - 83.6 22.4 3.74 31.1*
CG3 76.2 82.7 29.0 2.85 26.5 CG5 127.0 58.7 27.1 2.16 18.1 CG7 177.8 58.7 33.1 1.77 20.7 CG9 228.6 38.3 34.7 1.10 21.6
Note: 1 mm = 0.03937 in; 1 kN = 0.2248 kip ; * = Lost LVDTs
In the control specimens and in specimens BG3, BG5, CG3 and CG5, crushing of the
masonry units at the boundary regions and of the mortar in the midspan were
observed. Can be observed also that when failure is bond-controlled, debonding
started from the middle of the walls. Figure 5.17 illustrates a series of pictures with
the various mode of failure.
(a) BG5 – Crushing of the tile (b) BG3 – Crushing of the tile

University of Missouri - Rolla - C.I.E.S. Università degli studi di Genova - D.I.S.E.G.
159
(c) Control C – Crushing of the midspan (d) CG3 – Crushing of the tile
(e) BG3 – Fiber rupture + delam. (f) Control B – Crushing of the midspan
Fig. 5.17. Failure of the specimens (I)
For the specimens BG7, BG9, CG7 and CG9, failure occurred due to shear. Figure
5.18 illustrates the mode of failure.
(a) CG9 – Shear failure (b) BG9 – Shear failure

University of Missouri - Rolla - C.I.E.S. Università degli studi di Genova - D.I.S.E.G.
160
(c) CG9 – Shear Plan View (d) BG9 – Shear Plan View
Fig. 5.18. Failure of the specimens (II) The mode of failure for all the specimens are summarized in table 5.10.
Tab. 5.10. Modes of failure for the specimens
Specimen Mode of Failure Specimen Mode of Failure Control B Crushing of
masonry units Control C Crushing of
masonry units BG3 Fiber rupture CG3 Crushing of
masonry units BG5 Crushing of
masonry units CG5 Crushing of
masonry units BG7 Masonry shear CG7 Masonry shear BG9 Masonry shear CG9 Masonry shear
In the specimens CG7, CG9, BG7, BG9, no crushing of the midspan was observed.
By increasing the amount of FRP, due to the reduction of the displacement, the in-
plane load decreased. A mechanism of three plastic hinged arch in all the specimens
was observed. The specimens rotated as rigid bodies, like the theory showed in
section 1.2. Figure 5.19 shows the phenomenon on different specimens.
(a) Specimen BG3 (b) Specimen Control C
Central hinge Rigid bodies
Hinges

University of Missouri - Rolla - C.I.E.S. Università degli studi di Genova - D.I.S.E.G.
161
(c) Specimen BG5 (d) Specimen BG7
Fig. 5.19. Arch mechanism It can be observed that the control walls had a great flexural capacity due to the
arching action. If the wall is simply supported, the flexural capacity is related to the
load at which corresponds the creation of the first crack. Generally, in Morbin’s work,
it happened when the vertical load was about 3.1 kN (0.7 kip). This means that the
flexural capacity of the wall was increased about 7 times for concrete and clay
masonry. From the data acquisition system, the vertical load versus mid-height
deflection can be obtained for all the specimens. Figure 5.20 shows the cyclic
behavior for the specimen BG3. The other cyclic behaviors are illustrated in appendix
A.
Fig. 5.20. Cyclic behavior for specimen BG3
0
10
20
30
40
50
60
0 5 10 15 20 25 30 35
Mid-heigth net deflection (mm)
Load
(kN
)
Hinges
Rigid bodies
Hinges
Rigid bodies

University of Missouri - Rolla - C.I.E.S. Università degli studi di Genova - D.I.S.E.G.
162
By analyzing the experimental data, it is observed that when the first crack appeared
in the walls, the in-plane restraining force suddenly increased. This can be referred to
as the arching action.
By plotting the out-of-plane load (vertical load) versus the in-plane load (horizontal
load), it can be observed that the in-plane load remains practically constant until the
first crack appears in the specimens (Figure 5.21 a and b) and then grows almost
linearly.
(a) Clay Masonry
(b) Concrete Masonry
0
10
20
30
40
50
60
0 20 40 60 80 100 120 140
Horizontal load (kN)
Vert
ical
load
(kN
)
CONTROLCG3CG5CG7CG9
0
10
20
30
40
50
60
0 20 40 60 80 100 120 140
Horizontal load (kN)
Vert
ical
load
(kN
)
CONTROLBG3BG5BG7BG9

University of Missouri - Rolla - C.I.E.S. Università degli studi di Genova - D.I.S.E.G.
163
Fig. 5.21. Horizontal load vs. Vertical load. From the experimental values, a comparison of vertical load (out-of-plane) versus
mid-height deflection in terms of different FRP widths can be obtained.
Clay masonry. Figure 5.22 shows a comparison among the clay masonry specimens.
Note: In specimens control B and BG5 LVDTs were lost close to ultimate load Fig. 5.22. Comparison among clay masonry
Table 5.11 illustrates the ratio between the ultimate vertical loads of the strengthened
specimens and the ultimate load for the control wall. Tab. 5.11. Comparison among clay masonry specimens
Specimen FRP Width [mm]
Vertical load [kN]
Vertical load ratio
Control B - 21.3 1 BG3 76.2 52.2 2.45 BG5 127.0 45.6 2.14 BG7 177.8 55.0 2.58 BG9 228.6 53.1 2.49
Note: 1 mm = 0.03937 in.; 1 kN = 0.2248 Kip
A remarkable increment of flexural capacity compared to the control wall can be
observed. This increment may be overly optimistic because the arching was not
completely developed in the control specimen due to set-up difficulties. Figure 5.23
illustrates the horizontal load versus FRP width behavior.
0
10
20
30
40
50
60
0 5 10 15 20 25 30 35Mid-heigth net deflection (mm)
Load
(kN
)
ControlBG3BG5BG7BG9

University of Missouri - Rolla - C.I.E.S. Università degli studi di Genova - D.I.S.E.G.
164
Fig. 5.23. Horizontal versus FRP width behavior (Clay masonry)
Figure 5.23 shows the differences between the real and the theoretical behavior of the
control wall. This means that arching was not completely developed. Hence, a bigger
vertical load for the control specimen could be expected.
From the comparison in figure 5.22, it can be observed that the different amounts of
reinforcement do not influence dramatically the ultimate load. Higher reinforcement
can only increase the stiffness and reduce the deflection. By increasing the amount of
reinforcement, a drop in ductility was shown. Anyway, good performance under
cyclic load can be obtained with small amounts of FRP reinforcement.
By plotting the graphic with the H/Vmax load ratio, it can be observed that if the FRP
width increases, the ratio decreases linearly. Figure 5.24 illustrates the experimental
behavior and a trend line shows the linear behavior.
0
20
40
60
80
100
120
140
0 50 100 150 200 250
FRP width (mm)
Hor
izon
tal l
oad
(kN
)Theoretical

University of Missouri - Rolla - C.I.E.S. Università degli studi di Genova - D.I.S.E.G.
165
Fig. 5.24. H/Vmax ratio in function of FRP width (Clay masonry) However, it can be noted that for H/Vmax ratio equal to 1.52, failure was due to shear-
compression behavior. It is reasonable to think an H/Vmax ratio limit for the reinforced
masonry (It caused by shear-compression failure).
Concrete masonry. Figure 5.25 shows a comparison among the concrete masonry
specimens.
Note: In specimen control C lost LVDTs close to ultimate load
Fig. 5.25. Comparison among concrete masonry
0
0.5
1
1.5
2
2.5
3
3.5
4
4.5
0 50 100 150 200 250
FRP width (mm)
H /
Vmax
h/t ratio = 12.8
0
10
20
30
40
50
60
0 5 10 15 20 25 30 35Mid-heigth net deflection (mm)
Load
(kN
)
ControlCG3CG5CG7CG9

University of Missouri - Rolla - C.I.E.S. Università degli studi di Genova - D.I.S.E.G.
166
Table 5.12 illustrates the flexural capacity ratio compared to the control specimen.
Tab. 5.12. Comparison among concrete masonry specimens Specimen FRP Width
[mm] Vertical load
[kN] Vertical
load ratio Control C - 22.4 1
CG3 76.2 29.0 1.29 CG5 127.0 27.1 1.21 CG7 177.8 33.1 1.48 CG9 228.6 34.7 1.55
Note: 1 mm = 0.03937 in; 1 kN = 0.2248 Kip
Issues were not encountered to setup the tests. Figure 5.26 illustrates the horizontal
load versus FRP width behavior, close to the theoretical behavior.
Fig. 5.26. Horizontal versus FRP width behavior (Concrete masonry) From the comparison, it can be observed that the reinforcement does not influence
dramatically the ultimate load. By increasing the amount of reinforcement, a drop in
ductility was shown. Anyway, like for the clay masonry, good performance under
cyclic load can be obtained with small amounts of reinforcement. Plotting the graphic
with the H/Vmax load ratio, a linear behavior similar to the one obtained for clay
masonry can be observed (Figure 5.27).
0
20
40
60
80
100
120
140
160
0 50 100 150 200 250
FRP width (mm)
Hor
izon
tal l
oad
(kN
)
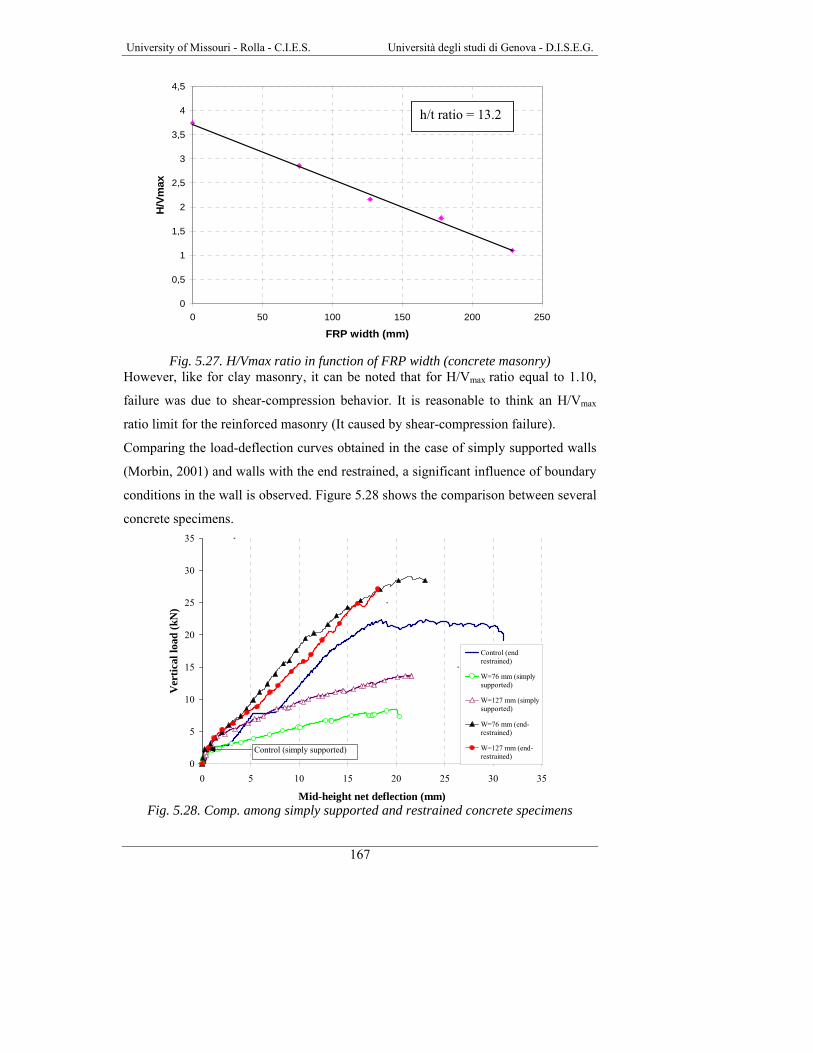
University of Missouri - Rolla - C.I.E.S. Università degli studi di Genova - D.I.S.E.G.
167
Fig. 5.27. H/Vmax ratio in function of FRP width (concrete masonry) However, like for clay masonry, it can be noted that for H/Vmax ratio equal to 1.10,
failure was due to shear-compression behavior. It is reasonable to think an H/Vmax
ratio limit for the reinforced masonry (It caused by shear-compression failure).
Comparing the load-deflection curves obtained in the case of simply supported walls
(Morbin, 2001) and walls with the end restrained, a significant influence of boundary
conditions in the wall is observed. Figure 5.28 shows the comparison between several
concrete specimens.
Fig. 5.28. Comp. among simply supported and restrained concrete specimens
0
0,5
1
1,5
2
2,5
3
3,5
4
4,5
0 50 100 150 200 250
FRP width (mm)
H/V
max
h/t ratio = 13.2
0
5
10
15
20
25
30
35
0 5 10 15 20 25 30 35
Mid-height net deflection (mm)
Ver
tical
load
(kN
)
Control (endrestrained)
W=76 mm (simplysupported)
W=127 mm (simplysupported)
W=76 mm (end-restrained)
W=127 mm (end-restrained)
Control (simply supported)

University of Missouri - Rolla - C.I.E.S. Università degli studi di Genova - D.I.S.E.G.
168
If the wall behaves as a simply supported element (i.e. large slenderness ratio or
upper end is not restrained), the FRP reinforcement is very effective since the wall is
in pure flexure and the crack openings are bridged by the reinforcement. In the case
of the simply supported unstrengthened specimens, the URM masonry wall collapsed
when the vertical load was about 3.1 kN (0.7 kips). Figure 5.28 shows that the
increase in the ultimate load for walls strengthened with 75 mm (3 in) and 125 mm (5
in) wide GFRP laminates were about 175 and 325% respectively. If the wall is
restrained (i.e. arching mechanism is observed), the same effectiveness of FRP
reinforcement is not observed because crushing of the masonry units at the boundary
regions controls the behavior. In this case, the increase in the out-of-plane capacity
for strengthened specimens with 75 mm (3 in) and 125 mm (5 in) wide GFRP
laminates was about 25%. Table 5.13 illustrates the effectiveness of FRP
reinforcement compared to the unstrengthened wall. Tab. 5.13. Effectiveness of FRP reinforcement for walls with arching
Specimen % increment of load CG3 29 CG5 21 CG7 48 CG9 55
5.5. Analytical Study
In order to determine the plastic moment at the midspans and at the boundaries for all
the specimens, interaction diagrams were built. The real dimensions of the cross
section for clay and concrete masonry were assumed. In order to simplify the
calculations, mortar joints were omitted. For the cross-section at the boundaries and
for the unstrengthened specimens was assumed the unreinforced section, since the
FRP was not present. Figure 5.29 shows the generic unreinforced section assumed to
calculate the M-N diagram.

University of Missouri - Rolla - C.I.E.S. Università degli studi di Genova - D.I.S.E.G.
169
Fig. 5.29. Generic unreinforced section
The following assumptions were taken:
• The maximum strain ε’m was assumed 0.0035 mm/mm (in/in) for clay
masonry, and 0.0025 mm/mm (in/in) for concrete masonry.
• The tensile strength of masonry was neglected.
To determine the ultimate moment, the ultimate state εm = ε’m was considered. Thus,
from the equations 5.2 and 5.3, α and β can be found.
0.890.75
αβ
==
To take into account the hollow units, different strain fields were assumed. Thus, for
each field M and N can be calculated with the equilibrium. As an example, the
calculations for β1ci ≤ l1 (Figure 5.29) are reported below.
Unstrengthened section
Strain fields Generic stress block
Tensile strength neglected

University of Missouri - Rolla - C.I.E.S. Università degli studi di Genova - D.I.S.E.G.
170
To satisfy the equilibrium:
2)()
2(')(
')(
11
1
hcNchbcfcM
bcfcN
ii
imi
imi
⋅−−⋅⋅⋅=
⋅⋅=ββα
βα
All the calculations are reported in appendix A. The experimental characteristics
obtained from the material characterization (section 4) were considered.
For the midspan, the strengthened cross-section was assumed. In this case, another
strain field had to be taken into account. FRP crisis was considered when FRP
reached the ultimate strain εfu. Thus, the field when εm < ε’m has to be considered. In
this field has to be considered also that α and β1 coefficients are changing following
the equations 5.2 and 5.3. Figure 5.30 illustrates the generic strengthened section
assumed to calculate the M-N diagram.
Fig. 5.30. Strengthened section
Strain fields Generic stress block
Strengthened section

University of Missouri - Rolla - C.I.E.S. Università degli studi di Genova - D.I.S.E.G.
171
All the calculations are reported in appendix A. Figure 5.31 (a) and (b) show the
interaction diagrams for the clay and concrete cross sections, considering the
unstrengthened and reinforced sections with different amounts of reinforcement. The
experimental characteristics obtained from the material characterization (section 4)
were considered.
(a) Clay walls
(b) Concrete walls Note: 1 in = 25.4 mm; 1 N = 0.2248 pd
Fig. 5.31. Interaction diagrams for clay and concrete cross sections
ω=0ω=3’’ ω=5’’
ω=9’’ω=7’’
Moment [Nmm]
Axi
al lo
ad [N
]
Moment [Nmm]
Axi
al lo
ad [N
]
ω=0
ω=9’’ ω=7’’ ω=5’’
ω=3’’

University of Missouri - Rolla - C.I.E.S. Università degli studi di Genova - D.I.S.E.G.
172
From the experimental values of the horizontal forces “N”, corresponding to Vmax
values, the experimental moments in the midspans and at the boundaries can be
found, using the M-N interaction diagrams. Table 5.14 and 5.15 show the values for
all the specimens. Tab. 5.14. Experimental moments for the clay specimens
Specimen N [kN] MMID[kN mm] MBOUND[kN mm] Control B 57.8 2601 2601
BG3 115.6 7663 4895 BG5 101.4 8789 4359 BG7 97.9 9872 4223 BG9 80.9 10797 3554
Tab. 5.15. Experimental moments for the concrete specimens
Specimen N [kN] MMID[kN mm] MBOUND[kN mm] Control C 83.6 3406 3406
CG3 82.7 5238 3375 CG5 58.7 5888 2483 CG7 58.7 6683 2483 CG9 38.3 7372 1670
In order to find a relationship for all the specimens, both clay and concrete, an
expression for the reinforcement ratio is introduced (Tumialan, 2000). The
reinforcement ratio is expressed as:
)/(' thfE
m
fff
ρϖ =
Where:
ρf = tb
Af
⋅
Af = FRP area
The slenderness ratio h/t is justified since this parameter is identified as one of the
most important in the out-of-plane behavior of masonry walls. The slenderness ratio
and out-of-plane capacity are inversely proportional. Since the strength is directly
proportional to the compressive strength, than the slenderness ratio and the
compressive strength are inversely proportional. Therefore, it is reasonable to express
the relation between the compressive strength and the slenderness ratio as a product.

University of Missouri - Rolla - C.I.E.S. Università degli studi di Genova - D.I.S.E.G.
173
With the experimental values from the characterizations, the reinforcement ratios can
be calculated. Table 5.16 illustrates the values. Tab. 5.16. Reinforcement ratio ωf for clay and concrete masonry
Specimen
b [mm]
h [mm]
FRP width[mm]
Af [mm2]
ρf
ωf
Control B 609.6 95.25 - - - - BG3 609.6 95.25 76.2 26.90 0.000463 0.149 BG5 609.6 95.25 127 44.84 0.000772 0.248 BG7 609.6 95.25 177.8 62.77 0.001081 0.348 BG9 609.6 95.25 228.6 80.71 0.00139 0.448
Control C 609.6 92.07 - - - - CG3 609.6 92.07 76.2 26.90 0.000479 0.206 CG5 609.6 92.07 127 44.84 0.000799 0.344 CG7 609.6 92.07 177.8 62.77 0.001118 0.481 CG9 609.6 92.07 228.6 80.71 0.001438 0.618
Note: 1 mm = 0.03937 in
In order to compare all the values a V/Mmax ratio was chosen. This ratio is
representative of the behavior of the wall.
Figure 5.32 illustrates the behavior for the specimens tested.
Fig. 5.32. Comparison for all the specimens The figure 5.32 shows that there could be a limit for the V/Mmax ratio. It can be said
that there could be a limit of the amount of the FRP reinforcement beyond which the
behavior is governed by shear - compression failure.
0
0.001
0.002
0.003
0.004
0.005
0.006
0.007
0.008
0.009
0.01
0 0.1 0.2 0.3 0.4 0.5 0.6 0.7
ωf
V/M
max
[1/m
m]
DataPoli. (Data)

University of Missouri - Rolla - C.I.E.S. Università degli studi di Genova - D.I.S.E.G.
174
Design considerations
The interaction diagrams were plotted to find the ultimate experimental moment for
each kind of specimen, considering the hollow masonry units.
For design purposes this approach could be excessively rigorous, so, different
solutions were investigated.
In order to maintain the slenderness ratio, two different cross sections were
considered:
− A full section with unchanged dimensions
− An equivalent section with the same thickness and area of the hollow section,
with a reduced base calculated using the following equation:
beq=t
Ah
Where: Ah = area of the hollow cross section
t = thickness of the wall
Figure 5.33 illustrates the comparison among the different kinds of approaches
followed.
Fig. 5.33. Different approaches for design purposes From the figure 5.33 can be seen that the most conservative approach is the one with
the equivalent base.
Moment [Nmm]
Axi
al lo
ad [N
]

University of Missouri - Rolla - C.I.E.S. Università degli studi di Genova - D.I.S.E.G.
175
It must be also taken into account that in designing phase the ultimate strain for the
fiber should be limited to a value of εub = 0.8% (see also section 4) because of
debonding issues.
University of Missouri - Rolla - C.I.E.S. Università degli studi di Genova - D.I.S.E.G.
176
6. IN-PLANE BEHAVIOR OF MASONRY WALLS STRENGTHENED WITH FRP LAMINATES AND RODS

University of Missouri - Rolla - C.I.E.S. Università degli studi di Genova - D.I.S.E.G.
177
6.1. Previous Results
The results presented in this section correspond to previous investigations conducted
to study the in-plane behavior of masonry panels strengthened with FRP composites,
which were intended to represent infill walls.
Schwegler (1995) investigated strengthening methods for masonry shear walls. The
objectives of this study were to increase the system ductility, generate uniform crack
distribution, and increase the load carrying capacity of the system. The dimensions of
the walls were 3.66 m (12 ft) by 1.83 m (6 ft) by 0.2 m (8 in). CFRP sheets were
bonded diagonally to the masonry walls as shown in figure 6.1, and mechanically
anchored to the adjoining slabs.
CFRPLaminates
Fig. 6.1. Strengthened wall (Schwegler, 1995)
Fig. 6.2. Test results (Schwegler, 1995) As observed in figure 6.2, the test results showed that the strengthened wall exhibited
elastic behavior up to 70% of the maximum shear force. It was also observed that the
carrying capacity decreased as a consequence of massive crack formation in the
masonry. By comparing walls strengthened in one side and two sides, it was observed

University of Missouri - Rolla - C.I.E.S. Università degli studi di Genova - D.I.S.E.G.
178
that if only one side of the masonry wall is strengthened, the capacity could be
halved. In addition, the eccentricities caused by this strengthening scheme had a
minimum effect on the shear carrying capacity. In all the strengthened walls fine
cracks were observed perpendicular to the sheets. The crack separation was constant
and the crack widths remained small.
Laursen et.al. (1995) studied the shear behavior of masonry walls strengthened with
CFRP laminates. The walls were built with concrete blocks and were fully grouted.
The overall dimensions were 1.82 x 1.82 m (72 in x 72 in). The walls were internally
reinforced; horizontally with a low shear reinforcement ratio of 0.14%, and vertically
with a ratio of 0.54%. The “original” wall failed in shear. The specimen was re-
tested after being repaired. The repair was performed by closing the large diagonal
shear cracks with epoxy filler and epoxy injection, and repairing the crushed
compression toes with epoxy mortar. The “repaired” wall was then strengthened with
CFRP laminates, which covered the two sides of the wall; an additional layer was
applied in the end regions as confinement. The amount of strengthening in the
“retrofitted” wall was similar to the previous wall but applied to only one side of the
wall.
Fig. 6.3. Test results (Laursen, 1995)
It was observed that the presence of the FRP laminates improved the wall
performance by changing the failure from a shear-controlled failure to a flexural-
controlled failure. This change caused an increase in the capability of deformation of
approximately 100% by preventing a brittle failure mode. The test results of this wall,
shown in Figure 6.3, also proved that even though the wall failed in shear, it could be

University of Missouri - Rolla - C.I.E.S. Università degli studi di Genova - D.I.S.E.G.
179
repaired to restore the initial stiffness and strength compared to the standard of the
“original” and “retrofitted” walls.
Tinazzi et al. (2000) introduced the term Structural Repointing and investigated the
use of FRP rods to increase the shear capacity of masonry panels made of clay bricks.
This technology consisted of placing # 2 GFRP rods in grooved horizontal joints as
shown in Figure 6.4. The rods were embedded in an epoxy-based paste. The nominal
dimensions of the panels were 0.09 m by 0.61 m by 0.61 m (3.5 in by 24in by 24 in).
The failure of unreinforced panels consisted of the joint sliding along the compressed
diagonal. In contrast, strengthened with FRP rods at each joint, showed increases in
capacity of about 45% higher as compared to the unreinforced wall. The failure
mode changed since joint sliding was prevented. The mechanism of failure indicated
the sliding of the masonry-paste interface.
Fig. 6.4. GFRP rods in mortar bed joints (Tinazzi, 2000)
Morbin A. et al. (2001) conducted work on masonry panels built with concrete
masonry blocks strengthened with GFRP laminates and rods at the University of
Missouri - Rolla.
A total of six masonry walls were manufactured for this experimental program, which
were built with 15.24 cm by 20.32 cm by 40.64 cm (6 in by 8 in by 16 in) concrete
blocks following a running bond pattern. One Unreinforced Masonry (URM) wall,
COW1, was the control specimen. COW2 was strengthened with GFRP bars at every
horizontal joint only on one side. Walls COW2 and COW3 had similar amounts of
reinforcement. In the latter specimen, the reinforcement was distributed in the two

University of Missouri - Rolla - C.I.E.S. Università degli studi di Genova - D.I.S.E.G.
180
faces, following an alternate pattern, to observe the influence of the reinforcement
eccentricity. Wall COW4 was strengthened with GFRP bars at every second
horizontal joint to observe the behavior of a wall with half the amount of
strengthening. Wall 5 was strengthened with GFRP laminates; the amount of
strengthening reinforcement was equivalent to that of Wall 2 in terms of axial
stiffness EA (Modulus of Elasticity x Reinforcement Cross Sectional Area). Thus
four GFRP strips, 1.63 m (64 in) long and 0.1 m (4 in) wide, were applied on the
panel surface. Wall 6 was strengthened with a combination of GFRP bars and
laminates. The bars were placed in every horizontal joint, whereas, the laminates
were applied in the vertical direction. The amount of reinforcement for both
directions was similar in terms of EA; as for wall COW5, four strips 1.63 m (64 in)
long and 0.1 m (4 in) wide were cut. The test matrix used in this investigation for
Series COW is summarized in table 6.1. Tab. 6.1. Test matrix for Series COW (Morbin, 2001)
Specimen Strengthening Front Side Back Side Layout
COW1
None
None
None
FRONT F B
COW2
#2 GFRP bars
1HJ
None
F R O N T F B
Tab. 6.1. Test matrix (continued)
Specimen Strengthening Front Side Back Side Layout

University of Missouri - Rolla - C.I.E.S. Università degli studi di Genova - D.I.S.E.G.
181
COW3 #2 GFRP bars 2HJ 2HJ
FRONT F B
COW4 #2 GFRP bars 2HJ None
FRONT F B
COW5
4 in GFRP laminates 4HS None
FRONT F B
COW6 #2 GFRP bars
4 in GFRP laminates
1HJ/4VS None
FRONT F B
LEGEND: 1HJ= every horizontal joint, 2HJ= every second horizontal joint, 4HS=four horizontal glass strips @ 16 in o.c., 4VS= four vertical glass strips @ 16 in o.c.
The average compressive strength of concrete masonry obtained from the testing of
prisms was 16.74 MPa (2430 psi) with a standard deviation of 2.37 MPa (345 psi). In
order to determine the shear stresses along the mortar joints, two series of triplets
were tested. Cohesion and coefficient of friction according to Coulomb criterion,
expressed by the equation τ = τo+ µ σn, were obtained by means of linear
interpolation of the experimental data. Thus for concrete blocks it was found
τ = 57.43+0.6679σn (psi) for σn<216 psi.
Masonry specimens were tested using the test setup illustrated in Figure 6.5 (see also
section 6.3).
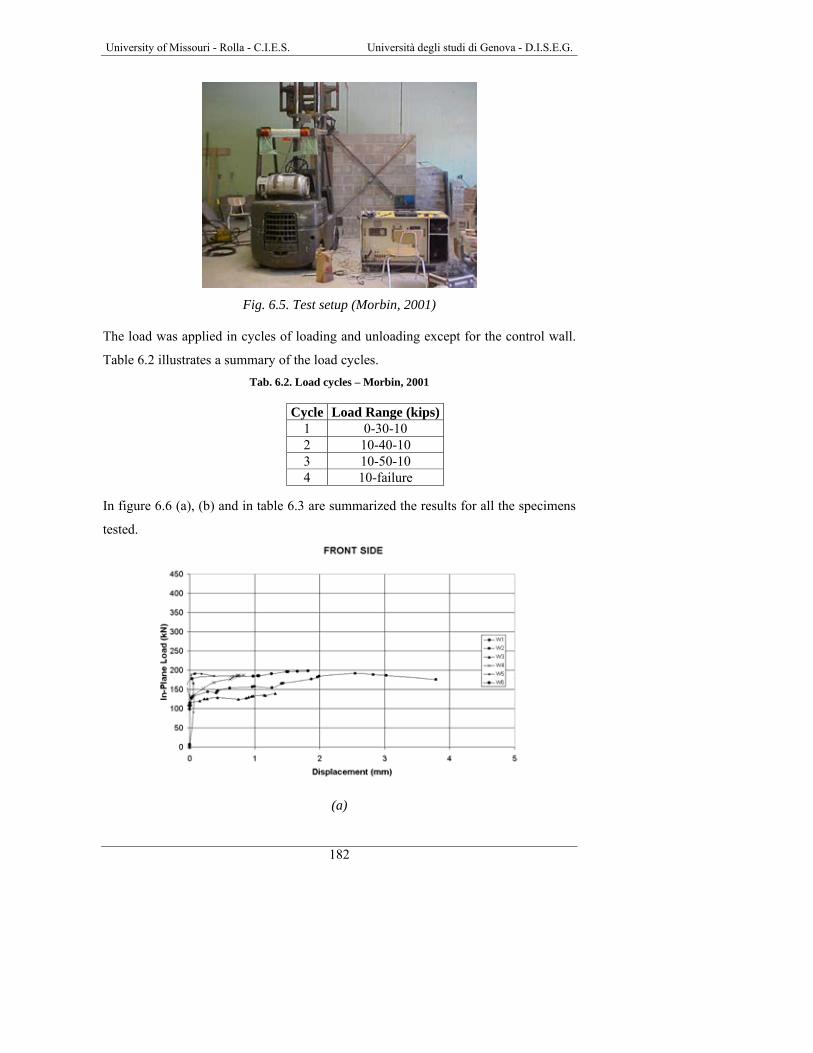
University of Missouri - Rolla - C.I.E.S. Università degli studi di Genova - D.I.S.E.G.
182
Fig. 6.5. Test setup (Morbin, 2001)
The load was applied in cycles of loading and unloading except for the control wall.
Table 6.2 illustrates a summary of the load cycles. Tab. 6.2. Load cycles – Morbin, 2001
In figure 6.6 (a), (b) and in table 6.3 are summarized the results for all the specimens
tested.
(a)
Cycle Load Range (kips)1 0-30-10 2 10-40-10 3 10-50-10 4 10-failure

University of Missouri - Rolla - C.I.E.S. Università degli studi di Genova - D.I.S.E.G.
183
(b)
Fig. 6.6. In-plane load vs. displacement (Morbin, 2001)
Tab. 6.3. Comparison of Pseudo-ductility for Series COW (Morbin, 2001)
Specimen In-Plane Load [kN] γu [°] γy [°] µ
COW1 108 0.09 0.09 1.0 COW2 200 1.71 0.13 13.1 COW3 195 1.82 0.09 20.2 COW4 189 0.40 0.08 5.0 COW5 137 0.94 0.17 5.5 COW6 191 0.72 0.14 5.1
The conclusions are that the masonry panels strengthened with FRP had a remarkable
increase in shear capacity and pseudo-ductility, ranging between 30% and 85%.
It was observed that the mechanism of failure of walls strengthened with GFRP bars
placed at every bed mortar joint consists of two phases. From the test observations,
the in-plane phase was the most critical, and the out-of-plane phase is pronounced in
walls having reinforcement eccentricity.
• In-Plane Phase: When the tensile strength of masonry is overcome, the wall
cracks along the diagonal, following the mortar joints (stepped crack

University of Missouri - Rolla - C.I.E.S. Università degli studi di Genova - D.I.S.E.G.
184
vertical/horizontal). For the reinforcement placed in the horizontal joint, the
crack is typically at the top side. Wall failure occurs only when a second
crack develops below the reinforcement at the epoxy/block interface.
• Out-of-Plane Phase: This phase influences the stability of the wall, which is
observed in specimens strengthened only on one side. Comparing the recorded
crack openings on the front (strengthened) and back (unstrengthened) sides,
the crack growth on the unstrengthened side increased at a higher rate than the
strengthened side.
Moreover, in contrast with URM walls, strengthened walls are stable after failure.
This fact can avoid injuries or loss of human life due to collapse of the wall.
6.2. Test Specimens Infill walls may or not may resist lateral and vertical loads. In order to simplify the
design, the potential interaction between the infill walls and the structural frame has
been ordinarily ignored. Ignoring the contribution of the masonry infill walls does not
always represent a conservative design. Their presence can lead to stiffening their
frames and thereby cause a redistribution of the lateral loads in the building plan.
Infill walls can be totally enclosed in a surrounding frame of beams and columns, as
typical in a multi story building. These walls can be subjected to high in-plane loads
during exceptional events such as high wind or earthquake. These loads are due to the
interaction between the infill walls and the surrounding structural frames.
Controlling shear failure is a key issue in masonry strengthening because after the
wall is cracked due to in-plane loads, it can easily collapse due to movement
perpendicular to the plane and jeopardize human lives. This kind of behavior has been
evident from post-earthquake observations. In this context, FRP composites can
provide viable solutions for the strengthening of URM walls subjected to stresses
caused by wind or earthquake loads. The use of FRP materials offers important
advantages in addition to their mechanical characteristics and ease of installation.
In order to demonstrate the effectiveness of the FRP strengthening of masonry walls
subjected to in-plane loading, a research program was conducted to continue
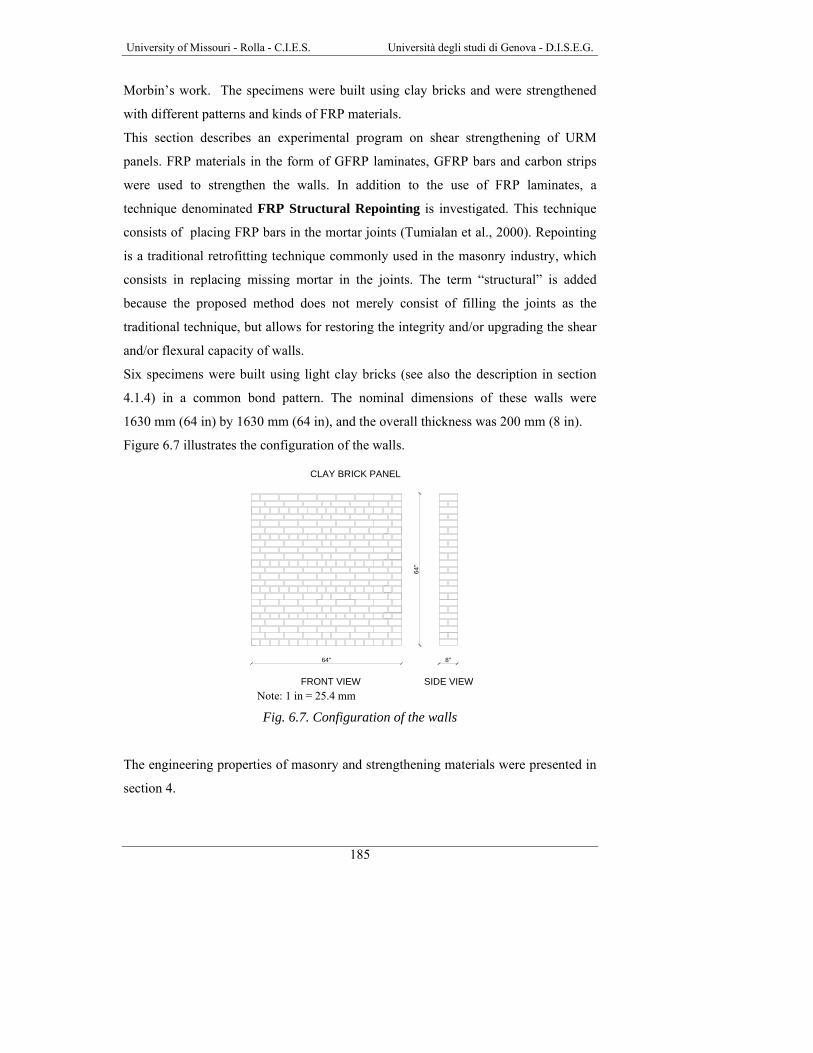
University of Missouri - Rolla - C.I.E.S. Università degli studi di Genova - D.I.S.E.G.
185
Morbin’s work. The specimens were built using clay bricks and were strengthened
with different patterns and kinds of FRP materials.
This section describes an experimental program on shear strengthening of URM
panels. FRP materials in the form of GFRP laminates, GFRP bars and carbon strips
were used to strengthen the walls. In addition to the use of FRP laminates, a
technique denominated FRP Structural Repointing is investigated. This technique
consists of placing FRP bars in the mortar joints (Tumialan et al., 2000). Repointing
is a traditional retrofitting technique commonly used in the masonry industry, which
consists in replacing missing mortar in the joints. The term “structural” is added
because the proposed method does not merely consist of filling the joints as the
traditional technique, but allows for restoring the integrity and/or upgrading the shear
and/or flexural capacity of walls.
Six specimens were built using light clay bricks (see also the description in section
4.1.4) in a common bond pattern. The nominal dimensions of these walls were
1630 mm (64 in) by 1630 mm (64 in), and the overall thickness was 200 mm (8 in).
Figure 6.7 illustrates the configuration of the walls.
Note: 1 in = 25.4 mm
Fig. 6.7. Configuration of the walls
The engineering properties of masonry and strengthening materials were presented in
section 4.
CLAY BRICK PANEL
64''
64''
8''
FRONT VIEW SIDE VIEW

University of Missouri - Rolla - C.I.E.S. Università degli studi di Genova - D.I.S.E.G.
186
Wall CLW1 was selected as control specimen. For the first strengthened panel,
CLW2, it was decided to put an amount of reinforcement equivalent to that of COW2
(See Section 6.1, Morbin, 2001), using the following equation:
m,clayf,clay f,concrete
m,concrete
AA =A
A⋅ (6.1)
where:
Af,clay = cross area of FRP reinforcement in clay bricks panels
Af,concrete = cross area of FRP reinforcement in concrete block panels
Am,clay = net area of clay brick panels
Am,concrete = net area of concrete block panels
Following this procedure CLW2 was reinforced placing GFRP bars in the two faces,
following an alternate pattern.
The testing of this wall showed that the amount of reinforcement calculated with
equation 6.1 was not sufficient to increase the shear performance of the wall. It was
observed that the wall failed suddenly right after the development of the first crack.
This was attributed to the large amount of energy accumulated by the wall.
In light of this result, for the other specimens, the amount of FRP was decided in
terms of ratio of the axial stiffness, which was defined as:
ρ = f f
m m
A EA f '
⋅⋅
(6.2)
where:
Af = cross area of FRP reinforcement
Am = net area of masonry
Ef = modulus of elasticity of FRP reinforcement
f‘m = compressive strength of masonry
For design considerations, according to MSJC Code (1999), the compressive strength
of masonry must be at least 17.0 MPa (2500 psi) for clay masonry and 10.4 MPa
(1500 psi) for concrete masonry.
Thus, CLW3 was reinforced placing GFRP rods and laminates on both sides of the
panel in a symmetrical configuration. The strengthening layout consisted of GFRP
rods every two joints and four vertical GFRP strips 1630 mm (64 in) long and 100

University of Missouri - Rolla - C.I.E.S. Università degli studi di Genova - D.I.S.E.G.
187
mm (4 in) wide. The amount of vertical reinforcement was the same used for the
concrete block panel COW6 (see section 6.1, Morbin, 2001) considering that an
amount of vertical reinforcement equal in terms of axial stiffness (Ef⋅Af) to the
horizontal one would have been excessive. CLW4 presented the same amount of
vertical GFRP laminates as CLW3 but half of the horizontal FRP reinforcement.
Thus GFRP rods were placed every four mortar joints. The purpose was to observe
the efficiency of the horizontal strengthening with the same amount of vertical. The
last two specimens were strengthened with carbon strips. Because of its flat shape this
kind of reinforcement is particularly suitable for old masonry building in which the
joints are thin. The cross section is equivalent to that of a #2 rod. The amount of
reinforcement was equivalent to that of CLW3 in terms of axial stiffness, but this was
placed with two different patterns. For CLW5, seven horizontal strips were placed on
one side of the wall and seven vertical strips were placed on the other side. For
CLW6, five strips on each face were oriented diagonally equally spaced from the
diagonal. The text matrix for series CLW is summarized in table 6.4.
Tab. 6.4. Test matrix for Series CLW
Specimen Strengthening Front Side Back Side Layout
CLW1 None None None
FRONT F B
CLW2 #2 GFRP bars 4HJ 4HJ
CLW3 #2 GFRP bars
4 in GFRP laminates
2HJ/4VS 2HJ/4VS
FRONT/BACK F B
FRONT/BACK F B

University of Missouri - Rolla - C.I.E.S. Università degli studi di Genova - D.I.S.E.G.
188
Tab. 6.4. Test matrix (continued)
Specimen Strengthening Front Side Back Side Layout
CLW4 #2 GFRP bars
4 in GFRP laminates
4HJ/4VS 4HJ/4VS
FRONT/BACK F B
CLW5 Carbon strips 3/4HC 3/4VC
BACK F B
CLW6 Carbon strips 5D 5D
FRONT/BACK F B
LEGEND: 2HJ=every second mortar joint, 4HJ= every fourth mortar joint, 4VS= four vertical glass strips @ 16 in o.c., 3/4VC= vertical carbon strips every third/fourth mortar joint, 3/4HC= horizontal carbon strips every third/fourth mortar joint, 5D= five diagonal carbon strips simmetrically spaced from the diagonal
All the FRP strips (both glass and carbon) and rods were installed following the
manual lay-up and NSM rods technique as described in Section 3.
Five strain gages were applied to the FRP reinforcement to monitor the strain
distribution along the strip and the laminates in correspondence to the loaded diagonal
of the panels. All the strain gages had a gage length of 12.7 mm (1/2 in) to ensure
localized strain measurement. The surfaces on which they were applied were
smoothed and conditioned to assure a perfect bond between strain gage and
deformable support. Figure 6.8 indicate the typical strain gages location on the FRP
reinforcement for the specimen CLW6 (see also Appendix B).

University of Missouri - Rolla - C.I.E.S. Università degli studi di Genova - D.I.S.E.G.
189
FRONT BACK
1
2
3
4
5
LVDT 1
LVDT 2
LVDT 4
LVDT 3
Fig. 6.8. Typical strain gages and LVDT’s location
6.3. Test Setup
The specimens were tested in a close loop fashion, following the ASTM E518
standard protocol (Standard Test Method for Diagonal Tension in Masonry
Assemblages). Two 30-ton-capacity hydraulic jacks activated by a manual pump
were used to load the specimen along one diagonal. The force was applied to the wall
by steel shoes placed at the top corner, and transmitted to similar shoes at the bottom
corner through high-strength steel rods. Figures 6.9 (a) and (b) illustrate the test setup.
(a) Test setup scheme (b) Test setup
Fig. 6.9. Test setup

University of Missouri - Rolla - C.I.E.S. Università degli studi di Genova - D.I.S.E.G.
190
The load was applied in cycles of loading and unloading, except for the control walls.
An initial cycle for a low load was performed in every wall to verify that both the
mechanical and electronic equipment was working properly. The data acquired by a
200 kip load cell and the Linear Variable Differential Transducers (LVDTs) were
collected by a Daytronic Data Acquisition System at a frequency of one Hz. A total of
four LVDTs were used to register displacements in the walls along the wall
diagonals. Two LVDTs were placed on each side of the walls: one oriented along the
force line to measure the wall shortening, and the other perpendicular to the force line
to record the crack opening. Table 6.5 illustrates a summary of the load cycles. Tab. 6.5. Test cycles
Note: 1kN = 0.2248 kip
Cycle Load Range [kN]1 0-6.7-2.2 2 2.2-9.0-2.2 3 2.2-11.2-2.2 4 2.2-failure

University of Missouri - Rolla - C.I.E.S. Università degli studi di Genova - D.I.S.E.G.
191
6.4. Test Results Wall CLW1
This wall was selected as control specimen. After a low load cycle to verify the
proper function of the monitoring instrumentation, the wall was taken to failure. Due
to the brittle nature of the unstrengthened clay masonry the failure was caused by
complete collapse of the loaded diagonal for splitting of the clay units. No visible
cracks were detected until reaching the maximum load, which was 307 kN (69.0
kips). Figures 6.10 and 6.11 show, respectively, the load versus diagonal
displacement behavior of the wall and a picture of the specimen after failure. In all
the graphs, the positive displacement corresponds to the loaded diagonal.
Fig. 6.10. Load vs. diagonal displacement
Fig. 6.11. Wall CLW1 after failure (front)
FRONT / BACK
0
50
100
150
200
250
300
350
400
450
-20 -15 -10 -5 0 5 10 15 20
Displacement (mm)
In-P
lane
Loa
d (k
N)
FRONT F B 0 90
0°B 0°F

University of Missouri - Rolla - C.I.E.S. Università degli studi di Genova - D.I.S.E.G.
192
Wall CLW2 Wall CLW2 was strengthened with GFRP rods every two mortar joints distributed on
the two faces of the panel. The peak load was reached at 306 kN (68.9 kips), less than
the control wall and without showing any ductile behavior. This fact may be
attributed to undesirable variables such as handwork or mortar workability. However,
in this case, the GFRP rods had no effect in terms of increasing the shear capacity.
The rods embedded in the joints provided the unique function to hold the wall at the
ultimate stage. Figures 6.12 and 6.13 show, respectively, the load versus diagonal
displacement behavior of the wall and a picture of the specimen after failure. During
the test, the readings of the LVDTs in 90° directions were lost.
Fig. 6.12. Load vs. diagonal displacement
Fig. 6.13. Wall CLW2 after failure (front)
FRONT
0
50
100
150
200
250
300
350
400
450
-20 -15 -10 -5 0 5 10 15 20
Displacement (mm)
In-P
lane
Loa
d (k
N)
0 90
0°F
FRONT/BACK F B

University of Missouri - Rolla - C.I.E.S. Università degli studi di Genova - D.I.S.E.G.
193
Wall CLW3 In Wall CLW3, the reinforcement was equally distributed in the horizontal and
vertical direction. GFRP rods were used in the horizontal direction; whereas, GFRP
laminates were used in the vertical direction. The first visible cracks were detected
along the diagonal mortar joints and in the clay units at 300 kN (67 kips). The peak
was reached at 406 kN (91 kips). The specimen, when compared to the control wall,
exhibited a significant ductile behavior, which allowed the panel to keep the
maximum load for a mean tensile displacement of 7.3 mm (0.29 in). Figures 6.14 and
6.15 show, respectively, the load versus diagonal displacement behavior of the wall
and a picture of the specimen after failure.
Fig. 6.14. Load vs. diagonal displacement
Fig. 6.15. Wall CLW3 after failure (front)
BACK
0
50
100
150
200
250
300
350
400
450
-20 -15 -10 -5 0 5 10 15 20
Displacement (mm)
In-P
lane
Loa
d (k
N)
0 90
0° 90°
FRONT/BACK F B

University of Missouri - Rolla - C.I.E.S. Università degli studi di Genova - D.I.S.E.G.
194
Wall CLW4
Wall CLW4 was strengthened with the same amount of vertical reinforcement of
CLW3 but half amount of the horizontal reinforcement. Even though the increase of
capacity and the ductile behavior observed for this specimen were less significant
than the ones observed for wall CLW3, no substantial differences in the mechanical
behavior during the load cycles and in the mode of failure were observed. The
collapse was caused by the progressive debonding between the epoxy-based paste in
the reinforced joints and the clay unit surfaces, which started from the loaded
diagonal. Delamination of the GFRP laminates was also observed. The peak load
was 319 kN (72 kips). Figures 6.16 and 6.17 show, respectively, the load versus
diagonal displacement behavior of the wall and a picture of the specimen after failure.
Fig. 6.16. Load vs. diagonal displacement
BACK
0
50
100
150
200
250
300
350
400
450
-20 -15 -10 -5 0 5 10 15 20
Displacement (mm)
In-P
lane
Loa
d (k
N)
0 90
90° 0°
FRO NT/BACK F B
FRONT
0
50
100
150
200
250
300
350
400
450
-20 -15 -10 -5 0 5 10 15 20
Displacement (mm)
In-P
lane
Loa
d (k
N)
0 90
0° 90°
FRO NT/BACK F B

University of Missouri - Rolla - C.I.E.S. Università degli studi di Genova - D.I.S.E.G.
195
Fig. 6.17. Wall CLW4 after failure (front)
Wall CLW5
Wall CLW5 was strengthened with CFRP tapes strips. Due to the higher modulus of
elasticity of this material, the amount of reinforcement in terms of axial stiffness was
achieved with a lower number of strips. This wall was strengthened with seven
horizontal tapes placed on one side of the wall and seven vertical tapes placed on the
other side. The tapes were symmetrically spaced from the horizontal and the vertical
axis.
Due to the high strength of the reinforcement, problems were encountered during this
test. Failure due to diagonal cracking of the wall was not observed because of the
sudden crushing of one corner of the specimen. This was caused by the fact that the
contact area of the steel shoes used in the setup were not big enough to spread the
high pressures originated by the diagonal load. Because of this problem, it was not
possible to record the data needed to plot the load versus displacement graph up to
shear failure.
However, the peak recorded before the corner crashed was 412 kN (93 kips), and the
opening of fine cracks was also detected on the lower part of the wall. Figures 6.18
and 6.19 show, respectively, the load versus diagonal displacement behavior of the
wall and pictures of the specimen after failure and of the crushed corner.

University of Missouri - Rolla - C.I.E.S. Università degli studi di Genova - D.I.S.E.G.
196
Fig. 6.18. Load vs. diagonal displacement
(a) Wall CLW5 after being tested (front) (b) Crushing of the corner (back)
Fig. 6.19. Wall CLW5 after failure
FRONT
0
50
100
150
200
250
300
350
400
450
-20 -15 -10 -5 0 5 10 15 20
Displacement (mm)
In-P
lane
Loa
d (k
N)
0 90
0° 90°
BACK F B
BACK
0
50
100
150
200
250
300
350
400
450
-20 -15 -10 -5 0 5 10 15 20
Displacement (mm)
In-P
lane
Loa
d (k
N)
0 90
90° 0°
BACK F B
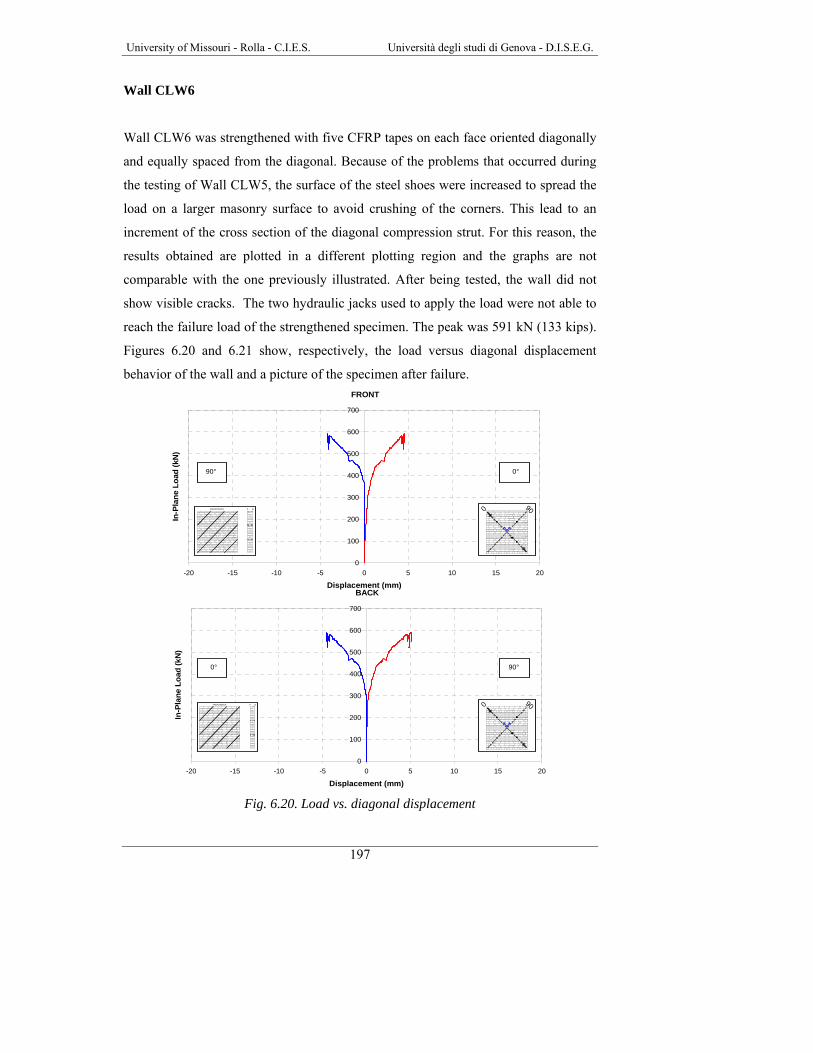
University of Missouri - Rolla - C.I.E.S. Università degli studi di Genova - D.I.S.E.G.
197
Wall CLW6
Wall CLW6 was strengthened with five CFRP tapes on each face oriented diagonally
and equally spaced from the diagonal. Because of the problems that occurred during
the testing of Wall CLW5, the surface of the steel shoes were increased to spread the
load on a larger masonry surface to avoid crushing of the corners. This lead to an
increment of the cross section of the diagonal compression strut. For this reason, the
results obtained are plotted in a different plotting region and the graphs are not
comparable with the one previously illustrated. After being tested, the wall did not
show visible cracks. The two hydraulic jacks used to apply the load were not able to
reach the failure load of the strengthened specimen. The peak was 591 kN (133 kips).
Figures 6.20 and 6.21 show, respectively, the load versus diagonal displacement
behavior of the wall and a picture of the specimen after failure.
Fig. 6.20. Load vs. diagonal displacement
FRONT
0
100
200
300
400
500
600
700
-20 -15 -10 -5 0 5 10 15 20
Displacement (mm)
In-P
lane
Loa
d (k
N)
0 90
90° 0°
FRONT/BACK F B
BACK
0
100
200
300
400
500
600
700
-20 -15 -10 -5 0 5 10 15 20
Displacement (mm)
In-P
lane
Loa
d (k
N)
0 90
0° 90°
FRONT/BACK F B

University of Missouri - Rolla - C.I.E.S. Università degli studi di Genova - D.I.S.E.G.
198
Fig. 6.21. Wall CLW6 after failure (front)
6.5. Mechanism of Failure
A critical in-plane mechanism of failure was detected in all the clay unit panels
strengthened with GFRP rods and laminates. Test results demonstrated that in walls
built with clay units, sliding shear failure is not observed. This can be attributed to
better bonding between clay units and mortar. Wall CLW1 failed for splitting of the
clay units, as observed in figures 6.22 (a) and (b).
(a) (b)
Fig. 6.22. Splitting of clay units in wall CLW1
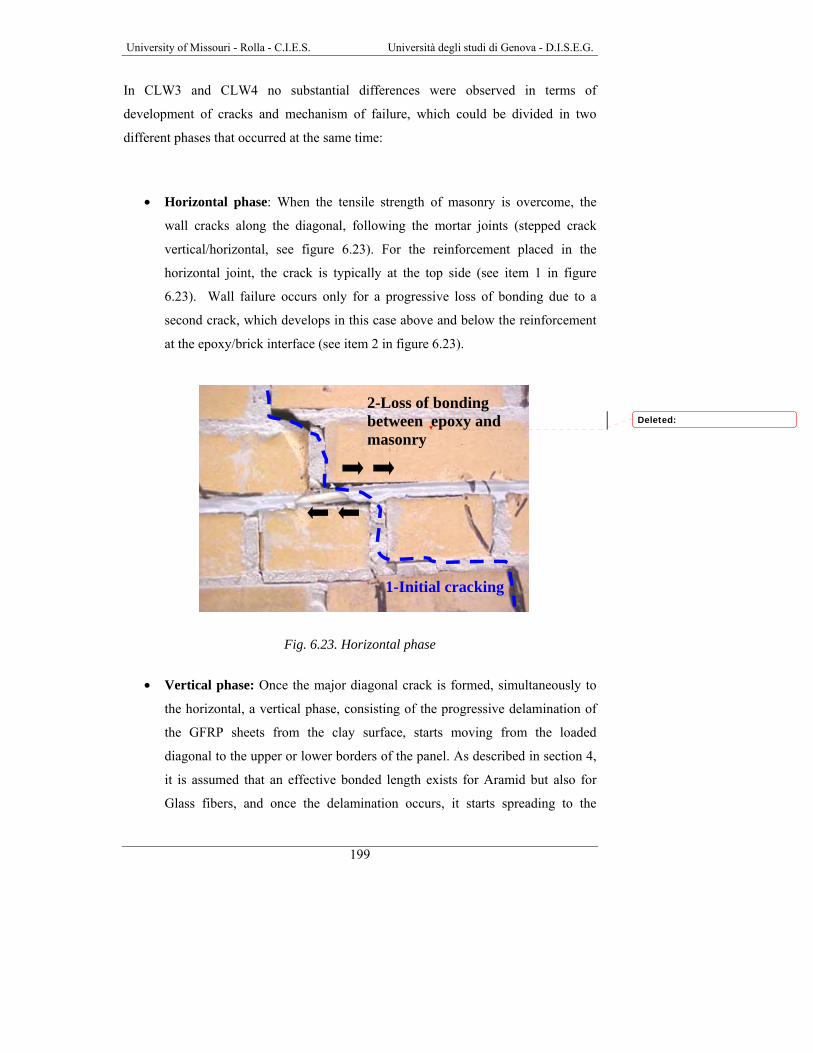
University of Missouri - Rolla - C.I.E.S. Università degli studi di Genova - D.I.S.E.G.
199
In CLW3 and CLW4 no substantial differences were observed in terms of
development of cracks and mechanism of failure, which could be divided in two
different phases that occurred at the same time:
• Horizontal phase: When the tensile strength of masonry is overcome, the
wall cracks along the diagonal, following the mortar joints (stepped crack
vertical/horizontal, see figure 6.23). For the reinforcement placed in the
horizontal joint, the crack is typically at the top side (see item 1 in figure
6.23). Wall failure occurs only for a progressive loss of bonding due to a
second crack, which develops in this case above and below the reinforcement
at the epoxy/brick interface (see item 2 in figure 6.23).
Fig. 6.23. Horizontal phase
• Vertical phase: Once the major diagonal crack is formed, simultaneously to
the horizontal, a vertical phase, consisting of the progressive delamination of
the GFRP sheets from the clay surface, starts moving from the loaded
diagonal to the upper or lower borders of the panel. As described in section 4,
it is assumed that an effective bonded length exists for Aramid but also for
Glass fibers, and once the delamination occurs, it starts spreading to the
1-Initial cracking
2-Loss of bonding between epoxy and masonry
Deleted:
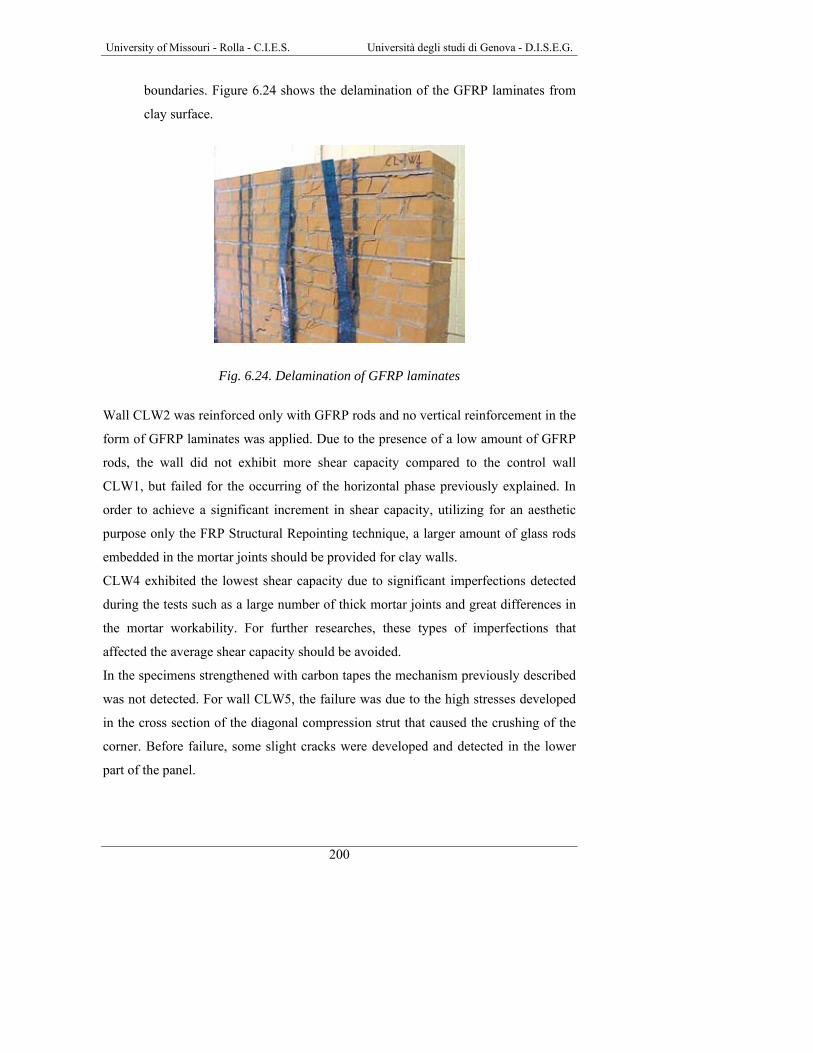
University of Missouri - Rolla - C.I.E.S. Università degli studi di Genova - D.I.S.E.G.
200
boundaries. Figure 6.24 shows the delamination of the GFRP laminates from
clay surface.
Fig. 6.24. Delamination of GFRP laminates
Wall CLW2 was reinforced only with GFRP rods and no vertical reinforcement in the
form of GFRP laminates was applied. Due to the presence of a low amount of GFRP
rods, the wall did not exhibit more shear capacity compared to the control wall
CLW1, but failed for the occurring of the horizontal phase previously explained. In
order to achieve a significant increment in shear capacity, utilizing for an aesthetic
purpose only the FRP Structural Repointing technique, a larger amount of glass rods
embedded in the mortar joints should be provided for clay walls.
CLW4 exhibited the lowest shear capacity due to significant imperfections detected
during the tests such as a large number of thick mortar joints and great differences in
the mortar workability. For further researches, these types of imperfections that
affected the average shear capacity should be avoided.
In the specimens strengthened with carbon tapes the mechanism previously described
was not detected. For wall CLW5, the failure was due to the high stresses developed
in the cross section of the diagonal compression strut that caused the crushing of the
corner. Before failure, some slight cracks were developed and detected in the lower
part of the panel.

University of Missouri - Rolla - C.I.E.S. Università degli studi di Genova - D.I.S.E.G.
201
The specimen reinforced with diagonal carbon strips (CLW6) showed no visible
cracks after being tested and the data recorded by the strain gauges (see appendix B)
showed that the strips worked up to 50% of the ultimate strain.
Figure 6.25 shows the cracks (highlighted with a marker) detected in the lower part of
wall CLW5 after the test.
(a) (b)
Fig. 6.25. Cracks detected in wall CLW5
The test setup configuration did not allow estimating ductility as conventionally done
(µ=δu/δy), where δu and δy are, respectively, the horizontal displacements at ultimate
and “yielding” caused by an in-plane load. Instead, a criterion using the shear strain
was adopted. Thus, the pseudo-ductility, ‘µ’, was quantified as the ratio γu/γy; where
γu is the shear strain at ultimate and γy is the shear strain, corresponding to the point
where the in-plane load vs. shear strain curve tends to be flat. Considering the strains
generated by the diagonal in-plane load as principal strains, the maximum shear strain
is expressed as:
0 90γ = ε + ε
where ε0 and ε90 are the strains associated with the shortening and lengthening of the
wall diagonals.
In table 6.6 a comparison of the pseudo-ductilities is presented: the most strengthened
specimens showed the highest values.

University of Missouri - Rolla - C.I.E.S. Università degli studi di Genova - D.I.S.E.G.
202
Tab. 6.6. Comparison of Pseudo-ductility for Series CLW
Specimen In-Plane Load [kN] γu [°] γy [°] µ
CLW1 307 0.03 0.03 1.0 CLW2 306 0.02 0.02 1.0 CLW3 406 0.38 0.05 7.6 CLW4 319 0.6 0.09 6.7
Note: 1kN = 0.2248 kip The results regarding the specimens CLW5 and CLW6 are not included in table 6.6
because of the problems encountered during the test as previously described.
6.6. Conclusions
Overall, results for clay brick panels showed remarkable increases in shear capacity
ranging between 4% and 30%. These percentages of increasing are lower than the one
recorded for the concrete block panels (from 30% to 80%) (Morbin, 2001) because of
different masonry characteristics (i.e. compressive strength) and wall geometries (i.e.
number of wythes and number of layers).
The evaluation of the pseudo-ductilities demonstrates the effectiveness of the
reinforcement. Increments in the amount of reinforcement led to increments in
pseudo-ductility.
For the strengthened specimens, two different failure phases were identified: vertical
and horizontal. Sliding shear failure was not observed in all the tested panels.
Due to the high compressive strength of clay masonry, and in order to have an
effective strengthening in terms of shear capacity and ductility, a lower limit for FRP
reinforcement should be identified. Under this limit, the reinforcement should not
increase the shear capacity of the URM walls.
From the experimental evidences it can be said that the walls strengthened with
carbon tapes showed significant increments of shear capacity ranging between 34%
and 93% when compared to the control wall. Increments up to 46% in comparison
with the specimen strengthened with GFRP laminates and rods were observed.
University of Missouri - Rolla - C.I.E.S. Università degli studi di Genova - D.I.S.E.G.
203
However, further experimental data obtained with a different test setup are needed to
determine the real shear capacity and the load versus displacement behavior up to
failure for the specimens strengthened with carbon tapes.
In contrast to URM walls, all the strengthened walls were stable after failure. In a real
building, this fact can avoid injuries or loss of human life due to collapse.
University of Missouri - Rolla - C.I.E.S. Università degli studi di Genova - D.I.S.E.G.
205
7. POST - TENSIONING
7.1. Background
Post-tensioning is a method of reinforcing (strengthening) concrete or other materials
with high-strength strands or bars, typically referred to as tendons. Post-tensioning
applications include office and apartment buildings, parking structures, slabs-on-
ground, bridges, sport stadiums, rock and soil anchors, and water-tanks. In many
cases, post-tensioning allows construction that would otherwise be impossible due to
either site constrains or architectural requirements.
A post-tensioning “tendon” is defined as a complete assembly consisting of the
anchorages, the pre-stressing strand or bar, the sheathing or duct and any grout or
corrosion-inhibiting coating (grease) surrounding the pre-stressing bar. There are two
main types of post-tensioning: unbonded and bonded (grouted).
An unbonded tendon is one in which the pre-stressing bar is not actually bonded to
the structure that surrounds it except at the anchorages.
In bonded systems, two or more strands are inserted into a metal or plastic duct that is
embedded inside the structure. The strands are stressed with different techniques and
anchored in an anchorage device. The duct is then filled with a cementitious grout
that provides corrosion protection to the strand and bonds the tendon at the structure
surrounding the duct.
In order for a pre-stressing tendon to be viable, it must attain and sustain the applied
stresses. This ability relies on an anchorage system that is capable of developing the
high levels of load without causing significant distress to the tendon that may result in
failure. In the case of post-tensioning, the anchors must also be capable of sustaining
these loads for the life of the structure. Anchorages for conventional steel pre-
stressing strands typically employ a steel wedge to grip and secure the tendon
(Nilson, 1987). The wedges commonly are serrated and grip the tendon or button-
heads on the end of the steel tendon (Holte et al., 1993). The isotropy and strength of

University of Missouri - Rolla - C.I.E.S. Università degli studi di Genova - D.I.S.E.G.
206
the strand material are two of the main characteristics making this particular
anchoring system feasible.
Uniaxially-reinforced FRP materials are highly anisotropic and show marked
differences in strength and stiffness responses in directions parallel to and transverse
to the fiber orientation. In order to accurately predict failure, special attention must
be paid to areas of the material subjected to combined stresses, such as bends in
stirrups, grid intersections and near tendon anchorages (Bank, 1993).
A major problem facing the use of fiber reinforced polymers (FRPs) in pre-stressing
applications is the anchorage.
Issues like damage to the bars due to excessive grip force and slip of the bars out of
the anchorages caused by weak friction forces and high tensile stress, clearly show
that traditional methods for gripping metal rods, are not applicable for FRP bars.
Figure 7.1 illustrates the traditional anchors for metal rods.
Fig. 7.1. Traditional anchor system for metal bars
Until recently, many anchorages included epoxy resins or expansive cements within
the body of the system. The creep of these materials can make these anchorages
inadequate for many applications through loss of pre-stress load with time.
On the other side, wedge systems that do not use resins are preferable if they do not
cause premature failure of the tendon from their gripping action.

University of Missouri - Rolla - C.I.E.S. Università degli studi di Genova - D.I.S.E.G.
207
In wedge type anchors, failure is induced by the high shear at the leading edge of the
wedge.
To take into consideration and solve the aforementioned problems, a variety of
anchor system has been developed and in the following pages an overview of
different commercially available FRP system and associated anchoring devices is
reported. In general, the anchor devices are often supplied by producers for the same
FRP tendons.
• Arapree (ARAmid PREstressing Element)
Arapree consists of round diameter 12 µm aramid filaments (Twaron) embedded in
epoxy resin. There are two types of Arapree elements: one with a rectangular cross
section and one with a circular cross section. Both consist of up to 400,000 aramid
filaments. The former may be easier to grip with a wedge anchor system (Gerritse
and Werner, 1988).
The systems developed for anchoring Arapree, both flat and round types, consist of a
metal sleeve into which the tendon is either grouted (post-tensioning application) or
clamped between two plastic wedges encased in an outer steel body. This system is
made up of a terminal body comprised of steel and two semi-cylindrical tapered
wedges of Polyamide.
Fig. 7.2. Arapree tendon and anchor components
This anchoring system was designed for use primarily as pre-tensioning anchors. The
manufacturer’s literature states that another anchorage type consisting of a steel tube

University of Missouri - Rolla - C.I.E.S. Università degli studi di Genova - D.I.S.E.G.
208
filled with a cement mortar bond material was developed for long-term use (Gerritse
and Werner, 1988).
The outer surface of the wedges and the inner surface of the metal terminal are non-
coated. The inner surface of the wedge trough which holds the tendon is similarly
smooth and gripping of the tendon rests solely on the frictional resistance provided by
the plastic.
• FiBRA (FIber BRAiding)
Mitsui Construction Company (MCC) produces an FRP tendon known by the trade
name FiBRA. FiBRA is a continuous fiber rod formed by braiding high strength
fibers in an epoxy resin. FiBRA rods have been used as reinforcement for concrete,
soil or rock, and as pre-stressing tendons (Tamura, 1993).
FiBRA has two different types of anchoring systems: the R-type resin anchor used for
single tendon anchoring, and the W-type wedge anchor for either single or multiple
tendon anchoring. The resin anchor consists of a single tendon epoxied to a
cylindrical steel cylinder. This cylinder is threaded on the exterior surface to allow
securing with a simple nut.
The second pre-stressing anchorage is a steel wedge-type anchor. The steel anchor is
comprised of four wedge units that slip inside a steel cylinder with a conical interior
surface.
Fig. 7.3. FiBRA tendon and anchor components

University of Missouri - Rolla - C.I.E.S. Università degli studi di Genova - D.I.S.E.G.
209
Grit is applied to the inner surface of the wedges for better tendon gripping. The
exterior surface, and the interior surface of the steel cylinder, is coated with a dry
lubricant to assist in seating and removal of the anchor.
• Carbon Stress
Carbon Stress is the trade name for a prestressing tendon.
Both flat bars with rectangular cross sections and round bars with circular cross
sections are currently available. Both bars are formed through pultrusion of carbon
fibers with a binding matrix. The flat bar is dimpled with a hatched pattern to create a
better bonding surface. The round bar is sanded to increase its bond characteristics.
Carbon Stress is similar in manufacturing to Arapree and employs similar anchoring
devices.
Fig. 7.4. Carbon Stress tendon and anchor components
A difference is in a dry lubricant coating on the exterior surface of the plastic wedges
to assist in better setting of the wedges. This also aids in removal of the wedges after
use. In addition, wedges for flat tendons are prepared by the manufacturer with a
sanded surface for better gripping. The wedges for the round tendons come with
instructions to apply a layer of epoxy and sand into the groove, which holds the
tendon. In both cases, the function of the sand coating is to increase the gripping
capability of the anchor.

University of Missouri - Rolla - C.I.E.S. Università degli studi di Genova - D.I.S.E.G.
210
• Leadline
Leadline is a carbon-based FRP rod, which is suitable for pre-stressing and ground
anchor applications.
Several different varieties of surface deformations exist for the Leadline product.
Smooth rods have no surface deformations. Indented rods have two shallow helical
cuts in the surface that spiral in opposite directions continually down the length of the
rod. The ribbed tendon has either raised helical windings similar to the indented
pattern or a circumferential winding transverse to the longitudinal axis of the rod.
Leadline utilizes a modified wedge system to anchor the tendons. The modification
comes in the form of a special metal sleeve, which fits between the wedges and the
tendon to reduce the severity of shearing stresses induced in the rod by the wedges.
The sleeve has four independent arms, which extend along the length of the tendon.
The wedges are then placed around the sleeve such that the space between the wedges
falls over the solid portion of the sleeve. A plastic film is placed around this to secure
the multiple pieces together for insertion into the terminal body.
Fig. 7.5. Leadline tendon and anchor components
• Technora® Rods
Named for the brand of aramid fiber used in its manufacture, Technora® is a spiral
wound rod that was developed as a substitute for high tensile strength steels. Bundles
of aramid fibers impregnated with a vinyl ester resin are pultruded into rods, and
hardened (Mukae et al., 1993).

University of Missouri - Rolla - C.I.E.S. Università degli studi di Genova - D.I.S.E.G.
211
Manufacturing a spiral wound tendon begins by impregnating a straight bundle of
aramid fibers with vinylester resin and pulling the material through an unheated die to
consolidate the composite. An identical fiber is wound spirally around the bundle of
fibers to produce a deformed surface. Three longitudinal fiber bundles are added to
the outer surface and a second spiral winding is added to secure these longitudinal
fibers. The resin is then cured without pressure in an oven.
The Technora® tendons employ either wedge type or grout type anchorages.
Anchorages for single rods and multiple bundles of rods numbering from 3 to 19 rods
are available. The bond type anchors have been developed for use with the spiral
wound rods, and are constructed so that the rod is inserted into a housing and then
fixed with injected mortar. A screw thread is cut into the outer surface of the housing
and the anchoring is secured with a nut.
Fig. 7.6. Technora tendon and anchor components
• CFCC (Carbon Fiber Composite Cable)
Carbon Fiber Composite Cable (CFCC) is formed by twisting a number of strands of
carbon fibers, much as conventional stranded steel tendon is manufactured.
The manufacturing process of CFCC begins with forming a prepreg consisting of
12,000 filaments impregnated with resin. The prepreg is then twisted to form a core
of fibers, which is covered with a wrapping of synthetic yarns. These rods are then
stranded to form a composite body, which is finally heated and cured. This process
results in a single rod, which may be used singly, or combined in sets of seven,
nineteen or thirty-seven to form multiple strand cables. The multiple strand cables

University of Missouri - Rolla - C.I.E.S. Università degli studi di Genova - D.I.S.E.G.
212
are twisted to better distribute forces throughout the cross section. The yarn covering
protects the core from UV radiation and mechanical damage while simultaneously
increasing bond characteristics (Erki and Rizkalla, 1993).
CFCC anchoring methods are classified as resin filling and diecast methods (Santoh
1993). The anchoring systems are chosen based on intended applications. The resin
filling method bonds the cable to a steel cylinder utilizing a high performance epoxy.
These tubes can be threaded, as necessary, to allow anchoring with nuts. The length
of the fixing metal piece is resin dependent but the standard length is 13.5 times the
CFCC diameter. The outer diameter of the cylinder varies by the material used.
Fig. 7.7. CFCC tendon and anchor components
The diecast method attaches the cable to a steel tube by means of a bronze alloy.
Steel wedges are then utilized to clamp the cables to an anchor system much like steel
cable systems.
• Lightline
This FRP tendon is stranded from individual Lightline rods, creating a twisted cable
made up of seven individual rods (one central rod surrounded by six rods), mimicking
a conventional 7-wire steel strand. The Lightline cable is a composite of E-glass and
epoxy. The tendon is manufactured under a proprietary process that ensures a high
degree of fiber alignment.

University of Missouri - Rolla - C.I.E.S. Università degli studi di Genova - D.I.S.E.G.
213
A resin-potted anchor with a parabolically tapered interior surface was chosen as the
anchoring system. This steel anchor is threaded on the outside to receive a matching
nut.
The anchor is an alternate design to the linearly tapered cone anchors currently
available in industry. The parabolic taper has been demonstrated under laboratory
investigation to reduce the peak shear stresses encountered at the front edge of
linearly tapered anchors (Holte et al., 1993).
The preparation of the anchor for use with the Lightline tendon involved several steps
as described in the literature.
• Parafil (PARAllel FILaments)
Linear Composites, Ltd. Yorkshire, England, is the producer of a parallel-lay rope
composed of Kevlar high strength yarns or fibers contained within a protective
polymeric sheath.
A variety of core yarns are used, the most common being polyester (known as Type
A), Kevlar 29 (Type F) and Kevlar 49 (Type G). Those of primary interest for pre-
stressing are the Type G ropes, which have the highest stiffness and lowest tendency
for creep (Burgoyne, 1993).
The elimination of the resin leaves the possibility for a greater percentage of the
cross-sectional area of this tendon to be fiber material. This advantage is balanced,
however, by the decreased efficiency of the system due to lack of stress transfer
resulting from resin impregnation.
Parafil has several features that distinguish it from most other pre-stressing systems: it
cannot be bonded to concrete; it contains no resin; and it was not initially developed
for pre-stressing. Nevertheless, it has been used for pre-stressing concrete on a
number of occasions.
Parafil ropes are anchored by means of a barrel and spike fitting that grips the fibers
between a central tapered spike and an external matching barrel. It has been
suggested that aluminum alloy, galvanized mild steel, stainless steel and other

University of Missouri - Rolla - C.I.E.S. Università degli studi di Genova - D.I.S.E.G.
214
materials could be used for the anchors since this scheme takes advantage of the
fibers of the rope simply being tightly packed in the protective outer sheathing.
Fig. 7.8. Parafill tendon and anchor components
Other particular anchors for different kinds of FRP tendons have been designed.
In the system developed by Rahman et al. (1993), epoxy paste is used to embed the
bar end into an internal threaded bar.
Another system developed at West Virginia University consists of a 203.2 mm (8 in)
long steel tube, with an internal diameter equal to that of the FRP bar, which is cut
lengthwise into two pieces. The inner surfaces of the split tubes are roughened by
sand blasting and coated with an epoxy adhesive. The tubes are then clamped to the
FRP rod until the resin is cured. An extensive experimental study was carried out by
Castro and Carino, (1998), in which the epoxy paste was substituted with a cement
mortar.
Figure 7.9 shows the anchor systems developed by Rahman (a), by the West Virginia
University (b) and the one developed by Castro and Carino (c).

University of Missouri - Rolla - C.I.E.S. Università degli studi di Genova - D.I.S.E.G.
215
Fig. 7.9. Anchor systems used for FRP tendons
In this section, a new anchor system for the tensioning of GFRP bars used for
structural strengthening will be described.
7.2. Tensioning and Anchor Devices
This post-tensioning technique addresses the solution of the tensioning problems of
FRP bars used to take the place of steel rods for structural strengthening.
The bars can be manufactured with any fiber type embedded in a thermoplastic resin.
The idea is based on the thermoplastic properties of the resin and consists of creating
two temporary anchors at the end of the bar; with these anchors and a screw device
the proper amount of tension can be introduced into the bar.
After this tensioning operation, one can bond the bar to the structure with any method
used for composite materials such as Near Surface Mounted rods (Section 3.2) or
drilled hole through transverse walls filled with epoxy-based paste.

University of Missouri - Rolla - C.I.E.S. Università degli studi di Genova - D.I.S.E.G.
216
This feature is very important particularly for historical masonry buildings, in which
the strengthening system must be the least visible as possible.
All the devices were designed in order to obtain items easily machinable and that can
be reused for several post-tensioning operations by removing them after the bar is
bonded to the structure.
The first drawings for machining all the needed mechanical components consisted of
eight steel items specifically designed for this particular post-tensioning technique.
The figure 7.10 shows all the items: (a) chuck; (b) teflon washer; (c) nut; (d) and (e)
spreaders of load; (f) threaded pipe; (g) thrust bearing; (h) wedge.
Fig. 7.10. Steel items
In order to anchor the rods, the thermoplastic properties of the resin used to pultrude
some of the FRP bars available on the market, were taken into account.
Thermoplastic materials have the characteristic of becoming soft once they reach the
glass transition temperature (Tg) and harden again once the source of heat is removed.
To utilize this feature, a rope heater was used; it is a particular kind of heater that can
be wrapped around objects even with small diameters.
The general procedure to load the GFRP bars used in these tests is described below.
The first step consisted of heating one end of the bar with the rope heater. To reach
and steadily maintain the Tg, the heater was connected with a temperature controller
and a thermocouple that were able to switch off the rope heater when the temperature
(a)
(b)
(c)
(d)
(e) (f)
(g)
(h)

University of Missouri - Rolla - C.I.E.S. Università degli studi di Genova - D.I.S.E.G.
217
was above the Tg and to switch it on again once the temperature was below the
chosen threshold.
The main characteristics of the bars used are summarized in table 7.1. Tab. 7.1. Material properties for GFRP G1 Rods
GFRP G1 RODS Ultimate Stress [MPa] 924 Modulus [MPa] 42574 Ultimate Strain 0.0217 Tg [°C] 138
Note: 1 Mpa = 145 psi
The amount of time needed to soften the end of the rod was between 210 and 240
seconds (data provided by the manufacturer of the rods). Both the temperature and the
time to soften the rod should not be higher or lower than the aforementioned values,
to avoid an excessive or an insufficient softening of the material that could cause
problems at the moment of the insertion of the wedge.
Once the bar termination was soft, the rope heater was removed, and the steel wedge
was gently driven into the bar by hand or hammer so as to avoid large cracking of the
bar.
The softening of the thermoplastic resin enabled expansion of the bar as the wedge
was driven into the end of the bar. This expansion was necessary for the bar to be
anchored in the chuck (figure 7.12 (d)).
When the termination was cold again, the second step involved inserting the items to
set up the dead end and the live end of the anchor system, in the following order:
for the dead end only the first chuck, the pipe, the first spreader of load (see figure
7.10 (d)) were inserted, and then, for the live end, the second spreader of load (see
figure 7.10 (e)), the threaded pipe, the thrust bearing or the teflon washers, the nut
and the second chuck were needed.
Now, repeating the first step, the insertion of the second wedge was done and when
the FRP bar was cold, the rod was ready to be loaded by tightening the nut with a
wrench. To avoid torsion stresses in the bar during the procedure of loading, caused
by friction between the nut and the pipe, a “woodruff key” and a “woodruff cutter”
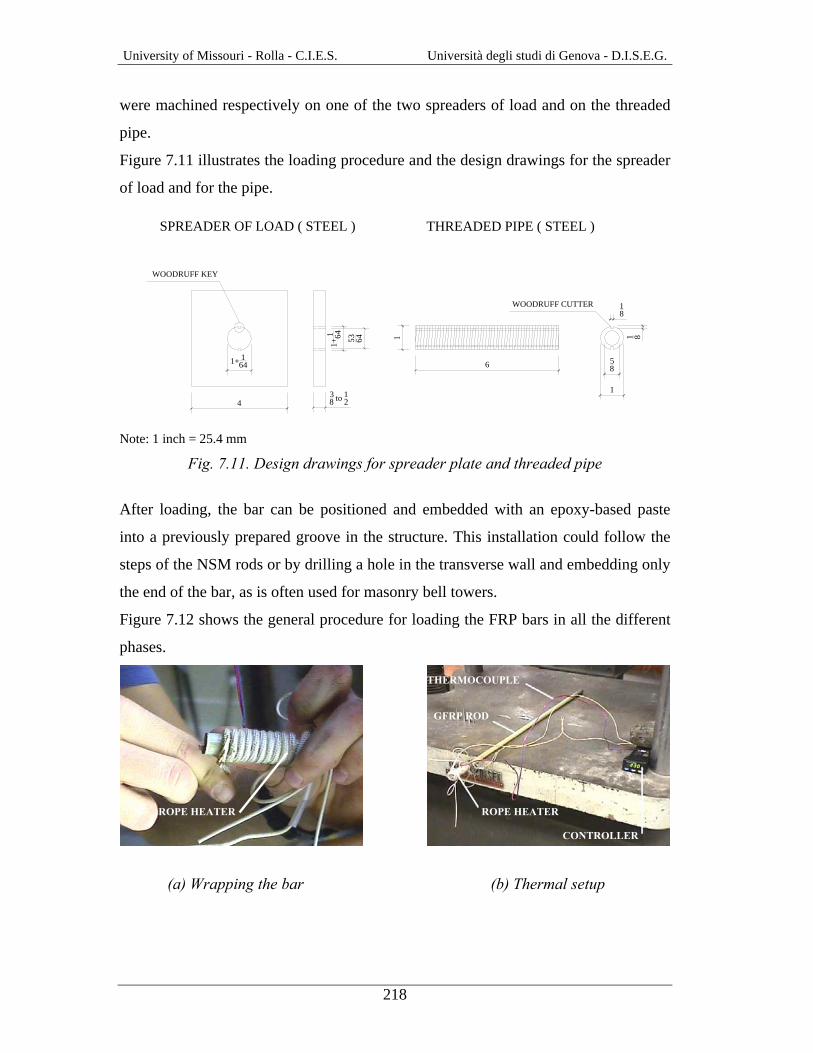
University of Missouri - Rolla - C.I.E.S. Università degli studi di Genova - D.I.S.E.G.
218
were machined respectively on one of the two spreaders of load and on the threaded
pipe.
Figure 7.11 illustrates the loading procedure and the design drawings for the spreader
of load and for the pipe.
4
1+1 64 53 64
1+ 164 6
11
58
18
1 8
SPREADER OF LOAD ( STEEL ) THREADED PIPE ( STEEL )
WOODRUFF KEY
38 to 12
WOODRUFF CUTTER
Note: 1 inch = 25.4 mm
Fig. 7.11. Design drawings for spreader plate and threaded pipe
After loading, the bar can be positioned and embedded with an epoxy-based paste
into a previously prepared groove in the structure. This installation could follow the
steps of the NSM rods or by drilling a hole in the transverse wall and embedding only
the end of the bar, as is often used for masonry bell towers.
Figure 7.12 shows the general procedure for loading the FRP bars in all the different
phases.
(a) Wrapping the bar (b) Thermal setup
THERMOCOUPLE
ROPE HEATER
CONTROLLER
GFRP ROD
ROPE HEATER

University of Missouri - Rolla - C.I.E.S. Università degli studi di Genova - D.I.S.E.G.
219
(c) Insertion of the wedge (d) Anchoring of the bar in the chuck
(e) Assembled items: details in (g) (f) Loading procedure
WEDGE
FIRST SPREADER OF LOAD
FIRST PIPE# 4 GFRP BAR
FIRST CHUCK
TEFLON WASHER# 4 GFRP BAR
SECOND SPREADER OF LOAD
WEDGE
THRUST BEARING
THREADED PIPE
FINE THREADED NUT
SECOND CHUCK
DEAD END LIVE END
(g) Assembled items
Fig. 7.12. General procedure for loading: different phases
STEEL WEDGE
SOFTENED END
DEAD END LIVE END
MEMBER TO BE TENSIONED

University of Missouri - Rolla - C.I.E.S. Università degli studi di Genova - D.I.S.E.G.
220
Some tensile tests were performed in order to check the reliability of the anchors.
According to the specification of the ACI 440, because long-term exposure to various
type of environments can reduce the tensile strength and creep rupture and fatigue
endurance of FRP bars, the material properties used in design equations should be
reduced based on the type and the level of environmental exposure.
The following equation gives the tensile properties that should be used in all design
equations. The design tensile strength should be determined by:
ffu = CE⋅ *fuf (7.1)
Where:
ffu = design tensile strength of FRP, considering reductions for service environment;
CE = environmental reduction factor, given in table 7.2 for various fiber type and
exposure conditions; *fuf = guaranteed tensile strength of an FRP bar defined as the mean tensile strength of
a sample of test specimens minus three times the standard deviation ( *fuf = fu,ave-3σ).
Tab. 7.2. CE factor for various fibers and exposure conditions
Exposure Fiber Environmental Condition Type reduction factor, CE
Carbon 1 Concrete not exposed to earth and weather Glass 0.8
Aramid 0.9 Carbon 0.9 Concrete exposed to earth and weather Glass 0.7 Aramid 0.8
Furthermore, to avoid failure of an FRP reinforced member due to creep rupture of
the FRP, stress limits should be imposed on the FRP reinforcement.
Values for safe sustained stress levels are given in table 7.3. These values are based
on the creep rupture stress limits stated in the ACI 440 (section 3.3.1) with an
imposed safety factor.

University of Missouri - Rolla - C.I.E.S. Università degli studi di Genova - D.I.S.E.G.
221
Tab. 7.3. Creep rupture stress limits in FRP reinforcement
Fiber type Glass FRP Aramid FRP Carbon FRPCreep rupture stress limit, Ff,s 0.20 ffu 0.30 ffu 0.55 ffu
Assuming the following values:
*fuf = 924 MPa (134000 psi) (Section 4.1.10)
CE = 0.8
Diameter of the bar = φ = 12 mm (0.472 in)
The stress limit for the Glass FRP bars used was:
Ff,s = 0.20⋅ CE⋅ *fuf = 148 MPa (21460 psi)
Which corresponds to an axial load equal to:
N = Ff,s⋅4πφ2
= 16.74 kN (3.76 kips)
Tensile tests were performed using the Tinius-Olsen Universal Testing Machine. The
bar was set up across the two crossheads of the machine and aligned with the axis of
the grips. The anchor at one end rested on the top crosshead.
On both ends, steel plates with dimensions 203.2 mm (8 in) by 203.2 mm (8 in) and
thickness of 12.7 mm (0.5 in) with a 13 mm (33/64 in) diameter hole in the middle,
were inserted between the anchors and the crossheads to spread the load. The
movable crosshead of the testing machine was positioned so that the plate at the lower
end was snug without stressing the bar.
The load was read on the graduate scale present on the testing machine.
Figure 7.13 shows the testing machine used for the tests and the positioning of the
anchors.

University of Missouri - Rolla - C.I.E.S. Università degli studi di Genova - D.I.S.E.G.
222
(a) Universal testing machine (b) Positioning of the anchors
Fig. 7.13. Universal testing machine and anchor positioning
The failure of the bars occurred when the load was about 22.24 kN (≅ 5 kips).
Failure occurred within the chuck where the material was subjected to combined
stresses such as transverse compression and longitudinal shear (in addition to the
axial load).
A total slipping of the chuck around the bar was also observed, because of the small
dimensions of the wedge that allowed the bar to pass through the chuck.
In order to avoid this type of failure and to increase the ultimate load tolerable by the
anchors so as to apply a reasonable safety factor, the design of the chuck and of the
wedge were changed and new items were machined to take the place of the previous
ones.
The dimensions of the wedge were increased and also the internal shape of the chuck
was changed, in order to increase the contact surface between the deformed bar and
the chuck and to avoid excessive stress concentration around the cross section of the
bar. For this purpose the bigger hole of the chuck was designed so as to have the same
surface area of the bar plus that of the wedge.
The new items were again tested in tensile with the Tinius-Olsen Universal Testing
Machine. In the new run of tests a load of about 40.00 kN (≅ 9 kips) was reached, and
the bar, after being tested, showed no damage.
WEDGE
STEEL PLATE
CROSSHEAD
CHUCK
CROSSHEADS

University of Missouri - Rolla - C.I.E.S. Università degli studi di Genova - D.I.S.E.G.
223
Because of safety issues, the failure of the bar was never reached with this setup.
Figure 7.14 shows the modification between the first and the final design of the steel
chuck.
Figure 7.15 illustrates the bar after the tensile tests with the two different chucks.
FIRST CHUCK
3
3364 to 9
161+
3 4
1+3 4
364 to 5
64
1+1 64
39 64
REDESIGNED CHUCK
364 to 5
64
1+3 4
1+3 4
2332
3
12
39 64 1+1 64
1+ 164 to 1+ 1
16
Fig. 7.14. Chuck designs
(a) Test with the first chuck (b) Test with the redesigned chuck
Fig. 7.15. Bar after failure

University of Missouri - Rolla - C.I.E.S. Università degli studi di Genova - D.I.S.E.G.
224
7.3. Test Setup
Once it was proven that the anchors were able to carry the right amount of load, long-
term tests were performed. A GFRP tendon-anchor system was stressed and subjected
to sustained load, to determine ease of installation, mechanical performance, and
anchor seating losses.
In order to find the amount of time after which the load was steady, different testing
times (6, 12 and 24 hours) were chosen.
The anchor system was tested using two 1.270 m (50 in) long steel angulars with
dimensions 304.8 mm (12 in) by 304.8 mm (12 in) and a thickness of 12.7 mm (0.5
in) bolted to the floor of the laboratory with 38.1 mm (1.5 in) diameter Dywidag rods.
The two steel beams were stiffened with three triangular steel plates with dimensions
279.4 mm (11 in) by 279.4 mm (11 in) and a thickness of 12.7 mm (0.5 in).
In both angulars a 25.8 mm (65/64 in) diameter hole was drilled to allow the
positioning of the pipe and the bar during the test.
The free length between the two beams was 1.524 m (60 in).
A Sensotek pressure transducer placed between two steel plates on the dead end of
the device measured the load that was recorded by means of a LABTECH data
acquisition system with a one-Hertz sampling rate.
Figure 7.16 illustrates the test setup.
(a) Test setup: general view (b) Detail of the pressure transducer
Fig. 7.16. Test setup
DATA ACQUISITION SYSTEM

University of Missouri - Rolla - C.I.E.S. Università degli studi di Genova - D.I.S.E.G.
225
7.4. Test Results
General Results.
All the results in terms of time and load losses are summarized in tables 7.4 and 7.5. Tab. 7.4. Test results for sustained load test
Test Name Testing Time [h]
Initial Load [kN]
Final Load [kN]
Losses of Load [%]
6h 6 22.33 16.98 24.0 12h-1* 12 24.12 21.19 12.1 12h-2 12 23.86 18.98 20.5 24h 24 21.07 15.73 25.3
Note: 1 kN = 0.2248 kip * = Reloaded specimen
Tab. 7.5. Losses of load during the test
Losses of Load [%] Test Name At 1 h At 2 h At 3 h At 4 h At 5 h
6h 16.7 19.4 20.6 21.6 23.0 12h-2 16.1 17.7 18.4 19.0 19.0 24h 19.3 20.7 22.0 22.0 22.9
For the specimen 12h-1, testing problems occurred during the procedure of loading,
so the bar was unloaded and reloaded again when the ends were already engaged in
the chuck. Because of this, losses of load significantly smaller than the other
specimens were recorded.
As indicated in table 7.4 the final losses of load in percentage, are all approximately
around the same value for all the tests.
Furthermore, from the data shown in table 7.5, it could be said that about 83% of the
final losses of load due to the anchor seating happened in the first two hours and then
they stabilize to a constant value after about six hours.
It must also be noted that the anchor seating losses during short-term use are
generally small and could become insignificant depending on the length of the
tendon.
Figure 7.17 illustrates the load versus time graph for a testing time of 24 hours (see
also fig. C.3 - 2,3,4 in Appendix C).

University of Missouri - Rolla - C.I.E.S. Università degli studi di Genova - D.I.S.E.G.
226
Fig. 7.17. Load vs. time for testing time equal to 24 hours
7.5. Validation of the System
The main area of application of this system is the structural rehabilitation of damaged
concrete, masonry, timber members; it consists of restoring the original structure
function and closing the cracks due to different causes such as seismic events or
differential settlements.
The application of tensioned FRP bars to a damaged structure induces a state of
compression and can close existing cracks.
Figure 7.18 shows a schematic drawing of the post-tensioned tendons used to close
cracks in a masonry structure.
0
5
10
15
20
25
30
35
0 3 6 9 12 15 18 21 24
Time [hours]
Load
[kN
]

University of Missouri - Rolla - C.I.E.S. Università degli studi di Genova - D.I.S.E.G.
227
Fig. 7.18. Post-tensioning of a cracked masonry wall
7.5.1. Test Setup
In order to validate the system and to calibrate the load on the GFRP bar as a function
of the torque furnished by a torque wrench, additional tests in the laboratory were
performed.
A reinforced concrete beam with dimensions 267 mm (10.5 in) by 419 mm (16.5 in)
by 2134 mm (84 in) long was casted.
The steel cage consisted of a 9.5 mm (3/8 in) diameter steel rebar and of stirrups with
the same size at 254 mm (10 in).
A PVC pipe with the internal diameter equal to 38.1 mm (1.5 in) was positioned
directly above the steel rebar, to allow the positioning of the threaded pipe during the
post-tensioning procedure.
Two kinds of tests were performed using this RC beam: the first one (test 1) to check
the variations of the mid span deflection during a certain amount of time while the
beam was subjected to the post-tensioning load, and the second one (test 2) to find the
ultimate load for this kind of device, loading the rod until reaching failure.
Figure 7.19 shows the RC beam used for the tests.
POST-TENSIONED TENDONS

University of Missouri - Rolla - C.I.E.S. Università degli studi di Genova - D.I.S.E.G.
228
(b) RC beam after curing
(a) Steel cage and PVC pipe
Fig. 7.19. RC beam used for validation test and detail of the construction After 28 days of curing, 10 grooves were done on both sides of the beam and were
filled with weak mortar in order to see, as well as possible, the opening and closing of
the cracks during the procedures of respectively loading and post-tensioning.
The beam was cracked using the Baldwin Universal Testing Machine with a four
point flexural test, according with the standards dictated by the ASTM E 72-98.
Once the cracks were opened, the post-tensioning device was used to reduce the mid
span deflection due to the vertical load previously applied.
In order to measure the midspan deflection and the load, an LVDT and a pressure
transducer were used. The load was applied to the rod using a torque wrench that was
calibrated after the tests.
Figure 7.20 shows the test setup and a detail of the dead end of the device.
(a) Test setup: general view (b) Dead end and pressure transducer
Fig. 7.20. Test setup

University of Missouri - Rolla - C.I.E.S. Università degli studi di Genova - D.I.S.E.G.
229
7.5.2. Test Results General Results.
The results of the two kinds of tests (test1 and test 2) are summarized in figures 7.21
and 7.22.
Fig. 7.21. Test 1: load vs. recovery of deflection
Fig. 7.22. Test 2: load vs. time: loading to failure
0
10
20
30
40
50
60
0 5 10 15 20 25 30
Time [hours]
Load
[kN
]
0
5
10
15
20
25
30
35
40
0 5 10 15 20 25 30 35 40
Recovery of deflection [mm]
Load
[kN
]

University of Missouri - Rolla - C.I.E.S. Università degli studi di Genova - D.I.S.E.G.
230
In figure 7.21, once reached a value of load of 35 kN (7.87 kips), two different
regions can be recognized: the very first part of the curve after the loading branch is
due to the anchor seating losses that represent the main part (66% of the total loss in
about an hour). The second part represent the decreasing of load due to the recovery
of deflection obtained by means of the sustained load carried by the post-tensioned
rod. This second loss occurred in about five hours.
The recovery of deflection is obtained as difference between the value recorded in a
moment and the value recorded at the beginning of the test with no load in the rod.
Figure 7.23 shows the position of the LVDT during the test and the recovery of
deflection measured in a generic moment.
FINAL SHAPE AFTER RECOVERY INITIAL DEFORMED SHAPEOF DEFLECTION
PRE-STRESSING
VERTICAL LOAD
LOAD
LVDT
FINAL DEFLECTION
INITIAL DEFLECTION
REC
OV
ERY
DETAIL A
DETAIL A Fig. 7.23. LVDT position and detail of the valuation of recovery of deflection
During the whole test a total recovery of deflection of 38.1 mm (1.5 in) was recorded
by the LVDT, and the cracks opened on the sides of the beam were totally closed.
Figure 7.24 illustrates the crack before and after the post-tensioning procedure.
(a) Cracks before post-tensioning (b) Cracks after post-tensioning
Fig. 7.24. Effectiveness of the post-tensioning technique
A AB B

University of Missouri - Rolla - C.I.E.S. Università degli studi di Genova - D.I.S.E.G.
231
Figure 7.22 shows the different loading cycles of a GFRP bar loaded up to failure.
The bar was loaded during a period of time of about 26 hours, increasing the load
after six different periods of time, to check which was the ultimate capacity of the
device and determine if the prestressing load would be maintained..
It can be noticed from the collected data that the ratio between the losses of load in
percentage and the time during which they occur, was decreasing.
This phenomenon can be explained with a first contribution to the losses of load due
to the anchor seating and a second one due to the recovery of deflection at mid span
that decreased during the test because of the closing of the cracks.
The contribution due to the anchor seating losses affected the first three cycles of
loading during a period of time which lasted about eleven hours, whereas the last part
of the test was affected mainly by the decreasing recovery of deflection.
It can be noticed that during the very last cycle, the losses of load were very low
meaning that the aforementioned contributions were almost completely developed.
Once the load of 49.62 kN (11.15 kips) was reached, the failure of the bar due to
creep-rupture effects occurred in the part of the bar just outside the chuck.
Two additional tests of this type (test 2) were performed to define the ultimate
capacity of the device and to collect the data in order to calibrate the torque wrench.
The test results in terms of ultimate load are summarized in table 7.6. Tab. 7.6. Ultimate loads
Test Number Ultimate Load [kN] 1 49.62 2 44.84 3 48.35
Mean 47.60 Note: 1 kN = 0.2248 kip
In order to calibrate the load on the GFRP bar as a function of the torque furnished by
a torque wrench, additional data were collected during the tests, to find a relationship
between the load measured by the pressure transducer and the moment read on the
scale of the wrench.

University of Missouri - Rolla - C.I.E.S. Università degli studi di Genova - D.I.S.E.G.
232
The relationship is illustrated in figure 7.25.
Fig. 7.25. Load vs. torque wrench moment graph
In figure 7.24 two different regions can be recognized: in the first part of the graph,
up to 30 kN (7 kips), the behavior obtained from the data recorded during the test is
very close to the linear trend, but in the second branch, the gap between the two
curves increases with the increasing of the load in the rod.
This phenomenon can be explained by the increasing of the friction between the nut
and the threaded pipe due to the damage that occur in the screw devices when the
load increases to high values.
This problem can be avoided by using tough steel for the devices and suitable grease
during the loading operation. In many cases, the torque wrench can be used up to
loads two times bigger than the admissible value stated by the ACI code.
The following equation can be used to determine the value of the moment that must
be read on the scale of the wrench used to load the rod in the field applications:
10M = N2.224
⋅ rod with: 0 ≤ Nrod ≤ 30 kN (7 kips)
Where: Nrod is the design load to apply at the rod [kN]
M is the value of the moment that must be read on the wrench [N⋅m]
0
50
100
150
200
250
0 5 10 15 20 25 30 35 40
Load [kN]
Mom
ent [
Nm
]
Real
Linear Trend

University of Missouri - Rolla - C.I.E.S. Università degli studi di Genova - D.I.S.E.G.
233
7.6. Conclusions
Several different kinds of tests were run to verify the effectiveness of the devices and
the applicability of the method in the real field.
The results of the work done in the laboratory demonstrate that the post-tensioning
devices allow for loading the rod up to loads almost three times larger than the
threshold stated by the ACI code.
The anchors are also able to carry a steady load for the period of time needed to fully
embed the rod in the member with the use of an epoxy-based paste.
The tests with the RC beam shows that the technique is capable of solving the
problems concerning the structural rehabilitation such as damage and cracks due to
seismic events or differential settlements, maintaining the integrity of structural
assemblages while preserving aesthetics.
Furthermore, due to the light weight of the material and the devices involved, site
equipment and handling requirements are reduced and simplified.
For these particular technique and devices, a patent disclosure was filed (see
Appendix C.5).

University of Missouri - Rolla - C.I.E.S. Università degli studi di Genova - D.I.S.E.G.
234

University of Missouri - Rolla - C.I.E.S. Università degli studi di Genova - D.I.S.E.G.
235
8. CONCLUSIONS AND FUTURE WORKS
8.1. Conclusions
The present investigation has demonstrated that FRP composites offer benefits for the
strengthening of masonry elements. FRP systems have been proven to increase
flexure and shear capacities of URM elements. Analytical studies were presented for
determining the flexural capacity limit of the strengthened walls and the effective
bonded length of the AFRP laminates.
The new anchor system showed in Section 7 demonstrated that FRP can be succefully
used also for the post-tensioning of masonry with composites in substitution of steel
tendons.
Results on durability tests on putty are a warning with respect to long-term durability.
An in-depth investigation of this and other types of putty may be warranted.
Specific conclusions and recommendations for both engineering and installation
procedures have been presented in all the sections of this thesis.
8.2. Future works Bond
Debonding of the FRP laminate from the masonry surface is the controlling
mechanism of failure. The previous work intended to establish a limit for the FRP
strain and for the minimum bonded length but is not sufficient for the calibration of
the model since debonding has a direct relationship with the porosity of the masonry,
the type of masonry, the humidity, the type of fiber, the quantity of saturant used, etc.
Different representative types of masonry, FRP and other parameters would be
investigated.

University of Missouri - Rolla - C.I.E.S. Università degli studi di Genova - D.I.S.E.G.
236
Out-of-plane with arching effect
In order to develop a design protocol for the flexural strengthening of URM walls
subjected to arching effect, different types of FRP materials and different values of
slenderness ratio would be studied. University of Missouri - Rolla is ready to build
full-scale walls to evaluate all these parameters.
Arching effect appeared to influence significantly RC beams in concrete frames. This
aspect could change ACI guidelines in terms of beam design.
In-plane behavior of masonry walls
For this behavior, it is important to investigate the interaction of strengthened walls
with the surrounding structural elements (i.e. beams and columns) since the
effectiveness of the strengthening may be dangerously overestimated due to
premature failures in the masonry or structural elements. For FRP structural
repointing, more economical embedding materials to encapsulate the FRP rods in the
mortar joints need to be explored. These materials might be mortars with improved
bond properties, which can transfer tensile stresses to the reinforcement.
Post-tensioning
University of Missouri – Rolla is ready to test the anchor system for the thermoplastic
bars in the field to validate the effectiveness and the speed of installation.
Note: a general issue is represented to a lack of material standardization that cause
many design difficulties because of large differences between the same type of FRP
materials.
University of Missouri - Rolla - C.I.E.S. Università degli studi di Genova - D.I.S.E.G.
237
8.3. New frontiers for FRP composites (Blast upgrading)
Terrorist attacks have shown to be a dangerous threat for civilian and military
facilities. Because of the high casualties experienced in the Oklahoma City and
Khobar Towers (Saudi Arabia) bombings, and in the Pentagon with aerial attack,
force protection is considered by the US Department of Defense (DOD) to be a
critical mission parameter. In particular, the blast scenario from a structural point of
view can be subdivided in three phases. In the first phase, exterior walls and columns
and windows are affected, in the second phase floor slabs and roofs, and in the third
and last phase, the lateral load-resisting frame. Amongst building components,
masonry walls possess a reduced capacity against out-of-plane blast loading. Their
capacity can be upgraded by placing internal or external steel reinforcement.
However, these procedures require significant labor during installation. An
alternative is to attach FRP composite materials to the surfaces of the walls to
increase the blast capacity. University of Missouri – Rolla is working in collaboration
with Fort Leonard Wood (Missouri) in a project consisting of design, verification and
upgrade with FRP composites.

University of Missouri - Rolla - C.I.E.S. Università degli studi di Genova - D.I.S.E.G.
238

University of Missouri - Rolla - C.I.E.S. Università degli studi di Genova - D.I.S.E.G.
239
APPENDIX A: ARCHING EFFECT

University of Missouri - Rolla - C.I.E.S. Università degli studi di Genova - D.I.S.E.G.
240
Appendix A.1: Beams design
Testing frame
Material Properties: Concrete: fcu = 23.4 N/mm2 = 3400 psi
fctd = 3.6 N/mm2 = 525 psi
εu = 0.0035
Steel: fyd = 359 N/mm2 = 52.2 ksi
εyd = 0.002 εu = 0.01
Bottom Beam
Top BeamP

University of Missouri - Rolla - C.I.E.S. Università degli studi di Genova - D.I.S.E.G.
241
BOTTOM BEAM DESIGN
Load on bottom beam
30 Kips
15 Kips 15 Kips P = kN 200 kips 455.130 ≅=⋅
VA = VB = kips 22.5 kN 1002
200 ==
Load sketch for bottom beam:
q = 22.5/L Kips
A B
L
L = 0.8128 m = 32”
q = kips/in 0.703 kN/m 1238128.0
100000 ==
Shear and flexure diagram:
DC
Smax
Mmax

University of Missouri - Rolla - C.I.E.S. Università degli studi di Genova - D.I.S.E.G.
242
Vc = Vd = kips 11.25 kN 502
8128.01232
==⋅=qL
Smax = kips 11.25 kN 502
8128.01232
==⋅=qL
Mmax = inkips 90 mkN 16.1088128.0123
8
22
⋅=⋅=⋅=qL
The design is influenced from the frame’s dimensions FLEXURE DESIGN:
H=8
"
B=11" d=
7"
Af
• B = 279.4 mm = 11”
• H = 203.2 mm = 8”
• D = 177.8 mm = 7”
Af = 2 2
yd
max in 0.27 mm 1767.3598.1779.0
10157400fd0.9
M ==⋅⋅
=⋅⋅
• N° 3 Rebars #3 Af = 213 mm2 = 0.33 in2
ωs = a"" 0658.04.238.1774.279
7.359213 fieldfdB
fA
cu
yds ==⋅⋅
⋅=⋅⋅
⋅
ξ= 0.066 + 0.924ϖs = 0.127
x = ξ d = 0.127⋅ 177.8 = 22.6 mm = 0.89”
β 527.0127.0)127.01(
127.010.1157.4)1(10.1157.4
22 =⋅−
⋅−=⋅−
⋅−= ξξ
ξ
k 359.0127.01
127.013.033.01
13.033.0 =−
⋅−=−
⋅−=ξ
ξ

University of Missouri - Rolla - C.I.E.S. Università degli studi di Genova - D.I.S.E.G.
243
95.0127.0359.011 =⋅−=⋅−= ξkζ
maxMinKips 114.49
mkN 12.9 mmN 129412208.17795.02137.359
≥⋅=
⋅=⋅=⋅⋅⋅=⋅⋅⋅= dAfM fydrd ζ
Strain Control:
0035.000145.026.278.17
01.06.2201.0 ≤=−⋅=
−⋅=
xdx
cε
SHEAR DESIGN:
Smax = 50 kN = 11.25 Kips = Vsd
Vrd1 = δ⋅⋅⋅ρ+⋅⋅⋅ db)501(rf25.0 wtctd
• r = 1.6-d = 1.42 m
• fctd = 3.6 N/mm2 = 525 Psi
• 02.0103.48.1774.279
213 3 ≤⋅=⋅
=⋅
= −
dbA
w
ftρ
• 1=δ
• bw = 279.4 mm = 11”
• d = 177.8 mm = 7”
Vrd1 = 77.13 kN = 17.34 Kips ≥ 50 kN = 11.25 Kips NO STIRRUPS NEEDED
• N° Stirrups 1 # 3 - 2 Arms / 254 mm (10”)
Checking compressed concrete:
Vrsu = sdV Kips 78 kN 348 8.1774.2794.2330.030.0 ≥==⋅⋅⋅=⋅⋅⋅ dbf wcu
TOP BEAM DESIGN The load on this beam was calculated considering that the wall cannot rotate.
Load sketch for top beam:

University of Missouri - Rolla - C.I.E.S. Università degli studi di Genova - D.I.S.E.G.
244
q = 27 Kips/foot
BA
Ll
L = 812.8 mm = 32”
l = 609.6 mm = 24”
q = Kips/in 3.375 kN/m 5916096.0
5.1240 ==⋅
Shear and flexure diagram:
A B
Smax
Mmax
VA = VB = Kips 40.5 kN 1802
6096.05912
==⋅=ql
Smax = Kips 40.5 kN 180VV BA ===
Mmax = inKips 401 mkN 75.4586096.0591
28128.0180
82
22
⋅=⋅=⋅−⋅=−⋅ qlLVA
The design is influenced from the frame’s dimensions

University of Missouri - Rolla - C.I.E.S. Università degli studi di Genova - D.I.S.E.G.
245
FLEXURE DESIGN:
d =
7"
H=8
"
B=8"
Af
• B = 203.2 cm = 8”
• H = 203.2 = 8”
• d = 177.8 = 7”
2 2
yd
maxf in 1.23 mm 795
7.3598.1779.045756000
fd0.9M A ==
⋅⋅=
⋅⋅=
• N° 3 Rebars #6 Af = 852 mm2 = 1.32 in2
ωs = b"" 362.04.238.1772.203
7.359852 fieldfdB
fA
cu
yds ==⋅⋅
⋅=⋅⋅
⋅
4.0k
8.0
0
0
=
=β
ξ= 8.0
362.0
0
=βωs = 0.453
x = ξ d = 0.453⋅ 177.8 = 80.6 mm = 3”.171
82.0453.04.01k1 =⋅−=ξ⋅−=ζ
Mrd = maxMinKips 395.5 mkN 7.448.17782.08527.359 ≅⋅=⋅=⋅⋅⋅=⋅⋅⋅ dAf fyd ζ
Strain Control:
01.00042.06.80
)6.808.177(0035.0)( ≤=−⋅=−⋅=x
xdcuεsdε

University of Missouri - Rolla - C.I.E.S. Università degli studi di Genova - D.I.S.E.G.
246
SHEAR DESIGN:
Smax = 180 kN = 40.5 Kips = Vsd
Vrd1 = δ⋅⋅⋅ρ+⋅⋅⋅ db)501(rf25.0 wtctd
• r = 1.6 – d = 1.42 m
• fctd = 3.6 N/mm2 = 525 psi
• 02.0023.08.1772.203
850 ≅=⋅
=⋅
=db
A
w
ftρ
• 1=δ
• bw = 203.2 mm = 8”
• d = 177.8 mm = 7”
Vrd1 = 101 kN = 12.21 Kips ≤ 180 kN = 40.5 Kips NEED STIRRUPS
Vcd = δ⋅⋅⋅⋅ dbf6.0 wctd
1 =δ
Vcd = kN 78.04 8.1772.2036.36.0 =⋅⋅⋅
Vwd = Vsd - Vcd = 180 – 78 = 102 kN
N° Stirrups 1 # 4 - 2 Arms Ast = 22 in 40.0mm 2581292 ==⋅
s = 3/4 5" mm 145102000
8.1779.07.3592589.0≅=⋅⋅⋅=
⋅⋅⋅
wd
ydst
VdfA
• N° Stirrups 1 # 4 - 2 Arms/ 14 cm (5” ½)
Checking compressed concrete:
Vrsu = sdV Kips 57 kN 253.6 8.1772.2034.2330.030.0 ≥==⋅⋅⋅=⋅⋅⋅ dbf wcu

University of Missouri - Rolla - C.I.E.S. Università degli studi di Genova - D.I.S.E.G.
247
(a) Beam forms (b) Beams casting
Fig. A.1. – 1 Preparation of the beams
Appendix A.2: Strengthening scheme
Fig. A.2 – 1. Configuration of the walls
24"
48''
4'' 24" 4''
48''

University of Missouri - Rolla - C.I.E.S. Università degli studi di Genova - D.I.S.E.G.
248
Fig. A.2 – 2. Strengthening scheme with the typical location of the strain gages
(a) Application of primer (b) Application of putty
(c ) Application of GFRP sheet (d) Removing of air bubbles
Fig. A.2 – 3. Specimens preparation
Width = 3”, 5”, 7”, 9” Width = 3”, 5”, 7”, 9”

University of Missouri - Rolla - C.I.E.S. Università degli studi di Genova - D.I.S.E.G.
249
Fig. A.2 – 4. Specimens ready to be tested
1
2
3
4
5
1
2
3
4
5

University of Missouri - Rolla - C.I.E.S. Università degli studi di Genova - D.I.S.E.G.
250
Appendix A.3: Test Setup
(a)
(b)
Fig. A.3 – 1. Test setup
LONGITUDINAL VIEW
WallTop Beam
Bottom Beam
Steel Plates
FRONT VIEW
WallTop Beam
Bottom Beam

University of Missouri - Rolla - C.I.E.S. Università degli studi di Genova - D.I.S.E.G.
251
Fig. A.3 – 2. Picture test setup
Appendix A.4: Test results
CLAY MASONRY
Specimen Control B
Fig. A.4 – 1. Mid-height deflection vs. Load – Control B
0
10
20
30
40
50
60
0 5 10 15 20 25 30 35
Mid-height net deflection (mm)
Load
(kN
)
Lost LVDTS

University of Missouri - Rolla - C.I.E.S. Università degli studi di Genova - D.I.S.E.G.
252
Specimen BG3
Fig. A.4 – 2. Mid-height deflection vs. Load – BG3
Fig. A.4 – 3. Strain vs. Load – BG3
0
10
20
30
40
50
60
0 5 10 15 20 25 30 35
Mid-heigth net deflection (mm)
Load
(kN
)
0
10
20
30
40
50
60
-0.2 0 0.2 0.4 0.6 0.8 1 1.2 1.4 1.6
Strain (%)
Load
(kN
)
Strain 1Strain 2Strain 3Strain 4Strain 5
1 2 3 4 5

University of Missouri - Rolla - C.I.E.S. Università degli studi di Genova - D.I.S.E.G.
253
Fig. A.4 – 4. Height vs. deflection– BG3
Specimen BG5
Fig. A.4 – 5. Mid-height deflection vs. Load – BG5
0
10
20
30
40
50
60
0 5 10 15 20 25 30 35
Mid-height net deflection (mm)
Load
(kN
)
Lost LVDTS
-30
-25
-20
-15
-10
-5
00 200 400 600 800 1000 1200
Position (mm)
Def
lect
ion
(mm
) 5 kN10 kN15 kN20 kN25 kN32 kN35 kN40 kN45 kN50 kN52 kN

University of Missouri - Rolla - C.I.E.S. Università degli studi di Genova - D.I.S.E.G.
254
Fig. A.4 – 6. Strain vs. Load – BG5
Fig. A.4 – 7. Height vs. deflection– BG5
0
10
20
30
40
50
60
-0.2 0 0.2 0.4 0.6 0.8 1 1.2 1.4 1.6Strain (%)
Load
(kN
)
Strain 1Strain 2Strain 3Strain 4Strain 5
1 2 3 4 5
-35
-30
-25
-20
-15
-10
-5
00 200 400 600 800 1000 1200
Position (mm)
Def
lect
ion
(mm
)
5 kN10 kN15 kN20 kN25 kN30 kN35 kN40 kN45 kN

University of Missouri - Rolla - C.I.E.S. Università degli studi di Genova - D.I.S.E.G.
255
Specimen BG7
Fig. A.4 – 8. Mid-height deflection vs. Load – BG7
Fig. A.4 – 9. Strain vs. Load – BG7
0
10
20
30
40
50
60
0 5 10 15 20 25 30 35
Mid-height deflection (mm)
Load
(kN
)
0
10
20
30
40
50
60
-0.2 0 0.2 0.4 0.6 0.8 1 1.2 1.4 1.6
Strain (%)
Load
(kN
)
Strain 1Strain 2Strain 3Strain 4Strain 5
1 2 3 4 5

University of Missouri - Rolla - C.I.E.S. Università degli studi di Genova - D.I.S.E.G.
256
Specimen BG9
Fig. A.4 – 10. Mid-height deflection vs. Load – BG9
Fig. A.4 – 11. Strain vs. Load – BG9
0
10
20
30
40
50
60
0 5 10 15 20 25 30 35
Mid-height deflection (mm)
Load
( kN
)
0
10
20
30
40
50
60
-0.2 0 0.2 0.4 0.6 0.8 1 1.2 1.4 1.6
Strain (%)
Load
(kN
)
Strain 1Strain 2Strain 3Strain 4Strain 5
1 2 3 4 5

University of Missouri - Rolla - C.I.E.S. Università degli studi di Genova - D.I.S.E.G.
257
Comparisons among clay masonry specimens
Fig. A.4 – 12. Vertical load vs. horizontal load – Comparison Clay masonry
Fig. A.4 – 13. H/Vmax vs. FRP width – Comparison Clay masonry
0
10
20
30
40
50
60
0 20 40 60 80 100 120 140 Horizontal load (kN)
Vert
ical
load
(kN
)
CONTROLBG3BG5BG7BG9
0
0.5
1
1.5
2
2.5
3
3.5
4
4.5
0 50 100 150 200 250
FRP width (mm)
H /
Vmax
h/t ratio = 12.8

University of Missouri - Rolla - C.I.E.S. Università degli studi di Genova - D.I.S.E.G.
258
CONCRETE MASONRY
Specimen Control C
Fig. A.4 – 14. Mid-height deflection vs. Load – Control C
Specimen CG3
Fig. A.4 – 15. Mid-height deflection vs. Load – CG3
0
10
20
30
40
50
60
0 5 10 15 20 25 30 35
Mid-height deflection (mm)
Load
(kN
)
LOST LVDTS
0
10
20
30
40
50
60
0 5 10 15 20 25 30 35Mid-height net deflection (mm)
Load
(kN
)

University of Missouri - Rolla - C.I.E.S. Università degli studi di Genova - D.I.S.E.G.
259
Fig. A.4 – 16. Strain vs. Load – CG3
Specimen CG5
Fig. A.4 – 17. Mid-height deflection vs. Load – CG5
0
10
20
30
40
50
60
-0.2 0 0.2 0.4 0.6 0.8 1 1.2 1.4 1.6Strain (%)
Load
(kN
)Strain 1Strain 2strain 3Strain 4Strain 5
1 2 3 4 5
0
10
20
30
40
50
60
0 5 10 15 20 25 30 35
Mid-height net deflection (mm)
Load
(kN
)

University of Missouri - Rolla - C.I.E.S. Università degli studi di Genova - D.I.S.E.G.
260
Fig. A.4 – 18. Strain vs. Load – CG5
Specimen CG7
Fig. A.4 – 19. Mid-height deflection vs. Load – CG7
0
10
20
30
40
50
60
-0,2 0 0,2 0,4 0,6 0,8 1 1,2 1,4 1,6Strain (%)
Load
(kN
)
strain 1Strain 2strain 3Strain 4Strain 5
1 2 3 4 5
0
10
20
30
40
50
60
0 5 10 15 20 25 30 35
Mid-height net deflection (mm)
Load
(kN
)

University of Missouri - Rolla - C.I.E.S. Università degli studi di Genova - D.I.S.E.G.
261
Fig. A.4 – 20. Strain vs. Load – CG7
Specimen CG9
Fig. A.4 – 21. Mid-height deflection vs. Load – CG9
0
10
20
30
40
50
60
-0.2 0 0.2 0.4 0.6 0.8 1 1.2 1.4 1.6Strain (%)
Load
(kN
)
Strain 1Strain 2Strain 3Strain 4Strain 5
1 2 3 4 5
0
10
20
30
40
50
60
0 5 10 15 20 25 30 35Mid-height net deflection (mm)
Load
( kN
)

University of Missouri - Rolla - C.I.E.S. Università degli studi di Genova - D.I.S.E.G.
262
Fig. A.4 – 22. Strain vs. Load – CG9
Comparisons among concrete masonry specimens
Fig. A.4 – 23. Vertical load vs. horizontal load – Comparison Concrete masonry
0
10
20
30
40
50
60
-0.2 0 0.2 0.4 0.6 0.8 1 1.2 1.4 1.6
Strain (%)
Load
(kN
)
Strain 1Strain 2Strain 3Strain 4Strain 5
1 2 3 4 5
0
10
20
30
40
50
60
0 20 40 60 80 100 120 140
Horizontal load (kN)
Vert
ical
load
(kN
)
CONTROLCG3CG5CG7CG9

University of Missouri - Rolla - C.I.E.S. Università degli studi di Genova - D.I.S.E.G.
263
Fig. A.4 – 24. H/Vmax vs. FRP width – Comparison Concrete masonry
Fig. A.4 – 25. Comparison among simply supported and restrained concrete specimens
0
0,5
1
1,5
2
2,5
3
3,5
4
4,5
0 50 100 150 200 250
FRP width (mm)
H/V
max
h/t ratio = 13.2
0
5
10
15
20
25
30
35
0 5 10 15 20 25 30 35
Mid-height net deflection (mm)
Ver
tical
load
(kN
)
Control (endrestrained)
W=76 mm (simplysupported)
W=127 mm (simplysupported)
W=76 mm (end-restrained)
W=127 mm (end-restrained)
Control (simply supported)

University of Missouri - Rolla - C.I.E.S. Università degli studi di Genova - D.I.S.E.G.
264
Appendix A.5: Analitycal study
Fig. A.5 - 1. Unstrengthened section
Fig. A.5 – 2. Strengthened section
block
Unstrengthened section
Strain fields Generic stress block
Tensile strength neglected
Strain fields Generic stress block
Strengthened section

University of Missouri - Rolla - C.I.E.S. Università degli studi di Genova - D.I.S.E.G.
265
FILE MATHCAD FOR THE M-N DIAGRAMS
Geometrical properties of the section: b 609.6:= h 95.25:= bb 330.2:= hb 20.6375:= t 0.35306:= l1 22.225:= hc l1
hb2
+:= l3 h 2 l1⋅− 2 hb⋅−:=
bf 76.2:= bf1 127:= bf2 177.8:= bf3 228.6:= Af bf t⋅:= Af1 bf1 t⋅:= Af2 bf2 t⋅:= Af3 bf3 t⋅:=
Material properties:
Ef 83129.98:= Em 14119.77:= n1EfEm
:= εmu 0.0035:=
εfu 0.0182:= fmu 20.17406:= ffu Ef ε fu⋅:= Crushing of the masonry: α 0.89:= β 0.75:= n 1 10000..:= εx n( )
n 1−( )110000 1−
:=
c εx( ) εmuh
εx εmu+( )⋅:=
Determination of the strain limits: c1
h l1−( )β
:= c2h l1− hb−( )
β:= c3
h l1− hb− l3−( )β
:= c4h l1− 2 hb⋅− l3−( )
β:=
ε1 εmuh c1−( )
c1⋅:= ε2 εmu
h c2−( )c2
⋅:= ε3 εmuh c3−( )
c3⋅:= ε4 εmu
h c4−( )c4
⋅:=
Unstrengthened cross-section: N εx( ) α fmu⋅ b c εx( )⋅ β⋅ 2 bb hb⋅( )⋅−[ ]⋅ εx ε1≤if
α fmu⋅ b c εx( )⋅ β⋅ bb hb⋅− bb β c εx( )⋅ l1− hb− l3−( )⋅−[ ]⋅ ε1 εx< ε2≤if
α fmu⋅ b c εx( )⋅ β⋅ bb hb⋅−( )⋅ ε2 εx< ε3≤if
α fmu⋅ b c εx( )⋅ β⋅ bb β c εx( )⋅ l1−( )⋅−[ ]⋅ ε3 εx< ε4≤if
α fmu⋅ β⋅ c εx( )⋅ b⋅ otherwise
:=
K1 εx( ) β b⋅ c εx( )⋅ α⋅ fmu⋅ h β
c εx( )2
⋅⎛⎜⎝
⎞⎠
−⎡⎢⎣
⎤⎥⎦
⋅:=
K εx( ) K1 εx( ) bb hb⋅ α⋅ fmu⋅ h hc−( )⋅−:=

University of Missouri - Rolla - C.I.E.S. Università degli studi di Genova - D.I.S.E.G.
266
M εx( ) K1 εx( ) bb hb⋅ α⋅ fmu⋅ h hc−( )⋅− bb hb⋅ α⋅ fmu⋅ hc⋅− N εx( )h2
⋅− εx ε1≤if
K εx( ) bb α⋅ fmu⋅ β c εx( )⋅ l1− hb− l3−( )⋅ h l1− hb− l3−( ) 0.5 β c εx( )⋅ hb− l1− l3−( )⋅−[ ]⋅− N εx( )h2
⋅− ε1 εx< ε2≤if
K εx( ) N εx( )h2
⋅− ε2 εx< ε3≤if
K1 εx( ) α fmu⋅ bb⋅ β c εx( )⋅ l1−( )⋅ h l1−β c εx( )⋅ l1−( )
2⎡⎢⎣
⎤⎥⎦
−⎡⎢⎣
⎤⎥⎦
⋅− N εx( )h2
⋅− ε3 εx< ε4≤if
K1 εx( ) N εx( )h2
⋅− otherwise
:=
Strengthened cross-section: N1 εx( ) α fmu⋅ b c εx( )⋅ β⋅ 2 bb hb⋅( )⋅−[ ]⋅ Af εx⋅ Ef⋅− εx ε1≤if
α fmu⋅ b c εx( )⋅ β⋅ bb hb⋅− bb β c εx( )⋅ l1− hb− l3−( )⋅−[ ]⋅ Af εx⋅ Ef⋅− ε1 εx< ε2≤if
α fmu⋅ b c εx( )⋅ β⋅ bb hb⋅−( )⋅ Af εx⋅ Ef⋅− ε2 εx< ε3≤if
α fmu⋅ b c εx( )⋅ β⋅ bb β c εx( )⋅ l1−( )⋅−[ ]⋅ Af εx⋅ Ef⋅− ε3 εx< ε4≤if
α fmu⋅ β⋅ c εx( )⋅ b⋅( ) Af εx⋅ Ef⋅− ε4 εx< εfu≤if
α fmu⋅ β⋅ c εfu( )⋅ b⋅( ) Af εfu⋅ Ef⋅− otherwise
:=
M1 εx( ) K1 εx( ) bb hb⋅ α⋅ fmu⋅ h hc−( )⋅− bb hb⋅ α⋅ fmu⋅ hc⋅− N1 εx( )
h2
⋅− εx ε1≤if
K εx( ) bb α⋅ fmu⋅ β c εx( )⋅ l1− hb− l3−( )⋅ h l1− hb− l3−( ) 0.5 β c εx( )⋅ hb− l1− l3−( )⋅−[ ]⋅− N1 εx( )h2
⋅− ε1 εx< ε2≤if
K εx( ) N1 εx( )h2
⋅− ε2 εx< ε3≤if
K1 εx( ) α fmu⋅ bb⋅ β c εx( )⋅ l1−( )⋅ h l1−β c εx( )⋅ l1−( )
2⎡⎢⎣
⎤⎥⎦
−⎡⎢⎣
⎤⎥⎦
⋅− N1 εx( )h2
⋅− ε3 εx< ε4≤if
K1 εx( ) N1 εx( )h2
⋅− ε4 εx< εfu≤if
K1 εfu( ) N1 εfu( )h2
⋅− otherwise
:=
N2 εx( ) α fmu⋅ b c εx( )⋅ β⋅ 2 bb hb⋅( )⋅−[ ]⋅ Af1 εx⋅ Ef⋅− εx ε1≤if
α fmu⋅ b c εx( )⋅ β⋅ bb hb⋅− bb β c εx( )⋅ l1− hb− l3−( )⋅−[ ]⋅ Af1 εx⋅ Ef⋅− ε1 εx< ε2≤if
α fmu⋅ b c εx( )⋅ β⋅ bb hb⋅−( )⋅ Af1 εx⋅ Ef⋅− ε2 εx< ε3≤if
α fmu⋅ b c εx( )⋅ β⋅ bb β c εx( )⋅ l1−( )⋅−[ ]⋅ Af1 εx⋅ Ef⋅− ε3 εx< ε4≤if
α fmu⋅ β⋅ c εx( )⋅ b⋅( ) Af1 εx⋅ Ef⋅− ε4 εx< εfu≤if
α fmu⋅ β⋅ c εfu( )⋅ b⋅( ) Af1 εfu⋅ Ef⋅− otherwise
:=

University of Missouri - Rolla - C.I.E.S. Università degli studi di Genova - D.I.S.E.G.
267
M2 εx( ) K1 εx( ) bb hb⋅ α⋅ fmu⋅ h hc−( )⋅− bb hb⋅ α⋅ fmu⋅ hc⋅− N2 εx( )h2
⋅− εx ε1≤if
K εx( ) bb α⋅ fmu⋅ β c εx( )⋅ l1− hb− l3−( )⋅ h l1− hb− l3−( ) 0.5 β c εx( )⋅ hb− l1− l3−( )⋅−[ ]⋅− N2 εx( )h2
⋅− ε1 εx< ε2≤if
K εx( ) N2 εx( )h2
⋅− ε2 εx< ε3≤if
K1 εx( ) α fmu⋅ bb⋅ β c εx( )⋅ l1−( )⋅ h l1−β c εx( )⋅ l1−( )
2⎡⎢⎣
⎤⎥⎦
−⎡⎢⎣
⎤⎥⎦
⋅− N2 εx( )h2
⋅− ε3 εx< ε4≤if
K1 εx( ) N2 εx( )h2
⋅− ε4 εx< εfu≤if
K1 εfu( ) N2 εfu( )h2
⋅− otherwise
:=
N3 εx( ) α fmu⋅ b c εx( )⋅ β⋅ 2 bb hb⋅( )⋅−[ ]⋅ Af2 εx⋅ Ef⋅− εx ε1≤if
α fmu⋅ b c εx( )⋅ β⋅ bb hb⋅− bb β c εx( )⋅ l1− hb− l3−( )⋅−[ ]⋅ Af2 εx⋅ Ef⋅− ε1 εx< ε2≤if
α fmu⋅ b c εx( )⋅ β⋅ bb hb⋅−( )⋅ Af2 εx⋅ Ef⋅− ε2 εx< ε3≤if
α fmu⋅ b c εx( )⋅ β⋅ bb β c εx( )⋅ l1−( )⋅−[ ]⋅ Af2 εx⋅ Ef⋅− ε3 εx< ε4≤if
α fmu⋅ β⋅ c εx( )⋅ b⋅( ) Af2 εx⋅ Ef⋅− ε4 εx< εfu≤if
α fmu⋅ β⋅ c εfu( )⋅ b⋅( ) Af2 εfu⋅ Ef⋅− otherwise
:=
M3 εx( ) K1 εx( ) bb hb⋅ α⋅ fmu⋅ h hc−( )⋅− bb hb⋅ α⋅ fmu⋅ hc⋅− N3 εx( )
h2
⋅− εx ε1≤if
K εx( ) bb α⋅ fmu⋅ β c εx( )⋅ l1− hb− l3−( )⋅ h l1− hb− l3−( ) 0.5 β c εx( )⋅ hb− l1− l3−( )⋅−[ ]⋅− N3 εx( )h2
⋅− ε1 εx< ε2≤if
K εx( ) N3 εx( )h2
⋅− ε2 εx< ε3≤if
K1 εx( ) α fmu⋅ bb⋅ β c εx( )⋅ l1−( )⋅ h l1−β c εx( )⋅ l1−( )
2⎡⎢⎣
⎤⎥⎦
−⎡⎢⎣
⎤⎥⎦
⋅− N3 εx( )h2
⋅− ε3 εx< ε4≤if
K1 εx( ) N3 εx( )h2
⋅− ε4 εx< εfu≤if
K1 εfu( ) N3 εfu( )h2
⋅− otherwise
:=
N4 εx( ) α fmu⋅ b c εx( )⋅ β⋅ 2 bb hb⋅( )⋅−[ ]⋅ Af3 εx⋅ Ef⋅− εx ε1≤if
α fmu⋅ b c εx( )⋅ β⋅ bb hb⋅− bb β c εx( )⋅ l1− hb− l3−( )⋅−[ ]⋅ Af3 εx⋅ Ef⋅− ε1 εx< ε2≤if
α fmu⋅ b c εx( )⋅ β⋅ bb hb⋅−( )⋅ Af3 εx⋅ Ef⋅− ε2 εx< ε3≤if
α fmu⋅ b c εx( )⋅ β⋅ bb β c εx( )⋅ l1−( )⋅−[ ]⋅ Af3 εx⋅ Ef⋅− ε3 εx< ε4≤if
α fmu⋅ β⋅ c εx( )⋅ b⋅( ) Af3 εx⋅ Ef⋅− ε4 εx< εfu≤if
α fmu⋅ β⋅ c εfu( )⋅ b⋅( ) Af3 εfu⋅ Ef⋅− otherwise
:=
M4 εx( ) K1 εx( ) bb hb⋅ α⋅ fmu⋅ h hc−( )⋅− bb hb⋅ α⋅ fmu⋅ hc⋅− N4 εx( )
h2
⋅− εx ε1≤if
K εx( ) bb α⋅ fmu⋅ β c εx( )⋅ l1− hb− l3−( )⋅ h l1− hb− l3−( ) 0.5 β c εx( )⋅ hb− l1− l3−( )⋅−[ ]⋅− N4 εx( )h2
⋅− ε1 εx< ε2≤if
K εx( ) N4 εx( )h2
⋅− ε2 εx< ε3≤if
K1 εx( ) α fmu⋅ bb⋅ β c εx( )⋅ l1−( )⋅ h l1−β c εx( )⋅ l1−( )
2⎡⎢⎣
⎤⎥⎦
−⎡⎢⎣
⎤⎥⎦
⋅− N4 εx( )h2
⋅− ε3 εx< ε4≤if
K1 εx( ) N4 εx( )h2
⋅− ε4 εx< εfu≤if
K1 εfu( ) N4 εfu( )h2
⋅− otherwise
:=

University of Missouri - Rolla - C.I.E.S. Università degli studi di Genova - D.I.S.E.G.
268
m 1 10000..:= εm m( )
m 1−( ) εmu⋅10000 1−
:=
α1 m( )2− εm m( )⋅ 3− εmu⋅ εm m( )+( )2⋅
3 4− εmu⋅ εm m( )+( ) εmu2⋅:=
β1 m( )1 4− εmu εm m( )+( )⋅2 3− εmu⋅ εm m( )+( )
:=
cm m( )εm m( ) h⋅
εfu εm m( )+:=
Na1 m( ) α1 m( ) fmu⋅ β1 m( )⋅ cm m( )⋅ b⋅ Af εfu⋅ Ef⋅−:= Ma1 m( ) α1 m( ) fmu⋅ β1 m( )⋅ cm m( )⋅ b⋅ h β1 m( )
cm m( )2
⋅−⎛⎜⎝
⎞⎠
⋅ Na1 m( )h2
⋅−:=
Na2 m( ) α1 m( ) fmu⋅ β1 m( )⋅ cm m( )⋅ b⋅ Af1 εfu⋅ Ef⋅−:= Ma2 m( ) α1 m( ) fmu⋅ β1 m( )⋅ cm m( )⋅ b⋅ h β1 m( )
cm m( )2
⋅−⎛⎜⎝
⎞⎠
⋅ Na2 m( )h2
⋅−:=
Na3 m( ) α1 m( ) fmu⋅ β1 m( )⋅ cm m( )⋅ b⋅ Af2 εfu⋅ Ef⋅−:= Ma3 m( ) α1 m( ) fmu⋅ β1 m( )⋅ cm m( )⋅ b⋅ h β1 m( )
cm m( )2
⋅−⎛⎜⎝
⎞⎠
⋅ Na3 m( )h2
⋅−:=
Na4 m( ) α1 m( ) fmu⋅ β1 m( )⋅ cm m( )⋅ b⋅ Af3 εfu⋅ Ef⋅−:= Ma4 m( ) α1 m( ) fmu⋅ β1 m( )⋅ cm m( )⋅ b⋅ h β1 m( )
cm m( )2
⋅−⎛⎜⎝
⎞⎠
⋅ Na4 m( )h2
⋅−:=
Nu α fmu⋅ b h⋅ 2 bb hb⋅( )⋅−[ ]⋅:= rx N 0( ) Nu..:= ry rx( )
M 0( ) rx⋅N 0( ) Nu−
Nu− M 0( )⋅N 0( ) Nu−
+:=
M function of N for unstrengthened section: εx1 0 2..:= cm εx1( ) εmu
hεx1 εmu+( )
⋅:= Nm εx1( ) α fmu⋅ b cm εx1( )⋅ β⋅ 2 bb hb⋅( )⋅−[ ]⋅ εx1 ε1≤if
α fmu⋅ b cm εx1( )⋅ β⋅ bb hb⋅− bb β cm εx1( )⋅ l1− hb− l3−( )⋅−[ ]⋅ ε1 εx1< ε2≤if
α fmu⋅ b cm εx1( )⋅ β⋅ bb hb⋅−( )⋅ ε2 εx1< ε3≤if
α fmu⋅ b cm εx1( )⋅ β⋅ bb β cm εx1( )⋅ l1−( )⋅−[ ]⋅ ε3 εx1< ε4≤if
α fmu⋅ β⋅ cm εx1( )⋅ b⋅ otherwise
:=
N1 N ε1( ):= N2 N ε2( ):= N3 N ε3( ):= N4 N ε4( ):=
C1 N( )
Nα fmu⋅
2 bb⋅ hb⋅+
b β⋅:=
C2 N( )
Nα fmu⋅
bb l1⋅ bb l3⋅+( )−
b β⋅ β bb⋅−:= C3 N( )
Nα fmu⋅
bb hb⋅+
b β⋅:=
C4 N( )bb− l1⋅
Nα fmu⋅
+
b β⋅ bb β⋅−:= C5 N( )
Nα fmu⋅ β⋅ b⋅
:=
K1m1 N( ) β b⋅ C1 N( )⋅ α⋅ fmu⋅ h β
C1 N( )2
⋅⎛⎜⎝
⎞⎠
−⎡⎢⎣
⎤⎥⎦
⋅:=
K1m2 N( ) β b⋅ C2 N( )⋅ α⋅ fmu⋅ h βC2 N( )
2⋅⎛⎜
⎝⎞⎠
−⎡⎢⎣
⎤⎥⎦
⋅:=
K1m3 N( ) β b⋅ C3 N( )⋅ α⋅ fmu⋅ h βC3 N( )
2⋅⎛⎜
⎝⎞⎠
−⎡⎢⎣
⎤⎥⎦
⋅:=

University of Missouri - Rolla - C.I.E.S. Università degli studi di Genova - D.I.S.E.G.
269
K1m4 N( ) β b⋅ C4 N( )⋅ α⋅ fmu⋅ h βC4 N( )
2⋅⎛⎜
⎝⎞⎠
−⎡⎢⎣
⎤⎥⎦
⋅:=
K1m5 N( ) β b⋅ C5 N( )⋅ α⋅ fmu⋅ h βC5 N( )
2⋅⎛⎜
⎝⎞⎠
−⎡⎢⎣
⎤⎥⎦
⋅:=
Km2 N( ) K1m2 N( ) bb hb⋅ α⋅ fmu⋅ h hc−( )⋅−:= Km3 N( ) K1m3 N( ) bb hb⋅ α⋅ fmu⋅ h hc−( )⋅−:= Mu N( ) K1m1 N( ) bb hb⋅ α⋅ fmu⋅ h hc−( )⋅− bb hb⋅ α⋅ fmu⋅ hc⋅− N
h2
⋅− N N1≥if
Km2 N( ) bb α⋅ fmu⋅ β C2 N( )⋅ l1− hb− l3−( )⋅ h l1− hb− l3−( ) 0.5 β C2 N( )⋅ hb− l1− l3−( )⋅−[ ]⋅− Nh2
⋅− N1 N> N2≥if
Km3 N( ) Nh2
⋅− N2 N> N3≥if
K1m4 N( ) α fmu⋅ bb⋅ β C4 N( )⋅ l1−( )⋅ h l1−β C4 N( )⋅ l1−( )
2⎡⎢⎣
⎤⎥⎦
−⎡⎢⎣
⎤⎥⎦
⋅− Nh2
⋅− N3 N> N4≥if
K1m5 N( ) Nh2
⋅− otherwise
:=
N 0 Nu..:=
Fig. A.5 – 3. Interaction diagrams for clay cross sections
ω=0ω=3’’ ω=5’’
ω=9’’ω=7’’
Moment [Nmm]
Axi
al lo
ad [N
]

University of Missouri - Rolla - C.I.E.S. Università degli studi di Genova - D.I.S.E.G.
270
Fig. A.5 – 4. Interaction diagrams for concrete cross sections
Tab. A.5 – 1. Experimental moments for the clay specimens
Specimen N [kN] MMID[kN mm] MBOUND[kN mm] Control B 57.8 2601 2601
BG3 115.6 7663 4895 BG5 101.4 8789 4359 BG7 97.9 9872 4223 BG9 80.9 10797 3554
Tab. A.5 – 2.Experimental moments for the concrete specimens
Specimen N [kN] MMID[kN mm] MBOUND[kN mm] Control C 83.6 3406 3406
CG3 82.7 5238 3375 CG5 58.7 5888 2483 CG7 58.7 6683 2483 CG9 38.3 7372 1670
Moment [Nmm]
Axi
al lo
ad [N
]
ω=0
ω=9’’ω=7’’ω=5’’
ω=3’’

University of Missouri - Rolla - C.I.E.S. Università degli studi di Genova - D.I.S.E.G.
271
Tab. A.5 – 3. Reinforcement ratio ωf for clay and concrete masonry
Specimen
b [mm]
h [mm]
FRP width[mm]
Af [mm2]
ρf
ωf
Control B 609.6 95.25 - - - - BG3 609.6 95.25 76.2 26.90 0.000463 0.149 BG5 609.6 95.25 127 44.84 0.000772 0.248 BG7 609.6 95.25 177.8 62.77 0.001081 0.348 BG9 609.6 95.25 228.6 80.71 0.00139 0.448
Control C 609.6 92.07 - - - - CG3 609.6 92.07 76.2 26.90 0.000479 0.206 CG5 609.6 92.07 127 44.84 0.000799 0.344 CG7 609.6 92.07 177.8 62.77 0.001118 0.481 CG9 609.6 92.07 228.6 80.71 0.001438 0.618
Note: 1 mm = 0.03937 in
Fig. A.5 – 5. Comparison for all the specimens
0
0.001
0.002
0.003
0.004
0.005
0.006
0.007
0.008
0.009
0.01
0 0.1 0.2 0.3 0.4 0.5 0.6 0.7
ωf
V/M
max
[1/m
m]
DataPoli. (Data)
h/t = 13

University of Missouri - Rolla - C.I.E.S. Università degli studi di Genova - D.I.S.E.G.
272
FILE MATHCAD FOR DESIGN PURPOSES
Geometrical properties of the section: b 609.6:= h 92.075:= bb 405.60625:= hb 31.75:= t 0.35306:= l1 30.1625:= hc l1
hb2
+:= l3 h 2 l1⋅− hb−:=
bf 76.2:= bf1 76.2:= Af bf t⋅:= Af1 bf1 t⋅:= Ac b h⋅ bb hb⋅−:= Material properties: Ef 83129.98:= Em 13125.66:= n1
EfEm
:= εmu 0.0025:=
εfu 0.0182:= fmu 14.58241:= ffu Ef εfu⋅:= Crushing of the masonry: α 0.89:= β 0.75:= εx 0 0.0001, 1..:= c εx( ) εmu
hεx εmu+( )⋅:=
Determination of the strain limits: c1
h l1−( )β
:= c2h l1− hb−( )
β:=
ε1 εmuh c1−( )
c1⋅:= ε2 εmu
h c2−( )c2
⋅:=
Unstrengthened cross-section: Real section: N εx( ) α fmu⋅ b c εx( )⋅ β⋅ bb hb⋅−( )⋅ εx ε1≤if
α fmu⋅ b c εx( )⋅ β⋅ bb β c εx( )⋅ l1−( )⋅−⎡⎣ ⎤⎦⋅ ε1 εx< ε2≤if
α fmu⋅ β⋅ c εx( )⋅ b⋅ otherwise
:=
K1 εx( ) β b⋅ c εx( )⋅ α⋅ fmu⋅ h β c εx( )
2⋅⎛⎜
⎝⎞⎠
−⎡⎢⎣
⎤⎥⎦
⋅:=
K εx( ) K1 εx( ) bb hb⋅ α⋅ fmu⋅ h hc−( )⋅−:= M εx( ) K1 εx( ) bb hb⋅ α⋅ fmu⋅ hc⋅− N εx( ) h
2⋅− εx ε1≤if
K1 εx( ) bb α⋅ fmu⋅ β c εx( )⋅ l1−( )⋅ h l1−β c εx( )⋅ l1−( )
2−⎡⎢
⎣⎤⎥⎦
⋅− N εx( ) h2
⋅− ε1 εx< ε2≤if
K1 εx( ) N εx( ) h2
⋅− otherwise
:=

University of Missouri - Rolla - C.I.E.S. Università degli studi di Genova - D.I.S.E.G.
273
Full section: Np εx( ) α fmu⋅ b c εx( )⋅ β⋅( )⋅ εx ε2≤if
α fmu⋅ β⋅ c εx( )⋅ b⋅ otherwise
:=
Mp εx( ) K1 εx( ) Np εx( ) h
2⋅− εx ε2≤if
K1 εx( ) Np εx( ) h2
⋅− otherwise
:=
Equivalent section: b1
Ach
:=
Nc εx( ) α fmu⋅ b1 c εx( )⋅ β⋅( )⋅ εx ε2≤if
α fmu⋅ β⋅ c εx( )⋅ b1⋅ otherwise
:=
K2 εx( ) β b1⋅ c εx( )⋅ α⋅ fmu⋅ h β c εx( )
2⋅⎛⎜
⎝⎞⎠
−⎡⎢⎣
⎤⎥⎦
⋅:=
Mc εx( ) K2 εx( ) Nc εx( ) h
2⋅− εx ε2≤if
K2 εx( ) Nc εx( ) h2
⋅− otherwise
:=
Strengthened cross-sections: Real section: N1 εx( ) α fmu⋅ b c εx( )⋅ β⋅ bb hb⋅−( )⋅ Af Ef⋅ εx⋅− εx ε1≤if
α fmu⋅ b c εx( )⋅ β⋅ bb β c εx( )⋅ l1−( )⋅−⎡⎣ ⎤⎦⋅ Af Ef⋅ εx⋅− ε1 εx< ε2≤if
α fmu⋅ β⋅ c εx( )⋅ b⋅ Af Ef⋅ εx⋅−( ) ε2 εx≤ εfu≤if
α fmu⋅ β⋅ c εfu( )⋅ b⋅ Af Ef⋅ εfu⋅−( ) otherwise
:=
K εx( ) K1 εx( ) bb hb⋅ α⋅ fmu⋅ h hc−( )⋅−:= K1 εx( ) β b⋅ c εx( )⋅ α⋅ fmu⋅ h β c εx( )
2⋅⎛⎜
⎝⎞⎠
−⎡⎢⎣
⎤⎥⎦
⋅:=
M1 εx( ) K1 εx( ) bb hb⋅ α⋅ fmu⋅ hc⋅− N1 εx( ) h
2⋅− εx ε1≤if
K1 εx( ) bb α⋅ fmu⋅ β c εx( )⋅ l1−( )⋅ h l1−β c εx( )⋅ l1−( )
2−⎡⎢
⎣⎤⎥⎦
⋅− N1 εx( ) h2
⋅− ε1 εx< ε2≤if
K1 εx( ) N1 εx( ) h2
⋅− ε2 εx≤ εfu≤if
K1 εfu( ) N1 εfu( ) h2
⋅− otherwise
:=

University of Missouri - Rolla - C.I.E.S. Università degli studi di Genova - D.I.S.E.G.
274
Full section: N2p εx( ) α fmu⋅ b c εx( )⋅ β⋅( )⋅ Af Ef⋅ εx⋅− εx ε2≤if
α fmu⋅ β⋅ c εx( )⋅ b⋅ Af Ef⋅ εx⋅−( ) ε2 εx≤ εfu≤if
α fmu⋅ β⋅ c εfu( )⋅ b⋅ Af Ef⋅ εfu⋅−( ) otherwise
:=
K1 εx( ) β b⋅ c εx( )⋅ α⋅ fmu⋅ h β c εx( )
2⋅⎛⎜
⎝⎞⎠
−⎡⎢⎣
⎤⎥⎦
⋅:=
M2p εx( ) K1 εx( ) N2p εx( ) h
2⋅− εx ε2≤if
K1 εx( ) N2p εx( ) h2
⋅− ε2 εx≤ εfu≤if
K1 εfu( ) N2p εfu( ) h2
⋅− otherwise
:=
Equivalent section: N2c εx( ) α fmu⋅ b1 c εx( )⋅ β⋅( )⋅ Af Ef⋅ εx⋅− εx ε2≤if
α fmu⋅ β⋅ c εx( )⋅ b1⋅ Af Ef⋅ εx⋅−( ) ε2 εx≤ εfu≤if
α fmu⋅ β⋅ c εfu( )⋅ b1⋅ Af Ef⋅ εfu⋅−( ) otherwise
:=
K1c εx( ) β b1⋅ c εx( )⋅ α⋅ fmu⋅ h β c εx( )
2⋅⎛⎜
⎝⎞⎠
−⎡⎢⎣
⎤⎥⎦
⋅:=
M2c εx( ) K1c εx( ) N2c εx( ) h
2⋅− εx ε2≤if
K1c εx( ) N2c εx( ) h2
⋅− ε2 εx≤ εfu≤if
K1c εfu( ) N2c εfu( ) h2
⋅− otherwise
:=
Nup α fmu⋅ b⋅ h⋅:= rxp Np 0( ) Nup, Nup..:= ryp rxp( )
Mp 0( ) rxp⋅Np 0( ) Nup−
Nup− Mp 0( )⋅Np 0( ) Nup−
+:= Nuc α fmu⋅ b1⋅ h⋅:= rxc Nc 0( ) Nuc, Nuc..:= ryc rxc( )
Mc 0( ) rxc⋅Nc 0( ) Nuc−
Nuc− Mc 0( )⋅Nc 0( ) Nuc−
+:=
Nu α fmu⋅ b h⋅ bb hb⋅−( )⋅:= rx N 0( ) Nu, Nu..:= ry rx( )
M 0( ) rx⋅N 0( ) Nu−
Nu− M 0( )⋅N 0( ) Nu−
+:=
εm 0 0.000001, 0.0025..:=
α1 εm( ) 2− εm⋅ 3− εmu⋅ εm+( )2⋅
3 4− εmu⋅ εm+( ) εmu2
⋅:=
β1 εm( ) 1 4− εmu εm+( )⋅
2 3− εmu⋅ εm+( ):=
cm εm( ) εm h⋅εfu εm+
:=
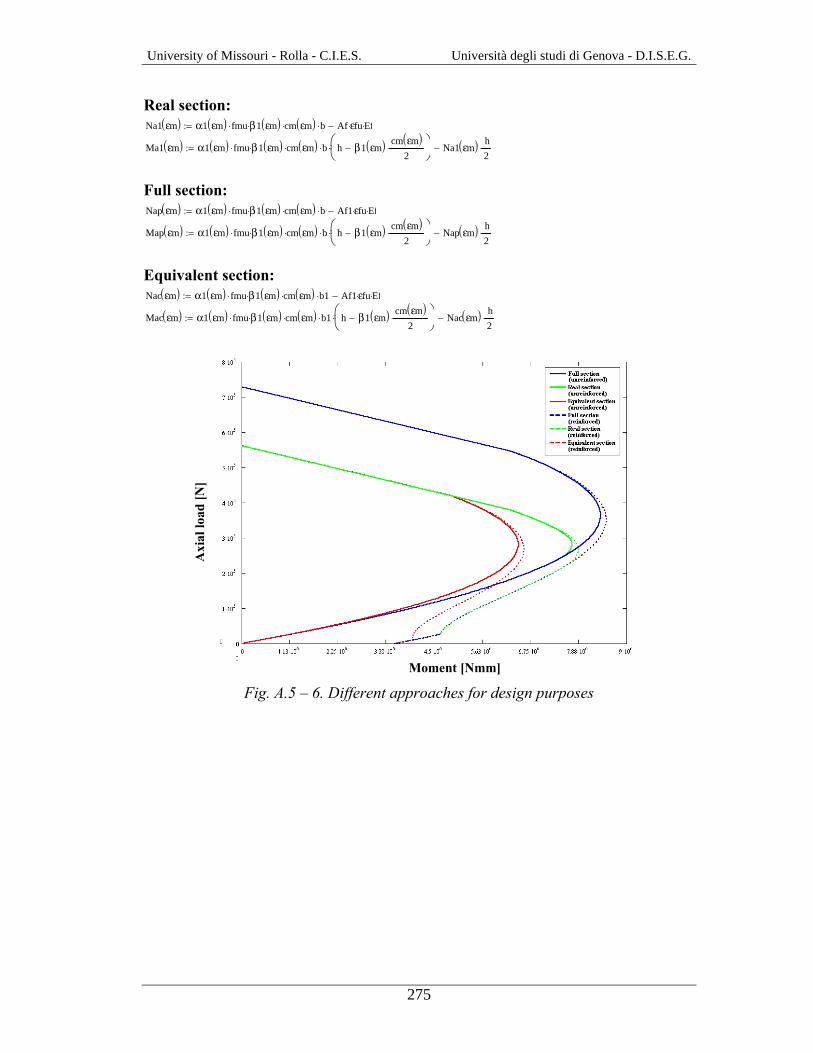
University of Missouri - Rolla - C.I.E.S. Università degli studi di Genova - D.I.S.E.G.
275
Real section: Na1 εm( ) α1 εm( ) fmu⋅ β1 εm( )⋅ cm εm( )⋅ b⋅ Af εfu⋅ Ef⋅−:= Ma1 εm( ) α1 εm( ) fmu⋅ β1 εm( )⋅ cm εm( )⋅ b⋅ h β1 εm( ) cm εm( )
2⋅−⎛⎜
⎝⎞⎠
⋅ Na1 εm( ) h2
⋅−:=
Full section: Nap εm( ) α1 εm( ) fmu⋅ β1 εm( )⋅ cm εm( )⋅ b⋅ Af1 εfu⋅ Ef⋅−:= Map εm( ) α1 εm( ) fmu⋅ β1 εm( )⋅ cm εm( )⋅ b⋅ h β1 εm( ) cm εm( )
2⋅−⎛⎜
⎝⎞⎠
⋅ Nap εm( ) h2
⋅−:=
Equivalent section: Nac εm( ) α1 εm( ) fmu⋅ β1 εm( )⋅ cm εm( )⋅ b1⋅ Af1 εfu⋅ Ef⋅−:= Mac εm( ) α1 εm( ) fmu⋅ β1 εm( )⋅ cm εm( )⋅ b1⋅ h β1 εm( ) cm εm( )
2⋅−⎛⎜
⎝⎞⎠
⋅ Nac εm( ) h2
⋅−:=
Fig. A.5 – 6. Different approaches for design purposes
Moment [Nmm]
Axi
al lo
ad [N
]

University of Missouri - Rolla - C.I.E.S. Università degli studi di Genova - D.I.S.E.G.
276

University of Missouri - Rolla - C.I.E.S. Università degli studi di Genova - D.I.S.E.G.
277
APPENDIX B: IN - PLANE

University of Missouri - Rolla - C.I.E.S. Università degli studi di Genova - D.I.S.E.G.
278
APPENDIX B.1: Test Specimens
Note: 1 in = 25.4 mm
Fig.B.1 - 1. Configuration of the walls
Tab. B.1 - 1. Test matrix for Series CLW
Specimen Strengthening Front Side Back Side Layout
CLW1 None None None
FRONT F B
CLW2 #2 GFRP bars 4HJ 4HJ
CLW3 #2 GFRP bars
4 in GFRP laminates
2HJ/4VS 2HJ/4VS
FRONT/BACK F B
CLAY BRICK PANEL
64''
64''
8''
FRONT VIEW SIDE VIEW
FRONT/BACK F B

University of Missouri - Rolla - C.I.E.S. Università degli studi di Genova - D.I.S.E.G.
279
Tab. B.1 - 1. Test matrix (continued)
Specimen Strengthening Front Side Back Side Layout
CLW4 #2 GFRP bars
4 in GFRP laminates
4HJ/4VS 4HJ/4VS
FRONT/BACK F B
CLW5 Carbon strips 3/4HC 3/4VC
BACK F B
CLW6 Carbon strips 5D 5D
FRONT/BACK F B
LEGEND: 2HJ=every second mortar joint, 4HJ= every fourth mortar joint, 4VS= four vertical glass strips @ 16 in o.c., 3/4VC= vertical carbon strips every third/fourth mortar joint, 3/4HC= horizontal carbon strips every third/fourth mortar joint, 5D= five diagonal carbon strips simmetrically spaced from the diagonal
FRONT BACK
1
2
3
4
5
LVDT 1
LVDT 2
LVDT 4
LVDT 3
Fig.B.1 - 2. Typical strain gages and LVDT’s location

University of Missouri - Rolla - C.I.E.S. Università degli studi di Genova - D.I.S.E.G.
280
APPENDIX B.2: Test Setup
(a) Test setup scheme (b) Test setup Fig.B.2 - 1. Test setup
Fig.B.2 - 2. Steel shoe
Tab. B.2 - 1. Test cycles
Note: 1kN = 0.2248 kip
Cycle Load Range (kips)1 0-6.7-2.2 2 2.2-9.0-2.2 3 2.2-11.2-2.2 4 2.2-failure

University of Missouri - Rolla - C.I.E.S. Università degli studi di Genova - D.I.S.E.G.
281
APPENDIX B.3: Test Results
Wall CLW1: Control wall
Fig.B.3 - 1. LVDTs location and loaded diagonal
Fig.B.3 - 2. Load vs. diagonal displacement
Fig.B.3 - 3. Wall CLW1 after failure (front)
FRONT / BACK
0
50
100
150
200
250
300
350
400
450
-20 -15 -10 -5 0 5 10 15 20
Displacement (mm)
In-P
lane
Loa
d (k
N)
FRONT F B 0 90
0°B 0°F
FRONT BACK
LVDT 1
LVDT 2

University of Missouri - Rolla - C.I.E.S. Università degli studi di Genova - D.I.S.E.G.
282
Wall CLW2
5
1
4
LVDT 2
3
2LV
DT 1
FRONT BACK
LVDT 3
LVDT 4
Fig.B.3 - 4. Strain gauges, LVDTs locations and loaded diagonal
Fig.B.3 - 5. Load vs. diagonal displacement
Fig.B.3 - 6. Wall CLW2 after failure (front)
FRONT
0
50
100
150
200
250
300
350
400
450
-20 -15 -10 -5 0 5 10 15 20
Displacement (mm)
In-P
lane
Loa
d (k
N)
0 90
0°F
FRONT/BACK F B

University of Missouri - Rolla - C.I.E.S. Università degli studi di Genova - D.I.S.E.G.
283
0
50
100
150
200
250
300
350
400
450
-0.012 -0.01 -0.008 -0.006 -0.004 -0.002 0 0.002 0.004
Strain [%]
Load
[kN
]Strain 4
Strain 1
Strain 3
Strain 5
Strain 2
Fig.B.3 - 7. Load vs. strain
Wall CLW3
BACKFRONT
1
2
3
4
5
LVDT 1 LVDT 2 LVDT 3 LVDT 4
Fig.B.3 - 8. Strain gauges, LVDTs locations and loaded diagonal
Fig.B.3 - 9. Load vs. diagonal displacement
BACK
0
50
100
150
200
250
300
350
400
450
-20 -15 -10 -5 0 5 10 15 20
Displacement (mm)
In-P
lane
Loa
d (k
N)
0 90
0° 90°
FRONT/BACK F B

University of Missouri - Rolla - C.I.E.S. Università degli studi di Genova - D.I.S.E.G.
284
Fig.B.3 - 10. Wall CLW3 after failure (front)
0
50
100
150
200
250
300
350
400
450
-0.15 0.05 0.25 0.45 0.65 0.85 1.05 1.25
Strain [%]
Load
[kN
]
Strain 1
Strain 3
Strain 2
Strain 5
Strain 4
Fig.B.3 - 11. Load vs. strain

University of Missouri - Rolla - C.I.E.S. Università degli studi di Genova - D.I.S.E.G.
285
Wall CLW4 BACKFRONT
1
2
3
4
5LV
DT 1 LVDT 2 LVDT 3 LVDT 4
Fig.B.3 - 12. Strain gauges, LVDTs locations and loaded diagonal
Fig.B.3 - 13. Load vs. diagonal displacement
FRONT
0
50
100
150
200
250
300
350
400
450
-20 -15 -10 -5 0 5 10 15 20
Displacement (mm)
In-P
lane
Loa
d (k
N)
0 90
0° 90°
FRONT/BACK F B
BACK
0
50
100
150
200
250
300
350
400
450
-20 -15 -10 -5 0 5 10 15 20
Displacement (mm)
In-P
lane
Loa
d (k
N)
0 90
90° 0°
FRONT/BACK F B

University of Missouri - Rolla - C.I.E.S. Università degli studi di Genova - D.I.S.E.G.
286
Fig.B.3 - 14. Wall CLW4 after failure (front)
0
50
100
150
200
250
300
350
400
450
-0.05 0.2 0.45 0.7 0.95 1.2 1.45
Strain [%]
Load
[kN
]
Strain 3
Strain 4
Strain 5
Strain 1
Strain 2
Fig.B.3 - 15. Load vs. strain
Wall CLW5 BACKFRONT
1
2
3
LVDT 3
LVDT 4
LVDT 1
LVDT 2
4
5
Fig.B.3 - 16. Strain gauges, LVDTs locations and loaded diagonal

University of Missouri - Rolla - C.I.E.S. Università degli studi di Genova - D.I.S.E.G.
287
Fig. B.3 – 17. Load vs. diagonal displacement
(a) Wall CLW5 after being tested (front) (b) Crushing of the corner (back)
Fig.B.3 - 18. Wall CLW5 after failure
FRONT
0
50
100
150
200
250
300
350
400
450
-20 -15 -10 -5 0 5 10 15 20
Displacement (mm)
In-P
lane
Loa
d (k
N)
0 90
0° 90°
BACK F B
BACK
0
50
100
150
200
250
300
350
400
450
-20 -15 -10 -5 0 5 10 15 20
Displacement (mm)
In-P
lane
Loa
d (k
N)
0 90
90° 0°
BACK F B

University of Missouri - Rolla - C.I.E.S. Università degli studi di Genova - D.I.S.E.G.
288
0
50
100
150
200
250
300
350
400
450
-0.01 -0.008 -0.006 -0.004 -0.002 0 0.002 0.004 0.006
Strain [%]
Load
[kN
]
Strain 4
Strain 5
Strain 3
Strain 2
Strain 1
Fig.B.3 - 19. Load vs. strain
Wall CLW6
BACK
1
2
3
4
5
LVDT 1
LVDT 2
LVDT 4
LVDT 3
FRONT
Fig.B.3 - 20. Strain gauges, LVDTs locations and loaded diagonal
FRONT
0
100
200
300
400
500
600
700
-20 -15 -10 -5 0 5 10 15 20
Displacement (mm)
In-P
lane
Loa
d (k
N)
0 90
90° 0°
FRONT/BACK F B

University of Missouri - Rolla - C.I.E.S. Università degli studi di Genova - D.I.S.E.G.
289
Fig.B.3 - 21. Load vs. diagonal displacement
Fig.B.3 - 22. Wall CLW6 after failure (front)
0
100
200
300
400
500
600
700
0 0.1 0.2 0.3 0.4 0.5 0.6 0.7 0.8
Strain [%]
Load
[kN
]
Strain 4
Strain 5
Fig.B.3 - 23. Load vs. strain
BACK
0
100
200
300
400
500
600
700
-20 -15 -10 -5 0 5 10 15 20
Displacement (mm)
In-P
lane
Loa
d (k
N)
0 90
0° 90°
FRONT/BACK F B

University of Missouri - Rolla - C.I.E.S. Università degli studi di Genova - D.I.S.E.G.
290
APPENDIX B.4: Mechanism of Failure
(a) (b)
Fig.B.4 - 1. Splitting of clay units in wall CLW1
Fig.B.4 - 2. Horizontal phase
1-Initial cracking
2-Loss of bonding between epoxy and masonry

University of Missouri - Rolla - C.I.E.S. Università degli studi di Genova - D.I.S.E.G.
291
Fig.B.4 - 3. Delamination of GFRP laminates
(a) (b)
Fig.B.4 - 4. Cracks detected in wall CLW5
Tab. B.4 - 1. Comparison of Pseudo-ductility for Series CLW
Specimen In-Plane Load [kN] γu [°] γy [°] µ
CLW1 307 0.03 0.03 1.0 CLW2 306 0.02 0.02 1.0 CLW3 406 0.38 0.05 7.6 CLW4 319 0.6 0.09 6.7
Note: 1kN = 0.2248 kip

University of Missouri - Rolla - C.I.E.S. Università degli studi di Genova - D.I.S.E.G.
292

University of Missouri - Rolla - C.I.E.S. Università degli studi di Genova - D.I.S.E.G.
293
APPENDIX C: POST -TENSIONING

University of Missouri - Rolla - C.I.E.S. Università degli studi di Genova - D.I.S.E.G.
294
APPENDIX C.1: Tensioning and Anchor Devices
ITEM # 1: WEDGE
1
1+12
2
38
38
38
1+12
316
4
1+1 64 53 64
1+ 164
ITEM # 5: SPREADER OF LOAD
of the diameters of the pipe ( item #8 )The diameters of the hole are function
OPTION 3OPTION 2OPTION 1
WOODRUFF KEY
PIPE
WELDING
38 to 12
( For the woodruf cutter see ITEM # 8 )
( Choose the cheaper option )
ITEM # 3: PIPE
1
11
58
Can be the same pipe as item # 8 without woodruff cutter
ITEM # 4: SPREADER OF LOAD
58
38 to 12
45 8
4
ITEM # 2: CHUCK
3
3364 to 9
161+ 164 to 1+ 1
16
1+3 4
1+3 4
364 to 5
64
1+1 64
39 64
The diameters of the slot are functionof the diameters of the pipe (item # 8 )
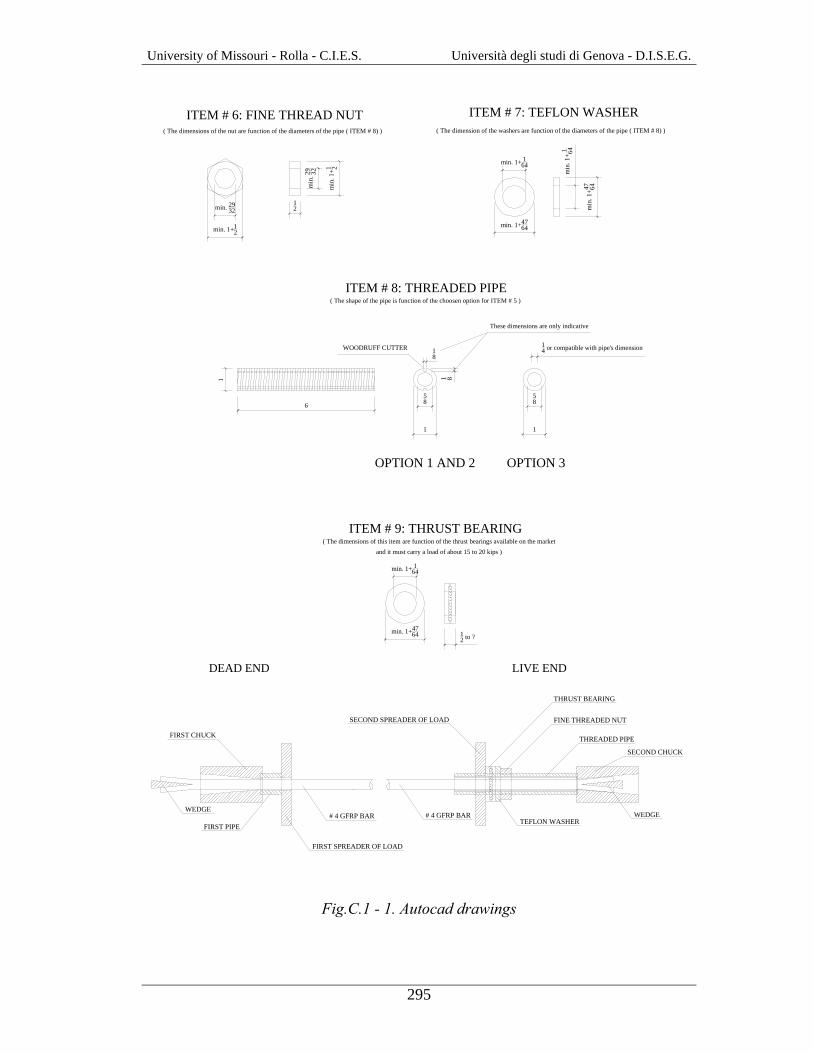
University of Missouri - Rolla - C.I.E.S. Università degli studi di Genova - D.I.S.E.G.
295
Fig.C.1 - 1. Autocad drawings
min. 2932
min. 1+12
min
. 1+1 2
min
. 29 32
12
ITEM # 6: FINE THREAD NUT( The dimensions of the nut are function of the diameters of the pipe ( ITEM # 8) )
6
1
1
58
18
1 8
ITEM # 8: THREADED PIPE
WOODRUFF CUTTER
These dimensions are only indicative
( The shape of the pipe is function of the choosen option for ITEM # 5 )
1
58
OPTION 1 AND 2 OPTION 3
14 or compatible with pipe's dimension
ITEM # 9: THRUST BEARING( The dimensions of this item are function of the thrust bearings available on the market
12 to ?
and it must carry a load of about 15 to 20 kips )
min. 1+4764
min. 1+ 164
min. 1+ 164
min
. 1+
1 64
min. 1+4764
min
. 1+47 64
ITEM # 7: TEFLON WASHER( The dimension of the washers are function of the diameters of the pipe ( ITEM # 8) )
WEDGE
FIRST SPREADER OF LOAD
FIRST PIPE# 4 GFRP BAR
FIRST CHUCK
TEFLON WASHER# 4 GFRP BAR
SECOND SPREADER OF LOAD
WEDGE
THRUST BEARING
THREADED PIPE
FINE THREADED NUT
SECOND CHUCK
DEAD END LIVE END

University of Missouri - Rolla - C.I.E.S. Università degli studi di Genova - D.I.S.E.G.
296
Fig. C.1 - 2. The chuck Fig. C.1 - 3. The wedges
Fig.C.1 - 4. The rope heater Fig.C.1 - 5. The thermo controller
Fig.C.1 - 6. Wrapping of the GFRP Rod
ROPE HEATER

University of Missouri - Rolla - C.I.E.S. Università degli studi di Genova - D.I.S.E.G.
297
Fig.C.1 - 7. Test setup
Fig.C.1 - 8. Driving the wedge
Fig.C.1 - 9. Final results with different Fig.C.1 - 10. Anchoring of the bar in heating times the chuck
THERMOCOUPLE
ROPE HEATER
CONTROLLER
GFRP ROD
STEEL WEDGE
SOFTENED END

University of Missouri - Rolla - C.I.E.S. Università degli studi di Genova - D.I.S.E.G.
298
Fig.C.1 - 11. Assembled items Fig.C.1- 12. Loading procedure
DEAD END LIVE END
MEMBER TO BE TENSIONED

University of Missouri - Rolla - C.I.E.S. Università degli studi di Genova - D.I.S.E.G.
299
APPENDIX C.2: Tensile Tests
(a) Universal testing machine (b) Positioning of the anchors
Fig. C.2 - 1. Universal testing machine and anchor positioning
FIRST CHUCK
3
3364 to 9
16
1+3 4
1+3 4
364 to 5
64
1+1 64
39 64
REDESIGNED CHUCK
364 to 5
64
1+3 4
1+3 4
2332
3
12
39 64 1+1 64
1+ 164 to 1+ 1
16
Fig. C.2 - 2. Chuck drawings
(a) Test with the first chuck (b) Test with the redesigned chuck
Fig. C.2 - 3. Bar after failure
WEDGE
STEEL PLATE
CROSSHEAD
CHUCK
CROSSHEADS

University of Missouri - Rolla - C.I.E.S. Università degli studi di Genova - D.I.S.E.G.
300
APPENDIX C.3: Long Term Tests
Test Setup
(a) Test setup: general view (b) Detail of the pressure transducer
Fig. C.3 - 1. Test setup
Test Results
Fig. C.3 - 2. Load vs. time for testing time equal to 6 hours
0
5
10
15
20
25
30
35
0 1 2 3 4 5 6
Time [hours]
Load
[kN
]
DATA ACQUISITION SYSTEM

University of Missouri - Rolla - C.I.E.S. Università degli studi di Genova - D.I.S.E.G.
301
Fig. C.3 - 3. Load vs. time for testing time equal to 12 hours
Fig. C.3 - 4. Load vs. time for testing time equal to 24 hours
0
5
10
15
20
25
30
35
0 3 6 9 12
Time [hours]
Load
[kN
]
0
5
10
15
20
25
30
35
0 3 6 9 12 15 18 21 24
Time [hours]
Load
[kN
]

University of Missouri - Rolla - C.I.E.S. Università degli studi di Genova - D.I.S.E.G.
302
APPENDIX C.4: Validation of the System
Test Setup
(a) Test setup: general view (b) Dead end and pressure transducer
Fig. C.4 - 1. Test setup
Test Results
Fig. C.4 - 2. Load vs. mid span deflection
0
5
10
15
20
25
30
35
40
0 5 10 15 20 25 30 35 40
Deflection [mm]
Load
[kN
]

University of Missouri - Rolla - C.I.E.S. Università degli studi di Genova - D.I.S.E.G.
303
Fig. C.4 - 3. Load vs. time: loading to failure
FINAL SHAPE AFTER RECOVERY INITIAL DEFORMED SHAPEOF DEFLECTION
PRE-STRESSING
VERTICAL LOAD
LOAD
LVDT
FINAL DEFLECTION
INITIAL DEFLECTION
REC
OV
ERY
DETAIL A
DETAIL A
Fig. C.4 - 4. Position of the LVDT and detail of the valuation of recovery of deflection
0
10
20
30
40
50
60
0 5 10 15 20 25 30
Time [hours]
Load
[kN
]

University of Missouri - Rolla - C.I.E.S. Università degli studi di Genova - D.I.S.E.G.
304
(a) Cracks before post-tensioning (b) Cracks after post-tensioning
Fig. C.4 - 5. Effectiveness of the post-tensioning technique
Tab. C.4 – 1. Ultimate loads
Test Number Ultimate Load [kN] 1 49.62 2 44.84 3 48.35
Mean 47.60 Note: 1 kN = 0.2248 kip
Fig. C.4 - 6. Load vs. torque wrench moment
A AB B
0
50
100
150
200
250
0 5 10 15 20 25 30 35 40
Load [kN]
Mom
ent [
Nm
]
Real
Linear Trend

University of Missouri - Rolla - C.I.E.S. Università degli studi di Genova - D.I.S.E.G.
305
APPENDIX C.5: Patent Disclosure UMUW FORM 16C UP&L DISCLOSURE NO: CAMPUS DATE RECEIVED UP&L:
UNIVERSITY OF MISSOURI SYSTEM
PROPRIETARY INFORMATION/INVENTION DISCLOSURE NOTE: This statement shall be treated as confidential information except for specific sections as noted. Except for individuals engaged in the evaluation and approval process, the information will not be divulged to others without proper confidentiality agreements in place, except as required by law. The objective of the form is to obtain the information necessary to determine whether to pursue patent protection for your invention.
SECTION I NONCONFIDENTIAL INFORMATION
1. Nonconfidential title of the work:
ANCHOR SYSTEM FOR THE TENSIONING OF FIBER-REINFORCED POLYMER BARS USED FOR STRUCTURAL STRENGHTENING
2. Nonconfidential lay abstract of invention:
This invention addresses the solution of the tensioning problems of Fiber-Reinforced Polymer (FRP) bars used to take the place of steel rods for structural strengthening. The bars can be manufactured with any fiber type embedded in a thermoplastic resin. The idea is based on the thermoplastic properties of the resin and consists of creating two temporary anchorages at the end of the bar; with these anchors and a screw device the proper amount of tension can be introduced into the bar.
After this tensioning operation, one can bond the bar to the structure with any method used for composite materials (e.g. Near Surface Mounted (NSM) rods or drilled hole through transverse walls filled with epoxy-based paste).
After bonding is completed, one can remove the anchors and the screw device to use them for another bar. In this way, one can cut the bars in situ as desired, and the tendon can be hidden inside the structure. This feature is very important particularly for historical masonry buildings, in which the strengthening system must be the least visible as possible.
3. Nature of work: Machine Process Utility Software____

University of Missouri - Rolla - C.I.E.S. Università degli studi di Genova - D.I.S.E.G.
306
If Software: Have proper copyright markings been utilized? Yes__No__
UNIVERSITY PATENTS & LICENSING OFFICE
509 LEWIS HALL COLUMBIA, MO 65211
(573)882-2821

University of Missouri - Rolla - C.I.E.S. Università degli studi di Genova - D.I.S.E.G.
307
APPENDIX D: MATERIALS AND BOND CHARACTERIZATION

University of Missouri - Rolla - C.I.E.S. Università degli studi di Genova - D.I.S.E.G.
308
APPENDIX D.1: Specimens Preparation (Bond Tests)
(a) Application of primer (b) Application first coat of saturant
(c) Application of AFRP sheets (d) Application of second coat of saturant
(e) Specimens ready (e) Test regions
Fig. D.1 – 1. Specimens preparation

University of Missouri - Rolla - C.I.E.S. Università degli studi di Genova - D.I.S.E.G.
309
APPENDIX D.2: Test Setup (Bond Tests)
Fig. D.2 – 1. Test setup
Fig. D.2 – 2. Picture test setup

University of Missouri - Rolla - C.I.E.S. Università degli studi di Genova - D.I.S.E.G.
310
Fig. D.2 – 3. Typical strain gages location

University of Missouri - Rolla - C.I.E.S. Università degli studi di Genova - D.I.S.E.G.
311
APPENDIX D.3: Test Results (Bond Tests)
Series CA
Fig. D.3 – 1. Strain vs. location – Test CA3-4
Fig. D.3 – 2. Strain vs. location – Test CA3-8
0
0.2
0.4
0.6
0.8
1
1.2
1.4
1.6
-40 0 40 80 120 160 200 240 280 320
distance [mm]
stra
in [%
]
5.3 KN10.0 KN15.0 KN20.1 KN22.2 KN23.8 KN
Unbonded region
0
0.2
0.4
0.6
0.8
1
1.2
1.4
1.6
-40 0 40 80 120 160 200 240 280 320
distance [mm]
stra
in [%
]
5.0 KN10.0 KN15.1 KN20.0 KN22.1 KN24.0 KN26.5 KN
Unbonded region
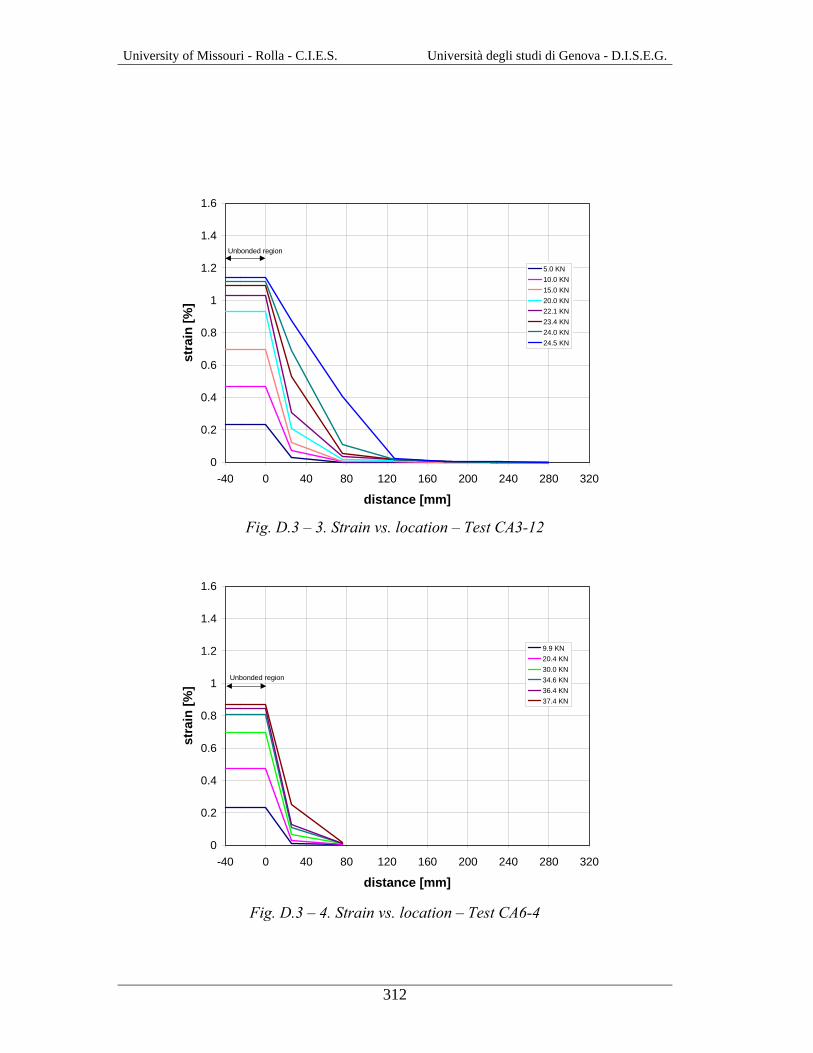
University of Missouri - Rolla - C.I.E.S. Università degli studi di Genova - D.I.S.E.G.
312
Fig. D.3 – 3. Strain vs. location – Test CA3-12
Fig. D.3 – 4. Strain vs. location – Test CA6-4
0
0.2
0.4
0.6
0.8
1
1.2
1.4
1.6
-40 0 40 80 120 160 200 240 280 320
distance [mm]
stra
in [%
]
5.0 KN10.0 KN15.0 KN20.0 KN22.1 KN23.4 KN24.0 KN24.5 KN
Unbonded region
0
0.2
0.4
0.6
0.8
1
1.2
1.4
1.6
-40 0 40 80 120 160 200 240 280 320
distance [mm]
stra
in [%
]
9.9 KN20.4 KN30.0 KN34.6 KN36.4 KN37.4 KN
Unbonded region

University of Missouri - Rolla - C.I.E.S. Università degli studi di Genova - D.I.S.E.G.
313
Fig. D.3 – 5. Strain vs. location – Test CA6-8
Fig. D.3 – 6. Strain vs. location – Test CA6-12
0
0.2
0.4
0.6
0.8
1
1.2
1.4
1.6
-40 0 40 80 120 160 200 240 280 320
distance [mm]
stra
in [%
]
10.0 KN20.0 KN30.0 KN40.4 KN44.0 KN46.2 KN48.2 KN
Unbonded region
0
0.2
0.4
0.6
0.8
1
1.2
1.4
1.6
-40 0 40 80 120 160 200 240 280 320
distance [mm]
stra
in [%
]
10.2 KN20.0 KN30.3 KN40.1 KN44.0 KN46.4 KN47.5 KN48.9 KN
Unbonded region

University of Missouri - Rolla - C.I.E.S. Università degli studi di Genova - D.I.S.E.G.
314
Series BA
Fig. D.3 – 7. Strain vs. location – Test BA3-4
Fig. D.3 – 8. Strain vs. location – Test BA3-8
0
0.2
0.4
0.6
0.8
1
1.2
1.4
1.6
-40 0 40 80 120 160 200 240 280 320
distance [mm]
stra
in [%
]
5.0 KN10.1 KN14.9 KN20.2 KN22.0 KN24.3 KN26.5 KN28.9 KN
Unbonded region
0
0.2
0.4
0.6
0.8
1
1.2
1.4
1.6
-40 0 40 80 120 160 200 240 280 320
distance [mm]
stra
in [%
]
5 KN10 KN15.2 KN20.3 KN22.1 KN24.2 KN26.3 KN27.9 KN
Unbonded region
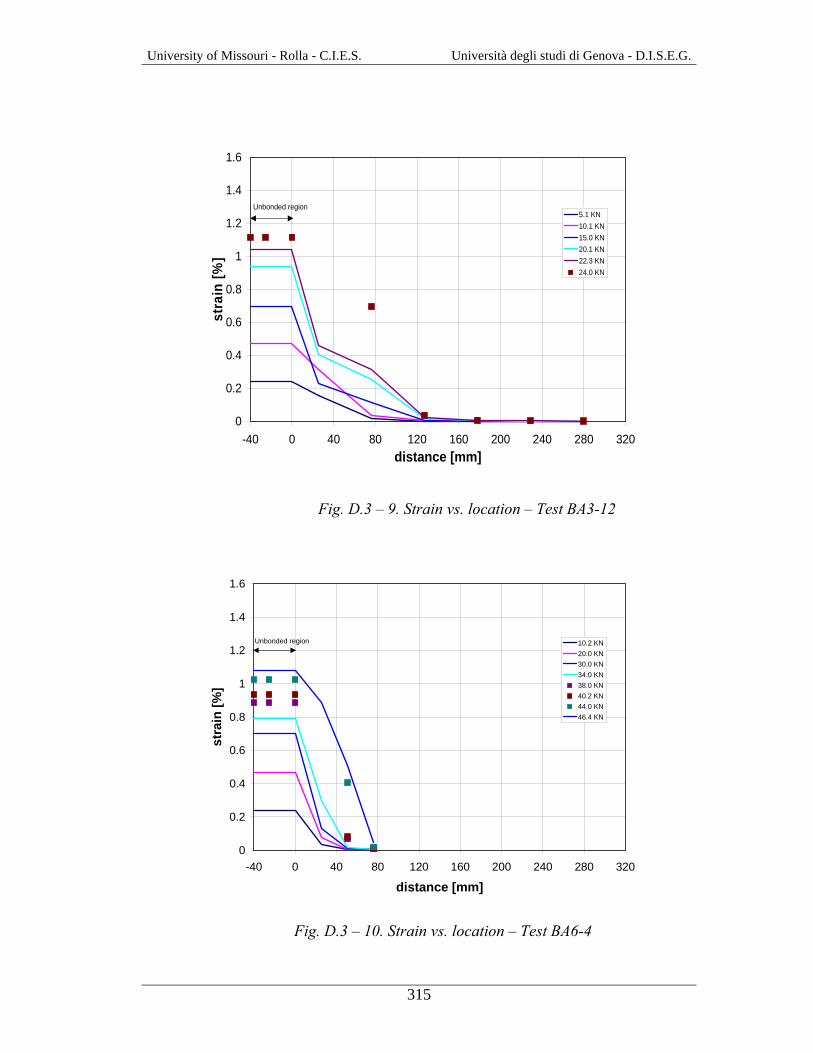
University of Missouri - Rolla - C.I.E.S. Università degli studi di Genova - D.I.S.E.G.
315
Fig. D.3 – 9. Strain vs. location – Test BA3-12
Fig. D.3 – 10. Strain vs. location – Test BA6-4
0
0.2
0.4
0.6
0.8
1
1.2
1.4
1.6
-40 0 40 80 120 160 200 240 280 320distance [mm]
stra
in [%
]5.1 KN10.1 KN15.0 KN20.1 KN22.3 KN24.0 KN
Unbonded region
0
0.2
0.4
0.6
0.8
1
1.2
1.4
1.6
-40 0 40 80 120 160 200 240 280 320
distance [mm]
stra
in [%
]
10.2 KN20.0 KN30.0 KN34.0 KN38.0 KN40.2 KN44.0 KN46.4 KN
Unbonded region

University of Missouri - Rolla - C.I.E.S. Università degli studi di Genova - D.I.S.E.G.
316
Fig. D.3 – 11. Strain vs. location – Test BA6-8
Fig. D.3 – 12. Strain vs. location – Test BA6-8
0
0.2
0.4
0.6
0.8
1
1.2
1.4
1.6
-40 0 40 80 120 160 200 240 280 320
distance [mm]
stra
in [%
]
10.0 KN20.0 KN31.3 KN
0
0.2
0.4
0.6
0.8
1
1.2
1.4
1.6
-40 0 40 80 120 160 200 240 280 320
distance [mm]
stra
in [%
]
10.4 KN20.0 KN31.0 KN40.0 KN41.7 KN43.6 KN44.9 KN46.6 KN
Unbonded region
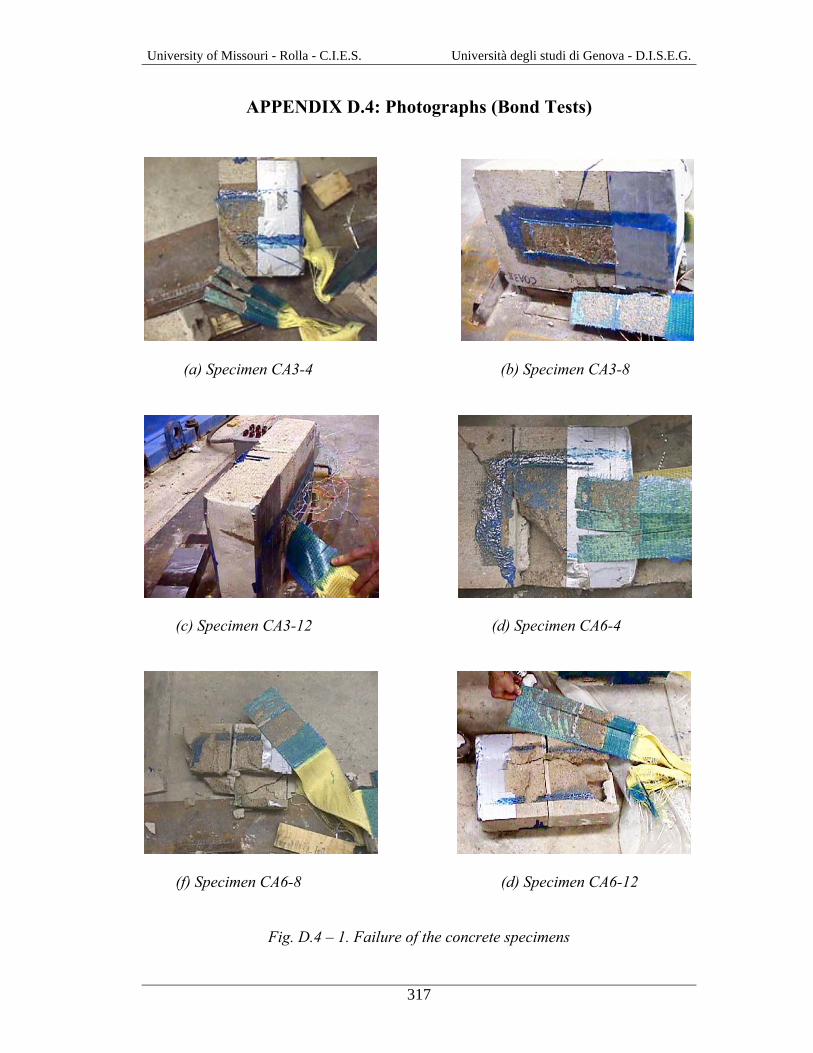
University of Missouri - Rolla - C.I.E.S. Università degli studi di Genova - D.I.S.E.G.
317
APPENDIX D.4: Photographs (Bond Tests)
(a) Specimen CA3-4 (b) Specimen CA3-8
(c) Specimen CA3-12 (d) Specimen CA6-4
(f) Specimen CA6-8 (d) Specimen CA6-12
Fig. D.4 – 1. Failure of the concrete specimens

University of Missouri - Rolla - C.I.E.S. Università degli studi di Genova - D.I.S.E.G.
318
(a) Specimen BA3-4 (b) Specimen BA3-12
(c) Specimen BA6-4 (d) Specimen BA6-8
(e) Specimen BA6-12 (g) Specimen BA6-12
Fig. D.4 – 2. Failure of the clay specimens

University of Missouri - Rolla - C.I.E.S. Università degli studi di Genova - D.I.S.E.G.
319
APPENDIX D.5: Specimens Preparation (Putty Tensile Tests)
(a) (b)
Fig. D.5 – 1. Beads
(a) (b)
Fig. D.5 – 2. Preparation of the specimens
Fig. D.5 – 3. Specimen configuration
76.2
12.7
6.35

University of Missouri - Rolla - C.I.E.S. Università degli studi di Genova - D.I.S.E.G.
320
Fig. D.5 – 4. Specimens ready to test
APPENDIX D.6: Test Setup (Putty Tensile Tests)
Fig. D.6 – 1. Test apparatus

University of Missouri - Rolla - C.I.E.S. Università degli studi di Genova - D.I.S.E.G.
321
APPENDIX D.7: Test Results (Putty Tensile Tests)
(a) (b)
(c)
Fig. D.7 – 1. Failure of the specimens
(a) (b)
Figure D.7 – 2. Specimens after the test

University of Missouri - Rolla - C.I.E.S. Università degli studi di Genova - D.I.S.E.G.
322
Fig. D.7 – 3. Example of experimental behavior of the specimens
Tab. D.7. – 1. Young’s Modulus values [MPa]
Beads % Beads diameters
0
1
2
3
4
5
8
10
0.8 mm 1352 1250 1191 1214 1203 1312 1309
1 mm 1237 1376 1251 1167 1256 1413 1299 1.25 mm 1078 1134 1053 1249 1218 1437 1286 1.75 mm 1275 1200 1352 1256 1180 1375 1228 2.25 mm
1319
1239 1350 1373 1433 1050 1233 1070 Note: 1 MPa = 145 psi; 1 mm = 0.03937 in
Tab. D.7. – 2. Stress values [MPa]
Beads % Beads diameters
0
1
2
3
4
5
8
10
0.8 mm 9.595 9.485 9.368 9.407 9.464 9.835 9.896 1 mm 10.650 9.817 9.675 8.295 7.960 9.585 9.272 1.25 mm 9.037 8.610 8.041 9.441 9.284 9.369 9.551 1.75 mm 9.004 9.626 9.160 9.473 9.429 9.467 9.378 2.25 mm
10.398
10.070 8.188 8.079 8.422 7.608 6.999 7.485 Note: 1 MPa = 145 psi; 1 mm = 0.03937 in
0
1
2
3
4
5
6
7
8
9
10
0 0.02 0.04 0.06 0.08 0.1 0.12 0.14 0.16
Strain [mm/mm]
Stre
ss [M
Pa]

University of Missouri - Rolla - C.I.E.S. Università degli studi di Genova - D.I.S.E.G.
323
Tab. D.7 – 3. Strain values [mm/mm]
Beads % Beads diameters
0
1
2
3
4
5
8
10
0.8 mm 0.202 0.199 0.200 0.194 0.189 0.138 0.143 1 mm 0.174 0.178 0.180 0.223 0.221 0.162 0.153 1.25 mm 0.225 0.232 0.232 0.182 0.149 0.147 0.116 1.75 mm 0.177 0.172 0.173 0.165 0.149 0.175 0.172 2.25 mm
0.190
0.196 0.145 0.136 0.136 0.121 0.107 0.135 Note: 1 MPa = 145 psi; 1 mm = 0.03937 in
Fig. D.7. – 4. Comparison between Young’s Modulus for specimens with and without beads.
0
200
400
600
800
1000
1200
1400
1600
0 1 2 3 4 5 6 7 8 9 10
Percentage of beads
You
ng's
Mod
ulus
[MP
a]
0.8 mm
1 mm
1.25 mm
1.75 mm
2.25 mm

University of Missouri - Rolla - C.I.E.S. Università degli studi di Genova - D.I.S.E.G.
324
Fig. D.7 – 5. Comparison between stresses for specimens with and without beads
Fig. D.7 – 6. Comparison between strains for specimens with and without beads
0
2
4
6
8
10
12
0 1 2 3 4 5 6 7 8 9 10
Percentage of beads
Stre
ss [M
Pa]
0.8 mm1 mm1.25 mm1.75 mm2.25 mm
0.00
0.05
0.10
0.15
0.20
0.25
0 1 2 3 4 5 6 7 8 9 10
Percentage of beads
Stra
in [m
m/m
m]
0.8 mm
1 mm
1.25 mm
1.75 mm
2.25 mm

University of Missouri - Rolla - C.I.E.S. Università degli studi di Genova - D.I.S.E.G.
325
Tab. D.7 – 4. Losses of mechanical properties
Virgin Specimen 20% Sand Loss (%)
Young’s Modulus [MPa] 1319 1096 17
Stress [MPa] 10.40 8.52 18
Strain [mm/mm] 0.190 0.126 34
Fig. D.7 – 7. Young’s Modulus, strength and strain as a function of sand percentage
Tab. D.7 – 5. Young’s Modulus values [MPa]
Beads % Beads diameters
0
1
2
3
4
5
8
10
0.8 mm 561 552 581 587 547 687 581
1 mm 676 685 631 594 587 576 606 1.25 mm 569 596 554 698 658 616 685 1.75 mm 629 608 692 564 552 495 522 2.25 mm
687
656 658 641 621 601 565 502 Note: 1 MPa = 145 psi; 1 mm = 0.03937 in
0
0.2
0.4
0.6
0.8
1
1.2
1.4
0 5 10 15 20
Percentage of sand
Nor
mal
ized
Str
ain,
Str
ess
and
You
ng's
M
odul
us
Ei/Eo
Si/So
ei/eo

University of Missouri - Rolla - C.I.E.S. Università degli studi di Genova - D.I.S.E.G.
326
Tab. D.7 – 6. Stress values [MPa]
Beads % Beads diameters
0
1
2
3
4
5
8
10
0.8 mm 4.742 4.492 4.663 4.655 4.337 4.113 4.058 1 mm 4.960 4.775 4.764 3.822 4.224 4.150 4.384 1.25 mm 3.731 3.835 4.150 4.303 4.442 4.415 3.571 1.75 mm 4.122 3.644 3.463 3.879 3.489 3.378 3.252 2.25 mm
4.497
3.307 3.152 2.901 3.408 3.066 3.313 2.672 Note: 1 MPa = 145 psi; 1 mm = 0.03937 in
Tab. D.7 – 7. Strain values [mm/mm]
Beads % Beads diameters
0
1
2
3
4
5
8
10
0.8 mm 0.122 0.117 0.123 0.106 0.116 0.087 0.075 1 mm 0.121 0.121 0.118 0.123 0.140 0.103 0.112 1.25 mm 0.128 0.132 0.127 0.102 0.098 0.103 0.095 1.75 mm 0.106 0.092 0.090 0.105 0.107 0.124 0.118 2.25 mm
0.098
0.121 0.101 0.069 0.092 0.082 0.089 0.086 Note: 1 MPa = 145 psi; 1 mm = 0.03937 in
Tab. D.7 – 8. Losses of mechanical properties
Virgin Specimen 20% Sand Loss (%)
Young’s Modulus [MPa] 1319 1096 17
Stress [MPa] 10.40 8.52 18
Strain [mm/mm] 0.190 0.126 34

University of Missouri - Rolla - C.I.E.S. Università degli studi di Genova - D.I.S.E.G.
327
APPENDIX D.8: Durability Tests (Putty)
Fig D.8 – 1. Accelerated aging in alkaline solutions for T = 60 ºC (140 ºF)
(a) (b) Fig. D.8 – 2. Failure of the specimens
0
5
10
15
20
25
30
35
0 5 10 15 20 25 30 35 40 45 50
Accelerate aging (days)
Rea
l con
ditio
ns (y
ears
)

University of Missouri - Rolla - C.I.E.S. Università degli studi di Genova - D.I.S.E.G.
328
Tab. D.8 – 1. Young’s Modulus values [MPa]
Beads % Beads diameters
0
1
2
3
4
5
8
10
0.8 mm 561 552 581 587 547 687 581
1 mm 676 685 631 594 587 576 606 1.25 mm 569 596 554 698 658 616 685 1.75 mm 629 608 692 564 552 495 522 2.25 mm
687
656 658 641 621 601 565 502 Note: 1 MPa = 145 psi; 1 mm = 0.03937 in
Tab. D.8 – 2. Stress values [MPa]
Beads % Beads diameters
0
1
2
3
4
5
8
10
0.8 mm 4.742 4.492 4.663 4.655 4.337 4.113 4.058 1 mm 4.960 4.775 4.764 3.822 4.224 4.150 4.384 1.25 mm 3.731 3.835 4.150 4.303 4.442 4.415 3.571 1.75 mm 4.122 3.644 3.463 3.879 3.489 3.378 3.252 2.25 mm
4.497
3.307 3.152 2.901 3.408 3.066 3.313 2.672 Note: 1 MPa = 145 psi; 1 mm = 0.03937 in
Tab. D.8 – 3. Strain values [mm/mm]
Beads % Beads diameters
0
1
2
3
4
5
8
10
0.8 mm 0.122 0.117 0.123 0.106 0.116 0.087 0.075 1 mm 0.121 0.121 0.118 0.123 0.140 0.103 0.112 1.25 mm 0.128 0.132 0.127 0.102 0.098 0.103 0.095 1.75 mm 0.106 0.092 0.090 0.105 0.107 0.124 0.118 2.25 mm
0.098
0.121 0.101 0.069 0.092 0.082 0.089 0.086 Note: 1 MPa = 145 psi; 1 mm = 0.03937 in

University of Missouri - Rolla - C.I.E.S. Università degli studi di Genova - D.I.S.E.G.
329
Fig. D.8 – 3. Comparison between Young’s Modulus for specimens with and without beads
Fig. D.8 – 4. Comparison between stresses for specimens with and without beads
0
200
400
600
800
1000
1200
1400
1600
0 1 2 3 4 5 6 7 8 9 10
Percentage of beads
Youn
g's
Mod
ulus
[MPa
]0.8 mm
1 mm
1.25 mm
1.75 mm
2.25 mm
0
2
4
6
8
10
12
0 1 2 3 4 5 6 7 8 9 10
Percentage of beads
Stre
ss [M
Pa]
0.8 mm
1 mm1.25 mm
1.75 mm2.25 mm

University of Missouri - Rolla - C.I.E.S. Università degli studi di Genova - D.I.S.E.G.
330
Fig. D.8 – 5. Comparison between strains for specimens with and without beads
Tab. D.8 – 4. Values for the specimens with the sand
0% 5% 10% 15% 20% Young’s Modulus [MPa] 680.6 687.0 677.4 760.8 876.8
Stress [MPa] 4.497 3.786 3.584 3.631 3.433
Strain [mm/mm] 0.098 0.113 0.078 0.073 0.081 Note: 1 MPa = 145 psi; 1 mm = 0.03937 in
0.00
0.05
0.10
0.15
0.20
0.25
0 1 2 3 4 5 6 7 8 9 10
Percentage of beads
Stra
in [m
m/m
m]
0.8 mm1 mm1.25 mm1.75 mm2.25 mm

University of Missouri - Rolla - C.I.E.S. Università degli studi di Genova - D.I.S.E.G.
331
Fig. D.8 – 6. Comparison between the behavior of a specimen at 0 and 21 days
Fig. D.8 – 7. Young’s modulus, stresses and strains for specimens with and without sand
0
2
4
6
8
10
0 0.02 0.04 0.06 0.08 0.1 0.12 0.14 0.16
Strain [mm/mm]
Stre
ss [M
Pa]
0 days
21 days
0
0.2
0.4
0.6
0.8
1
1.2
1.4
0 5 10 15 20
Percentage of sand
Nor
mal
ized
Stra
in, S
tress
and
You
ng's
M
odul
us
Ei/Eo
Si/So
ei/eo

University of Missouri - Rolla - C.I.E.S. Università degli studi di Genova - D.I.S.E.G.
332
Gravimetric Measurements
Fig. D.8 – 8. Typical absorption behavior of FRP composites
Fig. D.8 - 9. Precision scale Fig. D.8 – 10. Alkaline bath
Moi
stur
e co
nten
t (%
)
Square root of time (min)
Mm
M2
M1
√t2 √t1
Fickian Diffusion

University of Missouri - Rolla - C.I.E.S. Università degli studi di Genova - D.I.S.E.G.
333
Fig. D.8 – 11. Absorption behavior of putty with beads of 0.8 mm
Fig. D.8 – 12. Absorption behavior of putty with beads of 1 mm
-1
-0.5
0
0.5
1
1.5
2
2.5
0 50 100 150 200 250
Square root of time (min)
Moi
stur
e co
nten
t (%
) P 0P 0.8-1P 0,8-2P 0,8-3P 0,8-4P 0,8-5P 0,8-8P 0,8-10
-1
-0.5
0
0.5
1
1.5
2
2.5
0 50 100 150 200 250
Square root of time (min)
Moi
stur
e co
nten
t (%
)
P 0P 1-1P 1-2P 1-3P 1-4P 1-5P 1-8P 1-10
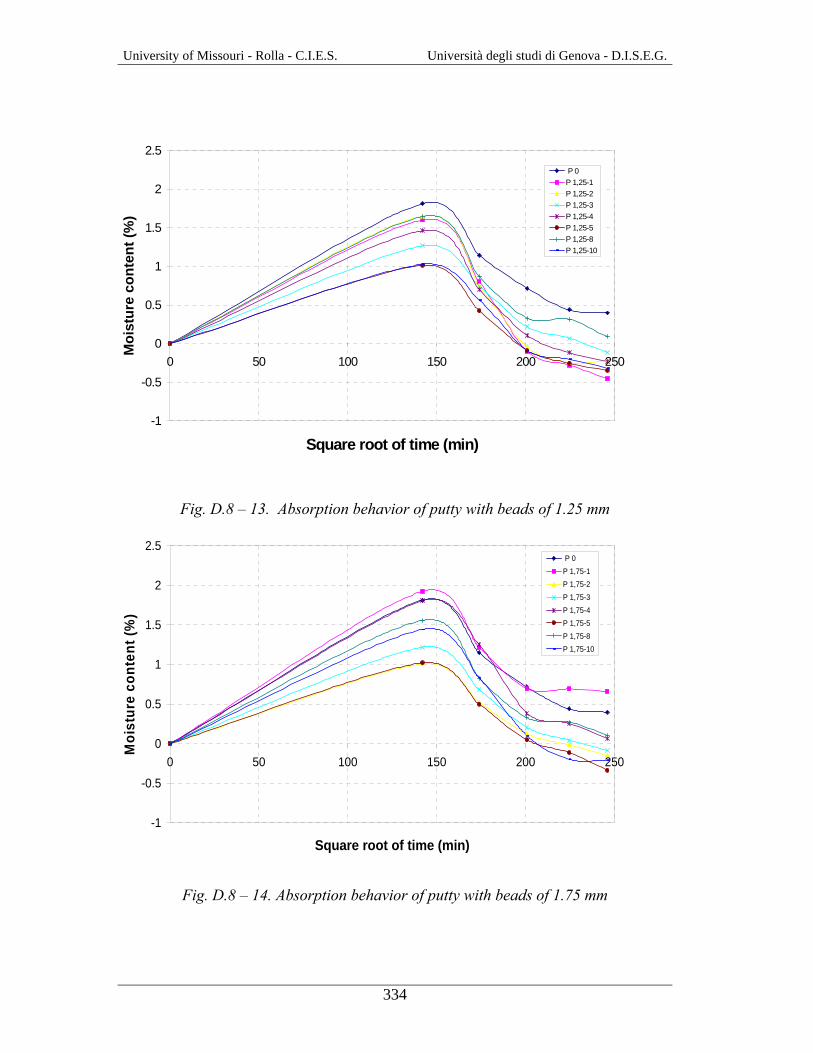
University of Missouri - Rolla - C.I.E.S. Università degli studi di Genova - D.I.S.E.G.
334
-1
-0.5
0
0.5
1
1.5
2
2.5
0 50 100 150 200 250
Square root of time (min)
Moi
stur
e co
nten
t (%
)
P 0P 1,25-1P 1,25-2P 1,25-3P 1,25-4P 1,25-5P 1,25-8P 1,25-10
Fig. D.8 – 13. Absorption behavior of putty with beads of 1.25 mm
Fig. D.8 – 14. Absorption behavior of putty with beads of 1.75 mm
-1
-0.5
0
0.5
1
1.5
2
2.5
0 50 100 150 200 250
Square root of time (min)
Moi
stur
e co
nten
t (%
)
P 0P 1,75-1P 1,75-2P 1,75-3P 1,75-4P 1,75-5P 1,75-8P 1,75-10

University of Missouri - Rolla - C.I.E.S. Università degli studi di Genova - D.I.S.E.G.
335
-1
-0.5
0
0.5
1
1.5
2
2.5
0 50 100 150 200 250
Square root of time (min)
Moi
stur
e co
nten
t (%
)
P 0P 2,25-1P 2,25-2P 2,25-3P 2,25-4P 2,25-5P 2,25-8P 2,25-10
Fig. D.8 – 15. Absorption behavior of putty with beads of 2.25 mm
Fig. D.8 – 16. Absorption behavior of putty with sand
-1
-0,5
0
0,5
1
1,5
2
2,5
0 50 100 150 200 250
Square root of time (min)
Moi
stur
e co
nten
t (%
)
P S-0
P S-5
P S-10
P S-15
P S-20

University of Missouri - Rolla - C.I.E.S. Università degli studi di Genova - D.I.S.E.G.
336
APPENDIX D.9: Test Specimens (Controlling the Putty)
Tab. D.9 - 1. Thickness of putty for each specimen Specimens Thickness of the
putty [mm] P-0-1 0
P-0-2 0
P-0-3 0
P-0.8-1 0.8
P-0.8-2 0.8
P-0.8-3 0.8
P-1.75-1 1.75
P-1.75-2 1.75
P-1.75-3 1.75
Note: 1 mm = 0.03937 in
(a) (b)
(c) (d)

University of Missouri - Rolla - C.I.E.S. Università degli studi di Genova - D.I.S.E.G.
337
(e) (f)
Fig. D.9 – 1. Preparation of the specimens
APPENDIX D.10: Test Setup (Controlling the Putty)
FRP WIDTH
CLAY BRICKS
AFRP SHEETTEST REGION
Fig. D.10 – 1. .Scheme of the generic test specimens
(a) (b)
Fig. D.10 – 2. Preparation of the setup

University of Missouri - Rolla - C.I.E.S. Università degli studi di Genova - D.I.S.E.G.
338
Fig. D.10 – 3. Generic test configuration
APPENDIX D.11: Test Results (Controlling the Putty)
Tab. D.11 – 1. Values for the specimens
Specimens Load [kN] Load Average [kN]
P-0-1 13,5
P-0-2 n.d.
P-0-3 10,1
11.8
P-0.8-1 12,7
P-0.8-2 12,3
P-0.8-3 13,5
11.7
P-1.75-1 12,5
P-1.75-2 11,9
P-1.75-3 14,1
12.8
Note: 1kN = 0.228 kip

University of Missouri - Rolla - C.I.E.S. Università degli studi di Genova - D.I.S.E.G.
339
(a) (b)
Fig. D.11 – 1. Failure of the specimens
Fig. D.11 – 2. behavior of the load in function of the thickness of putty
10
11
12
13
14
0 0.2 0.4 0.6 0.8 1 1.2 1.4 1.6 1.8
thickness of putty [mm]
Load
[kN
]

University of Missouri - Rolla - C.I.E.S. Università degli studi di Genova - D.I.S.E.G.
340

University of Missouri - Rolla - C.I.E.S. Università degli studi di Genova - D.I.S.E.G.
341
BIBLIOGRAPHY American Concrete Institute (ACI), Committee 440 (2001). “Guide for the design and
construction of concrete reinforced with FRP bars”. American Concrete Institute (ACI), Committee 440 (2001). “Guide for the design and
construction of externally bonded FRP system for strengthening concrete structures” (document under review).
American Concrete Institute, Masonry Standard Joint Committee (1999). “Code,
Specifications and Commentaries, ACI-530-99/ASCE 5-99/ TMS 402-99”, American Concrete Institute, American Society of Civil Engineering, The Masonry Society, Detroit, New York and Boulder, 1999.
Angel R., Abrams D.P., Shapiro D., Uzarski J. Webster M. (1994). “Behavior of
reinforced concrete frames with masonry infills”. Structural research series report No. 589, Department of Civil Engeneering, University of Illinois at Urbana-Champaign, March 1994.
ASTM D3039 (1987), American Society for Testing and Materials, "Tensile
Properties of Advanced Composites Materials”. ASTM C1019 (1993), American Society for Testing and Materials, “Test Method
of Sampling and Testing Grout”. ASTM E111 (1997), American Society for Testing and Materials, “Standard Test
Method for Young’s Modulus, Tangent Modulus, and Chord Modulus”. ASTM C1314 (1998), American Society for Testing and Materials, "Standard
Test Method for Constructing and Testing Masonry Prisms Used to Determine Compliance with Specified Compressive Strength of Masonry."
ASTM C270 (1998), American Society for Testing and Materials, "Standard
Specification of Mortar for Unit Masonry". ASTM E518 (2001), American Society for Testing and Materials, “Test Method
E518-00a Standard Test Methods for Flexural Bond Strength of Masonry”. ASTM 638 (2000), American Society for Testing and Materials, “Standard Test
Method for Tensile Properties of Plastics”. Baker L.R., Franken G.L. (1978). “Precracking behavior of laterally loaded
brickwork panels with In-Plane restraints”. Proceedings of the British Ceramic Society, No. 27, 1978.

University of Missouri - Rolla - C.I.E.S. Università degli studi di Genova - D.I.S.E.G.
342
Bank, L.C., (1993) “Properties of FRP Reinforcements for Concrete: Fiber-Reinforced-Plastic (FRP) Reinforcement for Concrete Structures: Properties and Applications”, A.C. Nanni, ed., Elsevier Science Publishers B.V., Amsterdam, 1993.
Burgoyne, C.J., (1993) “Advanced Composites in Construction”, lecture given at the
Pennsylvania State University, 26 August 1993. C.I.E.S. report – University of Missouri Rolla. Chajes, M.J., Finch W.W.Jr, Januszka T.F., and Thomson T.A. (1996). “Bond and
force transfer of composite materials plates bonded to concrete”, ACI Structural Journal, ACI, Vol. 93, No. 2.
De Lorenzis L., A. Nanni (2000). “Strengthening of RC structures with near surface
mounted rods”, C.I.E.S. report – University of Missouri Rolla.
De Lorenzis L., Miller B. and Nanni A. (2000). “Bond of FRP laminates to concrete”, ACI Structures Journal, July 2000.
Devalapura, R.K., Gauchel, J.V., Greenwood, M.E., Hankin, A., and Humphrey, T.
(1997), “Long-Term Durability of GFRP Composites in Alkaline Environments”, Proc. 3rd Non-Metallic (FRP) Reinforcement for Concrete Structures, International Symposium, Sapporo, Japan, October 14-16th 1997, Sapporo Japan, Vol.2.
Dixon Troy O. (1994). “Behavior of Anchor/Tendon Systems for Prestressed FRP
Construction”, Pennsylvania State University thesis.
Drysdale G. R., Hamid A. A., Baker R. L. (1999). “Masonry Structures – Behavior and design”, The Masonry Society, Boulder, Colorado.
Ehsani M.R. and Saadatmanesh H. (1996), “Repair and Strengthening of Earthquake-
Damaged Concrete and Masonry Walls with Composite Fabrics”, First International Conference on Composites in Infrastructure ICCI’96, Tucson, Arizona, January 1996.
Erki, M.A. and S.H. Rizkalla, “Anchorages for FRP Reinforcement” Concrete International, ACI, June 1993b.
Franke, L. and Overback, E., (1987), “Loss in strength and damage to glass fibers in
alkaline solutions and cement extracts”, Dur. Build. Mat., No.5, 1987. Gabrielsen B.L., Kaplan K., Wilton C. (1975). “A study of arching in non-reinforced
masonry walls”. SSI 748-1, Scientific Services, Inc., Redwood City, CA, 1975.

University of Missouri - Rolla - C.I.E.S. Università degli studi di Genova - D.I.S.E.G.
343
Ganga Rao, H.V.S., and, Vijay P.V., (1997), “Aging of Structural Composites Under Varying Environmental Conditions”, Proc. 3rd Non-Metallic (FRP) Reinforcement for Concrete Structures, International Symposium, Sapporo, Japan, October 14-16th 1997, Sapporo Japan, Vol.2,
Gerritse, A., and J. Werner, (1988). “ARAPREE: The Prestressing Element
Composed of Resin Bonded Twaron® Fibres”, Manufacturer’s Report, Rijswijk, Netherlands.
Gilstrap J.M., Dolan C.W. (1998). “Out-of-plane bending of FRP reinforced masonry
walls”, Composites science and technology, 1998. Hamilton H.R. III, Holberg A., Caspersen J., and Dolan C.W. (1999), “Strengthening
Concrete Masonry with Fiber Reinforced Polymers”, Fourth International Symposium on Fiber Reinforced Polymer (FRP) for Reinforced Concrete Structures, Baltimore, Maryland, November 1999.
Hendry H.W. (1981), Structural Brickwork. The Macmillan Press Ltd.m London,
1981. Holte, L.E., C.W. Dolan, and R.J. Schmidt, (1993). “Epoxy Socketed Anchors for
Non-Metallic Prestressing Tendons”, ACI SP 138-26, Proceedings of the International Symposium on FRP Reinforcement for Concrete Structures, A.C. Nanni and C.W. Dolan, editors, Vancouver, BC, Canada, 28-31 March 1993.
K. Roko, T.E. Boothby, C.F. Bakis (1999). “Failure modes of sheet bonded fiber
reinforced to brick masonry”, Fourth international symposium on fiber reinforced polymer for RC structures, 1999 (editing by: Charles W. Dolan, Sami H. Rizkalla, and Antonio Nanni).
Laursen P.T., Seible F., Hegemier G.A., and Innamorato D., „Seismic Retrofit and
Repair of Masonry Walls with Carbon Overlays,“ Non-Metallic (FRP) Reinforcement for Concrete Structures, edited by L. Taerwe, RILEM, 1995.
Litherland, K.L., Oakley, D.R., and Proctor, B.A., (1981), “The Use of Accelerated
Ageing Procedures to Predict the Long Term Strength of GRF Composites”, Cement and Concrete Research, Vol. 11
Maeda T., Asano Y., Sato Y., Ueda T., and Kakuta Y. (1997). “A study on bond
mechanism of carbon fiber sheet”, Non-metallic (FRP) reinforcement for concrete structures, Vol. 1, Japan Concrete Institute.
MBrace composite strengthening system engineering design guidelines second
edition (1998). Master Builders, Inc. and Structural Preservation Systems.

University of Missouri - Rolla - C.I.E.S. Università degli studi di Genova - D.I.S.E.G.
344
MDA Composites industries website. www.mdacomposites.org Micelli F., Nanni A. (2001). “Mechanical Properties and Durability of FRP Rods”.
C.I.E.S. report, University of Missouri – Rolla. Miller B. (1999). “Bond between carbon fiber reinforced polymer sheets and
concrete”, UMR thesis, 1999. Morbin A. (2001), “Strengthening of Masonry Elements with FRP Composites”,
C.I.E.S. report, University of Missouri – Rolla. Mukae, K., S. Kumagai, H. Nakai, and H. Asai, (1993). “Characteristics of Aramid
FRP Rod,” ACI SP 138-26, Proceedings of the International Symposium on FRP Reinforcement for Concrete Structures, A.C. Nanni and C.W. Dolan, editors, Vancouver, BC, Canada, 28-31 March 1993.
Nanni A. (1999). “Composites: coming on strong”, Concrete construction, vol. 44,
1999. Pei-Chang H., Nanni A. (1999). “Dapped-end strengthening of precast prestressed
concrete double tee beams with FRP composites”, C.I.E.S. Report – University of Missouri – Rolla.
Post-tensioning institute web site. www.post-tensioning.org. Randy M., Nanni A., Watkins S., Barker M., Bootby T. (1999). “Strengthening of
bridge G-270 with externally bonded CFRP”, C.I.E.S. Report – University of Missouri – Rolla.
Sabnis G.M. (1976). “Interaction between masonry walls and frames in multistory
structures”. First Canadian Masonry Symposium, Calgary, Alberta, 1976. Santoh, Norihiko, (1993). “CFCC (Carbon Fiber Composite Cable): Fiber-
Reinforced-Plastic (FRP) Reinforcement for Concrete Structures: Properties and Applications”, A.C. Nanni, ed., Elsevier Science Publishers B.V., Amsterdam, 1993.
Schwegler G., “Masonry Costruction Strengthened with Fiber Composites in
Seismically Endangered Zones,” Proceedings of the Tenth European Conference on Earthquake Engineering, Rotterdam, 1995.
Taghdi M., Bruneau M., Saatcioglu M. (2000). “Seisming retrofitting of low-rise
masonry and concrete walls using steel strips”. ASCE Journal of Structural Engineering, September 2000.

University of Missouri - Rolla - C.I.E.S. Università degli studi di Genova - D.I.S.E.G.
345
Taljsten B. (1994). “Plate bonding. Strengthening of existing structures with epoxy bonded plates of steel or reinforced plastics”, Doctoral thesis, Lulea University of technology, Sweden.
Tamura, Tomio (1993). “FiBRA: Fiber-Reinforced-Plastic (FRP) Reinforcement for
Concrete Structures: Properties and Applications”, A.C. Nanni, ed., Elsevier Science Publishers B.V., Amsterdam, 1993.
Tinazzi D., Nanni A. (2000). “Assessment of technologies of masonry retrofitting
with FRP”, C.I.E.S. Report – University of Missouri – Rolla. Tumialan G. (2001). “Strengthening of masonry structures with FRP composites”,
Doctoral thesis, University of Missouri – Rolla. Uomoto T., Nishimura T. (1999). “Deterioration of aramid, glass, and carbon fibers
due to alkali, acid and water in different temperature”, Fourth international symposium on fiber reinforced polymer for RC structures, 1999 (editing by: Charles W. Dolan, Sami H. Rizkalla, and Antonio Nanni).
Van Gemert D., Vandewalle L. (2001). “Anchorage of externally bonded steel plates
and CFRP laminates for strengthening of concrete elements”, Doctoral thesis, Katholieke Universiteit Leuven (May 2001).
Velazquez Dimas J.I, Ehsani M.R., and Saadatamtanesh H. (2000). “Out-of-plane
behavior of brick masonry walls strengthened with fiber composites”, ACI Structural Journal, May-June 2000.
Velazquez Dimas J.I, Eshani M.R. (2000). “Modeling out-of-plane behavior of UR
walls retrofitted with fiber composites”, Journal of composites for construction, November 2000.
Vijay, P.V., and Ganga Rao H.V.S., (1999), “Accelerated and Natural Weathering of
Glass Fiber Reinforced Plastic Bars”, Proc. FRPRCS-4, November 1-4th, 1999, Baltimore.
University of Missouri - Rolla - C.I.E.S. Università degli studi di Genova - D.I.S.E.G.
ACKNOWLEDGEMENTS We would like to express our appreciations to all the CIES members for their support
throughout our thesis program. It has been an honour and we are very proud to have
worked with Dr. Antonio Nanni for his availability and extreme intelligence. We
would also acknowledge Jaime Gustavo Tumialan, he has been not only a guide with
all his advises, but also a friend with whom share good times. We would recognize
also the support of Harold Martin from Rolla Technical Institute, Mr. Jason Cox, Jeff
Thomas, Steve Gable, Nestore Galati, Sinaph Namboorimadathil, Danielle Stone,
Antonio Morbin, Dr. J. Myers, Dr. P. Silva, Jeff Bradshaw and also Tong Li, Khaled
El-Domiaty, Xianlin Shen, Anand Khataukar, Sharath Murthy, Xinbao Yang and Yumin
Yang.
Special thanks to “the” Parretti, Jason, Nestore, Danielle, Paolo, Sinaph and Antonio
for the beautiful moments spent together.
Thanks to the CIES staff, Mrs. Ravonda McGauley, Mrs. Gayle Spitzmiller, Mrs.
Susan Tripp, and to all our colleagues.
A special thanks to the National Science Foundation Industry/University Cooperative
Research Center, Repair of Buildings and Bridges with Composites at the University
of Missouri-Rolla for providing the financial and material assistance for the
completion of our research as visiting scholars.
We would like to express also our sincere gratitude to Prof. Sergio Lagomarsino from
the University of Genoa - Italy, who gave us the opportunity to do this fantastic
experience in the United States.
Marco, Olly e Ale

University of Missouri - Rolla - C.I.E.S. Universita’ degli studi di Genova - D.I.S.E.G.
1
BIBLIOGRAPHY American Concrete Institute (ACI), Committee 440 (2001). “Guide for the design and
construction of concrete reinforced with FRP bars”. American Concrete Institute (ACI), Committee 440 (2001). “Guide for the design and
construction of externally bonded FRP system for strengthening concrete structures” (document under review).
American Concrete Institute, Masonry Standard Joint Committee (1999). “Code,
Specifications and Commentaries, ACI-530-99/ASCE 5-99/ TMS 402-99”, American Concrete Institute, American Society of Civil Engineering, The Masonry Society, Detroit, New York and Boulder, 1999.
Angel R., Abrams D.P., Shapiro D., Uzarski J. Webster M. (1994). “Behavior of
reinforced concrete frames with masonry infills”. Structural research series report No. 589, Department of Civil Engeneering, University of Illinois at Urbana-Champaign, March 1994.
ASTM D3039 (1987), American Society for Testing and Materials, "Tensile
Properties of Advanced Composites Materials”. ASTM C1019 (1993), American Society for Testing and Materials, “Test Method
of Sampling and Testing Grout”. ASTM E111 (1997), American Society for Testing and Materials, “Standard Test
Method for Young’s Modulus, Tangent Modulus, and Chord Modulus”. ASTM C1314 (1998), American Society for Testing and Materials, "Standard
Test Method for Constructing and Testing Masonry Prisms Used to Determine Compliance with Specified Compressive Strength of Masonry."
ASTM C270 (1998), American Society for Testing and Materials, "Standard
Specification of Mortar for Unit Masonry". ASTM E518 (2001), American Society for Testing and Materials, “Test Method
E518-00a Standard Test Methods for Flexural Bond Strength of Masonry”. ASTM 638 (2000), American Society for Testing and Materials, “Standard Test
Method for Tensile Properties of Plastics”. Baker L.R., Franken G.L. (1978). “Precracking behavior of laterally loaded
brickwork panels with In-Plane restraints”. Proceedings of the British Ceramic Society, No. 27, 1978.

University of Missouri - Rolla - C.I.E.S. Universita’ degli studi di Genova - D.I.S.E.G.
2
Bank, L.C., (1993) “Properties of FRP Reinforcements for Concrete: Fiber-
Reinforced-Plastic (FRP) Reinforcement for Concrete Structures: Properties and Applications”, A.C. Nanni, ed., Elsevier Science Publishers B.V., Amsterdam, 1993.
Burgoyne, C.J., (1993) “Advanced Composites in Construction”, lecture given at the
Pennsylvania State University, 26 August 1993. C.I.E.S. report – University of Missouri Rolla. Chajes, M.J., Finch W.W.Jr, Januszka T.F., and Thomson T.A. (1996). “Bond and
force transfer of composite materials plates bonded to concrete”, ACI Structural Journal, ACI, Vol. 93, No. 2.
De Lorenzis L., A. Nanni (2000). “Strengthening of RC structures with near surface
mounted rods”, C.I.E.S. report – University of Missouri Rolla. De Lorenzis L., Miller B. and Nanni A. (2000). “Bond of FRP laminates to concrete”,
ACI Structures Journal, July 2000. Devalapura, R.K., Gauchel, J.V., Greenwood, M.E., Hankin, A., and Humphrey, T.
(1997), “Long-Term Durability of GFRP Composites in Alkaline Environments”, Proc. 3rd Non-Metallic (FRP) Reinforcement for Concrete Structures, International Symposium, Sapporo, Japan, October 14-16th 1997, Sapporo Japan, Vol.2.
Dixon Troy O. (1994). “Behavior of Anchor/Tendon Systems for Prestressed FRP
Construction”, Pennsylvania State University thesis. Drysdale G. R., Hamid A. A., Baker R. L. (1999). “Masonry Structures – Behavior
and design”, The Masonry Society, Boulder, Colorado. Ehsani M.R. and Saadatmanesh H. (1996), “Repair and Strengthening of Earthquake-
Damaged Concrete and Masonry Walls with Composite Fabrics”, First International Conference on Composites in Infrastructure ICCI’96, Tucson, Arizona, January 1996.
Erki, M.A. and S.H. Rizkalla, “Anchorages for FRP Reinforcement” Concrete
International, ACI, June 1993b. Franke, L. and Overback, E., (1987), “Loss in strength and damage to glass fibers in
alkaline solutions and cement extracts”, Dur. Build. Mat., No.5, 1987. Gabrielsen B.L., Kaplan K., Wilton C. (1975). “A study of arching in non-reinforced
masonry walls”. SSI 748-1, Scientific Services, Inc., Redwood City, CA, 1975.
University of Missouri - Rolla - C.I.E.S. Universita’ degli studi di Genova - D.I.S.E.G.
3
Ganga Rao, H.V.S., and, Vijay P.V., (1997), “Aging of Structural Composites Under
Varying Environmental Conditions”, Proc. 3rd Non-Metallic (FRP) Reinforcement for Concrete Structures, International Symposium, Sapporo, Japan, October 14-16th 1997, Sapporo Japan, Vol.2,
Gerritse, A., and J. Werner, (1988). “ARAPREE: The Prestressing Element
Composed of Resin Bonded Twaron® Fibres”, Manufacturer’s Report, Rijswijk, Netherlands.
Gilstrap J.M., Dolan C.W. (1998). “Out-of-plane bending of FRP reinforced masonry
walls”, Composites science and technology, 1998. Hamilton H.R. III, Holberg A., Caspersen J., and Dolan C.W. (1999), “Strengthening
Concrete Masonry with Fiber Reinforced Polymers”, Fourth International Symposium on Fiber Reinforced Polymer (FRP) for Reinforced Concrete Structures, Baltimore, Maryland, November 1999.
Hendry H.W. (1981), Structural Brickwork. The Macmillan Press Ltd.m London,
1981. Holte, L.E., C.W. Dolan, and R.J. Schmidt, (1993). “Epoxy Socketed Anchors for
Non-Metallic Prestressing Tendons”, ACI SP 138-26, Proceedings of the International Symposium on FRP Reinforcement for Concrete Structures, A.C. Nanni and C.W. Dolan, editors, Vancouver, BC, Canada, 28-31 March 1993.
K. Roko, T.E. Boothby, C.F. Bakis (1999). “Failure modes of sheet bonded fiber
reinforced to brick masonry”, Fourth international symposium on fiber reinforced polymer for RC structures, 1999 (editing by: Charles W. Dolan, Sami H. Rizkalla, and Antonio Nanni).
Laursen P.T., Seible F., Hegemier G.A., and Innamorato D., „Seismic Retrofit and
Repair of Masonry Walls with Carbon Overlays,“ Non-Metallic (FRP) Reinforcement for Concrete Structures, edited by L. Taerwe, RILEM, 1995.
Litherland, K.L., Oakley, D.R., and Proctor, B.A., (1981), “The Use of Accelerated
Ageing Procedures to Predict the Long Term Strength of GRF Composites”, Cement and Concrete Research, Vol. 11
Maeda T., Asano Y., Sato Y., Ueda T., and Kakuta Y. (1997). “A study on bond
mechanism of carbon fiber sheet”, Non-metallic (FRP) reinforcement for concrete structures, Vol. 1, Japan Concrete Institute.
MBrace composite strengthening system engineering design guidelines second
edition (1998). Master Builders, Inc. and Structural Preservation Systems.
University of Missouri - Rolla - C.I.E.S. Universita’ degli studi di Genova - D.I.S.E.G.
4
MDA Composites industries website. www.mdacomposites.org Micelli F., Nanni A. (2001). “Mechanical Properties and Durability of FRP Rods”.
C.I.E.S. report, University of Missouri – Rolla. Miller B. (1999). “Bond between carbon fiber reinforced polymer sheets and
concrete”, UMR thesis, 1999. Morbin A. (2001), “Strengthening of Masonry Elements with FRP Composites”,
C.I.E.S. report, University of Missouri – Rolla. Mukae, K., S. Kumagai, H. Nakai, and H. Asai, (1993). “Characteristics of Aramid
FRP Rod,” ACI SP 138-26, Proceedings of the International Symposium on FRP Reinforcement for Concrete Structures, A.C. Nanni and C.W. Dolan, editors, Vancouver, BC, Canada, 28-31 March 1993.
Nanni A. (1999). “Composites: coming on strong”, Concrete construction, vol. 44,
1999. Pei-Chang H., Nanni A. (1999). “Dapped-end strengthening of precast prestressed
concrete double tee beams with FRP composites”, C.I.E.S. Report – University of Missouri – Rolla.
Post-tensioning institute web site. www.post-tensioning.org. Randy M., Nanni A., Watkins S., Barker M., Bootby T. (1999). “Strengthening of
bridge G-270 with externally bonded CFRP”, C.I.E.S. Report – University of Missouri – Rolla.
Sabnis G.M. (1976). “Interaction between masonry walls and frames in multistory
structures”. First Canadian Masonry Symposium, Calgary, Alberta, 1976. Santoh, Norihiko, (1993). “CFCC (Carbon Fiber Composite Cable): Fiber-
Reinforced-Plastic (FRP) Reinforcement for Concrete Structures: Properties and Applications”, A.C. Nanni, ed., Elsevier Science Publishers B.V., Amsterdam, 1993.
Schwegler G., “Masonry Costruction Strengthened with Fiber Composites in
Seismically Endangered Zones,” Proceedings of the Tenth European Conference on Earthquake Engineering, Rotterdam, 1995.
University of Missouri - Rolla - C.I.E.S. Universita’ degli studi di Genova - D.I.S.E.G.
5
Taghdi M., Bruneau M., Saatcioglu M. (2000). “Seisming retrofitting of low-rise masonry and concrete walls using steel strips”. ASCE Journal of Structural Engineering, September 2000.
Taljsten B. (1994). “Plate bonding. Strengthening of existing structures with epoxy
bonded plates of steel or reinforced plastics”, Doctoral thesis, Lulea University of technology, Sweden.
Tamura, Tomio (1993). “FiBRA: Fiber-Reinforced-Plastic (FRP) Reinforcement for
Concrete Structures: Properties and Applications”, A.C. Nanni, ed., Elsevier Science Publishers B.V., Amsterdam, 1993.
Tinazzi D., Nanni A. (2000). “Assessment of technologies of masonry retrofitting
with FRP”, C.I.E.S. Report – University of Missouri – Rolla. Tumialan G. (2001). “Strengthening of masonry structures with FRP composites”,
Doctoral thesis, University of Missouri – Rolla. Uomoto T., Nishimura T. (1999). “Deterioration of aramid, glass, and carbon fibers
due to alkali, acid and water in different temperature”, Fourth international symposium on fiber reinforced polymer for RC structures, 1999 (editing by: Charles W. Dolan, Sami H. Rizkalla, and Antonio Nanni).
Van Gemert D., Vandewalle L. (2001). “Anchorage of externally bonded steel plates
and CFRP laminates for strengthening of concrete elements”, Doctoral thesis, Katholieke Universiteit Leuven (May 2001).
Velazquez Dimas J.I, Ehsani M.R., and Saadatamtanesh H. (2000). “Out-of-plane
behavior of brick masonry walls strengthened with fiber composites”, ACI Structural Journal, May-June 2000.
Velazquez Dimas J.I, Eshani M.R. (2000). “Modeling out-of-plane behavior of UR
walls retrofitted with fiber composites”, Journal of composites for construction, November 2000.
Vijay, P.V., and Ganga Rao H.V.S., (1999), “Accelerated and Natural Weathering of
Glass Fiber Reinforced Plastic Bars”, Proc. FRPRCS-4, November 1-4th, 1999, Baltimore.