Center for Advanced Studies in Measurement and … for Advanced Studies in Measurement and...
25
Center for Advanced Studies in Measurement and Assessment CASMA Research Report Number 36 Factors Affecting Accuracy of Comparable Scores for Augmented Tests under Common Core State Standards Ja Young Kim † Won-Chan Lee Deborah J. Harris August 2013 † Ja Young Kim is Research Associate, ACT, Inc., 500 ACT Drive, P.O. Box 168, Iowa City, IA 52243 (email: [email protected]). Won-Chan Lee is Associate Professor, Center for Advanced Studies in Measurement and As- sessment (CASMA), 210 Lindquist Center, College of Education, University of Iowa, Iowa City, IA 52242 (email: [email protected]). Deborah J. Harris is Chief Research Scientist, ACT, Inc., 500 ACT Drive, P.O. Box 168, Iowa City, IA 52243 (email: [email protected]).
Transcript of Center for Advanced Studies in Measurement and … for Advanced Studies in Measurement and...

Center for Advanced Studies in
Measurement and Assessment
CASMA Research Report
Number 36
Factors Affecting Accuracy of
Comparable Scores for Augmented Tests
under Common Core State Standards
Ja Young Kim†
Won-Chan Lee
Deborah J. Harris
August 2013
†Ja Young Kim is Research Associate, ACT, Inc., 500 ACT Drive, P.O.Box 168, Iowa City, IA 52243 (email: [email protected]). Won-Chan Leeis Associate Professor, Center for Advanced Studies in Measurement and As-sessment (CASMA), 210 Lindquist Center, College of Education, University ofIowa, Iowa City, IA 52242 (email: [email protected]). Deborah J. Harrisis Chief Research Scientist, ACT, Inc., 500 ACT Drive, P.O. Box 168, Iowa City,IA 52243 (email: [email protected]).

Kim, Lee, and Harris Linking Augmented Tests
Center for Advanced Studies inMeasurement and Assessment (CASMA)
College of EducationUniversity of IowaIowa City, IA 52242Tel: 319-335-5439Web: www.education.uiowa.edu/casma
All rights reserved
ii
Kim, Lee, and Harris Linking Augmented Tests
Contents
1 Introduction 1
2 Theoretical Framework 12.1 Definition of Equating and Linking . . . . . . . . . . . . . . . . . 12.2 Issues for Linking Augmented Tests in the CINEG Design . . . . 2
3 Method 33.1 Data Source and Analysis . . . . . . . . . . . . . . . . . . . . . . 33.2 Study Factors . . . . . . . . . . . . . . . . . . . . . . . . . . . . . 5
3.2.1 Common-item Effect Size (CES) . . . . . . . . . . . . . . 53.2.2 Differential Effect Size (DES) . . . . . . . . . . . . . . . . 53.2.3 Latent-Trait Correlations between Common Assessment
and State-Specific Item Set . . . . . . . . . . . . . . . . . 73.2.4 Differential Latent-Trait Correlations between Common
Assessment and State-Specific Item Set . . . . . . . . . . 73.2.5 Equating Methods . . . . . . . . . . . . . . . . . . . . . . 8
3.3 Evaluation . . . . . . . . . . . . . . . . . . . . . . . . . . . . . . . 8
4 Results 10
5 Discussion 16
6 References 18
iii

Kim, Lee, and Harris Linking Augmented Tests
List of Tables
1 Descriptive Statistics for Single Group Pseudo-Data Analyses . . 112 Descriptive Statistics for Item Parameters for New Test and Old
Test in Simulated Data Analyses . . . . . . . . . . . . . . . . . . 113 Averaged Summary Statistics for Group Ability Difference and
Differential Effect Size . . . . . . . . . . . . . . . . . . . . . . . . 124 WBIAS for Comparison of Group Ability Difference and Differ-
ential Effect Size . . . . . . . . . . . . . . . . . . . . . . . . . . . 135 Averaged Summary Statistics for Group Ability Difference and
Equating Methods . . . . . . . . . . . . . . . . . . . . . . . . . . 146 Averaged Summary Statistics for Latent-Trait Correlations and
Differential Latent-Trait Correlations . . . . . . . . . . . . . . . . 14
List of Figures
1 Construction of Augmented Tests . . . . . . . . . . . . . . . . . . 42 Visual Explanation of CES and DES. . . . . . . . . . . . . . . . . 73 Conditional Bias of Latent-Trait Correlations Using FE for CES
0.2 . . . . . . . . . . . . . . . . . . . . . . . . . . . . . . . . . . . 154 Conditional Bias of Latent-Trait Correlations Using TS for CES
0.4 . . . . . . . . . . . . . . . . . . . . . . . . . . . . . . . . . . . 16
iv

Kim, Lee, and Harris Linking Augmented Tests
Abstract
This paper examined various factors affecting linking accuracy of the aug-mented tests containing both common assessments and state-specific item setsin the context of the Common Core State Standards (CCSS). Linking was con-ducted using the common-item nonequivalent groups design with pseudo andsimulated data. The factors included group ability differences, differential effectsizes, latent-trait correlations, differential latent-trait correlations between thecommon assessment and state-specific item set, and different equating methods(classical and IRT equating). Higher latent-trait correlation between the com-mon assessment and state-specific item set was associated with smaller bias,and if the latent-trait correlation exceeded 0.8, IRT equating methods providedadequate linking even though the group ability difference was large and thedifferential effect size was moderately large. The same latent-trait correlationsfor the old and new tests resulted in smaller bias than differential latent-traitcorrelations for the old and new tests.
v
Kim, Lee, and Harris Linking Augmented Tests
1 Introduction
The U.S. Department of Education has awarded Race to the Top grants to twostate-led consortia: the Partnership for the Assessment of Readiness for Col-lege and Careers (PARCC) and the Smarter Balanced Assessment Consortium(SBAC), to develop assessments based on the Common Core State Standards(CCSS). A common assessment that measures the CCSS must provide results onthe common standards that are comparable across states. If the common assess-ment does not cover state-specific standards, states are allowed to add up to anadditional 15% of content or items (Achieve, 2010; Cizek, 2010). Therefore, itis likely that at least some states may design augmented tests that contain boththe common assessment and state-specific items (Lazer, Mazzeo, Way, Twing,Camara, & Sweeney, 2010). Currently, 11 states plan to add state-determinedstandards to the CCSS (Center on Education Policy [CEP], 2012).
Large scale assessments require multiple forms that are similar in contentand statistical specifications to maintain test security over time. In order to usescores obtained from alternate forms interchangeably, the reported scores fromeach form should be on a common scale which is usually accomplished by aprocess called test equating and linking. However, it is complicated to link theaugmented tests that include both common assessment and state-specific itemsets across different administrations within a state and to concord them acrossdifferent states. This is because the state-specific item set is likely to vary acrossstates and the items could change depending on how much the CCSS overlapthe state-specific standards. Furthermore, students will perform differently onthe common assessment and state-specific item set because the two parts ofthe augmented test are developed based on different standards; the commonassessment is developed based on the CCSS while the state-specific item set isconstructed based on state standards. At the same time, dimensionality issuesalso would exist because the augmented test measures two different standards.
Given the context above, this study was aimed to investigate the effect ofthe relationship between the common assessment and state-specific item sets onlinking accuracy under different characteristics of examinees in proficiency onthe two parts of the augmented tests using different equating methods.
2 Theoretical Framework
2.1 Definition of Equating and Linking
Kolen and Brennan (2004) refer to equating as a statistical process of adjustingscores to account for small differences in difficulty across test forms. Scoreequating is crucial for any large scale assessment programs that require multipletest forms in order to obtain comparability of scores on test forms. To conductequating, the test forms should be similar in difficulty and content. Linking is analternative to equating when two different tests are developed based on differentspecifications (Kolen & Brennan, 2004). If the states want to compare scores
1

Kim, Lee, and Harris Linking Augmented Tests
on augmented tests that include both the common assessment and the state-specific item sets, linking generally may be used since content specificationsfor the state-specific item sets may differ over time depending on the contentcovered in the common assessment. There are three popular data collectiondesigns for equating and linking: single group design, random groups design,and common item non-equivalent groups (CINEG) design. This study focuseson the CINEG data collection design, in which two test forms have a set ofitems in common, which are administered to different samples from differentpopulations (Kolen & Brennan, 2004).
The U.S. Department of Education requires comparability of scores on theassessment across states within each consortium (Oregon Department of Edu-cation, 2011). To maintain comparability of scores on the common assessment,common items or common examinees across different test forms would be re-quired. Since the PARCC proposed a plan to use multiple fixed test forms acrossyears, grades, and states, common item links could be used to link the PARCCtest forms (Luecht & Camara, 2011). Therefore, the CINEG design was used asthe data collection method for the common assessment in this study. Note thatthe state-specific item sets would vary depending on the degree to which theCCSS are similar to the state-specific standards, whereas the common assess-ments measure the same CCSS and have similar statistical specifications, acrossyears, grades, and states. Therefore, the common assessment has the same orparallel test forms, but the state-specific item sets are more varied.
2.2 Issues for Linking Augmented Tests in the CINEGDesign
The CINEG design assumes that common items should represent the contentand statistical characteristics of a total test. If a common item set does notrepresent the characteristics of the total tests, it is difficult to obtain accu-rate linking relationships under the CINEG design. Klein and Jarjoura (1985)demonstrated that the content representation in the common items is criticalwhen non-equivalent groups perform differently with respect to various contentareas covered in the full-test forms. In the context of the CCSS, if the state-specific items are not similar to the common assessment with respect to content,statistical, and item type characteristics, the common items on the common as-sessment would not accurately reflect the total augmented test characteristics.
Therefore, it seems crucial to investigate how different degree of dissimilar-ity in the construct (latent traits) measured by the common assessment andstate-specific item set affects linked scores across the augmented tests. Notethat the common assessment does not necessarily mean the same test form. Itcould be the same single form, but it most likely consists of parallel forms witha set of common items. Also, characteristics of examinees would have impactson equating and linking results. Dorans, Liu, and Hammond (2008) investi-gated the effects of characteristics of populations on equating results. Theyobserved consistent results across different equating methods with small abilitydifferences and divergent results across the equating methods with large abil-
2
Kim, Lee, and Harris Linking Augmented Tests
ity differences. Given the previous research, examinee characteristics such asexaminee proficiency on the common assessment and the state-specific item setalso can influence the linked scores of the augmented tests.
3 Method
3.1 Data Source and Analysis
Large scale math and science tests were used in this study. Since no datawere available for the augmented tests, the math test was considered a commonassessment, and the science test was assumed to be a state-specific item set.Therefore, an augmented test used in this study consisted of the common as-sessment from the math test items and state-specific item set from the sciencetest items. The reason for using the math and science tests to construct theaugmented test was that the math and science tests were reasonably correlated(disattenuated correlation = 0.87), while the two tests measured different stan-dards. Both the common assessment and state-specific item set consisted ofmultiple-choice items. Pseudo and simulated data were used in this study.
For pseudo data, as shown in Figure 1, the 60-item math test was split in halfto make two parallel common assessments with 40 common items1 and 10 uniqueitems for each of the common assessments. Among the 40 common items, 20common items were used as linking items. Two sets of nine state-specific itemswere selected from the science test and augmented to the corresponding commonassessments to construct two augmented tests, New Test and Old Test. Asmentioned earlier, states that adopted the CCSS are allowed to add a maximumof 15% of the items to address state standards, which implies that the commonassessments must comprise at least 85% of the total test. In this study, the totalnumber of items in each augmented test is 59: 85% of the augmented test is thecommon assessment (n = 50) and the remaining 15% is the state-specific itemset (n = 9). Examinees taking New Test and Old Test are from the examineegroups of P (New Test group) and Q (Old Test group), respectively. The groupQ taking Old Test was set as the reference group. The combined group (P andQ) took both New Test and Old Test, so examinee groups of P and Q were usedas the sample to link New Test and Old Test. The sample size for each of thegroups P and Q is 1000.
1The 40 common items were used as a common-item pool to manipulate different conditionsIn thee thermed
of the number of common items considered in the full study design (see Kim, 2013).current study, the number of common items was not considered as a study factor sincresults for this factor were obvious (i.e., the larger number of common items always perfobetter). Therefore, only the reuslts for the 20-common item condition are reported here.
3

Kim, Lee, and Harris Linking Augmented Tests
Figure 1: Construction of Augmented Tests
Note. New Test taken by the examinee group P and Old Test taken by theexaminee group Q. CA = Common Assessment; SI = State-specific Items; n =Number of Items; CI = Common Items; UI = Unique Items.
Simulated data were used to manipulate different latent-trait correlationlevels between the common assessment and state-specific item sets. The reasonfor using simulated data in addition to the pseudo data is that it is hard toobtain different levels of latent-trait correlations with only the pseudo data inwhich the latent-trait correlations, as measured by disattenuated correlations,ranged from 0.8 to 0.9. The simulation process involved four steps. First, pairsof theta values (N = 3000) were drawn from a bivariate normal distribution forNew Test and Old Test populations. True item parameters for Old Test werethe same as the pseudo test item parameters. However, true item parametersfor New Test were not the same as the pseudo test item parameters becausein the pseudo-data analyses, New Test and Old Test shared 40 common itemseven though only 20 were used as linking items. Therefore, to manipulatethe smaller number of common items, the true item parameters for New Testwere selected from additional test items. Second, item responses for each testwere generated based on the true item parameters and examinees theta values.The three parameter logistic model (3PL) was fitted simultaneously to estimateitem parameters for the common assessment items and the state-specific items.Third, linking was conducted to obtain linked scores. Fourth, the above stepswere repeated 50 times. The composite raw scores for each set of data are from0 to 59 (i.e., 60 score points), which are the summed number correct scores of
4
Kim, Lee, and Harris Linking Augmented Tests
the common assessment and state-specific item set. The overall statistics areweighted by frequencies for Old Test.
3.2 Study Factors
Five factors were considered in this study: group ability difference (measuredby common-item effect size), differential effect size, latent-trait correlations be-tween the common assessment and state-specific item set, differential latent-trait correlations, and different equating methods. In the pseudo-data analyses,common-item effect size, differential effect size, and different equating methodswere investigated. In the simulated data analyses, all the five factors were exam-ined with more focus on the latent-trait correlations and differential latent-traitcorrelations.
3.2.1 Common-item Effect Size (CES)
The group ability difference was measured by Common-item Effect Size (CES).Different conditions of the common-item effect size were created using a sam-pling process with the external variables including students’ number correctscore in a large scale reading test and state of residency. Three levels of thecommon item effect size were created: 0.0, 0.2, and 0.4. The common-itemeffect size represents a standardized mean difference in common item scoresbetween New Test and Old Test. The effect size was calculated for New Testminus Old Test common item scores as follows:
CES =X1 −X2√
(N1−1)s21+(N2−1)s22N1+N2
, (1)
where X is the mean for the common item scores. N is the number of examinees,and s2 is for the variance of scores. New Test and Old Test are indicated by 1and 2, respectively.
3.2.2 Differential Effect Size (DES)
The effect size based on the common items that were obtained only from thecommon assessment does not represent student performance on the state-specificitem set. Therefore, it is problematic to use only the common-item effect sizeas an index of group differences. It is likely that examinees perform differentlyon the common assessment and state-specific item set because the two parts ofthe augmented test are developed based on different standards: The commonassessment is developed based on the CCSS, and the state-specific item set isconstructed based on state standards. Therefore, it would be reasonable toexamine differential effect sizes of the common assessment and state-specificitem set for linking the augmented tests. The differential effect size between thecommon assessment and state-specific item set can be calculated for the effect
5

Kim, Lee, and Harris Linking Augmented Tests
size of the common assessment minus the effect size of the state-specific itemset as follows:
DES =X1 −X2√
(N1−1)s2X1+(N2−1)s2X2
N1+N2
− Y 1 − Y 2√(N1−1)s2Y 1+(N2−1)s2Y 2
N1+N2
, (2)
where X and Y are the means for the common assessment scores and state-specific item scores, respectively; s2 2
X and sY are the variances of the commonassessment scores and state-specific item scores, respectively; N is the number ofexaminees; and New Test and Old Test were indicated by 1 and 2, respectively.Two levels of the differential effect size were created: 0.0 and 0.2.
Figure 2 contains a visual illustration for the combination of the common-item effect size and the differential effect size conditions. The bigger circlerepresents the common assessments (CA) and the smaller circle represents thestate-specific item sets (SI). The standardized mean is represented as SM. [CES0.2 DES 0.0] represents that the standardized mean based on the common itemscore for New Test group is 0.2 points higher than the standardized mean basedon the common item score for Old Test group. Also, the standardized meanbased on the state-specific item score for New Test group is also 0.2 points higherthan the standardized mean based on the state-specific item score for Old Testgroup. In this situation, the differential effect size (DES) is 0.0 because thecommon item effect size and the state-specific item effect size are the same.
Similarly, [CES 0.2 DES 0.2] represents that the standardized mean basedon the common item score for New Test group is 0.2 points higher than the stan-dardized mean based on the common item score for Old Test group. However,the standardized mean based on the state-specific item score for New Test groupis 0.4 points higher than the standardized mean based on the state-specific itemscore for Old Test group. Under this situation, DES is 0.2 because the differencein the effect sizes for the common item effect size and the state-specific itemeffect size is 0.2.
6

Kim, Lee, and Harris Linking Augmented Tests
Figure 2: Visual Explanation of CES and DES.
Note. CA SM = Standardized mean on common assessment; SI SM = Stan-dardized mean on state-specific item set.
3.2.3 Latent-Trait Correlations between Common Assessment andState-Specific Item Set
Five conditions of the latent-trait correlations between the common assessmentand state-specific item set were included: r = 0.6, r = 0.7, r = 0.8, r = 0.9,and r = 0.98. The conditions of the latent-trait correlation were determinedbased on the median value of the disattenuated correlation between math andscience raw scores for six national achievement tests administered in the 2005-2006 period, which was generally 0.8. Therefore, 0.8 was set as a mid-level ofthe latent-trait correlation values in this study.
3.2.4 Differential Latent-Trait Correlations between Common As-sessment and State-Specific Item Set
The latent-trait correlations between the common assessment and state-specificitem set would not always be the same across different augmented tests becausestate-specific item sets would vary depending on state objectives and standardscovered by the common assessment. Specifically, if a state within a consortiumadds different state-developed items over time, the latent-trait correlations be-tween the common assessment and state-specific item would differ across years.Therefore, it seems reasonable to investigate how the differential latent-traitcorrelations across different augmented tests would affect the linking accuracy.
7
Kim, Lee, and Harris Linking Augmented Tests
Also, the state-specific standards usually have been added to the CCSS withinthe same subject area. Therefore, the latent-trait correlations between the com-mon assessment and state-specific item set would be reasonably correlated inreal situations (i.e., two English tests); and, of the five values of the latent-traitcorrelations described earlier (0.6, 0.7, 0.8, 0.9, and 0.98), only the highest pairsof values using r = 0.8, r = 0.9, and r = 0.98 were included in the differen-tial latent-trait correlation conditions. Four levels of the differential latent-traitcorrelations were included: [r(new) = 0.8 r(old) = 0.9], [r(new) = 0.9 r(old)= 0.8], [r(new) = 0.9 r(old) = 0.98], and [r(new) = 0.98 r(old) = 0.9]. r(new)and r(old) indicate the latent-trait correlations between the common assessmentand state-specific item set for New Test and Old Test, respectively.
3.2.5 Equating Methods
For each of the conditions mentioned above, linking was conducted using theCINEG design with frequency estimation (FE), chained equipercentile equating(CE), IRT true score equating (TS), and IRT observed score equating (OS)methods. Linking was conducted using Equating Recipes (Brennan, Wang,Kim, & Seol, 2009) and PIE (Hanson, Zeng, & Cui, 2004). Synthetic weightsof one were given to the examinee group taking New Test in order to constructa synthetic population. Before linking, items in New Test and Old Test werecalibrated using BILOG-MG (Zimowski, Muraki, & Mislevy, 2003). Items fromthe two tests were put on the same scale using the Stocking and Lord (Stocking& Lord, 1983) scale transformation method.
3.3 Evaluation
For the pseudo-data analyses, the criterion to evaluate the linking accuracy ofthe augmented tests was established by using a single-group equating method.The rationale for using a single group equating as a criterion linking relation-ship is that two sources of linking errors –group ability differences and theuse of common items as opposed to full-length tests to determine the linkingrelationship– are not involved in the single group equating. Different criteriafor the linking relationships were used for different equating methods. A sin-gle group equipercentile equating relationship without smoothing was used asa criterion for the two classical equating methods: frequency estimation andchained equipercentile equating. Further, single group IRT observed and truescore equating relationships were used as criteria for the IRT observed and truescore equating methods, respectively.
For the simulated data analyses, true linking relationships were obtainedusing simple structure multidimensional IRT observed-score equating (Lee &Brossman, 2012) based on the true item parameters and a population bivariatenormal distribution for the two latent variables of the common assessment andstate-specific item set. More specifically, the latent-trait variables for the com-mon assessment (represented as 1) and the state-specific item set (representedas 2) are denoted as θ1 and θ2, and they follow the bivariate normal distribution
8

Kim, Lee, and Harris Linking Augmented Tests
denoted as BN (µ1, µ2, σ1, σ2, r). The terms µ1, µ2, σ1, and σ2 represent themeans and standard deviations for each of the two latent-trait variables of θ1and θ2, respectively, and r stands for the latent-trait correlation between θ1 andθ2. Different criteria of linking relationships were used for different populationdistributions. More specifically, based on Study Factors 3.2.1 through 3.2.4, atotal of 120 (3 x 2 x 5 x 4) pairs of population distributions for New Test andOld Test were considered in the simulation study. Therefore, 120 criteria oflinking relationships were used for the corresponding population distributionsof the simulated data analyses. This study assumes that each of the commonassessment and state-specific item sets measure a single latent-trait variable,and the two latent-trait variables measured by the common assessment andstate-specific item set are correlated. A total of 41 x 41 quadrature points andweights were created for the population bivariate distributions. Theta valuesrange from -4 to 4 for each of the common assessment and state-specific itemsets.
In order to conduct the simple structure multidimensional IRT observed-score equating, a fitted marginal observed-score distribution was obtained foreach of New Test and Old Test populations using the bivariate normal dis-tribution and true item parameters. First, using an extended version of theLord-Wingersky algorithm (Lord & Wingersky, 1984; Hanson, 1994; Thissen,Pommerich, Billeaud, & Williams, 1995), conditional raw-score distributionswere computed for each pair of theta values. Then, the marginal observed-scoredistribution was obtained for each test by aggregating the conditional distribu-tions over the entire bivariate theta distribution. Using the marginal observed-score distributions for the two tests, equipercentile equating was conducted ona synthetic population with a weight of one on New Test group. The indices forevaluating the linking results from the pseudo and simulated data analyses arebias (Bias), standard error (SE), and root mean squared error (RMSE). Thesesummary statistics were calculated for each of the raw score points (i.e., condi-tional statistics) and across all score points (i.e., overall statistics). Conditionalstatistics are shown in Equations 3, 4, and 5.√√[∑J
]√ 2√ j=1 ej(xi)Bias(xi) = − e(xi)
J(3)
SE(xi) =
√√√√√ 1
J
J∑j=1
ej(xi)− 1
J
J∑j=1
ej(xi)
2
(4)
RMSE(xi) =
√√√√√[∑Jj=1 ej(xi)
J− e(xi)
]2
+1
J
J∑j=1
ej(xi)− 1
J
J∑j=1
ej(xi)
2
(5)
9

Kim, Lee, and Harris Linking Augmented Tests
In Equations 3 through 5, J is the number of replications (10 for the psedodata and 50 for the simulated data); ej(xi) is an estimated equated score at scorepoint i; and e(xi) is a criterion equated at score point i. The o√verall∑ statistics in-clude the weighted average root mean squared bias, Wbias = i wiBias(xi)2√ ,∑the weighted average standard error, WSE = i wiSE(x 2√∑ i) , and the weighted
average RMSE, WRMSE = 2i wiRMSE(xi) . In addition to the summary
statistics mentioned above, an index of an acceptable level of error called a Dif-ference That Matters (DTM) was used to determine a practically acceptablelevel of the error for adequate linking in the simulated data analyses. The DTMvalue of 0.5 was used. The value of 0.5 for DTM is determined based on therationale such that if the difference between rounded scale scores is greater than0.5, the reported scale scores could be changed (Dorans & Feigenbaum, 1994).In this study, the adequacy of linking was determined by comparing the DTM toBias(xi). If the Bias(xi) was greater than the DTM, the linking was consideredunacceptable.
4 Results
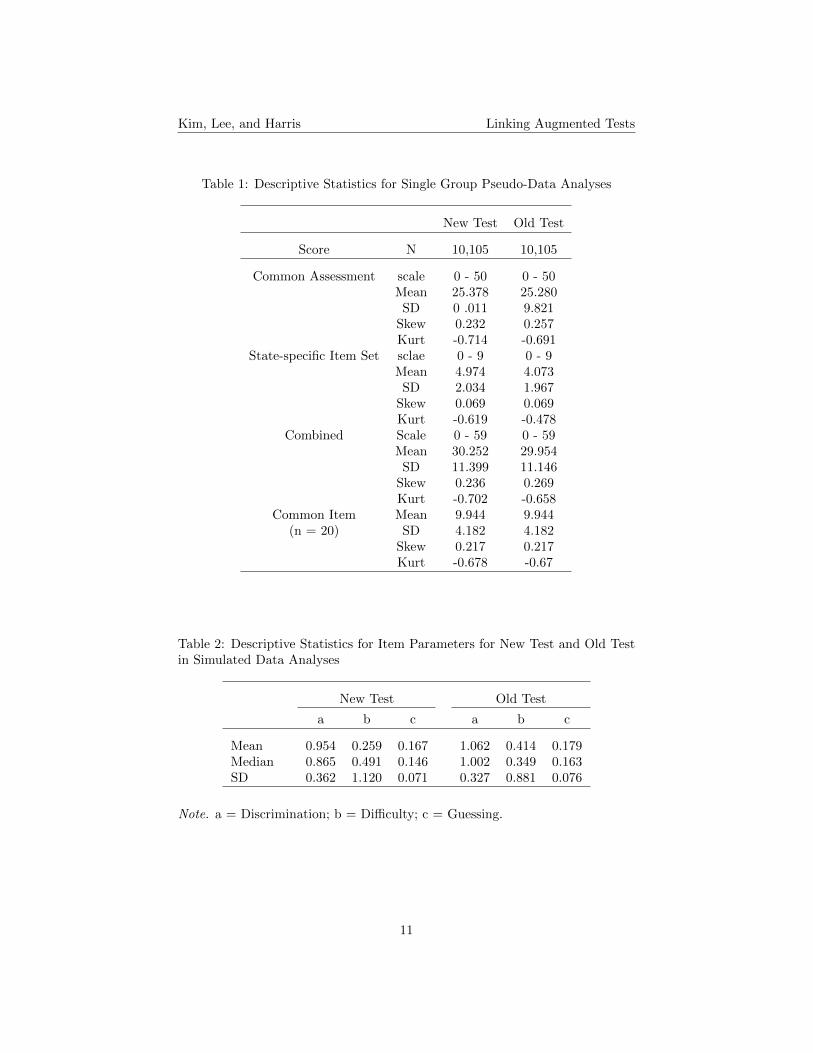
Descriptive statistics for the pseudo tests are provided in Table 1. The NewTest group showed slightly higher means for the common assessment, state-specific item set, and combined test than did the Old Test group. Generally,the descriptive statistics for New Test and Old Test were similar, indicating twopseudo tests were equivalent. Table 2 presents descriptive statistics for itemparameters of New Test and Old Test for the simulated data analyses. Old Testhas higher means for discrimination, difficulty, and guessing parameters thandid New Test.
Table 3 contains the averaged summary statistics for the effects of common-item effect size and differential effect size. The pseudo-data and simulated dataanalyses showed the same pattern of the results for the effect size conditions,therefore, only the results from the simulated data analyses were presentedin this section. The statistics were averaged over the latent-trait correlationconditions and equating methods. CES 0.0 indicates that Old Test and New Testgroups are equivalent. CES 0.2 is for moderately large group ability difference,and CES 0.4 is for large group ability difference. DES 0.0 is almost no differentialeffect size, and DES 0.2 is moderately large differential effect size, respectively.As indicated in Table 3, WBIAS and WRMSE increased as the group abilitydifference increased, while WSE seemed similar across different group abilityconditions. Also, larger WBIAS and WMSE were associated with the largerdifferential effect size. The values of WSE were similar when the differentialeffect sizes were 0.0 and 0.2.
10
Kim, Lee, and Harris Linking Augmented Tests
Table 1: Descriptive Statistics for Single Group Pseudo-Data Analyses
New Test Old Test
Score N 10,105 10,105
Common Assessment scale 0 - 50 0 - 50Mean 25.378 25.280SD 0 .011 9.821
Skew 0.232 0.257Kurt -0.714 -0.691
State-specific Item Set sclae 0 - 9 0 - 9Mean 4.974 4.073SD 2.034 1.967
Skew 0.069 0.069Kurt -0.619 -0.478
Combined Scale 0 - 59 0 - 59Mean 30.252 29.954SD 11.399 11.146
Skew 0.236 0.269Kurt -0.702 -0.658
Common Item Mean 9.944 9.944(n = 20) SD 4.182 4.182
Skew 0.217 0.217Kurt -0.678 -0.67
Table 2: Descriptive Statistics for Item Parameters for New Test and Old Testin Simulated Data Analyses
New Test Old Test
a b c a b c
Mean 0.954 0.259 0.167 1.062 0.414 0.179Median 0.865 0.491 0.146 1.002 0.349 0.163SD 0.362 1.120 0.071 0.327 0.881 0.076
Note. a = Discrimination; b = Difficulty; c = Guessing.
11

Kim, Lee, and Harris Linking Augmented Tests
Table 3: Averaged Summary Statistics for Group Ability Difference and Differ-ential Effect Size
Statistics
Differential Group Ability WBIAS WSE WRMSEEffect Size Difference
DES 0.0 CES 0.0 0.056 0.220 0.230CES 0.2 0.159 0.230 0.285CES 0.4 0.289 0.225 0.378
DES 0.2 CES 0.0 0.266 0.223 0.350CES 0.2 0.415 0.225 0.473CES 0.4 0.552 0.227 0.599
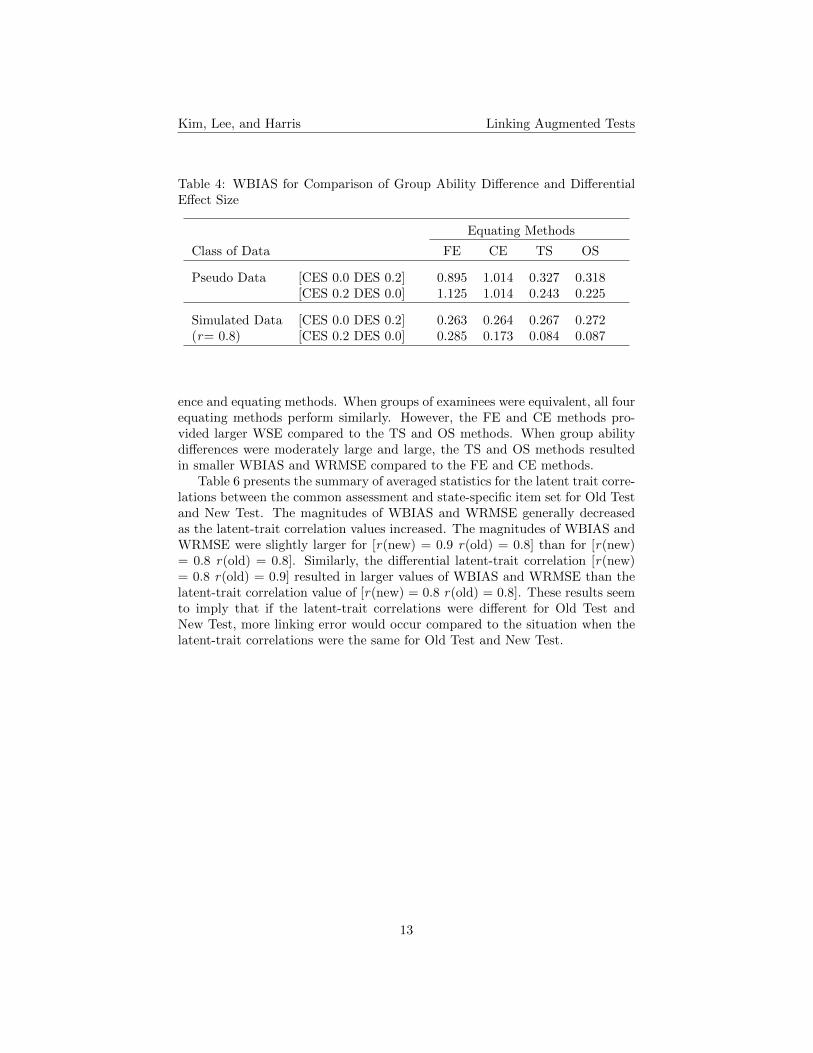
Table 4 presents the summary of WBIAS to compare the effects of group abil-ity difference and differential effect size depending on different equating meth-ods. [CES 0.0 DES 0.2] indicates a smaller value of the group ability differenceassociated with a larger value of differential effect size. [CES 0.2 DES 0.0] is fora larger value of the group ability difference associated with a smaller value ofdifferential effect size. If larger bias was observed for [CES 0.0 DES 0.2] thanfor [CES 0.2 DES 0.0], the effect of DES would be larger than the effect of CES.Conversely, if [CES 0.2 DES 0.0] yielded larger bias compared to [CES 0.0 DES0.2], the effect of CES would be larger than the effect of DES. Also, the resultsfrom the simulated data with r = 0.8 were selected to compare the pseudo-dataresults because the disattenuated correlation between the common assessmentand state-specific item set was about 0.8 for the pseudo data.
For the FE method with the pseudo and simulated data, [CES 0.2 DES0.0] resulted in larger WBIAS and WRMSE compared to [CES 0.0 DES 0.2],indicating that the group ability difference had more effect on the linking resultsthan did the differential effect size. For the CE method with the pseudo data,[CES 0.2 DES 0.0] resulted in similar magnitude of WBIAS to that of WBIASfor [CES 0.0 DES 0.2]. However, for the simulated data, larger WBIAS wasobserved for [CES 0.0 DES 0.2] than for [CES 0.2 DES 0.0]. When the CEwas used, the results were inconclusive for the pseudo-data analyses while apattern of results was obvious for the simulated data analyses, indicating thatthe CE was affected more by the differential effect size than by the group abilitydifference. The OS and TS methods generally resulted in larger WBIAS for [CES0.0 DES 0.2] than for [CES 0.2 DES 0.0] for both pseudo-data and simulateddata analyses. Based on this result, the IRT equating methods seemed moresensitive to the differential effect size than to the group ability difference whilethe frequency estimation and chained equipercentile methods were affected moreby the group ability difference than the differential effect size.
Table 5 presents the summary of averaged statistics for group ability differ-
12
Kim, Lee, and Harris Linking Augmented Tests
Table 4: WBIAS for Comparison of Group Ability Difference and DifferentialEffect Size
Equating Methods
Class of Data FE CE TS OS
Pseudo Data [CES 0.0 DES 0.2] 0.895 1.014 0.327 0.318[CES 0.2 DES 0.0] 1.125 1.014 0.243 0.225
Simulated Data [CES 0.0 DES 0.2] 0.263 0.264 0.267 0.272(r= 0.8) [CES 0.2 DES 0.0] 0.285 0.173 0.084 0.087
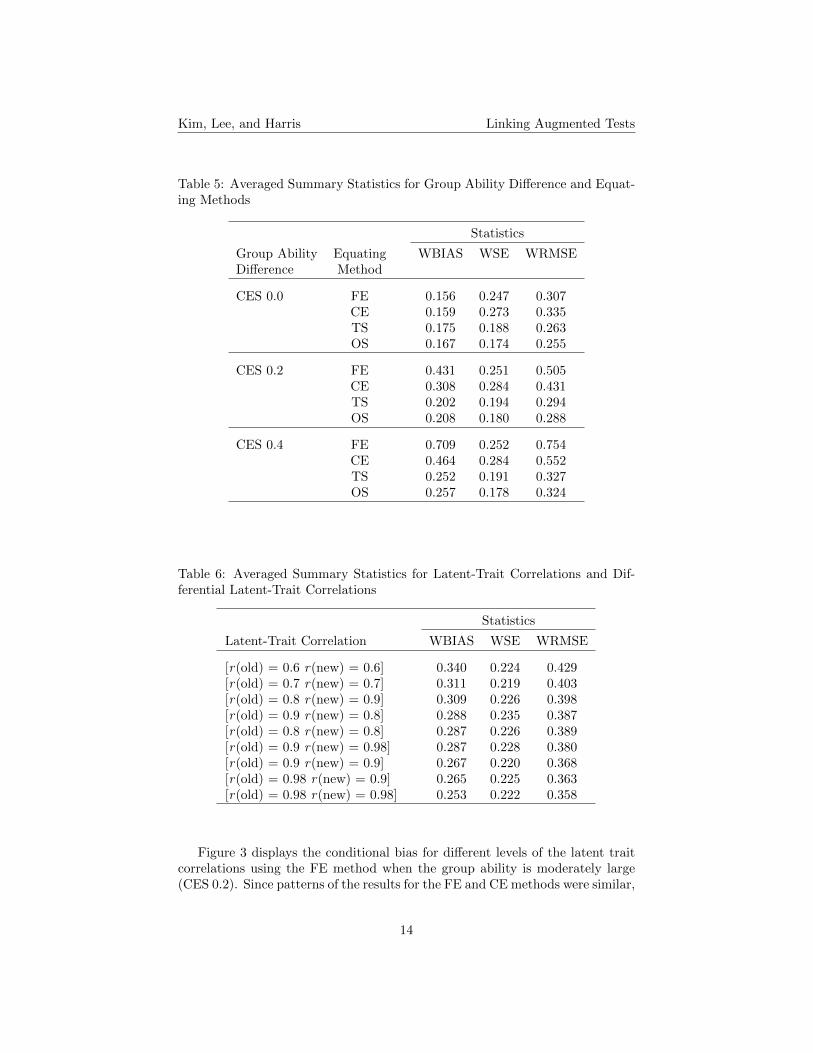
ence and equating methods. When groups of examinees were equivalent, all fourequating methods perform similarly. However, the FE and CE methods pro-vided larger WSE compared to the TS and OS methods. When group abilitydifferences were moderately large and large, the TS and OS methods resultedin smaller WBIAS and WRMSE compared to the FE and CE methods.
Table 6 presents the summary of averaged statistics for the latent trait corre-lations between the common assessment and state-specific item set for Old Testand New Test. The magnitudes of WBIAS and WRMSE generally decreasedas the latent-trait correlation values increased. The magnitudes of WBIAS andWRMSE were slightly larger for [r(new) = 0.9 r(old) = 0.8] than for [r(new)= 0.8 r(old) = 0.8]. Similarly, the differential latent-trait correlation [r(new)= 0.8 r(old) = 0.9] resulted in larger values of WBIAS and WRMSE than thelatent-trait correlation value of [r(new) = 0.8 r(old) = 0.8]. These results seemto imply that if the latent-trait correlations were different for Old Test andNew Test, more linking error would occur compared to the situation when thelatent-trait correlations were the same for Old Test and New Test.
13
Kim, Lee, and Harris Linking Augmented Tests
Table 5: Averaged Summary Statistics for Group Ability Difference and Equat-ing Methods
Statistics
Group Ability Equating WBIAS WSE WRMSEDifference Method
CES 0.0 FE 0.156 0.247 0.307CE 0.159 0.273 0.335TS 0.175 0.188 0.263OS 0.167 0.174 0.255
CES 0.2 FE 0.431 0.251 0.505CE 0.308 0.284 0.431TS 0.202 0.194 0.294OS 0.208 0.180 0.288
CES 0.4 FE 0.709 0.252 0.754CE 0.464 0.284 0.552TS 0.252 0.191 0.327OS 0.257 0.178 0.324
Table 6: Averaged Summary Statistics for Latent-Trait Correlations and Dif-ferential Latent-Trait Correlations
Statistics
Latent-Trait Correlation WBIAS WSE WRMSE
[r(old) = 0.6 r(new) = 0.6] 0.340 0.224 0.429[r(old) = 0.7 r(new) = 0.7] 0.311 0.219 0.403[r(old) = 0.8 r(new) = 0.9] 0.309 0.226 0.398[r(old) = 0.9 r(new) = 0.8] 0.288 0.235 0.387[r(old) = 0.8 r(new) = 0.8] 0.287 0.226 0.389[r(old) = 0.9 r(new) = 0.98] 0.287 0.228 0.380[r(old) = 0.9 r(new) = 0.9] 0.267 0.220 0.368[r(old) = 0.98 r(new) = 0.9] 0.265 0.225 0.363[r(old) = 0.98 r(new) = 0.98] 0.253 0.222 0.358
Figure 3 displays the conditional bias for different levels of the latent traitcorrelations using the FE method when the group ability is moderately large(CES 0.2). Since patterns of the results for the FE and CE methods were similar,
14

Kim, Lee, and Harris Linking Augmented Tests
only the FE results are presented here. There are two subfigures: the left oneis for the condition where the differential effect size is almost zero (DES 0.0),and the other is for the condition where the differential effect size is moderatelylarge (DES 0.2). The bold line in the middle of each plot represents the 0.5DTM criterion. The conditional bias was largest for r= 0.6, and smallest forr= 0.98 over most of the score range. Generally, as the latent-trait correlationincreased, bias decreased slightly across different score levels. When comparingthe magnitude of bias to the DTM, the lines of the plots for all the five latent-trait correlation conditions were below the DTM line when the differential effectsize was almost zero. However, when the differential effect size was moderatelylarge, bias for the latent-trait correlation values tended to exceed the DTM lineover most of the score range.
0
0.5
1
10 15 20 25 30 35 40 45 50 55
Bia
s
DES 0.0
DTM r = 0.6 r = 0.7
r = 0.8 r = 0.9 r = 0.98
raw score
0
0.5
1
10 15 20 25 30 35 40 45 50 55
Bia
s
DES 0.2
DTM r = 0.6 r = 0.7
r = 0.8 r = 0.9 r = 0.98
raw score
Figure 3: Conditional Bias of Latent-Trait Correlations Using FE for CES 0.2
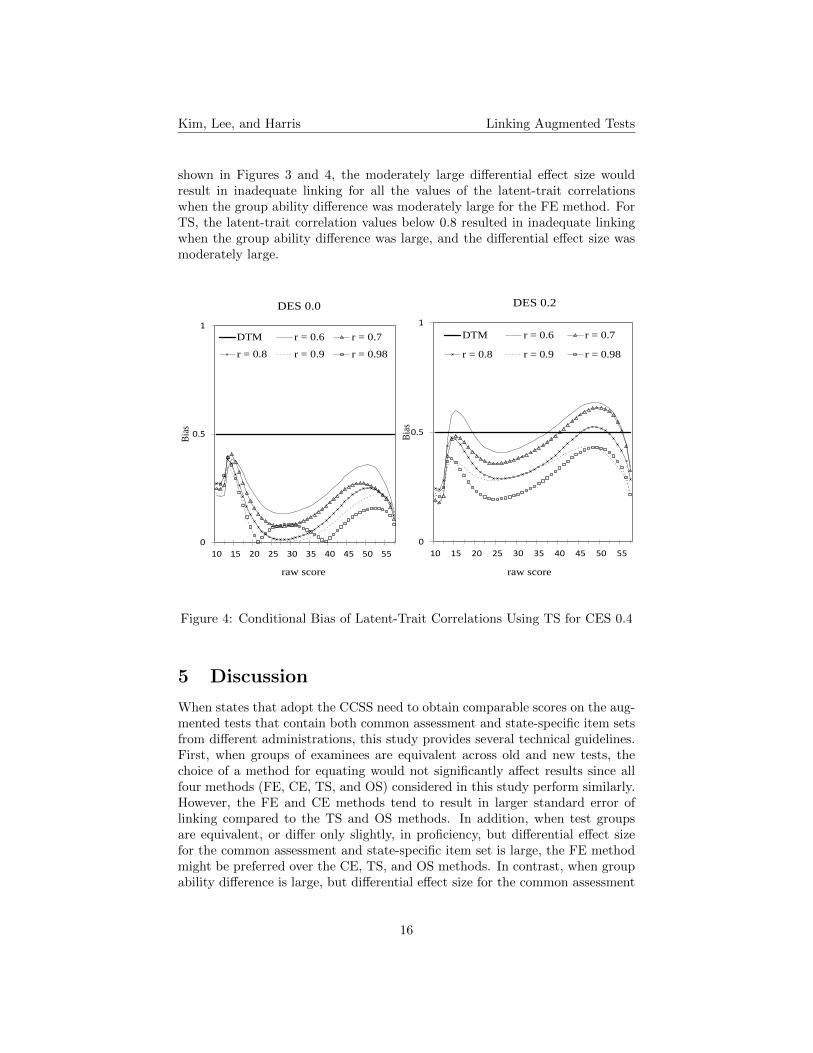
Figure 4 plots the conditional bias for the latent-trait correlations using theTS method with the large group ability difference (CES 0.4). Since results forthe TS and OS methods were similar, only the results from the TS methodwere discussed here. As shown in the left subfigure for DES 0.0, even thoughthe group ability difference was large, all the latent-trait correlation conditionsresulted in adequate linking when the differential effect size was almost zero.However, the latent-trait correlation values below or equal to 0.8 (e.g.,r = 0.6, r= 0.7, and r= 0.8) did not provide adequate linking in the high score range (40 to57) when the differential effect size was moderately large. Based on the results
15
Kim, Lee, and Harris Linking Augmented Tests
shown in Figures 3 and 4, the moderately large differential effect size wouldresult in inadequate linking for all the values of the latent-trait correlationswhen the group ability difference was moderately large for the FE method. ForTS, the latent-trait correlation values below 0.8 resulted in inadequate linkingwhen the group ability difference was large, and the differential effect size wasmoderately large.
0
0.5
1
10 15 20 25 30 35 40 45 50 55
Bia
s
DES 0.0
DTM r = 0.6 r = 0.7
r = 0.8 r = 0.9 r = 0.98
raw score
0
0.5
1
10 15 20 25 30 35 40 45 50 55
Bia
s
DES 0.2
DTM r = 0.6 r = 0.7
r = 0.8 r = 0.9 r = 0.98
raw score
Figure 4: Conditional Bias of Latent-Trait Correlations Using TS for CES 0.4
5 Discussion
When states that adopt the CCSS need to obtain comparable scores on the aug-mented tests that contain both common assessment and state-specific item setsfrom different administrations, this study provides several technical guidelines.First, when groups of examinees are equivalent across old and new tests, thechoice of a method for equating would not significantly affect results since allfour methods (FE, CE, TS, and OS) considered in this study perform similarly.However, the FE and CE methods tend to result in larger standard error oflinking compared to the TS and OS methods. In addition, when test groupsare equivalent, or differ only slightly, in proficiency, but differential effect sizefor the common assessment and state-specific item set is large, the FE methodmight be preferred over the CE, TS, and OS methods. In contrast, when groupability difference is large, but differential effect size for the common assessment
16
Kim, Lee, and Harris Linking Augmented Tests
and state-specific item set is small, the CE, TS, and OS methods would be pre-ferred over the FE method. This is because the FE method tends to be moresensitive to the group ability difference than the differential effect size, whilethe CE, TS, and OS methods are more sensitive to the differential effect sizethan the group ability difference.
Based on the results in this study, inadequate linking would result when thedifferential effect size is moderately large under two conditions – moderatelylarge group ability difference with the FE method and large group ability dif-ference with the TS method. However, the latent-trait correlation values above0.8 result in adequate linking for the TS method even though the differentialeffect size is moderately large and the group ability difference is large. In ad-dition, when the latent-trait correlation is different for old and new tests, lessaccurate linking would result compared to the case when the latent-trait corre-lation is similar for the old and new tests. Therefore, it is recommended thatthe latent-trait correlation between the common assessment and state-specificitem set remains above 0.8. Also, it would be important to keep the 15 per-cent augmentation guidelines clear and consistent to obtain a similar level ofrelationship between the common assessment and state-specific item set acrossyears, or even across states within a consortium.
As a limitation, it was difficult to determine whether the differential effectsize came from the difference in test form difficulty or the difference in theconstructs measured by the common assessment and state-specific item sets.Specifically, when there is a difference in the effect sizes on the common as-sessment and state-specific item set, there might be several reasons. First, thecommon assessment and state-specific item sets measure different constructs be-cause they are developed based on different standards. Second, when studentshave been taught with more emphasis on state-developed standards than theCCSS, the students might perform better on the state-specific item sets thanthe common assessment. Third, it is possible that the difficulty levels for thecommon assessment and the state-specific item set might be different. The re-sults for the differential effect size conditions therefore need to be interpretedwith caution.
In addition, this study was conducted with only paper-pencil based testsconsisting of multiple-choice items. According to Year One Report for PARCCmade by the U.S. Department of Education (May, 2012), the PARCC proposeda plan that includes both computer-based innovative item types and extendedperformance tasks for grades 3-11 in mathematics and English language. There-fore, there might be more complicated psychometric issues in using the innova-tive item types for the PARCC assessment than in using traditional item types.In this sense, generalizing from the results based upon the current study to thewhole CCSS context should be limited. Future research could investigate theeffects of using different types of items, including constructed response itemsand technology enhanced items on linking results for the augmented tests.
In terms of criterion linking relationships, using different criterion linkingrelationships would cause different results for some conditions. For example, itwas hard to determine whether the CE was more sensitive to the group ability
17

Kim, Lee, and Harris Linking Augmented Tests
difference or to the differential effect size for the pseudo-data analyses, whileit was obvious that the CE was more sensitive to the differential effect sizethan the group ability difference for the simulated data analyses. Note thatthe criterion linking relationships were different for the pseudo-data and simu-lated data analyses –single group linking relationship was used as the criterionfor the pseudo-data analyses, while a simple structure multidimensional IRTobserved-score linking relationship was used as the criterion for the simulateddata analyses. Furthermore, in the pseudo-data analyses, the criterion link-ing relationship differed for each equating method. Therefore, generalizationof the conclusions about performances of different equating methods should beexercised with caution.
Further, it would be interesting to see how the use of a different criterion mayalter the results of the simulation study. An additional analysis was conductedwhere the unidimensional IRT linking with no group difference was used as acriterion for the simulated data analyses. The results of this additional analysisled to the same conclusions. Future research could be conducted to examinehow different criterion linking relationships would affect linking results and howdifferent criterion linking relationships would be influenced by different levelsof group ability difference, differential effect size, and latent-trait correlationbetween the common assessment and state-specific item sets.
This study investigated various factors affecting linked scores of augmentedtests that include both the common assessment and the state-specific item set.The guidelines in this study can provide ideas about what factors need to beconsidered when states, assessment consortia, and testing companies use equiv-alent scores on augmented tests over time, across grades, and states within aconsortium.
6 References
Achieve. (2010, August). Common Core State Standards & Accountability.(Downloaded on January, 2011 from http://www.achieve.org/).
Brennan, R. L., Wang, T., Kim, S., & Seol, J. (2009). Equating recipes.[Computer program]. Iowa City: University of Iowa.
CEP. (2012). Year Two of Implementing the Common Core State Standards:States’ Progress and Challenges. (Available online: http://www.cep-dc.org/displayDocumentID=391).
Cizek, G. J. (2010). Translating Standards into Assessments: The Opportu-nities and Challenges of a Common Core. (Available online: http://www.brookings.edu/media/Files/events/2010).
Dorans, N. J., & Feigenbaum, M. D. (1994). Equating issues engenderedby changes to the SAT and PSAT/NMSQT. In I. M. Lawrence, N. J. Do-rans, M. D. Feigenbaum, N. J. Feryok, A. P. Schmitt, & N. K. Wright(Eds.),Technical issues related to the introduction of the new SAT and
18

Kim, Lee, and Harris Linking Augmented Tests
PSAT/NMSQT (ETS Research Memorandum No. RM-94-10). Prince-ton, NJ: ETS.
Dorans, N. J., Liu, J., & Hammond, S. (2008). Anchor test type andpopulation invariance: An exploration across subpopulations and test ad-ministrations. Applied Psychological Measurement, 32, 81–97.
Hanson, B. A. (1994). An extension of the Lord-Wingersky algorithm topolytomous items. Unpublished research note.
Hanson, B. A., Zeng, L., & Cui, Z. (2004). PIE [Computer Software]. IowaCity: University of Iowa.
Kim, J. (2013). Factors affecting accuracy of comparable scores for augmentedtests under Common Core State Standards. Unpublished doctoral disser-tation. University of Iowa.
Klein, L. W., & Jarjoura, D. (1985). The importance of content represen-tation for common item equating with nonrandom groups. Journal ofEducational Measurement, 22, 197–206.
Kolen, M. J., & Brennan, R. L. (2004). Test equating, scaling, and linking:Methods and practices (2nd ed.). New York: Springer-Verlag.
Lazer, S., Mazzeo, J., Way, W. D., Twing, J. S., Camara, W., & Sweeney,K. (2010). Thoughts on linking and comparing assessments of CommonCore Standards. (Available online: http://www.ets.org/Media/Home).
Lee, W., & Brossman, B. G. (2012). Observed score equating for mixed formattests using a simple structure multidimensional IRT framework. In Kolen,M. J. & Lee, W. (Ed.) Mixed-format tests: Psychometric properties witha primary focus on equating (volume 2). (CASMA Monograph Number2.2, pp. 118-129).
Lord, F. M., & Wingersky, M. S. (1984). Comparison of IRT true-score andequipercentile observed-score equatings. Applied Psychological Measure-ment, 8, 453-461.
Luecht, R. M., & Camara, W. J. (2011). Evidence and Design ImplicationsRequired to Support Comparability Claims. Washington: PARCC.
Oregon Department of Education. (2011). Development of the Common As-sessment for 2014-2015. (Available online: http://www.ode.state.or.us).
Stocking, M. L., & Lord, F. M. (1983). Developing a common metric in itemresponse theory. Applied Psychological Measurement, 7, 201-210.
Thissen, D., Pommerich, M., Billeaud, K., & Williams, V. S. L. (1995).Item response theory for scores on tests including polytomous items withordered responses. Applied Psychological Measurement, 19, 39-49.
19
Kim, Lee, and Harris Linking Augmented Tests
U.S. Department of Education. (2012) Race to the Top Assessment. (Availableonline: http://www2.ed.gov/programs/parcc-year-1.pdf).
Zimowski, M., Muraki, E., Mislevy, R., & Bock D. (2003). Bilog-MG [Com-puter software]. Mooresville, IN: Scientific Software International.
20