Centenarian controls increase variant effect sizes by an ... · Tesi, Niccolo; van der Lee, Sven;...
11
Delft University of Technology Centenarian controls increase variant effect sizes by an average twofold in an extreme case–extreme control analysis of Alzheimer’s disease Tesi, Niccolò; van der Lee, Sven J.; Hulsman, Marc; Jansen, Iris E.; Stringa, Najada; van Schoor, Natasja; Meijers-Heijboer, Hanne; Reinders, Marcel J.T.; Holstege, Henne; More Authors DOI 10.1038/s41431-018-0273-5 Publication date 2019 Document Version Final published version Published in European Journal of Human Genetics Citation (APA) Tesi, N., van der Lee, S. J., Hulsman, M., Jansen, I. E., Stringa, N., van Schoor, N., Meijers-Heijboer, H., Reinders, M. J. T., Holstege, H., & More Authors (2019). Centenarian controls increase variant effect sizes by an average twofold in an extreme case–extreme control analysis of Alzheimer’s disease. European Journal of Human Genetics, 27(2), 244-253. https://doi.org/10.1038/s41431-018-0273-5 Important note To cite this publication, please use the final published version (if applicable). Please check the document version above. Copyright Other than for strictly personal use, it is not permitted to download, forward or distribute the text or part of it, without the consent of the author(s) and/or copyright holder(s), unless the work is under an open content license such as Creative Commons. Takedown policy Please contact us and provide details if you believe this document breaches copyrights. We will remove access to the work immediately and investigate your claim. This work is downloaded from Delft University of Technology. For technical reasons the number of authors shown on this cover page is limited to a maximum of 10.
Transcript of Centenarian controls increase variant effect sizes by an ... · Tesi, Niccolo; van der Lee, Sven;...
Delft University of Technology
Centenarian controls increase variant effect sizes by an average twofold in an extremecase–extreme control analysis of Alzheimer’s disease
Tesi, Niccolò; van der Lee, Sven J.; Hulsman, Marc; Jansen, Iris E.; Stringa, Najada; van Schoor, Natasja;Meijers-Heijboer, Hanne; Reinders, Marcel J.T.; Holstege, Henne; More AuthorsDOI10.1038/s41431-018-0273-5Publication date2019Document VersionFinal published versionPublished inEuropean Journal of Human Genetics
Citation (APA)Tesi, N., van der Lee, S. J., Hulsman, M., Jansen, I. E., Stringa, N., van Schoor, N., Meijers-Heijboer, H.,Reinders, M. J. T., Holstege, H., & More Authors (2019). Centenarian controls increase variant effect sizesby an average twofold in an extreme case–extreme control analysis of Alzheimer’s disease. EuropeanJournal of Human Genetics, 27(2), 244-253. https://doi.org/10.1038/s41431-018-0273-5Important noteTo cite this publication, please use the final published version (if applicable).Please check the document version above.
CopyrightOther than for strictly personal use, it is not permitted to download, forward or distribute the text or part of it, without the consentof the author(s) and/or copyright holder(s), unless the work is under an open content license such as Creative Commons.
Takedown policyPlease contact us and provide details if you believe this document breaches copyrights.We will remove access to the work immediately and investigate your claim.
This work is downloaded from Delft University of Technology.For technical reasons the number of authors shown on this cover page is limited to a maximum of 10.

European Journal of Human Genetics (2019) 27:244–253https://doi.org/10.1038/s41431-018-0273-5
ARTICLE
Centenarian controls increase variant effect sizes by an averagetwofold in an extreme case–extreme control analysis of Alzheimer’sdisease
Niccolò Tesi1,2,3 ● Sven J. van der Lee1,2 ● Marc Hulsman1,2,3● Iris E. Jansen1,4
● Najada Stringa5,6 ●
Natasja van Schoor5,6 ● Hanne Meijers-Heijboer2 ● Martijn Huisman5,6● Philip Scheltens 1
● Marcel J. T. Reinders 3●
Wiesje M. van der Flier1,5 ● Henne Holstege1,2,3
Received: 23 April 2018 / Revised: 13 July 2018 / Accepted: 9 August 2018 / Published online: 26 September 2018© The Author(s) 2018. This article is published with open access
AbstractThe detection of genetic loci associated with Alzheimer’s disease (AD) requires large numbers of cases and controls becausevariant effect sizes are mostly small. We hypothesized that variant effect sizes should increase when individuals whorepresent the extreme ends of a disease spectrum are considered, as their genomes are assumed to be maximally enriched ordepleted with disease-associated genetic variants. We used 1,073 extensively phenotyped AD cases with relatively youngage at onset as extreme cases (66.3 ± 7.9 years), 1,664 age-matched controls (66.0 ± 6.5 years) and 255 cognitively healthycentenarians as extreme controls (101.4 ± 1.3 years). We estimated the effect size of 29 variants that were previouslyassociated with AD in genome-wide association studies. Comparing extreme AD cases with centenarian controls increasedthe variant effect size relative to published effect sizes by on average 1.90-fold (SE= 0.29, p= 9.0 × 10⁻⁴). The effect sizeincrease was largest for the rare high-impact TREM2 (R74H) variant (6.5-fold), and significant for variants in/near ECHDC3(4.6-fold), SLC24A4-RIN3 (4.5-fold), NME8 (3.8-fold), PLCG2 (3.3-fold), APOE-ε2 (2.2-fold), and APOE-ε4 (twofold).Comparing extreme phenotypes enabled us to replicate the AD association for 10 variants (p < 0.05) in relatively smallsamples. The increase in effect sizes depended mainly on using centenarians as extreme controls: the average variant effectsize was not increased in a comparison of extreme AD cases and age-matched controls (0.94-fold, p= 6.8 × 10⁻¹),suggesting that on average the tested genetic variants did not explain the extremity of the AD cases. Concluding, usingcentenarians as extreme controls in AD case–control studies boosts the variant effect size by on average twofold, allowingthe replication of disease-association in relatively small samples.
Introduction
Alzheimer’s disease (AD) is often characterized by aslow but progressive loss of cognitive functions, leadingto loss of autonomy. [1] AD is rare at the age of 65 years,but its incidence increases exponentially to 40% at theage of 100 years. [2] It is currently the most prevalentcause of death at old age and one of the major health
These authors contributed equally: Niccolò Tesi, Sven J. van der Lee
* Henne [email protected]
1 Alzheimer Center Amsterdam, Department of Neurology,Amsterdam Neuroscience, Vrije Universiteit Amsterdam,Amsterdam UMC, Amsterdam, The Netherlands
2 Department of Clinical Genetics, Amsterdam UMC,Amsterdam, The Netherlands
3 Delft Bioinformatics Lab, Delft University of Technology,
Delft, The Netherlands4 Department of Complex Trait Genetics, Center for Neurogenomics
and Cognitive Research, VU, Amsterdam, The Netherlands5 Department of Epidemiology and Biostatistics, Amsterdam UMC,
Amsterdam, The Netherlands6 Amsterdam Public Health Research Institute, Amsterdam, The
Netherlands
Electronic supplementary material The online version of this article(https://doi.org/10.1038/s41431-018-0273-5) contains supplementarymaterial, which is available to authorized users.
1234
5678
90();,:
1234567890();,:

threats of the 21st century. [1] Better understanding of theetiological factors that determine AD is warranted as notreatment is currently available. Heritability plays animportant role, as genetic factors are estimated to deter-mine 60–80% of the risk of AD. [3] About 30% of thegenetic risk is attributable to the ε4 allele of APOE gene,and large collaborative efforts have identified over twodozen additional genetic loci that are associated with aslight modification of the risk of AD. [4–17] The designof these association studies relies on the comparison ofvery large numbers of cases with age-matched controls,such that detected associations can be attributed specifi-cally to the disease. [18] However, given the prevalenceof AD in the aging population, it is likely that a significantfraction of the controls will develop the disease at a laterage. Therefore, as the AD risk for future cases likelyinvolves the same genetic variants, using age-matchedcontrols may quench variant association signals. Thismay, in part, explain the mostly small variant effect sizesassociated with common variants. Also, GWAS studiesmostly compare common genetic variants that are widelypropagated in the population; as a consequence, thesehave mostly small effects on AD risk. [19] Raregenetic variants often have larger effect sizes than com-mon variants, but as there are fewer carriers available inthe population, the requirement for large sample sizesstands. [20]
The power of genetic analyses is determined by thevariant frequency, the effect size of the variant, the samplesize, and significance threshold set to be obtained. [21]Therefore, instead of increasing sample sizes of geneticstudies to detect novel disease-associated genetic loci, analternative strategy is to increase variant effect sizes bysampling individuals with extreme phenotypes. [20, 22,23] For AD and other age-related diseases, extreme casesmay be defined by having a relatively early age at diseaseonset, and having the phenotypic features characteristicfor the disease, as defined by diagnostic assessment.Extreme controls are represented by individuals whoreach extreme ages without the disease. [22, 24, 25]Indeed, in a case–control study of type 2 diabetes, theeffect sizes for variants that were previously associatedwith the disease were increased when using centenariansas extreme controls. [24] The effect of using extremephenotypes in other age-related diseases has not beenstudied.
Here, we explored the potential of using extreme phe-notypes for genetic studies of AD by investigating thechange in effect size of known AD-associated variants.Furthermore, using an age- and population-matched refer-ence group, we investigated the contribution of eachextreme phenotype.
Methods
Cohort description
As extreme AD cases group (denoted by EA), we used1,149 AD cases from the Amsterdam Dementia Cohort(ADC). The ADC comprises patients who visit the memoryclinic of the VU University Medical Center, The Nether-lands. [26, 27] This cohort of AD patients is extensivelycharacterized and comprises 503 early-onset cases (denotedby eEA) with an age at onset < 65 years, and 646 late-onsetcases (denoted by lEA). Of the 503 early-onset cases, 255had an age at onset < 60 years (i.e., young early onset,denoted by yEA). The diagnosis of probable AD was basedon the clinical criteria formulated by the National Instituteof Neurological and Communicative Disorders and Stroke—Alzheimer’s Disease and Related Disorders Association(NINCDS-ADRDA) and based on National Institute ofAging–Alzheimer association (NIA-AA). [26–29] At base-line, all subjects underwent a standard clinical diagnosticassessment including neurological examination and stan-dard blood tests. In addition, all subjects underwent mag-netic resonance imaging, an electroencephalogram, andcerebrospinal fluid (CSF) [30] was analyzed for mostpatients. Clinical diagnosis is made in consensus-based,multidisciplinary meetings. Together, this elaborate diag-nostic procedure reduces the chance of misdiagnosis. Theextensive phenotyping in combination with the early dis-ease onset generates an AD cohort that can be regarded“extreme”.
As extreme control group (denoted by EC), we used268 self-reported cognitively healthy centenarians fromthe 100-plus Study cohort. [31] This study includesDutch-speaking individuals who (i) can provide officialevidence for being aged 100 years or older, (ii) self-reportto be cognitively healthy, which is confirmed by a proxy,(iii) consent to donation of a blood sample, (iv) consent to(at least) two home visits from a researcher, and (v)consent to undergo an interview and neuropsychologicaltest battery.
As “normal controls” (denoted by NC) we used 1,717middle-aged (55–85 year-old) individuals from a repre-sentative sample of Dutch individuals from the LongitudinalAging Study Amsterdam (LASA) cohort. [32, 33] LASA isan ongoing longitudinal study of older adults initiated in1991, with the main objective to determine predictors andconsequences of aging.
The Medical Ethics Committee of the VU UniversityMedical Center (METC) approved the ADC cohort, theLASA study and the 100-plus Study. All participants and/ortheir legal guardians gave written informed consent forparticipation in clinical and genetic studies.
Centenarian controls increase variant effect sizes by an average twofold in an extreme. . . 245
Genotyping and imputation of 29 selectedAD-associated genetic variants
We selected 29 single-nucleotide variants for which evi-dence for a genome-wide significant association with ADwas found in previous studies (Table S1, Table S2). [4–17]Genetic variants were determined by standard genotyping orimputation methods. In brief, we genotyped all individualsusing the Illumina Global Screening Array (GSAshar-edCUSTOM_20018389_A2) and applied established qual-ity control methods. [34] We used high-quality genotypingin all individuals (individual call rate > 98%, variant callrate > 98%), individuals with sex mismatches were exclu-ded and Hardy–Weinberg equilibrium-departure was con-sidered significant at p < 1 × 10⁻⁶. Genotypes were preparedfor imputation using provided scripts (HRC-1000G-check-bim.pl). [35] This script compares variant ID, strand andallele frequencies to the haplotype reference panel (HRCv1.1, April 2016). [35] Finally, all autosomal variants weresubmitted to the Michigan imputation server (https://imputationserver.sph.umich.edu). [34] The server uses SHAPEIT2(v2.r790) to phase data and imputation to the referencepanel (v1.1) was performed with Minimac3. [34, 36] A totalof 1,149 extreme AD cases, 1,717 normal controls and 268extreme (centenarian) controls passed quality control. Priorto analysis, we excluded individuals of non-Europeanancestry (NEA= 67, based on 1000Genomes [37] cluster-ing) and individuals with a family relation (NEA= 9, NEC=13, NNC= 53, identity-by-descent ≥ 0.3), [38] leaving 1,073extreme AD cases (NeEA= 464 and NlEA= 609), 1,664normal controls and 255 centenarian controls for theanalysis.
Statistical analysis
For each AD-associated variant, we explored the change ineffect size (E) relative to reported effect sizes when (1)comparing extreme AD cases with extreme (centenarian)controls (EA vs EC); (2) comparing extreme AD cases withnormal controls (EA vs NC); and (3) comparing normal ADcases with extreme (centenarian) controls (NA vs EC). Tocalculate variant effect sizes, we used logistic regressionmodels correcting for population stratification (principalcomponents 1–6). [39, 40] We calculated odds ratios rela-tive to the Haplotype Reference Consortium (HRC) alter-native allele assuming additive genetic effects, andestimated 95% confidence intervals (CIs).
We estimated the change in effect size relative toreported effect sizes (E) as follows:
Ek1�2 ¼
logORk1�2
logORkl
ð1Þ
where Ek1�2 indicates the effect size change for variant k
in a comparison of cohort 1 and cohort 2, e.g, EAPOE ε4EA�EC
indicates the effect size change for the APOE ε4 variantwhen extreme AD cases (EA) are compared with cognitivehealthy centenarians (EC). The logORk
1�2denotes the effectsize of variant k when comparing cohort 1 and cohort 2. Theeffect size of variant k reported in literature (Table S1) isdenoted by logORk
l .We estimated the added value of using extreme
(centenarian) controls rather than “normal age-matchedcontrols” in a case–control analysis. For this, we wantedto compute the change in effect size when comparingnon-extreme AD cases with extreme controls (NA vs EC).As we do not have direct access to “normal AD cases”,we estimated the effect size for the NA-EC comparisonby summing (1) the effect size from the comparisonof “normal AD cases” and “normal controls”, asreported in literature (logORk
l ), and (2) the effect sizefrom the comparison of normal controls (NC)with extreme (centenarian) controls (NC vs EC), i.e.,logORk
NA�EC ¼ logORkl þ logORk
NC�EC. The added valueof using extreme controls in a case–control analysis thenbecomes:
EkNA�EC ¼ logORk
l þ logORkNC�EC
logORkl
ð2Þ
To assess whether age at disease onset had an impacton the change in effect size due to the extreme cases(EEA�NC), we estimated the logORk
eEA�NC (early-onsetextreme AD cases vs normal controls), logORk
lEA�NC
(late-onset extreme AD cases vs normal controls) and thelogORk
yEA�NC (younger early-onset AD cases vs normalcontrols), and their 95% CI. Then, we computed theprobability that the effect size changes Ek
eEA�NC andEklEA�NCdiffered using a two-samples z-test (two-tailed
p value).
Determining significance of change in effect size
For each variant, we estimated Ek1�2 and a 95% CI by
sampling (S= 10,000) from the logORk1�2 and logORk
l
based on their respective standard errors. The probability ofdivergence between the distributions of the logORk
1�2andthe logORk
l was determined using a two-sample z-test (two-tailed p value).
The probability of observing Ek1�2>1, i.e., an increased
effect size for variant k, is considered to be a Bernoullivariable with p= 0.5 (equal chance of having an increased/decreased effect). The number of variants that show anincrease in effect (Ek
1�2>1) then follows a binomialdistribution.
246 N. Tesi et al.
The average change in effect size across all K= 29 testedvariants is calculated as follows:
E1�2 ¼ 1K
XK
k
Ek1�2 ð3Þ
Confidence intervals and probability of divergencebetween E1�2 and previously reported effect sizes wereestimated by sampling (S= 10,000, two-tailed p value).
Quality control of genotype data, population stratificationanalysis, and relatedness analyses were performed withPLINK (v1.90b4.6), whereas association analysis, downstreamanalyses, and plots were performed with R (v3.3.2). [41, 42]
Results
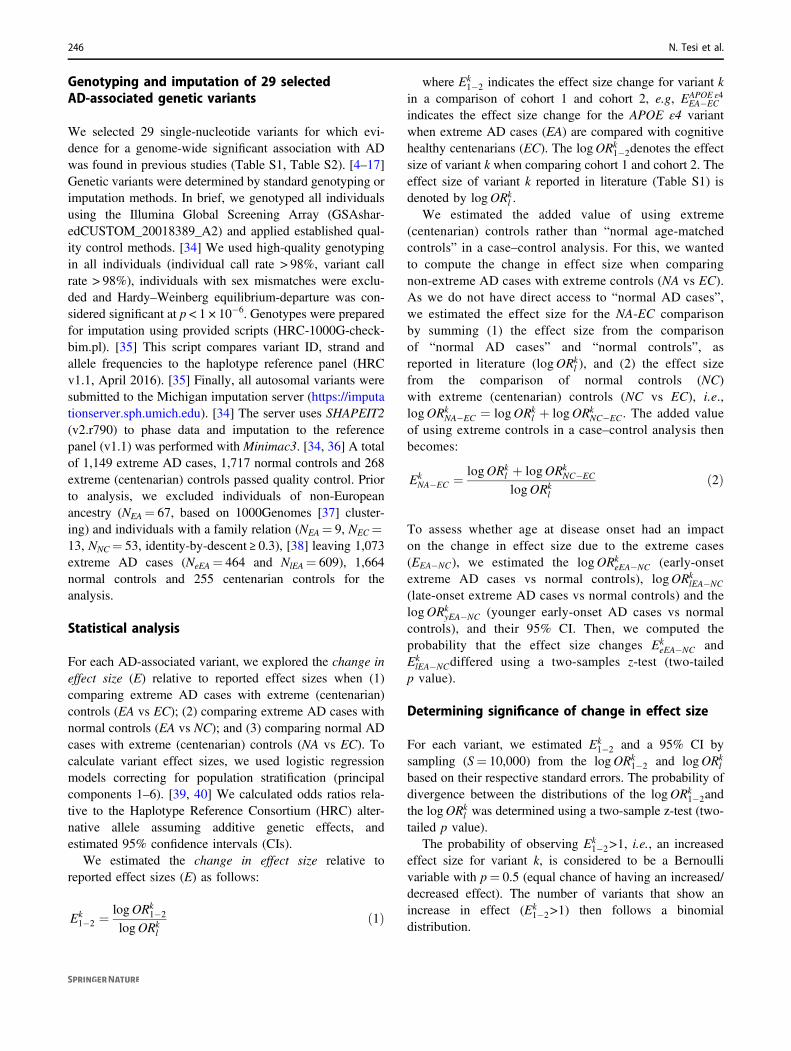
After quality control of the genetic data, we included 1,073extreme AD cases (with mean age at onset 66.4 ± 7.8 and52.7% females), 1,664 normal (age-matched) controls(mean age at inclusion 66.0 ± 6.5, 53.7% females), and 255cognitive healthy centenarians as extreme controls (meanage at inclusion 101.4 ± 1.3, 74.7% females) (Table 1).Within the extreme AD cases group, there were 464 early-onset cases (mean age at onset 59.1 ± 4.1, 54% females),and 609 late-onset cases (mean age at onset 72.1 ± 4.8, 51%females). The age at onset of the extreme AD cases was onaverage 8.2 years earlier compared with previous GWAstudies; the age at disease onset was on average 15.4 yearsearlier in early-onset cases and 2.5 years earlier in late-onsetcases, whereas the age at study inclusion of our centenariancontrols was on average 29.5 years higher than for pre-viously published controls (Fig. 1).
Effect of comparing extreme cases and centenariancontrols
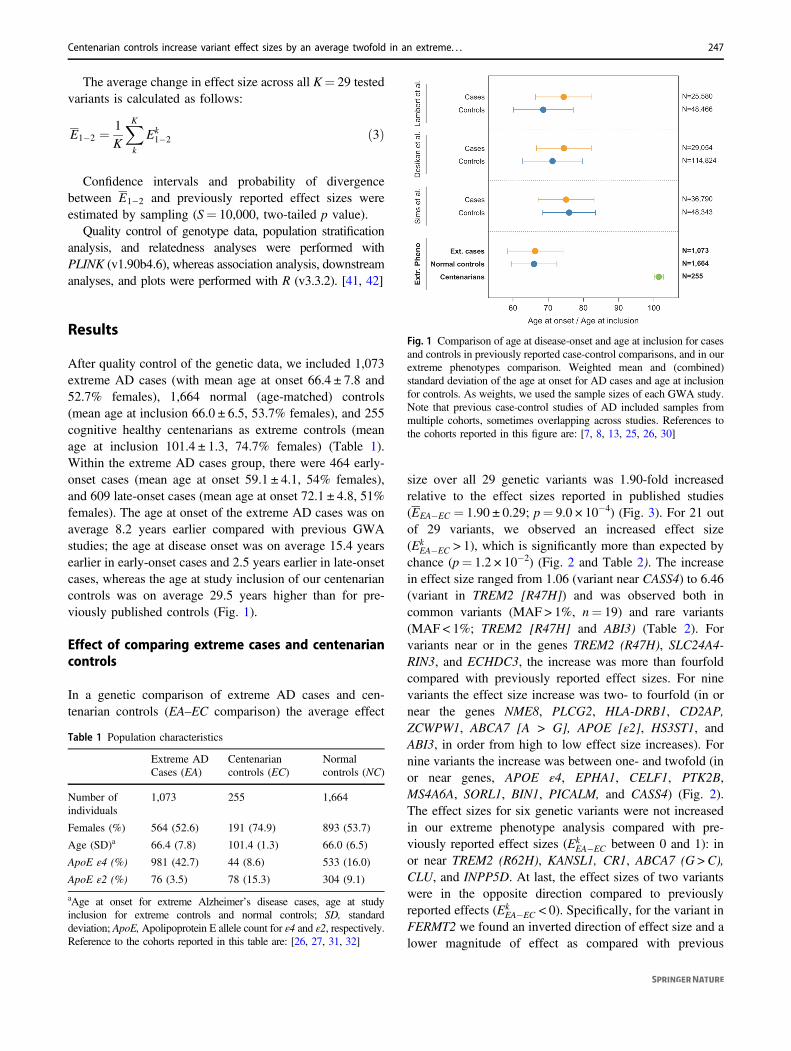
In a genetic comparison of extreme AD cases and cen-tenarian controls (EA–EC comparison) the average effect
size over all 29 genetic variants was 1.90-fold increasedrelative to the effect sizes reported in published studies(EEA�EC = 1.90 ± 0.29; p= 9.0 × 10⁻⁴) (Fig. 3). For 21 outof 29 variants, we observed an increased effect size(Ek
EA�EC > 1), which is significantly more than expected bychance (p= 1.2 × 10⁻²) (Fig. 2 and Table 2). The increasein effect size ranged from 1.06 (variant near CASS4) to 6.46(variant in TREM2 [R47H]) and was observed both incommon variants (MAF > 1%, n= 19) and rare variants(MAF < 1%; TREM2 [R47H] and ABI3) (Table 2). Forvariants near or in the genes TREM2 (R47H), SLC24A4-RIN3, and ECHDC3, the increase was more than fourfoldcompared with previously reported effect sizes. For ninevariants the effect size increase was two- to fourfold (in ornear the genes NME8, PLCG2, HLA-DRB1, CD2AP,ZCWPW1, ABCA7 [A > G], APOE [ε2], HS3ST1, andABI3, in order from high to low effect size increases). Fornine variants the increase was between one- and twofold (inor near genes, APOE ε4, EPHA1, CELF1, PTK2B,MS4A6A, SORL1, BIN1, PICALM, and CASS4) (Fig. 2).The effect sizes for six genetic variants were not increasedin our extreme phenotype analysis compared with pre-viously reported effect sizes (Ek
EA�EC between 0 and 1): inor near TREM2 (R62H), KANSL1, CR1, ABCA7 (G > C),CLU, and INPP5D. At last, the effect sizes of two variantswere in the opposite direction compared to previouslyreported effects (Ek
EA�EC < 0). Specifically, for the variant inFERMT2 we found an inverted direction of effect size and alower magnitude of effect as compared with previous
Table 1 Population characteristics
Extreme ADCases (EA)
Centenariancontrols (EC)
Normalcontrols (NC)
Number ofindividuals
1,073 255 1,664
Females (%) 564 (52.6) 191 (74.9) 893 (53.7)
Age (SD)a 66.4 (7.8) 101.4 (1.3) 66.0 (6.5)
ApoE ε4 (%) 981 (42.7) 44 (8.6) 533 (16.0)
ApoE ε2 (%) 76 (3.5) 78 (15.3) 304 (9.1)
aAge at onset for extreme Alzheimer’s disease cases, age at studyinclusion for extreme controls and normal controls; SD, standarddeviation; ApoE,Apolipoprotein E allele count for ε4 and ε2, respectively.Reference to the cohorts reported in this table are: [26, 27, 31, 32]
Fig. 1 Comparison of age at disease-onset and age at inclusion for casesand controls in previously reported case-control comparisons, and in ourextreme phenotypes comparison. Weighted mean and (combined)standard deviation of the age at onset for AD cases and age at inclusionfor controls. As weights, we used the sample sizes of each GWA study.Note that previous case-control studies of AD included samples frommultiple cohorts, sometimes overlapping across studies. References tothe cohorts reported in this figure are: [7, 8, 13, 25, 26, 30]
Centenarian controls increase variant effect sizes by an average twofold in an extreme. . . 247
studies (EFERMT2EA�EC between 0 and − 1). For the variant near
MEF2C we observed a larger effect size as compared withthose previously published, but in the opposite direction(EMEF2C
EA�EC<− 1).Overall, for seven common variants (MAF > 1%), the
effect size was significantly increased relatively to thepreviously reported effect sizes (Table 2), in or near genesAPOE ε2 (2.2-fold, p= 1.4 × 10⁻⁷), APOE ε4 (2.0-fold,p= 1.5 × 10⁻⁹), SLC24A4-RIN3 (4.5-fold, p= 2.8 × 10⁻³),ECHDC3 (4.6-fold, p= 1.8 × 10⁻²), PLCG2 (3.3-fold p=2.8 × 10⁻²), NME8 (3.9-fold, p= 3.3 × 10⁻²), and MEF2C(−1.9-fold, p= 3.3 × 10⁻²). Variants with significant effectsize changes were also more likely to be associated with ADin a comparison of extreme cases and centenarians. Theassociation with AD reached nominal significance (p <0.05) in 10 out of 21 variants with a changed effect size(Table 2). Next to APOE ε4 (logORAPOE ε4
EA�EC = 2.1, SE=0.17, p= 1.3 × 10⁻³³) and APOE ε2 (logORAPOE ε2
EA�EC =−1.8,p= 3.2 × 10⁻²¹), variants in or near these genes were sig-nificantly associated with AD: SCL24A4-RIN3, PLCG2,ECHDC3, NME8, BIN1, ZCWPW1, ABCA7 (A >G), andHLA-DRB1 (Table 2).
Effect of using extreme AD cases
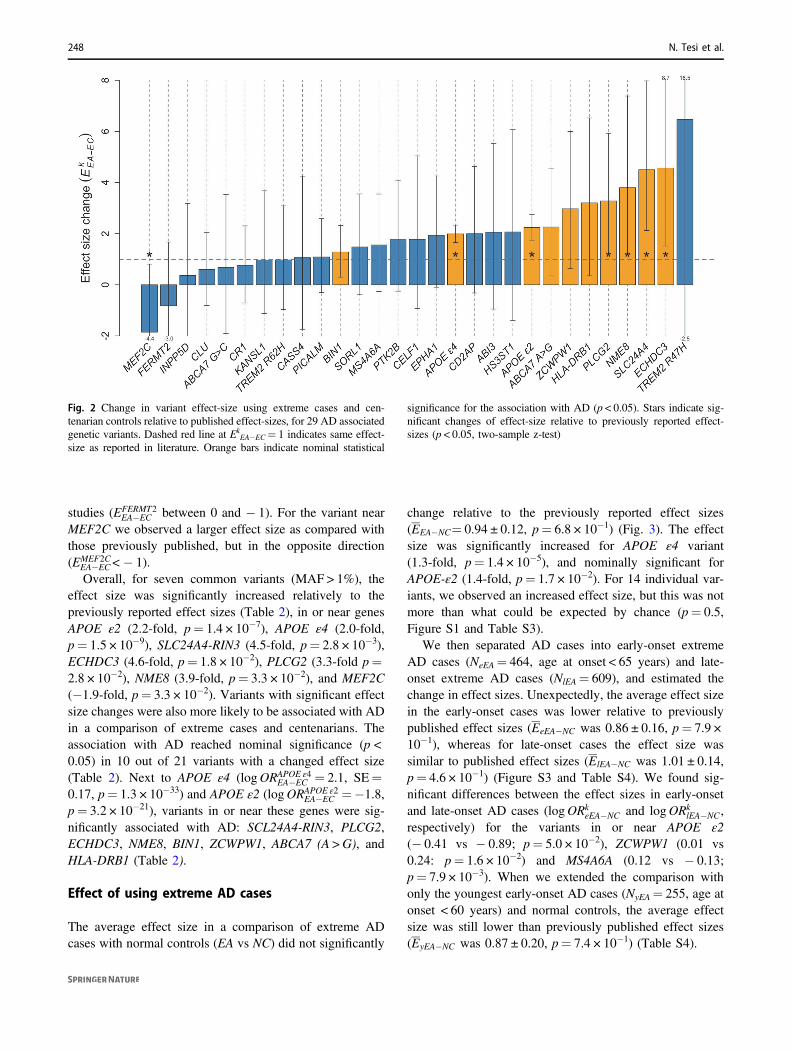
The average effect size in a comparison of extreme ADcases with normal controls (EA vs NC) did not significantly
change relative to the previously reported effect sizes(EEA�NC= 0.94 ± 0.12, p= 6.8 × 10⁻¹) (Fig. 3). The effectsize was significantly increased for APOE ε4 variant(1.3-fold, p= 1.4 × 10⁻⁵), and nominally significant forAPOE-ε2 (1.4-fold, p= 1.7 × 10⁻²). For 14 individual var-iants, we observed an increased effect size, but this was notmore than what could be expected by chance (p= 0.5,Figure S1 and Table S3).
We then separated AD cases into early-onset extremeAD cases (NeEA= 464, age at onset < 65 years) and late-onset extreme AD cases (NlEA= 609), and estimated thechange in effect sizes. Unexpectedly, the average effect sizein the early-onset cases was lower relative to previouslypublished effect sizes (EeEA�NC was 0.86 ± 0.16, p= 7.9 ×10⁻¹), whereas for late-onset cases the effect size wassimilar to published effect sizes (ElEA�NC was 1.01 ± 0.14,p= 4.6 × 10⁻¹) (Figure S3 and Table S4). We found sig-nificant differences between the effect sizes in early-onsetand late-onset AD cases (logORk
eEA�NC and logORklEA�NC,
respectively) for the variants in or near APOE ε2(− 0.41 vs − 0.89; p= 5.0 × 10⁻²), ZCWPW1 (0.01 vs0.24: p= 1.6 × 10⁻²) and MS4A6A (0.12 vs − 0.13;p= 7.9 × 10⁻³). When we extended the comparison withonly the youngest early-onset AD cases (NyEA= 255, age atonset < 60 years) and normal controls, the average effectsize was still lower than previously published effect sizes(EyEA�NC was 0.87 ± 0.20, p= 7.4 × 10⁻¹) (Table S4).
Fig. 2 Change in variant effect-size using extreme cases and cen-tenarian controls relative to published effect-sizes, for 29 AD associatedgenetic variants. Dashed red line at Ek
EA−EC= 1 indicates same effect-size as reported in literature. Orange bars indicate nominal statistical
significance for the association with AD (p < 0.05). Stars indicate sig-nificant changes of effect-size relative to previously reported effect-sizes (p < 0.05, two-sample z-test)
248 N. Tesi et al.
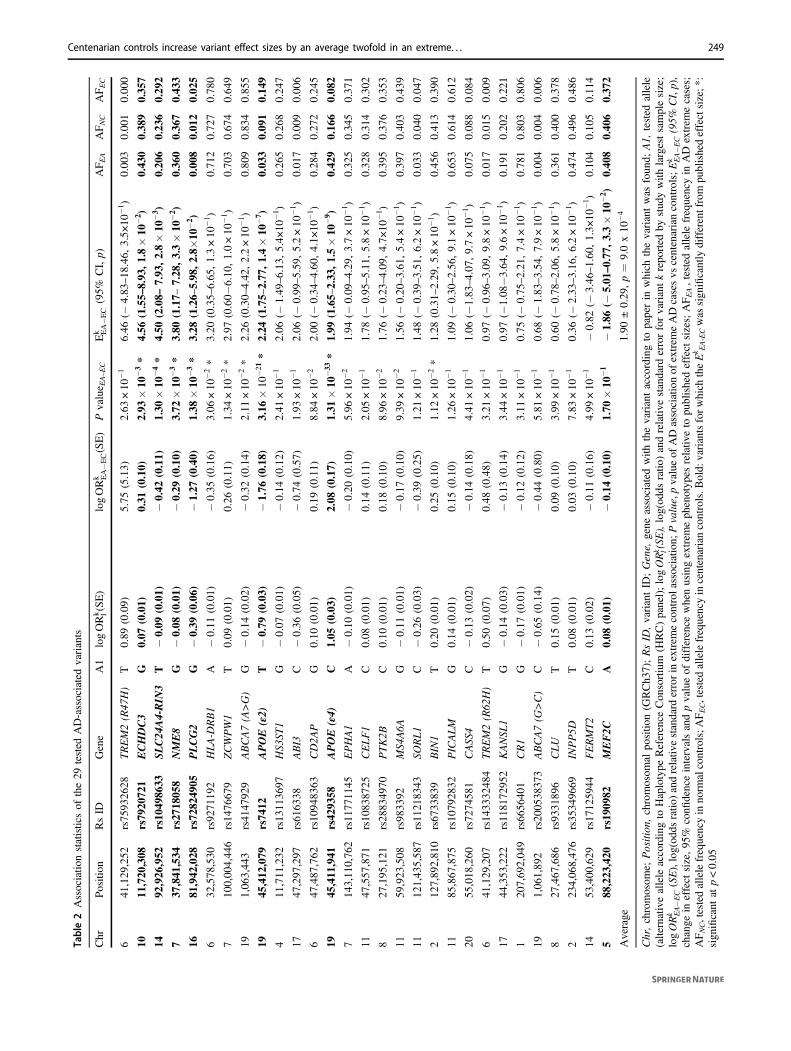
Table2Associatio
nstatisticsof
the29
tested
AD-associatedvariants
Chr
Position
RsID
Gene
A1
logORk l(SE)
logORk EA�E
C(SE)
Pvalue E
A–EC
Ek EA�E
C(95%
CI,p)
AF E
AAF N
CAF E
C
641
,129
,252
rs75
9326
28TREM2(R47
H)
T0.89
(0.09)
5.75
(5.13)
2.63
×10
−1
6.46
(−4.83
–18
.46,
3.5×
10−1 )
0.00
30.00
10.00
0
1011
,720
,308
rs79
2072
1ECHDC3
G0.07
(0.01)
0.31
(0.10)
2.93
×10
−3*
4.56
(1.55–
8.93
,1.8×10
−2 )
0.43
00.38
90.35
7
1492
,926
,952
rs10
4986
33SL
C24
A4-RIN
3T
−0.09
(0.01)
−0.42
(0.11)
1.30
×10
−4*
4.50
(2.08–
7.93
,2.8×10
−3 )
0.20
60.23
60.29
2
737
,841
,534
rs27
1805
8NME8
G−0.08
(0.01)
−0.29
(0.10)
3.72
×10
−3*
3.80
(1.17–
7.28
,3.3×10
−2 )
0.36
00.36
70.43
3
1681
,942
,028
rs72
8249
05PLCG2
G−0.39
(0.06)
−1.27
(0.40)
1.38
×10
−3*
3.28
(1.26–
5.98
,2.8×
10−2 )
0.00
80.01
20.02
5
632
,578
,530
rs92
7119
2HLA-D
RB1
A−0.11
(0.01)
−0.35
(0.16)
3.06
×10
−2*
3.20
(0.35–
6.65
,1.3×10
−1 )
0.71
20.72
70.78
0
710
0,00
4,44
6rs14
7667
9ZCWPW1
T0.09
(0.01)
0.26
(0.11)
1.34
×10
−2*
2.97
(0.60−
6.10
,1.0×10
−1 )
0.70
30.67
40.64
9
191,06
3,44
3rs41
4792
9ABCA7(A>G)
G−0.14
(0.02)
−0.32
(0.14)
2.11
×10
−2*
2.26
(0.30–
4.42
,2.2×10
−1 )
0.80
90.83
40.85
5
1945
,412
,079
rs74
12APOE
(ε2)
T−0.79
(0.03)
−1.76
(0.18)
3.16
×10
−21
*2.24
(1.75–
2.77
,1.4×10
−7 )
0.03
30.09
10.14
9
411
,711
,232
rs13
1136
97HS3
ST1
G−0.07
(0.01)
−0.14
(0.12)
2.41
×10
−1
2.06
(−1.49
–6.13
,5.4×
10−1 )
0.26
50.26
80.24
7
1747
,297
,297
rs61
6338
ABI3
C−0.36
(0.05)
−0.74
(0.57)
1.93
×10
−1
2.06
(−0.99
–5.59
,5.2×10
−1 )
0.01
70.00
90.00
6
647
,487
,762
rs10
9483
63CD2A
PG
0.10
(0.01)
0.19
(0.11)
8.84
×10
−2
2.00
(−0.34
–4.60
,4.1×
10−1 )
0.28
40.27
20.24
5
1945
,411
,941
rs42
9358
APOE
(ε4)
C1.05
(0.03)
2.08
(0.17)
1.31
×10
−33
*1.99
(1.65–
2.33
,1.5×10
−9 )
0.42
90.16
60.08
2
714
3,11
0,76
2rs11
7711
45EPHA1
A−0.10
(0.01)
−0.20
(0.10)
5.96
×10
−2
1.94
(−0.09
–4.29
,3.7×10
−1 )
0.32
50.34
50.37
1
1147
,557
,871
rs10
8387
25CELF1
C0.08
(0.01)
0.14
(0.11)
2.05
×10
−1
1.78
(−0.95
–5.11
,5.8×10
−1 )
0.32
80.31
40.30
2
827
,195
,121
rs28
8349
70PTK2B
C0.10
(0.01)
0.18
(0.10)
8.96
×10
−2
1.76
(−0.23
–4.09
,4.7×
10−1 )
0.39
50.37
60.35
3
1159
,923
,508
rs98
3392
MS4
A6A
G−0.11
(0.01)
−0.17
(0.10)
9.39
×10
−2
1.56
(−0.20
–3.61
,5.4×10
−1 )
0.39
70.40
30.43
9
1112
1,43
5,58
7rs11
2183
43SO
RL1
C−0.26
(0.03)
−0.39
(0.25)
1.21
×10
−1
1.48
(−0.39
–3.51
,6.2×10
−1 )
0.03
30.04
00.04
7
212
7,89
2,81
0rs67
3383
9BIN1
T0.20
(0.01)
0.25
(0.10)
1.12
×10
−2*
1.28
(0.31–
2.29
,5.8×10
−1 )
0.45
60.41
30.39
0
1185
,867
,875
rs10
7928
32PICALM
G0.14
(0.01)
0.15
(0.10)
1.26
×10
−1
1.09
(−0.30
–2.56
,9.1×10
−1 )
0.65
30.61
40.61
2
2055
,018
,260
rs72
7458
1CASS
4C
−0.13
(0.02)
−0.14
(0.18)
4.41
×10
−1
1.06
(−1.83–4.07
,9.7×10
−1 )
0.07
50.08
80.08
4
641
,129
,207
rs14
3332
484
TREM2(R62
H)
T0.50
(0.07)
0.48
(0.48)
3.21
×10
−1
0.97
(−0.96
–3.09
,9.8×10
−1 )
0.01
70.01
50.00
9
1744
,353
,222
rs11
8172
952
KANSL
1G
−0.14
(0.03)
−0.13
(0.14)
3.44
×10
−1
0.97
(−1.08−3.64
,9.6×10
−1 )
0.19
10.20
20.22
1
120
7,69
2,04
9rs66
5640
1CR1
G−0.17
(0.01)
−0.12
(0.12)
3.11
×10
−1
0.75
(−0.75
–2.21
,7.4×10
−1 )
0.78
10.80
30.80
6
191,06
1,89
2rs20
0538
373
ABCA7(G
>C)
C−0.65
(0.14)
−0.44
(0.80)
5.81
×10
−1
0.68
(−1.83
–3.54
,7.9×10
−1 )
0.00
40.00
40.00
6
827
,467
,686
rs93
3189
6CLU
T0.15
(0.01)
0.09
(0.10)
3.99
×10
−1
0.60
(−0.78
–2.06
,5.8×10
−1 )
0.36
10.40
00.37
8
223
4,06
8,47
6rs35
3496
69INPP5D
T0.08
(0.01)
0.03
(0.10)
7.83
×10
−1
0.36
(−2.33
–3.16
,6.2×10
−1 )
0.47
40.49
60.48
6
1453
,400
,629
rs17
1259
44FERMT2
C0.13
(0.02)
−0.11
(0.16)
4.99
×10
−1
−0.82
(−3.46–1.60
,1.3×
10−1 )
0.10
40.10
50.11
4
588
,223
,420
rs19
0982
MEF2C
A0.08
(0.01)
−0.14
(0.10)
1.70
×10
−1
−1.86
(−5.01–0.77
,3.3×10
−2 )
0.40
80.40
60.37
2
Average
1.90
±0.29
,p=
9.0x10
−4
Chr,chromosom
e;Position
,chromosom
alpo
sitio
n(G
RCh3
7);RsID
,variantID
;Gene,
gene
associated
with
thevariantaccordingto
paperin
which
thevariantwas
foun
d;A1,
tested
allele
(alternativeallele
accordingto
Haplotype
Reference
Con
sortium
(HRC)panel);logORk l(SE),log(od
dsratio
)andrelativ
estandard
errorforvariantkrepo
rted
bystud
ywith
largestsamplesize;
logORk EA�E
C(SE),log(od
dsratio
)andrelativ
estandard
errorin
extrem
econtrolassociatio
n;Pvalue,pvalueof
ADassociationof
extrem
eADcasesvs
centenariancontrols;E
k EA�E
C(95%
CI,p),
change
ineffect
size,95
%confi
denceintervalsandpvalueof
difference
whenusingextrem
eph
enotyp
esrelativ
eto
publishedeffect
sizes;AFEA,tested
allele
frequencyin
AD
extrem
ecases;
AFNC,testedallelefrequencyin
norm
alcontrols;A
FEC,testedallelefrequencyin
centenariancontrols.B
old:
variantsforwhich
theEk E
A-ECwas
sign
ificantly
differentfrom
publishedeffectsize;*
:sign
ificant
atp<0.05
Centenarian controls increase variant effect sizes by an average twofold in an extreme. . . 249
Effect of extreme controls
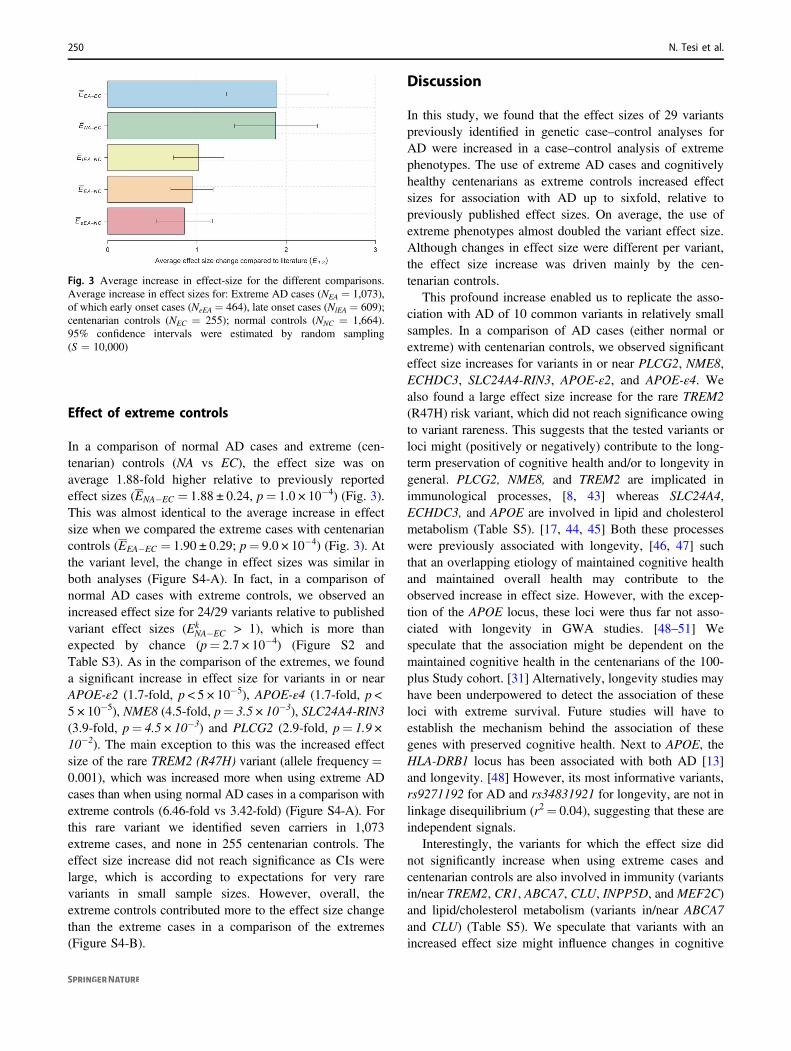
In a comparison of normal AD cases and extreme (cen-tenarian) controls (NA vs EC), the effect size was onaverage 1.88-fold higher relative to previously reportedeffect sizes (ENA�EC = 1.88 ± 0.24, p= 1.0 × 10⁻⁴) (Fig. 3).This was almost identical to the average increase in effectsize when we compared the extreme cases with centenariancontrols (EEA�EC = 1.90 ± 0.29; p= 9.0 × 10⁻⁴) (Fig. 3). Atthe variant level, the change in effect sizes was similar inboth analyses (Figure S4-A). In fact, in a comparison ofnormal AD cases with extreme controls, we observed anincreased effect size for 24/29 variants relative to publishedvariant effect sizes (Ek
NA�EC > 1), which is more thanexpected by chance (p= 2.7 × 10⁻⁴) (Figure S2 andTable S3). As in the comparison of the extremes, we founda significant increase in effect size for variants in or nearAPOE-ε2 (1.7-fold, p < 5 × 10⁻⁵), APOE-ε4 (1.7-fold, p <5 × 10⁻⁵), NME8 (4.5-fold, p= 3.5 × 10⁻³), SLC24A4-RIN3(3.9-fold, p= 4.5 × 10⁻³) and PLCG2 (2.9-fold, p= 1.9 ×10⁻²). The main exception to this was the increased effectsize of the rare TREM2 (R47H) variant (allele frequency=0.001), which was increased more when using extreme ADcases than when using normal AD cases in a comparison withextreme controls (6.46-fold vs 3.42-fold) (Figure S4-A). Forthis rare variant we identified seven carriers in 1,073extreme cases, and none in 255 centenarian controls. Theeffect size increase did not reach significance as CIs werelarge, which is according to expectations for very rarevariants in small sample sizes. However, overall, theextreme controls contributed more to the effect size changethan the extreme cases in a comparison of the extremes(Figure S4-B).
Discussion
In this study, we found that the effect sizes of 29 variantspreviously identified in genetic case–control analyses forAD were increased in a case–control analysis of extremephenotypes. The use of extreme AD cases and cognitivelyhealthy centenarians as extreme controls increased effectsizes for association with AD up to sixfold, relative topreviously published effect sizes. On average, the use ofextreme phenotypes almost doubled the variant effect size.Although changes in effect size were different per variant,the effect size increase was driven mainly by the cen-tenarian controls.
This profound increase enabled us to replicate the asso-ciation with AD of 10 common variants in relatively smallsamples. In a comparison of AD cases (either normal orextreme) with centenarian controls, we observed significanteffect size increases for variants in or near PLCG2, NME8,ECHDC3, SLC24A4-RIN3, APOE-ε2, and APOE-ε4. Wealso found a large effect size increase for the rare TREM2(R47H) risk variant, which did not reach significance owingto variant rareness. This suggests that the tested variants orloci might (positively or negatively) contribute to the long-term preservation of cognitive health and/or to longevity ingeneral. PLCG2, NME8, and TREM2 are implicated inimmunological processes, [8, 43] whereas SLC24A4,ECHDC3, and APOE are involved in lipid and cholesterolmetabolism (Table S5). [17, 44, 45] Both these processeswere previously associated with longevity, [46, 47] suchthat an overlapping etiology of maintained cognitive healthand maintained overall health may contribute to theobserved increase in effect size. However, with the excep-tion of the APOE locus, these loci were thus far not asso-ciated with longevity in GWA studies. [48–51] Wespeculate that the association might be dependent on themaintained cognitive health in the centenarians of the 100-plus Study cohort. [31] Alternatively, longevity studies mayhave been underpowered to detect the association of theseloci with extreme survival. Future studies will have toestablish the mechanism behind the association of thesegenes with preserved cognitive health. Next to APOE, theHLA-DRB1 locus has been associated with both AD [13]and longevity. [48] However, its most informative variants,rs9271192 for AD and rs34831921 for longevity, are not inlinkage disequilibrium (r2= 0.04), suggesting that these areindependent signals.
Interestingly, the variants for which the effect size didnot significantly increase when using extreme cases andcentenarian controls are also involved in immunity (variantsin/near TREM2, CR1, ABCA7, CLU, INPP5D, and MEF2C)and lipid/cholesterol metabolism (variants in/near ABCA7and CLU) (Table S5). We speculate that variants with anincreased effect size might influence changes in cognitive
Fig. 3 Average increase in effect-size for the different comparisons.Average increase in effect sizes for: Extreme AD cases (NEA = 1,073),of which early onset cases (NeEA = 464), late onset cases (NlEA = 609);centenarian controls (NEC = 255); normal controls (NNC = 1,664).95% confidence intervals were estimated by random sampling(S = 10,000)
250 N. Tesi et al.

health during aging while variants with no increased effectsize do not influence these processes.
Using extreme cases did not increase the variant effectsizes relative to published effect sizes, even though most ofthe extreme cases were biomarker confirmed and their meanage at onset was 8.2 years younger than the mean age atonset in other studies. [7, 8, 13] The only exception to thiswas the (non-significant) effect size increase for the rareTREM2 (R47H) risk variant, which was driven in part byusing extreme AD cases. This suggests that based on thetested genetic variants, the “phenotypically extreme” casespresented in this study were not genetically more extremethan cases presented in other studies. In fact, the varianteffect sizes of early-onset AD cases were on average lowerthan the variant effect size of late-onset AD cases, and thispersists even when selecting only the youngest early-onsetcases. One explanation for this observation may be that anearly age at onset may be driven by rare, high-impact var-iants, [19] whereas the disease onset at later ages may dependto a greater extent on more common risk variants. Further-more, we found significant differences at the variant level,between the effect sizes in early-onset and late-onset casesfor common variants in/near ZCWPW1 and APOE ε2, andalso in —opposite directions— for the variant in MS4A6A.These results are a first indication that these variants maydifferentially influence age of disease onset, however, futureexperiments will have to confirm this finding.
Our main finding is that, in a genetic case–control studyof extreme phenotypes, the majority of the observedincrease in effect size is attributable to the extreme controls,implicating that collecting cohorts of extreme controls isprofitable. We note that the centenarians used in this studywere selected for their preserved cognitive health, whichmight have further enlarged the effect size increase forgenetic variants that were previously identified for their ADassociation. We acknowledge that using centenarians ascontrols in genetic studies of AD could result in thedetection of variants associated with extreme longevity,such that newly detected AD-associations need to be ver-ified in an age-matched AD case–control setting. Never-theless, the effect sizes for all but two variants are in thesame direction as previously reported, which suggests thatthe tested AD variants do not have significant pleiotropicactivities that counteract their AD-related survival effects.Notably, the two variants with an opposite effect, in or nearMEF2C and FERMT2, also did not associate with AD inour age-matched case–control analysis. This suggests thatthe AD association of these variants is not consistent acrossstudies. This is in line with results from unpublishedGWASs of AD in which AD-associations of variants neartheMEF2C and FERMT2 genes were not replicated [52, 53](p= 5.4 × 10⁻³, [52] p= 3.0 × 10⁻⁴ for MEF2C [53] andp= 1.6 × 10⁻⁵ for FERMT2 [53] variant, with 5.0 × 10⁻⁸
being the genome-wide significance threshold). A strengthof our study is that our cohorts of AD patients and controls,were not previously used in the discovery of any of theknown AD-associated variants; [4–17] we thus provideindependent replication in a genetically homogeneousgroup of individuals, as they all came from one specificpopulation (Dutch).
Concluding, in our comparison of cases and controlswith extreme phenotypes we found that on average, theeffect of AD-related variants in genetic association studiesalmost doubled, whereas at the variant level effect sizesincreased up to sixfold. The observed increment in effectsize was driven by the centenarians as extreme controls,identifying centenarians as a valuable resource for geneticstudies, with possible applications for other age-relateddiseases.
Acknowledgements Research of the Alzheimer center Amsterdam ispart of the neurodegeneration research program of Amsterdam Neu-roscience (www.amsterdamresearch.org). The Alzheimer Cen-ter Amsterdam is supported by Stichting Alzheimer Nederland(WE09.2014-03) and Stiching VUmc fonds. The clinical databasestructure was developed with funding from Stichting Dioraphte (VSM14 04 14 02). The Dutch case–control study is part of EADB (Eur-opean Alzheimer DNA biobank) funded by JPcofundNL (ZonMWproject number: 733051061). This work was in part carried out on theDutch national e-infrastructure with the support of SURF Cooperative.
Compliance with ethical standards
Conflict of interest The authors declare no conflict of interests.
Open Access This article is licensed under a Creative CommonsAttribution 4.0 International License, which permits use, sharing,adaptation, distribution and reproduction in any medium or format, aslong as you give appropriate credit to the original author(s) and thesource, provide a link to the Creative Commons license, and indicate ifchanges were made. The images or other third party material in thisarticle are included in the article’s Creative Commons license, unlessindicated otherwise in a credit line to the material. If material is notincluded in the article’s Creative Commons license and your intendeduse is not permitted by statutory regulation or exceeds the permitteduse, you will need to obtain permission directly from the copyrightholder. To view a copy of this license, visit http://creativecommons.org/licenses/by/4.0/.
References
1. Alzheimer’s Association. 2012 Alzheimer’s disease facts andfigures. Alzheimers Dement. 2012;8:131–68.
2. Corrada MM, Brookmeyer R, Paganini-Hill A, Berlau D, KawasCH. Dementia incidence continues to increase with age in theoldest old: The 90+study. Ann Neurol. 2010;67:114–21.
3. Gatz M, Reynolds CA, Fratiglioni L, et al. Role of genes andenvironments for explaining Alzheimer disease. Arch Gen Psy-chiatry. 2006;63:168–74.
4. Lambert J-C, Heath S, Even G, et al. Genome-wide associationstudy identifies variants at CLU and CR1 associated with Alz-heimer’s disease. Nat Genet. 2009;41:1094–9.
Centenarian controls increase variant effect sizes by an average twofold in an extreme. . . 251
5. Harold D, Abraham R, Hollingworth P, et al. Genome-wideassociation study identifies variants at CLU and PICALM asso-ciated with Alzheimer’s disease. Nat Genet. 2009;41:1088–93.
6. Seshadri S, Fitzpatrick AL, Ikram MA, et al. Genome-wide ana-lysis of genetic loci associated with Alzheimer disease. JAMA.2010;303:1832–40.
7. Desikan RS, Schork AJ, Wang Y, et al. Polygenic overlapbetween C-reactive protein, plasma lipids, and Alzheimer disease.Circulation. 2015;131:2061–9.
8. Sims R, van der Lee SJ, Naj AC, et al. Rare coding variants inPLCG2, ABI3, and TREM2 implicate microglial-mediated innateimmunity in Alzheimer’s disease. Nat Genet. 2017;49:1373–84.
9. Guerreiro R, Wojtas A, Bras J, et al. TREM2 variants in Alz-heimer’s disease. N Engl J Med. 2013;368:117–27.
10. Jonsson T, Stefansson H, Steinberg S, et al. Variant of TREM2associated with the risk of Alzheimer’s disease. N Engl J Med.2013;368:107–16.
11. Hollingworth P, Harold D, Sims R, et al. Common variants atABCA7, MS4A6A/MS4A4E, EPHA1, CD33 and CD2AP areassociated with Alzheimer’s disease. Nat Genet. 2011;43:429–35.
12. Naj AC, Jun G, Beecham GW, et al. Common variants at MS4A4/MS4A6E, CD2AP, CD33 and EPHA1 are associated with late-onset Alzheimer’s disease. Nat Genet. 2011;43:436–41.
13. Lambert JC, Ibrahim-Verbaas CA, Harold D, et al. Meta-analysisof 74,046 individuals identifies 11 new susceptibility loci forAlzheimer’s disease. Nat Genet. 2013;45:1452–8.
14. Jun G, Ibrahim-Verbaas CA, Vronskaya M, et al. A novel Alz-heimer disease locus located near the gene encoding tau protein.Mol Psychiatry. 2016;21:108–17.
15. Steinberg S, Stefansson H, Jonsson T, et al. Loss-of-functionvariants in ABCA7 confer risk of Alzheimer’s disease. Nat Genet.2015;47:445–7.
16. Strittmatter WJ, Saunders AM, Schmechel D, et al. Apolipopro-tein E: high-avidity binding to beta-amyloid and increased fre-quency of type 4 allele in late-onset familial Alzheimer disease.Proc Natl Acad Sci USA. 1993;90:1977–81.
17. Corder EH, Saunders AM, Risch NJ, et al. Protective effect ofapolipoprotein E type 2 allele for late onset Alzheimer disease.Nat Genet. 1994;7:180–4.
18. Rose S, van der Laan MJ. Why Match? Investigating MatchedCase-Control Study Designs with Causal Effect Estimation. Int JBiostat. 2009; 5:1.
19. Lord J, Lu AJ, Cruchaga C. Identification of rare variants inAlzheimerâ€TMs disease. Front Genet 2014; 5. https://doi.org/10.3389/fgene.2014.00369.
20. Lee S, Abecasis GR, Boehnke M, Lin X. Rare-variant associationanalysis: study designs and statistical tests. Am J Hum Genet.2014;95:5–23.
21. Hong EP, Park JW. Sample size and statistical power calculationin genetic association studies. Genomics Inform. 2012;10:117–22.
22. Li D, Lewinger JP, Gauderman WJ, Murcray CE, Conti D. Usingextreme phenotype sampling to identify the rare causal variants ofquantitative traits in association studies. Genet Epidemiol.2011;35:790–9.
23. Barnett IJ, Lee S, Lin X. Detecting rare variant effects usingextreme phenotype sampling in sequencing association studies.Genet Epidemiol. 2013;37:142–51.
24. Garagnani P, Giuliani C, Pirazzini C, et al. Centenarians as super-controls to assess the biological relevance of genetic risk factorsfor common age-related diseases: a proof of principle on type 2diabetes. Aging. 2013;5:373–85.
25. Peloso GM, Rader DJ, Gabriel S, Kathiresan S, Daly MJ, NealeBM. Phenotypic extremes in rare variant study designs. Eur JHum Genet. 2016;24:924–30.
26. van der Flier WM, Pijnenburg YAL, Prins N, et al. Optimizingpatient care and research: the Amsterdam Dementia Cohort. JAlzheimers Dis. 2014;41:313–27.
27. van der Flier WM, Scheltens P. Amsterdam dementia cohort:performing research to optimize care. J Alzheimers Dis.2018;62:1091–111.
28. Varma AR, Snowden JS, Lloyd JJ, Talbot PR, Mann DM, NearyD. Evaluation of the NINCDS-ADRDA criteria in the differ-entiation of Alzheimer’s disease and frontotemporal dementia. JNeurol Neurosurg Psychiatry. 1999;66:184–8.
29. Blacker D, Albert MS, Bassett SS, Go RC, Harrell LE, FolsteinMF. Reliability and validity of NINCDS-ADRDA criteria forAlzheimer’s disease. The National Institute of Mental HealthGenetics Initiative. Arch Neurol. 1994;51:1198–204.
30. Simonsen AH, Herukka S-K, Andreasen N, et al. Recommenda-tions for CSF AD biomarkers in the diagnostic evaluation ofdementia. Alzheimers Dement. 2017;13:274–84.
31. Holstege H, Beker N, Dijkstra T et al. The 100-plus Study ofDutch cognitively healthy centenarians: rationale, design andcohort description. 2018. https://doi.org/10.1101/295287.
32. Huisman M, Poppelaars J, van der Horst M, et al. Cohort profile:the longitudinal aging study Amsterdam. Int J Epidemiol.2011;40:868–76.
33. Hoogendijk EO, Deeg DJH, Poppelaars J, et al. The longitudinalaging study Amsterdam: cohort update 2016 and major findings.Eur J Epidemiol. 2016;31:927–45.
34. Das S, Forer L, Schönherr S, et al. Next-generation genotypeimputation service and methods. Nat Genet. 2016;48:1284–7.
35. McCarthy S, Das S, Kretzschmar W, et al. A reference panel of64,976 haplotypes for genotype imputation. Nat Genet.2016;48:1279–83.
36. O’Connell J, Gurdasani D, Delaneau O, et al. A general approachfor haplotype phasing across the full spectrum of relatedness.PLoS Genet. 2014;10:e1004234.
37. 1000 Genomes Project Consortium, Auton A, Brooks LD, et al. Aglobal reference for human genetic variation. Nature. 2015;526:68–74.
38. Anderson CA, Pettersson FH, Clarke GM, Cardon LR, Morris AP,Zondervan KT. Data quality control in genetic case–controlassociation studies. Nat Protoc. 2010;5:1564–73.
39. Price AL, Zaitlen NA, Reich D, Patterson N. New approaches topopulation stratification in genome-wide association studies. NatRev Genet. 2010;11:459–63.
40. Price AL, Patterson NJ, Plenge RM, Weinblatt ME, Shadick NA,Reich D. Principal components analysis corrects for stratificationin genome-wide association studies. Nat Genet. 2006;38:904–9.
41. Purcell S, Neale B, Todd-Brown K, et al. PLINK: a tool set forwhole-genome association and population-based linkage analyses.Am J Hum Genet. 2007;81:559–75.
42. R Core Team. R: a language and environment for statistical com-puting. R Foundation for Statistical Computing, Vienna, Austria.
43. Van Cauwenberghe C, Van Broeckhoven C, Sleegers K. Thegenetic landscape of Alzheimer disease: clinical implications andperspectives. Genet Med. 2016;18:421–30.
44. Saunders AM, Strittmatter WJ, Schmechel D, et al. Association ofapolipoprotein E allele epsilon 4 with late-onset familial andsporadic Alzheimer’s disease. Neurology. 1993;43:1467–72.
45. Kraja AT, Borecki IB, Tsai MY, et al. Genetic analysis of 16NMR-lipoprotein fractions in humans, the GOLDN study. Lipids.2013;48:155–65.
46. Brooks-Wilson AR. Genetics of healthy aging and longevity.Hum Genet. 2013;132:1323–38.
47. vB Hjelmborg J, Iachine I, Skytthe A, et al. Genetic influence onhuman lifespan and longevity. Hum Genet. 2006;119:312–21.
252 N. Tesi et al.
48. Joshi PK, Pirastu N, Kentistou KA et al. Genome-wide meta-analysis associates HLA-DQA1/DRB1 and LPA and lifestylefactors with human longevity. Nat Commun. 2017; 8:910.
49. Ryu S, Atzmon G, Barzilai N, Raghavachari N, Suh Y. Geneticlandscape of APOE in human longevity revealed by high-throughput sequencing. Mech Ageing Dev. 2016;155:7–9.
50. Broer L, Buchman AS, Deelen J, et al. GWAS of longevity inCHARGE consortium confirms APOE and FOXO3 candidacy. JGerontol A Biol Sci Med Sci. 2015;70:110–8.
51. Sebastiani P, Gurinovich A, Bae H, et al. Four genome-wideassociation studies identify new extreme longevity variantas. JGerontol Ser A. 2017;72:1453–64.
52. Marioni R, Harris SE, McRae AF et al. GWAS on family historyof Alzheimer’s disease. 2018;8:99.
53. Jansen I, Savage J, Watanabe K et al. Genetic meta-analysisidentifies 9 novel loci and functional pathways for Alzheimersdisease risk. bioRxiv. 2018. https://doi.org/10.1101/258533.
Centenarian controls increase variant effect sizes by an average twofold in an extreme. . . 253