Census of Public and Semi Government Sector ... - Sri Lanka · government agencies and semi...
148
Census of Public and Semi Government Sector Employment - 2016 Department of Census and Statistics Ministry of National Policies and Economic Affairs Final Report
Transcript of Census of Public and Semi Government Sector ... - Sri Lanka · government agencies and semi...
Census of Public andSemi Government SectorEmployment - 2016
Department of Census and StatisticsMinistry of National Policies and Economic Affairs
Final Report
Printed by : Printing Division - Department of Census & Statistics
Census of Public and Semi Government Sector Employment - 2016
Final Report
Department of Census and Statistics
Ministry of National Policies and Economic Affairs

Census of Public and Semi Government Sector Employment - 2016
-ii-
Census of Public and Semi Government Sector Employment - 2016
-iii-
PREFACE
The latest round of the Census of Public and Semi Government Sector Employment was conducted
by the Department of Census and Statistics in 2016. This is the eighth in the series of such
censuses conducted by the Department of Census and Statistics covering both the public and semi
government sector employment since 1980.
The Census which was carried out in all institutions throughout the country between 9.30am and
11.30am on 17 November 2016 covered public and semi government institutions coming under
the Central Government and Provincial Councils. This publication contains final results of this
census and was prepared based on questionnaires personally completed by more than 1 million
such public and semi government employees who were employed in those institutions on 17
November 2016.
I wish to express my sincere gratitude to employees of all institutions coming under both the
Central Government and Provincial Councils guided by heads of all such institutions for their
invaluable assistance and cooperation without which this census would not have been a success.
I fervently hope that the findings of the Census would be immensely beneficial for policy makers,
planners, researchers and other data users.
Dr. A.J. Satharasinghe
Director General of Census and Statistics
Department of Census and Statistics
306/71, Poldoowa Road,
Battaramulla.
18 June 2018

Census of Public and Semi Government Sector Employment - 2016
-iv-
Census of Public and Semi Government Sector Employment - 2016
-v-
ACKNOWLEDGEMENTS Secretaries to the Ministries, Chief Secretaries of Provincial Councils, District Secretaries,
Heads of Institutions not coming under a ministry, Heads of Departments and other
government agencies and semi government institutions coming under both the Central
Government and Provincial Councils.
Chief Census coordinators appointed to liaise with the Department of Census and Statistics
(DCS) and other coordinators representing respective institutions
All public and semi government sector employees for the cooperation extended by
completing census questionnaires and being counted at this census.
Staff of the Research and Special Studies Division of DCS headed by Ms.U.V.Jayakody, Director
for overall planning and execution of the census under the able guidance of Mr.
D.G.S.G.Munasinghe, Additional Director General.
Mr. G.T.K.S. Perera, Senior Statistician, assisted by Ms.E.C.P. Ratnaweera, Statistician in
preparing the list of Public and semi Government Sector institutions and for supervising all
logistic arrangements of Census pre-processing activities.
Ms. K.K.C.Shiromalee, Senior Statistician in the supervision of the technical activities of
Census enumeration and for carrying out and supervising technical arrangements of Census
pre-processing activities.
Contributions made by staff of the Research and Special Studies Division for their
commitment and hard work throughout the census which paved the success of listing
operation, the enumeration of the Census, preparation of the preliminary report and
eventually the preparation of this final report.
The cooperation and assistance of Mr. Wasantha Weerasiri, Director (ICT) by handling the
Census data processing with the assistance of the staff of the Information Technology Division
under the direction of Mrs. I.A.M.Fernando, Additional Director General (ICT).
Staff of the Printing Division headed by Mr. M.J.M. Fernando, Statistician who supported in
printing and packing Census documents and for printing Census Preliminary Report and the
Final Report.
United Nations Population Fund (UNFPA) for providing financial assistance to hold census
training classes.
Heads and staff of District Statistical Branches/Provincial Councils/other branches in
Ministries and other institutions for extending their support in the distribution of Census
documents, organizing Census training classes, preparation of publicity materials,
preparation of the Census web site and official training videos, translation of census
documents to Tamil medium, assisting Research and Special Studies Division for maintaining
a smooth work flow in Census pre-processing activities, undertaking the painstaking task of
census data processing on behalf of ICT Division, designing cover pages of census
publications.
Members of the Census Steering Committee, Heads and staff of other statistical branches in
District Secretariats/ Provincial Councils/ Line Ministries/ Departments/ Other institutions/
for the support extended throughout the Census process.
The Finance Division, Administration Division, and Transport Unit of the Department.

Census of Public and Semi Government Sector Employment - 2016
-vi-
Census of Public and Semi Government Sector Employment - 2016
-vii-
TABLE OF CONTENTS Page
Preface ………………………………………………………………………………………………………………… iii
Acknowledgements ………………………………………………………………………………………………. v
Table of contents ………………………………………………………………………………………………..... vii
List of tables ………………………………………………………………………………………………………… ix
List of figures ……………………………………………………………………………………………………….. xiii
List of maps………………………………………………………………………………………………………….. xiv
Executive summary………………………………………………………………………………………………. xv
1. Introduction …………………………………………………………………………………………………….. 1
1.1 Background …………………………………………………………………………………………… 1
1.2 Census of public and semi government sector employment 2016……..……… 2
1.3 Public and semi government sectors employees in census years ……………... 6
2. Coverage of the Census ……….………..……………………………………………………………………
7
3. Summary of findings on employees …………………………………………………...………………. 14
3.1 Sector of employment………………………………………………………………………………. 14
3.2 Employees in line ministries …………………………………………………………………….. 15
3.3 Employees in provincial councils ………………………………………………………………. 19
3.4 Age and sex distribution …………………………………………………………………...………. 21
3.5 Ethnicity …………………………………………………………………………….……………………. 23
3.6 Religion ……………………………………………………………..……………………….……………. 24
3.7 Marital Status ………………………………………………………………………………..…………. 25
3.8 Nature of appointment ……………………………………………………………………………... 26
3.9 Level of education …………….……………………………………………………………………… 27
3.10 Graduate employees …….………………………………………………………………………… 29
3.11 Major occupation group …..…………………………………………………..…………………. 30
3.12 Professional/vocational qualifications ……………………………………………………. 32
3.13 Language skills ………………………………………………………………………………………. 34
3.14 District of place of work …………………………………………………………………………. 35
3.15 Divisional Secretariat (DS) division of place of work ………………………………... 39
3.16 Mode of travel ……………………………………………………………………………….……….. 47
3.17 Non communicable diseases …………………………………………………..……………….. 48
3.18 Knowledge on information technology ……………………………………………………. 49
Detailed tables ……………………………….…………………………………………………………………….. 55
Annexures
A. Classification of occupations ……………………………………………………………………. 121
B. Census questionnaire ………………………………………………………………………………. 123
C. Persons involved in the Census …………………………………………..……………………. 127

Census of Public and Semi Government Sector Employment - 2016
-viii-
Census of Public and Semi Government Sector Employment - 2016
-ix-
LIST OF TABLES
Page
Table 1.1 Public and semi government sector employees in census years 1968-2016
6
Table 2.1 Major institutions and census units covered at the census 2016 8
Table 2.2 Major institutions and census units of central government sector covered at the census 2016
8
Table 2.3 Major institutions and census units of provincial councils covered at the census 2016
10
Table 2.4 Some important types of institutions covered at the census by type of the institution and sector of the institution 2016
11
Table 2.5 Distribution of selected institutions/census units covered at the census by administrative district (administration/local government and education sectors) 2016
12
Table 2.6 Distribution of Selected institutions/census units covered at the census by administrative district (health, agriculture and law & order sectors) 2016
13
Table 3.1 Central government and provincial council institutions and their employees 2016
14
Table 3.2 Line ministries with more than 10,000 employees in both public and semi government sectors 2016
16
Table 3.3 Line ministries with less than 10,000 employees in both public and semi government sectors 2016
17
Table 3.4 Employees in provincial councils in both public and semi government sectors by sex 2016
19
Table 3.5 Distribution of employees by sector of employment, age group and sex 2016
21
Table 3.6 Distribution of employees by sector of employment, ethnicity and sex 2016
23
Table 3.7 Distribution of employees by sector of employment, religion and sex 2016
24
Table 3.8 Distribution of employees by sector of employment, marital status and sex 2016
25
Table 3.9 Distribution of employees by nature of appointment and sex 2016 26
Table 3.10 Distribution of employees by sector of employment, highest level of education and sex 2016
27
Table 3.11 Distribution of employees by discipline of basic degree and sex 2016 29
Table 3.12 Distribution employees by major occupation group and sex 2016 30
Table 3.13 Distribution of employees by professional/vocational qualification group and sex 2016
33
Table 3.14 Distribution of employees by level of language proficiency 2016 34
Census of Public and Semi Government Sector Employment - 2016
-x-
Page
Table 3.15 Distribution of employees by district of place of work, sector of employment and sex 2016
35
Table 3.16 Distribution of employees by Divisional Secretariat (DS) division of place of work and sex 2016
39
Table 3.17 Distribution of employees by major mode of travel, sector of employment and sex 2016
47
Table 3.18 Distribution of employees suffering from selected non-communicable diseases by sector of employment and sex 2016
48
Table 3.19 Distribution of employees by sector of employment, their ability to use computer and sex 2016
49
Table 3.20 Distribution of employees using internet by place of access and sex 2016
51
Table 3.21 Distribution of employees using email to exchange information by purpose of using and sex 2016
52
Table 1 Distribution of employees by sector of employment and sex 2016 56
Table 1A Distribution of employees by sector of employment and sex 2016 56
Table 2 Distribution of employees by institution and sex 2016 57
Table 3 Distribution of employees by sector of employment, age and sex 2016 84
Table 4 Distribution of employees by sector of employment, ethnic group and sex 2016
85
Table 5 Distribution of employees by sector of employment, age and ethnic group 2016
86
Table 6 Distribution of employees by sector of employment, religion and sex 2016
88
Table 7 Distribution of employees by sector of employment, age and religion 2016
89
Table 8 Distribution of employees by marital status, sex and age 2016 91
Table 9 Distribution of employees in central government public sector by
marital status, sex and age 2016 92
Table 10 Distribution of employees in provincial public sector by marital
status, sex and age 2016 93
Table 11 Distribution of employees in semi government sector by marital status, sex and age 2016
94
Table 12 Distribution of currently married employees by sector of employment, sex and spouse's activity 2016
95
Table 13 Distribution of employees by age and nature of appointment 2016 96
Table 14 Distribution of employees by sector of employment, sex and level of education 2016
97
Table 15 Distribution of employees in central government public sector by age, sex and highest level of education 2016
98
Census of Public and Semi Government Sector Employment - 2016
-xi-
Page
Table 16 Distribution of employees in provincial public sector by age, sex and highest level of education 2016
100
Table 17 Distribution of employees in semi government sector by age, sex and highest level of education 2016
102
Table 18 Distribution of employees by sector of employment, major occupation group and highest level of education 2016
104
Table 19 Distribution of employees with a basic degree by the field of degree and sector of employment 2016
106
Table 20 Distribution of employees by sector of employment, major occupation group and sex 2016
107
Table 21 Distribution of employees by province/district of place of work and sex 2016
108
Table 22 Distribution of employees by district of permanent residence and sector of employment 2016
109
Table 23 Distribution of employees by district of place of work and district of permanent residence 2016
110
Table 24 Distribution of employees by major mode of travel and sector of employment 2016
112
Table 25 Distribution of employees by mode of travel and sector of employment 2016
113
Table 26 Distribution of employees by mode of travel and sex 2016 114
Table 27 Distribution of employees suffering from Non-Communicable Diseases (NCDs) by sex and age 2016
115
Table 28 Distribution of employees suffering from at least one non-communicable diseases by sex and age 2016
116
Table 29 Distribution of employees by age, sex, sector of employment and ability to use a computer 2016
117
Table 30 Distribution of employees by age, sex, sector of employment and using computer for official purposes 2016
118
Table 31 Distribution of employees by age, sex, sector of employment and internet use 2016
119

Census of Public and Semi Government Sector Employment - 2016
-xii-
Census of Public and Semi Government Sector Employment - 2016
-xiii-
LIST OF FIGURES Page
Figure 1.1 Structure of institutions covered by the census 2016 2
Figure 1.2 Hierarchical structure used for the census operation 2016 3
Figure 1.3 Public and semi government sector employees by census years 6
Figure 3.1 Percentage distribution of employees by sector of employment 2016 15
Figure 3.2 Line ministries with more than 10,000 employees in both public and semi government sectors 2016
16
Figure 3.3 Line ministries with less than 10,000 employees in both public and semi government sectors 2016
18
Figure 3.4 Public and semi government employees by age and sex 2016 22
Figure 3.5 public and semi government employees by nature of appointment and sex 2016
26
Figure 3.6 Public and semi government employees by highest level of education, sector of employment and sex 2016
28
Figure 3.7 Public and semi government employees by highest level of education and sex 2016
29
Figure 3.8 Public and semi government employees by discipline of basic degree 2016
30
Figure 3.9 Public and semi government employees by major occupation group 2016
31
Figure 3.10 Public and semi government employees by major occupation group and sex 2016
32
Figure 3.11 Public and semi government employees with at least an average proficiency of official and link languages 2016
34
Figure 3.12 Distribution Public and semi government employees by district of work and sex 2016
36
Figure 3.13 Public and semi government employees by major mode of travel and sex 2016
48
Figure 3.14 Public and semi government employees by their ability to use computer and sex 2016
50
Figure 3.15 Public and semi government employees using internet by place of access 2016
51
Figure 3.16 Public and semi government employees using email to exchange information by purpose of using 2016
52
Census of Public and Semi Government Sector Employment - 2016
-xiv-
LIST OF MAPS Page
Map 3.1 Distribution of public and semi government employees by district of place of work and sector of employment 2016
37
Map 3.2 Distribution of public and semi government employees by district of place of work and sex 2016
38
Map 3.3 Distribution of public and semi government employees by Divisional Secretariat (DS) division of place of work 2016
46
Census of Public and Semi Government Sector Employment - 2016
-xv-
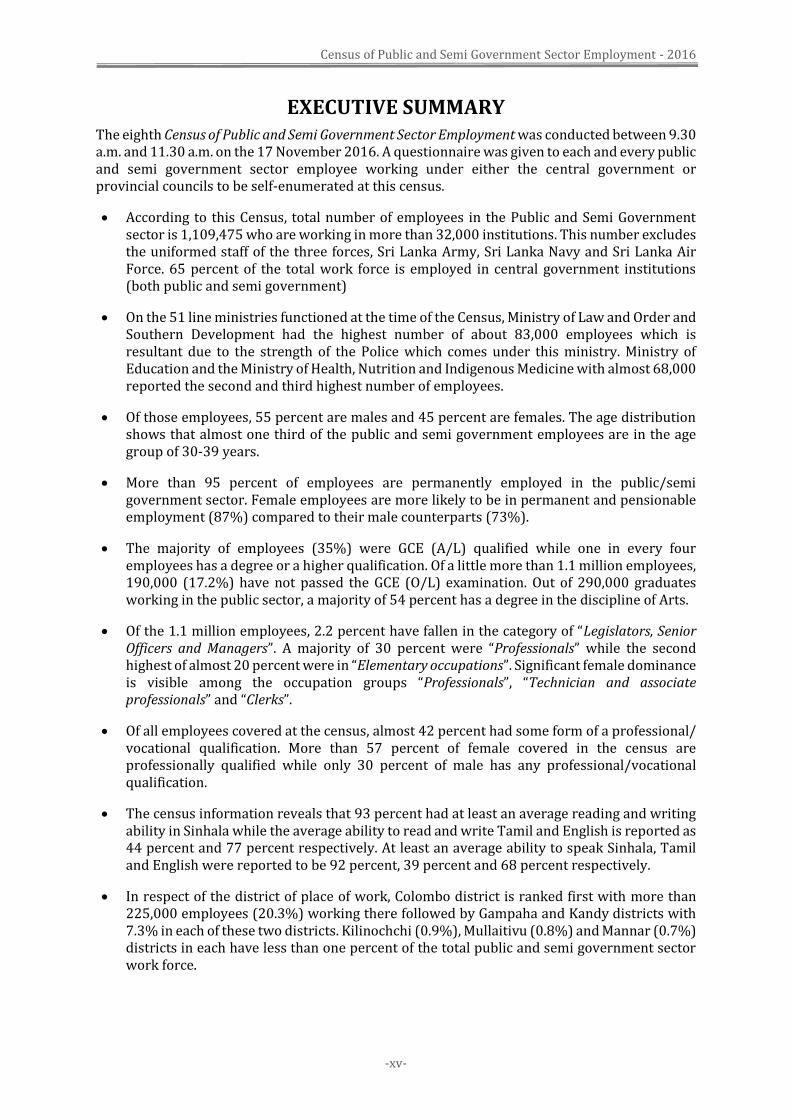
EXECUTIVE SUMMARY The eighth Census of Public and Semi Government Sector Employment was conducted between 9.30 a.m. and 11.30 a.m. on the 17 November 2016. A questionnaire was given to each and every public and semi government sector employee working under either the central government or provincial councils to be self-enumerated at this census.
According to this Census, total number of employees in the Public and Semi Government sector is 1,109,475 who are working in more than 32,000 institutions. This number excludes the uniformed staff of the three forces, Sri Lanka Army, Sri Lanka Navy and Sri Lanka Air Force. 65 percent of the total work force is employed in central government institutions (both public and semi government)
On the 51 line ministries functioned at the time of the Census, Ministry of Law and Order and Southern Development had the highest number of about 83,000 employees which is resultant due to the strength of the Police which comes under this ministry. Ministry of Education and the Ministry of Health, Nutrition and Indigenous Medicine with almost 68,000 reported the second and third highest number of employees.
Of those employees, 55 percent are males and 45 percent are females. The age distribution shows that almost one third of the public and semi government employees are in the age group of 30-39 years.
More than 95 percent of employees are permanently employed in the public/semi government sector. Female employees are more likely to be in permanent and pensionable employment (87%) compared to their male counterparts (73%).
The majority of employees (35%) were GCE (A/L) qualified while one in every four employees has a degree or a higher qualification. Of a little more than 1.1 million employees, 190,000 (17.2%) have not passed the GCE (O/L) examination. Out of 290,000 graduates working in the public sector, a majority of 54 percent has a degree in the discipline of Arts.
Of the 1.1 million employees, 2.2 percent have fallen in the category of “Legislators, Senior Officers and Managers”. A majority of 30 percent were “Professionals” while the second highest of almost 20 percent were in “Elementary occupations”. Significant female dominance is visible among the occupation groups “Professionals”, “Technician and associate professionals” and “Clerks”.
Of all employees covered at the census, almost 42 percent had some form of a professional/ vocational qualification. More than 57 percent of female covered in the census are professionally qualified while only 30 percent of male has any professional/vocational qualification.
The census information reveals that 93 percent had at least an average reading and writing ability in Sinhala while the average ability to read and write Tamil and English is reported as 44 percent and 77 percent respectively. At least an average ability to speak Sinhala, Tamil and English were reported to be 92 percent, 39 percent and 68 percent respectively.
In respect of the district of place of work, Colombo district is ranked first with more than 225,000 employees (20.3%) working there followed by Gampaha and Kandy districts with 7.3% in each of these two districts. Kilinochchi (0.9%), Mullaitivu (0.8%) and Mannar (0.7%) districts in each have less than one percent of the total public and semi government sector work force.
Census of Public and Semi Government Sector Employment - 2016
-xvi-
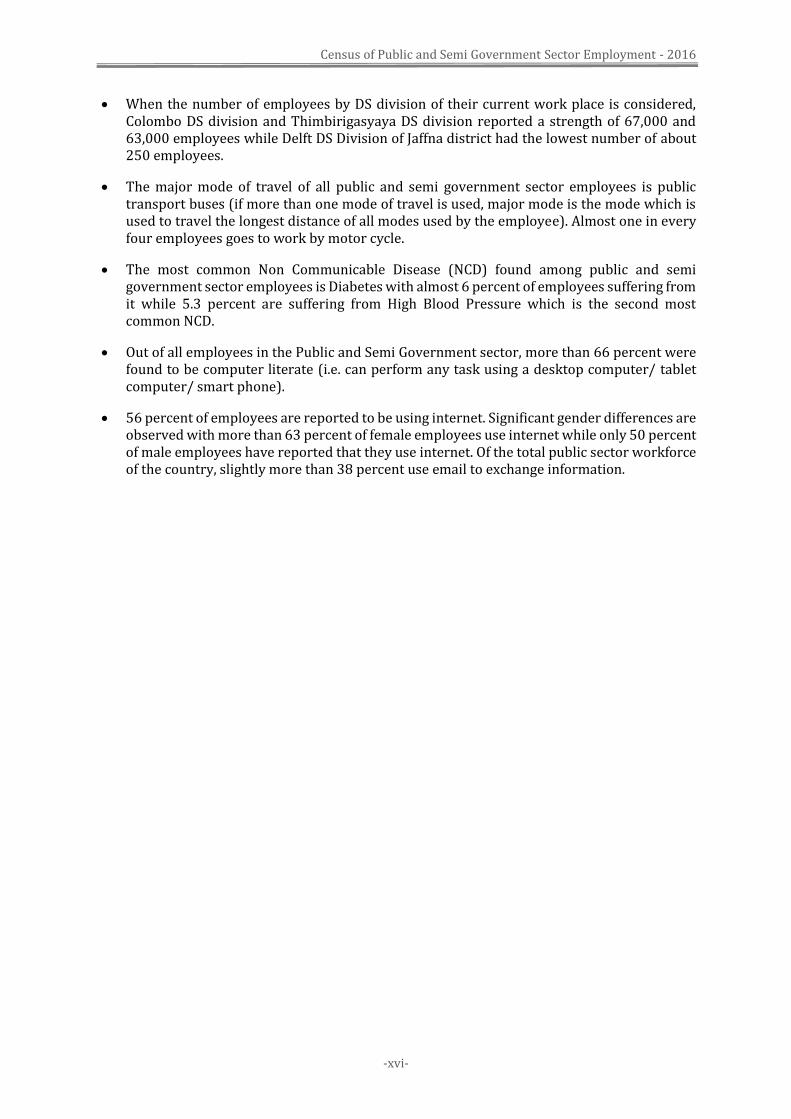
When the number of employees by DS division of their current work place is considered, Colombo DS division and Thimbirigasyaya DS division reported a strength of 67,000 and 63,000 employees while Delft DS Division of Jaffna district had the lowest number of about 250 employees.
The major mode of travel of all public and semi government sector employees is public transport buses (if more than one mode of travel is used, major mode is the mode which is used to travel the longest distance of all modes used by the employee). Almost one in every four employees goes to work by motor cycle.
The most common Non Communicable Disease (NCD) found among public and semi government sector employees is Diabetes with almost 6 percent of employees suffering from it while 5.3 percent are suffering from High Blood Pressure which is the second most common NCD.
Out of all employees in the Public and Semi Government sector, more than 66 percent were found to be computer literate (i.e. can perform any task using a desktop computer/ tablet computer/ smart phone).
56 percent of employees are reported to be using internet. Significant gender differences are observed with more than 63 percent of female employees use internet while only 50 percent of male employees have reported that they use internet. Of the total public sector workforce of the country, slightly more than 38 percent use email to exchange information.
Census of Public and Semi Government Sector Employment - 2016
-1-
1. INTRODUCTION
Public Sector, according to Encyclopedia Britannica is “the portion of the economy composed of
all levels of government and government controlled enterprises” and excludes private
companies, voluntary organizations and households.
Public sector therefore includes public goods and government services such as public education,
health care, police, military, physical infrastructure and those who work for the government.
Rather than its mere functions as a service provider, Public Sector represents government
ownership and control on matters such as exercising public authority and the implementation
of public policy. Public enterprises on the other hand are self-financing commercial enterprises
which are owned by the government and operate on a commercial basis and provide private
goods and services for sale.
To fulfill the social and economic responsibilities entrusted upon the public sector, governments
throughout the world employ people directly in the sector. The number employed by the
government largely depends on the level of economic development of the country as well as the
role played by the respective government in the production of goods and services.
In 2016, the share of public and semi government sector employment to total employment in Sri
Lanka was 14.6 percent (LFS 2016). The same source, reported that 5.5 percent of the total
population (as of midyear) in 2016 were employed in the public and semi government sector,
which is a useful measure in assessing whether adequate/excessive numbers to provide
essential services to the population are employed by the government.
1.1. Background
The first scientific Census on Public and Semi Government sector employment was carried out
in 1980 in order to cater to the requirements of data on the Public and Semi Government sector
for planning and monitoring purposes of government employees and the institutions in which
they work. Department of Census and Statistics being the National Statistical Office responsible
for providing official statistics required for policy formulation and government planning
purposes has been followed the basic principles of census taking for conducting its maiden
scientific census in 1980. It was the first Census in which the Public sector employees were
classified in to the two broad categories, the Public sector and the Corporation sector. While the
Public sector comprised of employees in Ministries, Departments and all other agencies coming
directly under the Government Administration, the Corporation sector covered all employees in
state owned Corporations and other statutory bodies. Subsequent to that, censuses were carried
out in 1985, 1990, 1994, 1998, 2002 and 2006 at a quite similar frequency of 4 to 5 years.
Before 1980, Ministry of Public Administration had been instrumental in conducting censuses in
1968, 1972 and 1976 with the technical assistance of the Department of Census and Statistics;
they covered only the public sector and was just a head count based on their payroll. However,
results of the 1976 census have not been published due to under coverage observed in the
enumeration. Previous records revealed that the number employed in the Public sector prior to
1968 was also collected from respective Ministries by the Department of Census and Statistics.
Census of Public and Semi Government Sector Employment - 2016
-2-
1.2. Census of Public and Semi Government Sector Employment 2016
The Census of Public and Semi Government Sector Employment 2016 is the eighth in the series
of censuses conducted by the Department of Census and Statistics (DCS). Previous Census which
was carried out in 2006, reported a workforce of about 800,000 Public and Semi Government
employees.
The planning of the Census of Public and Semi Government Sector employment, which will be
referred to as Employment Census hereafter, was officially kicked off with a stakeholder meeting
in December 2015. User requirements were inquired and identified, a draft questionnaire was
extensively discussed at this meeting which was attended by officers representing many key
public and semi government sector institutions. Subsequently, a listing of all Public and Semi
Government institutions that will be covered in the Census was carried out starting from March
2016, as the first step of the Census.
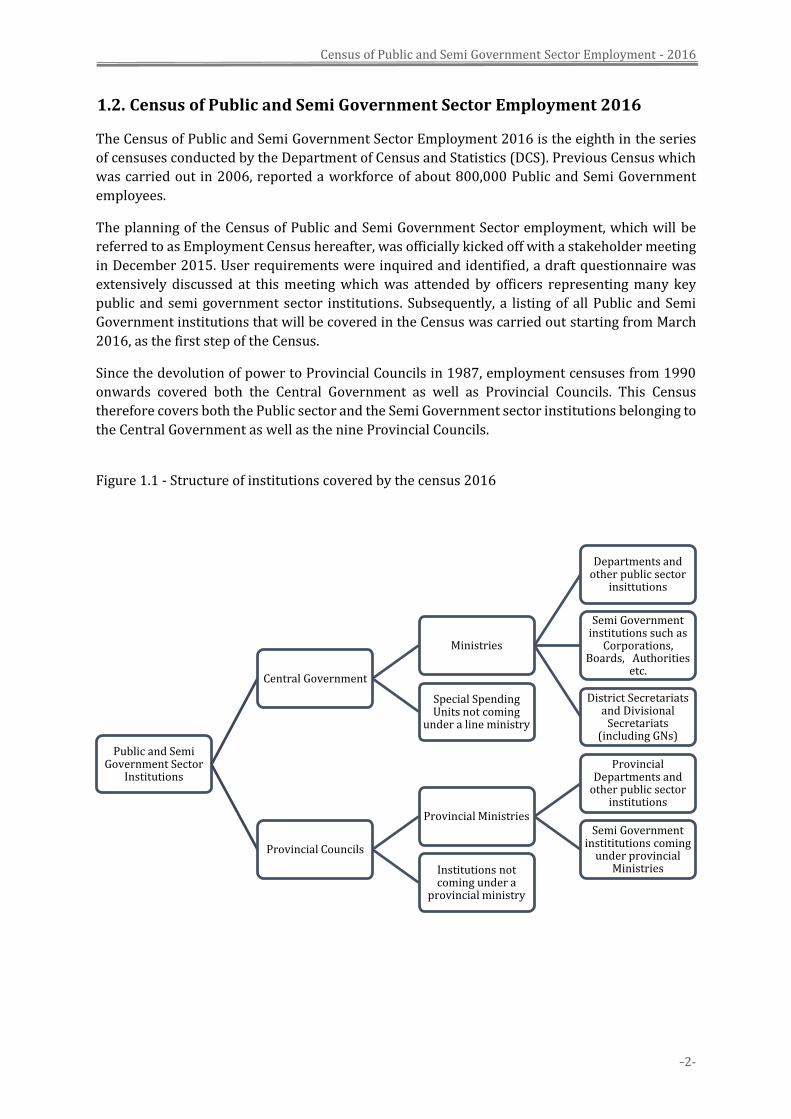
Since the devolution of power to Provincial Councils in 1987, employment censuses from 1990
onwards covered both the Central Government as well as Provincial Councils. This Census
therefore covers both the Public sector and the Semi Government sector institutions belonging to
the Central Government as well as the nine Provincial Councils.
Figure 1.1 - Structure of institutions covered by the census 2016
Public and Semi Government Sector
Institutions
Central Government
Ministries
Departments and other public sector
insittutions
Semi Government institutions such as
Corporations, Boards, Authorities
etc.
District Secretariats and Divisional
Secretariats (including GNs)
Special Spending Units not coming
under a line ministry
Provincial Councils
Provincial Ministries
Provincial Departments and
other public sector institutions
Semi Government instititutions coming
under provincial MinistriesInstitutions not
coming under a provincial ministry
Census of Public and Semi Government Sector Employment - 2016
-3-
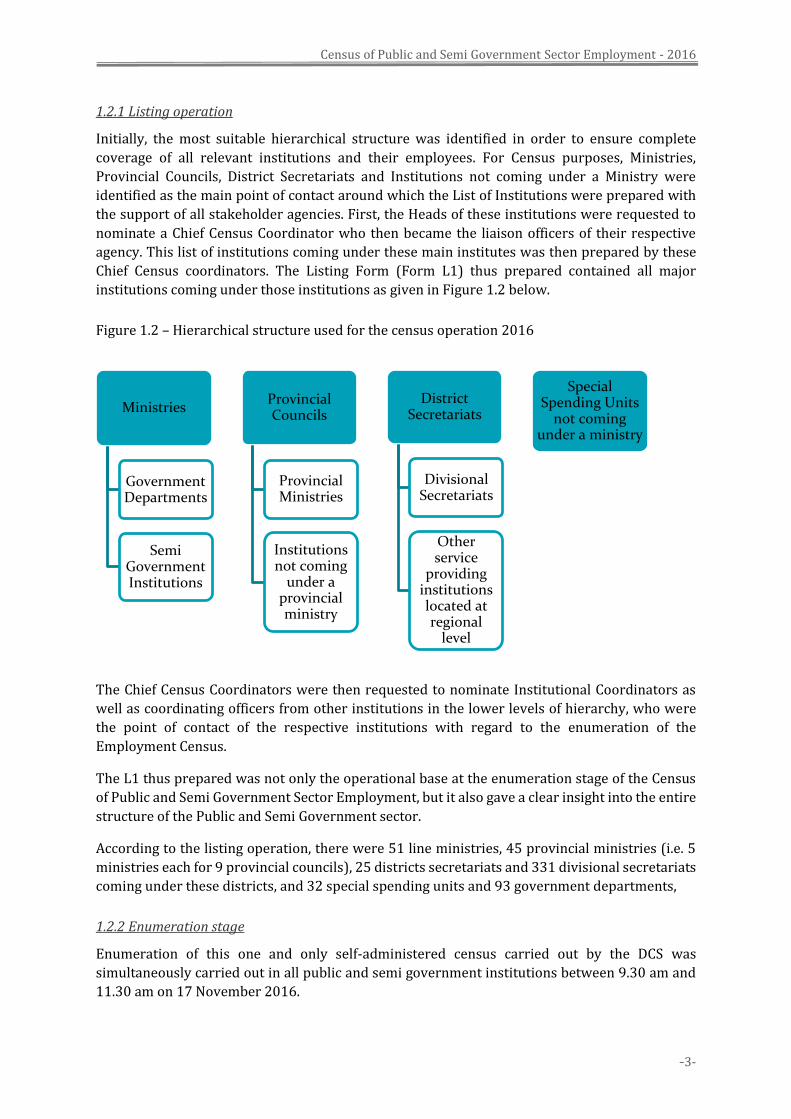
1.2.1 Listing operation
Initially, the most suitable hierarchical structure was identified in order to ensure complete
coverage of all relevant institutions and their employees. For Census purposes, Ministries,
Provincial Councils, District Secretariats and Institutions not coming under a Ministry were
identified as the main point of contact around which the List of Institutions were prepared with
the support of all stakeholder agencies. First, the Heads of these institutions were requested to
nominate a Chief Census Coordinator who then became the liaison officers of their respective
agency. This list of institutions coming under these main institutes was then prepared by these
Chief Census coordinators. The Listing Form (Form L1) thus prepared contained all major
institutions coming under those institutions as given in Figure 1.2 below.
Figure 1.2 – Hierarchical structure used for the census operation 2016
The Chief Census Coordinators were then requested to nominate Institutional Coordinators as
well as coordinating officers from other institutions in the lower levels of hierarchy, who were
the point of contact of the respective institutions with regard to the enumeration of the
Employment Census.
The L1 thus prepared was not only the operational base at the enumeration stage of the Census
of Public and Semi Government Sector Employment, but it also gave a clear insight into the entire
structure of the Public and Semi Government sector.
According to the listing operation, there were 51 line ministries, 45 provincial ministries (i.e. 5
ministries each for 9 provincial councils), 25 districts secretariats and 331 divisional secretariats
coming under these districts, and 32 special spending units and 93 government departments,
1.2.2 Enumeration stage
Enumeration of this one and only self-administered census carried out by the DCS was
simultaneously carried out in all public and semi government institutions between 9.30 am and
11.30 am on 17 November 2016.
Ministries
Government Departments
Semi Government Institutions
Provincial Councils
Provincial Ministries
Institutions not coming
under a provincial ministry
District Secretariats
Divisional Secretariats
Other service
providing institutions located at regional
level
Special Spending Units
not coming under a ministry
Census of Public and Semi Government Sector Employment - 2016
-4-
1.2.3 New features of this census
Many new features were introduced at this Census with the purpose of ensuring quality, accuracy
and timeliness of data released as follows;
Complete listing of all Public and Semi Government institutions including all their
branches up to the lowest level.
Appointment of coordinators /liaison officers from institutions with a considerable
number of employees.
Conducting extensive training programs covering the entire island. In addition to the DCS
head office in Battaramulla, training classes were conducted in all District Secretariats, All
Provincial Council offices, and selected major institutions with large number of
employees.
Enumeration of field labourers employed in the estates of Semi Government sector
A dedicated web site containing all census materials including audio visual instructions
on completing the census questionnaire.
Enumeration of employees working in Sri Lankan diplomatic missions located in 51
countries throughout the world, overseas branches of the Bank of Ceylon (BOC) and the
People’s Bank, and off-shore branches of Sri Lankan Airlines were covered at this census.
1.2.4 Limitations and notable facts
Employees of the subsidiaries of Semi Government Institutions are not included in this
Census.
Information on uniformed staff of Sri Lanka Army, Sri Lanka Navy and Sri Lanka Air Force
are not included in this report.
Sri Lanka Telecom, gazetted under the Ministry of Telecommunication & Digital
Infrastructure and Associated Newspapers of Ceylon Limited (Lake House), Lanka
Puwath Ltd. both gazetted under the Ministry of Parliamentary Reforms and Mass Media
(currently Ministry of Finance and Mass Media) could not be covered at this Census.
Development Officers, Public Management Assistants etc. of some ministries who are
deployed to carry out duties of a semi government institutions coming under that
particular ministry are included as employees of that ministry.
Employees of the Blood Bank who are attached to hospitals are given in this report as
hospital staff, not as Blood Bank Staff.
Slightly low response rates were observed from hospitals coming under the Ministry of
Health, Nutrition and Indigenous Medicine as well as Sri Lankan Airlines.
Census of Public and Semi Government Sector Employment - 2016
-5-
Grass root level field officers such as Grama Niladharis, Divineguma Development
Officers, Public Health Midwives, and Agrarian Research Production Assistant are
published under the respective Divisional Secretariat, Divineguma Maha Sangamaya,
Medical Officer of Health (MOH) Office, or Agrarian Services Centres.
Employees of Courts appointed by the Judicial Services Commission (JSC) are published
under the Judicial Services Commission while employees appointed by the Ministry of
Justice are published as employees of respective Courts.
Employees of Provincial Councils when deployed at an institution which does not belong
to the provincial council and when the institution they belong is not mentioned clearly
are published as employees of the Chief Secretariat of that respective Provincial Council.
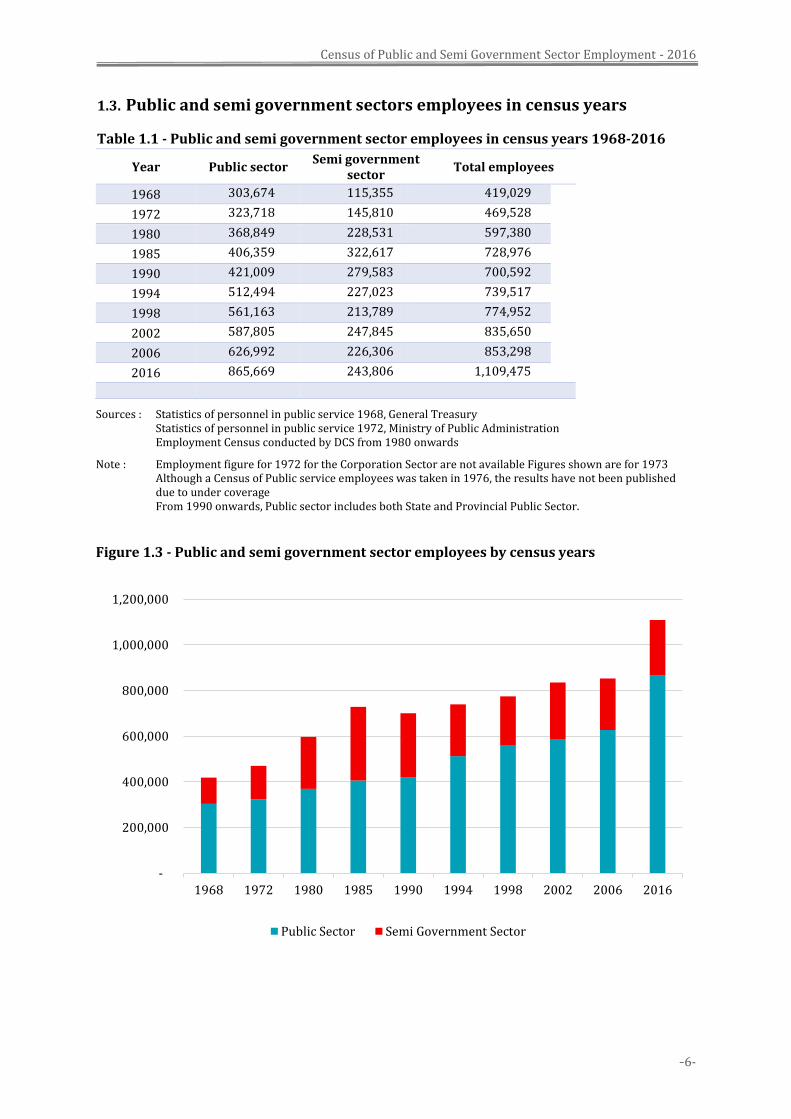
Since the inception of censuses to collect information on public and semi government employees
in 1968, employment has increased from about 420,000 in 1968 to 1.1 million in 2016, the growth
being more prominent in the public sector than in the semi government sector.
Census of Public and Semi Government Sector Employment - 2016
-6-
1.3. Public and semi government sectors employees in census years
Table 1.1 - Public and semi government sector employees in census years 1968-2016
Year Public sector Semi government
sector Total employees
1968 303,674 115,355 419,029
1972 323,718 145,810 469,528
1980 368,849 228,531 597,380
1985 406,359 322,617 728,976
1990 421,009 279,583 700,592
1994 512,494 227,023 739,517
1998 561,163 213,789 774,952
2002 587,805 247,845 835,650
2006 626,992 226,306 853,298
2016 865,669 243,806 1,109,475
Sources : Statistics of personnel in public service 1968, General Treasury Statistics of personnel in public service 1972, Ministry of Public Administration Employment Census conducted by DCS from 1980 onwards
Note : Employment figure for 1972 for the Corporation Sector are not available Figures shown are for 1973 Although a Census of Public service employees was taken in 1976, the results have not been published due to under coverage From 1990 onwards, Public sector includes both State and Provincial Public Sector.
Figure 1.3 - Public and semi government sector employees by census years
-
200,000
400,000
600,000
800,000
1,000,000
1,200,000
1968 1972 1980 1985 1990 1994 1998 2002 2006 2016
Public Sector Semi Government Sector
Census of Public and Semi Government Sector Employment - 2016
-7-
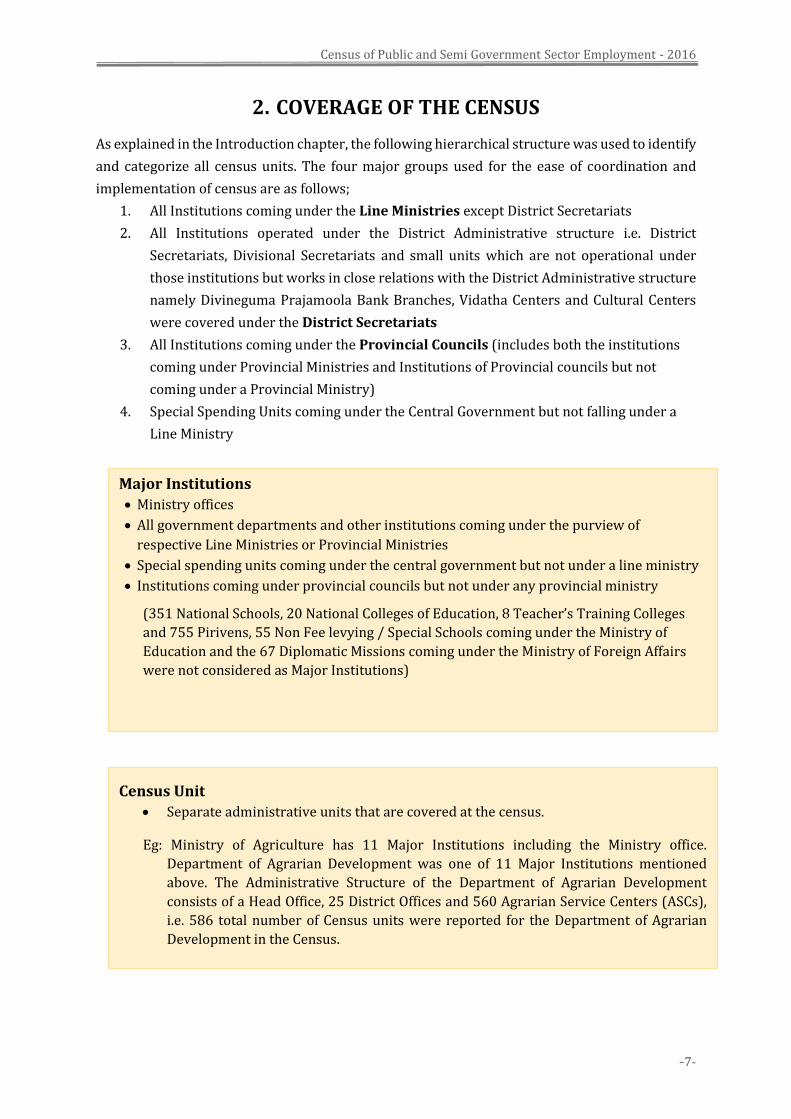
2. COVERAGE OF THE CENSUS
As explained in the Introduction chapter, the following hierarchical structure was used to identify
and categorize all census units. The four major groups used for the ease of coordination and
implementation of census are as follows;
1. All Institutions coming under the Line Ministries except District Secretariats
2. All Institutions operated under the District Administrative structure i.e. District
Secretariats, Divisional Secretariats and small units which are not operational under
those institutions but works in close relations with the District Administrative structure
namely Divineguma Prajamoola Bank Branches, Vidatha Centers and Cultural Centers
were covered under the District Secretariats
3. All Institutions coming under the Provincial Councils (includes both the institutions
coming under Provincial Ministries and Institutions of Provincial councils but not
coming under a Provincial Ministry)
4. Special Spending Units coming under the Central Government but not falling under a
Line Ministry
Major Institutions
Ministry offices
All government departments and other institutions coming under the purview of
respective Line Ministries or Provincial Ministries
Special spending units coming under the central government but not under a line ministry
Institutions coming under provincial councils but not under any provincial ministry
(351 National Schools, 20 National Colleges of Education, 8 Teacher’s Training Colleges
and 755 Pirivens, 55 Non Fee levying / Special Schools coming under the Ministry of
Education and the 67 Diplomatic Missions coming under the Ministry of Foreign Affairs
were not considered as Major Institutions)
Census Unit
Separate administrative units that are covered at the census.
Eg: Ministry of Agriculture has 11 Major Institutions including the Ministry office.
Department of Agrarian Development was one of 11 Major Institutions mentioned
above. The Administrative Structure of the Department of Agrarian Development
consists of a Head Office, 25 District Offices and 560 Agrarian Service Centers (ASCs),
i.e. 586 total number of Census units were reported for the Department of Agrarian
Development in the Census.
Census of Public and Semi Government Sector Employment - 2016
-8-
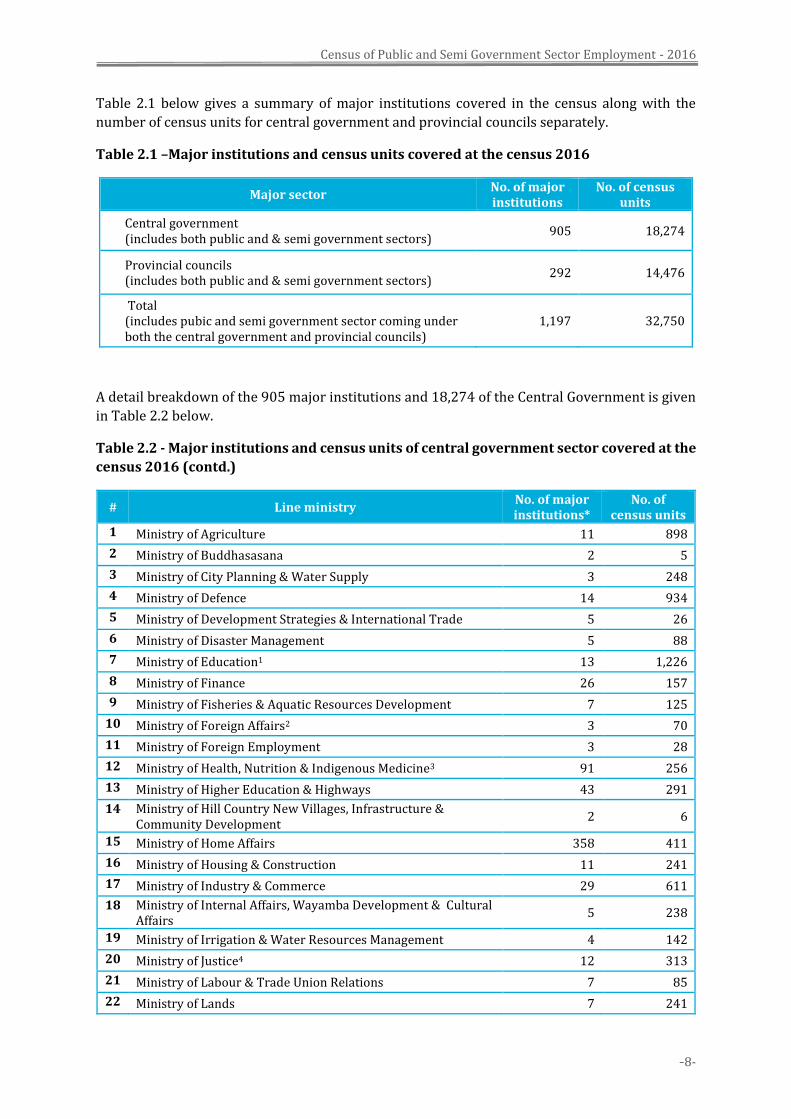
Table 2.1 below gives a summary of major institutions covered in the census along with the
number of census units for central government and provincial councils separately.
Table 2.1 –Major institutions and census units covered at the census 2016
Major sector No. of major institutions
No. of census units
Central government (includes both public and & semi government sectors)
905 18,274
Provincial councils (includes both public and & semi government sectors)
292 14,476
Total (includes pubic and semi government sector coming under both the central government and provincial councils)
1,197 32,750
A detail breakdown of the 905 major institutions and 18,274 of the Central Government is given
in Table 2.2 below.
Table 2.2 - Major institutions and census units of central government sector covered at the
census 2016 (contd.)
# Line ministry No. of major institutions*
No. of census units
1 Ministry of Agriculture 11 898
2 Ministry of Buddhasasana 2 5
3 Ministry of City Planning & Water Supply 3 248
4 Ministry of Defence 14 934
5 Ministry of Development Strategies & International Trade 5 26
6 Ministry of Disaster Management 5 88
7 Ministry of Education1 13 1,226
8 Ministry of Finance 26 157
9 Ministry of Fisheries & Aquatic Resources Development 7 125
10 Ministry of Foreign Affairs2 3 70
11 Ministry of Foreign Employment 3 28
12 Ministry of Health, Nutrition & Indigenous Medicine3 91 256
13 Ministry of Higher Education & Highways 43 291
14 Ministry of Hill Country New Villages, Infrastructure & Community Development
2 6
15 Ministry of Home Affairs 358 411
16 Ministry of Housing & Construction 11 241
17 Ministry of Industry & Commerce 29 611
18 Ministry of Internal Affairs, Wayamba Development & Cultural Affairs
5 238
19 Ministry of Irrigation & Water Resources Management 4 142
20 Ministry of Justice4 12 313
21 Ministry of Labour & Trade Union Relations 7 85
22 Ministry of Lands 7 241

Census of Public and Semi Government Sector Employment - 2016
-9-
# Line ministry No. of major institutions*
No. of census units
23 Ministry of Law & Order and Southern Development 5 826
24 Ministry of Mahaweli Development & Environment 12 380
25 Ministry of Megapolis & Western Development 6 77
26 Ministry of National Co-existence Dialogue and Official Languages
5 8
27 Ministry of National Integration & Reconciliation 2 2
28 Ministry of National Policies & Economic Affairs 17 265
29 Ministry of Parliamentary Reforms and Mass Media 12 59
30 Ministry of Petroleum Resources Development 5 34
31 Ministry of Plantation Industries 15 186
32 Ministry of Ports & Shipping 5 36
33 Ministry of Post, Postal Services & Muslim Religious Affairs 3 4,137
34 Ministry of Power & Renewable Energy 7 360
35 Ministry of Primary Industries 2 27
36 Ministry of Prison Reforms, Rehabilitation, Resettlement and Hindu Religious Affairs
8 156
37 Ministry of Provincial Council & Local Government 4 17
38 Ministry of Public Administration & Management 7 10
39 Ministry of Public Enterprise Development 21 2,220
40 Ministry of Regional Development 2 2
41 Ministry of Rural Economic Affairs 8 121
42 Ministry of Science, Technology & Research 13 279
43 Ministry of Skills Development and Vocational Training 11 128
44 Ministry of Social Empowerment & Welfare 7 1,134
45 Ministry of Special Assignments 1 1
46 Ministry of Sports 6 10
47 Ministry of Sustainable Development & Wildlife 5 251
48 Ministry of Telecommunication & Digital Infrastructure 2 2
49 Ministry of Tourism Development & Christian Religious Affairs 6 25
50 Ministry of Transport and Civil Aviation 9 613
51 Ministry of Women and Child Affairs 6 14
Subtotal for the 51 line ministries 873 18,020
52 Institutions of Central Government but not coming under a Line Ministry
32 254
Central government sector 905 18,274
Note – * Includes the respective ministry office as a separate institution. 1 - 351 national schools, 20 national colleges of education, 8 teacher’s training Colleges and 755
pirivenas and 55 non fee levying / special schools are not included as major institutions.
2 - 67 diplomatic missions (embassies or high/ deputy high commissions) are not included as major
institutions.
3 - 16 Nurse’s training schools (NTSs) are not included as major institutions
4 - 186 courts coming under the ministry of justice are not included as major institutions.
Census of Public and Semi Government Sector Employment - 2016
-10-
According to Table 2.2 above, the total number of major institutions covered under the Line
Ministries was 873. Along with the 32 institutions not coming under a line ministry, the total
number of major institutions in the Central Government Sector sums up to 905.
Total number of census units that were reported for Central Government Sector was 18,274.
Among them the majority were the Post Offices and sub post offices of the Department of Posts.
Other significantly larger number of census units covered during the census were 1,584 State
Bank branches, 1,084 Divineguma Prajamoola Bank branches, 755 Pirivenas, 560 ASCs (Agrarian
Service Centers), 467 Police Stations, 406 Railway sub offices/ workshops which included railway
stations, 352 National Schools, 351 Sathosa Outlets/sub offices/stores, 331 Divisional
Secretariats, 265 Vidatha Centers, 201 Cultural Centers and 186 Courts coming under the
Ministry of Justice.
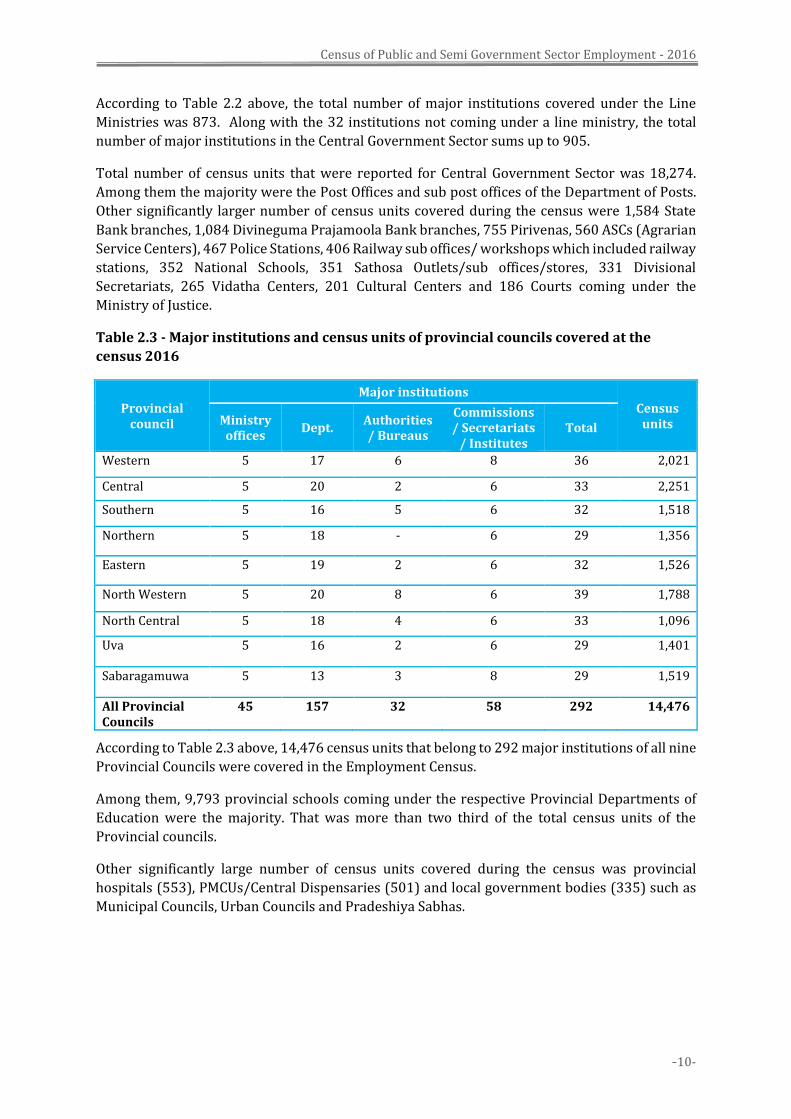
Table 2.3 - Major institutions and census units of provincial councils covered at the
census 2016
Provincial council
Major institutions Census
units Ministry offices
Dept. Authorities/ Bureaus
Commissions/ Secretariats
/ Institutes Total
Western 5 17 6 8 36 2,021
Central 5 20 2 6 33 2,251
Southern 5 16 5 6 32 1,518
Northern 5 18 - 6 29 1,356
Eastern 5 19 2 6 32 1,526
North Western 5 20 8 6 39 1,788
North Central 5 18 4 6 33 1,096
Uva 5 16 2 6 29 1,401
Sabaragamuwa 5 13 3 8 29 1,519
All Provincial Councils
45 157 32 58 292 14,476
According to Table 2.3 above, 14,476 census units that belong to 292 major institutions of all nine
Provincial Councils were covered in the Employment Census.
Among them, 9,793 provincial schools coming under the respective Provincial Departments of
Education were the majority. That was more than two third of the total census units of the
Provincial councils.
Other significantly large number of census units covered during the census was provincial
hospitals (553), PMCUs/Central Dispensaries (501) and local government bodies (335) such as
Municipal Councils, Urban Councils and Pradeshiya Sabhas.
Census of Public and Semi Government Sector Employment - 2016
-11-
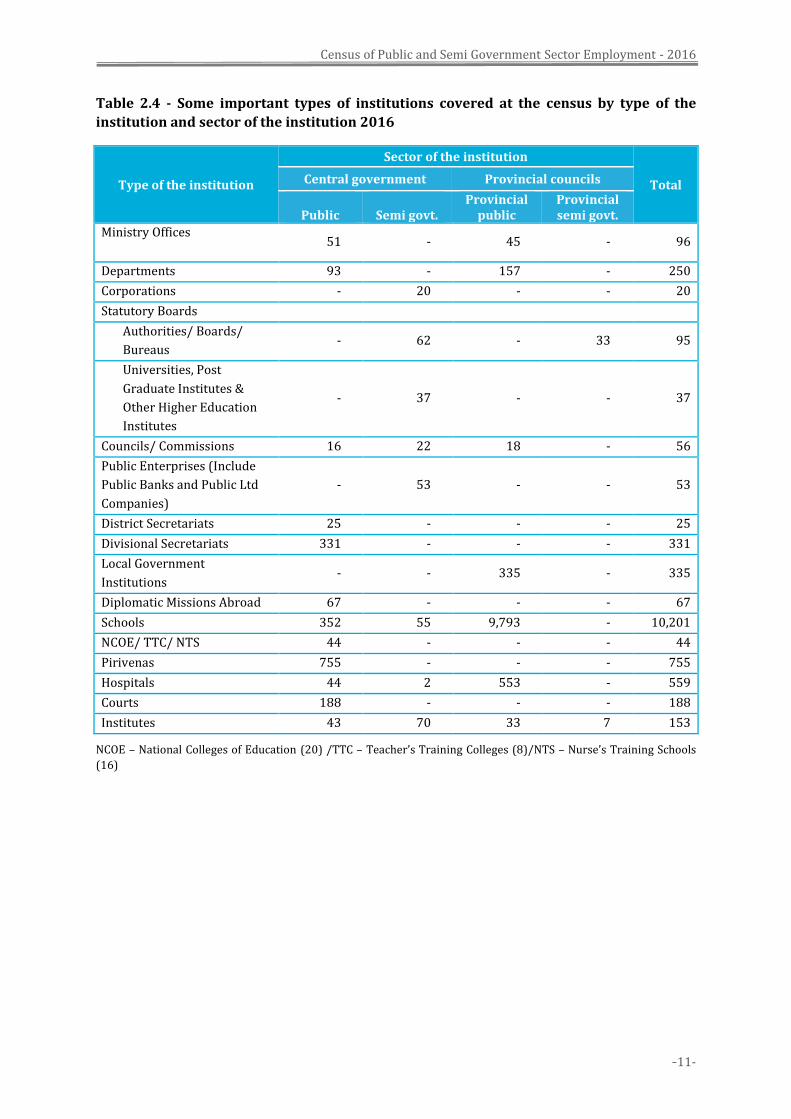
Table 2.4 - Some important types of institutions covered at the census by type of the
institution and sector of the institution 2016
Type of the institution
Sector of the institution
Total Central government Provincial councils
Public
Semi govt.
Provincial public
Provincial semi govt.
Ministry Offices
51 - 45 - 96
Departments 93 - 157 - 250
Corporations - 20 - - 20
Statutory Boards
Authorities/ Boards/
Bureaus - 62 - 33 95
Universities, Post
Graduate Institutes &
Other Higher Education
Institutes
- 37 - - 37
Councils/ Commissions 16 22 18 - 56
Public Enterprises (Include
Public Banks and Public Ltd
Companies)
- 53 - - 53
District Secretariats 25 - - - 25
Divisional Secretariats 331 - - - 331
Local Government
Institutions - - 335 - 335
Diplomatic Missions Abroad 67 - - - 67
Schools 352 55 9,793 - 10,201
NCOE/ TTC/ NTS 44 - - - 44
Pirivenas 755 - - - 755
Hospitals 44 2 553 - 559
Courts 188 - - - 188
Institutes 43 70 33 7 153
NCOE – National Colleges of Education (20) /TTC – Teacher’s Training Colleges (8)/NTS – Nurse’s Training Schools
(16)
-12-
Census of Public and Semi Government Sector Employment – 2016
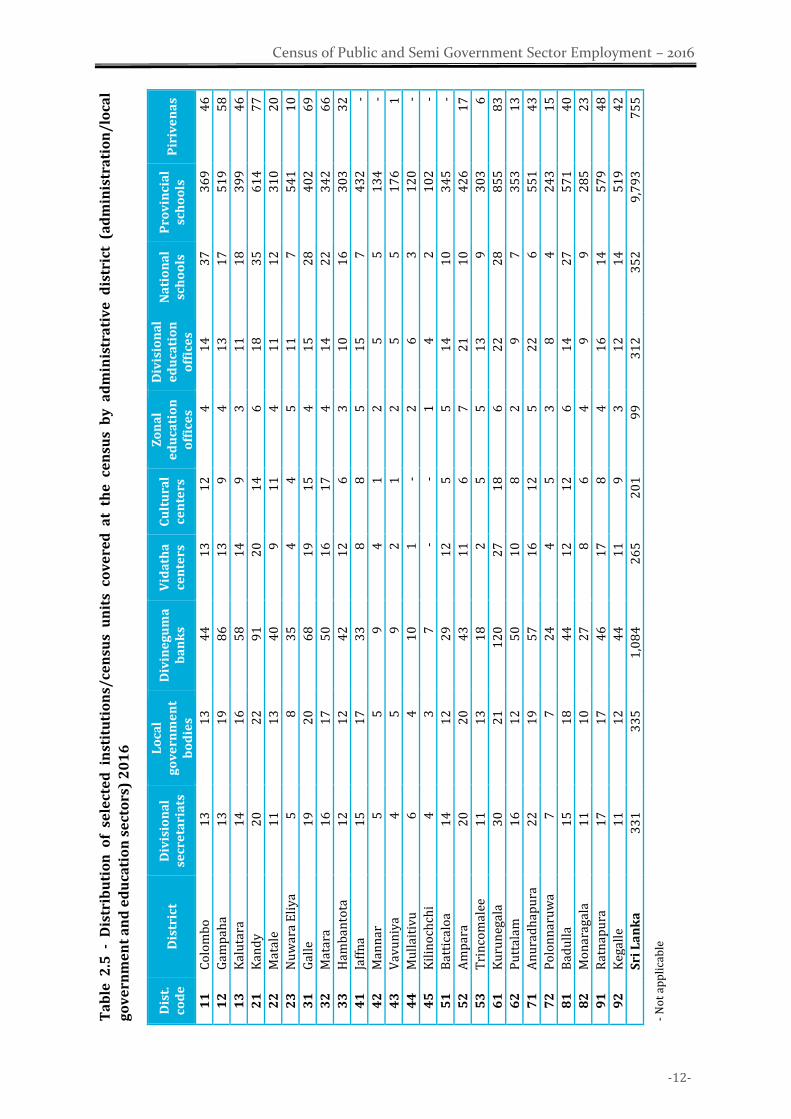
T
ab
le 2
.5 -
Dis
trib
uti
on
of
sele
cte
d i
nst
itu
tio
ns/
cen
sus
un
its
cov
ere
d a
t th
e c
en
sus
by
ad
min
istr
ati
ve
dis
tric
t (a
dm
inis
tra
tio
n/
loca
l
go
ve
rnm
en
t a
nd
ed
uca
tio
n s
ect
ors
) 2
01
6
Dis
t.
cod
e
Dis
tric
t D
ivis
ion
al
secr
eta
ria
ts
Lo
cal
go
ve
rnm
en
t b
od
ies
Div
ine
gu
ma
b
an
ks
Vid
ath
a
cen
ters
C
ult
ura
l ce
nte
rs
Zo
na
l e
du
cati
on
o
ffic
es
Div
isio
na
l e
du
cati
on
o
ffic
es
Na
tio
na
l sc
ho
ols
P
rov
inci
al
sch
oo
ls
Pir
ive
na
s
11
C
olo
mb
o
13
1
3
44
1
3
12
4
1
4
37
3
69
4
6
12
G
amp
aha
13
1
9
86
1
3
9
4
13
1
7
51
9
58
13
K
alu
tara
1
4
16
5
8
14
9
3
1
1
18
3
99
4
6
21
K
and
y
20
2
2
91
2
0
14
6
1
8
35
6
14
7
7
22
M
atal
e 1
1
13
4
0
9
11
4
1
1
12
3
10
2
0
23
N
uw
ara
Eli
ya
5
8
3
5
4
4
5
11
7
5
41
1
0
31
G
alle
1
9
20
6
8
19
1
5
4
15
2
8
40
2
69
32
M
atar
a 1
6
17
5
0
16
1
7
4
14
2
2
34
2
66
33
H
amb
anto
ta
12
1
2
42
1
2
6
3
10
1
6
30
3
32
41
Ja
ffn
a
15
1
7
33
8
8
5
1
5
7
43
2
-
42
M
ann
ar
5
5
9
4
1
2
5
5
13
4
-
43
V
avu
niy
a 4
5
9
2
1
2
5
5
1
76
1
44
M
ull
aiti
vu
6
4
1
0
1
- 2
6
3
1
20
-
45
K
ilin
och
chi
4
3
7
- -
1
4
2
10
2
-
51
B
atti
calo
a 1
4
12
2
9
12
5
5
1
4
10
3
45
-
52
A
mp
ara
20
2
0
43
1
1
6
7
21
1
0
42
6
17
53
T
rin
com
alee
1
1
13
1
8
2
5
5
13
9
3
03
6
61
K
uru
neg
ala
30
2
1
12
0
27
1
8
6
22
2
8
85
5
83
62
P
utt
alam
1
6
12
5
0
10
8
2
9
7
3
53
1
3
71
A
nu
rad
hap
ura
2
2
19
5
7
16
1
2
5
22
6
5
51
4
3
72
P
olo
nn
aru
wa
7
7
2
4
4
5
3
8
4
24
3
15
81
B
adu
lla
15
1
8
44
1
2
12
6
1
4
27
5
71
4
0
82
M
on
arag
ala
11
1
0
27
8
6
4
9
9
2
85
2
3
91
R
atn
apu
ra
17
1
7
46
1
7
8
4
16
1
4
57
9
48
92
K
egal
le
11
1
2
44
1
1
9
3
12
1
4
51
9
42
S
ri L
an
ka
3
31
3
35
1
,08
4
26
5
20
1
99
3
12
3
52
9
,79
3
75
5
- N
ot
app
lica
ble
-13-
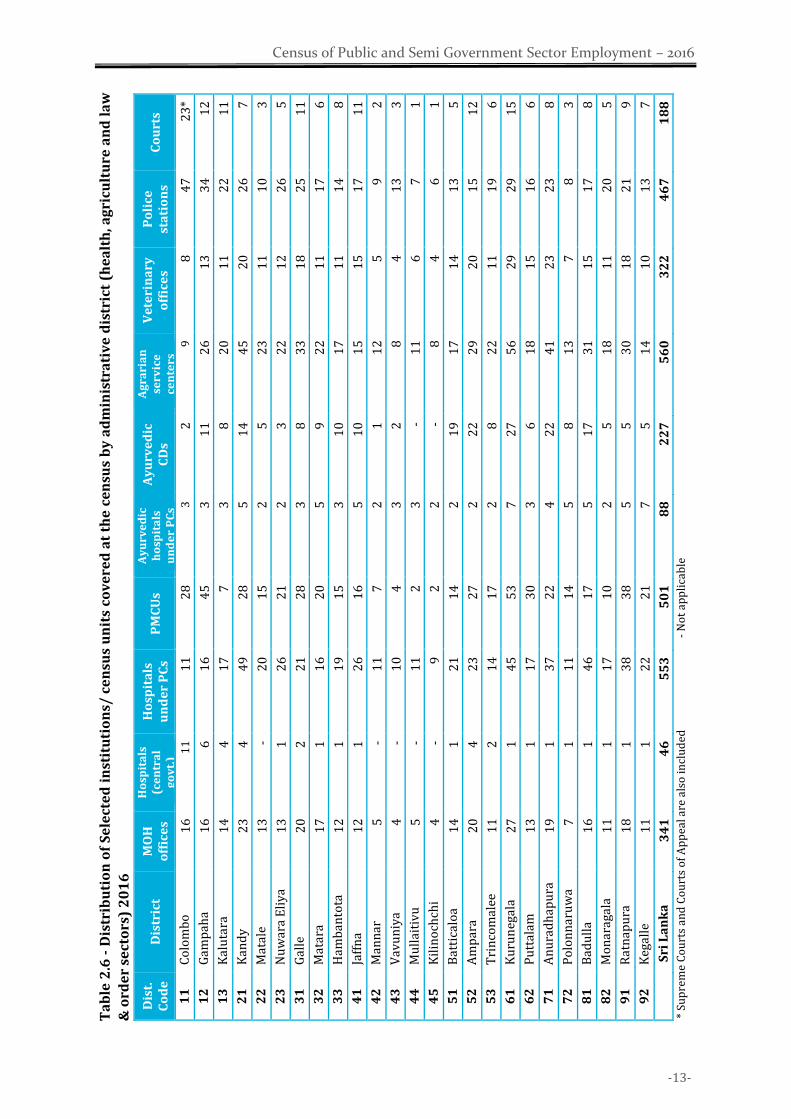
Census of Public and Semi Government Sector Employment – 2016
T
ab
le 2
.6 -
Dis
trib
uti
on
of
Se
lect
ed
in
stit
uti
on
s/ c
en
sus
un
its
cov
ere
d a
t th
e c
en
sus
by
ad
min
istr
ati
ve
dis
tric
t (h
ea
lth
, ag
ricu
ltu
re a
nd
la
w
& o
rde
r se
cto
rs)
20
16
Dis
t.
Co
de
D
istr
ict
MO
H
off
ice
s
Ho
spit
als
(c
en
tra
l g
ov
t.)
Ho
spit
als
u
nd
er
PC
s P
MC
Us
Ay
urv
ed
ic
ho
spit
als
u
nd
er
PC
s
Ay
urv
ed
ic
CD
s
Ag
rari
an
se
rvic
e
cen
ters
Ve
teri
na
ry
off
ice
s P
oli
ce
sta
tio
ns
Co
urt
s
11
C
olo
mb
o
16
1
1
11
2
8
3
2
9
8
47
2
3*
12
G
amp
aha
16
6
1
6
45
3
1
1
26
1
3
34
1
2
13
K
alu
tara
1
4
4
17
7
3
8
2
0
11
2
2
11
21
K
and
y
23
4
4
9
28
5
1
4
45
2
0
26
7
22
M
atal
e 1
3
- 2
0
15
2
5
2
3
11
1
0
3
23
N
uw
ara
Eli
ya
1
3
1
26
2
1
2
3
22
1
2
26
5
31
G
alle
2
0
2
21
2
8
3
8
33
1
8
25
1
1
32
M
atar
a 1
7
1
16
2
0
5
9
22
1
1
17
6
33
H
amb
anto
ta
12
1
1
9
15
3
1
0
17
1
1
14
8
41
Ja
ffn
a
12
1
2
6
16
5
1
0
15
1
5
17
1
1
42
M
ann
ar
5
- 1
1
7
2
1
12
5
9
2
43
V
avu
niy
a 4
-
10
4
3
2
8
4
1
3
3
44
M
ull
aiti
vu
5
-
11
2
3
-
11
6
7
1
45
K
ilin
och
chi
4
- 9
2
2
-
8
4
6
1
51
B
atti
calo
a 1
4
1
21
1
4
2
19
1
7
14
1
3
5
52
A
mp
ara
20
4
2
3
27
2
2
2
29
2
0
15
1
2
53
T
rin
com
alee
1
1
2
14
1
7
2
8
22
1
1
19
6
61
K
uru
neg
ala
27
1
4
5
53
7
2
7
56
2
9
29
1
5
62
P
utt
alam
1
3
1
17
3
0
3
6
18
1
5
16
6
71
A
nu
rad
hap
ura
1
9
1
37
2
2
4
22
4
1
23
2
3
8
72
P
olo
nn
aru
wa
7
1
1
1
14
5
8
1
3
7
8
3
81
B
adu
lla
16
1
4
6
17
5
1
7
31
1
5
17
8
82
M
on
arag
ala
11
1
1
7
10
2
5
1
8
11
2
0
5
91
R
atn
apu
ra
18
1
3
8
38
5
5
3
0
18
2
1
9
92
K
egal
le
11
1
2
2
21
7
5
1
4
10
1
3
7
S
ri L
an
ka
3
41
4
6
55
3
50
1
88
2
27
5
60
3
22
4
67
1
88
*
Su
pre
me
Co
urt
s an
d C
ou
rts
of
Ap
pea
l are
als
o in
clu
ded
- N
ot
app
lica
ble
Census of Public and Semi Government Sector Employment – 2016
-14-
3. SUMMARY OF FINDINGS ON EMPLOYEES
This section presents some key findings on public and semi government sector employees such
as the sector of employment, employees in line ministries as well as some key information on
employees such as the age and sex, ethnicity, religion, marital status, nature of appointment, level
of education, major occupation group, professional/ vocational qualifications, language skills,
district of the place of work, mode of travel to work, Non Communicable Diseases they are
suffering from, and the level of their ICT literacy.
3.1 Sector of employment
The Census of Public and Semi Government Sector Employment covered 1,109,475 employees
working in both the Central Government and Provincial councils working in approximately
32,750 census units. As explained in Chapter 2, a separate administrative unit which belongs to
the Central Government or a Provincial Council covered at the census is defined as a census unit.
A census unit may belong to a major institution but functions as an independent entity in carrying
out work assigned to that institution.
When institutions irrespective of the size are considered, the census covered 32,750 institutions
of which majority belong to the central governments. However, majority of institutions coming
under Provincial Councils comprise of schools and hospitals functioning under the nine provincial
councils.
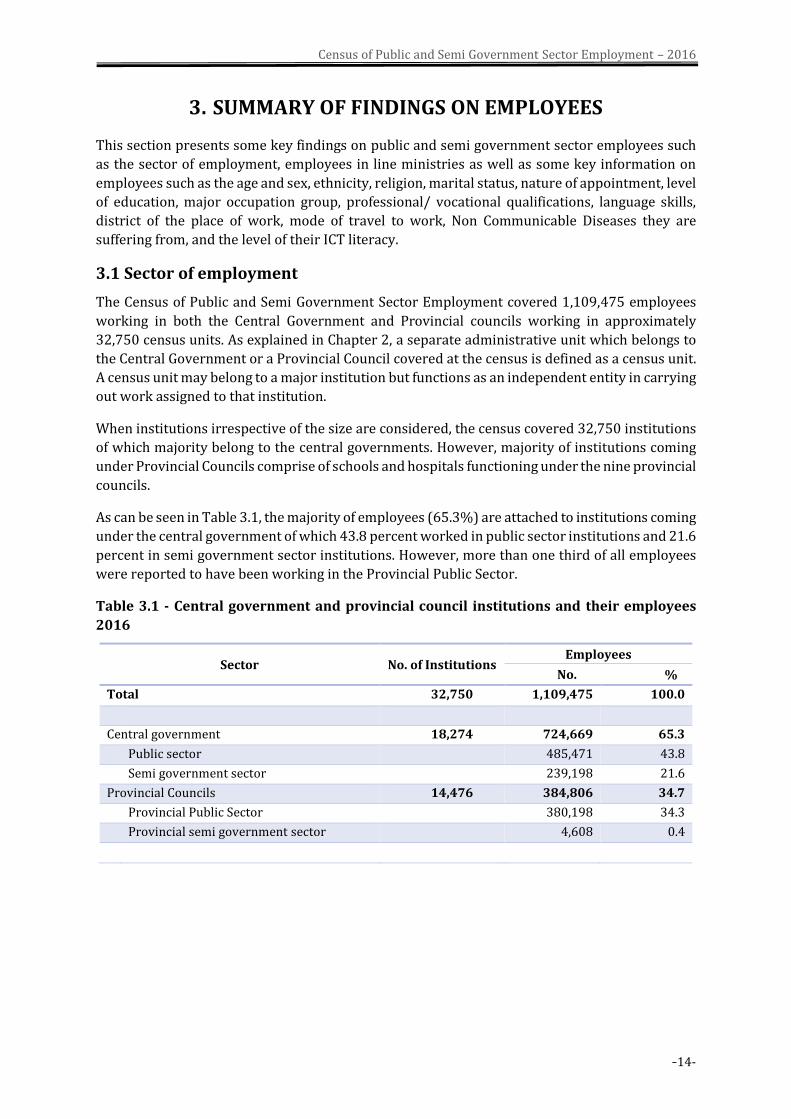
As can be seen in Table 3.1, the majority of employees (65.3%) are attached to institutions coming
under the central government of which 43.8 percent worked in public sector institutions and 21.6
percent in semi government sector institutions. However, more than one third of all employees
were reported to have been working in the Provincial Public Sector.
Table 3.1 - Central government and provincial council institutions and their employees
2016
Sector No. of Institutions Employees
No. %
Total 32,750 1,109,475 100.0
Central government 18,274 724,669 65.3
Public sector 485,471 43.8
Semi government sector 239,198 21.6
Provincial Councils 14,476 384,806 34.7
Provincial Public Sector 380,198 34.3
Provincial semi government sector 4,608 0.4
Census of Public and Semi Government Sector Employment – 2016
-15-
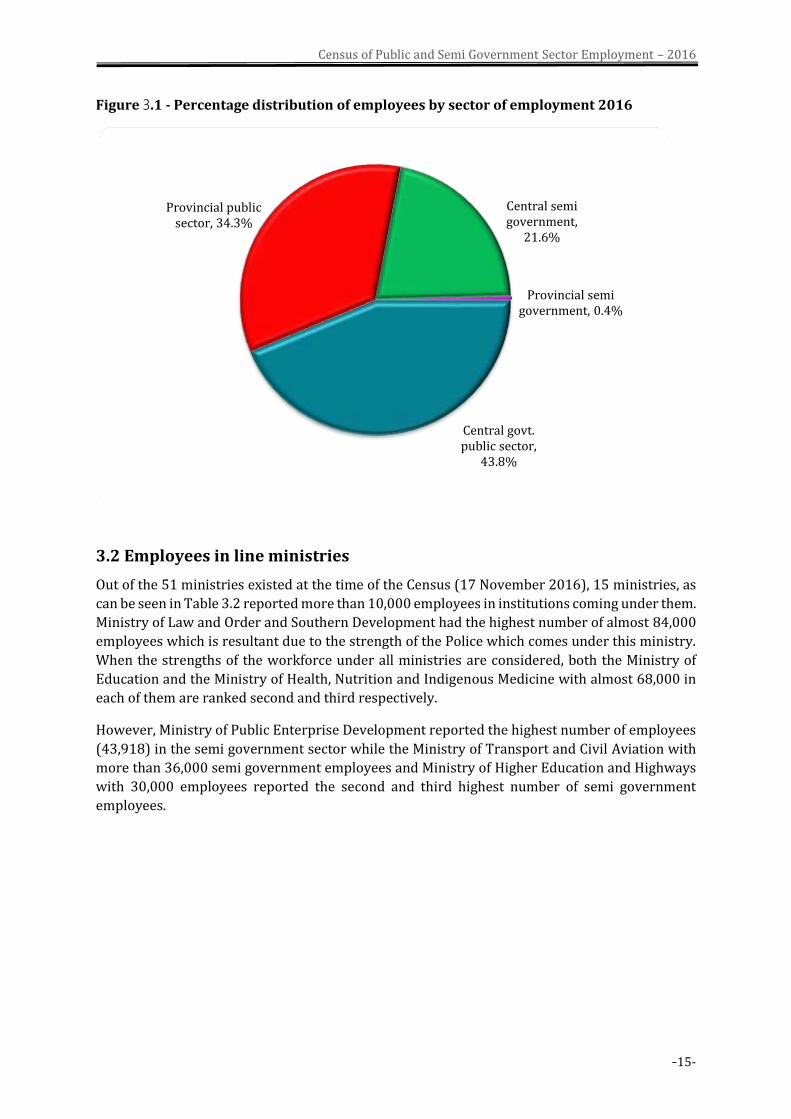
Figure 3.1 - Percentage distribution of employees by sector of employment 2016
3.2 Employees in line ministries
Out of the 51 ministries existed at the time of the Census (17 November 2016), 15 ministries, as
can be seen in Table 3.2 reported more than 10,000 employees in institutions coming under them.
Ministry of Law and Order and Southern Development had the highest number of almost 84,000
employees which is resultant due to the strength of the Police which comes under this ministry.
When the strengths of the workforce under all ministries are considered, both the Ministry of
Education and the Ministry of Health, Nutrition and Indigenous Medicine with almost 68,000 in
each of them are ranked second and third respectively.
However, Ministry of Public Enterprise Development reported the highest number of employees
(43,918) in the semi government sector while the Ministry of Transport and Civil Aviation with
more than 36,000 semi government employees and Ministry of Higher Education and Highways
with 30,000 employees reported the second and third highest number of semi government
employees.
Central govt. public sector,
43.8%
Provincial public sector, 34.3%
Central semi government,
21.6%
Provincial semi government, 0.4%
Census of Public and Semi Government Sector Employment – 2016
-16-
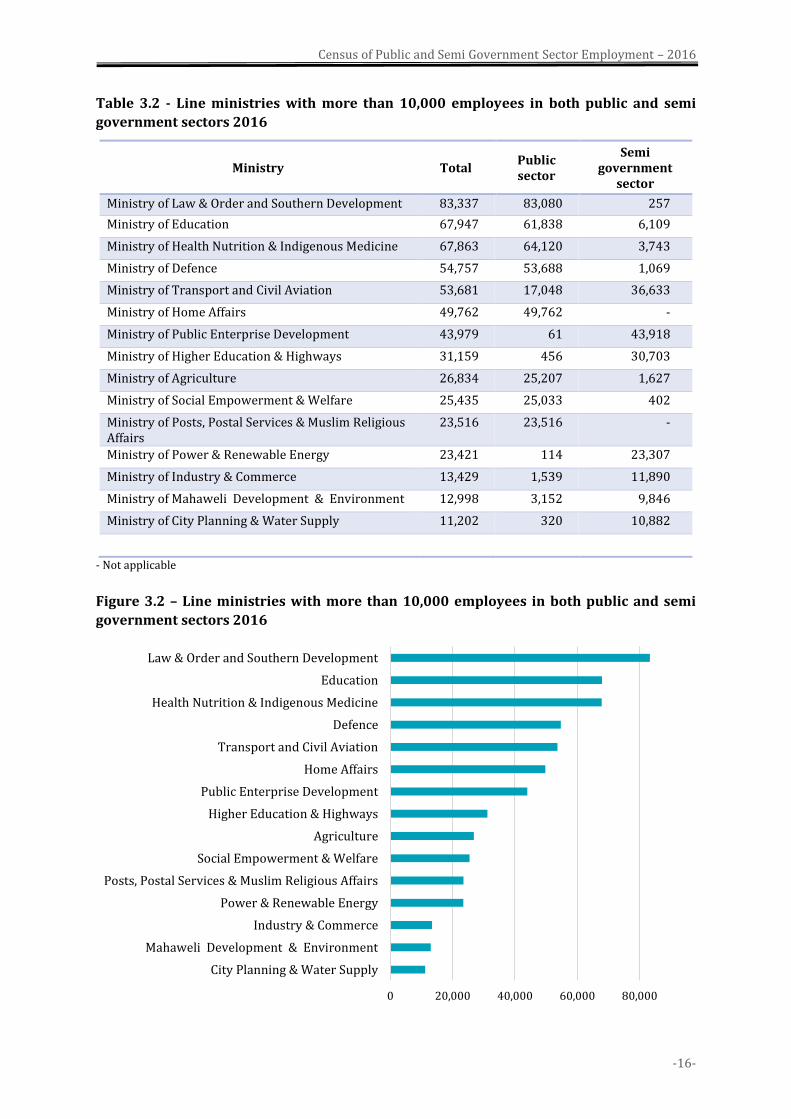
Table 3.2 - Line ministries with more than 10,000 employees in both public and semi
government sectors 2016
Ministry Total Public sector
Semi government
sector
Ministry of Law & Order and Southern Development 83,337 83,080 257
Ministry of Education 67,947 61,838 6,109
Ministry of Health Nutrition & Indigenous Medicine 67,863 64,120 3,743
Ministry of Defence 54,757 53,688 1,069
Ministry of Transport and Civil Aviation 53,681 17,048 36,633
Ministry of Home Affairs 49,762 49,762 -
Ministry of Public Enterprise Development 43,979 61 43,918
Ministry of Higher Education & Highways 31,159 456 30,703
Ministry of Agriculture 26,834 25,207 1,627
Ministry of Social Empowerment & Welfare 25,435 25,033 402
Ministry of Posts, Postal Services & Muslim Religious Affairs
23,516 23,516 -
Ministry of Power & Renewable Energy 23,421 114 23,307
Ministry of Industry & Commerce 13,429 1,539 11,890
Ministry of Mahaweli Development & Environment 12,998 3,152 9,846
Ministry of City Planning & Water Supply 11,202 320 10,882
- Not applicable
Figure 3.2 – Line ministries with more than 10,000 employees in both public and semi
government sectors 2016
0 20,000 40,000 60,000 80,000
City Planning & Water Supply
Mahaweli Development & Environment
Industry & Commerce
Power & Renewable Energy
Posts, Postal Services & Muslim Religious Affairs
Social Empowerment & Welfare
Agriculture
Higher Education & Highways
Public Enterprise Development
Home Affairs
Transport and Civil Aviation
Defence
Health Nutrition & Indigenous Medicine
Education
Law & Order and Southern Development
Census of Public and Semi Government Sector Employment – 2016
-17-
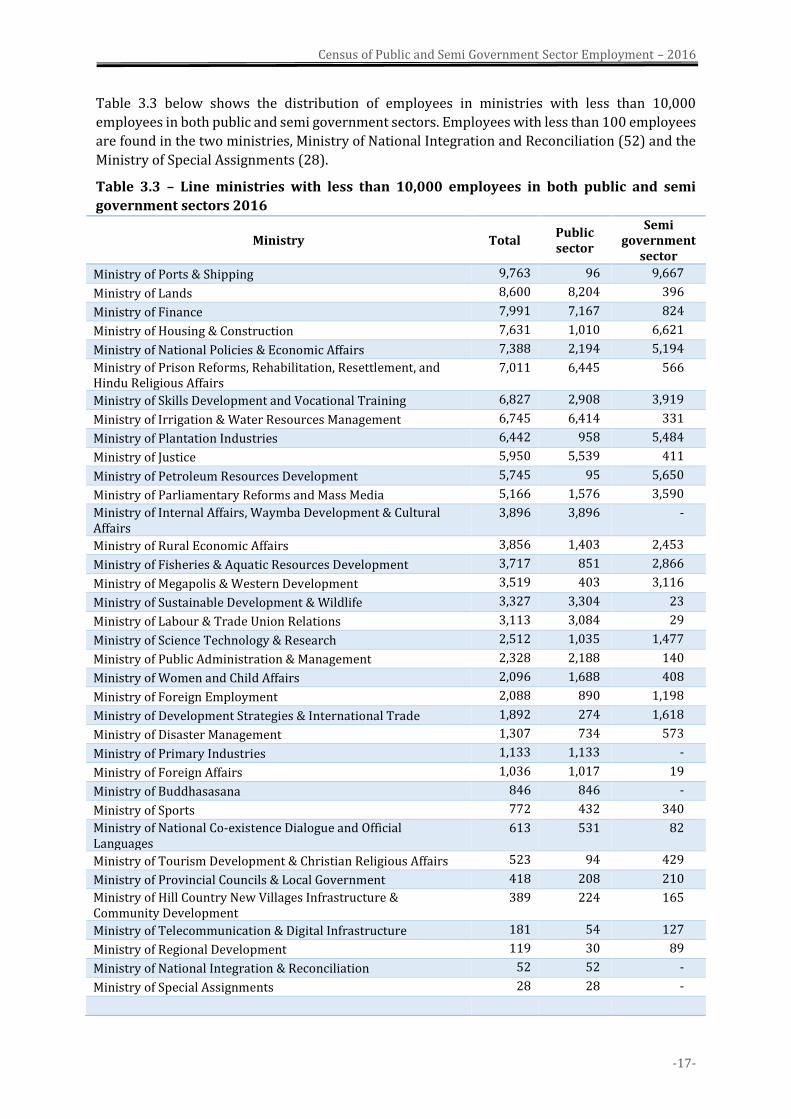
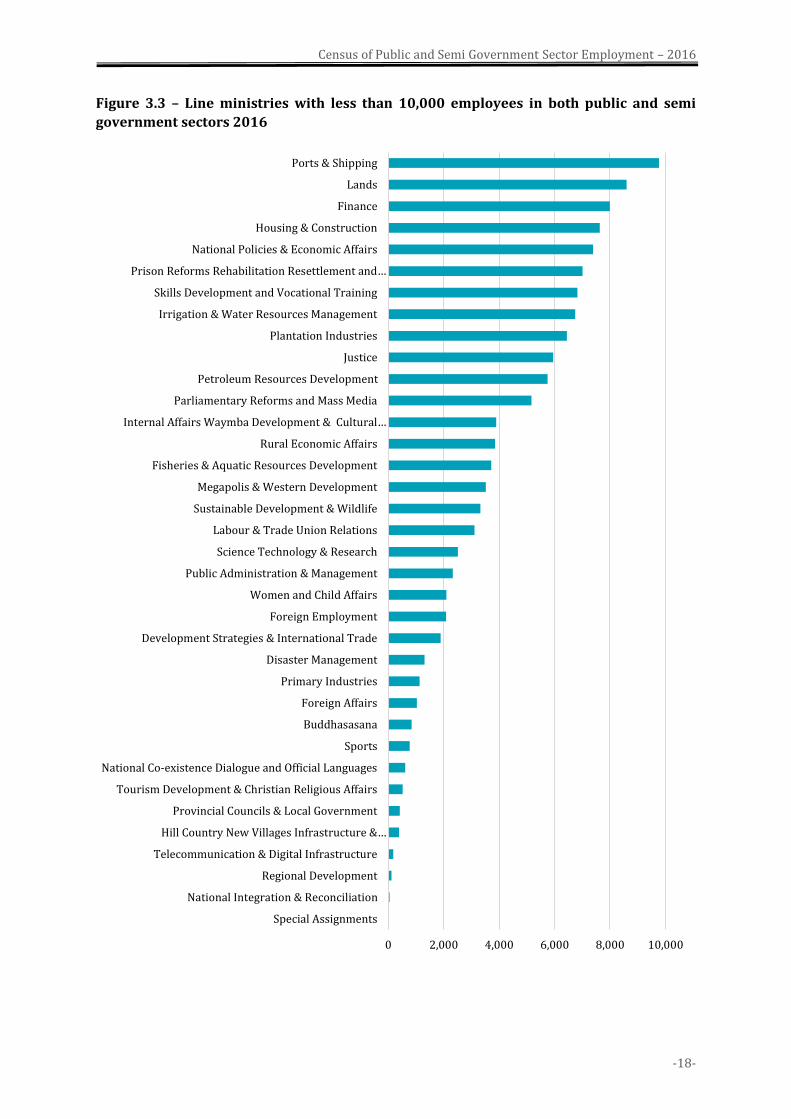
Table 3.3 below shows the distribution of employees in ministries with less than 10,000
employees in both public and semi government sectors. Employees with less than 100 employees
are found in the two ministries, Ministry of National Integration and Reconciliation (52) and the
Ministry of Special Assignments (28).
Table 3.3 – Line ministries with less than 10,000 employees in both public and semi
government sectors 2016
Ministry Total Public sector
Semi government
sector
Ministry of Ports & Shipping 9,763 96 9,667
Ministry of Lands 8,600 8,204 396
Ministry of Finance 7,991 7,167 824
Ministry of Housing & Construction 7,631 1,010 6,621
Ministry of National Policies & Economic Affairs 7,388 2,194 5,194
Ministry of Prison Reforms, Rehabilitation, Resettlement, and Hindu Religious Affairs
7,011 6,445 566
Ministry of Skills Development and Vocational Training 6,827 2,908 3,919
Ministry of Irrigation & Water Resources Management 6,745 6,414 331
Ministry of Plantation Industries 6,442 958 5,484
Ministry of Justice 5,950 5,539 411
Ministry of Petroleum Resources Development 5,745 95 5,650
Ministry of Parliamentary Reforms and Mass Media 5,166 1,576 3,590
Ministry of Internal Affairs, Waymba Development & Cultural Affairs
3,896 3,896 -
Ministry of Rural Economic Affairs 3,856 1,403 2,453
Ministry of Fisheries & Aquatic Resources Development 3,717 851 2,866
Ministry of Megapolis & Western Development 3,519 403 3,116
Ministry of Sustainable Development & Wildlife 3,327 3,304 23
Ministry of Labour & Trade Union Relations 3,113 3,084 29
Ministry of Science Technology & Research 2,512 1,035 1,477
Ministry of Public Administration & Management 2,328 2,188 140
Ministry of Women and Child Affairs 2,096 1,688 408
Ministry of Foreign Employment 2,088 890 1,198
Ministry of Development Strategies & International Trade 1,892 274 1,618
Ministry of Disaster Management 1,307 734 573
Ministry of Primary Industries 1,133 1,133 -
Ministry of Foreign Affairs 1,036 1,017 19
Ministry of Buddhasasana 846 846 -
Ministry of Sports 772 432 340
Ministry of National Co-existence Dialogue and Official Languages
613 531 82
Ministry of Tourism Development & Christian Religious Affairs 523 94 429
Ministry of Provincial Councils & Local Government 418 208 210
Ministry of Hill Country New Villages Infrastructure & Community Development
389 224 165
Ministry of Telecommunication & Digital Infrastructure 181 54 127
Ministry of Regional Development 119 30 89
Ministry of National Integration & Reconciliation 52 52 -
Ministry of Special Assignments 28 28 -
Census of Public and Semi Government Sector Employment – 2016
-18-
Figure 3.3 – Line ministries with less than 10,000 employees in both public and semi
government sectors 2016
0 2,000 4,000 6,000 8,000 10,000
Special Assignments
National Integration & Reconciliation
Regional Development
Telecommunication & Digital Infrastructure
Hill Country New Villages Infrastructure &…
Provincial Councils & Local Government
Tourism Development & Christian Religious Affairs
National Co-existence Dialogue and Official Languages
Sports
Buddhasasana
Foreign Affairs
Primary Industries
Disaster Management
Development Strategies & International Trade
Foreign Employment
Women and Child Affairs
Public Administration & Management
Science Technology & Research
Labour & Trade Union Relations
Sustainable Development & Wildlife
Megapolis & Western Development
Fisheries & Aquatic Resources Development
Rural Economic Affairs
Internal Affairs Waymba Development & Cultural…
Parliamentary Reforms and Mass Media
Petroleum Resources Development
Justice
Plantation Industries
Irrigation & Water Resources Management
Skills Development and Vocational Training
Prison Reforms Rehabilitation Resettlement and…
National Policies & Economic Affairs
Housing & Construction
Finance
Lands
Ports & Shipping
Census of Public and Semi Government Sector Employment – 2016
-19-
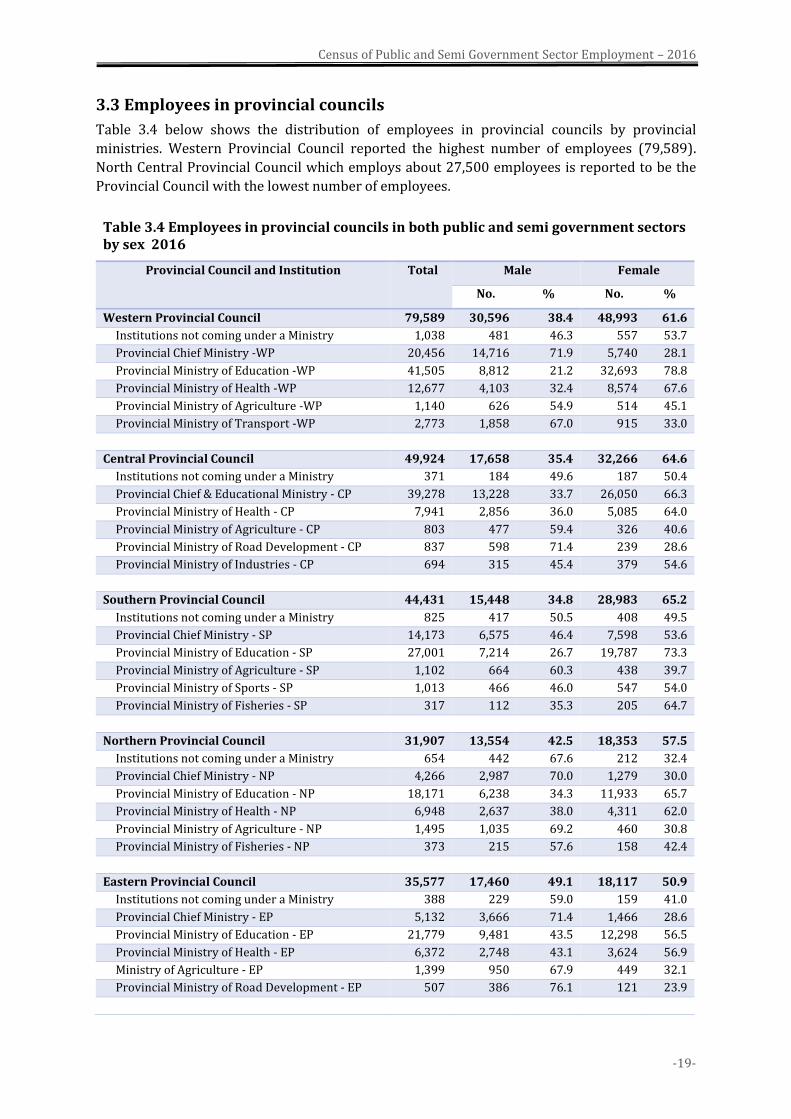
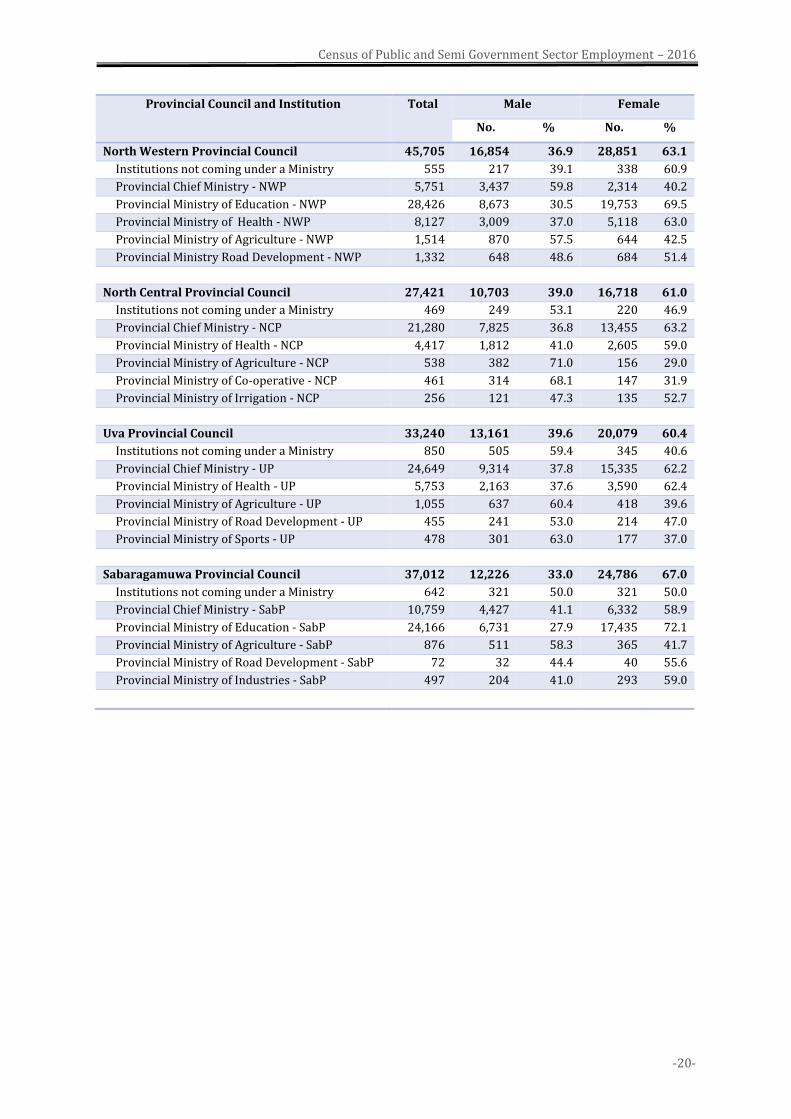
3.3 Employees in provincial councils
Table 3.4 below shows the distribution of employees in provincial councils by provincial
ministries. Western Provincial Council reported the highest number of employees (79,589).
North Central Provincial Council which employs about 27,500 employees is reported to be the
Provincial Council with the lowest number of employees.
Table 3.4 Employees in provincial councils in both public and semi government sectors by sex 2016
Provincial Council and Institution Total Male Female
No. % No. %
Western Provincial Council 79,589 30,596 38.4 48,993 61.6
Institutions not coming under a Ministry 1,038 481 46.3 557 53.7
Provincial Chief Ministry -WP 20,456 14,716 71.9 5,740 28.1
Provincial Ministry of Education -WP 41,505 8,812 21.2 32,693 78.8
Provincial Ministry of Health -WP 12,677 4,103 32.4 8,574 67.6
Provincial Ministry of Agriculture -WP 1,140 626 54.9 514 45.1
Provincial Ministry of Transport -WP 2,773 1,858 67.0 915 33.0
Central Provincial Council 49,924 17,658 35.4 32,266 64.6
Institutions not coming under a Ministry 371 184 49.6 187 50.4
Provincial Chief & Educational Ministry - CP 39,278 13,228 33.7 26,050 66.3
Provincial Ministry of Health - CP 7,941 2,856 36.0 5,085 64.0
Provincial Ministry of Agriculture - CP 803 477 59.4 326 40.6
Provincial Ministry of Road Development - CP 837 598 71.4 239 28.6
Provincial Ministry of Industries - CP 694 315 45.4 379 54.6
Southern Provincial Council 44,431 15,448 34.8 28,983 65.2
Institutions not coming under a Ministry 825 417 50.5 408 49.5
Provincial Chief Ministry - SP 14,173 6,575 46.4 7,598 53.6
Provincial Ministry of Education - SP 27,001 7,214 26.7 19,787 73.3
Provincial Ministry of Agriculture - SP 1,102 664 60.3 438 39.7
Provincial Ministry of Sports - SP 1,013 466 46.0 547 54.0
Provincial Ministry of Fisheries - SP 317 112 35.3 205 64.7
Northern Provincial Council 31,907 13,554 42.5 18,353 57.5
Institutions not coming under a Ministry 654 442 67.6 212 32.4
Provincial Chief Ministry - NP 4,266 2,987 70.0 1,279 30.0
Provincial Ministry of Education - NP 18,171 6,238 34.3 11,933 65.7
Provincial Ministry of Health - NP 6,948 2,637 38.0 4,311 62.0
Provincial Ministry of Agriculture - NP 1,495 1,035 69.2 460 30.8
Provincial Ministry of Fisheries - NP 373 215 57.6 158 42.4
Eastern Provincial Council 35,577 17,460 49.1 18,117 50.9
Institutions not coming under a Ministry 388 229 59.0 159 41.0
Provincial Chief Ministry - EP 5,132 3,666 71.4 1,466 28.6
Provincial Ministry of Education - EP 21,779 9,481 43.5 12,298 56.5
Provincial Ministry of Health - EP 6,372 2,748 43.1 3,624 56.9
Ministry of Agriculture - EP 1,399 950 67.9 449 32.1
Provincial Ministry of Road Development - EP 507 386 76.1 121 23.9
Census of Public and Semi Government Sector Employment – 2016
-20-
Provincial Council and Institution Total Male Female
No. % No. %
North Western Provincial Council 45,705 16,854 36.9 28,851 63.1
Institutions not coming under a Ministry 555 217 39.1 338 60.9
Provincial Chief Ministry - NWP 5,751 3,437 59.8 2,314 40.2
Provincial Ministry of Education - NWP 28,426 8,673 30.5 19,753 69.5
Provincial Ministry of Health - NWP 8,127 3,009 37.0 5,118 63.0
Provincial Ministry of Agriculture - NWP 1,514 870 57.5 644 42.5
Provincial Ministry Road Development - NWP 1,332 648 48.6 684 51.4
North Central Provincial Council 27,421 10,703 39.0 16,718 61.0
Institutions not coming under a Ministry 469 249 53.1 220 46.9
Provincial Chief Ministry - NCP 21,280 7,825 36.8 13,455 63.2
Provincial Ministry of Health - NCP 4,417 1,812 41.0 2,605 59.0
Provincial Ministry of Agriculture - NCP 538 382 71.0 156 29.0
Provincial Ministry of Co-operative - NCP 461 314 68.1 147 31.9
Provincial Ministry of Irrigation - NCP 256 121 47.3 135 52.7
Uva Provincial Council 33,240 13,161 39.6 20,079 60.4
Institutions not coming under a Ministry 850 505 59.4 345 40.6
Provincial Chief Ministry - UP 24,649 9,314 37.8 15,335 62.2
Provincial Ministry of Health - UP 5,753 2,163 37.6 3,590 62.4
Provincial Ministry of Agriculture - UP 1,055 637 60.4 418 39.6
Provincial Ministry of Road Development - UP 455 241 53.0 214 47.0
Provincial Ministry of Sports - UP 478 301 63.0 177 37.0
Sabaragamuwa Provincial Council 37,012 12,226 33.0 24,786 67.0
Institutions not coming under a Ministry 642 321 50.0 321 50.0
Provincial Chief Ministry - SabP 10,759 4,427 41.1 6,332 58.9
Provincial Ministry of Education - SabP 24,166 6,731 27.9 17,435 72.1
Provincial Ministry of Agriculture - SabP 876 511 58.3 365 41.7
Provincial Ministry of Road Development - SabP 72 32 44.4 40 55.6
Provincial Ministry of Industries - SabP 497 204 41.0 293 59.0
Census of Public and Semi Government Sector Employment – 2016
-21-
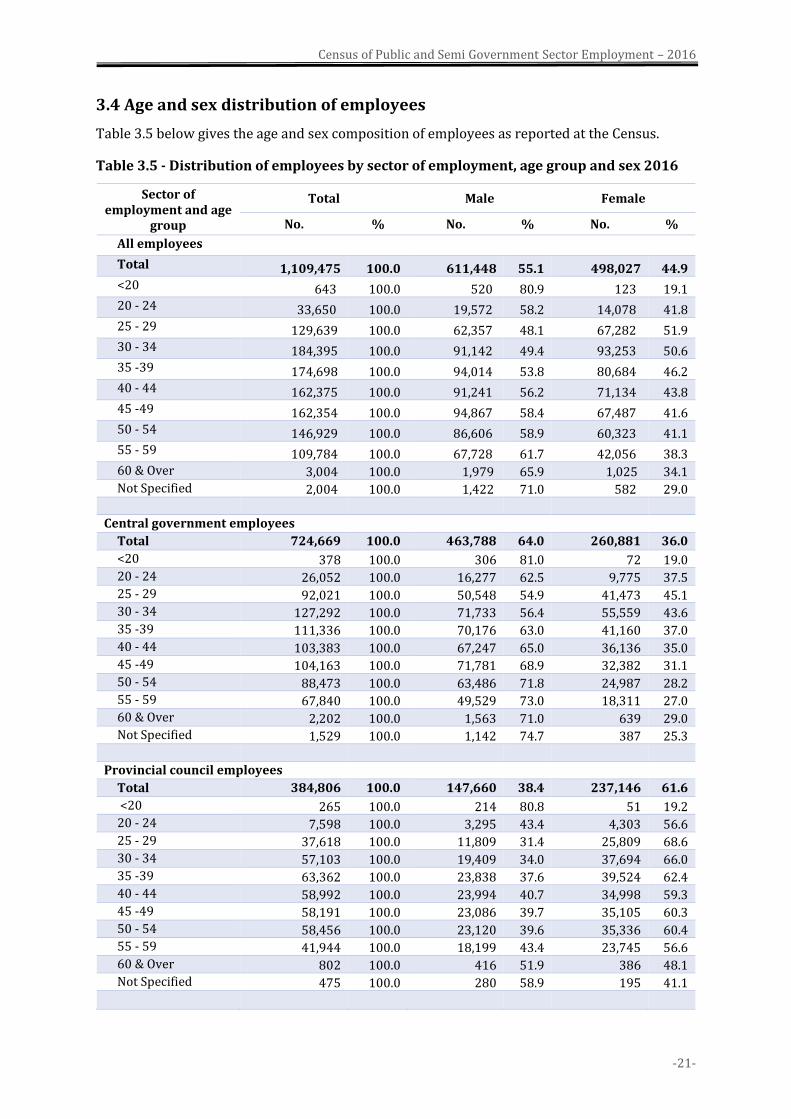
3.4 Age and sex distribution of employees
Table 3.5 below gives the age and sex composition of employees as reported at the Census.
Table 3.5 - Distribution of employees by sector of employment, age group and sex 2016
Sector of employment and age
group
Total Male Female
No. % No. % No. %
All employees Total 1,109,475 100.0 611,448 55.1 498,027 44.9 <20 643 100.0 520 80.9 123 19.1 20 - 24 33,650 100.0 19,572 58.2 14,078 41.8 25 - 29 129,639 100.0 62,357 48.1 67,282 51.9 30 - 34 184,395 100.0 91,142 49.4 93,253 50.6 35 -39 174,698 100.0 94,014 53.8 80,684 46.2 40 - 44 162,375 100.0 91,241 56.2 71,134 43.8 45 -49 162,354 100.0 94,867 58.4 67,487 41.6 50 - 54 146,929 100.0 86,606 58.9 60,323 41.1 55 - 59 109,784 100.0 67,728 61.7 42,056 38.3 60 & Over 3,004 100.0 1,979 65.9 1,025 34.1 Not Specified 2,004 100.0 1,422 71.0 582 29.0
Central government employees
Total 724,669 100.0 463,788 64.0 260,881 36.0
<20 378 100.0 306 81.0 72 19.0 20 - 24 26,052 100.0 16,277 62.5 9,775 37.5 25 - 29 92,021 100.0 50,548 54.9 41,473 45.1 30 - 34 127,292 100.0 71,733 56.4 55,559 43.6 35 -39 111,336 100.0 70,176 63.0 41,160 37.0 40 - 44 103,383 100.0 67,247 65.0 36,136 35.0 45 -49 104,163 100.0 71,781 68.9 32,382 31.1 50 - 54 88,473 100.0 63,486 71.8 24,987 28.2 55 - 59 67,840 100.0 49,529 73.0 18,311 27.0 60 & Over 2,202 100.0 1,563 71.0 639 29.0 Not Specified 1,529 100.0 1,142 74.7 387 25.3
Provincial council employees
Total 384,806 100.0 147,660 38.4 237,146 61.6
<20 265 100.0 214 80.8 51 19.2 20 - 24 7,598 100.0 3,295 43.4 4,303 56.6 25 - 29 37,618 100.0 11,809 31.4 25,809 68.6 30 - 34 57,103 100.0 19,409 34.0 37,694 66.0 35 -39 63,362 100.0 23,838 37.6 39,524 62.4 40 - 44 58,992 100.0 23,994 40.7 34,998 59.3 45 -49 58,191 100.0 23,086 39.7 35,105 60.3 50 - 54 58,456 100.0 23,120 39.6 35,336 60.4 55 - 59 41,944 100.0 18,199 43.4 23,745 56.6 60 & Over 802 100.0 416 51.9 386 48.1 Not Specified 475 100.0 280 58.9 195 41.1
Census of Public and Semi Government Sector Employment – 2016
-22-
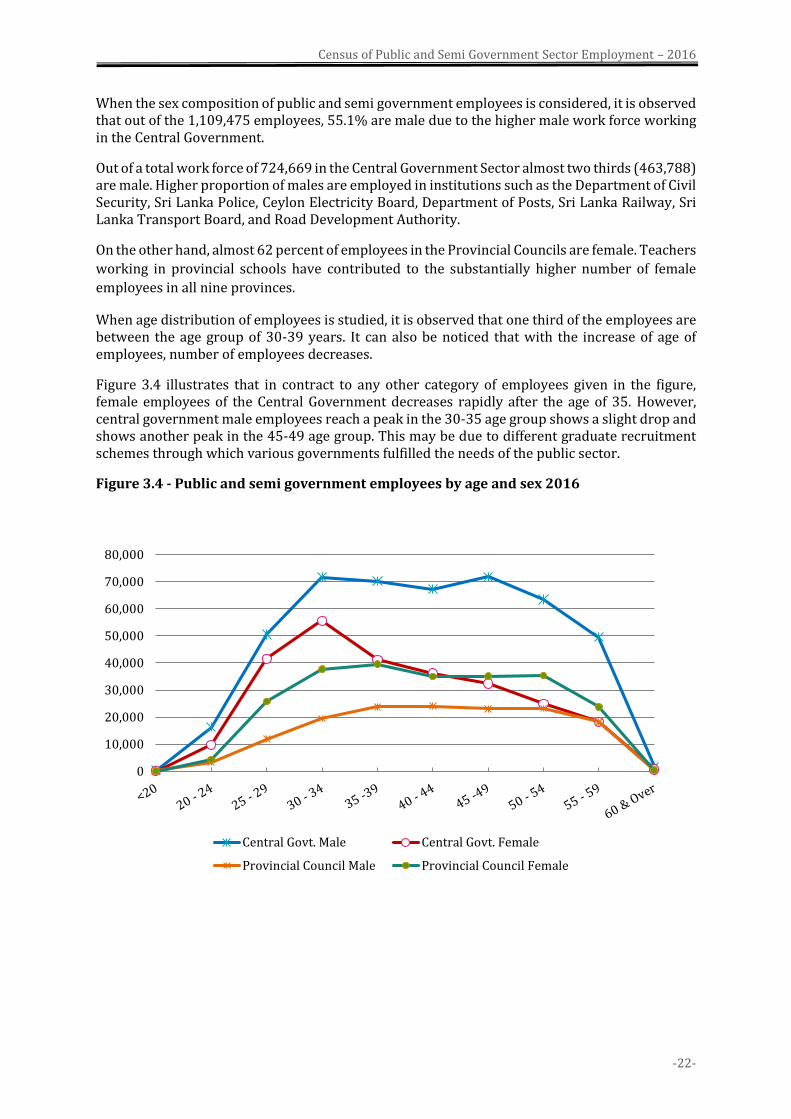
When the sex composition of public and semi government employees is considered, it is observed that out of the 1,109,475 employees, 55.1% are male due to the higher male work force working in the Central Government.
Out of a total work force of 724,669 in the Central Government Sector almost two thirds (463,788) are male. Higher proportion of males are employed in institutions such as the Department of Civil Security, Sri Lanka Police, Ceylon Electricity Board, Department of Posts, Sri Lanka Railway, Sri Lanka Transport Board, and Road Development Authority.
On the other hand, almost 62 percent of employees in the Provincial Councils are female. Teachers
working in provincial schools have contributed to the substantially higher number of female
employees in all nine provinces.
When age distribution of employees is studied, it is observed that one third of the employees are between the age group of 30-39 years. It can also be noticed that with the increase of age of employees, number of employees decreases.
Figure 3.4 illustrates that in contract to any other category of employees given in the figure, female employees of the Central Government decreases rapidly after the age of 35. However, central government male employees reach a peak in the 30-35 age group shows a slight drop and shows another peak in the 45-49 age group. This may be due to different graduate recruitment schemes through which various governments fulfilled the needs of the public sector.
Figure 3.4 - Public and semi government employees by age and sex 2016
0
10,000
20,000
30,000
40,000
50,000
60,000
70,000
80,000
Central Govt. Male Central Govt. Female
Provincial Council Male Provincial Council Female
Census of Public and Semi Government Sector Employment – 2016
-23-
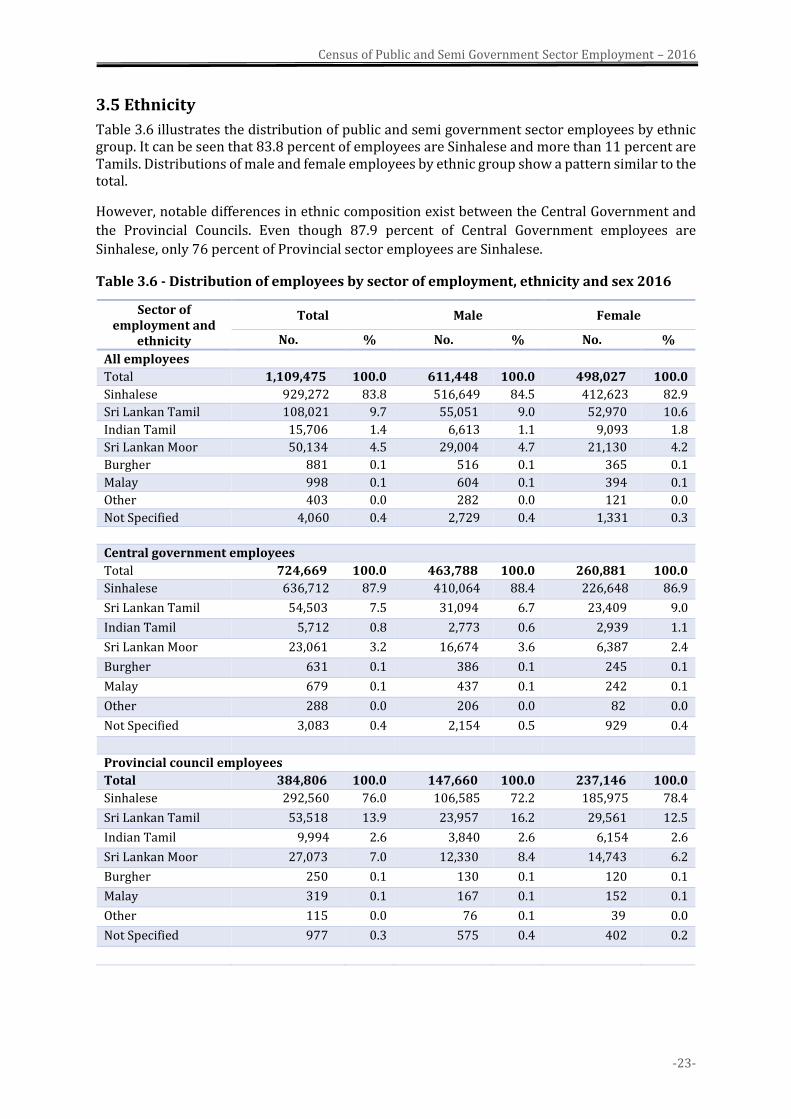
3.5 Ethnicity
Table 3.6 illustrates the distribution of public and semi government sector employees by ethnic group. It can be seen that 83.8 percent of employees are Sinhalese and more than 11 percent are Tamils. Distributions of male and female employees by ethnic group show a pattern similar to the total.
However, notable differences in ethnic composition exist between the Central Government and
the Provincial Councils. Even though 87.9 percent of Central Government employees are
Sinhalese, only 76 percent of Provincial sector employees are Sinhalese.
Table 3.6 - Distribution of employees by sector of employment, ethnicity and sex 2016
Sector of employment and
ethnicity
Total Male Female
No. % No. % No. %
All employees
Total 1,109,475 100.0 611,448 100.0 498,027 100.0
Sinhalese 929,272 83.8 516,649 84.5 412,623 82.9
Sri Lankan Tamil 108,021 9.7 55,051 9.0 52,970 10.6
Indian Tamil 15,706 1.4 6,613 1.1 9,093 1.8
Sri Lankan Moor 50,134 4.5 29,004 4.7 21,130 4.2
Burgher 881 0.1 516 0.1 365 0.1
Malay 998 0.1 604 0.1 394 0.1
Other 403 0.0 282 0.0 121 0.0
Not Specified 4,060 0.4 2,729 0.4 1,331 0.3
Central government employees
Total 724,669 100.0 463,788 100.0 260,881 100.0
Sinhalese 636,712 87.9 410,064 88.4 226,648 86.9
Sri Lankan Tamil 54,503 7.5 31,094 6.7 23,409 9.0
Indian Tamil 5,712 0.8 2,773 0.6 2,939 1.1
Sri Lankan Moor 23,061 3.2 16,674 3.6 6,387 2.4
Burgher 631 0.1 386 0.1 245 0.1
Malay 679 0.1 437 0.1 242 0.1
Other 288 0.0 206 0.0 82 0.0
Not Specified 3,083 0.4 2,154 0.5 929 0.4
Provincial council employees
Total 384,806 100.0 147,660 100.0 237,146 100.0
Sinhalese 292,560 76.0 106,585 72.2 185,975 78.4
Sri Lankan Tamil 53,518 13.9 23,957 16.2 29,561 12.5
Indian Tamil 9,994 2.6 3,840 2.6 6,154 2.6
Sri Lankan Moor 27,073 7.0 12,330 8.4 14,743 6.2
Burgher 250 0.1 130 0.1 120 0.1
Malay 319 0.1 167 0.1 152 0.1
Other 115 0.0 76 0.1 39 0.0
Not Specified 977 0.3 575 0.4 402 0.2
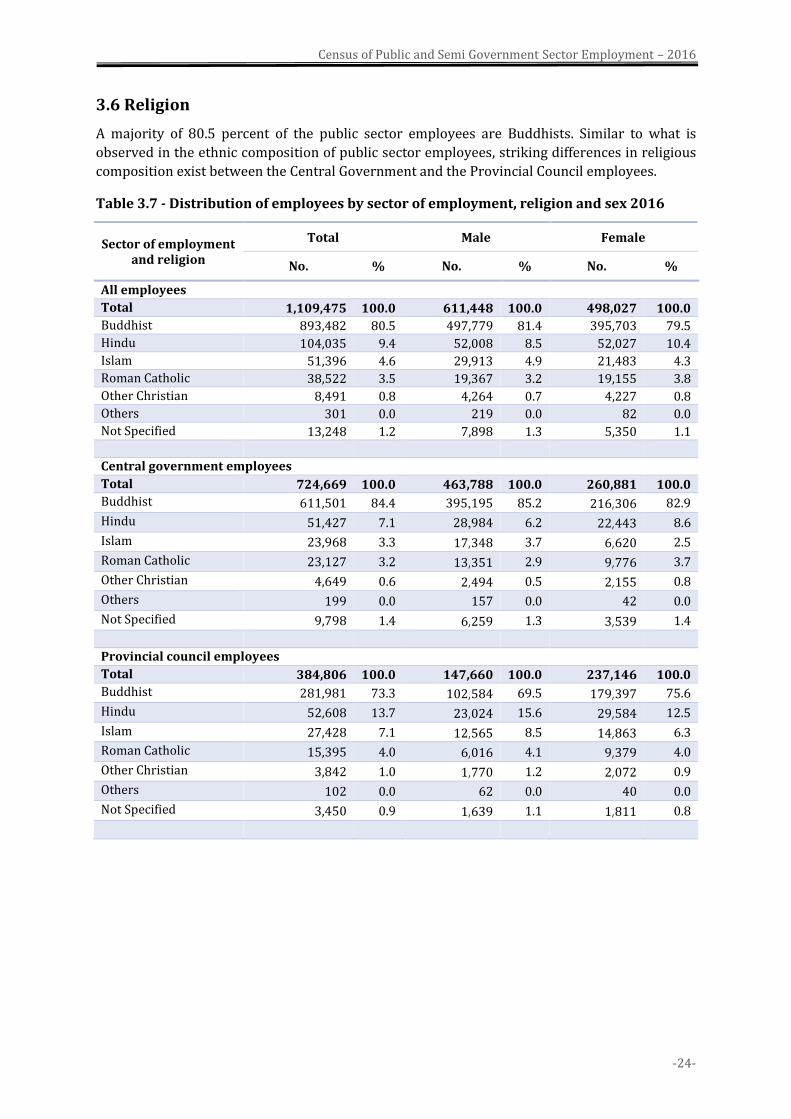
Census of Public and Semi Government Sector Employment – 2016
-24-
3.6 Religion
A majority of 80.5 percent of the public sector employees are Buddhists. Similar to what is
observed in the ethnic composition of public sector employees, striking differences in religious
composition exist between the Central Government and the Provincial Council employees.
Table 3.7 - Distribution of employees by sector of employment, religion and sex 2016
Sector of employment and religion
Total Male Female
No. % No. % No. %
All employees
Total 1,109,475 100.0 611,448 100.0 498,027 100.0
Buddhist 893,482 80.5 497,779 81.4 395,703 79.5
Hindu 104,035 9.4 52,008 8.5 52,027 10.4
Islam 51,396 4.6 29,913 4.9 21,483 4.3
Roman Catholic 38,522 3.5 19,367 3.2 19,155 3.8
Other Christian 8,491 0.8 4,264 0.7 4,227 0.8
Others 301 0.0 219 0.0 82 0.0
Not Specified 13,248 1.2 7,898 1.3 5,350 1.1
Central government employees
Total 724,669 100.0 463,788 100.0 260,881 100.0
Buddhist 611,501 84.4 395,195 85.2 216,306 82.9
Hindu 51,427 7.1 28,984 6.2 22,443 8.6
Islam 23,968 3.3 17,348 3.7 6,620 2.5
Roman Catholic 23,127 3.2 13,351 2.9 9,776 3.7
Other Christian 4,649 0.6 2,494 0.5 2,155 0.8
Others 199 0.0 157 0.0 42 0.0
Not Specified 9,798 1.4 6,259 1.3 3,539 1.4
Provincial council employees
Total 384,806 100.0 147,660 100.0 237,146 100.0
Buddhist 281,981 73.3 102,584 69.5 179,397 75.6
Hindu 52,608 13.7 23,024 15.6 29,584 12.5
Islam 27,428 7.1 12,565 8.5 14,863 6.3
Roman Catholic 15,395 4.0 6,016 4.1 9,379 4.0
Other Christian 3,842 1.0 1,770 1.2 2,072 0.9
Others 102 0.0 62 0.0 40 0.0
Not Specified 3,450 0.9 1,639 1.1 1,811 0.8
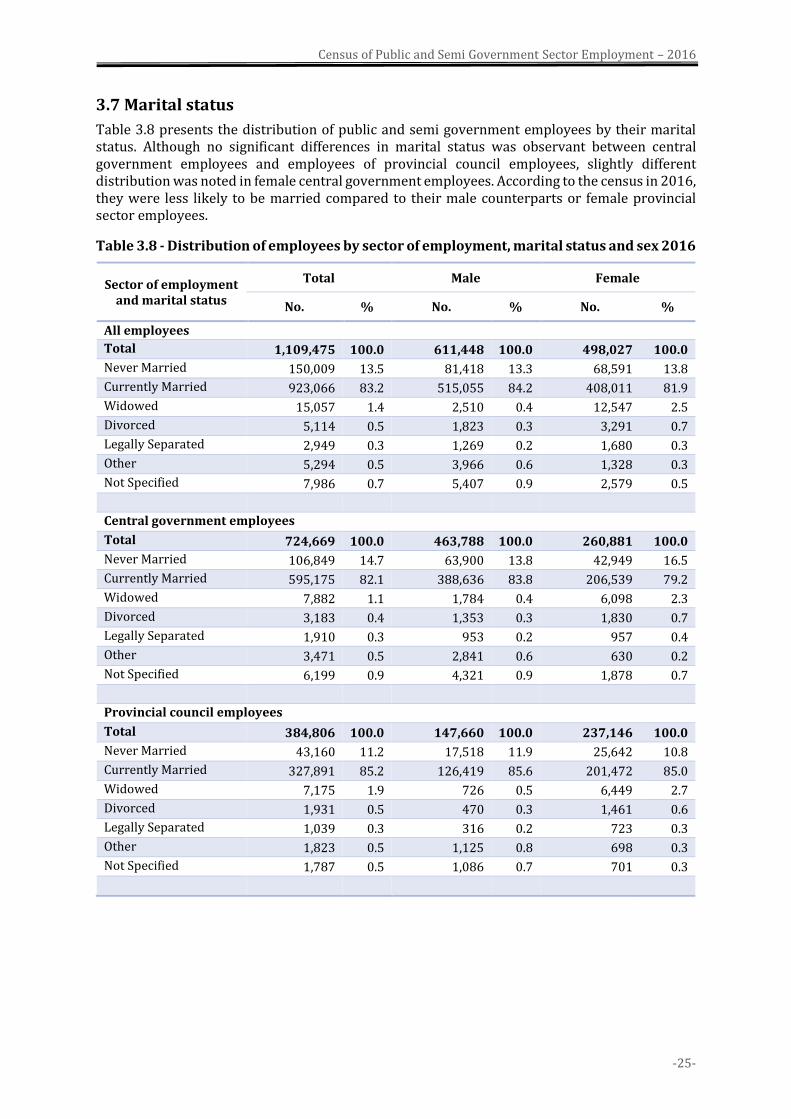
Census of Public and Semi Government Sector Employment – 2016
-25-
3.7 Marital status
Table 3.8 presents the distribution of public and semi government employees by their marital status. Although no significant differences in marital status was observant between central government employees and employees of provincial council employees, slightly different distribution was noted in female central government employees. According to the census in 2016, they were less likely to be married compared to their male counterparts or female provincial sector employees.
Table 3.8 - Distribution of employees by sector of employment, marital status and sex 2016
Sector of employment and marital status
Total Male Female
No. % No. % No. %
All employees
Total 1,109,475 100.0 611,448 100.0 498,027 100.0
Never Married 150,009 13.5 81,418 13.3 68,591 13.8
Currently Married 923,066 83.2 515,055 84.2 408,011 81.9
Widowed 15,057 1.4 2,510 0.4 12,547 2.5
Divorced 5,114 0.5 1,823 0.3 3,291 0.7
Legally Separated 2,949 0.3 1,269 0.2 1,680 0.3
Other 5,294 0.5 3,966 0.6 1,328 0.3
Not Specified 7,986 0.7 5,407 0.9 2,579 0.5
Central government employees
Total 724,669 100.0 463,788 100.0 260,881 100.0
Never Married 106,849 14.7 63,900 13.8 42,949 16.5
Currently Married 595,175 82.1 388,636 83.8 206,539 79.2
Widowed 7,882 1.1 1,784 0.4 6,098 2.3
Divorced 3,183 0.4 1,353 0.3 1,830 0.7
Legally Separated 1,910 0.3 953 0.2 957 0.4
Other 3,471 0.5 2,841 0.6 630 0.2
Not Specified 6,199 0.9 4,321 0.9 1,878 0.7
Provincial council employees
Total 384,806 100.0 147,660 100.0 237,146 100.0
Never Married 43,160 11.2 17,518 11.9 25,642 10.8
Currently Married 327,891 85.2 126,419 85.6 201,472 85.0
Widowed 7,175 1.9 726 0.5 6,449 2.7
Divorced 1,931 0.5 470 0.3 1,461 0.6
Legally Separated 1,039 0.3 316 0.2 723 0.3
Other 1,823 0.5 1,125 0.8 698 0.3
Not Specified 1,787 0.5 1,086 0.7 701 0.3
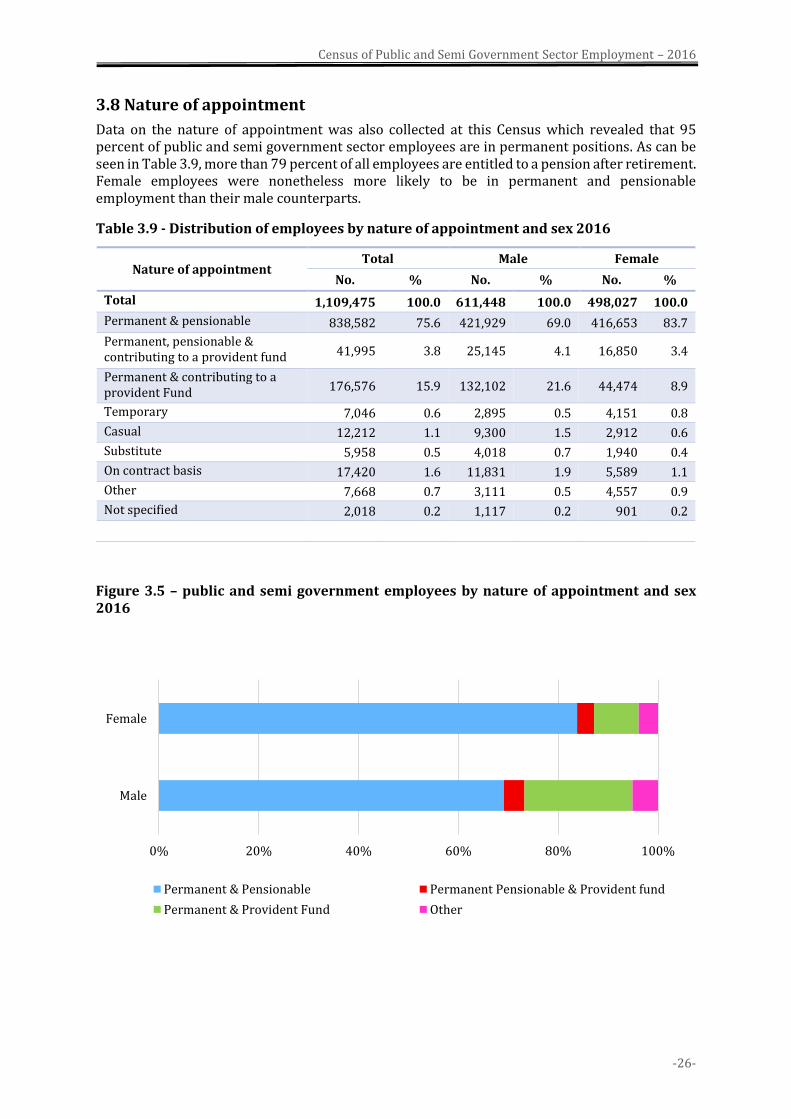
Census of Public and Semi Government Sector Employment – 2016
-26-
3.8 Nature of appointment
Data on the nature of appointment was also collected at this Census which revealed that 95 percent of public and semi government sector employees are in permanent positions. As can be seen in Table 3.9, more than 79 percent of all employees are entitled to a pension after retirement. Female employees were nonetheless more likely to be in permanent and pensionable employment than their male counterparts.
Table 3.9 - Distribution of employees by nature of appointment and sex 2016
Nature of appointment Total Male Female
No. % No. % No. %
Total 1,109,475 100.0 611,448 100.0 498,027 100.0
Permanent & pensionable 838,582 75.6 421,929 69.0 416,653 83.7
Permanent, pensionable & contributing to a provident fund 41,995 3.8 25,145 4.1 16,850 3.4
Permanent & contributing to a provident Fund 176,576 15.9 132,102 21.6 44,474 8.9
Temporary 7,046 0.6 2,895 0.5 4,151 0.8
Casual 12,212 1.1 9,300 1.5 2,912 0.6
Substitute 5,958 0.5 4,018 0.7 1,940 0.4
On contract basis 17,420 1.6 11,831 1.9 5,589 1.1
Other 7,668 0.7 3,111 0.5 4,557 0.9
Not specified 2,018 0.2 1,117 0.2 901 0.2
Figure 3.5 – public and semi government employees by nature of appointment and sex 2016
0% 20% 40% 60% 80% 100%
Male
Female
Permanent & Pensionable Permanent Pensionable & Provident fund
Permanent & Provident Fund Other
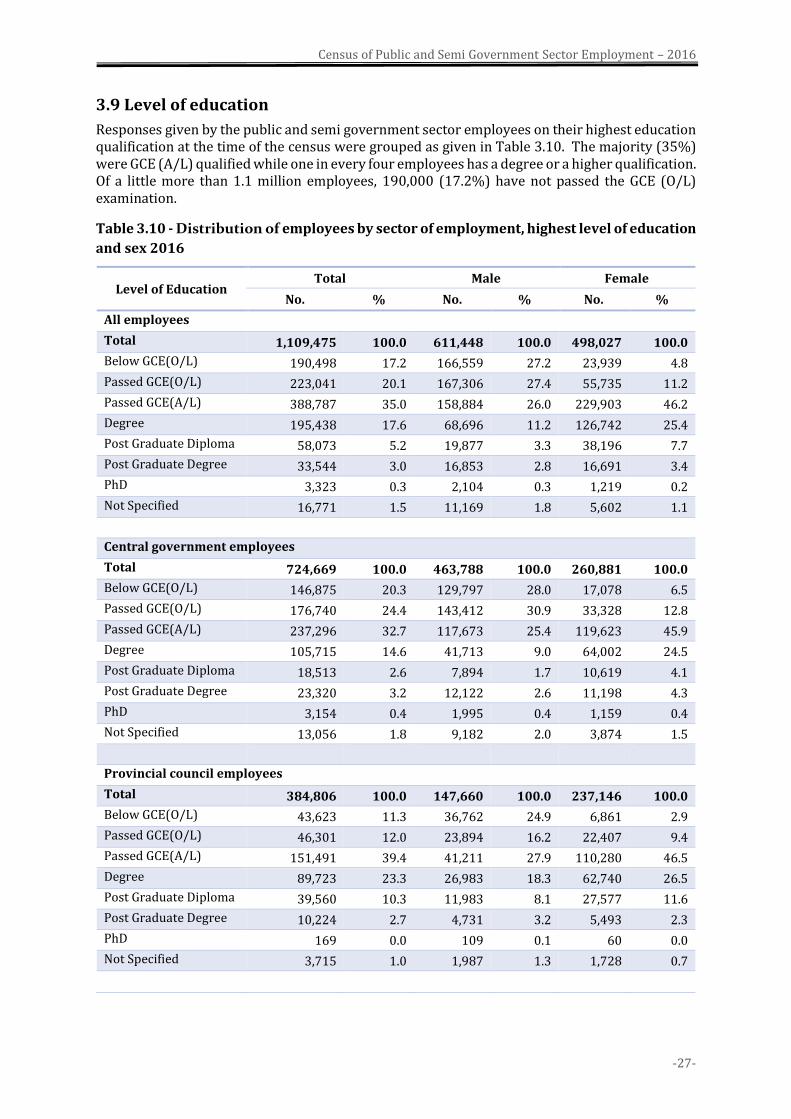
Census of Public and Semi Government Sector Employment – 2016
-27-
3.9 Level of education
Responses given by the public and semi government sector employees on their highest education qualification at the time of the census were grouped as given in Table 3.10. The majority (35%) were GCE (A/L) qualified while one in every four employees has a degree or a higher qualification. Of a little more than 1.1 million employees, 190,000 (17.2%) have not passed the GCE (O/L) examination.
Table 3.10 - Distribution of employees by sector of employment, highest level of education
and sex 2016
Level of Education Total Male Female
No. % No. % No. %
All employees
Total 1,109,475 100.0 611,448 100.0 498,027 100.0
Below GCE(O/L) 190,498 17.2 166,559 27.2 23,939 4.8
Passed GCE(O/L) 223,041 20.1 167,306 27.4 55,735 11.2
Passed GCE(A/L) 388,787 35.0 158,884 26.0 229,903 46.2
Degree 195,438 17.6 68,696 11.2 126,742 25.4
Post Graduate Diploma 58,073 5.2 19,877 3.3 38,196 7.7
Post Graduate Degree 33,544 3.0 16,853 2.8 16,691 3.4
PhD 3,323 0.3 2,104 0.3 1,219 0.2
Not Specified 16,771 1.5 11,169 1.8 5,602 1.1
Central government employees
Total 724,669 100.0 463,788 100.0 260,881 100.0
Below GCE(O/L) 146,875 20.3 129,797 28.0 17,078 6.5
Passed GCE(O/L) 176,740 24.4 143,412 30.9 33,328 12.8
Passed GCE(A/L) 237,296 32.7 117,673 25.4 119,623 45.9
Degree 105,715 14.6 41,713 9.0 64,002 24.5
Post Graduate Diploma 18,513 2.6 7,894 1.7 10,619 4.1
Post Graduate Degree 23,320 3.2 12,122 2.6 11,198 4.3
PhD 3,154 0.4 1,995 0.4 1,159 0.4
Not Specified 13,056 1.8 9,182 2.0 3,874 1.5
Provincial council employees
Total 384,806 100.0 147,660 100.0 237,146 100.0
Below GCE(O/L) 43,623 11.3 36,762 24.9 6,861 2.9
Passed GCE(O/L) 46,301 12.0 23,894 16.2 22,407 9.4
Passed GCE(A/L) 151,491 39.4 41,211 27.9 110,280 46.5
Degree 89,723 23.3 26,983 18.3 62,740 26.5
Post Graduate Diploma 39,560 10.3 11,983 8.1 27,577 11.6
Post Graduate Degree 10,224 2.7 4,731 3.2 5,493 2.3
PhD 169 0.0 109 0.1 60 0.0
Not Specified 3,715 1.0 1,987 1.3 1,728 0.7
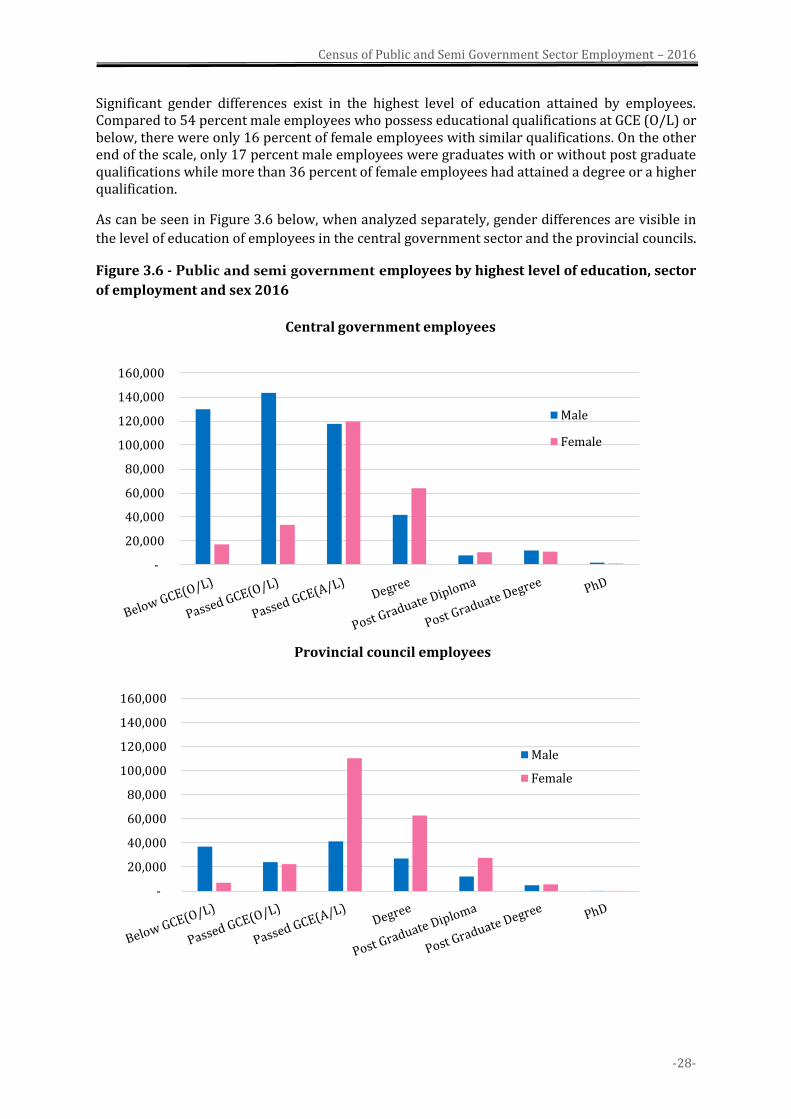
Census of Public and Semi Government Sector Employment – 2016
-28-
Significant gender differences exist in the highest level of education attained by employees. Compared to 54 percent male employees who possess educational qualifications at GCE (O/L) or below, there were only 16 percent of female employees with similar qualifications. On the other end of the scale, only 17 percent male employees were graduates with or without post graduate qualifications while more than 36 percent of female employees had attained a degree or a higher qualification.
As can be seen in Figure 3.6 below, when analyzed separately, gender differences are visible in
the level of education of employees in the central government sector and the provincial councils.
Figure 3.6 - Public and semi government employees by highest level of education, sector
of employment and sex 2016
-
20,000
40,000
60,000
80,000
100,000
120,000
140,000
160,000
Central government employees
Male
Female
-
20,000
40,000
60,000
80,000
100,000
120,000
140,000
160,000
Provincial council employees
Male
Female
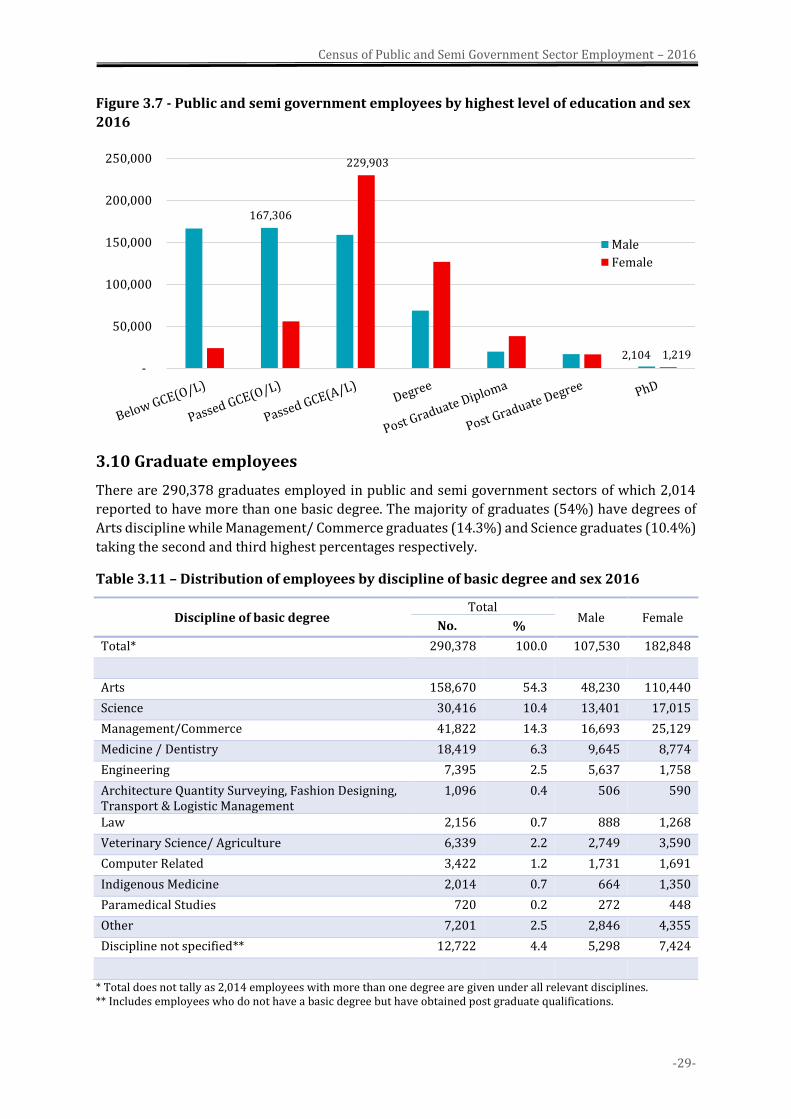
Census of Public and Semi Government Sector Employment – 2016
-29-
Figure 3.7 - Public and semi government employees by highest level of education and sex
2016
3.10 Graduate employees
There are 290,378 graduates employed in public and semi government sectors of which 2,014
reported to have more than one basic degree. The majority of graduates (54%) have degrees of
Arts discipline while Management/ Commerce graduates (14.3%) and Science graduates (10.4%)
taking the second and third highest percentages respectively.
Table 3.11 – Distribution of employees by discipline of basic degree and sex 2016
Discipline of basic degree Total
Male Female No. %
Total* 290,378 100.0 107,530 182,848
Arts 158,670 54.3 48,230 110,440
Science 30,416 10.4 13,401 17,015
Management/Commerce 41,822 14.3 16,693 25,129
Medicine / Dentistry 18,419 6.3 9,645 8,774
Engineering 7,395 2.5 5,637 1,758
Architecture Quantity Surveying, Fashion Designing, Transport & Logistic Management
1,096 0.4 506 590
Law 2,156 0.7 888 1,268
Veterinary Science/ Agriculture 6,339 2.2 2,749 3,590
Computer Related 3,422 1.2 1,731 1,691
Indigenous Medicine 2,014 0.7 664 1,350
Paramedical Studies 720 0.2 272 448
Other 7,201 2.5 2,846 4,355
Discipline not specified** 12,722 4.4 5,298 7,424
* Total does not tally as 2,014 employees with more than one degree are given under all relevant disciplines. ** Includes employees who do not have a basic degree but have obtained post graduate qualifications.
167,306
2,104
229,903
1,219 -
50,000
100,000
150,000
200,000
250,000
Male
Female
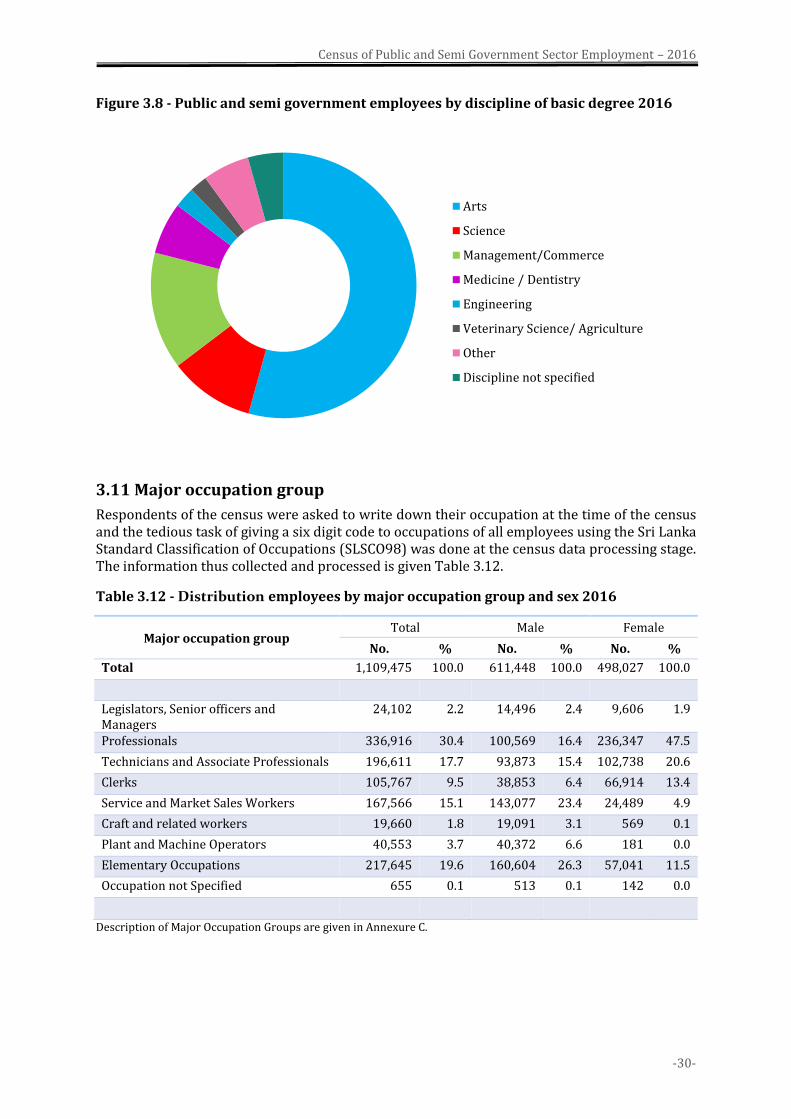
Census of Public and Semi Government Sector Employment – 2016
-30-
Figure 3.8 - Public and semi government employees by discipline of basic degree 2016
3.11 Major occupation group
Respondents of the census were asked to write down their occupation at the time of the census and the tedious task of giving a six digit code to occupations of all employees using the Sri Lanka Standard Classification of Occupations (SLSCO98) was done at the census data processing stage. The information thus collected and processed is given Table 3.12.
Table 3.12 - Distribution employees by major occupation group and sex 2016
Major occupation group Total Male Female
No. % No. % No. %
Total 1,109,475 100.0 611,448 100.0 498,027 100.0
Legislators, Senior officers and Managers
24,102 2.2 14,496 2.4 9,606 1.9
Professionals 336,916 30.4 100,569 16.4 236,347 47.5
Technicians and Associate Professionals 196,611 17.7 93,873 15.4 102,738 20.6
Clerks 105,767 9.5 38,853 6.4 66,914 13.4
Service and Market Sales Workers 167,566 15.1 143,077 23.4 24,489 4.9
Craft and related workers 19,660 1.8 19,091 3.1 569 0.1
Plant and Machine Operators 40,553 3.7 40,372 6.6 181 0.0
Elementary Occupations 217,645 19.6 160,604 26.3 57,041 11.5
Occupation not Specified 655 0.1 513 0.1 142 0.0
Description of Major Occupation Groups are given in Annexure C.
Arts
Science
Management/Commerce
Medicine / Dentistry
Engineering
Veterinary Science/ Agriculture
Other
Discipline not specified
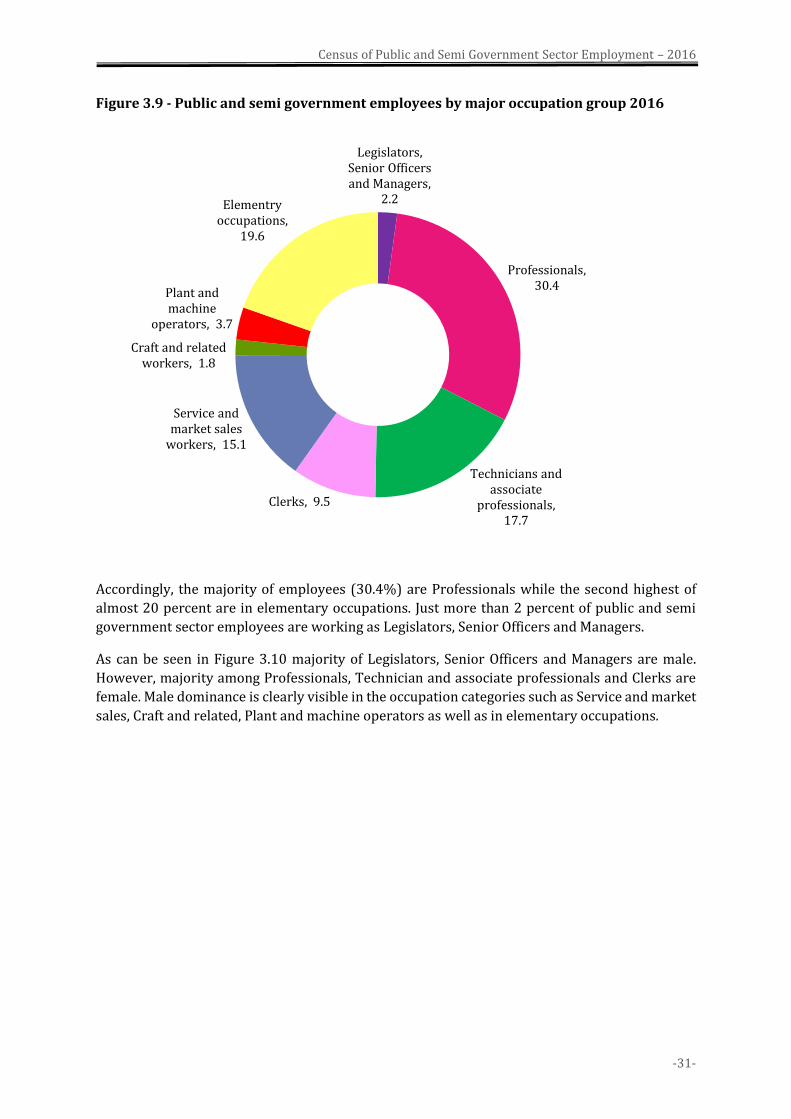
Census of Public and Semi Government Sector Employment – 2016
-31-
Figure 3.9 - Public and semi government employees by major occupation group 2016
Accordingly, the majority of employees (30.4%) are Professionals while the second highest of
almost 20 percent are in elementary occupations. Just more than 2 percent of public and semi
government sector employees are working as Legislators, Senior Officers and Managers.
As can be seen in Figure 3.10 majority of Legislators, Senior Officers and Managers are male.
However, majority among Professionals, Technician and associate professionals and Clerks are
female. Male dominance is clearly visible in the occupation categories such as Service and market
sales, Craft and related, Plant and machine operators as well as in elementary occupations.
Legislators, Senior Officers and Managers,
2.2
Professionals, 30.4
Technicians and associate
professionals, 17.7
Clerks, 9.5
Service and market sales
workers, 15.1
Craft and related workers, 1.8
Plant and machine
operators, 3.7
Elementry occupations,
19.6
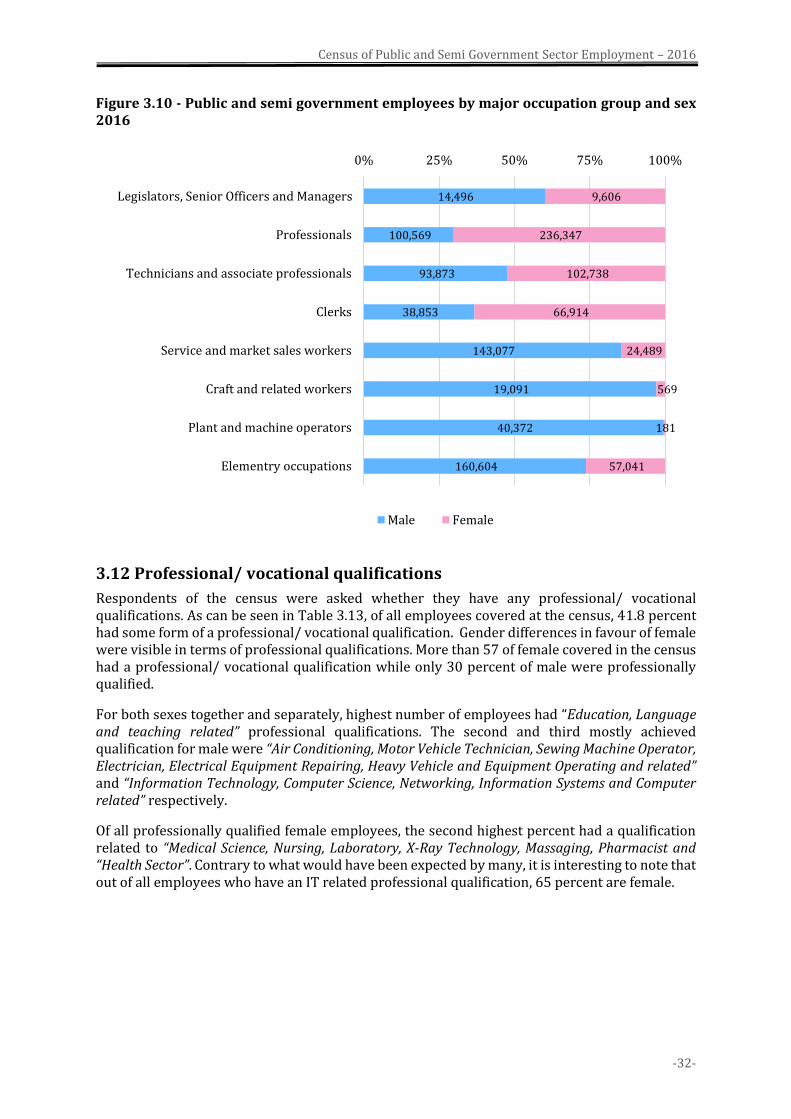
Census of Public and Semi Government Sector Employment – 2016
-32-
Figure 3.10 - Public and semi government employees by major occupation group and sex 2016
3.12 Professional/ vocational qualifications
Respondents of the census were asked whether they have any professional/ vocational qualifications. As can be seen in Table 3.13, of all employees covered at the census, 41.8 percent had some form of a professional/ vocational qualification. Gender differences in favour of female were visible in terms of professional qualifications. More than 57 of female covered in the census had a professional/ vocational qualification while only 30 percent of male were professionally qualified.
For both sexes together and separately, highest number of employees had “Education, Language and teaching related” professional qualifications. The second and third mostly achieved qualification for male were “Air Conditioning, Motor Vehicle Technician, Sewing Machine Operator, Electrician, Electrical Equipment Repairing, Heavy Vehicle and Equipment Operating and related” and “Information Technology, Computer Science, Networking, Information Systems and Computer related” respectively.
Of all professionally qualified female employees, the second highest percent had a qualification related to “Medical Science, Nursing, Laboratory, X-Ray Technology, Massaging, Pharmacist and “Health Sector”. Contrary to what would have been expected by many, it is interesting to note that out of all employees who have an IT related professional qualification, 65 percent are female.
14,496
100,569
93,873
38,853
143,077
19,091
40,372
160,604
9,606
236,347
102,738
66,914
24,489
569
181
57,041
0% 25% 50% 75% 100%
Legislators, Senior Officers and Managers
Professionals
Technicians and associate professionals
Clerks
Service and market sales workers
Craft and related workers
Plant and machine operators
Elementry occupations
Male Female
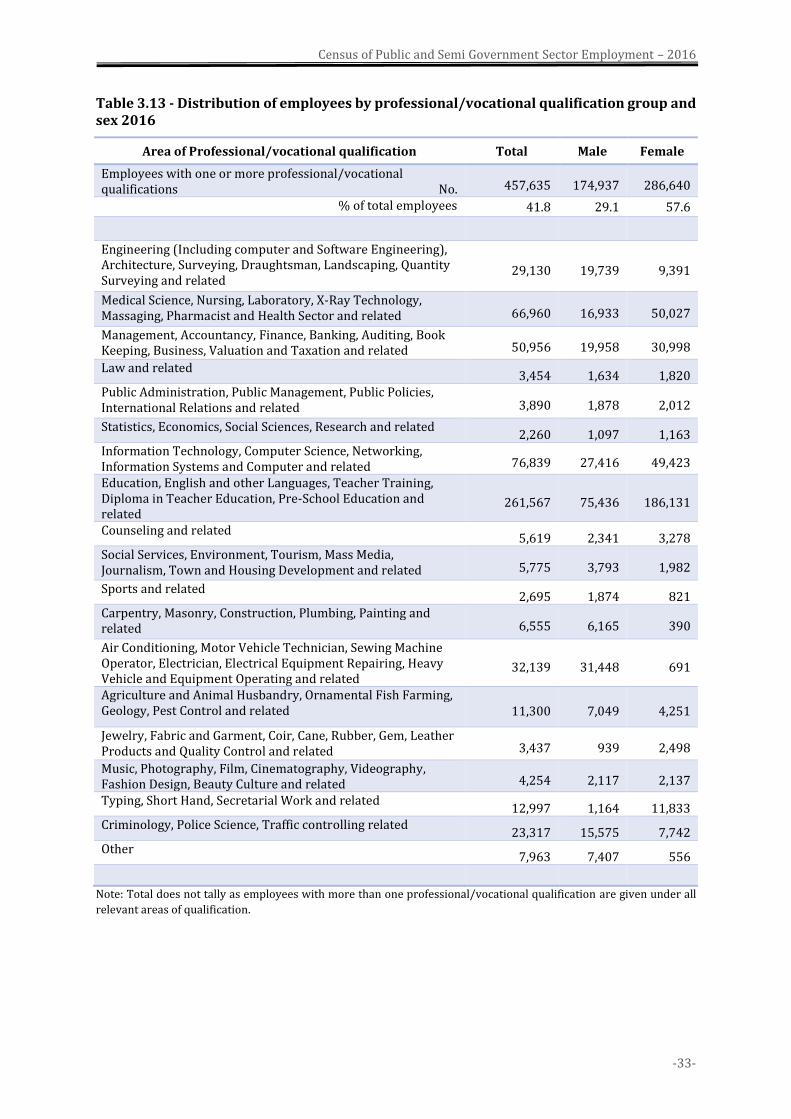
Census of Public and Semi Government Sector Employment – 2016
-33-
Table 3.13 - Distribution of employees by professional/vocational qualification group and sex 2016
Area of Professional/vocational qualification Total Male Female
Employees with one or more professional/vocational qualifications No. 457,635 174,937 286,640
% of total employees 41.8 29.1 57.6
Engineering (Including computer and Software Engineering), Architecture, Surveying, Draughtsman, Landscaping, Quantity Surveying and related
29,130 19,739 9,391
Medical Science, Nursing, Laboratory, X-Ray Technology, Massaging, Pharmacist and Health Sector and related 66,960 16,933 50,027
Management, Accountancy, Finance, Banking, Auditing, Book Keeping, Business, Valuation and Taxation and related 50,956 19,958 30,998
Law and related 3,454 1,634 1,820
Public Administration, Public Management, Public Policies, International Relations and related 3,890 1,878 2,012
Statistics, Economics, Social Sciences, Research and related 2,260 1,097 1,163
Information Technology, Computer Science, Networking, Information Systems and Computer and related 76,839 27,416 49,423
Education, English and other Languages, Teacher Training, Diploma in Teacher Education, Pre-School Education and related
261,567 75,436 186,131
Counseling and related 5,619 2,341 3,278
Social Services, Environment, Tourism, Mass Media, Journalism, Town and Housing Development and related 5,775 3,793 1,982
Sports and related 2,695 1,874 821
Carpentry, Masonry, Construction, Plumbing, Painting and related 6,555 6,165 390
Air Conditioning, Motor Vehicle Technician, Sewing Machine Operator, Electrician, Electrical Equipment Repairing, Heavy Vehicle and Equipment Operating and related
32,139 31,448 691
Agriculture and Animal Husbandry, Ornamental Fish Farming, Geology, Pest Control and related 11,300 7,049 4,251
Jewelry, Fabric and Garment, Coir, Cane, Rubber, Gem, Leather Products and Quality Control and related 3,437 939 2,498
Music, Photography, Film, Cinematography, Videography, Fashion Design, Beauty Culture and related 4,254 2,117 2,137
Typing, Short Hand, Secretarial Work and related 12,997 1,164 11,833
Criminology, Police Science, Traffic controlling related 23,317 15,575 7,742
Other 7,963 7,407 556
Note: Total does not tally as employees with more than one professional/vocational qualification are given under all
relevant areas of qualification.
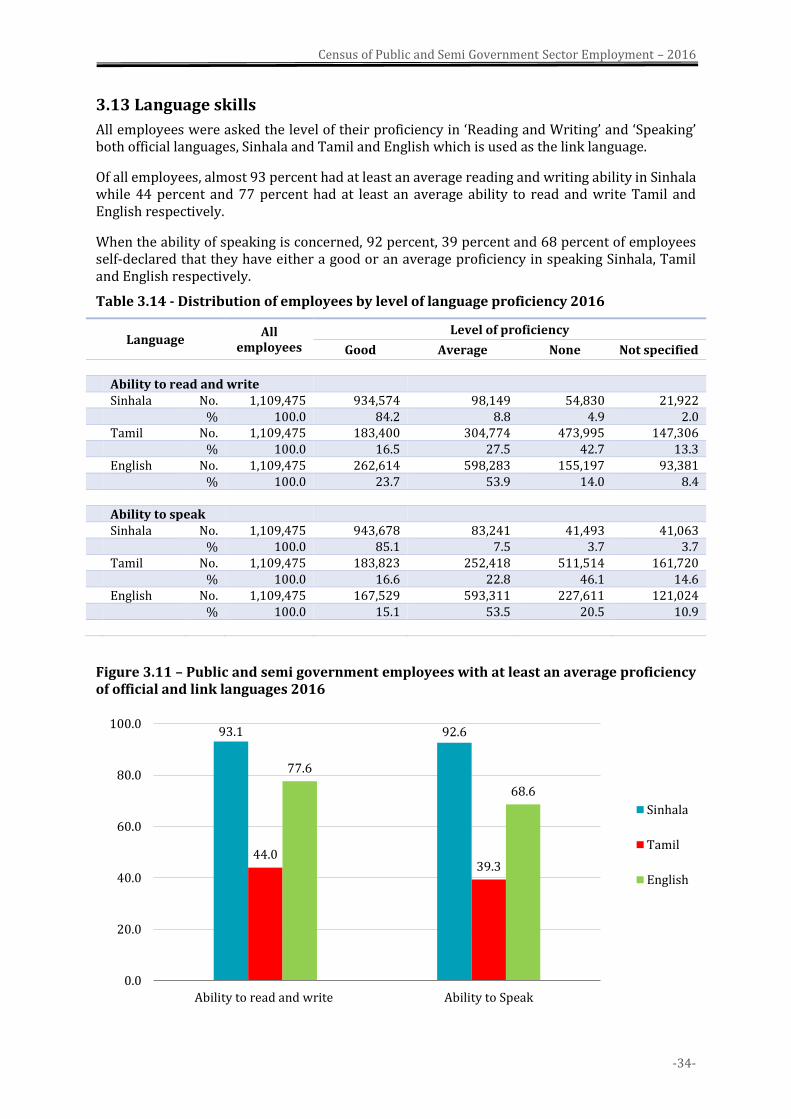
Census of Public and Semi Government Sector Employment – 2016
-34-
3.13 Language skills
All employees were asked the level of their proficiency in ‘Reading and Writing’ and ‘Speaking’ both official languages, Sinhala and Tamil and English which is used as the link language.
Of all employees, almost 93 percent had at least an average reading and writing ability in Sinhala while 44 percent and 77 percent had at least an average ability to read and write Tamil and English respectively.
When the ability of speaking is concerned, 92 percent, 39 percent and 68 percent of employees self-declared that they have either a good or an average proficiency in speaking Sinhala, Tamil and English respectively.
Table 3.14 - Distribution of employees by level of language proficiency 2016
Language All
employees
Level of proficiency
Good Average None Not specified
Ability to read and write Sinhala No. 1,109,475 934,574 98,149 54,830 21,922 % 100.0 84.2 8.8 4.9 2.0 Tamil No. 1,109,475 183,400 304,774 473,995 147,306 % 100.0 16.5 27.5 42.7 13.3 English No. 1,109,475 262,614 598,283 155,197 93,381 % 100.0 23.7 53.9 14.0 8.4 Ability to speak Sinhala No. 1,109,475 943,678 83,241 41,493 41,063 % 100.0 85.1 7.5 3.7 3.7 Tamil No. 1,109,475 183,823 252,418 511,514 161,720 % 100.0 16.6 22.8 46.1 14.6 English No. 1,109,475 167,529 593,311 227,611 121,024 % 100.0 15.1 53.5 20.5 10.9
Figure 3.11 – Public and semi government employees with at least an average proficiency of official and link languages 2016
93.1 92.6
44.039.3
77.6
68.6
0.0
20.0
40.0
60.0
80.0
100.0
Ability to read and write Ability to Speak
Sinhala
Tamil
English
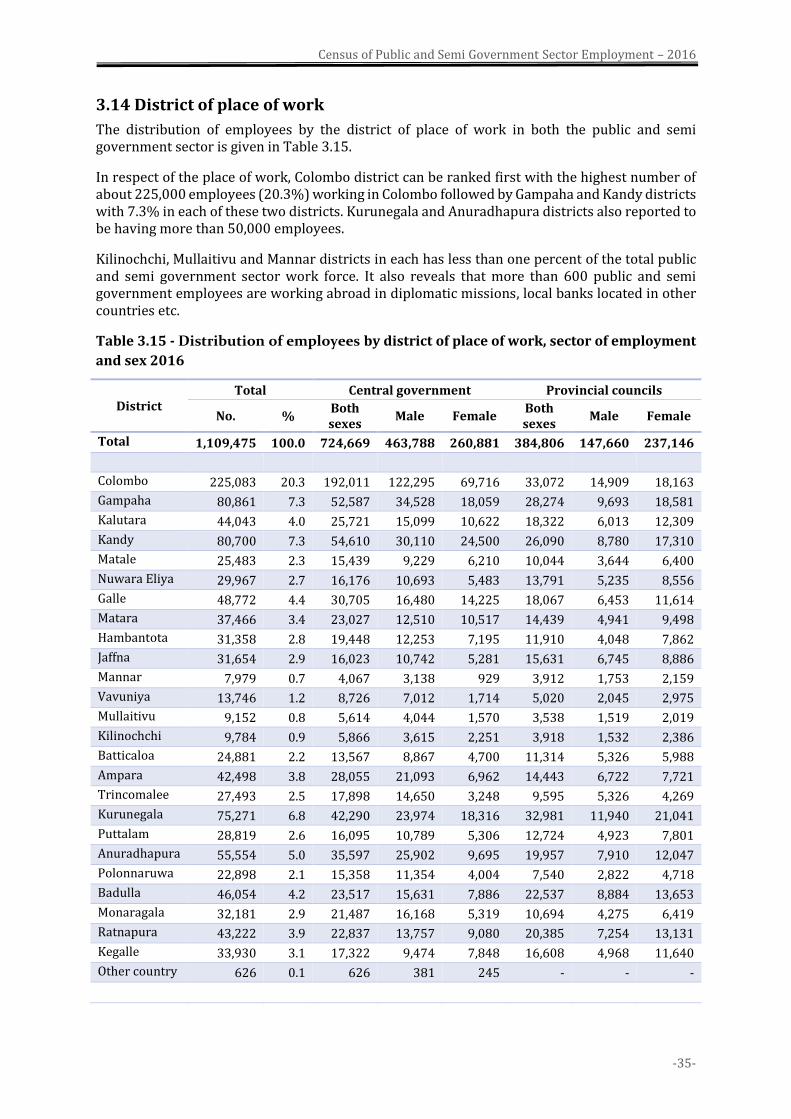
Census of Public and Semi Government Sector Employment – 2016
-35-
3.14 District of place of work
The distribution of employees by the district of place of work in both the public and semi government sector is given in Table 3.15.
In respect of the place of work, Colombo district can be ranked first with the highest number of about 225,000 employees (20.3%) working in Colombo followed by Gampaha and Kandy districts with 7.3% in each of these two districts. Kurunegala and Anuradhapura districts also reported to be having more than 50,000 employees.
Kilinochchi, Mullaitivu and Mannar districts in each has less than one percent of the total public and semi government sector work force. It also reveals that more than 600 public and semi government employees are working abroad in diplomatic missions, local banks located in other countries etc.
Table 3.15 - Distribution of employees by district of place of work, sector of employment
and sex 2016
District Total Central government Provincial councils
No. % Both sexes
Male Female Both sexes
Male Female
Total 1,109,475 100.0 724,669 463,788 260,881 384,806 147,660 237,146
Colombo 225,083 20.3 192,011 122,295 69,716 33,072 14,909 18,163
Gampaha 80,861 7.3 52,587 34,528 18,059 28,274 9,693 18,581
Kalutara 44,043 4.0 25,721 15,099 10,622 18,322 6,013 12,309
Kandy 80,700 7.3 54,610 30,110 24,500 26,090 8,780 17,310
Matale 25,483 2.3 15,439 9,229 6,210 10,044 3,644 6,400
Nuwara Eliya 29,967 2.7 16,176 10,693 5,483 13,791 5,235 8,556
Galle 48,772 4.4 30,705 16,480 14,225 18,067 6,453 11,614
Matara 37,466 3.4 23,027 12,510 10,517 14,439 4,941 9,498
Hambantota 31,358 2.8 19,448 12,253 7,195 11,910 4,048 7,862
Jaffna 31,654 2.9 16,023 10,742 5,281 15,631 6,745 8,886
Mannar 7,979 0.7 4,067 3,138 929 3,912 1,753 2,159
Vavuniya 13,746 1.2 8,726 7,012 1,714 5,020 2,045 2,975
Mullaitivu 9,152 0.8 5,614 4,044 1,570 3,538 1,519 2,019
Kilinochchi 9,784 0.9 5,866 3,615 2,251 3,918 1,532 2,386
Batticaloa 24,881 2.2 13,567 8,867 4,700 11,314 5,326 5,988
Ampara 42,498 3.8 28,055 21,093 6,962 14,443 6,722 7,721
Trincomalee 27,493 2.5 17,898 14,650 3,248 9,595 5,326 4,269
Kurunegala 75,271 6.8 42,290 23,974 18,316 32,981 11,940 21,041
Puttalam 28,819 2.6 16,095 10,789 5,306 12,724 4,923 7,801
Anuradhapura 55,554 5.0 35,597 25,902 9,695 19,957 7,910 12,047
Polonnaruwa 22,898 2.1 15,358 11,354 4,004 7,540 2,822 4,718
Badulla 46,054 4.2 23,517 15,631 7,886 22,537 8,884 13,653
Monaragala 32,181 2.9 21,487 16,168 5,319 10,694 4,275 6,419
Ratnapura 43,222 3.9 22,837 13,757 9,080 20,385 7,254 13,131
Kegalle 33,930 3.1 17,322 9,474 7,848 16,608 4,968 11,640
Other country 626 0.1 626 381 245 - - -
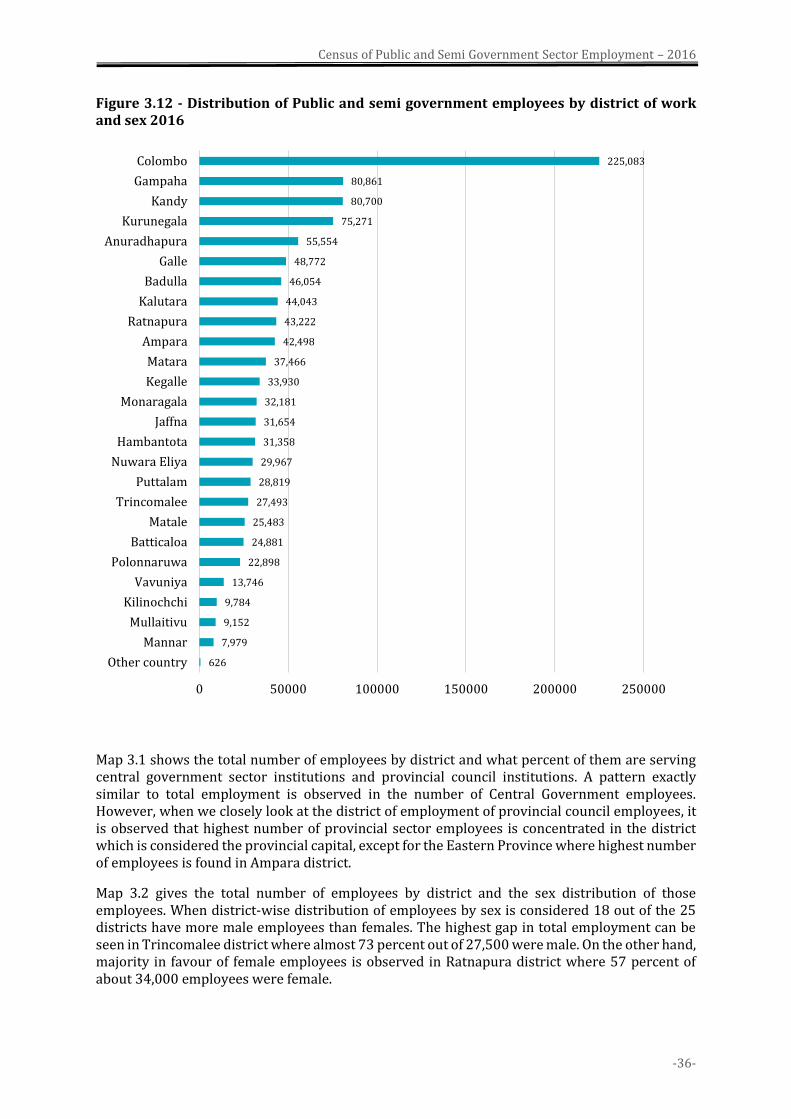
Census of Public and Semi Government Sector Employment – 2016
-36-
Figure 3.12 - Distribution of Public and semi government employees by district of work and sex 2016
Map 3.1 shows the total number of employees by district and what percent of them are serving central government sector institutions and provincial council institutions. A pattern exactly similar to total employment is observed in the number of Central Government employees. However, when we closely look at the district of employment of provincial council employees, it is observed that highest number of provincial sector employees is concentrated in the district which is considered the provincial capital, except for the Eastern Province where highest number of employees is found in Ampara district.
Map 3.2 gives the total number of employees by district and the sex distribution of those employees. When district-wise distribution of employees by sex is considered 18 out of the 25 districts have more male employees than females. The highest gap in total employment can be seen in Trincomalee district where almost 73 percent out of 27,500 were male. On the other hand, majority in favour of female employees is observed in Ratnapura district where 57 percent of about 34,000 employees were female.
626
7,979
9,152
9,784
13,746
22,898
24,881
25,483
27,493
28,819
29,967
31,358
31,654
32,181
33,930
37,466
42,498
43,222
44,043
46,054
48,772
55,554
75,271
80,700
80,861
225,083
0 50000 100000 150000 200000 250000
Other country
Mannar
Mullaitivu
Kilinochchi
Vavuniya
Polonnaruwa
Batticaloa
Matale
Trincomalee
Puttalam
Nuwara Eliya
Hambantota
Jaffna
Monaragala
Kegalle
Matara
Ampara
Ratnapura
Kalutara
Badulla
Galle
Anuradhapura
Kurunegala
Kandy
Gampaha
Colombo
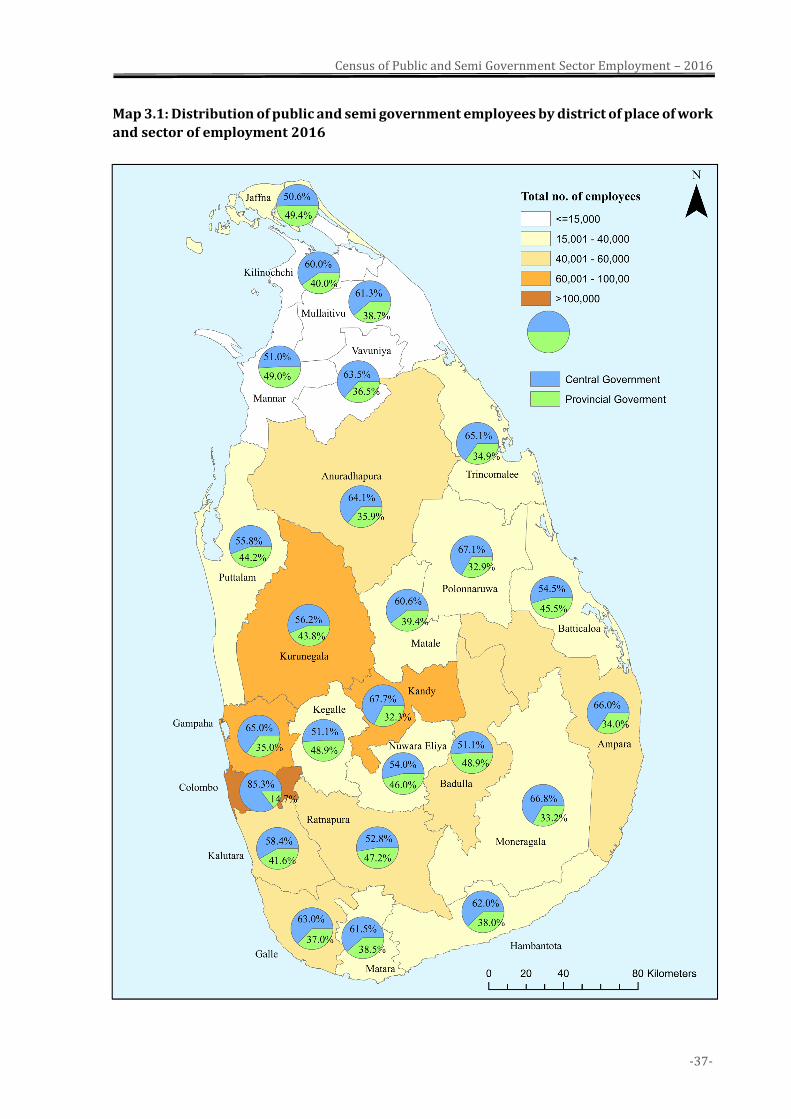
Census of Public and Semi Government Sector Employment – 2016
-37-
Map 3.1: Distribution of public and semi government employees by district of place of work
and sector of employment 2016
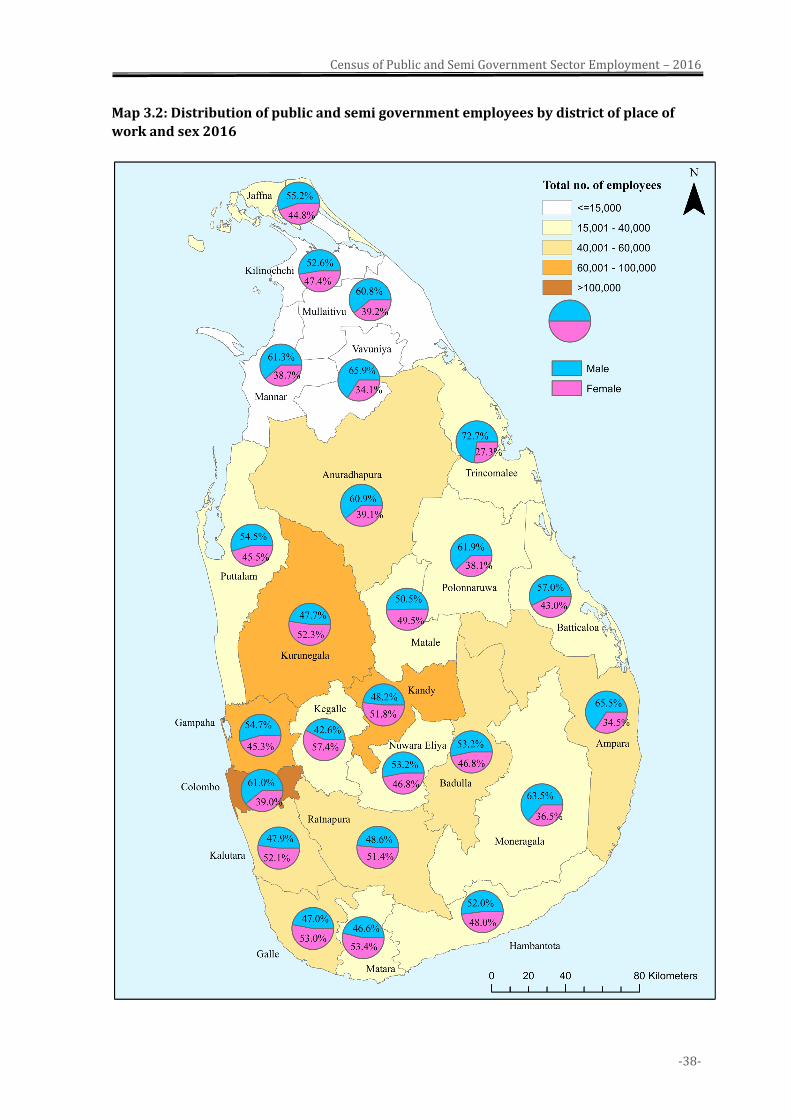
Census of Public and Semi Government Sector Employment – 2016
-38-
Map 3.2: Distribution of public and semi government employees by district of place of
work and sex 2016
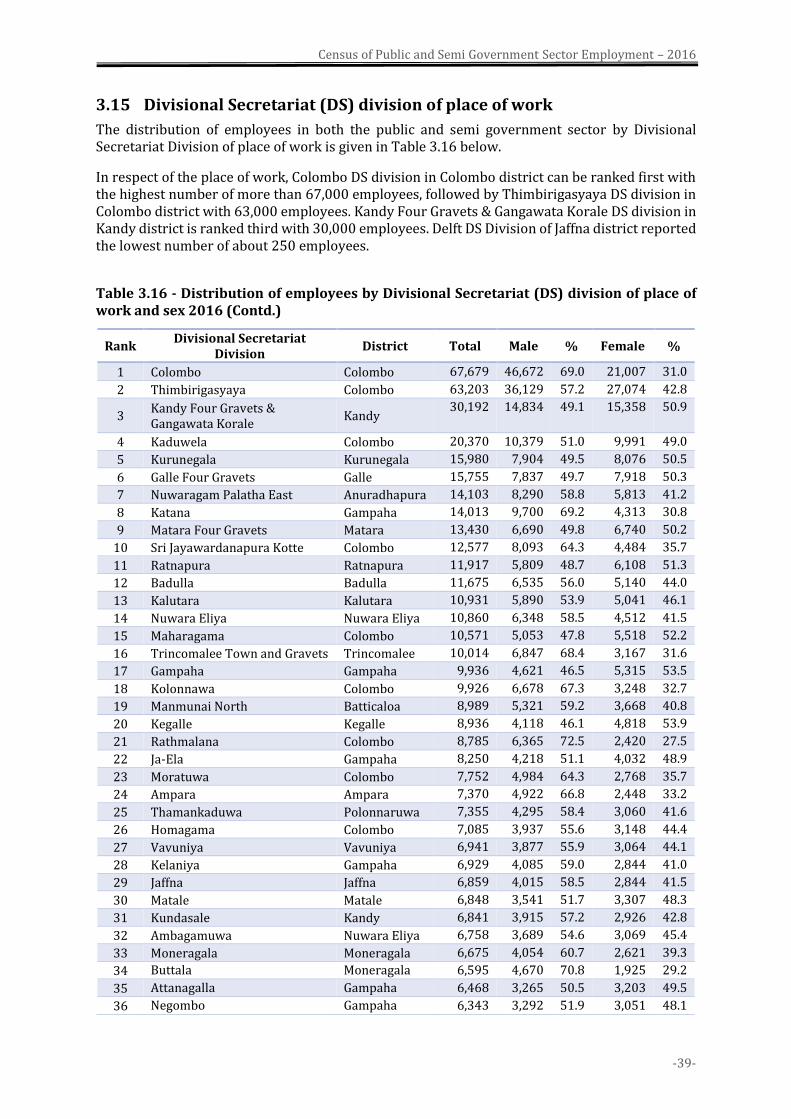
Census of Public and Semi Government Sector Employment – 2016
-39-
3.15 Divisional Secretariat (DS) division of place of work
The distribution of employees in both the public and semi government sector by Divisional Secretariat Division of place of work is given in Table 3.16 below.
In respect of the place of work, Colombo DS division in Colombo district can be ranked first with the highest number of more than 67,000 employees, followed by Thimbirigasyaya DS division in Colombo district with 63,000 employees. Kandy Four Gravets & Gangawata Korale DS division in Kandy district is ranked third with 30,000 employees. Delft DS Division of Jaffna district reported the lowest number of about 250 employees.
Table 3.16 - Distribution of employees by Divisional Secretariat (DS) division of place of work and sex 2016 (Contd.)
Rank Divisional Secretariat
Division District Total Male % Female %
1 Colombo Colombo 67,679 46,672 69.0 21,007 31.0
2 Thimbirigasyaya Colombo 63,203 36,129 57.2 27,074 42.8
3 Kandy Four Gravets & Gangawata Korale
Kandy 30,192 14,834 49.1 15,358 50.9
4 Kaduwela Colombo 20,370 10,379 51.0 9,991 49.0
5 Kurunegala Kurunegala 15,980 7,904 49.5 8,076 50.5
6 Galle Four Gravets Galle 15,755 7,837 49.7 7,918 50.3
7 Nuwaragam Palatha East Anuradhapura 14,103 8,290 58.8 5,813 41.2
8 Katana Gampaha 14,013 9,700 69.2 4,313 30.8
9 Matara Four Gravets Matara 13,430 6,690 49.8 6,740 50.2
10 Sri Jayawardanapura Kotte Colombo 12,577 8,093 64.3 4,484 35.7
11 Ratnapura Ratnapura 11,917 5,809 48.7 6,108 51.3
12 Badulla Badulla 11,675 6,535 56.0 5,140 44.0
13 Kalutara Kalutara 10,931 5,890 53.9 5,041 46.1
14 Nuwara Eliya Nuwara Eliya 10,860 6,348 58.5 4,512 41.5
15 Maharagama Colombo 10,571 5,053 47.8 5,518 52.2
16 Trincomalee Town and Gravets Trincomalee 10,014 6,847 68.4 3,167 31.6
17 Gampaha Gampaha 9,936 4,621 46.5 5,315 53.5
18 Kolonnawa Colombo 9,926 6,678 67.3 3,248 32.7
19 Manmunai North Batticaloa 8,989 5,321 59.2 3,668 40.8
20 Kegalle Kegalle 8,936 4,118 46.1 4,818 53.9
21 Rathmalana Colombo 8,785 6,365 72.5 2,420 27.5
22 Ja-Ela Gampaha 8,250 4,218 51.1 4,032 48.9
23 Moratuwa Colombo 7,752 4,984 64.3 2,768 35.7
24 Ampara Ampara 7,370 4,922 66.8 2,448 33.2
25 Thamankaduwa Polonnaruwa 7,355 4,295 58.4 3,060 41.6
26 Homagama Colombo 7,085 3,937 55.6 3,148 44.4
27 Vavuniya Vavuniya 6,941 3,877 55.9 3,064 44.1
28 Kelaniya Gampaha 6,929 4,085 59.0 2,844 41.0
29 Jaffna Jaffna 6,859 4,015 58.5 2,844 41.5
30 Matale Matale 6,848 3,541 51.7 3,307 48.3
31 Kundasale Kandy 6,841 3,915 57.2 2,926 42.8
32 Ambagamuwa Nuwara Eliya 6,758 3,689 54.6 3,069 45.4
33 Moneragala Moneragala 6,675 4,054 60.7 2,621 39.3
34 Buttala Moneragala 6,595 4,670 70.8 1,925 29.2
35 Attanagalla Gampaha 6,468 3,265 50.5 3,203 49.5
36 Negombo Gampaha 6,343 3,292 51.9 3,051 48.1

Census of Public and Semi Government Sector Employment – 2016
-40-
Rank Divisional Secretariat
Division District Total Male % Female %
37 Panadura Kalutara 6,334 2,940 46.4 3,394 53.6
38 Karachchi Kilinochchi 6,325 3,330 52.6 2,995 47.4
39 Dehiwala Colombo 6,211 3,399 54.7 2,812 45.3
40 Embilipitiya Ratnapura 6,001 3,359 56.0 2,642 44.0
41 Yatinuwara Kandy 5,891 2,863 48.6 3,028 51.4
42 Nallur Jaffna 5,759 3,501 60.8 2,258 39.2
43 Hambantota Hambantota 5,676 3,061 53.9 2,615 46.1
44 Kuliyapitiya West Kurunegala 5,629 2,757 49.0 2,872 51.0
45 Hanguranketha Nuwara Eliya 5,592 2,565 45.9 3,027 54.1
46 Hanwella Colombo 5,329 2,874 53.9 2,455 46.1
47 Tangalle Hambantota 5,188 2,851 55.0 2,337 45.0
48 Udapalatha Kandy 5,140 2,678 52.1 2,462 47.9
49 Horana Kalutara 5,104 2,293 44.9 2,811 55.1
50 Mahara Gampaha 4,914 2,864 58.3 2,050 41.7
51 Bandarawela Badulla 4,875 2,540 52.1 2,335 47.9
52 Kantale Trincomalee 4,808 3,713 77.2 1,095 22.8
53 Welimada Badulla 4,577 2,430 53.1 2,147 46.9
54 Biyagama Gampaha 4,572 2,896 63.3 1,676 36.7
55 Wattala Gampaha 4,508 2,600 57.7 1,908 42.3
56 Dambulla Matale 4,481 2,770 61.8 1,711 38.2
57 Haputale Badulla 4,480 2,874 64.2 1,606 35.8
58 Uhana Ampara 4,479 3,212 71.7 1,267 28.3
59 Puttalam Puttalam 4,449 2,672 60.1 1,777 39.9
60 Mawanella Kegalle 4,445 1,856 41.8 2,589 58.2
61 Beruwala Kalutara 4,340 2,081 47.9 2,259 52.1
62 Mannar Town Mannar 4,319 2,646 61.3 1,673 38.7
63 Kesbewa Colombo 4,240 2,067 48.8 2,173 51.3
64 Mahiyanganaya Badulla 4,221 2,542 60.2 1,679 39.8
65 Mirigama Gampaha 4,141 1,774 42.8 2,367 57.2
66 Pannala Kurunegala 4,071 1,914 47.0 2,157 53.0
67 Vavuniya South Vavuniya 4,018 3,256 81.0 762 19.0
68 Chilaw Puttalam 3,996 2,085 52.2 1,911 47.8
69 Hingurakgoda Polonnaruwa 3,892 2,511 64.5 1,381 35.5
70 Mathugama Kalutara 3,880 1,936 49.9 1,944 50.1
71 Dimbulagala Polonnaruwa 3,765 2,429 64.5 1,336 35.5
72 Warakapola Kegalle 3,748 1,444 38.5 2,304 61.5
73 Ambalantota Hambantota 3,735 2,202 59.0 1,533 41.0
74 Minuwangoda Gampaha 3,724 1,515 40.7 2,209 59.3
75 Nuwaragam Palatha Central Anuradhapura 3,684 2,378 64.5 1,306 35.5
76 Dompe Gampaha 3,642 1,690 46.4 1,952 53.6
77 Maho Kurunegala 3,508 2,004 57.1 1,504 42.9
78 Kothmale Nuwara Eliya 3,447 1,604 46.5 1,843 53.5
79 Balangoda Ratnapura 3,430 1,813 52.9 1,617 47.1
80 Divulapitiya Gampaha 3,421 1,701 49.7 1,720 50.3
81 Pasbage Korale Kandy 3,420 1,808 52.9 1,612 47.1
82 Rambukkana Kegalle 3,419 1,624 47.5 1,795 52.5
83 Wariyapola Kurunegala 3,365 1,716 51.0 1,649 49.0
84 Walapane Nuwara Eliya 3,310 1,722 52.0 1,588 48.0
85 Medawachchiya Anuradhapura 3,224 2,212 68.6 1,012 31.4
86 Udunuwara Kandy 3,210 1,397 43.5 1,813 56.5
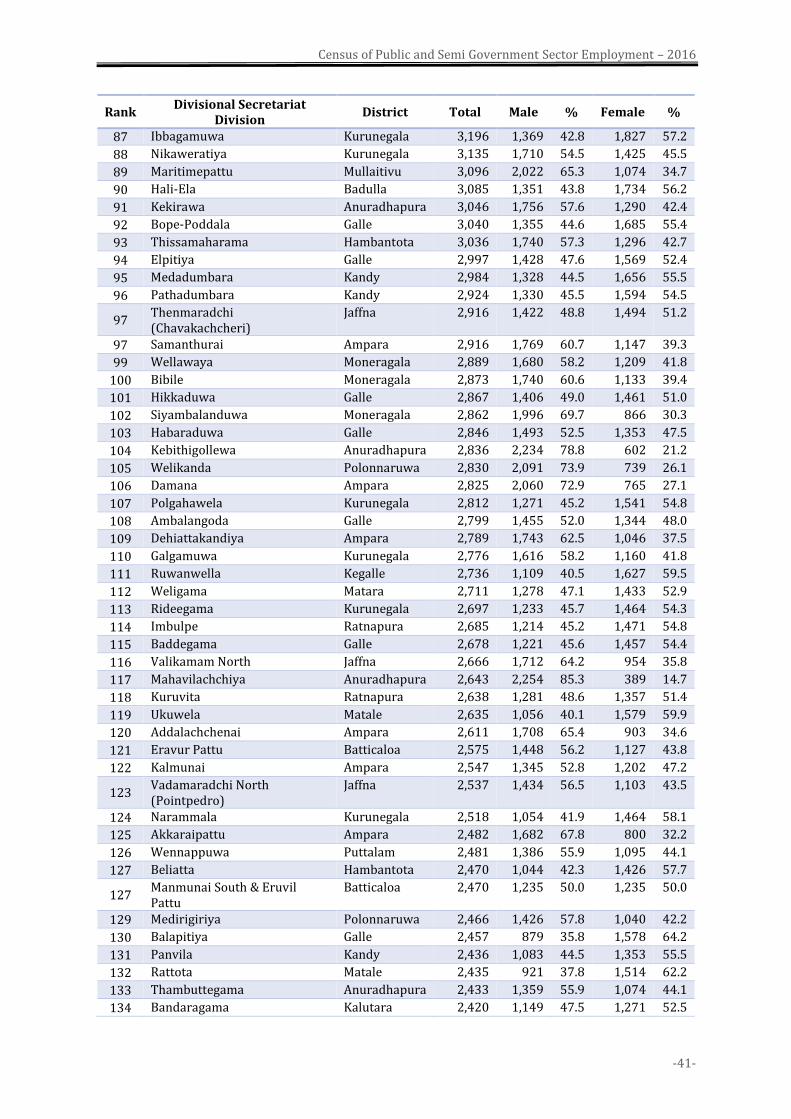
Census of Public and Semi Government Sector Employment – 2016
-41-
Rank Divisional Secretariat
Division District Total Male % Female %
87 Ibbagamuwa Kurunegala 3,196 1,369 42.8 1,827 57.2
88 Nikaweratiya Kurunegala 3,135 1,710 54.5 1,425 45.5
89 Maritimepattu Mullaitivu 3,096 2,022 65.3 1,074 34.7
90 Hali-Ela Badulla 3,085 1,351 43.8 1,734 56.2
91 Kekirawa Anuradhapura 3,046 1,756 57.6 1,290 42.4
92 Bope-Poddala Galle 3,040 1,355 44.6 1,685 55.4
93 Thissamaharama Hambantota 3,036 1,740 57.3 1,296 42.7
94 Elpitiya Galle 2,997 1,428 47.6 1,569 52.4
95 Medadumbara Kandy 2,984 1,328 44.5 1,656 55.5
96 Pathadumbara Kandy 2,924 1,330 45.5 1,594 54.5
97 Thenmaradchi (Chavakachcheri)
Jaffna 2,916 1,422 48.8 1,494 51.2
97 Samanthurai Ampara 2,916 1,769 60.7 1,147 39.3
99 Wellawaya Moneragala 2,889 1,680 58.2 1,209 41.8
100 Bibile Moneragala 2,873 1,740 60.6 1,133 39.4
101 Hikkaduwa Galle 2,867 1,406 49.0 1,461 51.0
102 Siyambalanduwa Moneragala 2,862 1,996 69.7 866 30.3
103 Habaraduwa Galle 2,846 1,493 52.5 1,353 47.5
104 Kebithigollewa Anuradhapura 2,836 2,234 78.8 602 21.2
105 Welikanda Polonnaruwa 2,830 2,091 73.9 739 26.1
106 Damana Ampara 2,825 2,060 72.9 765 27.1
107 Polgahawela Kurunegala 2,812 1,271 45.2 1,541 54.8
108 Ambalangoda Galle 2,799 1,455 52.0 1,344 48.0
109 Dehiattakandiya Ampara 2,789 1,743 62.5 1,046 37.5
110 Galgamuwa Kurunegala 2,776 1,616 58.2 1,160 41.8
111 Ruwanwella Kegalle 2,736 1,109 40.5 1,627 59.5
112 Weligama Matara 2,711 1,278 47.1 1,433 52.9
113 Rideegama Kurunegala 2,697 1,233 45.7 1,464 54.3
114 Imbulpe Ratnapura 2,685 1,214 45.2 1,471 54.8
115 Baddegama Galle 2,678 1,221 45.6 1,457 54.4
116 Valikamam North Jaffna 2,666 1,712 64.2 954 35.8
117 Mahavilachchiya Anuradhapura 2,643 2,254 85.3 389 14.7
118 Kuruvita Ratnapura 2,638 1,281 48.6 1,357 51.4
119 Ukuwela Matale 2,635 1,056 40.1 1,579 59.9
120 Addalachchenai Ampara 2,611 1,708 65.4 903 34.6
121 Eravur Pattu Batticaloa 2,575 1,448 56.2 1,127 43.8
122 Kalmunai Ampara 2,547 1,345 52.8 1,202 47.2
123 Vadamaradchi North (Pointpedro)
Jaffna 2,537 1,434 56.5 1,103 43.5
124 Narammala Kurunegala 2,518 1,054 41.9 1,464 58.1
125 Akkaraipattu Ampara 2,482 1,682 67.8 800 32.2
126 Wennappuwa Puttalam 2,481 1,386 55.9 1,095 44.1
127 Beliatta Hambantota 2,470 1,044 42.3 1,426 57.7
127 Manmunai South & Eruvil Pattu
Batticaloa 2,470 1,235 50.0 1,235 50.0
129 Medirigiriya Polonnaruwa 2,466 1,426 57.8 1,040 42.2
130 Balapitiya Galle 2,457 879 35.8 1,578 64.2
131 Panvila Kandy 2,436 1,083 44.5 1,353 55.5
132 Rattota Matale 2,435 921 37.8 1,514 62.2
133 Thambuttegama Anuradhapura 2,433 1,359 55.9 1,074 44.1
134 Bandaragama Kalutara 2,420 1,149 47.5 1,271 52.5
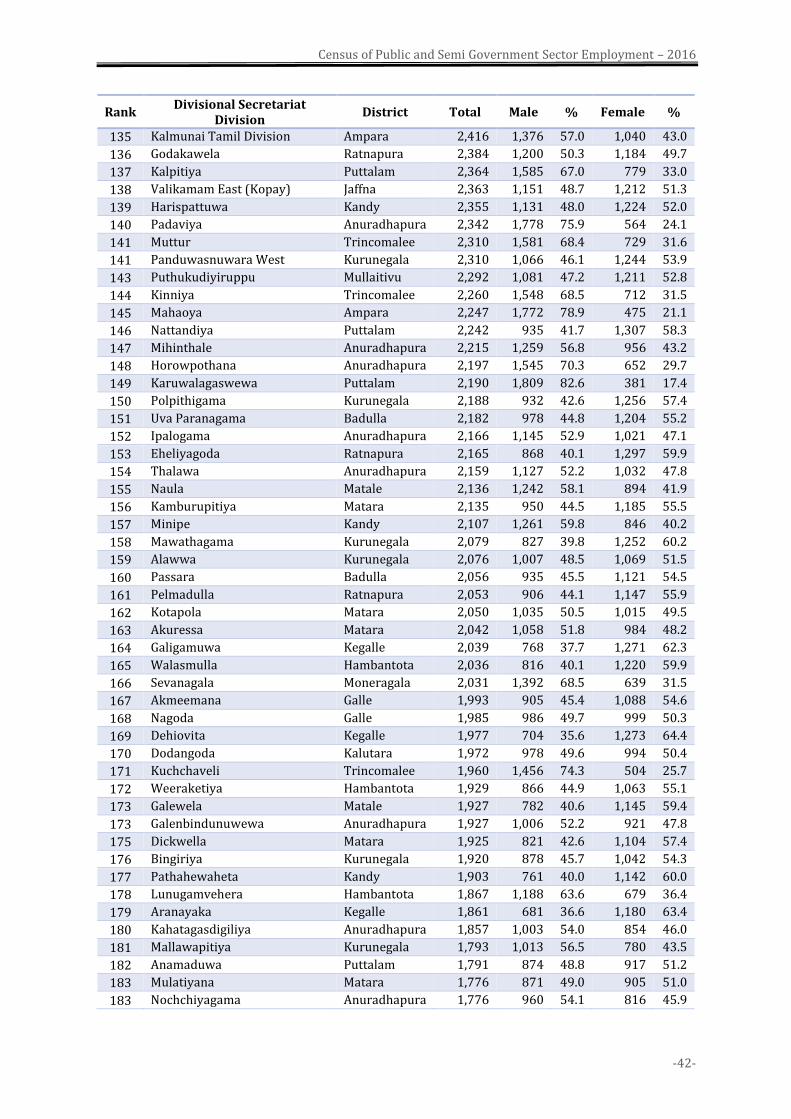
Census of Public and Semi Government Sector Employment – 2016
-42-
Rank Divisional Secretariat
Division District Total Male % Female %
135 Kalmunai Tamil Division Ampara 2,416 1,376 57.0 1,040 43.0
136 Godakawela Ratnapura 2,384 1,200 50.3 1,184 49.7
137 Kalpitiya Puttalam 2,364 1,585 67.0 779 33.0
138 Valikamam East (Kopay) Jaffna 2,363 1,151 48.7 1,212 51.3
139 Harispattuwa Kandy 2,355 1,131 48.0 1,224 52.0
140 Padaviya Anuradhapura 2,342 1,778 75.9 564 24.1
141 Muttur Trincomalee 2,310 1,581 68.4 729 31.6
141 Panduwasnuwara West Kurunegala 2,310 1,066 46.1 1,244 53.9
143 Puthukudiyiruppu Mullaitivu 2,292 1,081 47.2 1,211 52.8
144 Kinniya Trincomalee 2,260 1,548 68.5 712 31.5
145 Mahaoya Ampara 2,247 1,772 78.9 475 21.1
146 Nattandiya Puttalam 2,242 935 41.7 1,307 58.3
147 Mihinthale Anuradhapura 2,215 1,259 56.8 956 43.2
148 Horowpothana Anuradhapura 2,197 1,545 70.3 652 29.7
149 Karuwalagaswewa Puttalam 2,190 1,809 82.6 381 17.4
150 Polpithigama Kurunegala 2,188 932 42.6 1,256 57.4
151 Uva Paranagama Badulla 2,182 978 44.8 1,204 55.2
152 Ipalogama Anuradhapura 2,166 1,145 52.9 1,021 47.1
153 Eheliyagoda Ratnapura 2,165 868 40.1 1,297 59.9
154 Thalawa Anuradhapura 2,159 1,127 52.2 1,032 47.8
155 Naula Matale 2,136 1,242 58.1 894 41.9
156 Kamburupitiya Matara 2,135 950 44.5 1,185 55.5
157 Minipe Kandy 2,107 1,261 59.8 846 40.2
158 Mawathagama Kurunegala 2,079 827 39.8 1,252 60.2
159 Alawwa Kurunegala 2,076 1,007 48.5 1,069 51.5
160 Passara Badulla 2,056 935 45.5 1,121 54.5
161 Pelmadulla Ratnapura 2,053 906 44.1 1,147 55.9
162 Kotapola Matara 2,050 1,035 50.5 1,015 49.5
163 Akuressa Matara 2,042 1,058 51.8 984 48.2
164 Galigamuwa Kegalle 2,039 768 37.7 1,271 62.3
165 Walasmulla Hambantota 2,036 816 40.1 1,220 59.9
166 Sevanagala Moneragala 2,031 1,392 68.5 639 31.5
167 Akmeemana Galle 1,993 905 45.4 1,088 54.6
168 Nagoda Galle 1,985 986 49.7 999 50.3
169 Dehiovita Kegalle 1,977 704 35.6 1,273 64.4
170 Dodangoda Kalutara 1,972 978 49.6 994 50.4
171 Kuchchaveli Trincomalee 1,960 1,456 74.3 504 25.7
172 Weeraketiya Hambantota 1,929 866 44.9 1,063 55.1
173 Galewela Matale 1,927 782 40.6 1,145 59.4
173 Galenbindunuwewa Anuradhapura 1,927 1,006 52.2 921 47.8
175 Dickwella Matara 1,925 821 42.6 1,104 57.4
176 Bingiriya Kurunegala 1,920 878 45.7 1,042 54.3
177 Pathahewaheta Kandy 1,903 761 40.0 1,142 60.0
178 Lunugamvehera Hambantota 1,867 1,188 63.6 679 36.4
179 Aranayaka Kegalle 1,861 681 36.6 1,180 63.4
180 Kahatagasdigiliya Anuradhapura 1,857 1,003 54.0 854 46.0
181 Mallawapitiya Kurunegala 1,793 1,013 56.5 780 43.5
182 Anamaduwa Puttalam 1,791 874 48.8 917 51.2
183 Mulatiyana Matara 1,776 871 49.0 905 51.0
183 Nochchiyagama Anuradhapura 1,776 960 54.1 816 45.9
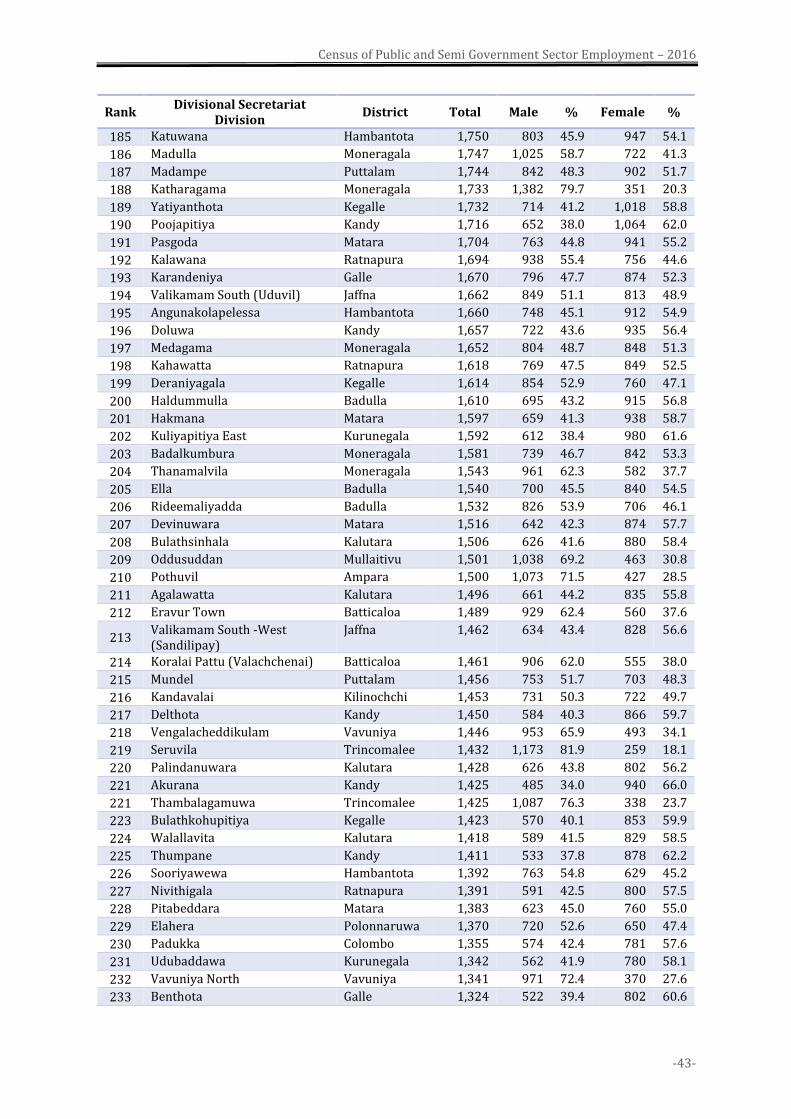
Census of Public and Semi Government Sector Employment – 2016
-43-
Rank Divisional Secretariat
Division District Total Male % Female %
185 Katuwana Hambantota 1,750 803 45.9 947 54.1
186 Madulla Moneragala 1,747 1,025 58.7 722 41.3
187 Madampe Puttalam 1,744 842 48.3 902 51.7
188 Katharagama Moneragala 1,733 1,382 79.7 351 20.3
189 Yatiyanthota Kegalle 1,732 714 41.2 1,018 58.8
190 Poojapitiya Kandy 1,716 652 38.0 1,064 62.0
191 Pasgoda Matara 1,704 763 44.8 941 55.2
192 Kalawana Ratnapura 1,694 938 55.4 756 44.6
193 Karandeniya Galle 1,670 796 47.7 874 52.3
194 Valikamam South (Uduvil) Jaffna 1,662 849 51.1 813 48.9
195 Angunakolapelessa Hambantota 1,660 748 45.1 912 54.9
196 Doluwa Kandy 1,657 722 43.6 935 56.4
197 Medagama Moneragala 1,652 804 48.7 848 51.3
198 Kahawatta Ratnapura 1,618 769 47.5 849 52.5
199 Deraniyagala Kegalle 1,614 854 52.9 760 47.1
200 Haldummulla Badulla 1,610 695 43.2 915 56.8
201 Hakmana Matara 1,597 659 41.3 938 58.7
202 Kuliyapitiya East Kurunegala 1,592 612 38.4 980 61.6
203 Badalkumbura Moneragala 1,581 739 46.7 842 53.3
204 Thanamalvila Moneragala 1,543 961 62.3 582 37.7
205 Ella Badulla 1,540 700 45.5 840 54.5
206 Rideemaliyadda Badulla 1,532 826 53.9 706 46.1
207 Devinuwara Matara 1,516 642 42.3 874 57.7
208 Bulathsinhala Kalutara 1,506 626 41.6 880 58.4
209 Oddusuddan Mullaitivu 1,501 1,038 69.2 463 30.8
210 Pothuvil Ampara 1,500 1,073 71.5 427 28.5
211 Agalawatta Kalutara 1,496 661 44.2 835 55.8
212 Eravur Town Batticaloa 1,489 929 62.4 560 37.6
213 Valikamam South -West (Sandilipay)
Jaffna 1,462 634 43.4 828 56.6
214 Koralai Pattu (Valachchenai) Batticaloa 1,461 906 62.0 555 38.0
215 Mundel Puttalam 1,456 753 51.7 703 48.3
216 Kandavalai Kilinochchi 1,453 731 50.3 722 49.7
217 Delthota Kandy 1,450 584 40.3 866 59.7
218 Vengalacheddikulam Vavuniya 1,446 953 65.9 493 34.1
219 Seruvila Trincomalee 1,432 1,173 81.9 259 18.1
220 Palindanuwara Kalutara 1,428 626 43.8 802 56.2
221 Akurana Kandy 1,425 485 34.0 940 66.0
221 Thambalagamuwa Trincomalee 1,425 1,087 76.3 338 23.7
223 Bulathkohupitiya Kegalle 1,423 570 40.1 853 59.9
224 Walallavita Kalutara 1,418 589 41.5 829 58.5
225 Thumpane Kandy 1,411 533 37.8 878 62.2
226 Sooriyawewa Hambantota 1,392 763 54.8 629 45.2
227 Nivithigala Ratnapura 1,391 591 42.5 800 57.5
228 Pitabeddara Matara 1,383 623 45.0 760 55.0
229 Elahera Polonnaruwa 1,370 720 52.6 650 47.4
230 Padukka Colombo 1,355 574 42.4 781 57.6
231 Udubaddawa Kurunegala 1,342 562 41.9 780 58.1
232 Vavuniya North Vavuniya 1,341 971 72.4 370 27.6
233 Benthota Galle 1,324 522 39.4 802 60.6
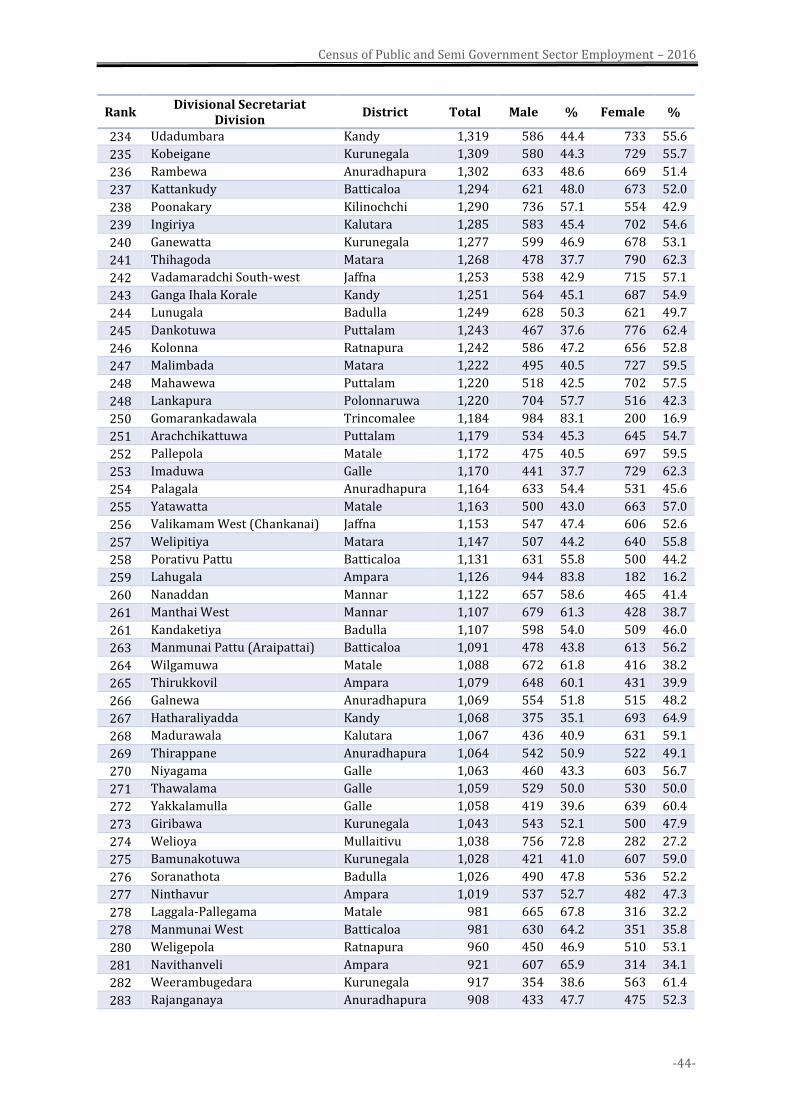
Census of Public and Semi Government Sector Employment – 2016
-44-
Rank Divisional Secretariat
Division District Total Male % Female %
234 Udadumbara Kandy 1,319 586 44.4 733 55.6
235 Kobeigane Kurunegala 1,309 580 44.3 729 55.7
236 Rambewa Anuradhapura 1,302 633 48.6 669 51.4
237 Kattankudy Batticaloa 1,294 621 48.0 673 52.0
238 Poonakary Kilinochchi 1,290 736 57.1 554 42.9
239 Ingiriya Kalutara 1,285 583 45.4 702 54.6
240 Ganewatta Kurunegala 1,277 599 46.9 678 53.1
241 Thihagoda Matara 1,268 478 37.7 790 62.3
242 Vadamaradchi South-west Jaffna 1,253 538 42.9 715 57.1
243 Ganga Ihala Korale Kandy 1,251 564 45.1 687 54.9
244 Lunugala Badulla 1,249 628 50.3 621 49.7
245 Dankotuwa Puttalam 1,243 467 37.6 776 62.4
246 Kolonna Ratnapura 1,242 586 47.2 656 52.8
247 Malimbada Matara 1,222 495 40.5 727 59.5
248 Mahawewa Puttalam 1,220 518 42.5 702 57.5
248 Lankapura Polonnaruwa 1,220 704 57.7 516 42.3
250 Gomarankadawala Trincomalee 1,184 984 83.1 200 16.9
251 Arachchikattuwa Puttalam 1,179 534 45.3 645 54.7
252 Pallepola Matale 1,172 475 40.5 697 59.5
253 Imaduwa Galle 1,170 441 37.7 729 62.3
254 Palagala Anuradhapura 1,164 633 54.4 531 45.6
255 Yatawatta Matale 1,163 500 43.0 663 57.0
256 Valikamam West (Chankanai) Jaffna 1,153 547 47.4 606 52.6
257 Welipitiya Matara 1,147 507 44.2 640 55.8
258 Porativu Pattu Batticaloa 1,131 631 55.8 500 44.2
259 Lahugala Ampara 1,126 944 83.8 182 16.2
260 Nanaddan Mannar 1,122 657 58.6 465 41.4
261 Manthai West Mannar 1,107 679 61.3 428 38.7
261 Kandaketiya Badulla 1,107 598 54.0 509 46.0
263 Manmunai Pattu (Araipattai) Batticaloa 1,091 478 43.8 613 56.2
264 Wilgamuwa Matale 1,088 672 61.8 416 38.2
265 Thirukkovil Ampara 1,079 648 60.1 431 39.9
266 Galnewa Anuradhapura 1,069 554 51.8 515 48.2
267 Hatharaliyadda Kandy 1,068 375 35.1 693 64.9
268 Madurawala Kalutara 1,067 436 40.9 631 59.1
269 Thirappane Anuradhapura 1,064 542 50.9 522 49.1
270 Niyagama Galle 1,063 460 43.3 603 56.7
271 Thawalama Galle 1,059 529 50.0 530 50.0
272 Yakkalamulla Galle 1,058 419 39.6 639 60.4
273 Giribawa Kurunegala 1,043 543 52.1 500 47.9
274 Welioya Mullaitivu 1,038 756 72.8 282 27.2
275 Bamunakotuwa Kurunegala 1,028 421 41.0 607 59.0
276 Soranathota Badulla 1,026 490 47.8 536 52.2
277 Ninthavur Ampara 1,019 537 52.7 482 47.3
278 Laggala-Pallegama Matale 981 665 67.8 316 32.2
278 Manmunai West Batticaloa 981 630 64.2 351 35.8
280 Weligepola Ratnapura 960 450 46.9 510 53.1
281 Navithanveli Ampara 921 607 65.9 314 34.1
282 Weerambugedara Kurunegala 917 354 38.6 563 61.4
283 Rajanganaya Anuradhapura 908 433 47.7 475 52.3
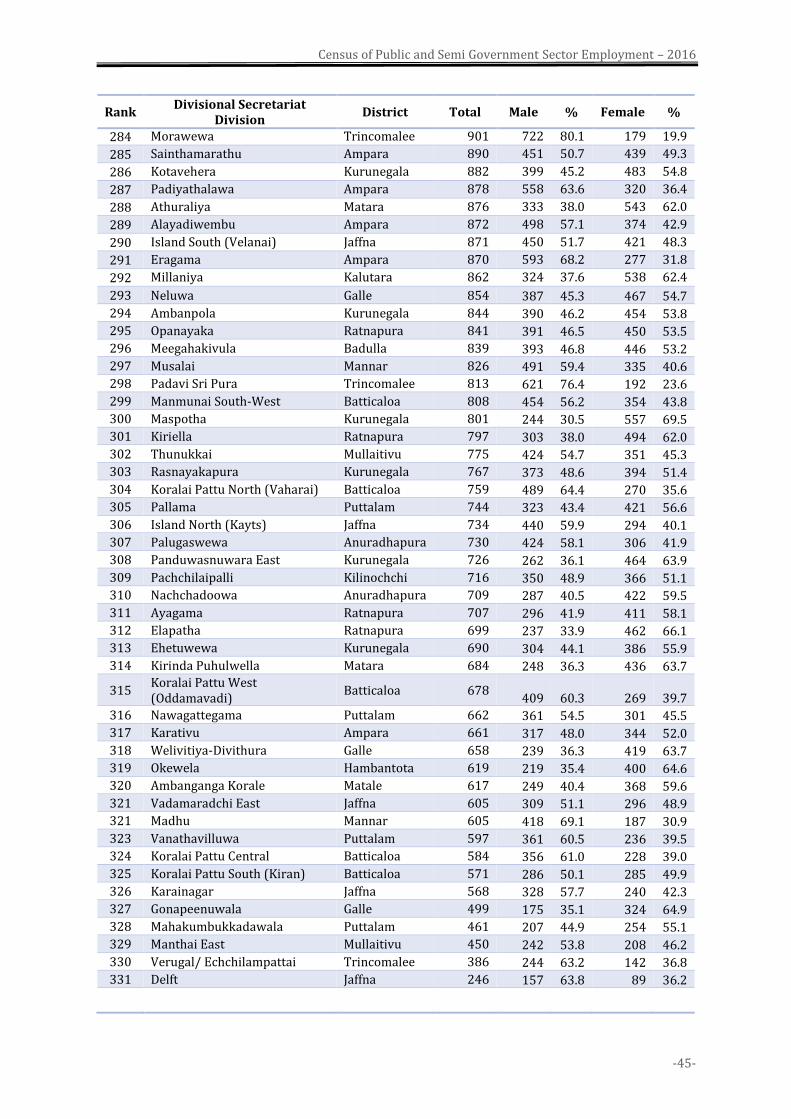
Census of Public and Semi Government Sector Employment – 2016
-45-
Rank Divisional Secretariat
Division District Total Male % Female %
284 Morawewa Trincomalee 901 722 80.1 179 19.9
285 Sainthamarathu Ampara 890 451 50.7 439 49.3
286 Kotavehera Kurunegala 882 399 45.2 483 54.8
287 Padiyathalawa Ampara 878 558 63.6 320 36.4
288 Athuraliya Matara 876 333 38.0 543 62.0
289 Alayadiwembu Ampara 872 498 57.1 374 42.9
290 Island South (Velanai) Jaffna 871 450 51.7 421 48.3
291 Eragama Ampara 870 593 68.2 277 31.8
292 Millaniya Kalutara 862 324 37.6 538 62.4
293 Neluwa Galle 854 387 45.3 467 54.7
294 Ambanpola Kurunegala 844 390 46.2 454 53.8
295 Opanayaka Ratnapura 841 391 46.5 450 53.5
296 Meegahakivula Badulla 839 393 46.8 446 53.2
297 Musalai Mannar 826 491 59.4 335 40.6
298 Padavi Sri Pura Trincomalee 813 621 76.4 192 23.6
299 Manmunai South-West Batticaloa 808 454 56.2 354 43.8
300 Maspotha Kurunegala 801 244 30.5 557 69.5
301 Kiriella Ratnapura 797 303 38.0 494 62.0
302 Thunukkai Mullaitivu 775 424 54.7 351 45.3
303 Rasnayakapura Kurunegala 767 373 48.6 394 51.4
304 Koralai Pattu North (Vaharai) Batticaloa 759 489 64.4 270 35.6
305 Pallama Puttalam 744 323 43.4 421 56.6
306 Island North (Kayts) Jaffna 734 440 59.9 294 40.1
307 Palugaswewa Anuradhapura 730 424 58.1 306 41.9
308 Panduwasnuwara East Kurunegala 726 262 36.1 464 63.9
309 Pachchilaipalli Kilinochchi 716 350 48.9 366 51.1
310 Nachchadoowa Anuradhapura 709 287 40.5 422 59.5
311 Ayagama Ratnapura 707 296 41.9 411 58.1
312 Elapatha Ratnapura 699 237 33.9 462 66.1
313 Ehetuwewa Kurunegala 690 304 44.1 386 55.9
314 Kirinda Puhulwella Matara 684 248 36.3 436 63.7
315 Koralai Pattu West (Oddamavadi)
Batticaloa 678 409 60.3 269 39.7
316 Nawagattegama Puttalam 662 361 54.5 301 45.5
317 Karativu Ampara 661 317 48.0 344 52.0
318 Welivitiya-Divithura Galle 658 239 36.3 419 63.7
319 Okewela Hambantota 619 219 35.4 400 64.6
320 Ambanganga Korale Matale 617 249 40.4 368 59.6
321 Vadamaradchi East Jaffna 605 309 51.1 296 48.9
321 Madhu Mannar 605 418 69.1 187 30.9
323 Vanathavilluwa Puttalam 597 361 60.5 236 39.5
324 Koralai Pattu Central Batticaloa 584 356 61.0 228 39.0
325 Koralai Pattu South (Kiran) Batticaloa 571 286 50.1 285 49.9
326 Karainagar Jaffna 568 328 57.7 240 42.3
327 Gonapeenuwala Galle 499 175 35.1 324 64.9
328 Mahakumbukkadawala Puttalam 461 207 44.9 254 55.1
329 Manthai East Mullaitivu 450 242 53.8 208 46.2
330 Verugal/ Echchilampattai Trincomalee 386 244 63.2 142 36.8
331 Delft Jaffna 246 157 63.8 89 36.2

Census of Public and Semi Government Sector Employment – 2016
-46-
Map 3.3: Distribution of public and semi government employees by Divisional Secretariat
(DS) division of place of work 2016
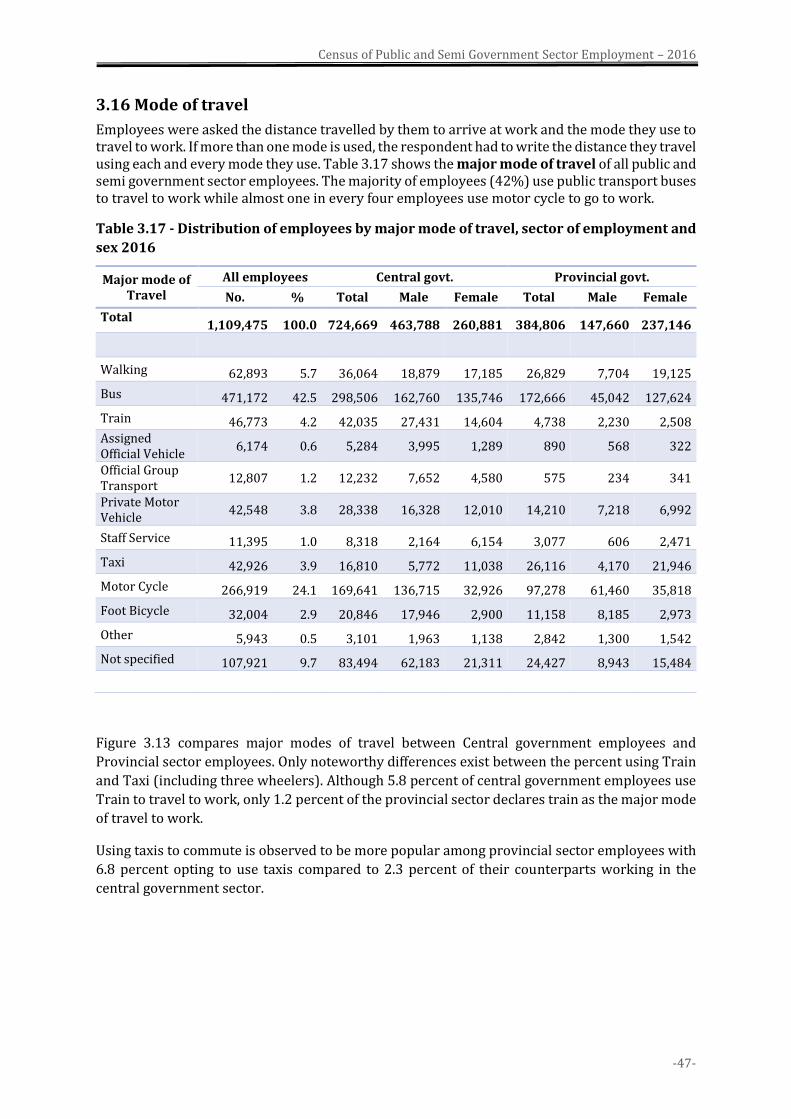
Census of Public and Semi Government Sector Employment – 2016
-47-
3.16 Mode of travel
Employees were asked the distance travelled by them to arrive at work and the mode they use to travel to work. If more than one mode is used, the respondent had to write the distance they travel using each and every mode they use. Table 3.17 shows the major mode of travel of all public and semi government sector employees. The majority of employees (42%) use public transport buses to travel to work while almost one in every four employees use motor cycle to go to work.
Table 3.17 - Distribution of employees by major mode of travel, sector of employment and
sex 2016
Major mode of Travel
All employees Central govt. Provincial govt.
No. % Total Male Female Total Male Female
Total 1,109,475 100.0 724,669 463,788 260,881 384,806 147,660 237,146
Walking 62,893 5.7 36,064 18,879 17,185 26,829 7,704 19,125
Bus 471,172 42.5 298,506 162,760 135,746 172,666 45,042 127,624
Train 46,773 4.2 42,035 27,431 14,604 4,738 2,230 2,508 Assigned Official Vehicle
6,174 0.6 5,284 3,995 1,289 890 568 322
Official Group Transport
12,807 1.2 12,232 7,652 4,580 575 234 341
Private Motor Vehicle
42,548 3.8 28,338 16,328 12,010 14,210 7,218 6,992
Staff Service 11,395 1.0 8,318 2,164 6,154 3,077 606 2,471
Taxi 42,926 3.9 16,810 5,772 11,038 26,116 4,170 21,946
Motor Cycle 266,919 24.1 169,641 136,715 32,926 97,278 61,460 35,818
Foot Bicycle 32,004 2.9 20,846 17,946 2,900 11,158 8,185 2,973
Other 5,943 0.5 3,101 1,963 1,138 2,842 1,300 1,542
Not specified 107,921 9.7 83,494 62,183 21,311 24,427 8,943 15,484
Figure 3.13 compares major modes of travel between Central government employees and
Provincial sector employees. Only noteworthy differences exist between the percent using Train
and Taxi (including three wheelers). Although 5.8 percent of central government employees use
Train to travel to work, only 1.2 percent of the provincial sector declares train as the major mode
of travel to work.
Using taxis to commute is observed to be more popular among provincial sector employees with
6.8 percent opting to use taxis compared to 2.3 percent of their counterparts working in the
central government sector.
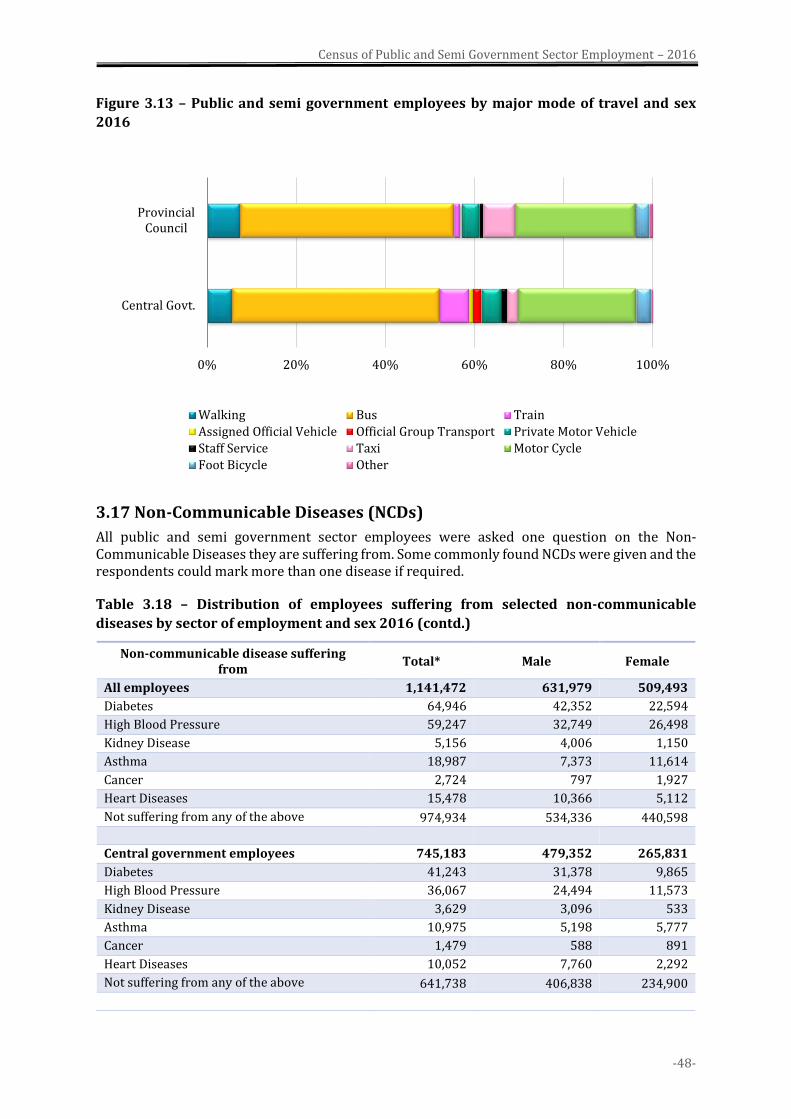
Census of Public and Semi Government Sector Employment – 2016
-48-
Figure 3.13 – Public and semi government employees by major mode of travel and sex
2016
3.17 Non-Communicable Diseases (NCDs)
All public and semi government sector employees were asked one question on the Non-Communicable Diseases they are suffering from. Some commonly found NCDs were given and the respondents could mark more than one disease if required.
Table 3.18 – Distribution of employees suffering from selected non-communicable
diseases by sector of employment and sex 2016 (contd.)
Non-communicable disease suffering from
Total* Male Female
All employees 1,141,472 631,979 509,493
Diabetes 64,946 42,352 22,594
High Blood Pressure 59,247 32,749 26,498
Kidney Disease 5,156 4,006 1,150
Asthma 18,987 7,373 11,614
Cancer 2,724 797 1,927
Heart Diseases 15,478 10,366 5,112
Not suffering from any of the above 974,934 534,336 440,598
Central government employees 745,183 479,352 265,831
Diabetes 41,243 31,378 9,865
High Blood Pressure 36,067 24,494 11,573
Kidney Disease 3,629 3,096 533
Asthma 10,975 5,198 5,777
Cancer 1,479 588 891
Heart Diseases 10,052 7,760 2,292
Not suffering from any of the above 641,738 406,838 234,900
0% 20% 40% 60% 80% 100%
Central Govt.
ProvincialCouncil
Walking Bus Train
Assigned Official Vehicle Official Group Transport Private Motor Vehicle
Staff Service Taxi Motor Cycle
Foot Bicycle Other
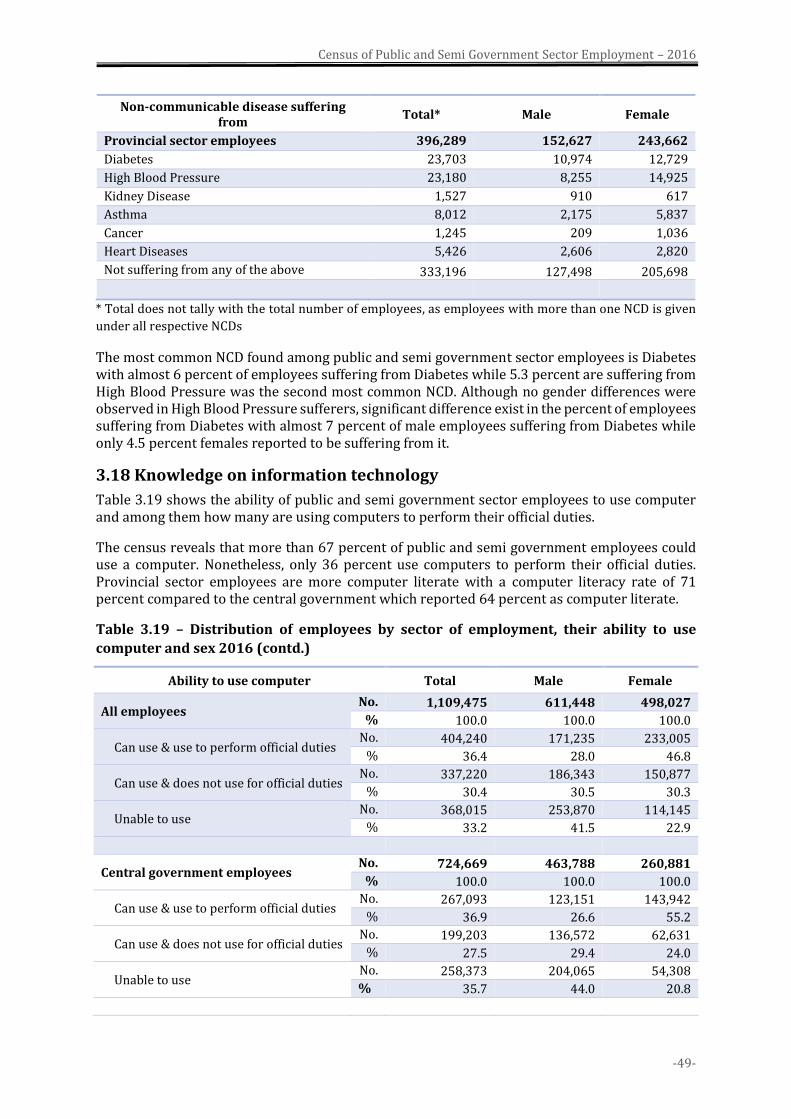
Census of Public and Semi Government Sector Employment – 2016
-49-
Non-communicable disease suffering from
Total* Male Female
Provincial sector employees 396,289 152,627 243,662
Diabetes 23,703 10,974 12,729
High Blood Pressure 23,180 8,255 14,925
Kidney Disease 1,527 910 617
Asthma 8,012 2,175 5,837
Cancer 1,245 209 1,036
Heart Diseases 5,426 2,606 2,820
Not suffering from any of the above 333,196 127,498 205,698
* Total does not tally with the total number of employees, as employees with more than one NCD is given
under all respective NCDs
The most common NCD found among public and semi government sector employees is Diabetes with almost 6 percent of employees suffering from Diabetes while 5.3 percent are suffering from High Blood Pressure was the second most common NCD. Although no gender differences were observed in High Blood Pressure sufferers, significant difference exist in the percent of employees suffering from Diabetes with almost 7 percent of male employees suffering from Diabetes while only 4.5 percent females reported to be suffering from it.
3.18 Knowledge on information technology
Table 3.19 shows the ability of public and semi government sector employees to use computer and among them how many are using computers to perform their official duties.
The census reveals that more than 67 percent of public and semi government employees could use a computer. Nonetheless, only 36 percent use computers to perform their official duties. Provincial sector employees are more computer literate with a computer literacy rate of 71 percent compared to the central government which reported 64 percent as computer literate.
Table 3.19 – Distribution of employees by sector of employment, their ability to use
computer and sex 2016 (contd.)
Ability to use computer Total Male Female
All employees No. 1,109,475 611,448 498,027
% 100.0 100.0 100.0
Can use & use to perform official duties No. 404,240 171,235 233,005
% 36.4 28.0 46.8
Can use & does not use for official duties No. 337,220 186,343 150,877
% 30.4 30.5 30.3
Unable to use No. 368,015 253,870 114,145
% 33.2 41.5 22.9
Central government employees No. 724,669 463,788 260,881
% 100.0 100.0 100.0
Can use & use to perform official duties No. 267,093 123,151 143,942
% 36.9 26.6 55.2
Can use & does not use for official duties No. 199,203 136,572 62,631
% 27.5 29.4 24.0
Unable to use No. 258,373 204,065 54,308
% 35.7 44.0 20.8
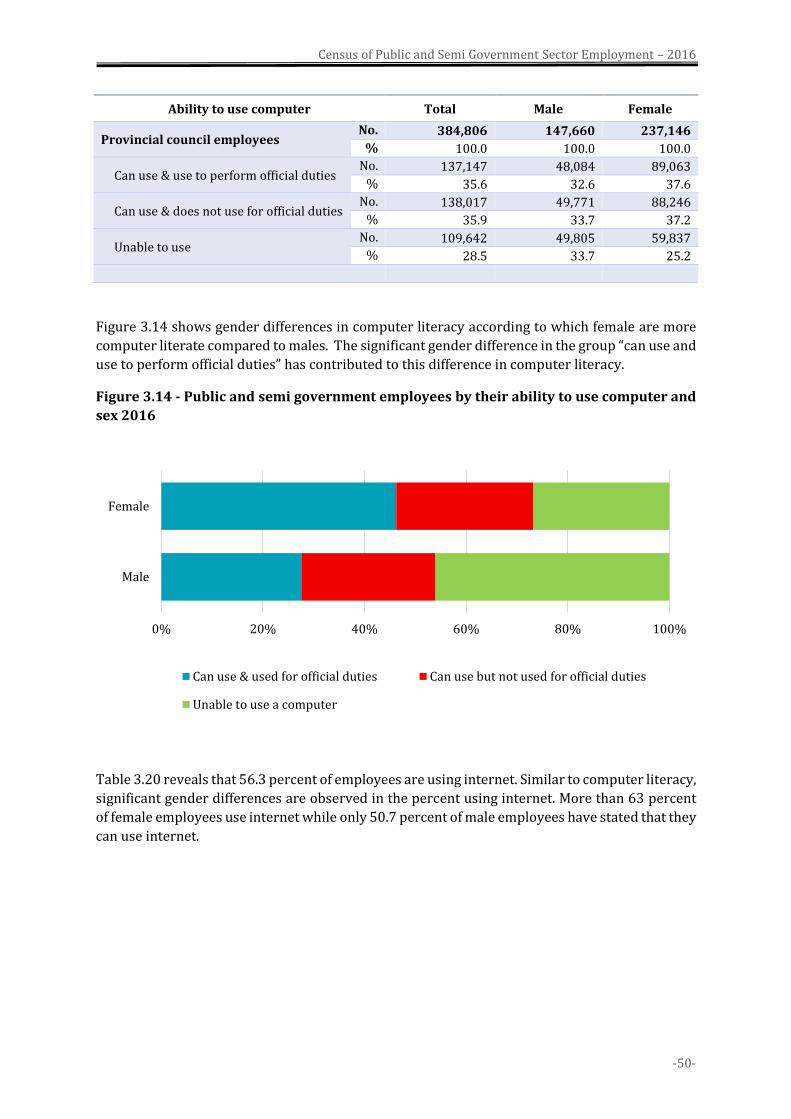
Census of Public and Semi Government Sector Employment – 2016
-50-
Ability to use computer Total Male Female
Provincial council employees No. 384,806 147,660 237,146
% 100.0 100.0 100.0
Can use & use to perform official duties No. 137,147 48,084 89,063
% 35.6 32.6 37.6
Can use & does not use for official duties No. 138,017 49,771 88,246
% 35.9 33.7 37.2
Unable to use No. 109,642 49,805 59,837
% 28.5 33.7 25.2
Figure 3.14 shows gender differences in computer literacy according to which female are more
computer literate compared to males. The significant gender difference in the group “can use and
use to perform official duties” has contributed to this difference in computer literacy.
Figure 3.14 - Public and semi government employees by their ability to use computer and
sex 2016
Table 3.20 reveals that 56.3 percent of employees are using internet. Similar to computer literacy,
significant gender differences are observed in the percent using internet. More than 63 percent
of female employees use internet while only 50.7 percent of male employees have stated that they
can use internet.
0% 20% 40% 60% 80% 100%
Male
Female
Can use & used for official duties Can use but not used for official duties
Unable to use a computer
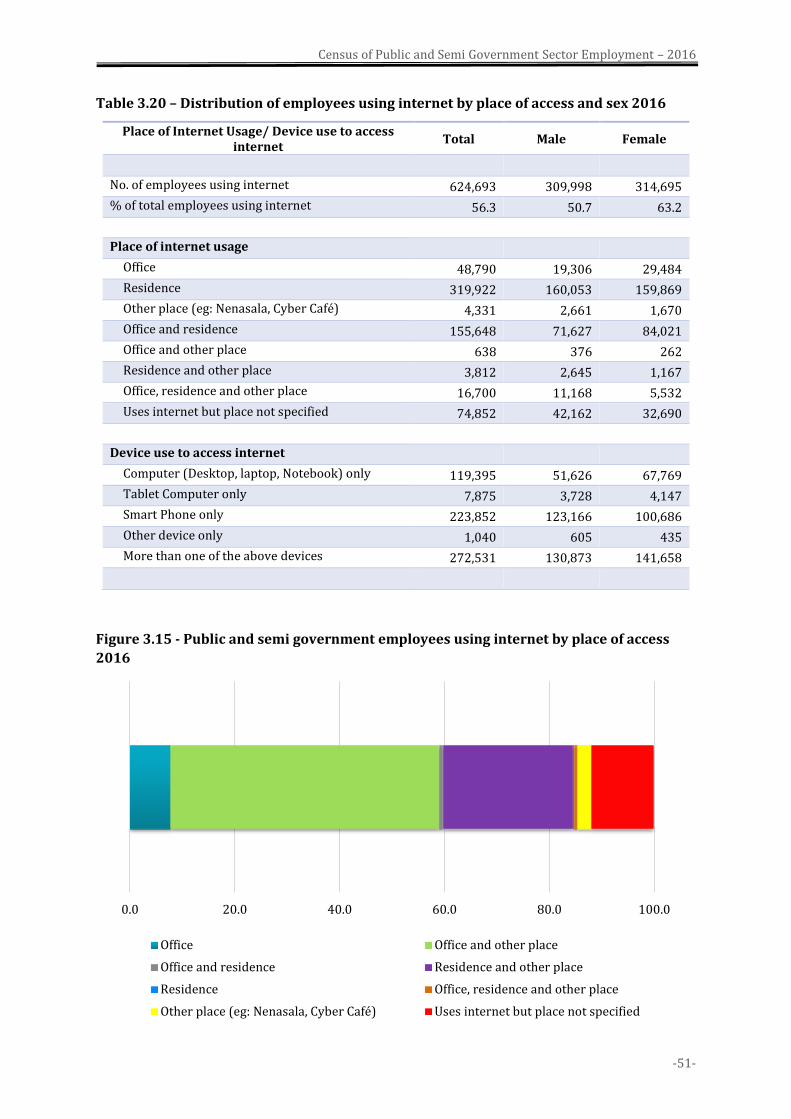
Census of Public and Semi Government Sector Employment – 2016
-51-
Table 3.20 – Distribution of employees using internet by place of access and sex 2016
Place of Internet Usage/ Device use to access internet
Total Male Female
No. of employees using internet 624,693 309,998 314,695
% of total employees using internet 56.3 50.7 63.2
Place of internet usage
Office 48,790 19,306 29,484
Residence 319,922 160,053 159,869
Other place (eg: Nenasala, Cyber Café) 4,331 2,661 1,670
Office and residence 155,648 71,627 84,021
Office and other place 638 376 262
Residence and other place 3,812 2,645 1,167
Office, residence and other place 16,700 11,168 5,532
Uses internet but place not specified 74,852 42,162 32,690
Device use to access internet
Computer (Desktop, laptop, Notebook) only 119,395 51,626 67,769
Tablet Computer only 7,875 3,728 4,147
Smart Phone only 223,852 123,166 100,686
Other device only 1,040 605 435
More than one of the above devices 272,531 130,873 141,658
Figure 3.15 - Public and semi government employees using internet by place of access
2016
0.0 20.0 40.0 60.0 80.0 100.0
Office Office and other place
Office and residence Residence and other place
Residence Office, residence and other place
Other place (eg: Nenasala, Cyber Café) Uses internet but place not specified
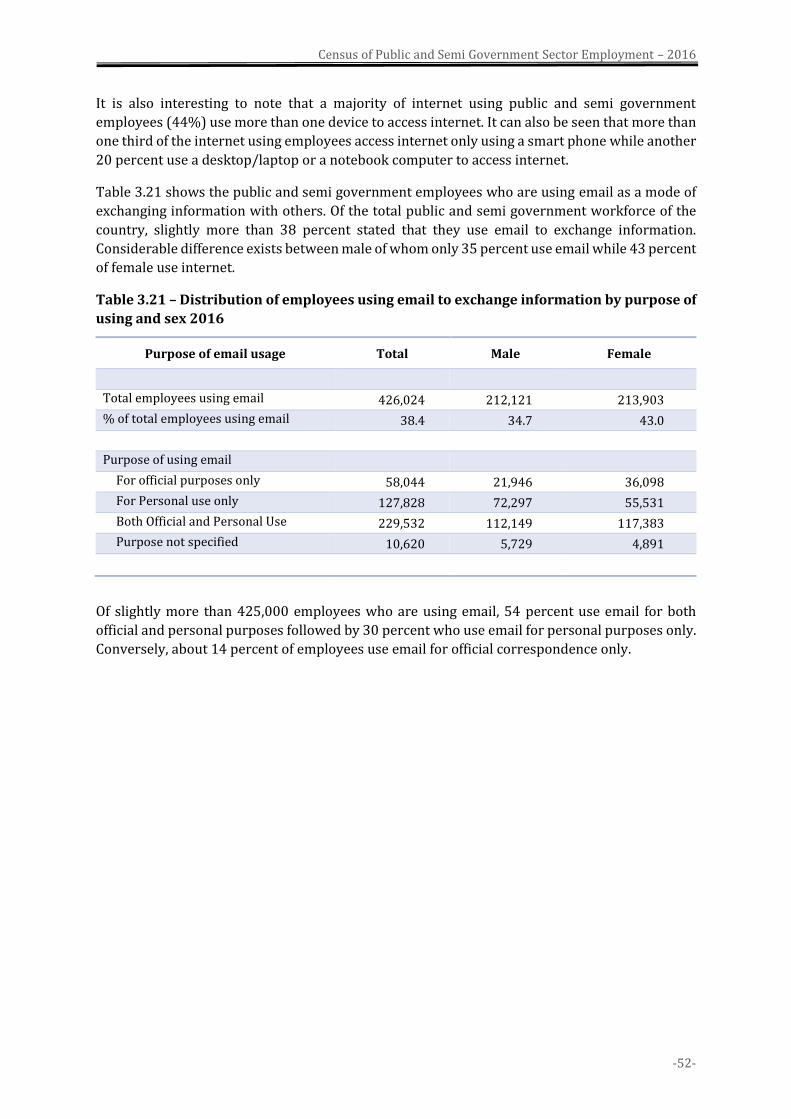
Census of Public and Semi Government Sector Employment – 2016
-52-
It is also interesting to note that a majority of internet using public and semi government
employees (44%) use more than one device to access internet. It can also be seen that more than
one third of the internet using employees access internet only using a smart phone while another
20 percent use a desktop/laptop or a notebook computer to access internet.
Table 3.21 shows the public and semi government employees who are using email as a mode of
exchanging information with others. Of the total public and semi government workforce of the
country, slightly more than 38 percent stated that they use email to exchange information.
Considerable difference exists between male of whom only 35 percent use email while 43 percent
of female use internet.
Table 3.21 – Distribution of employees using email to exchange information by purpose of
using and sex 2016
Purpose of email usage Total Male Female
Total employees using email 426,024 212,121 213,903
% of total employees using email 38.4 34.7 43.0
Purpose of using email
For official purposes only 58,044 21,946 36,098
For Personal use only 127,828 72,297 55,531
Both Official and Personal Use 229,532 112,149 117,383
Purpose not specified 10,620 5,729 4,891
Of slightly more than 425,000 employees who are using email, 54 percent use email for both
official and personal purposes followed by 30 percent who use email for personal purposes only.
Conversely, about 14 percent of employees use email for official correspondence only.
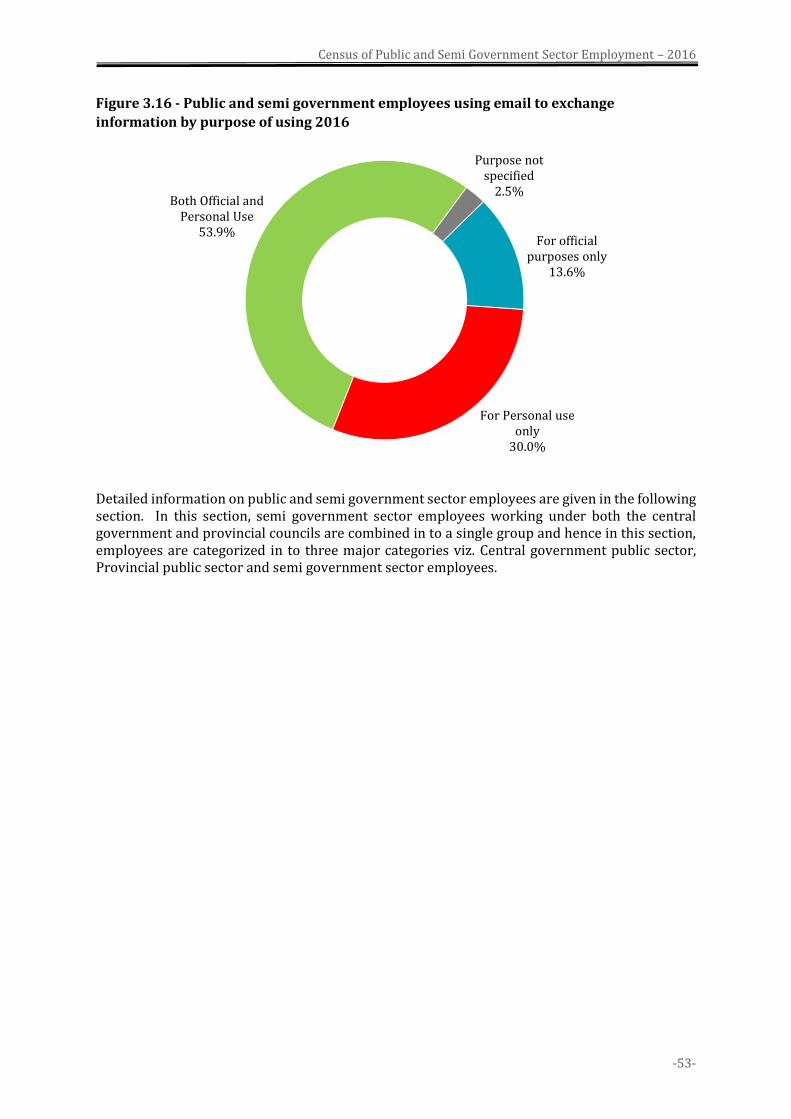
Census of Public and Semi Government Sector Employment – 2016
-53-
Figure 3.16 - Public and semi government employees using email to exchange
information by purpose of using 2016
Detailed information on public and semi government sector employees are given in the following section. In this section, semi government sector employees working under both the central government and provincial councils are combined in to a single group and hence in this section, employees are categorized in to three major categories viz. Central government public sector, Provincial public sector and semi government sector employees.
For official purposes only
13.6%
For Personal use only
30.0%
Both Official and Personal Use
53.9%
Purpose not specified
2.5%

Census of Public and Semi Government Sector Employment – 2016
-54-
Census of Public and Semi Government Sector Employment – 2016
-55-
DETAILED TABLES
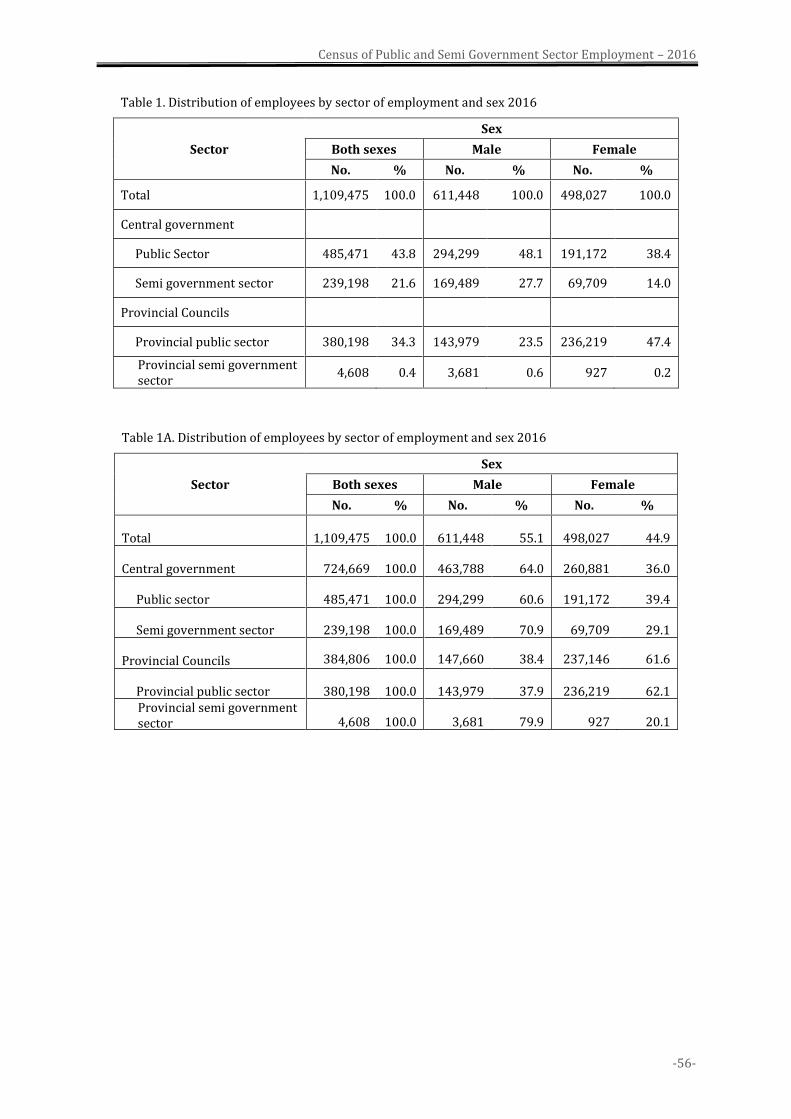
Census of Public and Semi Government Sector Employment – 2016
-56-
Table 1. Distribution of employees by sector of employment and sex 2016
Sector
Sex
Both sexes Male Female
No. % No. % No. %
Total 1,109,475 100.0 611,448 100.0 498,027 100.0
Central government
Public Sector 485,471 43.8 294,299 48.1 191,172 38.4
Semi government sector 239,198 21.6 169,489 27.7 69,709 14.0
Provincial Councils
Provincial public sector 380,198 34.3 143,979 23.5 236,219 47.4
Provincial semi government sector
4,608 0.4 3,681 0.6 927 0.2
Table 1A. Distribution of employees by sector of employment and sex 2016
Sector
Sex
Both sexes Male Female
No. % No. % No. %
Total 1,109,475 100.0 611,448 55.1 498,027 44.9
Central government 724,669 100.0 463,788 64.0 260,881 36.0
Public sector 485,471 100.0 294,299 60.6 191,172 39.4
Semi government sector 239,198 100.0 169,489 70.9 69,709 29.1
Provincial Councils 384,806 100.0 147,660 38.4 237,146 61.6
Provincial public sector 380,198 100.0 143,979 37.9 236,219 62.1 Provincial semi government sector 4,608 100.0 3,681 79.9 927 20.1
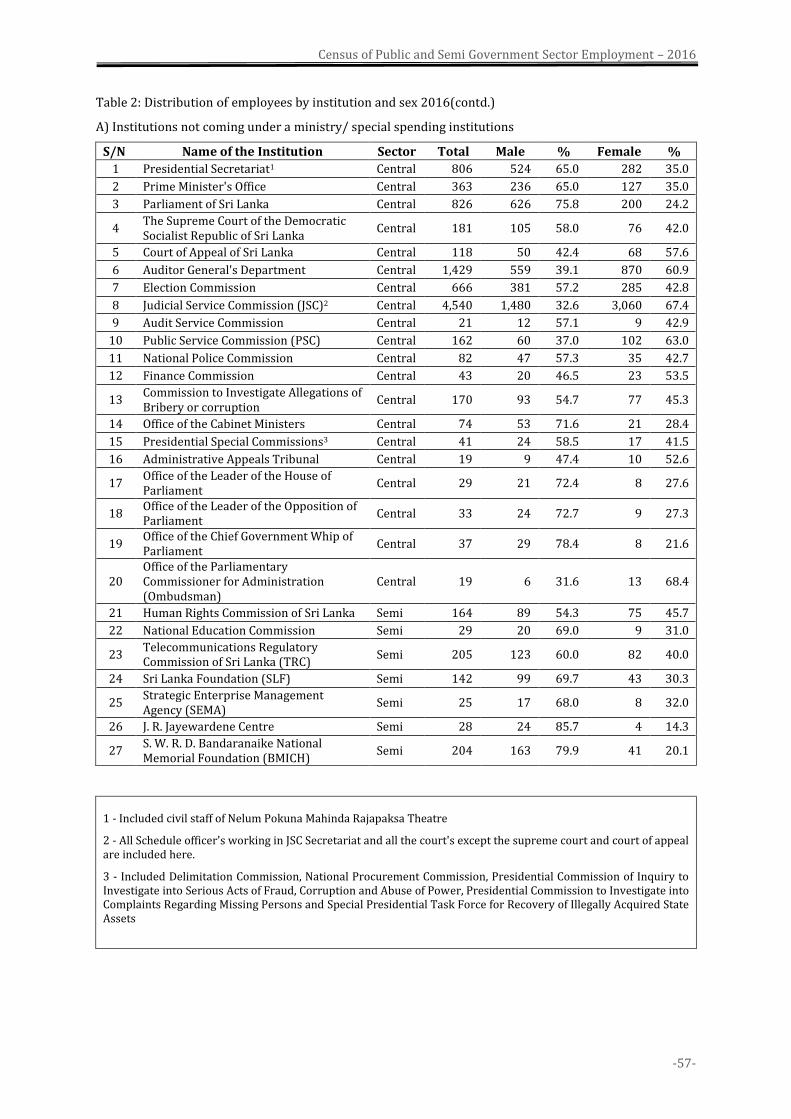
Census of Public and Semi Government Sector Employment – 2016
-57-
Table 2: Distribution of employees by institution and sex 2016(contd.)
A) Institutions not coming under a ministry/ special spending institutions
S/N Name of the Institution Sector Total Male % Female %
1 Presidential Secretariat1 Central 806 524 65.0 282 35.0
2 Prime Minister's Office Central 363 236 65.0 127 35.0
3 Parliament of Sri Lanka Central 826 626 75.8 200 24.2
4 The Supreme Court of the Democratic Socialist Republic of Sri Lanka
Central 181 105 58.0 76 42.0
5 Court of Appeal of Sri Lanka Central 118 50 42.4 68 57.6
6 Auditor General's Department Central 1,429 559 39.1 870 60.9
7 Election Commission Central 666 381 57.2 285 42.8
8 Judicial Service Commission (JSC)2 Central 4,540 1,480 32.6 3,060 67.4
9 Audit Service Commission Central 21 12 57.1 9 42.9
10 Public Service Commission (PSC) Central 162 60 37.0 102 63.0
11 National Police Commission Central 82 47 57.3 35 42.7
12 Finance Commission Central 43 20 46.5 23 53.5
13 Commission to Investigate Allegations of Bribery or corruption
Central 170 93 54.7 77 45.3
14 Office of the Cabinet Ministers Central 74 53 71.6 21 28.4
15 Presidential Special Commissions3 Central 41 24 58.5 17 41.5
16 Administrative Appeals Tribunal Central 19 9 47.4 10 52.6
17 Office of the Leader of the House of Parliament
Central 29 21 72.4 8 27.6
18 Office of the Leader of the Opposition of Parliament
Central 33 24 72.7 9 27.3
19 Office of the Chief Government Whip of Parliament
Central 37 29 78.4 8 21.6
20 Office of the Parliamentary Commissioner for Administration (Ombudsman)
Central 19 6 31.6 13 68.4
21 Human Rights Commission of Sri Lanka Semi 164 89 54.3 75 45.7
22 National Education Commission Semi 29 20 69.0 9 31.0
23 Telecommunications Regulatory Commission of Sri Lanka (TRC)
Semi 205 123 60.0 82 40.0
24 Sri Lanka Foundation (SLF) Semi 142 99 69.7 43 30.3
25 Strategic Enterprise Management Agency (SEMA)
Semi 25 17 68.0 8 32.0
26 J. R. Jayewardene Centre Semi 28 24 85.7 4 14.3
27 S. W. R. D. Bandaranaike National Memorial Foundation (BMICH)
Semi 204 163 79.9 41 20.1
1 - Included civil staff of Nelum Pokuna Mahinda Rajapaksa Theatre
2 - All Schedule officer's working in JSC Secretariat and all the court's except the supreme court and court of appeal are included here.
3 - Included Delimitation Commission, National Procurement Commission, Presidential Commission of Inquiry to Investigate into Serious Acts of Fraud, Corruption and Abuse of Power, Presidential Commission to Investigate into Complaints Regarding Missing Persons and Special Presidential Task Force for Recovery of Illegally Acquired State Assets
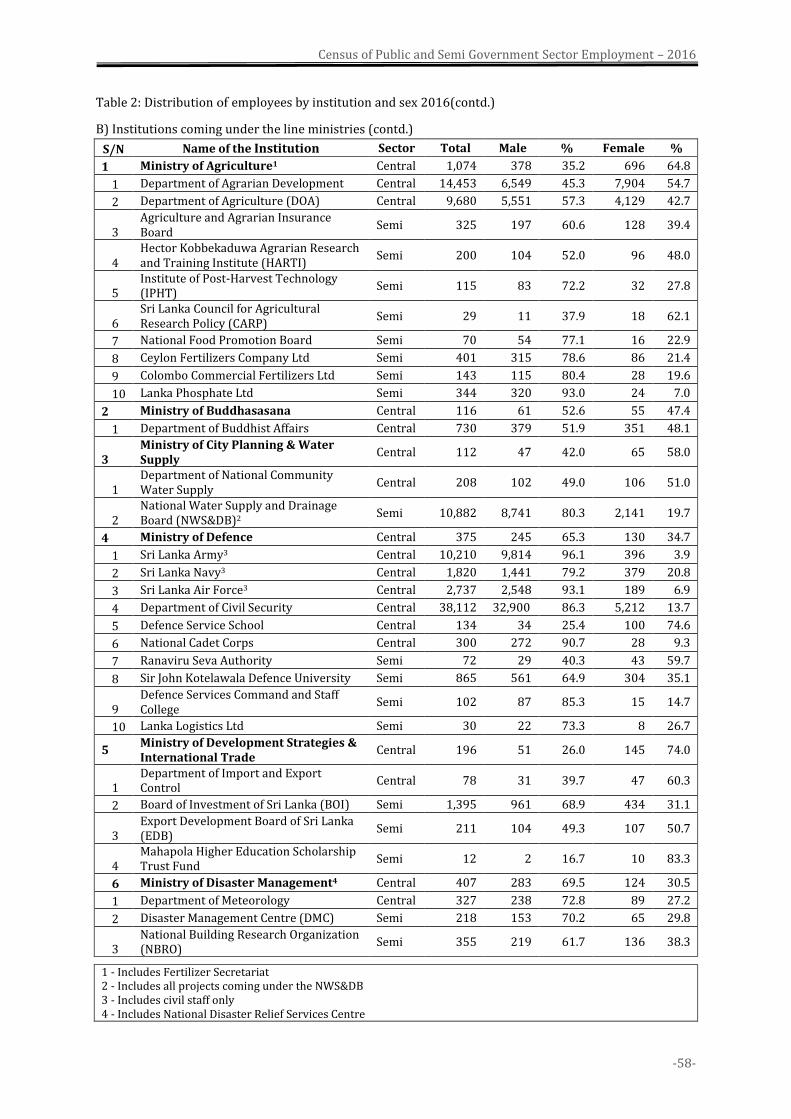
Census of Public and Semi Government Sector Employment – 2016
-58-
Table 2: Distribution of employees by institution and sex 2016(contd.)
B) Institutions coming under the line ministries (contd.)
S/N Name of the Institution Sector Total Male % Female %
1 Ministry of Agriculture1 Central 1,074 378 35.2 696 64.8
1 Department of Agrarian Development Central 14,453 6,549 45.3 7,904 54.7
2 Department of Agriculture (DOA) Central 9,680 5,551 57.3 4,129 42.7
3 Agriculture and Agrarian Insurance Board
Semi 325 197 60.6 128 39.4
4 Hector Kobbekaduwa Agrarian Research and Training Institute (HARTI)
Semi 200 104 52.0 96 48.0
5 Institute of Post-Harvest Technology (IPHT)
Semi 115 83 72.2 32 27.8
6 Sri Lanka Council for Agricultural Research Policy (CARP)
Semi 29 11 37.9 18 62.1
7 National Food Promotion Board Semi 70 54 77.1 16 22.9
8 Ceylon Fertilizers Company Ltd Semi 401 315 78.6 86 21.4
9 Colombo Commercial Fertilizers Ltd Semi 143 115 80.4 28 19.6
10 Lanka Phosphate Ltd Semi 344 320 93.0 24 7.0
2 Ministry of Buddhasasana Central 116 61 52.6 55 47.4
1 Department of Buddhist Affairs Central 730 379 51.9 351 48.1
3 Ministry of City Planning & Water Supply
Central 112 47 42.0 65 58.0
1 Department of National Community Water Supply
Central 208 102 49.0 106 51.0
2 National Water Supply and Drainage Board (NWS&DB)2
Semi 10,882 8,741 80.3 2,141 19.7
4 Ministry of Defence Central 375 245 65.3 130 34.7
1 Sri Lanka Army3 Central 10,210 9,814 96.1 396 3.9
2 Sri Lanka Navy3 Central 1,820 1,441 79.2 379 20.8
3 Sri Lanka Air Force3 Central 2,737 2,548 93.1 189 6.9
4 Department of Civil Security Central 38,112 32,900 86.3 5,212 13.7
5 Defence Service School Central 134 34 25.4 100 74.6
6 National Cadet Corps Central 300 272 90.7 28 9.3
7 Ranaviru Seva Authority Semi 72 29 40.3 43 59.7
8 Sir John Kotelawala Defence University Semi 865 561 64.9 304 35.1
9 Defence Services Command and Staff College
Semi 102 87 85.3 15 14.7
10 Lanka Logistics Ltd Semi 30 22 73.3 8 26.7
5 Ministry of Development Strategies & International Trade
Central 196 51 26.0 145 74.0
1 Department of Import and Export Control
Central 78 31 39.7 47 60.3
2 Board of Investment of Sri Lanka (BOI) Semi 1,395 961 68.9 434 31.1
3 Export Development Board of Sri Lanka (EDB)
Semi 211 104 49.3 107 50.7
4 Mahapola Higher Education Scholarship Trust Fund
Semi 12 2 16.7 10 83.3
6 Ministry of Disaster Management4 Central 407 283 69.5 124 30.5
1 Department of Meteorology Central 327 238 72.8 89 27.2
2 Disaster Management Centre (DMC) Semi 218 153 70.2 65 29.8
3 National Building Research Organization (NBRO)
Semi 355 219 61.7 136 38.3
1 - Includes Fertilizer Secretariat 2 - Includes all projects coming under the NWS&DB 3 - Includes civil staff only 4 - Includes National Disaster Relief Services Centre
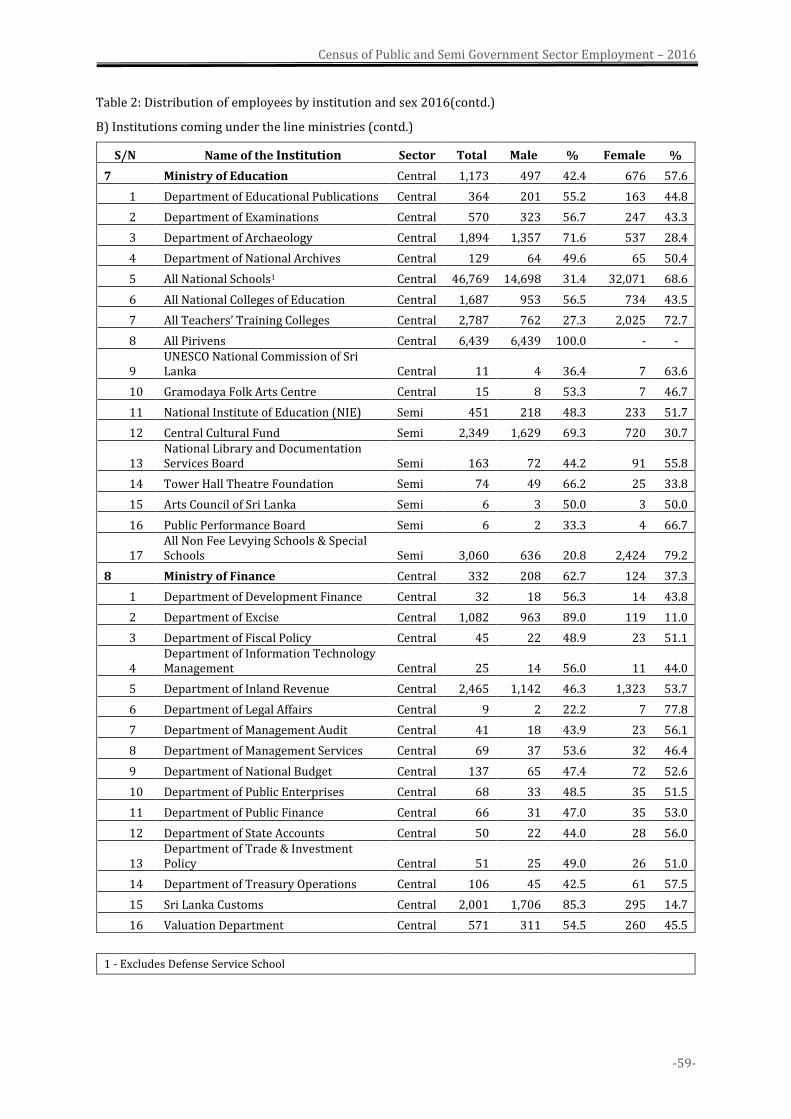
Census of Public and Semi Government Sector Employment – 2016
-59-
Table 2: Distribution of employees by institution and sex 2016(contd.)
B) Institutions coming under the line ministries (contd.)
S/N Name of the Institution Sector Total Male % Female %
7 Ministry of Education Central 1,173 497 42.4 676 57.6
1 Department of Educational Publications Central 364 201 55.2 163 44.8
2 Department of Examinations Central 570 323 56.7 247 43.3
3 Department of Archaeology Central 1,894 1,357 71.6 537 28.4
4 Department of National Archives Central 129 64 49.6 65 50.4
5 All National Schools1 Central 46,769 14,698 31.4 32,071 68.6
6 All National Colleges of Education Central 1,687 953 56.5 734 43.5
7 All Teachers’ Training Colleges Central 2,787 762 27.3 2,025 72.7
8 All Pirivens Central 6,439 6,439 100.0 - -
9 UNESCO National Commission of Sri Lanka Central 11 4 36.4 7 63.6
10 Gramodaya Folk Arts Centre Central 15 8 53.3 7 46.7
11 National Institute of Education (NIE) Semi 451 218 48.3 233 51.7
12 Central Cultural Fund Semi 2,349 1,629 69.3 720 30.7
13 National Library and Documentation Services Board Semi 163 72 44.2 91 55.8
14 Tower Hall Theatre Foundation Semi 74 49 66.2 25 33.8
15 Arts Council of Sri Lanka Semi 6 3 50.0 3 50.0
16 Public Performance Board Semi 6 2 33.3 4 66.7
17 All Non Fee Levying Schools & Special Schools Semi 3,060 636 20.8 2,424 79.2
8 Ministry of Finance Central 332 208 62.7 124 37.3
1 Department of Development Finance Central 32 18 56.3 14 43.8
2 Department of Excise Central 1,082 963 89.0 119 11.0
3 Department of Fiscal Policy Central 45 22 48.9 23 51.1
4 Department of Information Technology Management Central 25 14 56.0 11 44.0
5 Department of Inland Revenue Central 2,465 1,142 46.3 1,323 53.7
6 Department of Legal Affairs Central 9 2 22.2 7 77.8
7 Department of Management Audit Central 41 18 43.9 23 56.1
8 Department of Management Services Central 69 37 53.6 32 46.4
9 Department of National Budget Central 137 65 47.4 72 52.6
10 Department of Public Enterprises Central 68 33 48.5 35 51.5
11 Department of Public Finance Central 66 31 47.0 35 53.0
12 Department of State Accounts Central 50 22 44.0 28 56.0
13 Department of Trade & Investment Policy Central 51 25 49.0 26 51.0
14 Department of Treasury Operations Central 106 45 42.5 61 57.5
15 Sri Lanka Customs Central 2,001 1,706 85.3 295 14.7
16 Valuation Department Central 571 311 54.5 260 45.5
1 - Excludes Defense Service School
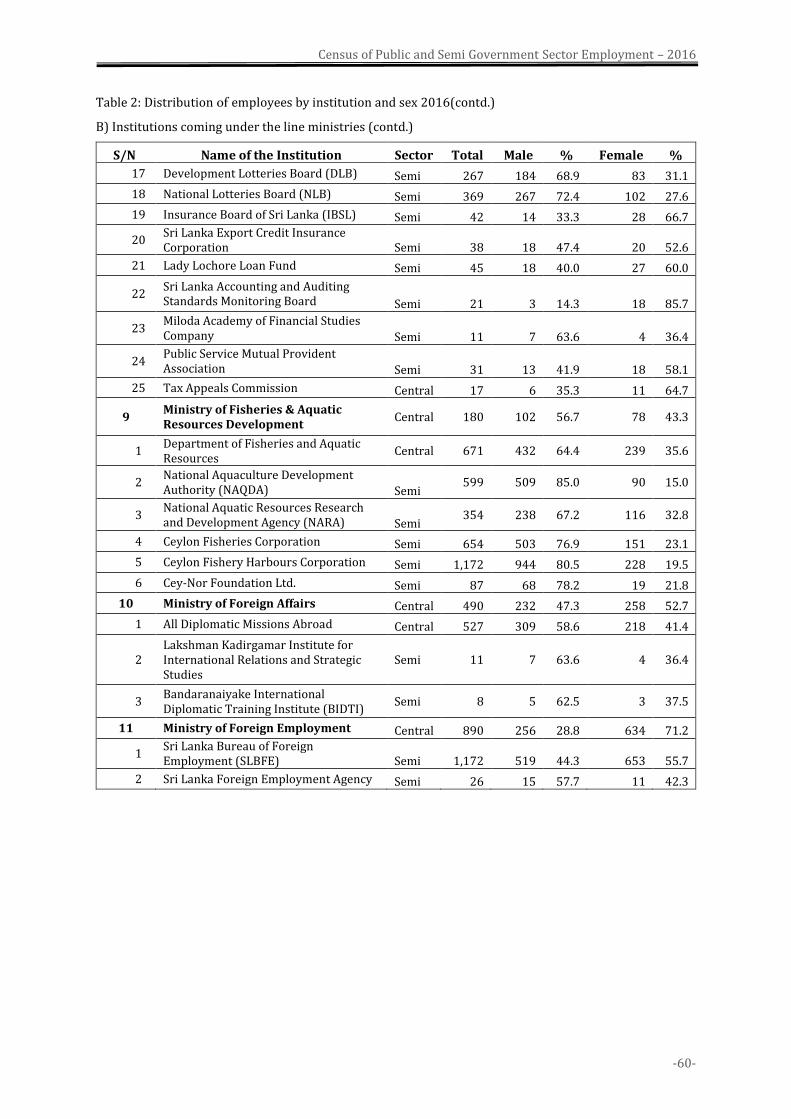
Census of Public and Semi Government Sector Employment – 2016
-60-
Table 2: Distribution of employees by institution and sex 2016(contd.)
B) Institutions coming under the line ministries (contd.)
S/N Name of the Institution Sector Total Male % Female %
17 Development Lotteries Board (DLB) Semi 267 184 68.9 83 31.1
18 National Lotteries Board (NLB) Semi 369 267 72.4 102 27.6
19 Insurance Board of Sri Lanka (IBSL) Semi 42 14 33.3 28 66.7
20 Sri Lanka Export Credit Insurance Corporation Semi 38 18 47.4 20 52.6
21 Lady Lochore Loan Fund Semi 45 18 40.0 27 60.0
22 Sri Lanka Accounting and Auditing Standards Monitoring Board Semi 21 3 14.3 18 85.7
23 Miloda Academy of Financial Studies Company Semi 11 7 63.6 4 36.4
24 Public Service Mutual Provident Association Semi 31 13 41.9 18 58.1
25 Tax Appeals Commission Central 17 6 35.3 11 64.7
9 Ministry of Fisheries & Aquatic Resources Development
Central 180 102 56.7 78 43.3
1 Department of Fisheries and Aquatic Resources
Central 671 432 64.4 239 35.6
2 National Aquaculture Development Authority (NAQDA) Semi
599 509 85.0 90 15.0
3 National Aquatic Resources Research and Development Agency (NARA) Semi
354 238 67.2 116 32.8
4 Ceylon Fisheries Corporation Semi 654 503 76.9 151 23.1
5 Ceylon Fishery Harbours Corporation Semi 1,172 944 80.5 228 19.5
6 Cey-Nor Foundation Ltd. Semi 87 68 78.2 19 21.8
10 Ministry of Foreign Affairs Central 490 232 47.3 258 52.7
1 All Diplomatic Missions Abroad Central 527 309 58.6 218 41.4
2 Lakshman Kadirgamar Institute for International Relations and Strategic Studies
Semi 11 7 63.6 4 36.4
3 Bandaranaiyake International Diplomatic Training Institute (BIDTI)
Semi 8 5 62.5 3 37.5
11 Ministry of Foreign Employment Central 890 256 28.8 634 71.2
1 Sri Lanka Bureau of Foreign Employment (SLBFE) Semi 1,172 519 44.3 653 55.7
2 Sri Lanka Foreign Employment Agency Semi 26 15 57.7 11 42.3
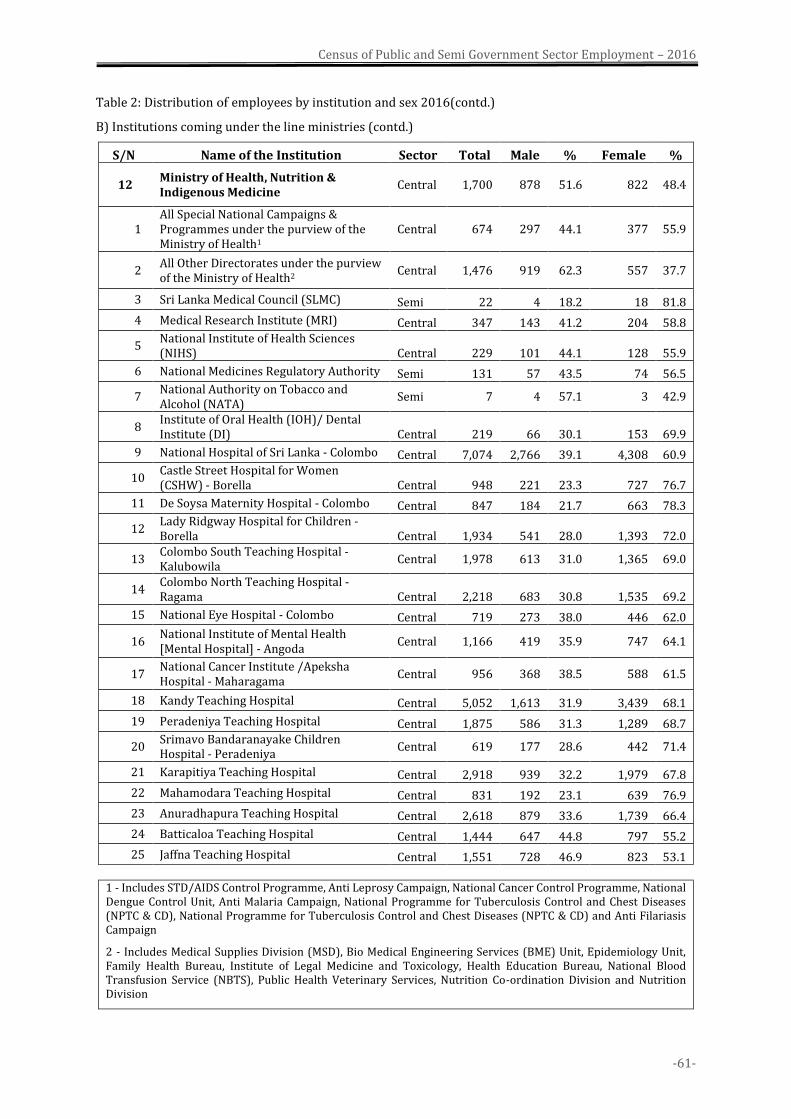
Census of Public and Semi Government Sector Employment – 2016
-61-
Table 2: Distribution of employees by institution and sex 2016(contd.)
B) Institutions coming under the line ministries (contd.)
S/N Name of the Institution Sector Total Male % Female %
12 Ministry of Health, Nutrition & Indigenous Medicine
Central 1,700 878 51.6 822 48.4
1 All Special National Campaigns & Programmes under the purview of the Ministry of Health1
Central 674 297 44.1 377 55.9
2 All Other Directorates under the purview of the Ministry of Health2
Central 1,476 919 62.3 557 37.7
3 Sri Lanka Medical Council (SLMC) Semi 22 4 18.2 18 81.8
4 Medical Research Institute (MRI) Central 347 143 41.2 204 58.8
5 National Institute of Health Sciences (NIHS) Central 229 101 44.1 128 55.9
6 National Medicines Regulatory Authority Semi 131 57 43.5 74 56.5
7 National Authority on Tobacco and Alcohol (NATA)
Semi 7 4 57.1 3 42.9
8 Institute of Oral Health (IOH)/ Dental Institute (DI) Central 219 66 30.1 153 69.9
9 National Hospital of Sri Lanka - Colombo Central 7,074 2,766 39.1 4,308 60.9
10 Castle Street Hospital for Women (CSHW) - Borella Central 948 221 23.3 727 76.7
11 De Soysa Maternity Hospital - Colombo Central 847 184 21.7 663 78.3
12 Lady Ridgway Hospital for Children - Borella Central 1,934 541 28.0 1,393 72.0
13 Colombo South Teaching Hospital - Kalubowila
Central 1,978 613 31.0 1,365 69.0
14 Colombo North Teaching Hospital - Ragama Central 2,218 683 30.8 1,535 69.2
15 National Eye Hospital - Colombo Central 719 273 38.0 446 62.0
16 National Institute of Mental Health [Mental Hospital] - Angoda
Central 1,166 419 35.9 747 64.1
17 National Cancer Institute /Apeksha Hospital - Maharagama
Central 956 368 38.5 588 61.5
18 Kandy Teaching Hospital Central 5,052 1,613 31.9 3,439 68.1
19 Peradeniya Teaching Hospital Central 1,875 586 31.3 1,289 68.7
20 Srimavo Bandaranayake Children Hospital - Peradeniya
Central 619 177 28.6 442 71.4
21 Karapitiya Teaching Hospital Central 2,918 939 32.2 1,979 67.8
22 Mahamodara Teaching Hospital Central 831 192 23.1 639 76.9
23 Anuradhapura Teaching Hospital Central 2,618 879 33.6 1,739 66.4
24 Batticaloa Teaching Hospital Central 1,444 647 44.8 797 55.2
25 Jaffna Teaching Hospital Central 1,551 728 46.9 823 53.1
1 - Includes STD/AIDS Control Programme, Anti Leprosy Campaign, National Cancer Control Programme, National Dengue Control Unit, Anti Malaria Campaign, National Programme for Tuberculosis Control and Chest Diseases (NPTC & CD), National Programme for Tuberculosis Control and Chest Diseases (NPTC & CD) and Anti Filariasis Campaign
2 - Includes Medical Supplies Division (MSD), Bio Medical Engineering Services (BME) Unit, Epidemiology Unit, Family Health Bureau, Institute of Legal Medicine and Toxicology, Health Education Bureau, National Blood Transfusion Service (NBTS), Public Health Veterinary Services, Nutrition Co-ordination Division and Nutrition Division
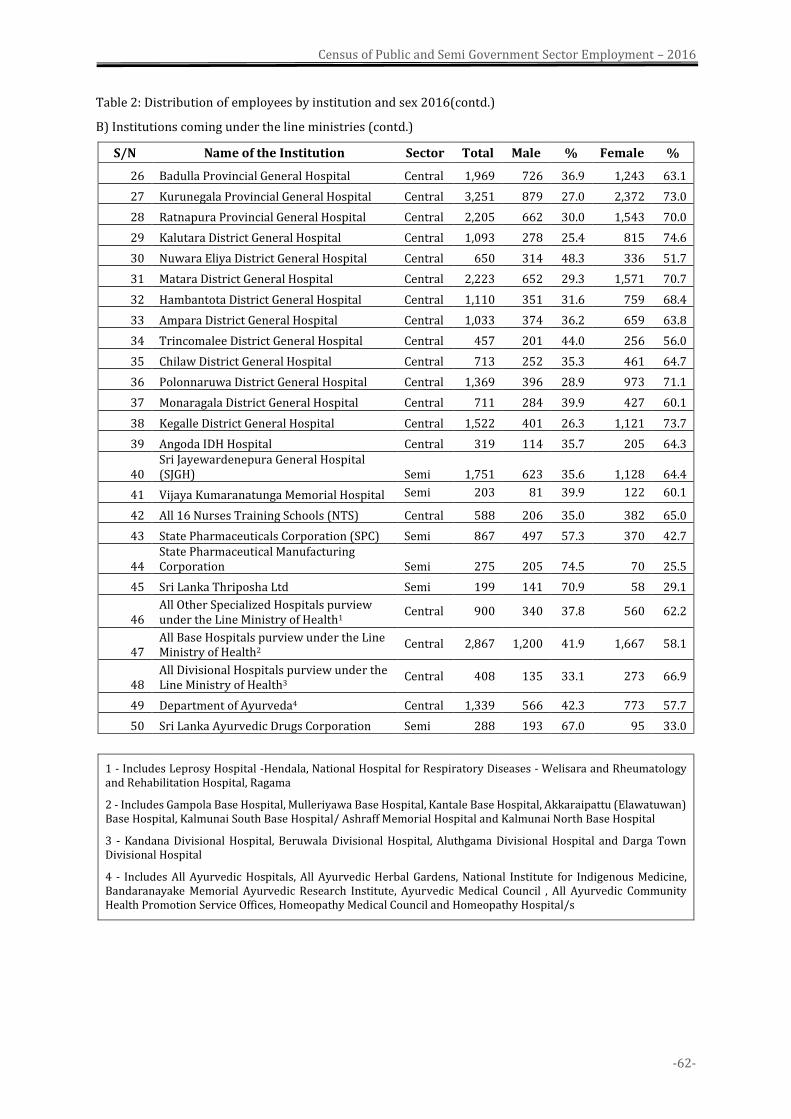
Census of Public and Semi Government Sector Employment – 2016
-62-
Table 2: Distribution of employees by institution and sex 2016(contd.)
B) Institutions coming under the line ministries (contd.)
S/N Name of the Institution Sector Total Male % Female %
26 Badulla Provincial General Hospital Central 1,969 726 36.9 1,243 63.1
27 Kurunegala Provincial General Hospital Central 3,251 879 27.0 2,372 73.0
28 Ratnapura Provincial General Hospital Central 2,205 662 30.0 1,543 70.0
29 Kalutara District General Hospital Central 1,093 278 25.4 815 74.6
30 Nuwara Eliya District General Hospital Central 650 314 48.3 336 51.7
31 Matara District General Hospital Central 2,223 652 29.3 1,571 70.7
32 Hambantota District General Hospital Central 1,110 351 31.6 759 68.4
33 Ampara District General Hospital Central 1,033 374 36.2 659 63.8
34 Trincomalee District General Hospital Central 457 201 44.0 256 56.0
35 Chilaw District General Hospital Central 713 252 35.3 461 64.7
36 Polonnaruwa District General Hospital Central 1,369 396 28.9 973 71.1
37 Monaragala District General Hospital Central 711 284 39.9 427 60.1
38 Kegalle District General Hospital Central 1,522 401 26.3 1,121 73.7
39 Angoda IDH Hospital Central 319 114 35.7 205 64.3
40 Sri Jayewardenepura General Hospital (SJGH) Semi 1,751 623 35.6 1,128 64.4
41 Vijaya Kumaranatunga Memorial Hospital Semi 203 81 39.9 122 60.1
42 All 16 Nurses Training Schools (NTS) Central 588 206 35.0 382 65.0
43 State Pharmaceuticals Corporation (SPC) Semi 867 497 57.3 370 42.7
44 State Pharmaceutical Manufacturing Corporation Semi 275 205 74.5 70 25.5
45 Sri Lanka Thriposha Ltd Semi 199 141 70.9 58 29.1
46 All Other Specialized Hospitals purview under the Line Ministry of Health1
Central 900 340 37.8 560 62.2
47 All Base Hospitals purview under the Line Ministry of Health2
Central 2,867 1,200 41.9 1,667 58.1
48 All Divisional Hospitals purview under the Line Ministry of Health3
Central 408 135 33.1 273 66.9
49 Department of Ayurveda4 Central 1,339 566 42.3 773 57.7
50 Sri Lanka Ayurvedic Drugs Corporation Semi 288 193 67.0 95 33.0
1 - Includes Leprosy Hospital -Hendala, National Hospital for Respiratory Diseases - Welisara and Rheumatology and Rehabilitation Hospital, Ragama
2 - Includes Gampola Base Hospital, Mulleriyawa Base Hospital, Kantale Base Hospital, Akkaraipattu (Elawatuwan) Base Hospital, Kalmunai South Base Hospital/ Ashraff Memorial Hospital and Kalmunai North Base Hospital
3 - Kandana Divisional Hospital, Beruwala Divisional Hospital, Aluthgama Divisional Hospital and Darga Town Divisional Hospital
4 - Includes All Ayurvedic Hospitals, All Ayurvedic Herbal Gardens, National Institute for Indigenous Medicine, Bandaranayake Memorial Ayurvedic Research Institute, Ayurvedic Medical Council , All Ayurvedic Community Health Promotion Service Offices, Homeopathy Medical Council and Homeopathy Hospital/s
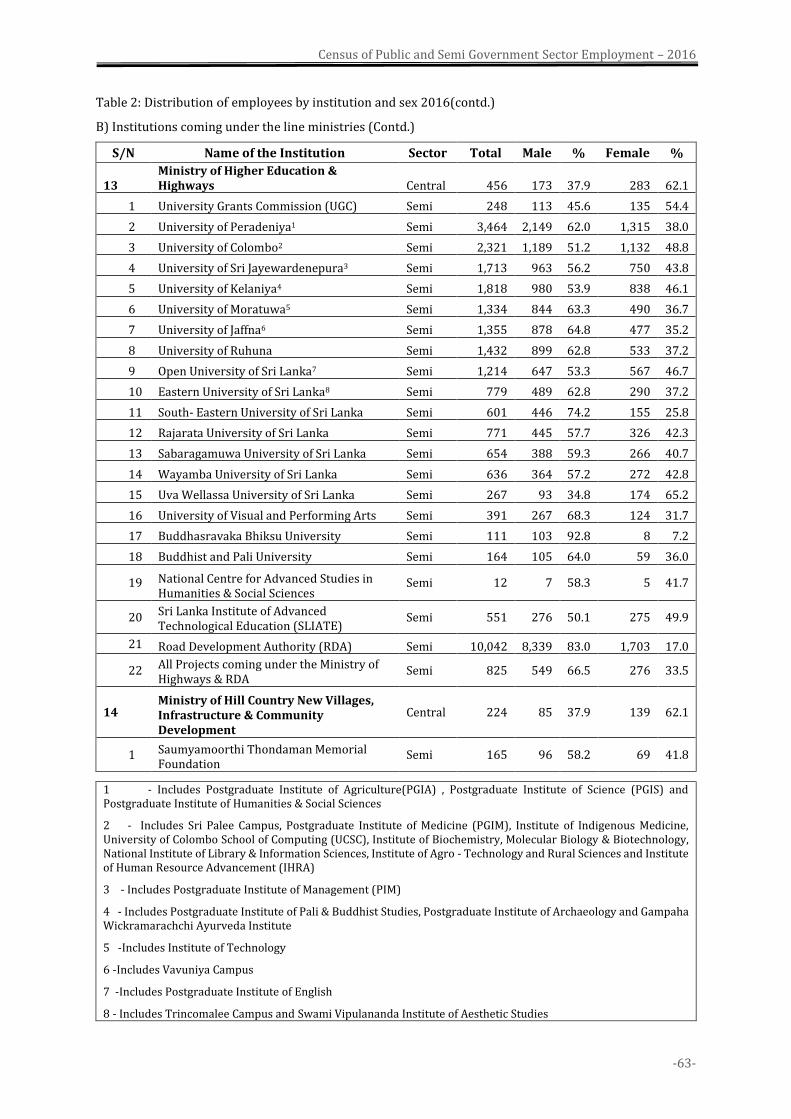
Census of Public and Semi Government Sector Employment – 2016
-63-
Table 2: Distribution of employees by institution and sex 2016(contd.)
B) Institutions coming under the line ministries (Contd.)
S/N Name of the Institution Sector Total Male % Female %
13 Ministry of Higher Education & Highways Central 456 173 37.9 283 62.1
1 University Grants Commission (UGC) Semi 248 113 45.6 135 54.4
2 University of Peradeniya1 Semi 3,464 2,149 62.0 1,315 38.0
3 University of Colombo2 Semi 2,321 1,189 51.2 1,132 48.8
4 University of Sri Jayewardenepura3 Semi 1,713 963 56.2 750 43.8
5 University of Kelaniya4 Semi 1,818 980 53.9 838 46.1
6 University of Moratuwa5 Semi 1,334 844 63.3 490 36.7
7 University of Jaffna6 Semi 1,355 878 64.8 477 35.2
8 University of Ruhuna Semi 1,432 899 62.8 533 37.2
9 Open University of Sri Lanka7 Semi 1,214 647 53.3 567 46.7
10 Eastern University of Sri Lanka8 Semi 779 489 62.8 290 37.2
11 South- Eastern University of Sri Lanka Semi 601 446 74.2 155 25.8
12 Rajarata University of Sri Lanka Semi 771 445 57.7 326 42.3
13 Sabaragamuwa University of Sri Lanka Semi 654 388 59.3 266 40.7
14 Wayamba University of Sri Lanka Semi 636 364 57.2 272 42.8
15 Uva Wellassa University of Sri Lanka Semi 267 93 34.8 174 65.2
16 University of Visual and Performing Arts Semi 391 267 68.3 124 31.7
17 Buddhasravaka Bhiksu University Semi 111 103 92.8 8 7.2
18 Buddhist and Pali University Semi 164 105 64.0 59 36.0
19 National Centre for Advanced Studies in Humanities & Social Sciences
Semi 12 7 58.3 5 41.7
20 Sri Lanka Institute of Advanced Technological Education (SLIATE)
Semi 551 276 50.1 275 49.9
21 Road Development Authority (RDA) Semi 10,042 8,339 83.0 1,703 17.0
22 All Projects coming under the Ministry of Highways & RDA
Semi 825 549 66.5 276 33.5
14 Ministry of Hill Country New Villages, Infrastructure & Community Development
Central 224 85 37.9 139 62.1
1 Saumyamoorthi Thondaman Memorial Foundation
Semi 165 96 58.2 69 41.8
1 - Includes Postgraduate Institute of Agriculture(PGIA) , Postgraduate Institute of Science (PGIS) and Postgraduate Institute of Humanities & Social Sciences
2 - Includes Sri Palee Campus, Postgraduate Institute of Medicine (PGIM), Institute of Indigenous Medicine, University of Colombo School of Computing (UCSC), Institute of Biochemistry, Molecular Biology & Biotechnology, National Institute of Library & Information Sciences, Institute of Agro - Technology and Rural Sciences and Institute of Human Resource Advancement (IHRA)
3 - Includes Postgraduate Institute of Management (PIM)
4 - Includes Postgraduate Institute of Pali & Buddhist Studies, Postgraduate Institute of Archaeology and Gampaha Wickramarachchi Ayurveda Institute
5 -Includes Institute of Technology
6 -Includes Vavuniya Campus
7 -Includes Postgraduate Institute of English
8 - Includes Trincomalee Campus and Swami Vipulananda Institute of Aesthetic Studies
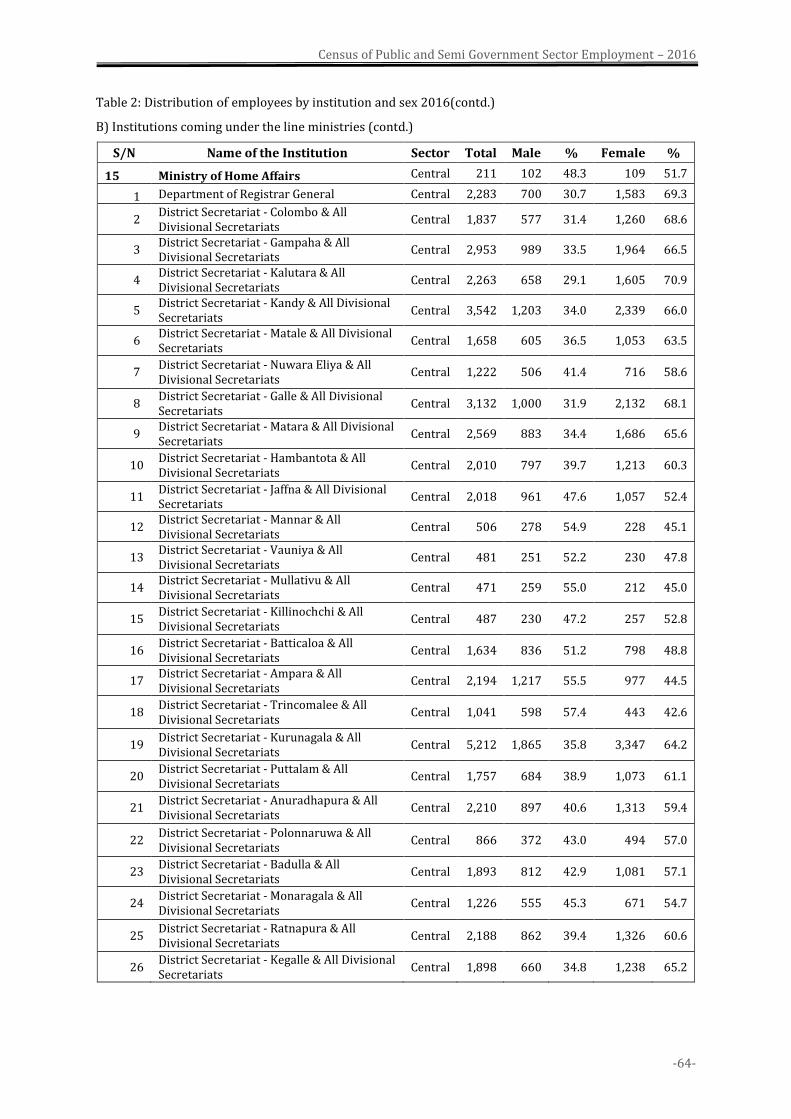
Census of Public and Semi Government Sector Employment – 2016
-64-
Table 2: Distribution of employees by institution and sex 2016(contd.)
B) Institutions coming under the line ministries (contd.)
S/N Name of the Institution Sector Total Male % Female %
15 Ministry of Home Affairs Central 211 102 48.3 109 51.7
1 Department of Registrar General Central 2,283 700 30.7 1,583 69.3
2 District Secretariat - Colombo & All Divisional Secretariats
Central 1,837 577 31.4 1,260 68.6
3 District Secretariat - Gampaha & All Divisional Secretariats
Central 2,953 989 33.5 1,964 66.5
4 District Secretariat - Kalutara & All Divisional Secretariats
Central 2,263 658 29.1 1,605 70.9
5 District Secretariat - Kandy & All Divisional Secretariats
Central 3,542 1,203 34.0 2,339 66.0
6 District Secretariat - Matale & All Divisional Secretariats
Central 1,658 605 36.5 1,053 63.5
7 District Secretariat - Nuwara Eliya & All Divisional Secretariats
Central 1,222 506 41.4 716 58.6
8 District Secretariat - Galle & All Divisional Secretariats
Central 3,132 1,000 31.9 2,132 68.1
9 District Secretariat - Matara & All Divisional Secretariats
Central 2,569 883 34.4 1,686 65.6
10 District Secretariat - Hambantota & All Divisional Secretariats
Central 2,010 797 39.7 1,213 60.3
11 District Secretariat - Jaffna & All Divisional Secretariats
Central 2,018 961 47.6 1,057 52.4
12 District Secretariat - Mannar & All Divisional Secretariats
Central 506 278 54.9 228 45.1
13 District Secretariat - Vauniya & All Divisional Secretariats
Central 481 251 52.2 230 47.8
14 District Secretariat - Mullativu & All Divisional Secretariats
Central 471 259 55.0 212 45.0
15 District Secretariat - Killinochchi & All Divisional Secretariats
Central 487 230 47.2 257 52.8
16 District Secretariat - Batticaloa & All Divisional Secretariats
Central 1,634 836 51.2 798 48.8
17 District Secretariat - Ampara & All Divisional Secretariats
Central 2,194 1,217 55.5 977 44.5
18 District Secretariat - Trincomalee & All Divisional Secretariats
Central 1,041 598 57.4 443 42.6
19 District Secretariat - Kurunagala & All Divisional Secretariats
Central 5,212 1,865 35.8 3,347 64.2
20 District Secretariat - Puttalam & All Divisional Secretariats
Central 1,757 684 38.9 1,073 61.1
21 District Secretariat - Anuradhapura & All Divisional Secretariats
Central 2,210 897 40.6 1,313 59.4
22 District Secretariat - Polonnaruwa & All Divisional Secretariats
Central 866 372 43.0 494 57.0
23 District Secretariat - Badulla & All Divisional Secretariats
Central 1,893 812 42.9 1,081 57.1
24 District Secretariat - Monaragala & All Divisional Secretariats
Central 1,226 555 45.3 671 54.7
25 District Secretariat - Ratnapura & All Divisional Secretariats
Central 2,188 862 39.4 1,326 60.6
26 District Secretariat - Kegalle & All Divisional Secretariats
Central 1,898 660 34.8 1,238 65.2
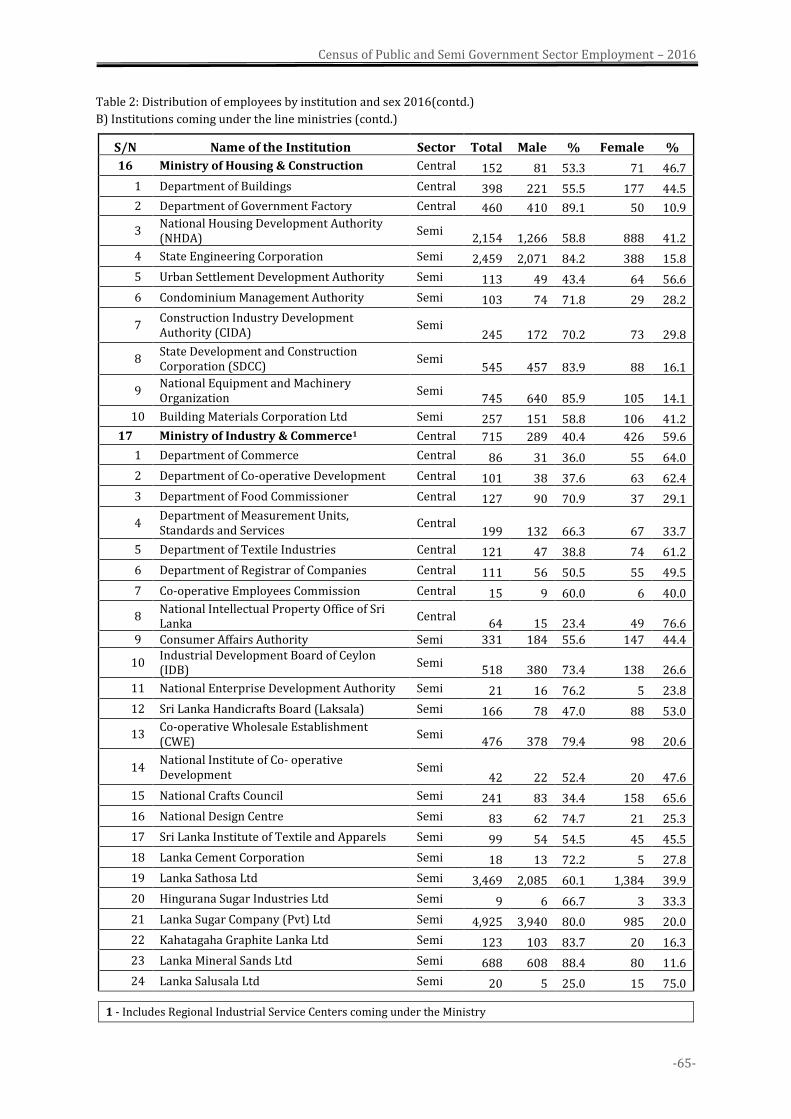
Census of Public and Semi Government Sector Employment – 2016
-65-
Table 2: Distribution of employees by institution and sex 2016(contd.)
B) Institutions coming under the line ministries (contd.)
S/N Name of the Institution Sector Total Male % Female %
16 Ministry of Housing & Construction Central 152 81 53.3 71 46.7
1 Department of Buildings Central 398 221 55.5 177 44.5
2 Department of Government Factory Central 460 410 89.1 50 10.9
3 National Housing Development Authority (NHDA)
Semi 2,154 1,266 58.8 888 41.2
4 State Engineering Corporation Semi 2,459 2,071 84.2 388 15.8
5 Urban Settlement Development Authority Semi 113 49 43.4 64 56.6
6 Condominium Management Authority Semi 103 74 71.8 29 28.2
7 Construction Industry Development Authority (CIDA)
Semi 245 172 70.2 73 29.8
8 State Development and Construction Corporation (SDCC)
Semi 545 457 83.9 88 16.1
9 National Equipment and Machinery Organization
Semi 745 640 85.9 105 14.1
10 Building Materials Corporation Ltd Semi 257 151 58.8 106 41.2
17 Ministry of Industry & Commerce1 Central 715 289 40.4 426 59.6
1 Department of Commerce Central 86 31 36.0 55 64.0
2 Department of Co-operative Development Central 101 38 37.6 63 62.4
3 Department of Food Commissioner Central 127 90 70.9 37 29.1
4 Department of Measurement Units, Standards and Services
Central 199 132 66.3 67 33.7
5 Department of Textile Industries Central 121 47 38.8 74 61.2
6 Department of Registrar of Companies Central 111 56 50.5 55 49.5
7 Co-operative Employees Commission Central 15 9 60.0 6 40.0
8 National Intellectual Property Office of Sri Lanka
Central 64 15 23.4 49 76.6
9 Consumer Affairs Authority Semi 331 184 55.6 147 44.4
10 Industrial Development Board of Ceylon (IDB)
Semi 518 380 73.4 138 26.6
11 National Enterprise Development Authority Semi 21 16 76.2 5 23.8
12 Sri Lanka Handicrafts Board (Laksala) Semi 166 78 47.0 88 53.0
13 Co-operative Wholesale Establishment (CWE)
Semi 476 378 79.4 98 20.6
14 National Institute of Co- operative Development
Semi 42 22 52.4 20 47.6
15 National Crafts Council Semi 241 83 34.4 158 65.6
16 National Design Centre Semi 83 62 74.7 21 25.3
17 Sri Lanka Institute of Textile and Apparels Semi 99 54 54.5 45 45.5
18 Lanka Cement Corporation Semi 18 13 72.2 5 27.8
19 Lanka Sathosa Ltd Semi 3,469 2,085 60.1 1,384 39.9
20 Hingurana Sugar Industries Ltd Semi 9 6 66.7 3 33.3
21 Lanka Sugar Company (Pvt) Ltd Semi 4,925 3,940 80.0 985 20.0
22 Kahatagaha Graphite Lanka Ltd Semi 123 103 83.7 20 16.3
23 Lanka Mineral Sands Ltd Semi 688 608 88.4 80 11.6
24 Lanka Salusala Ltd Semi 20 5 25.0 15 75.0
1 - Includes Regional Industrial Service Centers coming under the Ministry
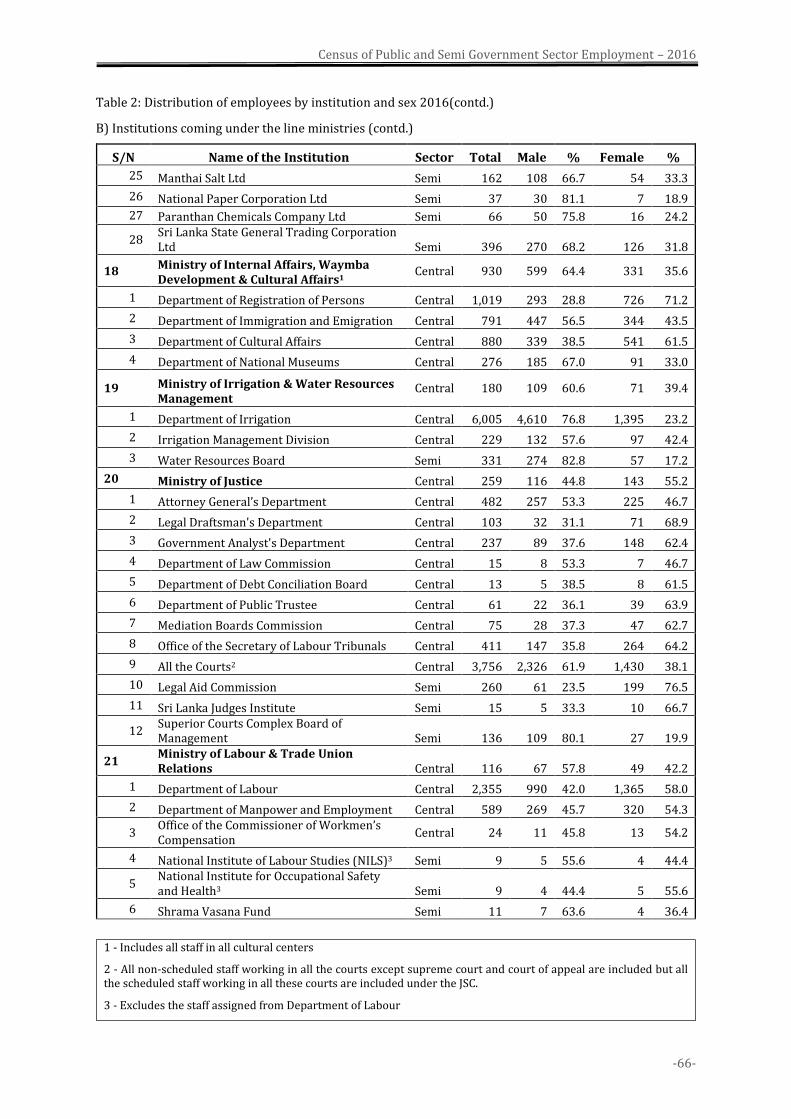
Census of Public and Semi Government Sector Employment – 2016
-66-
Table 2: Distribution of employees by institution and sex 2016(contd.)
B) Institutions coming under the line ministries (contd.)
S/N Name of the Institution Sector Total Male % Female %
25 Manthai Salt Ltd Semi 162 108 66.7 54 33.3
26 National Paper Corporation Ltd Semi 37 30 81.1 7 18.9
27 Paranthan Chemicals Company Ltd Semi 66 50 75.8 16 24.2
28 Sri Lanka State General Trading Corporation Ltd Semi 396 270 68.2 126 31.8
18 Ministry of Internal Affairs, Waymba Development & Cultural Affairs1
Central 930 599 64.4 331 35.6
1 Department of Registration of Persons Central 1,019 293 28.8 726 71.2
2 Department of Immigration and Emigration Central 791 447 56.5 344 43.5
3 Department of Cultural Affairs Central 880 339 38.5 541 61.5
4 Department of National Museums Central 276 185 67.0 91 33.0
19 Ministry of Irrigation & Water Resources Management
Central 180 109 60.6 71 39.4
1 Department of Irrigation Central 6,005 4,610 76.8 1,395 23.2
2 Irrigation Management Division Central 229 132 57.6 97 42.4
3 Water Resources Board Semi 331 274 82.8 57 17.2
20 Ministry of Justice Central 259 116 44.8 143 55.2
1 Attorney General’s Department Central 482 257 53.3 225 46.7
2 Legal Draftsman's Department Central 103 32 31.1 71 68.9
3 Government Analyst's Department Central 237 89 37.6 148 62.4
4 Department of Law Commission Central 15 8 53.3 7 46.7
5 Department of Debt Conciliation Board Central 13 5 38.5 8 61.5
6 Department of Public Trustee Central 61 22 36.1 39 63.9
7 Mediation Boards Commission Central 75 28 37.3 47 62.7
8 Office of the Secretary of Labour Tribunals Central 411 147 35.8 264 64.2
9 All the Courts2 Central 3,756 2,326 61.9 1,430 38.1
10 Legal Aid Commission Semi 260 61 23.5 199 76.5
11 Sri Lanka Judges Institute Semi 15 5 33.3 10 66.7
12 Superior Courts Complex Board of Management Semi 136 109 80.1 27 19.9
21 Ministry of Labour & Trade Union Relations Central 116 67 57.8 49 42.2
1 Department of Labour Central 2,355 990 42.0 1,365 58.0
2 Department of Manpower and Employment Central 589 269 45.7 320 54.3
3 Office of the Commissioner of Workmen’s Compensation
Central 24 11 45.8 13 54.2
4 National Institute of Labour Studies (NILS)3 Semi 9 5 55.6 4 44.4
5 National Institute for Occupational Safety and Health3 Semi 9 4 44.4 5 55.6
6 Shrama Vasana Fund Semi 11 7 63.6 4 36.4
1 - Includes all staff in all cultural centers
2 - All non-scheduled staff working in all the courts except supreme court and court of appeal are included but all the scheduled staff working in all these courts are included under the JSC.
3 - Excludes the staff assigned from Department of Labour
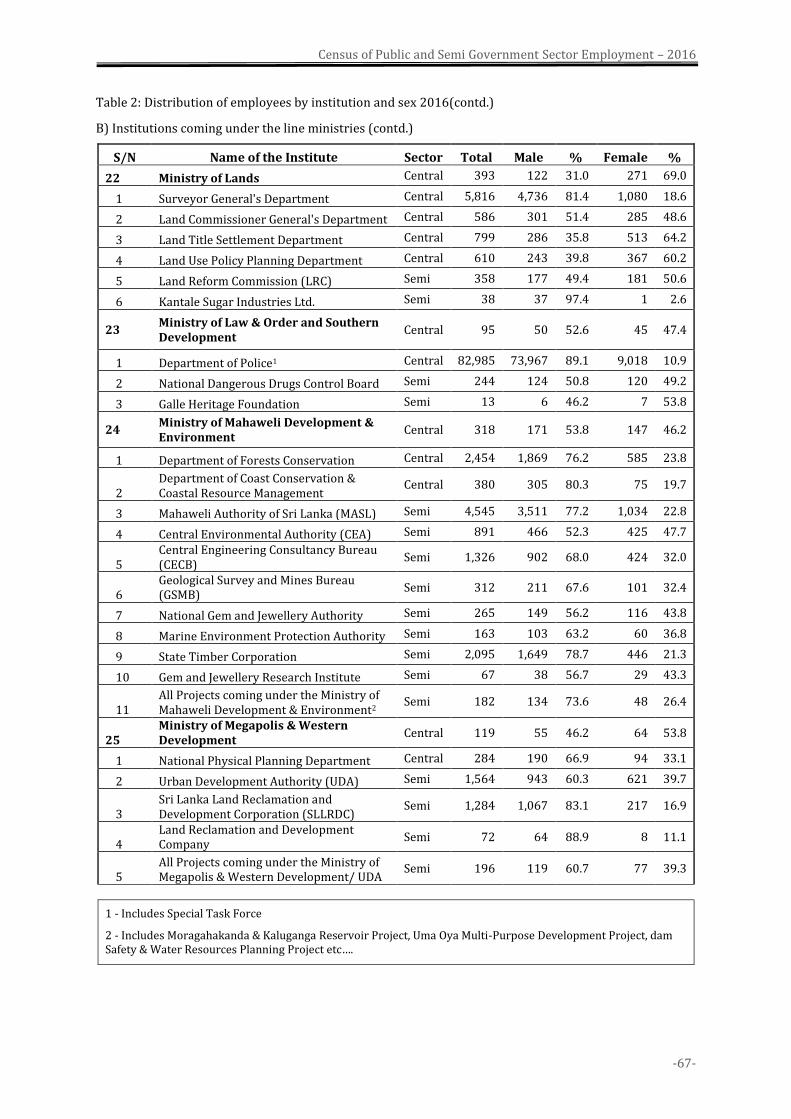
Census of Public and Semi Government Sector Employment – 2016
-67-
Table 2: Distribution of employees by institution and sex 2016(contd.)
B) Institutions coming under the line ministries (contd.)
S/N Name of the Institute Sector Total Male % Female %
22 Ministry of Lands Central 393 122 31.0 271 69.0
1 Surveyor General's Department Central 5,816 4,736 81.4 1,080 18.6
2 Land Commissioner General's Department Central 586 301 51.4 285 48.6
3 Land Title Settlement Department Central 799 286 35.8 513 64.2
4 Land Use Policy Planning Department Central 610 243 39.8 367 60.2
5 Land Reform Commission (LRC) Semi 358 177 49.4 181 50.6
6 Kantale Sugar Industries Ltd. Semi 38 37 97.4 1 2.6
23 Ministry of Law & Order and Southern Development
Central 95 50 52.6 45 47.4
1 Department of Police1 Central 82,985 73,967 89.1 9,018 10.9
2 National Dangerous Drugs Control Board Semi 244 124 50.8 120 49.2
3 Galle Heritage Foundation Semi 13 6 46.2 7 53.8
24 Ministry of Mahaweli Development & Environment
Central 318 171 53.8 147 46.2
1 Department of Forests Conservation Central 2,454 1,869 76.2 585 23.8
2 Department of Coast Conservation & Coastal Resource Management
Central 380 305 80.3 75 19.7
3 Mahaweli Authority of Sri Lanka (MASL) Semi 4,545 3,511 77.2 1,034 22.8
4 Central Environmental Authority (CEA) Semi 891 466 52.3 425 47.7
5 Central Engineering Consultancy Bureau (CECB)
Semi 1,326 902 68.0 424 32.0
6 Geological Survey and Mines Bureau (GSMB)
Semi 312 211 67.6 101 32.4
7 National Gem and Jewellery Authority Semi 265 149 56.2 116 43.8
8 Marine Environment Protection Authority Semi 163 103 63.2 60 36.8
9 State Timber Corporation Semi 2,095 1,649 78.7 446 21.3
10 Gem and Jewellery Research Institute Semi 67 38 56.7 29 43.3
11 All Projects coming under the Ministry of Mahaweli Development & Environment2
Semi 182 134 73.6 48 26.4
25 Ministry of Megapolis & Western Development
Central 119 55 46.2 64 53.8
1 National Physical Planning Department Central 284 190 66.9 94 33.1
2 Urban Development Authority (UDA) Semi 1,564 943 60.3 621 39.7
3 Sri Lanka Land Reclamation and Development Corporation (SLLRDC)
Semi 1,284 1,067 83.1 217 16.9
4 Land Reclamation and Development Company
Semi 72 64 88.9 8 11.1
5 All Projects coming under the Ministry of Megapolis & Western Development/ UDA
Semi 196 119 60.7 77 39.3
1 - Includes Special Task Force
2 - Includes Moragahakanda & Kaluganga Reservoir Project, Uma Oya Multi-Purpose Development Project, dam Safety & Water Resources Planning Project etc….
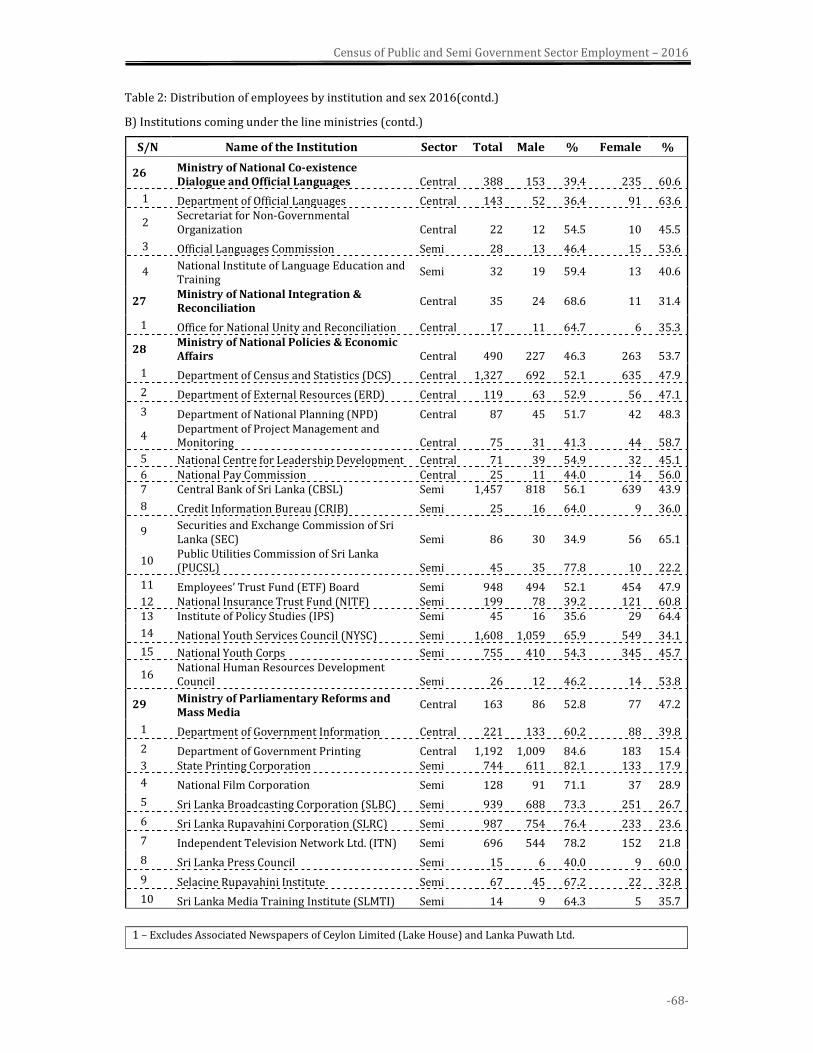
Census of Public and Semi Government Sector Employment – 2016
-68-
Table 2: Distribution of employees by institution and sex 2016(contd.)
B) Institutions coming under the line ministries (contd.)
S/N Name of the Institution Sector Total Male % Female %
26 Ministry of National Co-existence Dialogue and Official Languages Central 388 153 39.4 235 60.6
1 Department of Official Languages Central 143 52 36.4 91 63.6
2 Secretariat for Non-Governmental Organization Central 22 12 54.5 10 45.5
3 Official Languages Commission Semi 28 13 46.4 15 53.6
4 National Institute of Language Education and Training
Semi 32 19 59.4 13 40.6
27 Ministry of National Integration & Reconciliation
Central 35 24 68.6 11 31.4
1 Office for National Unity and Reconciliation Central 17 11 64.7 6 35.3
28 Ministry of National Policies & Economic Affairs Central 490 227 46.3 263 53.7
1 Department of Census and Statistics (DCS) Central 1,327 692 52.1 635 47.9
2 Department of External Resources (ERD) Central 119 63 52.9 56 47.1
3 Department of National Planning (NPD) Central 87 45 51.7 42 48.3
4 Department of Project Management and Monitoring Central 75 31 41.3 44 58.7
5 National Centre for Leadership Development Central 71 39 54.9 32 45.1 6 National Pay Commission Central 25 11 44.0 14 56.0 7 Central Bank of Sri Lanka (CBSL) Semi 1,457 818 56.1 639 43.9
8 Credit Information Bureau (CRIB) Semi 25 16 64.0 9 36.0
9 Securities and Exchange Commission of Sri Lanka (SEC) Semi 86 30 34.9 56 65.1
10 Public Utilities Commission of Sri Lanka (PUCSL) Semi 45 35 77.8 10 22.2
11 Employees’ Trust Fund (ETF) Board Semi 948 494 52.1 454 47.9 12 National Insurance Trust Fund (NITF) Semi 199 78 39.2 121 60.8 13 Institute of Policy Studies (IPS) Semi 45 16 35.6 29 64.4
14 National Youth Services Council (NYSC) Semi 1,608 1,059 65.9 549 34.1
15 National Youth Corps Semi 755 410 54.3 345 45.7
16 National Human Resources Development Council Semi 26 12 46.2 14 53.8
29 Ministry of Parliamentary Reforms and Mass Media
Central 163 86 52.8 77 47.2
1 Department of Government Information Central 221 133 60.2 88 39.8
2 Department of Government Printing Central 1,192 1,009 84.6 183 15.4 3 State Printing Corporation Semi 744 611 82.1 133 17.9
4 National Film Corporation Semi 128 91 71.1 37 28.9
5 Sri Lanka Broadcasting Corporation (SLBC) Semi 939 688 73.3 251 26.7
6 Sri Lanka Rupavahini Corporation (SLRC) Semi 987 754 76.4 233 23.6
7 Independent Television Network Ltd. (ITN) Semi 696 544 78.2 152 21.8
8 Sri Lanka Press Council Semi 15 6 40.0 9 60.0
9 Selacine Rupavahini Institute Semi 67 45 67.2 22 32.8
10 Sri Lanka Media Training Institute (SLMTI) Semi 14 9 64.3 5 35.7
1 – Excludes Associated Newspapers of Ceylon Limited (Lake House) and Lanka Puwath Ltd.
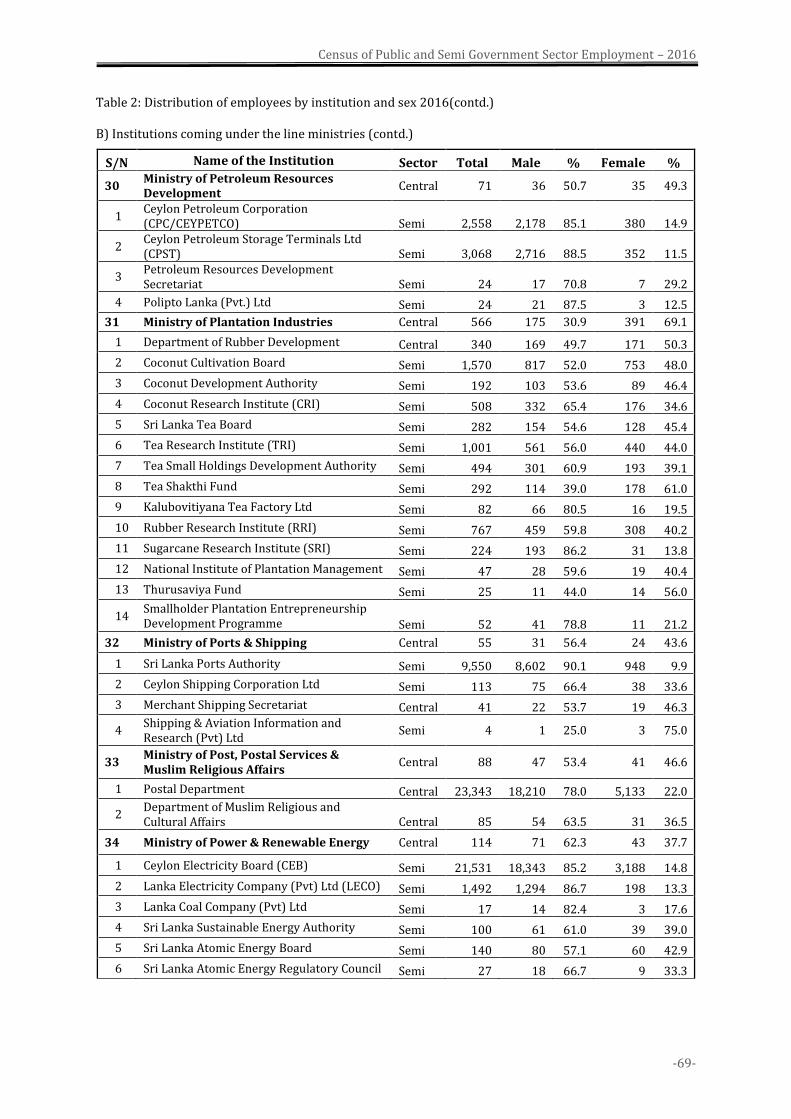
Census of Public and Semi Government Sector Employment – 2016
-69-
Table 2: Distribution of employees by institution and sex 2016(contd.)
B) Institutions coming under the line ministries (contd.)
S/N Name of the Institution Sector Total Male % Female %
30 Ministry of Petroleum Resources Development
Central 71 36 50.7 35 49.3
1 Ceylon Petroleum Corporation (CPC/CEYPETCO) Semi 2,558 2,178 85.1 380 14.9
2 Ceylon Petroleum Storage Terminals Ltd (CPST) Semi 3,068 2,716 88.5 352 11.5
3 Petroleum Resources Development Secretariat Semi 24 17 70.8 7 29.2
4 Polipto Lanka (Pvt.) Ltd Semi 24 21 87.5 3 12.5
31 Ministry of Plantation Industries Central 566 175 30.9 391 69.1
1 Department of Rubber Development Central 340 169 49.7 171 50.3
2 Coconut Cultivation Board Semi 1,570 817 52.0 753 48.0
3 Coconut Development Authority Semi 192 103 53.6 89 46.4
4 Coconut Research Institute (CRI) Semi 508 332 65.4 176 34.6
5 Sri Lanka Tea Board Semi 282 154 54.6 128 45.4
6 Tea Research Institute (TRI) Semi 1,001 561 56.0 440 44.0
7 Tea Small Holdings Development Authority Semi 494 301 60.9 193 39.1
8 Tea Shakthi Fund Semi 292 114 39.0 178 61.0
9 Kalubovitiyana Tea Factory Ltd Semi 82 66 80.5 16 19.5
10 Rubber Research Institute (RRI) Semi 767 459 59.8 308 40.2
11 Sugarcane Research Institute (SRI) Semi 224 193 86.2 31 13.8
12 National Institute of Plantation Management Semi 47 28 59.6 19 40.4
13 Thurusaviya Fund Semi 25 11 44.0 14 56.0
14 Smallholder Plantation Entrepreneurship Development Programme Semi 52 41 78.8 11 21.2
32 Ministry of Ports & Shipping Central 55 31 56.4 24 43.6
1 Sri Lanka Ports Authority Semi 9,550 8,602 90.1 948 9.9
2 Ceylon Shipping Corporation Ltd Semi 113 75 66.4 38 33.6
3 Merchant Shipping Secretariat Central 41 22 53.7 19 46.3
4 Shipping & Aviation Information and Research (Pvt) Ltd
Semi 4 1 25.0 3 75.0
33 Ministry of Post, Postal Services & Muslim Religious Affairs
Central 88 47 53.4 41 46.6
1 Postal Department Central 23,343 18,210 78.0 5,133 22.0
2 Department of Muslim Religious and Cultural Affairs Central 85 54 63.5 31 36.5
34 Ministry of Power & Renewable Energy Central 114 71 62.3 43 37.7
1 Ceylon Electricity Board (CEB) Semi 21,531 18,343 85.2 3,188 14.8
2 Lanka Electricity Company (Pvt) Ltd (LECO) Semi 1,492 1,294 86.7 198 13.3
3 Lanka Coal Company (Pvt) Ltd Semi 17 14 82.4 3 17.6
4 Sri Lanka Sustainable Energy Authority Semi 100 61 61.0 39 39.0
5 Sri Lanka Atomic Energy Board Semi 140 80 57.1 60 42.9
6 Sri Lanka Atomic Energy Regulatory Council Semi 27 18 66.7 9 33.3
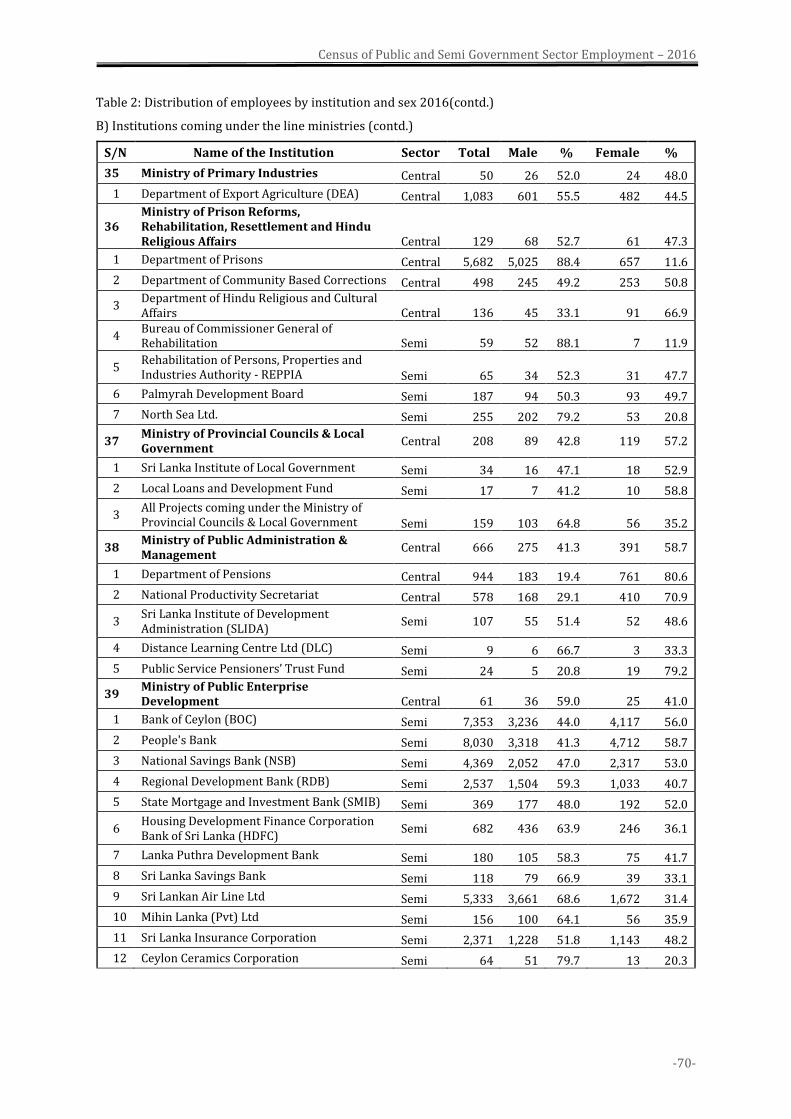
Census of Public and Semi Government Sector Employment – 2016
-70-
Table 2: Distribution of employees by institution and sex 2016(contd.)
B) Institutions coming under the line ministries (contd.)
S/N Name of the Institution Sector Total Male % Female %
35 Ministry of Primary Industries Central 50 26 52.0 24 48.0
1 Department of Export Agriculture (DEA) Central 1,083 601 55.5 482 44.5
36 Ministry of Prison Reforms, Rehabilitation, Resettlement and Hindu Religious Affairs Central 129 68 52.7 61 47.3
1 Department of Prisons Central 5,682 5,025 88.4 657 11.6
2 Department of Community Based Corrections Central 498 245 49.2 253 50.8
3 Department of Hindu Religious and Cultural Affairs Central 136 45 33.1 91 66.9
4 Bureau of Commissioner General of Rehabilitation Semi 59 52 88.1 7 11.9
5 Rehabilitation of Persons, Properties and Industries Authority - REPPIA Semi 65 34 52.3 31 47.7
6 Palmyrah Development Board Semi 187 94 50.3 93 49.7
7 North Sea Ltd. Semi 255 202 79.2 53 20.8
37 Ministry of Provincial Councils & Local Government
Central 208 89 42.8 119 57.2
1 Sri Lanka Institute of Local Government Semi 34 16 47.1 18 52.9
2 Local Loans and Development Fund Semi 17 7 41.2 10 58.8
3 All Projects coming under the Ministry of Provincial Councils & Local Government Semi 159 103 64.8 56 35.2
38 Ministry of Public Administration & Management
Central 666 275 41.3 391 58.7
1 Department of Pensions Central 944 183 19.4 761 80.6
2 National Productivity Secretariat Central 578 168 29.1 410 70.9
3 Sri Lanka Institute of Development Administration (SLIDA)
Semi 107 55 51.4 52 48.6
4 Distance Learning Centre Ltd (DLC) Semi 9 6 66.7 3 33.3
5 Public Service Pensioners’ Trust Fund Semi 24 5 20.8 19 79.2
39 Ministry of Public Enterprise Development Central 61 36 59.0 25 41.0
1 Bank of Ceylon (BOC) Semi 7,353 3,236 44.0 4,117 56.0
2 People's Bank Semi 8,030 3,318 41.3 4,712 58.7
3 National Savings Bank (NSB) Semi 4,369 2,052 47.0 2,317 53.0
4 Regional Development Bank (RDB) Semi 2,537 1,504 59.3 1,033 40.7
5 State Mortgage and Investment Bank (SMIB) Semi 369 177 48.0 192 52.0
6 Housing Development Finance Corporation Bank of Sri Lanka (HDFC)
Semi 682 436 63.9 246 36.1
7 Lanka Puthra Development Bank Semi 180 105 58.3 75 41.7
8 Sri Lanka Savings Bank Semi 118 79 66.9 39 33.1
9 Sri Lankan Air Line Ltd Semi 5,333 3,661 68.6 1,672 31.4
10 Mihin Lanka (Pvt) Ltd Semi 156 100 64.1 56 35.9
11 Sri Lanka Insurance Corporation Semi 2,371 1,228 51.8 1,143 48.2
12 Ceylon Ceramics Corporation Semi 64 51 79.7 13 20.3
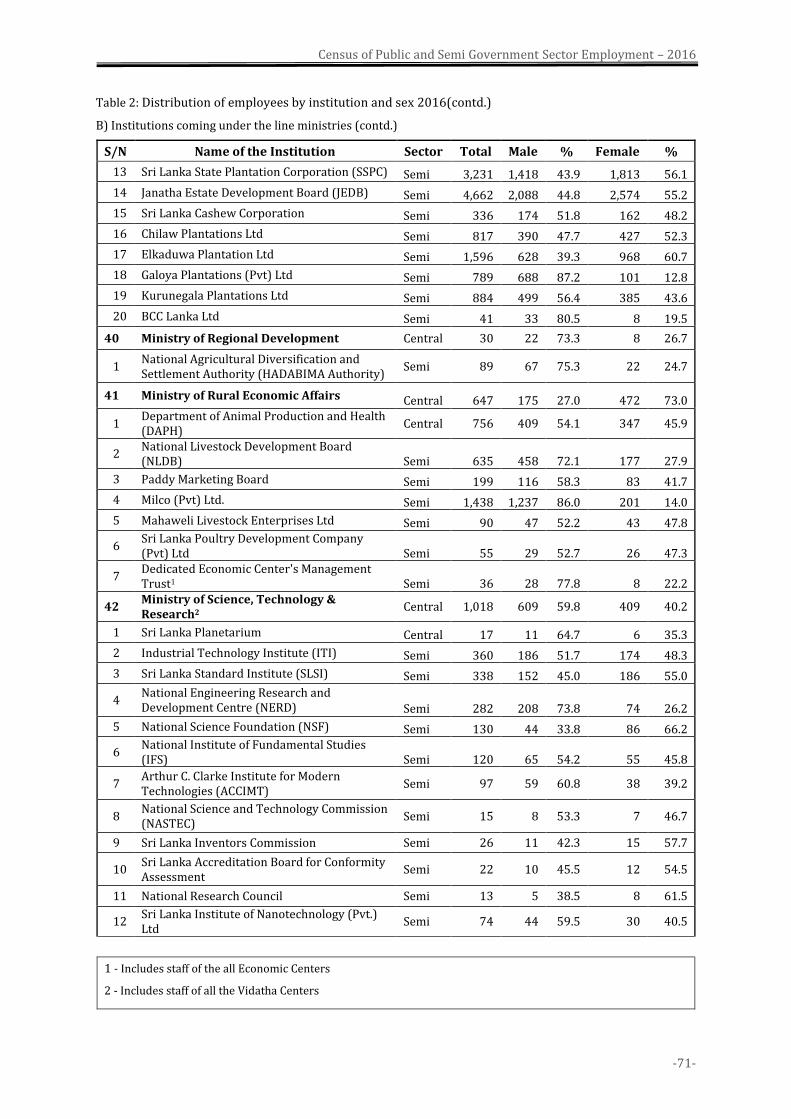
Census of Public and Semi Government Sector Employment – 2016
-71-
Table 2: Distribution of employees by institution and sex 2016(contd.)
B) Institutions coming under the line ministries (contd.)
S/N Name of the Institution Sector Total Male % Female %
13 Sri Lanka State Plantation Corporation (SSPC) Semi 3,231 1,418 43.9 1,813 56.1
14 Janatha Estate Development Board (JEDB) Semi 4,662 2,088 44.8 2,574 55.2
15 Sri Lanka Cashew Corporation Semi 336 174 51.8 162 48.2
16 Chilaw Plantations Ltd Semi 817 390 47.7 427 52.3
17 Elkaduwa Plantation Ltd Semi 1,596 628 39.3 968 60.7
18 Galoya Plantations (Pvt) Ltd Semi 789 688 87.2 101 12.8
19 Kurunegala Plantations Ltd Semi 884 499 56.4 385 43.6
20 BCC Lanka Ltd Semi 41 33 80.5 8 19.5
40 Ministry of Regional Development Central 30 22 73.3 8 26.7
1 National Agricultural Diversification and Settlement Authority (HADABIMA Authority)
Semi 89 67 75.3 22 24.7
41 Ministry of Rural Economic Affairs Central 647 175 27.0 472 73.0
1 Department of Animal Production and Health (DAPH)
Central 756 409 54.1 347 45.9
2 National Livestock Development Board (NLDB) Semi 635 458 72.1 177 27.9
3 Paddy Marketing Board Semi 199 116 58.3 83 41.7
4 Milco (Pvt) Ltd. Semi 1,438 1,237 86.0 201 14.0
5 Mahaweli Livestock Enterprises Ltd Semi 90 47 52.2 43 47.8
6 Sri Lanka Poultry Development Company (Pvt) Ltd Semi 55 29 52.7 26 47.3
7 Dedicated Economic Center's Management Trust1 Semi 36 28 77.8 8 22.2
42 Ministry of Science, Technology & Research2
Central 1,018 609 59.8 409 40.2
1 Sri Lanka Planetarium Central 17 11 64.7 6 35.3
2 Industrial Technology Institute (ITI) Semi 360 186 51.7 174 48.3
3 Sri Lanka Standard Institute (SLSI) Semi 338 152 45.0 186 55.0
4 National Engineering Research and Development Centre (NERD) Semi 282 208 73.8 74 26.2
5 National Science Foundation (NSF) Semi 130 44 33.8 86 66.2
6 National Institute of Fundamental Studies (IFS) Semi 120 65 54.2 55 45.8
7 Arthur C. Clarke Institute for Modern Technologies (ACCIMT)
Semi 97 59 60.8 38 39.2
8 National Science and Technology Commission (NASTEC)
Semi 15 8 53.3 7 46.7
9 Sri Lanka Inventors Commission Semi 26 11 42.3 15 57.7
10 Sri Lanka Accreditation Board for Conformity Assessment
Semi 22 10 45.5 12 54.5
11 National Research Council Semi 13 5 38.5 8 61.5
12 Sri Lanka Institute of Nanotechnology (Pvt.) Ltd
Semi 74 44 59.5 30 40.5
1 - Includes staff of the all Economic Centers
2 - Includes staff of all the Vidatha Centers
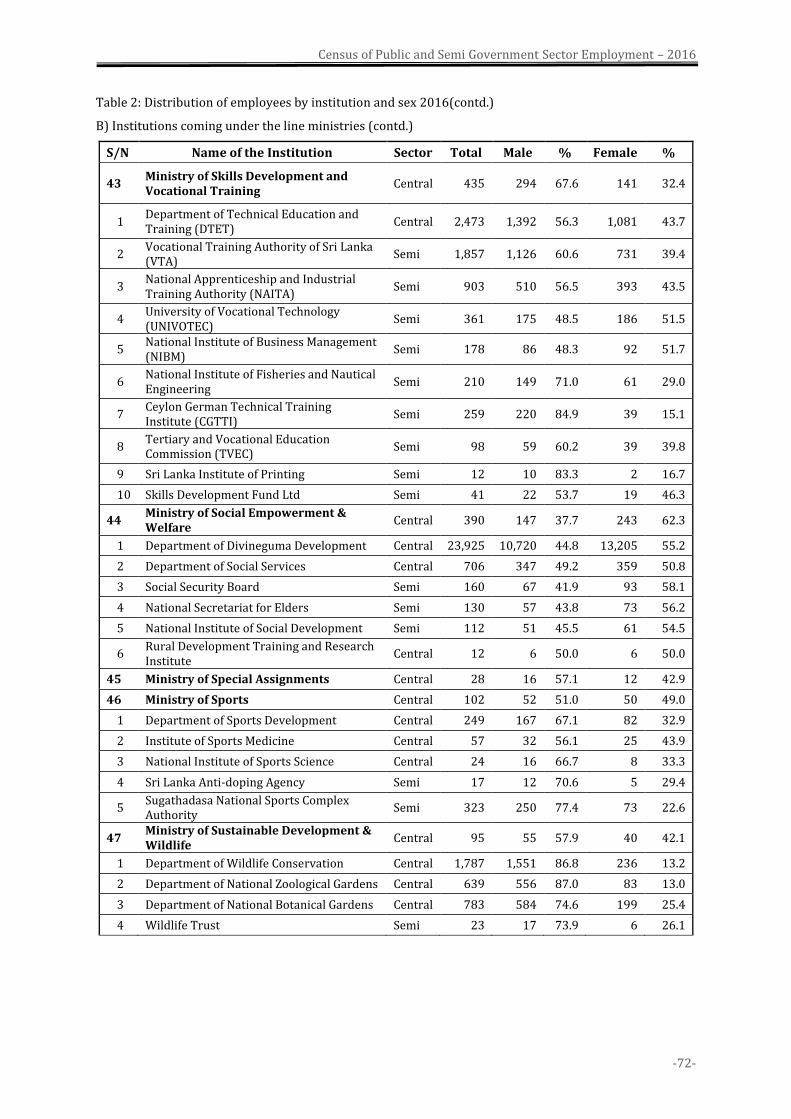
Census of Public and Semi Government Sector Employment – 2016
-72-
Table 2: Distribution of employees by institution and sex 2016(contd.)
B) Institutions coming under the line ministries (contd.)
S/N Name of the Institution Sector Total Male % Female %
43 Ministry of Skills Development and Vocational Training
Central 435 294 67.6 141 32.4
1 Department of Technical Education and Training (DTET)
Central 2,473 1,392 56.3 1,081 43.7
2 Vocational Training Authority of Sri Lanka (VTA)
Semi 1,857 1,126 60.6 731 39.4
3 National Apprenticeship and Industrial Training Authority (NAITA)
Semi 903 510 56.5 393 43.5
4 University of Vocational Technology (UNIVOTEC)
Semi 361 175 48.5 186 51.5
5 National Institute of Business Management (NIBM)
Semi 178 86 48.3 92 51.7
6 National Institute of Fisheries and Nautical Engineering
Semi 210 149 71.0 61 29.0
7 Ceylon German Technical Training Institute (CGTTI)
Semi 259 220 84.9 39 15.1
8 Tertiary and Vocational Education Commission (TVEC)
Semi 98 59 60.2 39 39.8
9 Sri Lanka Institute of Printing Semi 12 10 83.3 2 16.7
10 Skills Development Fund Ltd Semi 41 22 53.7 19 46.3
44 Ministry of Social Empowerment & Welfare
Central 390 147 37.7 243 62.3
1 Department of Divineguma Development Central 23,925 10,720 44.8 13,205 55.2
2 Department of Social Services Central 706 347 49.2 359 50.8
3 Social Security Board Semi 160 67 41.9 93 58.1
4 National Secretariat for Elders Semi 130 57 43.8 73 56.2
5 National Institute of Social Development Semi 112 51 45.5 61 54.5
6 Rural Development Training and Research Institute
Central 12 6 50.0 6 50.0
45 Ministry of Special Assignments Central 28 16 57.1 12 42.9
46 Ministry of Sports Central 102 52 51.0 50 49.0
1 Department of Sports Development Central 249 167 67.1 82 32.9
2 Institute of Sports Medicine Central 57 32 56.1 25 43.9
3 National Institute of Sports Science Central 24 16 66.7 8 33.3
4 Sri Lanka Anti-doping Agency Semi 17 12 70.6 5 29.4
5 Sugathadasa National Sports Complex Authority
Semi 323 250 77.4 73 22.6
47 Ministry of Sustainable Development & Wildlife
Central 95 55 57.9 40 42.1
1 Department of Wildlife Conservation Central 1,787 1,551 86.8 236 13.2
2 Department of National Zoological Gardens Central 639 556 87.0 83 13.0
3 Department of National Botanical Gardens Central 783 584 74.6 199 25.4
4 Wildlife Trust Semi 23 17 73.9 6 26.1
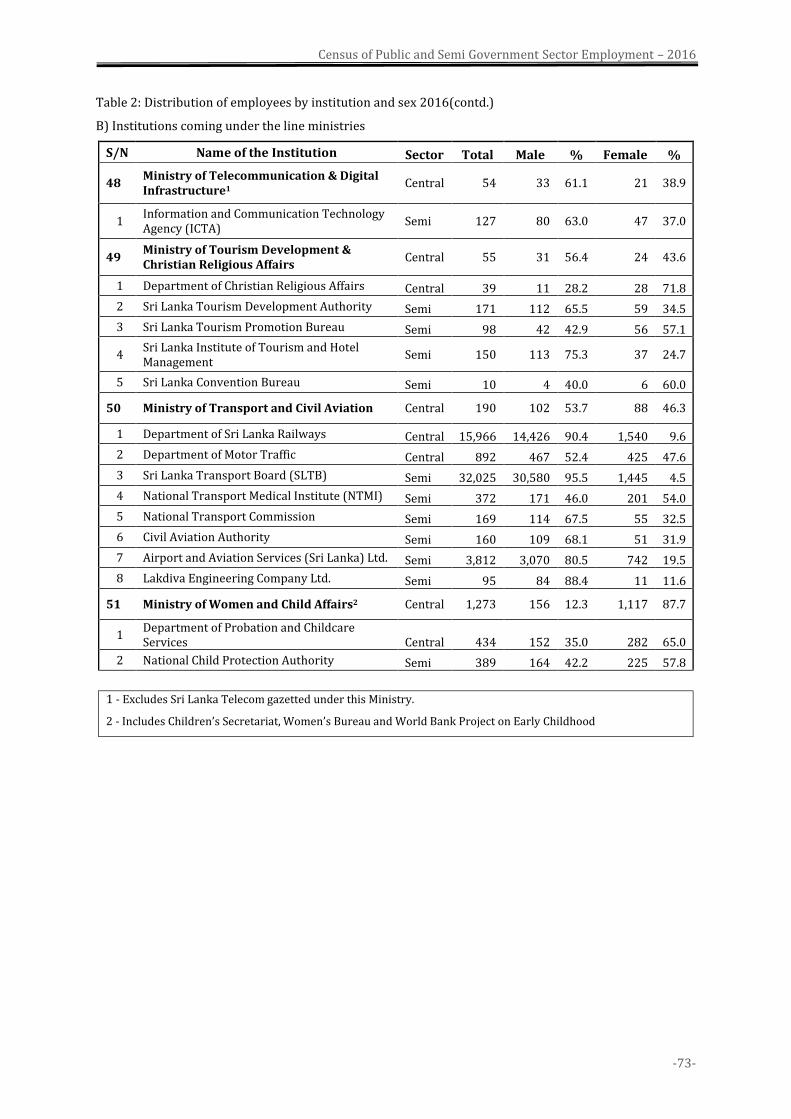
Census of Public and Semi Government Sector Employment – 2016
-73-
Table 2: Distribution of employees by institution and sex 2016(contd.)
B) Institutions coming under the line ministries
S/N Name of the Institution Sector Total Male % Female %
48 Ministry of Telecommunication & Digital Infrastructure1
Central 54 33 61.1 21 38.9
1 Information and Communication Technology Agency (ICTA)
Semi 127 80 63.0 47 37.0
49 Ministry of Tourism Development & Christian Religious Affairs
Central 55 31 56.4 24 43.6
1 Department of Christian Religious Affairs Central 39 11 28.2 28 71.8
2 Sri Lanka Tourism Development Authority Semi 171 112 65.5 59 34.5
3 Sri Lanka Tourism Promotion Bureau Semi 98 42 42.9 56 57.1
4 Sri Lanka Institute of Tourism and Hotel Management
Semi 150 113 75.3 37 24.7
5 Sri Lanka Convention Bureau Semi 10 4 40.0 6 60.0
50 Ministry of Transport and Civil Aviation Central 190 102 53.7 88 46.3
1 Department of Sri Lanka Railways Central 15,966 14,426 90.4 1,540 9.6
2 Department of Motor Traffic Central 892 467 52.4 425 47.6
3 Sri Lanka Transport Board (SLTB) Semi 32,025 30,580 95.5 1,445 4.5
4 National Transport Medical Institute (NTMI) Semi 372 171 46.0 201 54.0
5 National Transport Commission Semi 169 114 67.5 55 32.5
6 Civil Aviation Authority Semi 160 109 68.1 51 31.9
7 Airport and Aviation Services (Sri Lanka) Ltd. Semi 3,812 3,070 80.5 742 19.5
8 Lakdiva Engineering Company Ltd. Semi 95 84 88.4 11 11.6
51 Ministry of Women and Child Affairs2 Central 1,273 156 12.3 1,117 87.7
1 Department of Probation and Childcare Services Central 434 152 35.0 282 65.0
2 National Child Protection Authority Semi 389 164 42.2 225 57.8
1 - Excludes Sri Lanka Telecom gazetted under this Ministry.
2 - Includes Children’s Secretariat, Women’s Bureau and World Bank Project on Early Childhood
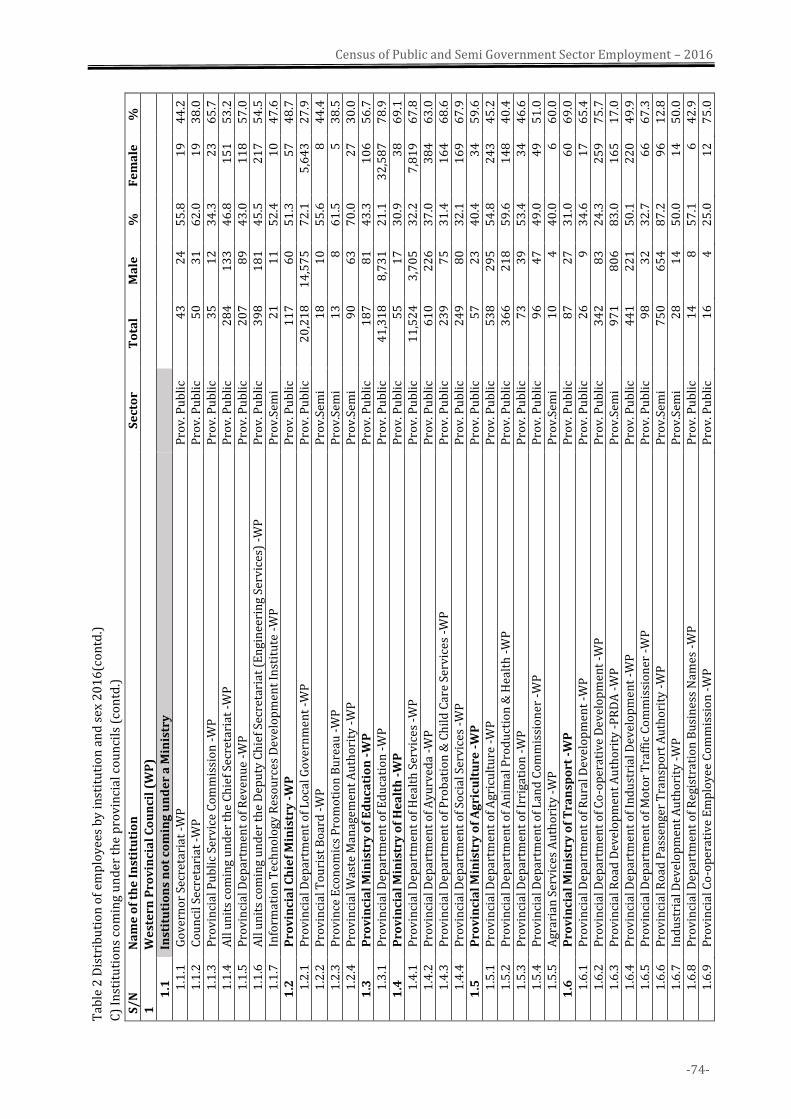
-74-
Census of Public and Semi Government Sector Employment – 2016
T
able
2 D
istr
ibu
tio
n o
f em
plo
yee
s b
y in
stit
uti
on
an
d s
ex 2
01
6(c
on
td.)
C)
Inst
itu
tio
ns
com
ing
un
der
th
e p
rov
inci
al c
ou
nci
ls (
con
td.)
S/
N
Na
me
of
the
In
stit
uti
on
S
ect
or
To
tal
Ma
le
%
Fe
ma
le
%
1
We
ste
rn P
rov
inci
al
Co
un
cil
(WP
)
1.1
In
stit
uti
on
s n
ot
com
ing
un
de
r a
Min
istr
y
1.1
.1
Go
ver
no
r Se
cret
aria
t -W
P
Pro
v. P
ub
lic
43
2
4
55
.8
19
4
4.2
1
.1.2
C
ou
nci
l Sec
reta
riat
-W
P
Pro
v. P
ub
lic
50
3
1
62
.0
19
3
8.0
1
.1.3
P
rov
inci
al P
ub
lic
Serv
ice
Co
mm
issi
on
-W
P
Pro
v. P
ub
lic
35
1
2
34
.3
23
6
5.7
1
.1.4
A
ll u
nit
s co
min
g u
nd
er t
he
Ch
ief
Secr
etar
iat
-WP
P
rov
. Pu
bli
c 2
84
1
33
4
6.8
1
51
5
3.2
1
.1.5
P
rov
inci
al D
epar
tmen
t o
f R
even
ue
-WP
P
rov
. Pu
bli
c 2
07
8
9
43
.0
11
8
57
.0
1.1
.6
All
un
its
com
ing
un
der
th
e D
epu
ty C
hie
f Se
cret
aria
t (E
ngi
nee
rin
g Se
rvic
es)
-WP
P
rov
. Pu
bli
c 3
98
1
81
4
5.5
2
17
5
4.5
1
.1.7
I
nfo
rmat
ion
Tec
hn
olo
gy R
eso
urc
es D
evel
op
men
t In
stit
ute
-W
P
Pro
v.S
emi
21
1
1
52
.4
10
4
7.6
1
.2
Pro
vin
cia
l C
hie
f M
inis
try
-W
P
Pro
v. P
ub
lic
11
7
60
5
1.3
5
7
48
.7
1.2
.1
Pro
vin
cial
Dep
artm
ent
of
Lo
cal G
ov
ern
men
t -W
P
Pro
v. P
ub
lic
20
,21
8
14
,57
5
72
.1
5,6
43
2
7.9
1
.2.2
P
rov
inci
al T
ou
rist
Bo
ard
-W
P
Pro
v.S
emi
18
1
0
55
.6
8
44
.4
1.2
.3
Pro
vin
ce E
con
om
ics
Pro
mo
tio
n B
ure
au -
WP
P
rov
.Sem
i 1
3
8
61
.5
5
38
.5
1.2
.4
Pro
vin
cial
Was
te M
anag
emen
t A
uth
ori
ty -
WP
P
rov
.Sem
i 9
0
63
7
0.0
2
7
30
.0
1.3
P
rov
inci
al
Min
istr
y o
f E
du
cati
on
-W
P
Pro
v. P
ub
lic
18
7
81
4
3.3
1
06
5
6.7
1
.3.1
P
rov
inci
al D
epar
tmen
t o
f E
du
cati
on
-W
P
Pro
v. P
ub
lic
41
,31
8
8,7
31
2
1.1
3
2,5
87
7
8.9
1
.4
Pro
vin
cia
l M
inis
try
of
He
alt
h -
WP
P
rov
. Pu
bli
c 5
5
17
3
0.9
3
8
69
.1
1.4
.1
Pro
vin
cial
Dep
artm
ent
of
Hea
lth
Ser
vic
es -
WP
P
rov
. Pu
bli
c 1
1,5
24
3
,70
5
32
.2
7,8
19
6
7.8
1
.4.2
P
rov
inci
al D
epar
tmen
t o
f A
yu
rved
a -W
P
Pro
v. P
ub
lic
61
0
22
6
37
.0
38
4
63
.0
1.4
.3
Pro
vin
cial
Dep
artm
ent
of
Pro
bat
ion
& C
hil
d C
are
Serv
ices
-W
P
Pro
v. P
ub
lic
23
9
75
3
1.4
1
64
6
8.6
1
.4.4
P
rov
inci
al D
epar
tmen
t o
f So
cial
Ser
vic
es -
WP
P
rov
. Pu
bli
c 2
49
8
0
32
.1
16
9
67
.9
1.5
P
rov
inci
al
Min
istr
y o
f A
gri
cult
ure
-W
P
Pro
v. P
ub
lic
57
2
3
40
.4
34
5
9.6
1
.5.1
P
rov
inci
al D
epar
tmen
t o
f A
gric
ult
ure
-W
P
Pro
v. P
ub
lic
53
8
29
5
54
.8
24
3
45
.2
1.5
.2
Pro
vin
cial
Dep
artm
ent
of
An
imal
Pro
du
ctio
n &
Hea
lth
-W
P
Pro
v. P
ub
lic
36
6
21
8
59
.6
14
8
40
.4
1.5
.3
Pro
vin
cial
Dep
artm
ent
of
Irri
gati
on
-W
P
Pro
v. P
ub
lic
73
3
9
53
.4
34
4
6.6
1
.5.4
P
rov
inci
al D
epar
tmen
t o
f L
and
Co
mm
issi
on
er -
WP
P
rov
. Pu
bli
c 9
6
47
4
9.0
4
9
51
.0
1.5
.5
Agr
aria
n S
erv
ices
Au
tho
rity
-W
P
Pro
v.S
emi
10
4
4
0.0
6
6
0.0
1
.6
Pro
vin
cia
l M
inis
try
of
Tra
nsp
ort
-W
P
Pro
v. P
ub
lic
87
2
7
31
.0
60
6
9.0
1
.6.1
P
rov
inci
al D
epar
tmen
t o
f R
ura
l Dev
elo
pm
ent
-WP
P
rov
. Pu
bli
c 2
6
9
34
.6
17
6
5.4
1
.6.2
P
rov
inci
al D
epar
tmen
t o
f C
o-o
per
ativ
e D
evel
op
men
t -W
P
Pro
v. P
ub
lic
34
2
83
2
4.3
2
59
7
5.7
1
.6.3
P
rov
inci
al R
oad
Dev
elo
pm
ent
Au
tho
rity
-P
RD
A -
WP
P
rov
.Sem
i 9
71
8
06
8
3.0
1
65
1
7.0
1
.6.4
P
rov
inci
al D
epar
tmen
t o
f In
du
stri
al D
evel
op
men
t -W
P
Pro
v. P
ub
lic
44
1
22
1
50
.1
22
0
49
.9
1.6
.5
Pro
vin
cial
Dep
artm
ent
of
Mo
tor
Tra
ffic
Co
mm
issi
on
er -
WP
P
rov
. Pu
bli
c 9
8
32
3
2.7
6
6
67
.3
1.6
.6
Pro
vin
cial
Ro
ad P
asse
nge
r T
ran
spo
rt A
uth
ori
ty -
WP
P
rov
.Sem
i 7
50
6
54
8
7.2
9
6
12
.8
1.6
.7
In
du
stri
al D
evel
op
men
t A
uth
ori
ty -
WP
P
rov
.Sem
i 2
8
14
5
0.0
1
4
50
.0
1.6
.8
Pro
vin
cial
Dep
artm
ent
of
Reg
istr
atio
n B
usi
nes
s N
ames
-W
P
Pro
v. P
ub
lic
14
8
5
7.1
6
4
2.9
1
.6.9
P
rov
inci
al C
o-o
per
ativ
e E
mp
loy
ee C
om
mis
sio
n -
WP
P
rov
. Pu
bli
c 1
6
4
25
.0
12
7
5.0
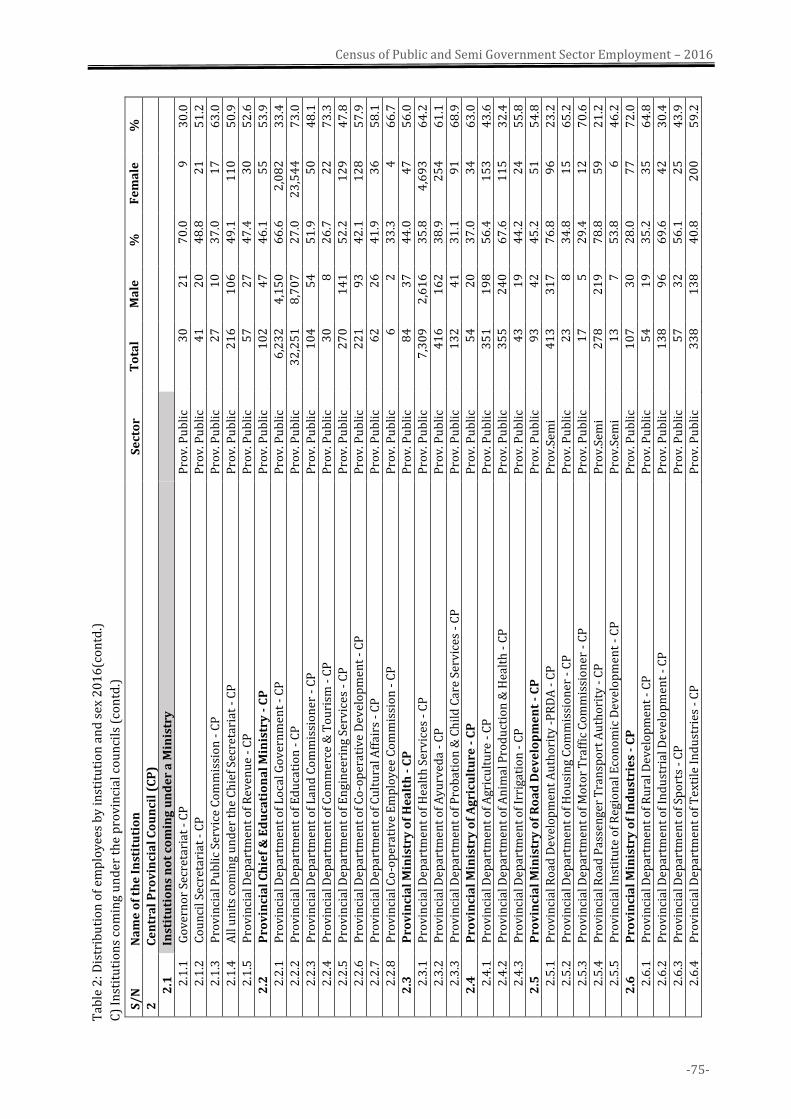
-75-
Census of Public and Semi Government Sector Employment – 2016
T
able
2: D
istr
ibu
tio
n o
f em
plo
yee
s b
y in
stit
uti
on
an
d s
ex 2
01
6(c
on
td.)
C)
Inst
itu
tio
ns
com
ing
un
der
th
e p
rov
inci
al c
ou
nci
ls (
con
td.)
S/
N
Na
me
of
the
In
stit
uti
on
S
ect
or
To
tal
Ma
le
%
Fe
ma
le
%
2
Ce
ntr
al
Pro
vin
cia
l C
ou
nci
l (C
P)
2.1
In
stit
uti
on
s n
ot
com
ing
un
de
r a
Min
istr
y
2.1
.1
Go
ver
no
r Se
cret
aria
t -
CP
P
rov
. Pu
bli
c 3
0
21
7
0.0
9
3
0.0
2.1
.2
Co
un
cil S
ecre
tari
at -
CP
P
rov
. Pu
bli
c 4
1
20
4
8.8
2
1
51
.2
2.1
.3
Pro
vin
cial
Pu
bli
c Se
rvic
e C
om
mis
sio
n -
CP
P
rov
. Pu
bli
c 2
7
10
3
7.0
1
7
63
.0
2.1
.4
All
un
its
com
ing
un
der
th
e C
hie
f Se
cret
aria
t -
CP
P
rov
. Pu
bli
c 2
16
1
06
4
9.1
1
10
5
0.9
2.1
.5
Pro
vin
cial
Dep
artm
ent
of
Rev
enu
e -
CP
P
rov
. Pu
bli
c 5
7
27
4
7.4
3
0
52
.6
2.2
P
rov
inci
al
Ch
ief
& E
du
cati
on
al
Min
istr
y -
CP
P
rov
. Pu
bli
c 1
02
4
7
46
.1
55
5
3.9
2.2
.1
Pro
vin
cial
Dep
artm
ent
of
Lo
cal G
ov
ern
men
t -
CP
P
rov
. Pu
bli
c 6
,23
2
4,1
50
6
6.6
2
,08
2
33
.4
2.2
.2
Pro
vin
cial
Dep
artm
ent
of
Ed
uca
tio
n -
CP
P
rov
. Pu
bli
c 3
2,2
51
8
,70
7
27
.0
23
,54
4
73
.0
2.2
.3
Pro
vin
cial
Dep
artm
ent
of
Lan
d C
om
mis
sio
ner
- C
P
Pro
v. P
ub
lic
10
4
54
5
1.9
5
0
48
.1
2.2
.4
Pro
vin
cial
Dep
artm
ent
of
Co
mm
erce
& T
ou
rism
- C
P
Pro
v. P
ub
lic
30
8
2
6.7
2
2
73
.3
2.2
.5
Pro
vin
cial
Dep
artm
ent
of
En
gin
eeri
ng
Serv
ices
- C
P
Pro
v. P
ub
lic
27
0
14
1
52
.2
12
9
47
.8
2.2
.6
Pro
vin
cial
Dep
artm
ent
of
Co
-op
erat
ive
Dev
elo
pm
ent
- C
P
Pro
v. P
ub
lic
22
1
93
4
2.1
1
28
5
7.9
2.2
.7
Pro
vin
cial
Dep
artm
ent
of
Cu
ltu
ral A
ffai
rs -
CP
P
rov
. Pu
bli
c 6
2
26
4
1.9
3
6
58
.1
2.2
.8
Pro
vin
cial
Co
-op
erat
ive
Em
plo
yee
Co
mm
issi
on
- C
P
Pro
v. P
ub
lic
6
2
33
.3
4
66
.7
2.3
P
rov
inci
al
Min
istr
y o
f H
ea
lth
- C
P
Pro
v. P
ub
lic
84
3
7
44
.0
47
5
6.0
2.3
.1
Pro
vin
cial
Dep
artm
ent
of
Hea
lth
Ser
vic
es -
CP
P
rov
. Pu
bli
c 7
,30
9
2,6
16
3
5.8
4
,69
3
64
.2
2.3
.2
Pro
vin
cial
Dep
artm
ent
of
Ay
urv
eda
- C
P
Pro
v. P
ub
lic
41
6
16
2
38
.9
25
4
61
.1
2.3
.3
Pro
vin
cial
Dep
artm
ent
of
Pro
bat
ion
& C
hil
d C
are
Serv
ices
- C
P
Pro
v. P
ub
lic
13
2
41
3
1.1
9
1
68
.9
2.4
P
rov
inci
al
Min
istr
y o
f A
gri
cult
ure
- C
P
Pro
v. P
ub
lic
54
2
0
37
.0
34
6
3.0
2.4
.1
Pro
vin
cial
Dep
artm
ent
of
Agr
icu
ltu
re -
CP
P
rov
. Pu
bli
c 3
51
1
98
5
6.4
1
53
4
3.6
2.4
.2
Pro
vin
cial
Dep
artm
ent
of
An
imal
Pro
du
ctio
n &
Hea
lth
- C
P
Pro
v. P
ub
lic
35
5
24
0
67
.6
11
5
32
.4
2.4
.3
Pro
vin
cial
Dep
artm
ent
of
Irri
gati
on
- C
P
Pro
v. P
ub
lic
43
1
9
44
.2
24
5
5.8
2.5
P
rov
inci
al
Min
istr
y o
f R
oa
d D
ev
elo
pm
en
t -
CP
P
rov
. Pu
bli
c 9
3
42
4
5.2
5
1
54
.8
2.5
.1
Pro
vin
cial
Ro
ad D
evel
op
men
t A
uth
ori
ty -
PR
DA
- C
P
Pro
v.S
emi
41
3
31
7
76
.8
96
2
3.2
2.5
.2
Pro
vin
cial
Dep
artm
ent
of
Ho
usi
ng
Co
mm
issi
on
er -
CP
P
rov
. Pu
bli
c 2
3
8
34
.8
15
6
5.2
2.5
.3
Pro
vin
cial
Dep
artm
ent
of
Mo
tor
Tra
ffic
Co
mm
issi
on
er -
CP
P
rov
. Pu
bli
c 1
7
5
29
.4
12
7
0.6
2.5
.4
Pro
vin
cial
Ro
ad P
asse
nge
r T
ran
spo
rt A
uth
ori
ty -
CP
P
rov
.Sem
i 2
78
2
19
7
8.8
5
9
21
.2
2.5
.5
Pro
vin
cial
In
stit
ute
of
Reg
ion
al E
con
om
ic D
evel
op
men
t -
CP
P
rov
.Sem
i 1
3
7
53
.8
6
46
.2
2.6
P
rov
inci
al
Min
istr
y o
f In
du
stri
es
- C
P
Pro
v. P
ub
lic
10
7
30
2
8.0
7
7
72
.0
2.6
.1
Pro
vin
cial
Dep
artm
ent
of
Ru
ral D
evel
op
men
t -
CP
P
rov
. Pu
bli
c 5
4
19
3
5.2
3
5
64
.8
2.6
.2
Pro
vin
cial
Dep
artm
ent
of
Ind
ust
rial
Dev
elo
pm
ent
- C
P
Pro
v. P
ub
lic
13
8
96
6
9.6
4
2
30
.4
2.6
.3
Pro
vin
cial
Dep
artm
ent
of
Spo
rts
- C
P
Pro
v. P
ub
lic
57
3
2
56
.1
25
4
3.9
2.6
.4
Pro
vin
cial
Dep
artm
ent
of
Tex
tile
In
du
stri
es -
CP
P
rov
. Pu
bli
c 3
38
1
38
4
0.8
2
00
5
9.2
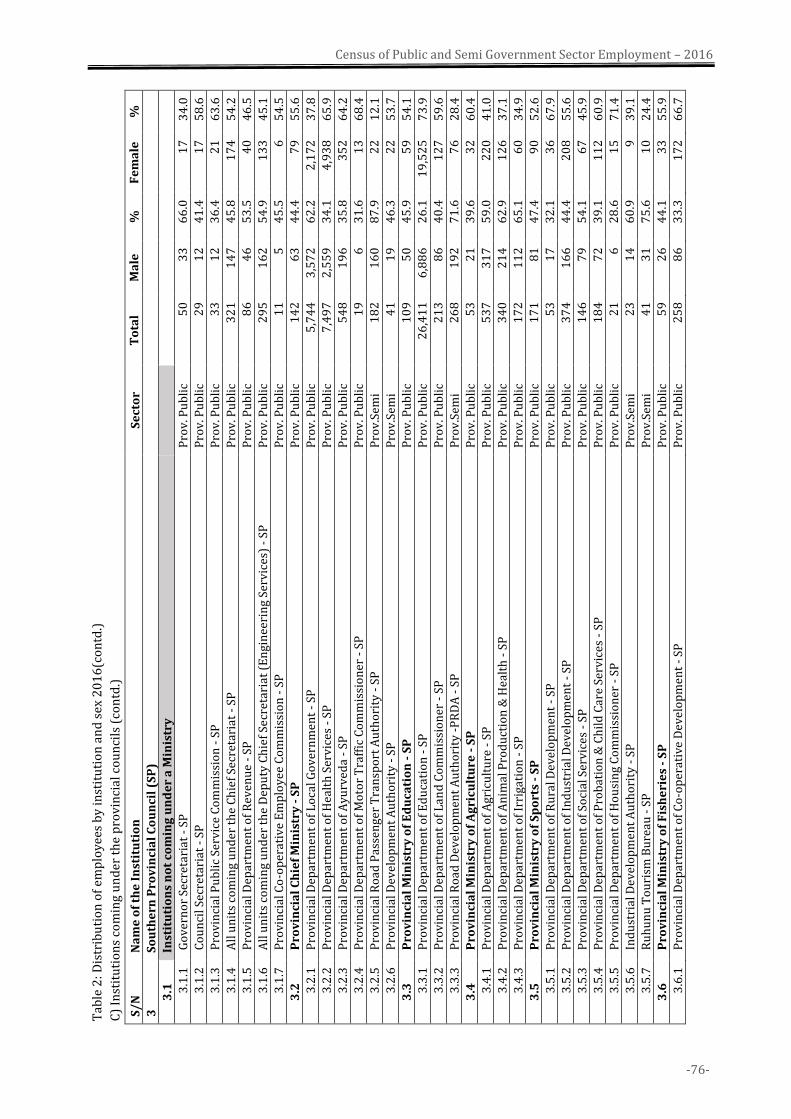
-76-
Census of Public and Semi Government Sector Employment – 2016
T
able
2: D
istr
ibu
tio
n o
f em
plo
yee
s b
y in
stit
uti
on
an
d s
ex 2
01
6(c
on
td.)
C)
Inst
itu
tio
ns
com
ing
un
der
th
e p
rov
inci
al c
ou
nci
ls (
con
td.)
S/
N
Na
me
of
the
In
stit
uti
on
S
ect
or
To
tal
Ma
le
%
Fe
ma
le
%
3
So
uth
ern
Pro
vin
cia
l C
ou
nci
l (S
P)
3.1
In
stit
uti
on
s n
ot
com
ing
un
de
r a
Min
istr
y
3.1
.1
Go
ver
no
r Se
cret
aria
t -
SP
Pro
v. P
ub
lic
50
3
3
66
.0
17
3
4.0
3.1
.2
Co
un
cil S
ecre
tari
at -
SP
P
rov
. Pu
bli
c 2
9
12
4
1.4
1
7
58
.6
3.1
.3
Pro
vin
cial
Pu
bli
c Se
rvic
e C
om
mis
sio
n -
SP
P
rov
. Pu
bli
c 3
3
12
3
6.4
2
1
63
.6
3.1
.4
All
un
its
com
ing
un
der
th
e C
hie
f Se
cret
aria
t -
SP
Pro
v. P
ub
lic
32
1
14
7
45
.8
17
4
54
.2
3.1
.5
Pro
vin
cial
Dep
artm
ent
of
Rev
enu
e -
SP
Pro
v. P
ub
lic
86
4
6
53
.5
40
4
6.5
3.1
.6
All
un
its
com
ing
un
der
th
e D
epu
ty C
hie
f Se
cret
aria
t (E
ngi
nee
rin
g Se
rvic
es)
- SP
P
rov
. Pu
bli
c 2
95
1
62
5
4.9
1
33
4
5.1
3.1
.7
Pro
vin
cial
Co
-op
erat
ive
Em
plo
yee
Co
mm
issi
on
- S
P
Pro
v. P
ub
lic
11
5
4
5.5
6
5
4.5
3.2
P
rov
inci
al
Ch
ief
Min
istr
y -
SP
P
rov
. Pu
bli
c 1
42
6
3
44
.4
79
5
5.6
3.2
.1
Pro
vin
cial
Dep
artm
ent
of
Lo
cal G
ov
ern
men
t -
SP
Pro
v. P
ub
lic
5,7
44
3
,57
2
62
.2
2,1
72
3
7.8
3.2
.2
Pro
vin
cial
Dep
artm
ent
of
Hea
lth
Ser
vic
es -
SP
P
rov
. Pu
bli
c 7
,49
7
2,5
59
3
4.1
4
,93
8
65
.9
3.2
.3
Pro
vin
cial
Dep
artm
ent
of
Ay
urv
eda
- SP
P
rov
. Pu
bli
c 5
48
1
96
3
5.8
3
52
6
4.2
3.2
.4
Pro
vin
cial
Dep
artm
ent
of
Mo
tor
Tra
ffic
Co
mm
issi
on
er -
SP
P
rov
. Pu
bli
c 1
9
6
31
.6
13
6
8.4
3.2
.5
Pro
vin
cial
Ro
ad P
asse
nge
r T
ran
spo
rt A
uth
ori
ty -
SP
P
rov
.Sem
i 1
82
1
60
8
7.9
2
2
12
.1
3.2
.6
Pro
vin
cial
Dev
elo
pm
ent
Au
tho
rity
- S
P
Pro
v.S
emi
41
1
9
46
.3
22
5
3.7
3.3
P
rov
inci
al
Min
istr
y o
f E
du
cati
on
- S
P
Pro
v. P
ub
lic
10
9
50
4
5.9
5
9
54
.1
3.3
.1
Pro
vin
cial
Dep
artm
ent
of
Ed
uca
tio
n -
SP
P
rov
. Pu
bli
c 2
6,4
11
6
,88
6
26
.1
19
,52
5
73
.9
3.3
.2
Pro
vin
cial
Dep
artm
ent
of
Lan
d C
om
mis
sio
ner
- S
P
Pro
v. P
ub
lic
21
3
86
4
0.4
1
27
5
9.6
3.3
.3
Pro
vin
cial
Ro
ad D
evel
op
men
t A
uth
ori
ty -
PR
DA
- S
P
Pro
v.S
emi
26
8
19
2
71
.6
76
2
8.4
3.4
P
rov
inci
al
Min
istr
y o
f A
gri
cult
ure
- S
P
Pro
v. P
ub
lic
53
2
1
39
.6
32
6
0.4
3.4
.1
Pro
vin
cial
Dep
artm
ent
of
Agr
icu
ltu
re -
SP
P
rov
. Pu
bli
c 5
37
3
17
5
9.0
2
20
4
1.0
3.4
.2
Pro
vin
cial
Dep
artm
ent
of
An
imal
Pro
du
ctio
n &
Hea
lth
- S
P
Pro
v. P
ub
lic
34
0
21
4
62
.9
12
6
37
.1
3.4
.3
Pro
vin
cial
Dep
artm
ent
of
Irri
gati
on
- S
P
Pro
v. P
ub
lic
17
2
11
2
65
.1
60
3
4.9
3.5
P
rov
inci
al
Min
istr
y o
f S
po
rts
- S
P
Pro
v. P
ub
lic
17
1
81
4
7.4
9
0
52
.6
3.5
.1
Pro
vin
cial
Dep
artm
ent
of
Ru
ral D
evel
op
men
t -
SP
Pro
v. P
ub
lic
53
1
7
32
.1
36
6
7.9
3.5
.2
Pro
vin
cial
Dep
artm
ent
of
Ind
ust
rial
Dev
elo
pm
ent
- SP
P
rov
. Pu
bli
c 3
74
1
66
4
4.4
2
08
5
5.6
3.5
.3
Pro
vin
cial
Dep
artm
ent
of
Soci
al S
erv
ices
- S
P
Pro
v. P
ub
lic
14
6
79
5
4.1
6
7
45
.9
3.5
.4
Pro
vin
cial
Dep
artm
ent
of
Pro
bat
ion
& C
hil
d C
are
Serv
ices
- S
P
Pro
v. P
ub
lic
18
4
72
3
9.1
1
12
6
0.9
3.5
.5
Pro
vin
cial
Dep
artm
ent
of
Ho
usi
ng
Co
mm
issi
on
er -
SP
P
rov
. Pu
bli
c 2
1
6
28
.6
15
7
1.4
3.5
.6
In
du
stri
al D
evel
op
men
t A
uth
ori
ty -
SP
P
rov
.Sem
i 2
3
14
6
0.9
9
3
9.1
3.5
.7
Ru
hu
nu
To
uri
sm B
ure
au -
SP
P
rov
.Sem
i 4
1
31
7
5.6
1
0
24
.4
3.6
P
rov
inci
al
Min
istr
y o
f F
ish
eri
es
- S
P
Pro
v. P
ub
lic
59
2
6
44
.1
33
5
5.9
3.6
.1
Pro
vin
cial
Dep
artm
ent
of
Co
-op
erat
ive
Dev
elo
pm
ent
- SP
P
rov
. Pu
bli
c 2
58
8
6
33
.3
17
2
66
.7
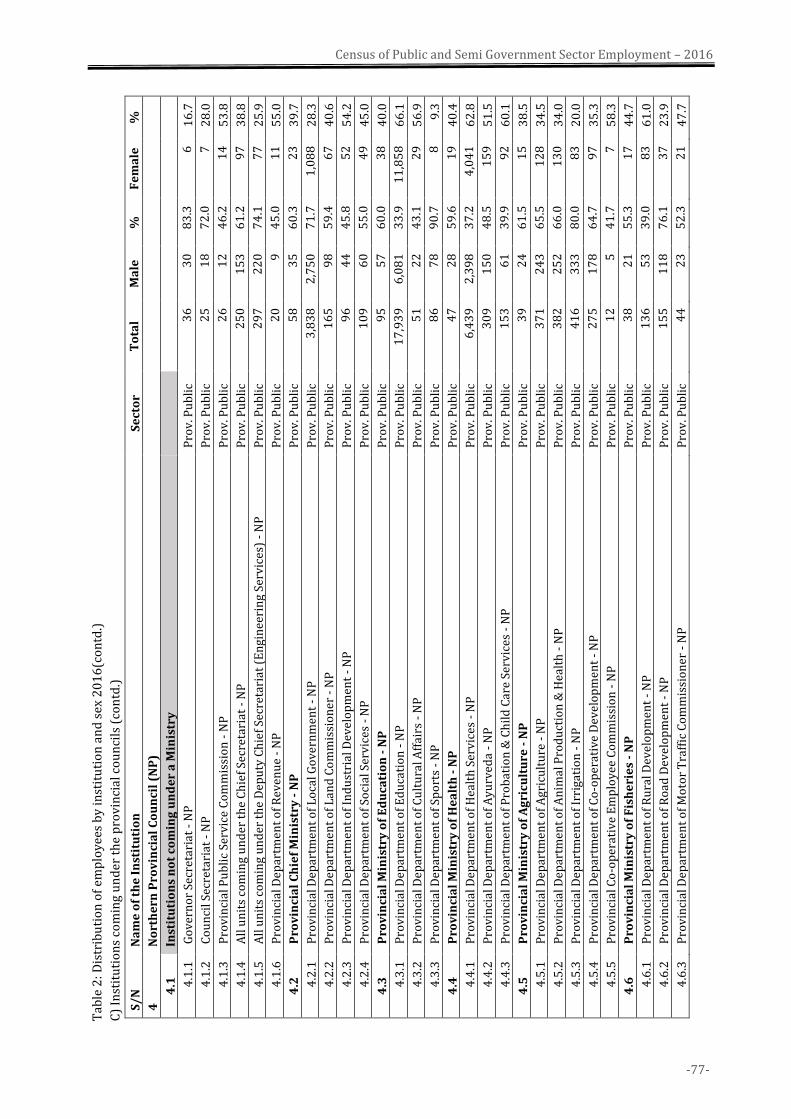
-77-
Census of Public and Semi Government Sector Employment – 2016
T
able
2: D
istr
ibu
tio
n o
f em
plo
yee
s b
y in
stit
uti
on
an
d s
ex 2
01
6(c
on
td.)
C)
Inst
itu
tio
ns
com
ing
un
der
th
e p
rov
inci
al c
ou
nci
ls (
con
td.)
S/
N
Na
me
of
the
In
stit
uti
on
S
ect
or
To
tal
Ma
le
%
Fe
ma
le
%
4
No
rth
ern
Pro
vin
cia
l C
ou
nci
l (N
P)
4.1
In
stit
uti
on
s n
ot
com
ing
un
de
r a
Min
istr
y
4.1
.1
Go
ver
no
r Se
cret
aria
t -
NP
P
rov
. Pu
bli
c 3
6
30
8
3.3
6
1
6.7
4.1
.2
Co
un
cil S
ecre
tari
at -
NP
P
rov
. Pu
bli
c 2
5
18
7
2.0
7
2
8.0
4.1
.3
Pro
vin
cial
Pu
bli
c Se
rvic
e C
om
mis
sio
n -
NP
P
rov
. Pu
bli
c 2
6
12
4
6.2
1
4
53
.8
4.1
.4
All
un
its
com
ing
un
der
th
e C
hie
f Se
cret
aria
t -
NP
P
rov
. Pu
bli
c 2
50
1
53
6
1.2
9
7
38
.8
4.1
.5
All
un
its
com
ing
un
der
th
e D
epu
ty C
hie
f Se
cret
aria
t (E
ngi
nee
rin
g Se
rvic
es)
- N
P
Pro
v. P
ub
lic
29
7
22
0
74
.1
77
2
5.9
4.1
.6
Pro
vin
cial
Dep
artm
ent
of
Rev
enu
e -
NP
P
rov
. Pu
bli
c 2
0
9
45
.0
11
5
5.0
4.2
P
rov
inci
al
Ch
ief
Min
istr
y -
NP
P
rov
. Pu
bli
c 5
8
35
6
0.3
2
3
39
.7
4.2
.1
Pro
vin
cial
Dep
artm
ent
of
Lo
cal G
ov
ern
men
t -
NP
P
rov
. Pu
bli
c 3
,83
8
2,7
50
7
1.7
1
,08
8
28
.3
4.2
.2
Pro
vin
cial
Dep
artm
ent
of
Lan
d C
om
mis
sio
ner
- N
P
Pro
v. P
ub
lic
16
5
98
5
9.4
6
7
40
.6
4.2
.3
Pro
vin
cial
Dep
artm
ent
of
Ind
ust
rial
Dev
elo
pm
ent
- N
P
Pro
v. P
ub
lic
96
4
4
45
.8
52
5
4.2
4.2
.4
Pro
vin
cial
Dep
artm
ent
of
Soci
al S
erv
ices
- N
P
Pro
v. P
ub
lic
10
9
60
5
5.0
4
9
45
.0
4.3
P
rov
inci
al
Min
istr
y o
f E
du
cati
on
- N
P
Pro
v. P
ub
lic
95
5
7
60
.0
38
4
0.0
4.3
.1
Pro
vin
cial
Dep
artm
ent
of
Ed
uca
tio
n -
NP
P
rov
. Pu
bli
c 1
7,9
39
6
,08
1
33
.9
11
,85
8
66
.1
4.3
.2
Pro
vin
cial
Dep
artm
ent
of
Cu
ltu
ral A
ffai
rs -
NP
P
rov
. Pu
bli
c 5
1
22
4
3.1
2
9
56
.9
4.3
.3
Pro
vin
cial
Dep
artm
ent
of
Spo
rts
- N
P
Pro
v. P
ub
lic
86
7
8
90
.7
8
9.3
4.4
P
rov
inci
al
Min
istr
y o
f H
ea
lth
- N
P
Pro
v. P
ub
lic
47
2
8
59
.6
19
4
0.4
4.4
.1
Pro
vin
cial
Dep
artm
ent
of
Hea
lth
Ser
vic
es -
NP
P
rov
. Pu
bli
c 6
,43
9
2,3
98
3
7.2
4
,04
1
62
.8
4.4
.2
Pro
vin
cial
Dep
artm
ent
of
Ay
urv
eda
- N
P
Pro
v. P
ub
lic
30
9
15
0
48
.5
15
9
51
.5
4.4
.3
Pro
vin
cial
Dep
artm
ent
of
Pro
bat
ion
& C
hil
d C
are
Serv
ices
- N
P
Pro
v. P
ub
lic
15
3
61
3
9.9
9
2
60
.1
4.5
P
rov
inci
al
Min
istr
y o
f A
gri
cult
ure
- N
P
Pro
v. P
ub
lic
39
2
4
61
.5
15
3
8.5
4.5
.1
Pro
vin
cial
Dep
artm
ent
of
Agr
icu
ltu
re -
NP
P
rov
. Pu
bli
c 3
71
2
43
6
5.5
1
28
3
4.5
4.5
.2
Pro
vin
cial
Dep
artm
ent
of
An
imal
Pro
du
ctio
n &
Hea
lth
- N
P
Pro
v. P
ub
lic
38
2
25
2
66
.0
13
0
34
.0
4.5
.3
Pro
vin
cial
Dep
artm
ent
of
Irri
gati
on
- N
P
Pro
v. P
ub
lic
41
6
33
3
80
.0
83
2
0.0
4.5
.4
Pro
vin
cial
Dep
artm
ent
of
Co
-op
erat
ive
Dev
elo
pm
ent
- N
P
Pro
v. P
ub
lic
27
5
17
8
64
.7
97
3
5.3
4.5
.5
Pro
vin
cial
Co
-op
erat
ive
Em
plo
yee
Co
mm
issi
on
- N
P
Pro
v. P
ub
lic
12
5
4
1.7
7
5
8.3
4.6
P
rov
inci
al
Min
istr
y o
f F
ish
eri
es
- N
P
Pro
v. P
ub
lic
38
2
1
55
.3
17
4
4.7
4.6
.1
Pro
vin
cial
Dep
artm
ent
of
Ru
ral D
evel
op
men
t -
NP
P
rov
. Pu
bli
c 1
36
5
3
39
.0
83
6
1.0
4.6
.2
Pro
vin
cial
Dep
artm
ent
of
Ro
ad D
evel
op
men
t -
NP
P
rov
. Pu
bli
c 1
55
1
18
7
6.1
3
7
23
.9
4.6
.3
Pro
vin
cial
Dep
artm
ent
of
Mo
tor
Tra
ffic
Co
mm
issi
on
er -
NP
P
rov
. Pu
bli
c 4
4
23
5
2.3
2
1
47
.7
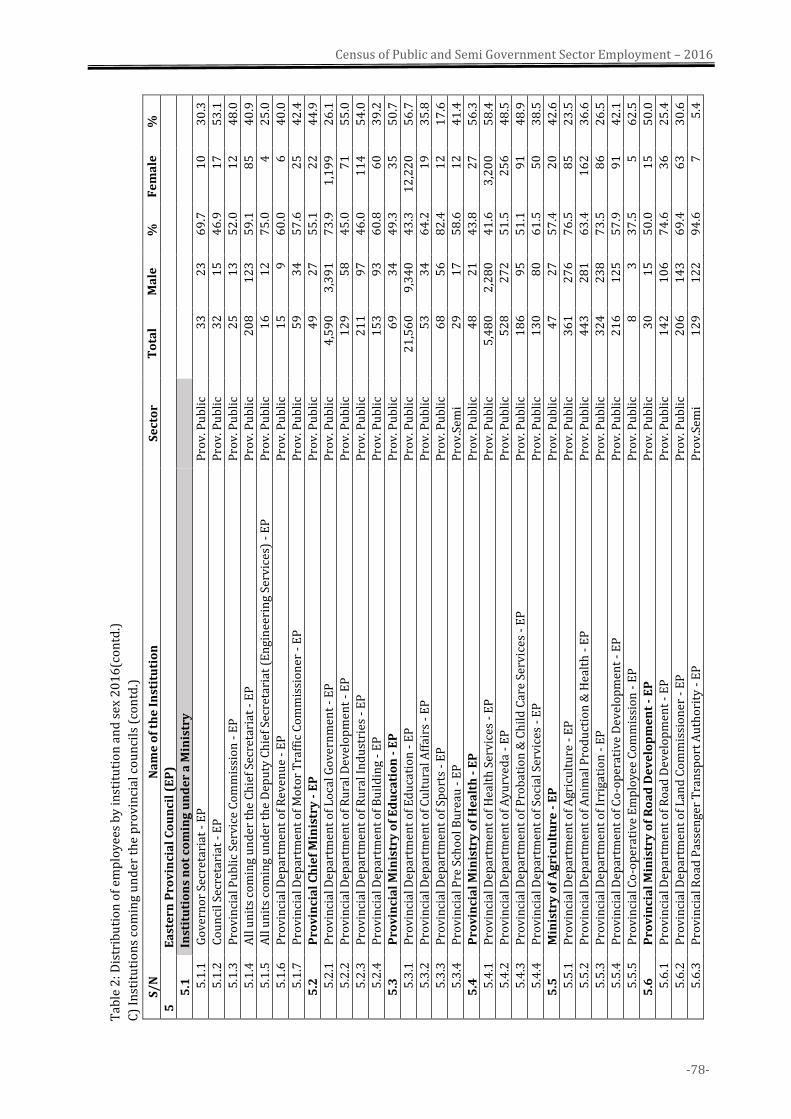
-78-
Census of Public and Semi Government Sector Employment – 2016
T
able
2: D
istr
ibu
tio
n o
f em
plo
yee
s b
y in
stit
uti
on
an
d s
ex 2
01
6(c
on
td.)
C)
Inst
itu
tio
ns
com
ing
un
der
th
e p
rov
inci
al c
ou
nci
ls (
con
td.)
S/
N
Na
me
of
the
In
stit
uti
on
S
ect
or
To
tal
Ma
le
%
Fe
ma
le
%
5
Ea
ste
rn P
rov
inci
al
Co
un
cil
(EP
)
5.1
In
stit
uti
on
s n
ot
com
ing
un
de
r a
Min
istr
y
5.1
.1
Go
ver
no
r Se
cret
aria
t -
EP
P
rov
. Pu
bli
c 3
3
23
6
9.7
1
0
30
.3
5.1
.2
Co
un
cil S
ecre
tari
at -
EP
P
rov
. Pu
bli
c 3
2
15
4
6.9
1
7
53
.1
5.1
.3
Pro
vin
cial
Pu
bli
c Se
rvic
e C
om
mis
sio
n -
EP
P
rov
. Pu
bli
c 2
5
13
5
2.0
1
2
48
.0
5.1
.4
All
un
its
com
ing
un
der
th
e C
hie
f Se
cret
aria
t -
EP
P
rov
. Pu
bli
c 2
08
1
23
5
9.1
8
5
40
.9
5.1
.5
All
un
its
com
ing
un
der
th
e D
epu
ty C
hie
f Se
cret
aria
t (E
ngi
nee
rin
g Se
rvic
es)
- E
P
Pro
v. P
ub
lic
16
1
2
75
.0
4
25
.0
5.1
.6
Pro
vin
cial
Dep
artm
ent
of
Rev
enu
e -
EP
P
rov
. Pu
bli
c 1
5
9
60
.0
6
40
.0
5.1
.7
Pro
vin
cial
Dep
artm
ent
of
Mo
tor
Tra
ffic
Co
mm
issi
on
er -
EP
P
rov
. Pu
bli
c 5
9
34
5
7.6
2
5
42
.4
5.2
P
rov
inci
al
Ch
ief
Min
istr
y -
EP
P
rov
. Pu
bli
c 4
9
27
5
5.1
2
2
44
.9
5.2
.1
Pro
vin
cial
Dep
artm
ent
of
Lo
cal G
ov
ern
men
t -
EP
P
rov
. Pu
bli
c 4
,59
0
3,3
91
7
3.9
1
,19
9
26
.1
5.2
.2
Pro
vin
cial
Dep
artm
ent
of
Ru
ral D
evel
op
men
t -
EP
P
rov
. Pu
bli
c 1
29
5
8
45
.0
71
5
5.0
5.2
.3
Pro
vin
cial
Dep
artm
ent
of
Ru
ral I
nd
ust
ries
- E
P
Pro
v. P
ub
lic
21
1
97
4
6.0
1
14
5
4.0
5.2
.4
Pro
vin
cial
Dep
artm
ent
of
Bu
ild
ing
- E
P
Pro
v. P
ub
lic
15
3
93
6
0.8
6
0
39
.2
5.3
P
rov
inci
al
Min
istr
y o
f E
du
cati
on
- E
P
Pro
v. P
ub
lic
69
3
4
49
.3
35
5
0.7
5.3
.1
Pro
vin
cial
Dep
artm
ent
of
Ed
uca
tio
n -
EP
P
rov
. Pu
bli
c 2
1,5
60
9
,34
0
43
.3
12
,22
0
56
.7
5.3
.2
Pro
vin
cial
Dep
artm
ent
of
Cu
ltu
ral A
ffai
rs -
EP
P
rov
. Pu
bli
c 5
3
34
6
4.2
1
9
35
.8
5.3
.3
Pro
vin
cial
Dep
artm
ent
of
Spo
rts
- E
P
Pro
v. P
ub
lic
68
5
6
82
.4
12
1
7.6
5.3
.4
Pro
vin
cial
Pre
Sch
oo
l Bu
reau
- E
P
Pro
v.S
emi
29
1
7
58
.6
12
4
1.4
5.4
P
rov
inci
al
Min
istr
y o
f H
ea
lth
- E
P
Pro
v. P
ub
lic
48
2
1
43
.8
27
5
6.3
5.4
.1
Pro
vin
cial
Dep
artm
ent
of
Hea
lth
Ser
vic
es -
EP
P
rov
. Pu
bli
c 5
,48
0
2,2
80
4
1.6
3
,20
0
58
.4
5.4
.2
Pro
vin
cial
Dep
artm
ent
of
Ay
urv
eda
- E
P
Pro
v. P
ub
lic
52
8
27
2
51
.5
25
6
48
.5
5.4
.3
Pro
vin
cial
Dep
artm
ent
of
Pro
bat
ion
& C
hil
d C
are
Serv
ices
- E
P
Pro
v. P
ub
lic
18
6
95
5
1.1
9
1
48
.9
5.4
.4
Pro
vin
cial
Dep
artm
ent
of
Soci
al S
erv
ices
- E
P
Pro
v. P
ub
lic
13
0
80
6
1.5
5
0
38
.5
5.5
M
inis
try
of
Ag
ricu
ltu
re -
EP
P
rov
. Pu
bli
c 4
7
27
5
7.4
2
0
42
.6
5.5
.1
Pro
vin
cial
Dep
artm
ent
of
Agr
icu
ltu
re -
EP
P
rov
. Pu
bli
c 3
61
2
76
7
6.5
8
5
23
.5
5.5
.2
Pro
vin
cial
Dep
artm
ent
of
An
imal
Pro
du
ctio
n &
Hea
lth
- E
P
Pro
v. P
ub
lic
44
3
28
1
63
.4
16
2
36
.6
5.5
.3
Pro
vin
cial
Dep
artm
ent
of
Irri
gati
on
- E
P
Pro
v. P
ub
lic
32
4
23
8
73
.5
86
2
6.5
5.5
.4
Pro
vin
cial
Dep
artm
ent
of
Co
-op
erat
ive
Dev
elo
pm
ent
- E
P
Pro
v. P
ub
lic
21
6
12
5
57
.9
91
4
2.1
5.5
.5
Pro
vin
cial
Co
-op
erat
ive
Em
plo
yee
Co
mm
issi
on
- E
P
Pro
v. P
ub
lic
8
3
37
.5
5
62
.5
5.6
P
rov
inci
al
Min
istr
y o
f R
oa
d D
ev
elo
pm
en
t -
EP
P
rov
. Pu
bli
c 3
0
15
5
0.0
1
5
50
.0
5.6
.1
Pro
vin
cial
Dep
artm
ent
of
Ro
ad D
evel
op
men
t -
EP
P
rov
. Pu
bli
c 1
42
1
06
7
4.6
3
6
25
.4
5.6
.2
Pro
vin
cial
Dep
artm
ent
of
Lan
d C
om
mis
sio
ner
- E
P
Pro
v. P
ub
lic
20
6
14
3
69
.4
63
3
0.6
5.6
.3
Pro
vin
cial
Ro
ad P
asse
nge
r T
ran
spo
rt A
uth
ori
ty -
EP
P
rov
.Sem
i 1
29
1
22
9
4.6
7
5
.4
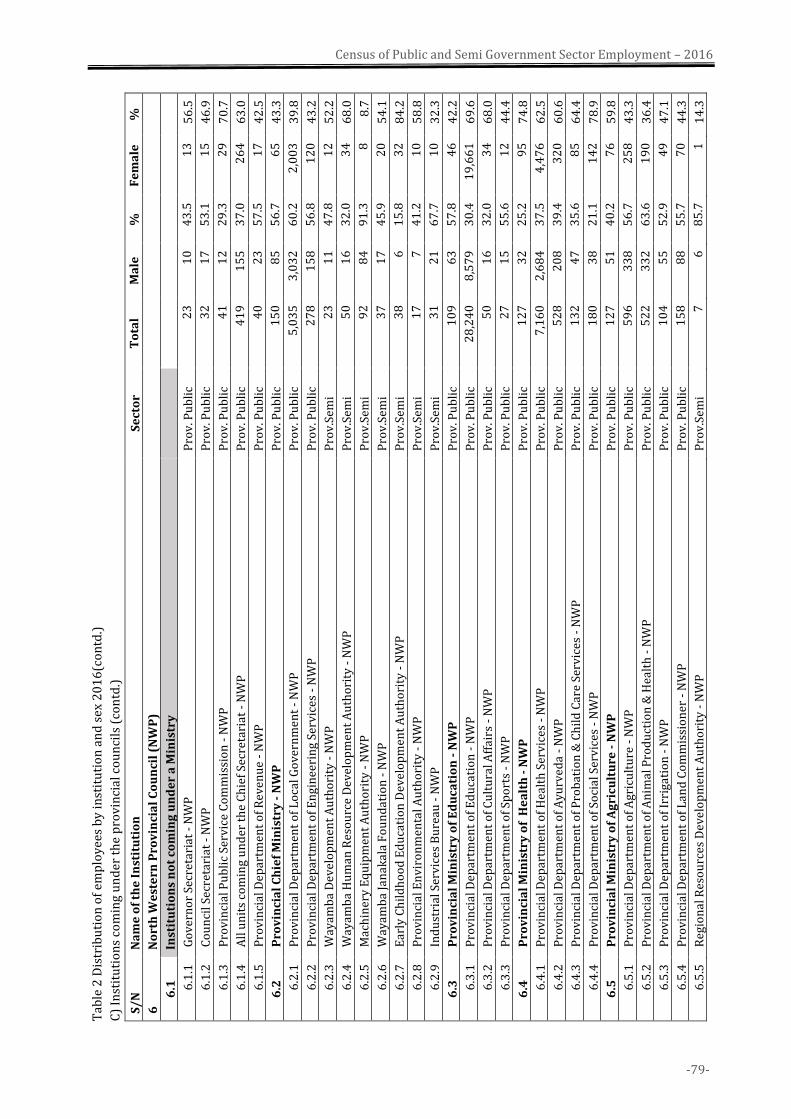
-79-
Census of Public and Semi Government Sector Employment – 2016
T
able
2 D
istr
ibu
tio
n o
f em
plo
yee
s b
y in
stit
uti
on
an
d s
ex 2
01
6(c
on
td.)
C)
Inst
itu
tio
ns
com
ing
un
der
th
e p
rov
inci
al c
ou
nci
ls (
con
td.)
S/
N
Na
me
of
the
In
stit
uti
on
S
ect
or
To
tal
Ma
le
%
Fe
ma
le
%
6
No
rth
We
ste
rn P
rov
inci
al
Co
un
cil
(NW
P)
6.1
In
stit
uti
on
s n
ot
com
ing
un
de
r a
Min
istr
y
6.1
.1
Go
ver
no
r Se
cret
aria
t -
NW
P
Pro
v. P
ub
lic
23
1
0
43
.5
13
5
6.5
6.1
.2
Co
un
cil S
ecre
tari
at -
NW
P
Pro
v. P
ub
lic
32
1
7
53
.1
15
4
6.9
6.1
.3
Pro
vin
cial
Pu
bli
c Se
rvic
e C
om
mis
sio
n -
NW
P
Pro
v. P
ub
lic
41
1
2
29
.3
29
7
0.7
6.1
.4
All
un
its
com
ing
un
der
th
e C
hie
f Se
cret
aria
t -
NW
P
Pro
v. P
ub
lic
41
9
15
5
37
.0
26
4
63
.0
6.1
.5
Pro
vin
cial
Dep
artm
ent
of
Rev
enu
e -
NW
P
Pro
v. P
ub
lic
40
2
3
57
.5
17
4
2.5
6.2
P
rov
inci
al
Ch
ief
Min
istr
y -
NW
P
Pro
v. P
ub
lic
15
0
85
5
6.7
6
5
43
.3
6.2
.1
Pro
vin
cial
Dep
artm
ent
of
Lo
cal G
ov
ern
men
t -
NW
P
Pro
v. P
ub
lic
5,0
35
3
,03
2
60
.2
2,0
03
3
9.8
6.2
.2
Pro
vin
cial
Dep
artm
ent
of
En
gin
eeri
ng
Serv
ices
- N
WP
P
rov
. Pu
bli
c 2
78
1
58
5
6.8
1
20
4
3.2
6.2
.3
Way
amb
a D
evel
op
men
t A
uth
ori
ty -
NW
P
Pro
v.S
emi
23
1
1
47
.8
12
5
2.2
6.2
.4
Way
amb
a H
um
an R
eso
urc
e D
evel
op
men
t A
uth
ori
ty -
NW
P
Pro
v.S
emi
50
1
6
32
.0
34
6
8.0
6.2
.5
Mac
hin
ery
Eq
uip
men
t A
uth
ori
ty -
NW
P
Pro
v.S
emi
92
8
4
91
.3
8
8.7
6.2
.6
Way
amb
a Ja
nak
ala
Fo
un
dat
ion
- N
WP
P
rov
.Sem
i 3
7
17
4
5.9
2
0
54
.1
6.2
.7
Ear
ly C
hil
dh
oo
d E
du
cati
on
Dev
elo
pm
ent
Au
tho
rity
- N
WP
P
rov
.Sem
i 3
8
6
15
.8
32
8
4.2
6.2
.8
Pro
vin
cial
En
vir
on
men
tal A
uth
ori
ty -
NW
P
Pro
v.S
emi
17
7
4
1.2
1
0
58
.8
6.2
.9
In
du
stri
al S
erv
ices
Bu
reau
- N
WP
P
rov
.Sem
i 3
1
21
6
7.7
1
0
32
.3
6.3
P
rov
inci
al
Min
istr
y o
f E
du
cati
on
- N
WP
P
rov
. Pu
bli
c 1
09
6
3
57
.8
46
4
2.2
6.3
.1
Pro
vin
cial
Dep
artm
ent
of
Ed
uca
tio
n -
NW
P
Pro
v. P
ub
lic
28
,24
0
8,5
79
3
0.4
1
9,6
61
6
9.6
6.3
.2
Pro
vin
cial
Dep
artm
ent
of
Cu
ltu
ral A
ffai
rs -
NW
P
Pro
v. P
ub
lic
50
1
6
32
.0
34
6
8.0
6.3
.3
Pro
vin
cial
Dep
artm
ent
of
Spo
rts
- N
WP
P
rov
. Pu
bli
c 2
7
15
5
5.6
1
2
44
.4
6.4
P
rov
inci
al
Min
istr
y o
f H
ea
lth
- N
WP
P
rov
. Pu
bli
c 1
27
3
2
25
.2
95
7
4.8
6.4
.1
Pro
vin
cial
Dep
artm
ent
of
Hea
lth
Ser
vic
es -
NW
P
Pro
v. P
ub
lic
7,1
60
2
,68
4
37
.5
4,4
76
6
2.5
6.4
.2
Pro
vin
cial
Dep
artm
ent
of
Ay
urv
eda
- N
WP
P
rov
. Pu
bli
c 5
28
2
08
3
9.4
3
20
6
0.6
6.4
.3
Pro
vin
cial
Dep
artm
ent
of
Pro
bat
ion
& C
hil
d C
are
Serv
ices
- N
WP
P
rov
. Pu
bli
c 1
32
4
7
35
.6
85
6
4.4
6.4
.4
Pro
vin
cial
Dep
artm
ent
of
Soci
al S
erv
ices
- N
WP
P
rov
. Pu
bli
c 1
80
3
8
21
.1
14
2
78
.9
6.5
P
rov
inci
al
Min
istr
y o
f A
gri
cult
ure
- N
WP
P
rov
. Pu
bli
c 1
27
5
1
40
.2
76
5
9.8
6.5
.1
Pro
vin
cial
Dep
artm
ent
of
Agr
icu
ltu
re -
NW
P
Pro
v. P
ub
lic
59
6
33
8
56
.7
25
8
43
.3
6.5
.2
Pro
vin
cial
Dep
artm
ent
of
An
imal
Pro
du
ctio
n &
Hea
lth
- N
WP
P
rov
. Pu
bli
c 5
22
3
32
6
3.6
1
90
3
6.4
6.5
.3
Pro
vin
cial
Dep
artm
ent
of
Irri
gati
on
- N
WP
P
rov
. Pu
bli
c 1
04
5
5
52
.9
49
4
7.1
6.5
.4
Pro
vin
cial
Dep
artm
ent
of
Lan
d C
om
mis
sio
ner
- N
WP
P
rov
. Pu
bli
c 1
58
8
8
55
.7
70
4
4.3
6.5
.5
Reg
ion
al R
eso
urc
es D
evel
op
men
t A
uth
ori
ty -
NW
P
Pro
v.S
emi
7
6
85
.7
1
14
.3
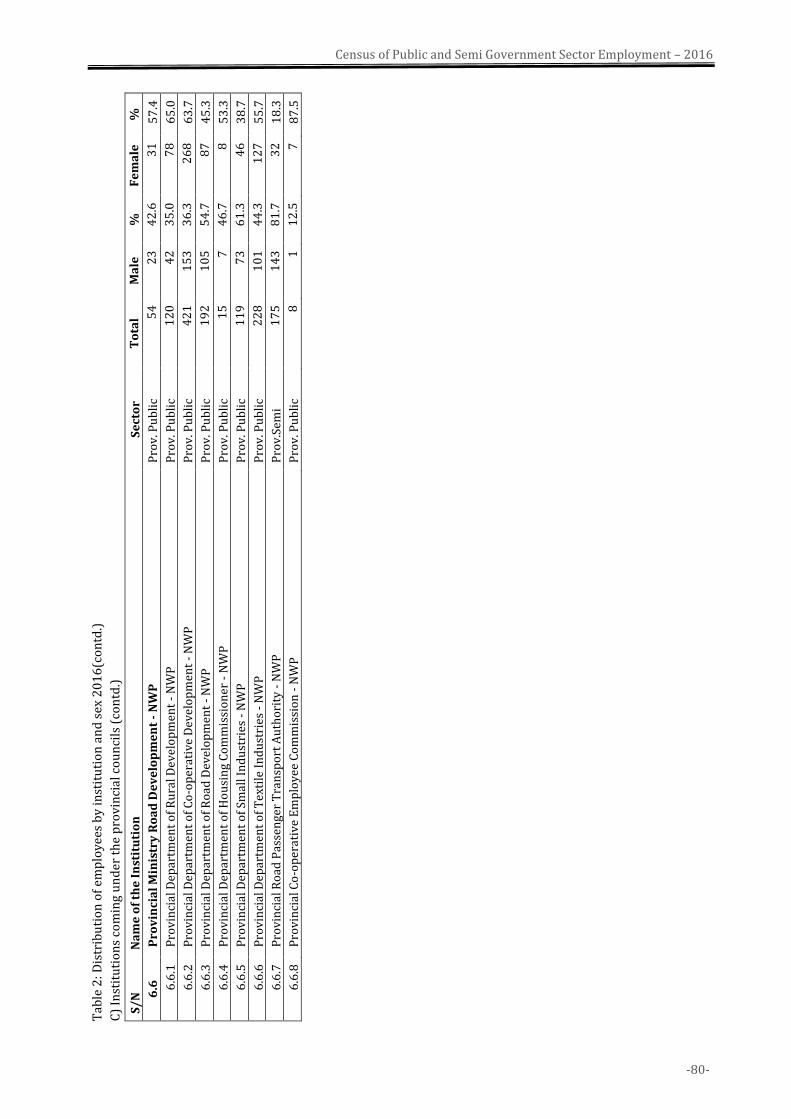
-80-
Census of Public and Semi Government Sector Employment – 2016
T
able
2: D
istr
ibu
tio
n o
f em
plo
yee
s b
y in
stit
uti
on
an
d s
ex 2
01
6(c
on
td.)
C)
Inst
itu
tio
ns
com
ing
un
der
th
e p
rov
inci
al c
ou
nci
ls (
con
td.)
S/
N
Na
me
of
the
In
stit
uti
on
S
ect
or
To
tal
Ma
le
%
Fe
ma
le
%
6.6
P
rov
inci
al
Min
istr
y R
oa
d D
ev
elo
pm
en
t -
NW
P
Pro
v. P
ub
lic
54
2
3
42
.6
31
5
7.4
6.6
.1
Pro
vin
cial
Dep
artm
ent
of
Ru
ral D
evel
op
men
t -
NW
P
Pro
v. P
ub
lic
12
0
42
3
5.0
7
8
65
.0
6.6
.2
Pro
vin
cial
Dep
artm
ent
of
Co
-op
erat
ive
Dev
elo
pm
ent
- N
WP
P
rov
. Pu
bli
c 4
21
1
53
3
6.3
2
68
6
3.7
6.6
.3
Pro
vin
cial
Dep
artm
ent
of
Ro
ad D
evel
op
men
t -
NW
P
Pro
v. P
ub
lic
19
2
10
5
54
.7
87
4
5.3
6.6
.4
Pro
vin
cial
Dep
artm
ent
of
Ho
usi
ng
Co
mm
issi
on
er -
NW
P
Pro
v. P
ub
lic
15
7
4
6.7
8
5
3.3
6.6
.5
Pro
vin
cial
Dep
artm
ent
of
Smal
l In
du
stri
es -
NW
P
Pro
v. P
ub
lic
11
9
73
6
1.3
4
6
38
.7
6.6
.6
Pro
vin
cial
Dep
artm
ent
of
Tex
tile
In
du
stri
es -
NW
P
Pro
v. P
ub
lic
22
8
10
1
44
.3
12
7
55
.7
6.6
.7
Pro
vin
cial
Ro
ad P
asse
nge
r T
ran
spo
rt A
uth
ori
ty -
NW
P
Pro
v.S
emi
17
5
14
3
81
.7
32
1
8.3
6.6
.8
Pro
vin
cial
Co
-op
erat
ive
Em
plo
yee
Co
mm
issi
on
- N
WP
P
rov
. Pu
bli
c 8
1
1
2.5
7
8
7.5
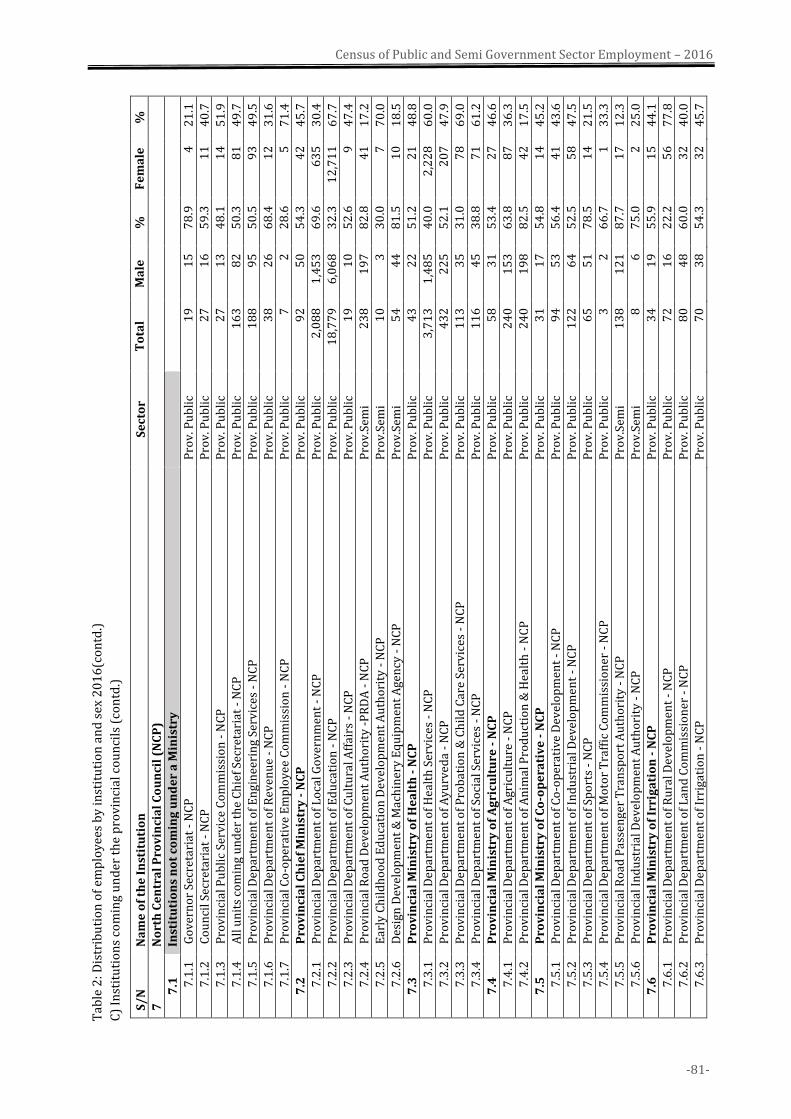
-81-
Census of Public and Semi Government Sector Employment – 2016
T
able
2: D
istr
ibu
tio
n o
f em
plo
yee
s b
y in
stit
uti
on
an
d s
ex 2
01
6(c
on
td.)
C)
Inst
itu
tio
ns
com
ing
un
der
th
e p
rov
inci
al c
ou
nci
ls (
con
td.)
S/
N
Na
me
of
the
In
stit
uti
on
S
ect
or
To
tal
Ma
le
%
Fe
ma
le
%
7
No
rth
Ce
ntr
al
Pro
vin
cia
l C
ou
nci
l (N
CP
)
7.1
In
stit
uti
on
s n
ot
com
ing
un
de
r a
Min
istr
y
7.1
.1
Go
ver
no
r Se
cret
aria
t -
NC
P
Pro
v. P
ub
lic
19
1
5
78
.9
4
21
.1
7.1
.2
Co
un
cil S
ecre
tari
at -
NC
P
Pro
v. P
ub
lic
27
1
6
59
.3
11
4
0.7
7.1
.3
Pro
vin
cial
Pu
bli
c Se
rvic
e C
om
mis
sio
n -
NC
P
Pro
v. P
ub
lic
27
1
3
48
.1
14
5
1.9
7.1
.4
All
un
its
com
ing
un
der
th
e C
hie
f Se
cret
aria
t -
NC
P
Pro
v. P
ub
lic
16
3
82
5
0.3
8
1
49
.7
7.1
.5
Pro
vin
cial
Dep
artm
ent
of
En
gin
eeri
ng
Serv
ices
- N
CP
P
rov
. Pu
bli
c 1
88
9
5
50
.5
93
4
9.5
7.1
.6
Pro
vin
cial
Dep
artm
ent
of
Rev
enu
e -
NC
P
Pro
v. P
ub
lic
38
2
6
68
.4
12
3
1.6
7.1
.7
Pro
vin
cial
Co
-op
erat
ive
Em
plo
yee
Co
mm
issi
on
- N
CP
P
rov
. Pu
bli
c 7
2
2
8.6
5
7
1.4
7.2
P
rov
inci
al
Ch
ief
Min
istr
y -
NC
P
Pro
v. P
ub
lic
92
5
0
54
.3
42
4
5.7
7.2
.1
Pro
vin
cial
Dep
artm
ent
of
Lo
cal G
ov
ern
men
t -
NC
P
Pro
v. P
ub
lic
2,0
88
1
,45
3
69
.6
63
5
30
.4
7.2
.2
Pro
vin
cial
Dep
artm
ent
of
Ed
uca
tio
n -
NC
P
Pro
v. P
ub
lic
18
,77
9
6,0
68
3
2.3
1
2,7
11
6
7.7
7.2
.3
Pro
vin
cial
Dep
artm
ent
of
Cu
ltu
ral A
ffai
rs -
NC
P
Pro
v. P
ub
lic
19
1
0
52
.6
9
47
.4
7.2
.4
Pro
vin
cial
Ro
ad D
evel
op
men
t A
uth
ori
ty -
PR
DA
- N
CP
P
rov
.Sem
i 2
38
1
97
8
2.8
4
1
17
.2
7.2
.5
Ear
ly C
hil
dh
oo
d E
du
cati
on
Dev
elo
pm
ent
Au
tho
rity
- N
CP
P
rov
.Sem
i 1
0
3
30
.0
7
70
.0
7.2
.6
Des
ign
Dev
elo
pm
ent
& M
ach
iner
y E
qu
ipm
ent
Age
ncy
- N
CP
P
rov
.Sem
i 5
4
44
8
1.5
1
0
18
.5
7.3
P
rov
inci
al
Min
istr
y o
f H
ea
lth
- N
CP
P
rov
. Pu
bli
c 4
3
22
5
1.2
2
1
48
.8
7.3
.1
Pro
vin
cial
Dep
artm
ent
of
Hea
lth
Ser
vic
es -
NC
P
Pro
v. P
ub
lic
3,7
13
1
,48
5
40
.0
2,2
28
6
0.0
7.3
.2
Pro
vin
cial
Dep
artm
ent
of
Ay
urv
eda
- N
CP
P
rov
. Pu
bli
c 4
32
2
25
5
2.1
2
07
4
7.9
7.3
.3
Pro
vin
cial
Dep
artm
ent
of
Pro
bat
ion
& C
hil
d C
are
Serv
ices
- N
CP
P
rov
. Pu
bli
c 1
13
3
5
31
.0
78
6
9.0
7.3
.4
Pro
vin
cial
Dep
artm
ent
of
Soci
al S
erv
ices
- N
CP
P
rov
. Pu
bli
c 1
16
4
5
38
.8
71
6
1.2
7.4
P
rov
inci
al
Min
istr
y o
f A
gri
cult
ure
- N
CP
P
rov
. Pu
bli
c 5
8
31
5
3.4
2
7
46
.6
7.4
.1
Pro
vin
cial
Dep
artm
ent
of
Agr
icu
ltu
re -
NC
P
Pro
v. P
ub
lic
24
0
15
3
63
.8
87
3
6.3
7.4
.2
Pro
vin
cial
Dep
artm
ent
of
An
imal
Pro
du
ctio
n &
Hea
lth
- N
CP
P
rov
. Pu
bli
c 2
40
1
98
8
2.5
4
2
17
.5
7.5
P
rov
inci
al
Min
istr
y o
f C
o-o
pe
rati
ve
- N
CP
P
rov
. Pu
bli
c 3
1
17
5
4.8
1
4
45
.2
7.5
.1
Pro
vin
cial
Dep
artm
ent
of
Co
-op
erat
ive
Dev
elo
pm
ent
- N
CP
P
rov
. Pu
bli
c 9
4
53
5
6.4
4
1
43
.6
7.5
.2
Pro
vin
cial
Dep
artm
ent
of
Ind
ust
rial
Dev
elo
pm
ent
- N
CP
P
rov
. Pu
bli
c 1
22
6
4
52
.5
58
4
7.5
7.5
.3
Pro
vin
cial
Dep
artm
ent
of
Spo
rts
- N
CP
P
rov
. Pu
bli
c 6
5
51
7
8.5
1
4
21
.5
7.5
.4
Pro
vin
cial
Dep
artm
ent
of
Mo
tor
Tra
ffic
Co
mm
issi
on
er -
NC
P
Pro
v. P
ub
lic
3
2
66
.7
1
33
.3
7.5
.5
Pro
vin
cial
Ro
ad P
asse
nge
r T
ran
spo
rt A
uth
ori
ty -
NC
P
Pro
v.S
emi
13
8
12
1
87
.7
17
1
2.3
7.5
.6
Pro
vin
cial
In
du
stri
al D
evel
op
men
t A
uth
ori
ty -
NC
P
Pro
v.S
emi
8
6
75
.0
2
25
.0
7.6
P
rov
inci
al
Min
istr
y o
f Ir
rig
ati
on
- N
CP
P
rov
. Pu
bli
c 3
4
19
5
5.9
1
5
44
.1
7.6
.1
Pro
vin
cial
Dep
artm
ent
of
Ru
ral D
evel
op
men
t -
NC
P
Pro
v. P
ub
lic
72
1
6
22
.2
56
7
7.8
7.6
.2
Pro
vin
cial
Dep
artm
ent
of
Lan
d C
om
mis
sio
ner
- N
CP
P
rov
. Pu
bli
c 8
0
48
6
0.0
3
2
40
.0
7.6
.3
Pro
vin
cial
Dep
artm
ent
of
Irri
gati
on
- N
CP
P
rov
. Pu
bli
c 7
0
38
5
4.3
3
2
45
.7
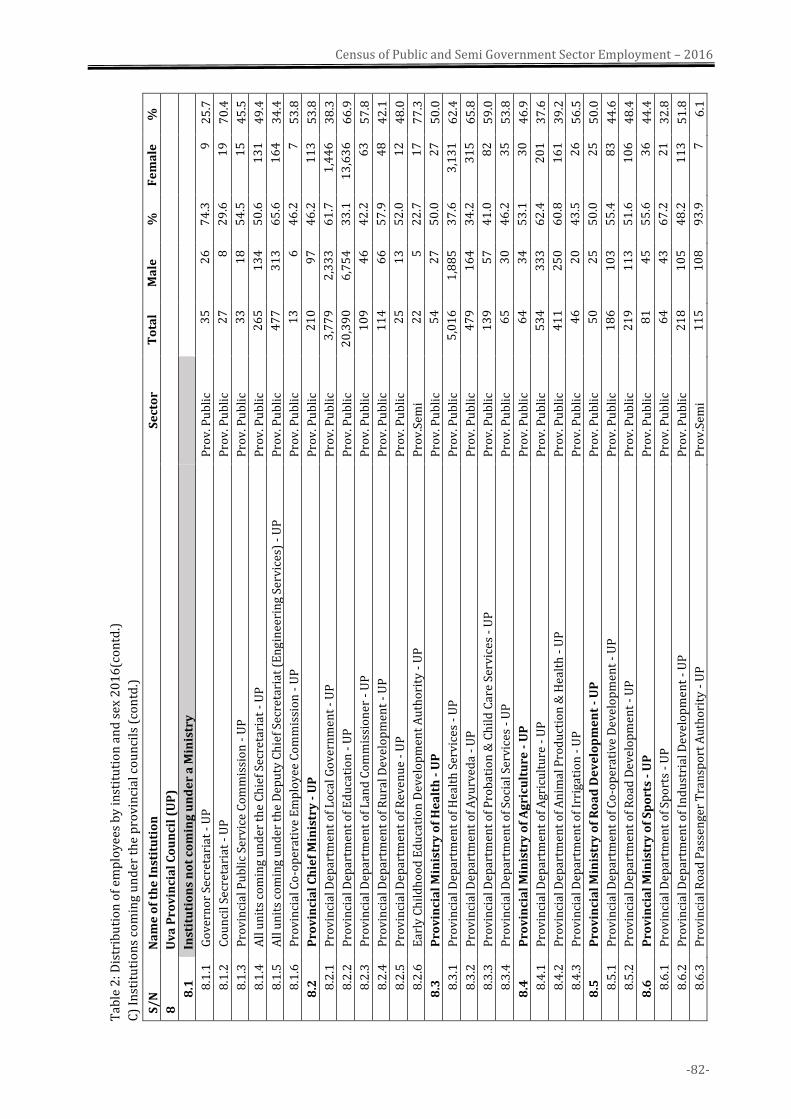
-82-
Census of Public and Semi Government Sector Employment – 2016
T
able
2: D
istr
ibu
tio
n o
f em
plo
yee
s b
y in
stit
uti
on
an
d s
ex 2
01
6(c
on
td.)
C)
Inst
itu
tio
ns
com
ing
un
der
th
e p
rov
inci
al c
ou
nci
ls (
con
td.)
S/
N
Na
me
of
the
In
stit
uti
on
S
ect
or
To
tal
Ma
le
%
Fe
ma
le
%
8
Uv
a P
rov
inci
al
Co
un
cil
(UP
)
8.1
In
stit
uti
on
s n
ot
com
ing
un
de
r a
Min
istr
y
8.1
.1
Go
ver
no
r Se
cret
aria
t -
UP
P
rov
. Pu
bli
c 3
5
26
7
4.3
9
2
5.7
8.1
.2
Co
un
cil S
ecre
tari
at -
UP
P
rov
. Pu
bli
c 2
7
8
29
.6
19
7
0.4
8.1
.3
Pro
vin
cial
Pu
bli
c Se
rvic
e C
om
mis
sio
n -
UP
P
rov
. Pu
bli
c 3
3
18
5
4.5
1
5
45
.5
8.1
.4
All
un
its
com
ing
un
der
th
e C
hie
f Se
cret
aria
t -
UP
P
rov
. Pu
bli
c 2
65
1
34
5
0.6
1
31
4
9.4
8.1
.5
All
un
its
com
ing
un
der
th
e D
epu
ty C
hie
f Se
cret
aria
t (E
ng
inee
rin
g Se
rvic
es)
- U
P
Pro
v. P
ub
lic
47
7
31
3
65
.6
16
4
34
.4
8.1
.6
Pro
vin
cial
Co
-op
erat
ive
Em
plo
yee
Co
mm
issi
on
- U
P
Pro
v. P
ub
lic
13
6
4
6.2
7
5
3.8
8.2
P
rov
inci
al
Ch
ief
Min
istr
y -
UP
P
rov
. Pu
bli
c 2
10
9
7
46
.2
11
3
53
.8
8.2
.1
Pro
vin
cial
Dep
artm
ent
of
Lo
cal G
ov
ern
men
t -
UP
P
rov
. Pu
bli
c 3
,77
9
2,3
33
6
1.7
1
,44
6
38
.3
8.2
.2
Pro
vin
cial
Dep
artm
ent
of
Ed
uca
tio
n -
UP
P
rov
. Pu
bli
c 2
0,3
90
6
,75
4
33
.1
13
,63
6
66
.9
8.2
.3
Pro
vin
cial
Dep
artm
ent
of
Lan
d C
om
mis
sio
ner
- U
P
Pro
v. P
ub
lic
10
9
46
4
2.2
6
3
57
.8
8.2
.4
Pro
vin
cial
Dep
artm
ent
of
Ru
ral D
evel
op
men
t -
UP
P
rov
. Pu
bli
c 1
14
6
6
57
.9
48
4
2.1
8.2
.5
Pro
vin
cial
Dep
artm
ent
of
Rev
enu
e -
UP
P
rov
. Pu
bli
c 2
5
13
5
2.0
1
2
48
.0
8.2
.6
Ear
ly C
hil
dh
oo
d E
du
cati
on
Dev
elo
pm
ent
Au
tho
rity
- U
P
Pro
v.S
emi
22
5
2
2.7
1
7
77
.3
8.3
P
rov
inci
al
Min
istr
y o
f H
ea
lth
- U
P
Pro
v. P
ub
lic
54
2
7
50
.0
27
5
0.0
8.3
.1
Pro
vin
cial
Dep
artm
ent
of
Hea
lth
Ser
vic
es -
UP
P
rov
. Pu
bli
c 5
,01
6
1,8
85
3
7.6
3
,13
1
62
.4
8.3
.2
Pro
vin
cial
Dep
artm
ent
of
Ay
urv
eda
- U
P
Pro
v. P
ub
lic
47
9
16
4
34
.2
31
5
65
.8
8.3
.3
Pro
vin
cial
Dep
artm
ent
of
Pro
bat
ion
& C
hil
d C
are
Serv
ices
- U
P
Pro
v. P
ub
lic
13
9
57
4
1.0
8
2
59
.0
8.3
.4
Pro
vin
cial
Dep
artm
ent
of
Soci
al S
erv
ices
- U
P
Pro
v. P
ub
lic
65
3
0
46
.2
35
5
3.8
8.4
P
rov
inci
al
Min
istr
y o
f A
gri
cult
ure
- U
P
Pro
v. P
ub
lic
64
3
4
53
.1
30
4
6.9
8.4
.1
Pro
vin
cial
Dep
artm
ent
of
Agr
icu
ltu
re -
UP
P
rov
. Pu
bli
c 5
34
3
33
6
2.4
2
01
3
7.6
8.4
.2
Pro
vin
cial
Dep
artm
ent
of
An
imal
Pro
du
ctio
n &
Hea
lth
- U
P
Pro
v. P
ub
lic
41
1
25
0
60
.8
16
1
39
.2
8.4
.3
Pro
vin
cial
Dep
artm
ent
of
Irri
gati
on
- U
P
Pro
v. P
ub
lic
46
2
0
43
.5
26
5
6.5
8.5
P
rov
inci
al
Min
istr
y o
f R
oa
d D
ev
elo
pm
en
t -
UP
P
rov
. Pu
bli
c 5
0
25
5
0.0
2
5
50
.0
8.5
.1
Pro
vin
cial
Dep
artm
ent
of
Co
-op
erat
ive
Dev
elo
pm
ent
- U
P
Pro
v. P
ub
lic
18
6
10
3
55
.4
83
4
4.6
8.5
.2
Pro
vin
cial
Dep
artm
ent
of
Ro
ad D
evel
op
men
t -
UP
P
rov
. Pu
bli
c 2
19
1
13
5
1.6
1
06
4
8.4
8.6
P
rov
inci
al
Min
istr
y o
f S
po
rts
- U
P
Pro
v. P
ub
lic
81
4
5
55
.6
36
4
4.4
8.6
.1
Pro
vin
cial
Dep
artm
ent
of
Spo
rts
- U
P
Pro
v. P
ub
lic
64
4
3
67
.2
21
3
2.8
8.6
.2
Pro
vin
cial
Dep
artm
ent
of
Ind
ust
rial
Dev
elo
pm
ent
- U
P
Pro
v. P
ub
lic
21
8
10
5
48
.2
11
3
51
.8
8.6
.3
Pro
vin
cial
Ro
ad P
asse
nge
r T
ran
spo
rt A
uth
ori
ty -
UP
P
rov
.Sem
i 1
15
1
08
9
3.9
7
6
.1
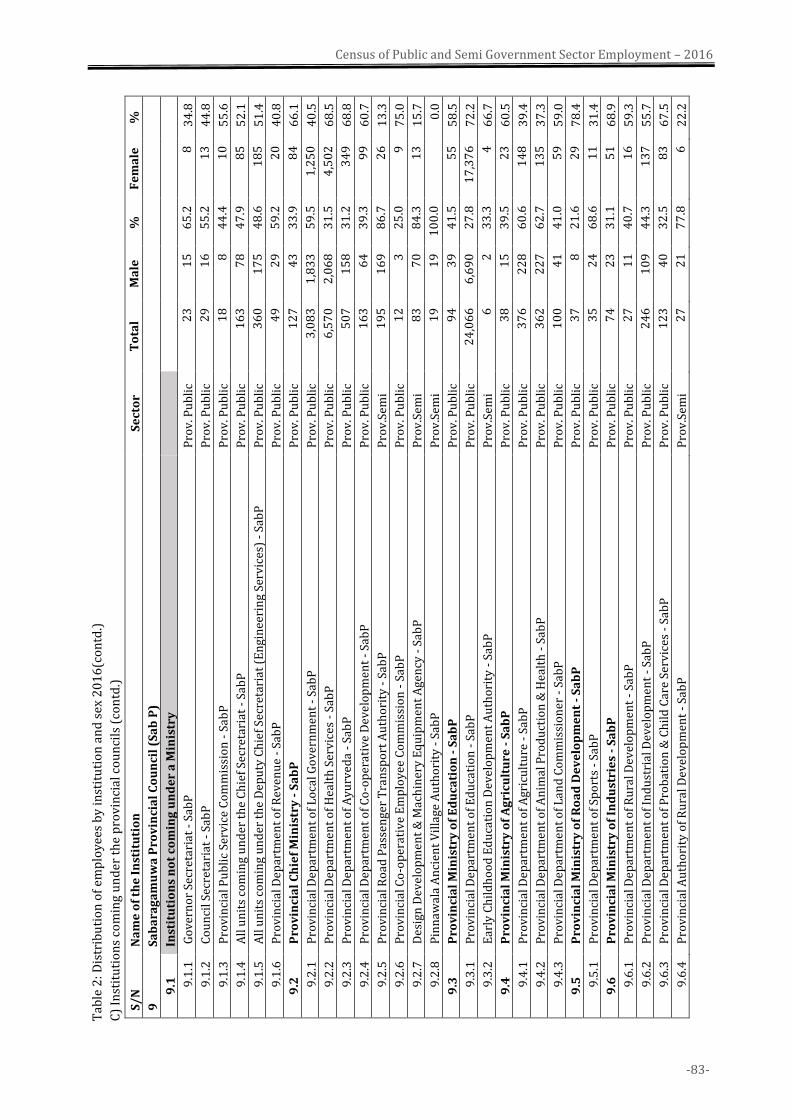
-83-
Census of Public and Semi Government Sector Employment – 2016
T
able
2: D
istr
ibu
tio
n o
f em
plo
yee
s b
y in
stit
uti
on
an
d s
ex 2
01
6(c
on
td.)
C)
Inst
itu
tio
ns
com
ing
un
der
th
e p
rov
inci
al c
ou
nci
ls (
con
td.)
S/
N
Na
me
of
the
In
stit
uti
on
S
ect
or
To
tal
Ma
le
%
Fe
ma
le
%
9
Sa
ba
rag
am
uw
a P
rov
inci
al
Co
un
cil
(Sa
b P
)
9.1
In
stit
uti
on
s n
ot
com
ing
un
de
r a
Min
istr
y
9.1
.1
Go
ver
no
r Se
cret
aria
t -
Sab
P
Pro
v. P
ub
lic
23
1
5
65
.2
8
34
.8
9.1
.2
Co
un
cil S
ecre
tari
at -
Sab
P
Pro
v. P
ub
lic
29
1
6
55
.2
13
4
4.8
9.1
.3
Pro
vin
cial
Pu
bli
c Se
rvic
e C
om
mis
sio
n -
Sab
P
Pro
v. P
ub
lic
18
8
4
4.4
1
0
55
.6
9.1
.4
All
un
its
com
ing
un
der
th
e C
hie
f Se
cret
aria
t -
Sab
P
Pro
v. P
ub
lic
16
3
78
4
7.9
8
5
52
.1
9.1
.5
All
un
its
com
ing
un
der
th
e D
epu
ty C
hie
f S
ecre
tari
at (
En
gin
eeri
ng
Serv
ices
) -
Sab
P
Pro
v. P
ub
lic
36
0
17
5
48
.6
18
5
51
.4
9.1
.6
Pro
vin
cial
Dep
artm
ent
of
Rev
enu
e -
Sab
P
Pro
v. P
ub
lic
49
2
9
59
.2
20
4
0.8
9.2
P
rov
inci
al
Ch
ief
Min
istr
y -
Sa
bP
P
rov
. Pu
bli
c 1
27
4
3
33
.9
84
6
6.1
9.2
.1
Pro
vin
cial
Dep
artm
ent
of
Lo
cal G
ov
ern
men
t -
Sab
P
Pro
v. P
ub
lic
3,0
83
1
,83
3
59
.5
1,2
50
4
0.5
9.2
.2
Pro
vin
cial
Dep
artm
ent
of
Hea
lth
Ser
vic
es -
Sab
P
Pro
v. P
ub
lic
6,5
70
2
,06
8
31
.5
4,5
02
6
8.5
9.2
.3
Pro
vin
cial
Dep
artm
ent
of
Ay
urv
eda
- Sa
bP
P
rov
. Pu
bli
c 5
07
1
58
3
1.2
3
49
6
8.8
9.2
.4
Pro
vin
cial
Dep
artm
ent
of
Co
-op
erat
ive
Dev
elo
pm
ent
- Sa
bP
P
rov
. Pu
bli
c 1
63
6
4
39
.3
99
6
0.7
9.2
.5
Pro
vin
cial
Ro
ad P
asse
nge
r T
ran
spo
rt A
uth
ori
ty -
Sab
P
Pro
v.S
emi
19
5
16
9
86
.7
26
1
3.3
9.2
.6
Pro
vin
cial
Co
-op
erat
ive
Em
plo
yee
Co
mm
issi
on
- S
abP
P
rov
. Pu
bli
c 1
2
3
25
.0
9
75
.0
9.2
.7
Des
ign
Dev
elo
pm
ent
& M
ach
iner
y E
qu
ipm
ent
Age
ncy
- S
abP
P
rov
.Sem
i 8
3
70
8
4.3
1
3
15
.7
9.2
.8
Pin
naw
ala
An
cien
t V
illa
ge A
uth
ori
ty -
Sab
P
Pro
v.S
emi
19
1
9
10
0.0
0.0
9.3
P
rov
inci
al
Min
istr
y o
f E
du
cati
on
- S
ab
P
Pro
v. P
ub
lic
94
3
9
41
.5
55
5
8.5
9.3
.1
Pro
vin
cial
Dep
artm
ent
of
Ed
uca
tio
n -
Sab
P
Pro
v. P
ub
lic
24
,06
6
6,6
90
2
7.8
1
7,3
76
7
2.2
9.3
.2
Ear
ly C
hil
dh
oo
d E
du
cati
on
Dev
elo
pm
ent
Au
tho
rity
- S
abP
P
rov
.Sem
i 6
2
3
3.3
4
6
6.7
9.4
P
rov
inci
al
Min
istr
y o
f A
gri
cult
ure
- S
ab
P
Pro
v. P
ub
lic
38
1
5
39
.5
23
6
0.5
9.4
.1
Pro
vin
cial
Dep
artm
ent
of
Agr
icu
ltu
re -
Sab
P
Pro
v. P
ub
lic
37
6
22
8
60
.6
14
8
39
.4
9.4
.2
Pro
vin
cial
Dep
artm
ent
of
An
imal
Pro
du
ctio
n &
Hea
lth
- S
abP
P
rov
. Pu
bli
c 3
62
2
27
6
2.7
1
35
3
7.3
9.4
.3
Pro
vin
cial
Dep
artm
ent
of
Lan
d C
om
mis
sio
ner
- S
abP
P
rov
. Pu
bli
c 1
00
4
1
41
.0
59
5
9.0
9.5
P
rov
inci
al
Min
istr
y o
f R
oa
d D
ev
elo
pm
en
t -
Sa
bP
P
rov
. Pu
bli
c 3
7
8
21
.6
29
7
8.4
9.5
.1
Pro
vin
cial
Dep
artm
ent
of
Spo
rts
- Sa
bP
P
rov
. Pu
bli
c 3
5
24
6
8.6
1
1
31
.4
9.6
P
rov
inci
al
Min
istr
y o
f In
du
stri
es
- S
ab
P
Pro
v. P
ub
lic
74
2
3
31
.1
51
6
8.9
9.6
.1
Pro
vin
cial
Dep
artm
ent
of
Ru
ral D
evel
op
men
t -
Sab
P
Pro
v. P
ub
lic
27
1
1
40
.7
16
5
9.3
9.6
.2
Pro
vin
cial
Dep
artm
ent
of
Ind
ust
rial
Dev
elo
pm
ent
- Sa
bP
P
rov
. Pu
bli
c 2
46
1
09
4
4.3
1
37
5
5.7
9.6
.3
Pro
vin
cial
Dep
artm
ent
of
Pro
bat
ion
& C
hil
d C
are
Serv
ices
- S
abP
P
rov
. Pu
bli
c 1
23
4
0
32
.5
83
6
7.5
9.6
.4
Pro
vin
cial
Au
tho
rity
of
Ru
ral D
evel
op
men
t -
Sab
P
Pro
v.S
emi
27
2
1
77
.8
6
22
.2
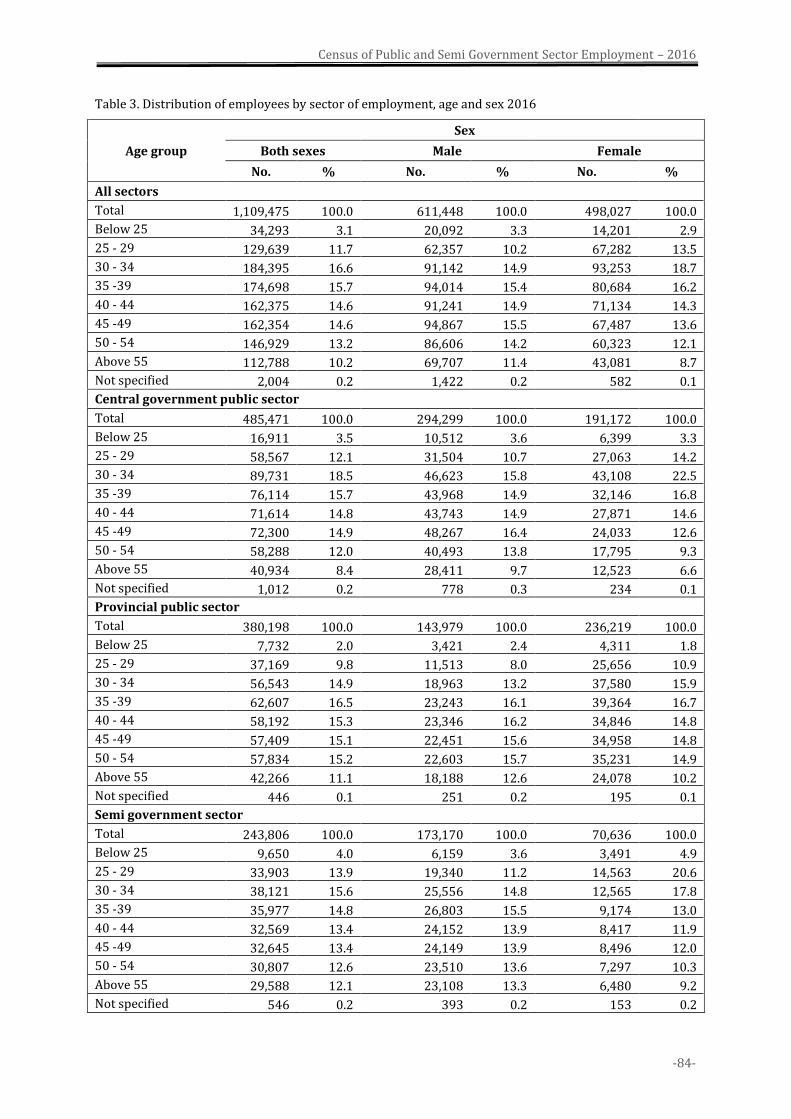
Census of Public and Semi Government Sector Employment – 2016
-84-
Table 3. Distribution of employees by sector of employment, age and sex 2016
Age group
Sex
Both sexes Male Female
No. % No. % No. %
All sectors
Total 1,109,475 100.0 611,448 100.0 498,027 100.0
Below 25 34,293 3.1 20,092 3.3 14,201 2.9
25 - 29 129,639 11.7 62,357 10.2 67,282 13.5
30 - 34 184,395 16.6 91,142 14.9 93,253 18.7
35 -39 174,698 15.7 94,014 15.4 80,684 16.2
40 - 44 162,375 14.6 91,241 14.9 71,134 14.3
45 -49 162,354 14.6 94,867 15.5 67,487 13.6
50 - 54 146,929 13.2 86,606 14.2 60,323 12.1
Above 55 112,788 10.2 69,707 11.4 43,081 8.7
Not specified 2,004 0.2 1,422 0.2 582 0.1
Central government public sector
Total 485,471 100.0 294,299 100.0 191,172 100.0
Below 25 16,911 3.5 10,512 3.6 6,399 3.3
25 - 29 58,567 12.1 31,504 10.7 27,063 14.2
30 - 34 89,731 18.5 46,623 15.8 43,108 22.5
35 -39 76,114 15.7 43,968 14.9 32,146 16.8
40 - 44 71,614 14.8 43,743 14.9 27,871 14.6
45 -49 72,300 14.9 48,267 16.4 24,033 12.6
50 - 54 58,288 12.0 40,493 13.8 17,795 9.3
Above 55 40,934 8.4 28,411 9.7 12,523 6.6
Not specified 1,012 0.2 778 0.3 234 0.1
Provincial public sector
Total 380,198 100.0 143,979 100.0 236,219 100.0
Below 25 7,732 2.0 3,421 2.4 4,311 1.8
25 - 29 37,169 9.8 11,513 8.0 25,656 10.9
30 - 34 56,543 14.9 18,963 13.2 37,580 15.9
35 -39 62,607 16.5 23,243 16.1 39,364 16.7
40 - 44 58,192 15.3 23,346 16.2 34,846 14.8
45 -49 57,409 15.1 22,451 15.6 34,958 14.8
50 - 54 57,834 15.2 22,603 15.7 35,231 14.9
Above 55 42,266 11.1 18,188 12.6 24,078 10.2
Not specified 446 0.1 251 0.2 195 0.1
Semi government sector
Total 243,806 100.0 173,170 100.0 70,636 100.0
Below 25 9,650 4.0 6,159 3.6 3,491 4.9
25 - 29 33,903 13.9 19,340 11.2 14,563 20.6
30 - 34 38,121 15.6 25,556 14.8 12,565 17.8
35 -39 35,977 14.8 26,803 15.5 9,174 13.0
40 - 44 32,569 13.4 24,152 13.9 8,417 11.9
45 -49 32,645 13.4 24,149 13.9 8,496 12.0
50 - 54 30,807 12.6 23,510 13.6 7,297 10.3
Above 55 29,588 12.1 23,108 13.3 6,480 9.2
Not specified 546 0.2 393 0.2 153 0.2
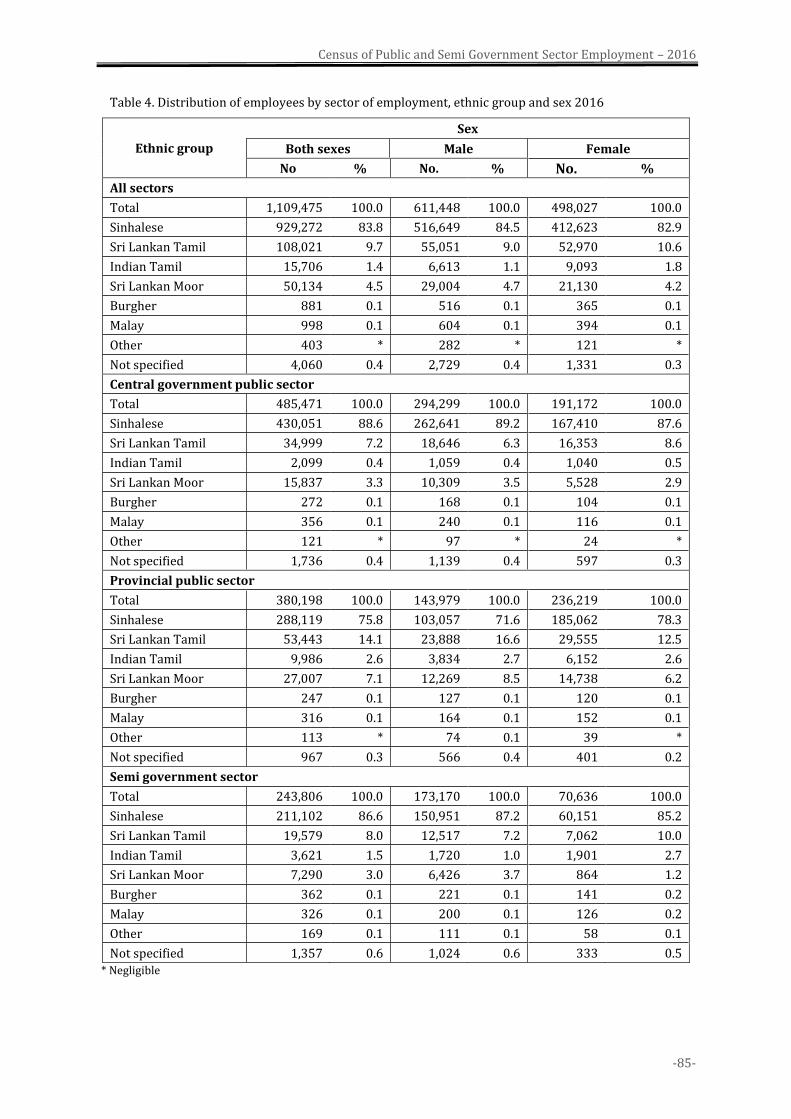
Census of Public and Semi Government Sector Employment – 2016
-85-
Table 4. Distribution of employees by sector of employment, ethnic group and sex 2016
Ethnic group
Sex
Both sexes Male Female
No % No. % No. %
All sectors
Total 1,109,475 100.0 611,448 100.0 498,027 100.0
Sinhalese 929,272 83.8 516,649 84.5 412,623 82.9
Sri Lankan Tamil 108,021 9.7 55,051 9.0 52,970 10.6
Indian Tamil 15,706 1.4 6,613 1.1 9,093 1.8
Sri Lankan Moor 50,134 4.5 29,004 4.7 21,130 4.2
Burgher 881 0.1 516 0.1 365 0.1
Malay 998 0.1 604 0.1 394 0.1
Other 403 * 282 * 121 *
Not specified 4,060 0.4 2,729 0.4 1,331 0.3
Central government public sector
Total 485,471 100.0 294,299 100.0 191,172 100.0
Sinhalese 430,051 88.6 262,641 89.2 167,410 87.6
Sri Lankan Tamil 34,999 7.2 18,646 6.3 16,353 8.6
Indian Tamil 2,099 0.4 1,059 0.4 1,040 0.5
Sri Lankan Moor 15,837 3.3 10,309 3.5 5,528 2.9
Burgher 272 0.1 168 0.1 104 0.1
Malay 356 0.1 240 0.1 116 0.1
Other 121 * 97 * 24 *
Not specified 1,736 0.4 1,139 0.4 597 0.3
Provincial public sector
Total 380,198 100.0 143,979 100.0 236,219 100.0
Sinhalese 288,119 75.8 103,057 71.6 185,062 78.3
Sri Lankan Tamil 53,443 14.1 23,888 16.6 29,555 12.5
Indian Tamil 9,986 2.6 3,834 2.7 6,152 2.6
Sri Lankan Moor 27,007 7.1 12,269 8.5 14,738 6.2
Burgher 247 0.1 127 0.1 120 0.1
Malay 316 0.1 164 0.1 152 0.1
Other 113 * 74 0.1 39 *
Not specified 967 0.3 566 0.4 401 0.2
Semi government sector
Total 243,806 100.0 173,170 100.0 70,636 100.0
Sinhalese 211,102 86.6 150,951 87.2 60,151 85.2
Sri Lankan Tamil 19,579 8.0 12,517 7.2 7,062 10.0
Indian Tamil 3,621 1.5 1,720 1.0 1,901 2.7
Sri Lankan Moor 7,290 3.0 6,426 3.7 864 1.2
Burgher 362 0.1 221 0.1 141 0.2
Malay 326 0.1 200 0.1 126 0.2
Other 169 0.1 111 0.1 58 0.1
Not specified 1,357 0.6 1,024 0.6 333 0.5
* Negligible
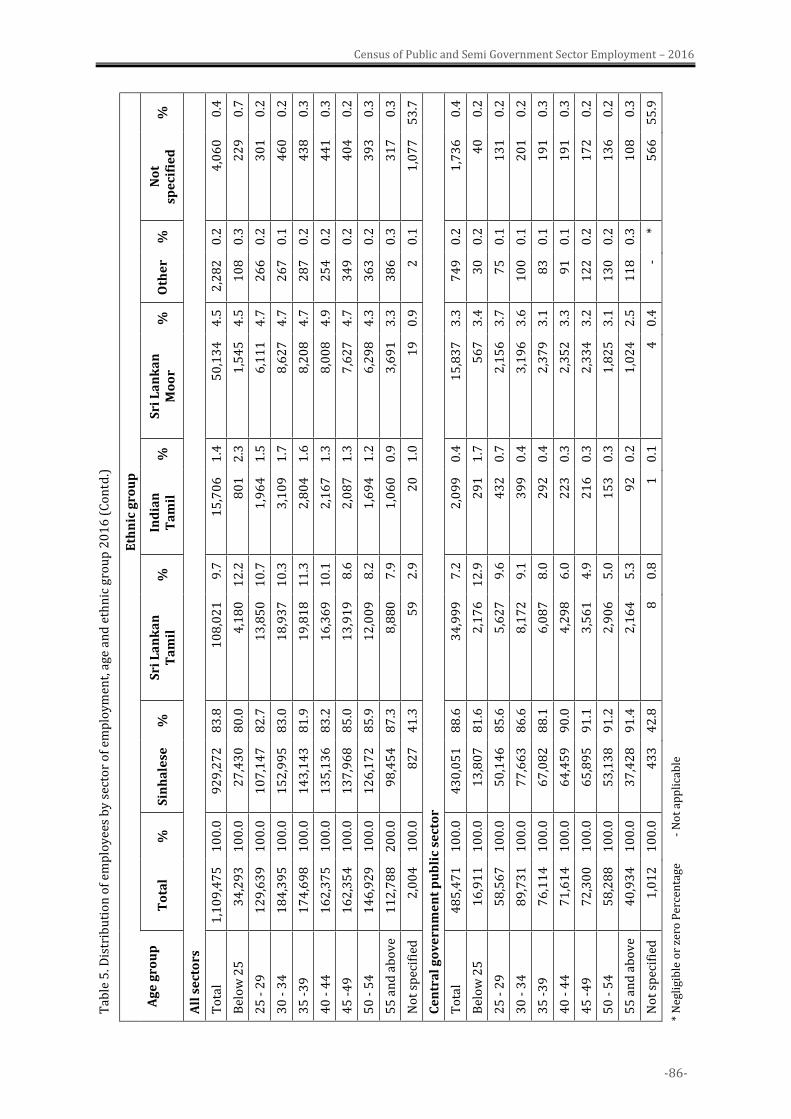
-86-
Census of Public and Semi Government Sector Employment – 2016
T
able
5. D
istr
ibu
tio
n o
f em
plo
yee
s b
y s
ecto
r o
f em
plo
ym
ent,
age
an
d e
thn
ic g
rou
p 2
01
6 (
Co
ntd
.)
Ag
e g
rou
p
Eth
nic
gro
up
To
tal
%
Sin
ha
lese
%
S
ri L
an
ka
n
Ta
mil
%
In
dia
n
Ta
mil
%
S
ri L
an
ka
n
Mo
or
%
Oth
er
%
No
t sp
eci
fie
d
%
All
se
cto
rs
To
tal
1,1
09
,47
5
10
0.0
9
29
,27
2
83
.8
10
8,0
21
9
.7
15
,70
6
1.4
5
0,1
34
4
.5
2,2
82
0
.2
4,0
60
0
.4
Bel
ow
25
3
4,2
93
1
00
.0
27
,43
0
80
.0
4,1
80
1
2.2
8
01
2
.3
1,5
45
4
.5
10
8
0.3
2
29
0
.7
25
- 2
9
12
9,6
39
1
00
.0
10
7,1
47
8
2.7
1
3,8
50
1
0.7
1
,96
4
1.5
6
,11
1
4.7
2
66
0
.2
30
1
0.2
30
- 3
4
18
4,3
95
1
00
.0
15
2,9
95
8
3.0
1
8,9
37
1
0.3
3
,10
9
1.7
8
,62
7
4.7
2
67
0
.1
46
0
0.2
35
-3
9
17
4,6
98
1
00
.0
14
3,1
43
8
1.9
1
9,8
18
1
1.3
2
,80
4
1.6
8
,20
8
4.7
2
87
0
.2
43
8
0.3
40
- 4
4
16
2,3
75
1
00
.0
13
5,1
36
8
3.2
1
6,3
69
1
0.1
2
,16
7
1.3
8
,00
8
4.9
2
54
0
.2
44
1
0.3
45
-4
9
16
2,3
54
1
00
.0
13
7,9
68
8
5.0
1
3,9
19
8
.6
2,0
87
1
.3
7,6
27
4
.7
34
9
0.2
4
04
0
.2
50
- 5
4
14
6,9
29
1
00
.0
12
6,1
72
8
5.9
1
2,0
09
8
.2
1,6
94
1
.2
6,2
98
4
.3
36
3
0.2
3
93
0
.3
55
an
d a
bo
ve
11
2,7
88
2
00
.0
98
,45
4
87
.3
8,8
80
7
.9
1,0
60
0
.9
3,6
91
3
.3
38
6
0.3
3
17
0
.3
No
t sp
ecif
ied
2
,00
4
10
0.0
8
27
4
1.3
5
9
2.9
2
0
1.0
1
9
0.9
2
0
.1
1,0
77
5
3.7
Ce
ntr
al
go
ve
rnm
en
t p
ub
lic
sect
or
To
tal
48
5,4
71
1
00
.0
43
0,0
51
8
8.6
3
4,9
99
7
.2
2,0
99
0
.4
15
,83
7
3.3
7
49
0
.2
1,7
36
0
.4
Bel
ow
25
1
6,9
11
1
00
.0
13
,80
7
81
.6
2,1
76
1
2.9
2
91
1
.7
56
7
3.4
3
0
0.2
4
0
0.2
25
- 2
9
58
,56
7
10
0.0
5
0,1
46
8
5.6
5
,62
7
9.6
4
32
0
.7
2,1
56
3
.7
75
0
.1
13
1
0.2
30
- 3
4
89
,73
1
10
0.0
7
7,6
63
8
6.6
8
,17
2
9.1
3
99
0
.4
3,1
96
3
.6
10
0
0.1
2
01
0
.2
35
-3
9
76
,11
4
10
0.0
6
7,0
82
8
8.1
6
,08
7
8.0
2
92
0
.4
2,3
79
3
.1
83
0
.1
19
1
0.3
40
- 4
4
71
,61
4
10
0.0
6
4,4
59
9
0.0
4
,29
8
6.0
2
23
0
.3
2,3
52
3
.3
91
0
.1
19
1
0.3
45
-4
9
72
,30
0
10
0.0
6
5,8
95
9
1.1
3
,56
1
4.9
2
16
0
.3
2,3
34
3
.2
12
2
0.2
1
72
0
.2
50
- 5
4
58
,28
8
10
0.0
5
3,1
38
9
1.2
2
,90
6
5.0
1
53
0
.3
1,8
25
3
.1
13
0
0.2
1
36
0
.2
55
an
d a
bo
ve
40
,93
4
10
0.0
3
7,4
28
9
1.4
2
,16
4
5.3
9
2
0.2
1
,02
4
2.5
1
18
0
.3
10
8
0.3
No
t sp
ecif
ied
1
,01
2
10
0.0
4
33
4
2.8
8
0
.8
1
0.1
4
0
.4
- *
56
6
55
.9
* N
egli
gib
le o
r ze
ro P
erce
nta
ge
- N
ot
app
lica
ble
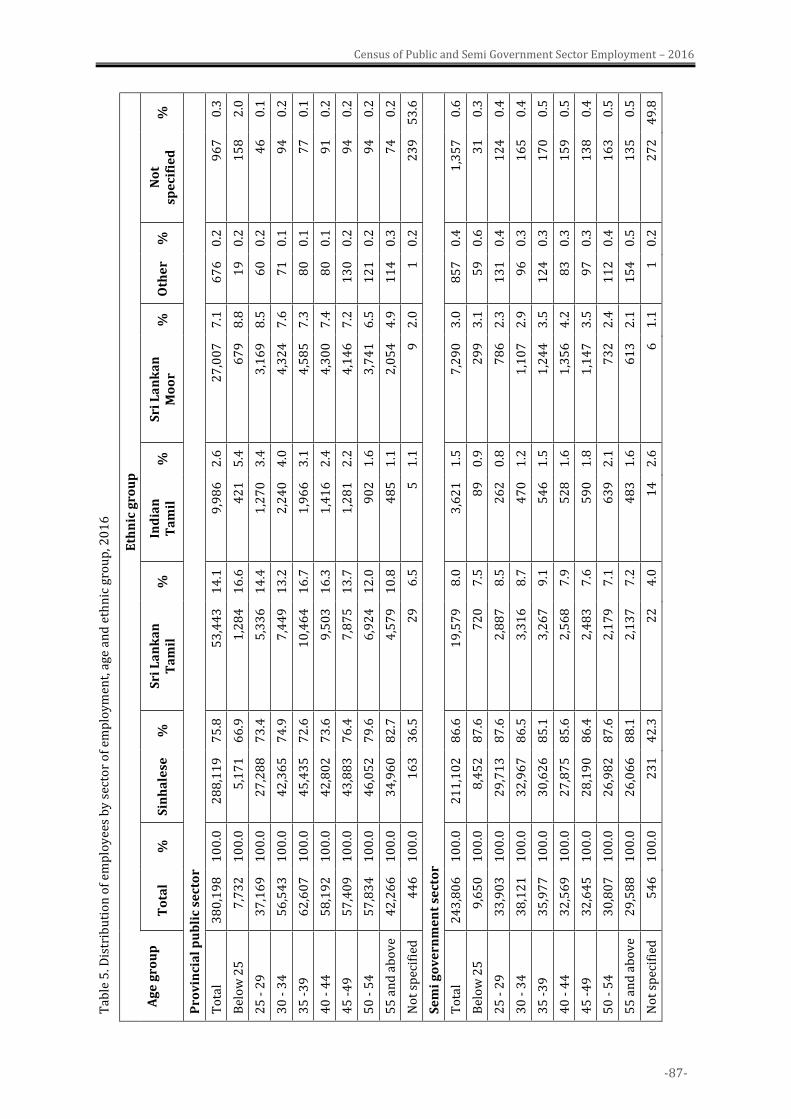
-87-
Census of Public and Semi Government Sector Employment – 2016
T
able
5. D
istr
ibu
tio
n o
f em
plo
yee
s b
y s
ecto
r o
f em
plo
ym
ent,
age
an
d e
thn
ic g
rou
p, 2
01
6
Ag
e g
rou
p
Eth
nic
gro
up
To
tal
%
Sin
ha
lese
%
S
ri L
an
ka
n
Ta
mil
%
In
dia
n
Ta
mil
%
S
ri L
an
ka
n
Mo
or
%
Oth
er
%
No
t sp
eci
fie
d
%
Pro
vin
cia
l p
ub
lic
sect
or
To
tal
38
0,1
98
1
00
.0
28
8,1
19
7
5.8
5
3,4
43
1
4.1
9
,98
6
2.6
2
7,0
07
7
.1
67
6
0.2
9
67
0
.3
Bel
ow
25
7
,73
2
10
0.0
5
,17
1
66
.9
1,2
84
1
6.6
4
21
5
.4
67
9
8.8
1
9
0.2
1
58
2
.0
25
- 2
9
37
,16
9
10
0.0
2
7,2
88
7
3.4
5
,33
6
14
.4
1,2
70
3
.4
3,1
69
8
.5
60
0
.2
46
0
.1
30
- 3
4
56
,54
3
10
0.0
4
2,3
65
7
4.9
7
,44
9
13
.2
2,2
40
4
.0
4,3
24
7
.6
71
0
.1
94
0
.2
35
-3
9
62
,60
7
10
0.0
4
5,4
35
7
2.6
1
0,4
64
1
6.7
1
,96
6
3.1
4
,58
5
7.3
8
0
0.1
7
7
0.1
40
- 4
4
58
,19
2
10
0.0
4
2,8
02
7
3.6
9
,50
3
16
.3
1,4
16
2
.4
4,3
00
7
.4
80
0
.1
91
0
.2
45
-4
9
57
,40
9
10
0.0
4
3,8
83
7
6.4
7
,87
5
13
.7
1,2
81
2
.2
4,1
46
7
.2
13
0
0.2
9
4
0.2
50
- 5
4
57
,83
4
10
0.0
4
6,0
52
7
9.6
6
,92
4
12
.0
90
2
1.6
3
,74
1
6.5
1
21
0
.2
94
0
.2
55
an
d a
bo
ve
42
,26
6
10
0.0
3
4,9
60
8
2.7
4
,57
9
10
.8
48
5
1.1
2
,05
4
4.9
1
14
0
.3
74
0
.2
No
t sp
ecif
ied
4
46
1
00
.0
16
3
36
.5
29
6
.5
5
1.1
9
2
.0
1
0.2
2
39
5
3.6
Se
mi
go
ve
rnm
en
t se
cto
r
To
tal
24
3,8
06
1
00
.0
21
1,1
02
8
6.6
1
9,5
79
8
.0
3,6
21
1
.5
7,2
90
3
.0
85
7
0.4
1
,35
7
0.6
Bel
ow
25
9
,65
0
10
0.0
8
,45
2
87
.6
72
0
7.5
8
9
0.9
2
99
3
.1
59
0
.6
31
0
.3
25
- 2
9
33
,90
3
10
0.0
2
9,7
13
8
7.6
2
,88
7
8.5
2
62
0
.8
78
6
2.3
1
31
0
.4
12
4
0.4
30
- 3
4
38
,12
1
10
0.0
3
2,9
67
8
6.5
3
,31
6
8.7
4
70
1
.2
1,1
07
2
.9
96
0
.3
16
5
0.4
35
-3
9
35
,97
7
10
0.0
3
0,6
26
8
5.1
3
,26
7
9.1
5
46
1
.5
1,2
44
3
.5
12
4
0.3
1
70
0
.5
40
- 4
4
32
,56
9
10
0.0
2
7,8
75
8
5.6
2
,56
8
7.9
5
28
1
.6
1,3
56
4
.2
83
0
.3
15
9
0.5
45
-4
9
32
,64
5
10
0.0
2
8,1
90
8
6.4
2
,48
3
7.6
5
90
1
.8
1,1
47
3
.5
97
0
.3
13
8
0.4
50
- 5
4
30
,80
7
10
0.0
2
6,9
82
8
7.6
2
,17
9
7.1
6
39
2
.1
73
2
2.4
1
12
0
.4
16
3
0.5
55
an
d a
bo
ve
29
,58
8
10
0.0
2
6,0
66
8
8.1
2
,13
7
7.2
4
83
1
.6
61
3
2.1
1
54
0
.5
13
5
0.5
No
t sp
ecif
ied
5
46
1
00
.0
23
1
42
.3
22
4
.0
14
2
.6
6
1.1
1
0
.2
27
2
49
.8
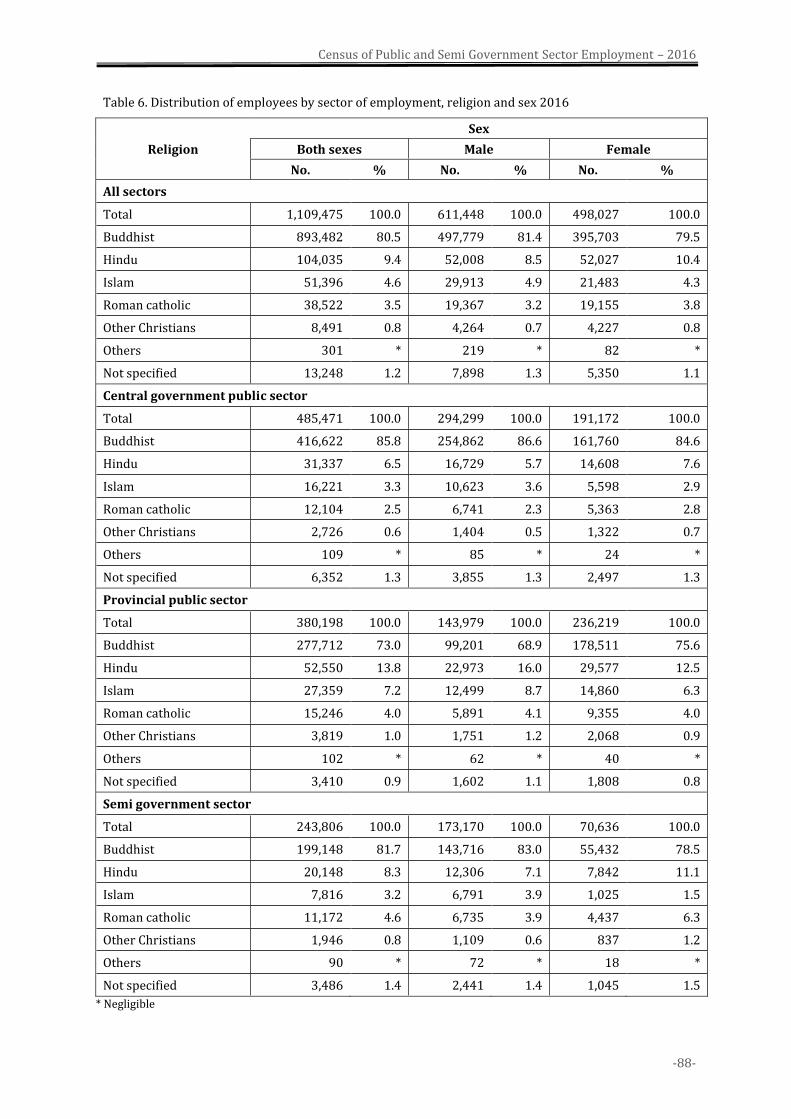
Census of Public and Semi Government Sector Employment – 2016
-88-
Table 6. Distribution of employees by sector of employment, religion and sex 2016
Religion
Sex
Both sexes Male Female
No. % No. % No. %
All sectors
Total 1,109,475 100.0 611,448 100.0 498,027 100.0
Buddhist 893,482 80.5 497,779 81.4 395,703 79.5
Hindu 104,035 9.4 52,008 8.5 52,027 10.4
Islam 51,396 4.6 29,913 4.9 21,483 4.3
Roman catholic 38,522 3.5 19,367 3.2 19,155 3.8
Other Christians 8,491 0.8 4,264 0.7 4,227 0.8
Others 301 * 219 * 82 *
Not specified 13,248 1.2 7,898 1.3 5,350 1.1
Central government public sector
Total 485,471 100.0 294,299 100.0 191,172 100.0
Buddhist 416,622 85.8 254,862 86.6 161,760 84.6
Hindu 31,337 6.5 16,729 5.7 14,608 7.6
Islam 16,221 3.3 10,623 3.6 5,598 2.9
Roman catholic 12,104 2.5 6,741 2.3 5,363 2.8
Other Christians 2,726 0.6 1,404 0.5 1,322 0.7
Others 109 * 85 * 24 *
Not specified 6,352 1.3 3,855 1.3 2,497 1.3
Provincial public sector
Total 380,198 100.0 143,979 100.0 236,219 100.0
Buddhist 277,712 73.0 99,201 68.9 178,511 75.6
Hindu 52,550 13.8 22,973 16.0 29,577 12.5
Islam 27,359 7.2 12,499 8.7 14,860 6.3
Roman catholic 15,246 4.0 5,891 4.1 9,355 4.0
Other Christians 3,819 1.0 1,751 1.2 2,068 0.9
Others 102 * 62 * 40 *
Not specified 3,410 0.9 1,602 1.1 1,808 0.8
Semi government sector
Total 243,806 100.0 173,170 100.0 70,636 100.0
Buddhist 199,148 81.7 143,716 83.0 55,432 78.5
Hindu 20,148 8.3 12,306 7.1 7,842 11.1
Islam 7,816 3.2 6,791 3.9 1,025 1.5
Roman catholic 11,172 4.6 6,735 3.9 4,437 6.3
Other Christians 1,946 0.8 1,109 0.6 837 1.2
Others 90 * 72 * 18 *
Not specified 3,486 1.4 2,441 1.4 1,045 1.5
* Negligible
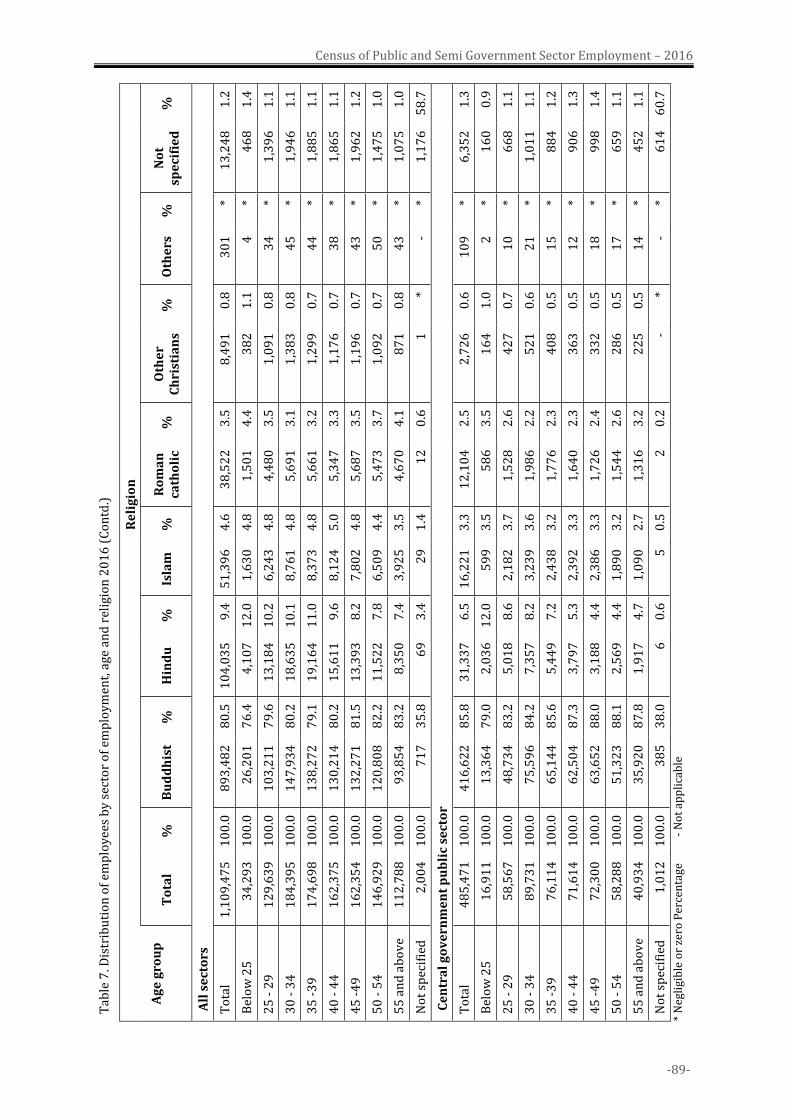
-89-
Census of Public and Semi Government Sector Employment – 2016
T
able
7. D
istr
ibu
tio
n o
f em
plo
yee
s b
y s
ecto
r o
f em
plo
ym
ent,
age
an
d r
elig
ion
20
16
(C
on
td.)
Ag
e g
rou
p
Re
lig
ion
To
tal
%
Bu
dd
his
t %
H
ind
u
%
Isla
m
%
Ro
ma
n
cath
oli
c %
O
the
r C
hri
stia
ns
%
Oth
ers
%
N
ot
spe
cifi
ed
%
All
se
cto
rs
To
tal
1,1
09
,47
5
10
0.0
8
93
,48
2
80
.5
10
4,0
35
9
.4
51
,39
6
4.6
3
8,5
22
3
.5
8,4
91
0
.8
30
1
* 1
3,2
48
1
.2
Bel
ow
25
3
4,2
93
1
00
.0
26
,20
1
76
.4
4,1
07
1
2.0
1
,63
0
4.8
1
,50
1
4.4
3
82
1
.1
4
* 4
68
1
.4
25
- 2
9
12
9,6
39
1
00
.0
10
3,2
11
7
9.6
1
3,1
84
1
0.2
6
,24
3
4.8
4
,48
0
3.5
1
,09
1
0.8
3
4
* 1
,39
6
1.1
30
- 3
4
18
4,3
95
1
00
.0
14
7,9
34
8
0.2
1
8,6
35
1
0.1
8
,76
1
4.8
5
,69
1
3.1
1
,38
3
0.8
4
5
* 1
,94
6
1.1
35
-3
9
17
4,6
98
1
00
.0
13
8,2
72
7
9.1
1
9,1
64
1
1.0
8
,37
3
4.8
5
,66
1
3.2
1
,29
9
0.7
4
4
* 1
,88
5
1.1
40
- 4
4
16
2,3
75
1
00
.0
13
0,2
14
8
0.2
1
5,6
11
9
.6
8,1
24
5
.0
5,3
47
3
.3
1,1
76
0
.7
38
*
1,8
65
1
.1
45
-4
9
16
2,3
54
1
00
.0
13
2,2
71
8
1.5
1
3,3
93
8
.2
7,8
02
4
.8
5,6
87
3
.5
1,1
96
0
.7
43
*
1,9
62
1
.2
50
- 5
4
14
6,9
29
1
00
.0
12
0,8
08
8
2.2
1
1,5
22
7
.8
6,5
09
4
.4
5,4
73
3
.7
1,0
92
0
.7
50
*
1,4
75
1
.0
55
an
d a
bo
ve
11
2,7
88
1
00
.0
93
,85
4
83
.2
8,3
50
7
.4
3,9
25
3
.5
4,6
70
4
.1
87
1
0.8
4
3
* 1
,07
5
1.0
No
t sp
ecif
ied
2
,00
4
10
0.0
7
17
3
5.8
6
9
3.4
2
9
1.4
1
2
0.6
1
*
- *
1,1
76
5
8.7
Ce
ntr
al
go
ve
rnm
en
t p
ub
lic
sect
or
To
tal
48
5,4
71
1
00
.0
41
6,6
22
8
5.8
3
1,3
37
6
.5
16
,22
1
3.3
1
2,1
04
2
.5
2,7
26
0
.6
10
9
* 6
,35
2
1.3
Bel
ow
25
1
6,9
11
1
00
.0
13
,36
4
79
.0
2,0
36
1
2.0
5
99
3
.5
58
6
3.5
1
64
1
.0
2
* 1
60
0
.9
25
- 2
9
58
,56
7
10
0.0
4
8,7
34
8
3.2
5
,01
8
8.6
2
,18
2
3.7
1
,52
8
2.6
4
27
0
.7
10
*
66
8
1.1
30
- 3
4
89
,73
1
10
0.0
7
5,5
96
8
4.2
7
,35
7
8.2
3
,23
9
3.6
1
,98
6
2.2
5
21
0
.6
21
*
1,0
11
1
.1
35
-3
9
76
,11
4
10
0.0
6
5,1
44
8
5.6
5
,44
9
7.2
2
,43
8
3.2
1
,77
6
2.3
4
08
0
.5
15
*
88
4
1.2
40
- 4
4
71
,61
4
10
0.0
6
2,5
04
8
7.3
3
,79
7
5.3
2
,39
2
3.3
1
,64
0
2.3
3
63
0
.5
12
*
90
6
1.3
45
-4
9
72
,30
0
10
0.0
6
3,6
52
8
8.0
3
,18
8
4.4
2
,38
6
3.3
1
,72
6
2.4
3
32
0
.5
18
*
99
8
1.4
50
- 5
4
58
,28
8
10
0.0
5
1,3
23
8
8.1
2
,56
9
4.4
1
,89
0
3.2
1
,54
4
2.6
2
86
0
.5
17
*
65
9
1.1
55
an
d a
bo
ve
40
,93
4
10
0.0
3
5,9
20
8
7.8
1
,91
7
4.7
1
,09
0
2.7
1
,31
6
3.2
2
25
0
.5
14
*
45
2
1.1
No
t sp
ecif
ied
1
,01
2
10
0.0
3
85
3
8.0
6
0
.6
5
0.5
2
0
.2
- *
- *
61
4
60
.7
* N
egli
gib
le o
r ze
ro P
erce
nta
ge
- N
ot
app
lica
ble
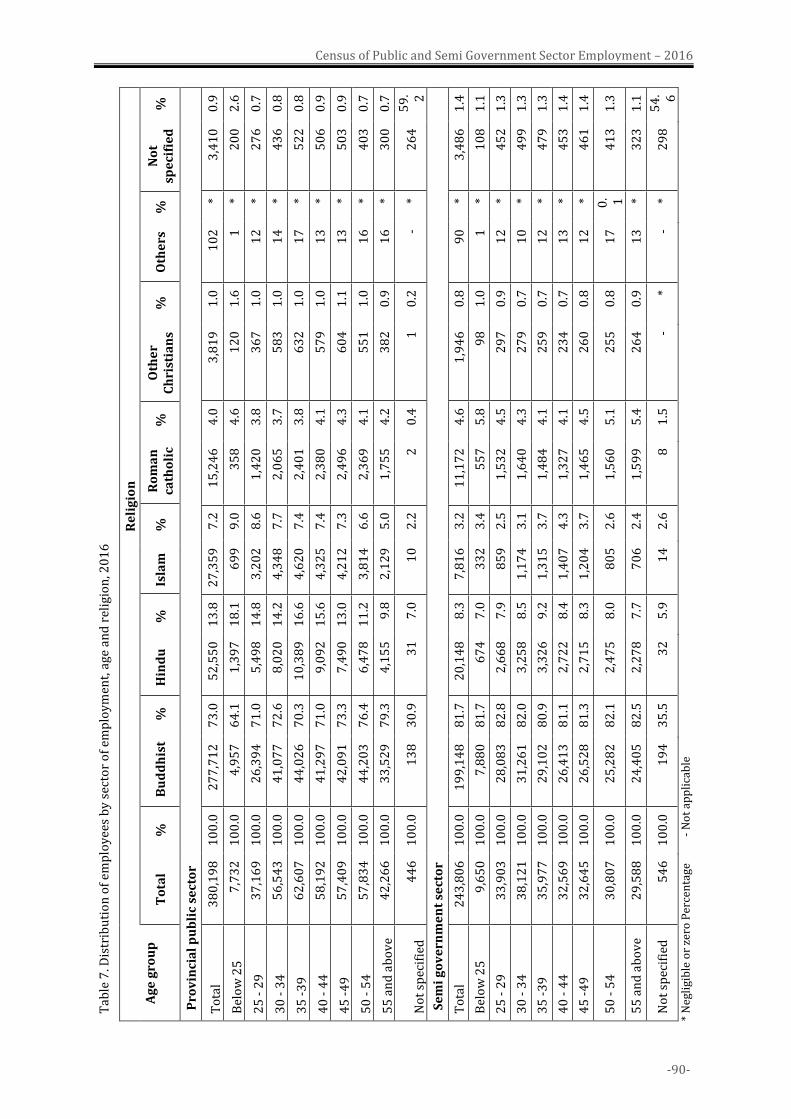
-90-
Census of Public and Semi Government Sector Employment – 2016
T
able
7. D
istr
ibu
tio
n o
f em
plo
yee
s b
y s
ecto
r o
f em
plo
ym
ent,
age
an
d r
elig
ion
, 20
16
Ag
e g
rou
p
Re
lig
ion
To
tal
%
Bu
dd
his
t %
H
ind
u
%
Isla
m
%
Ro
ma
n
cath
oli
c %
O
the
r C
hri
stia
ns
%
Oth
ers
%
N
ot
spe
cifi
ed
%
Pro
vin
cia
l p
ub
lic
sect
or
To
tal
38
0,1
98
1
00
.0
27
7,7
12
7
3.0
5
2,5
50
1
3.8
2
7,3
59
7
.2
15
,24
6
4.0
3
,81
9
1.0
1
02
*
3,4
10
0
.9
Bel
ow
25
7
,73
2
10
0.0
4
,95
7
64
.1
1,3
97
1
8.1
6
99
9
.0
35
8
4.6
1
20
1
.6
1
* 2
00
2
.6
25
- 2
9
37
,16
9
10
0.0
2
6,3
94
7
1.0
5
,49
8
14
.8
3,2
02
8
.6
1,4
20
3
.8
36
7
1.0
1
2
* 2
76
0
.7
30
- 3
4
56
,54
3
10
0.0
4
1,0
77
7
2.6
8
,02
0
14
.2
4,3
48
7
.7
2,0
65
3
.7
58
3
1.0
1
4
* 4
36
0
.8
35
-3
9
62
,60
7
10
0.0
4
4,0
26
7
0.3
1
0,3
89
1
6.6
4
,62
0
7.4
2
,40
1
3.8
6
32
1
.0
17
*
52
2
0.8
40
- 4
4
58
,19
2
10
0.0
4
1,2
97
7
1.0
9
,09
2
15
.6
4,3
25
7
.4
2,3
80
4
.1
57
9
1.0
1
3
* 5
06
0
.9
45
-4
9
57
,40
9
10
0.0
4
2,0
91
7
3.3
7
,49
0
13
.0
4,2
12
7
.3
2,4
96
4
.3
60
4
1.1
1
3
* 5
03
0
.9
50
- 5
4
57
,83
4
10
0.0
4
4,2
03
7
6.4
6
,47
8
11
.2
3,8
14
6
.6
2,3
69
4
.1
55
1
1.0
1
6
* 4
03
0
.7
55
an
d a
bo
ve
42
,26
6
10
0.0
3
3,5
29
7
9.3
4
,15
5
9.8
2
,12
9
5.0
1
,75
5
4.2
3
82
0
.9
16
*
30
0
0.7
No
t sp
ecif
ied
4
46
1
00
.0
13
8
30
.9
31
7
.0
10
2
.2
2
0.4
1
0
.2
- *
26
4
59
. 2
Se
mi
go
ve
rnm
en
t se
cto
r
To
tal
24
3,8
06
1
00
.0
19
9,1
48
8
1.7
2
0,1
48
8
.3
7,8
16
3
.2
11
,17
2
4.6
1
,94
6
0.8
9
0
* 3
,48
6
1.4
Bel
ow
25
9
,65
0
10
0.0
7
,88
0
81
.7
67
4
7.0
3
32
3
.4
55
7
5.8
9
8
1.0
1
*
10
8
1.1
25
- 2
9
33
,90
3
10
0.0
2
8,0
83
8
2.8
2
,66
8
7.9
8
59
2
.5
1,5
32
4
.5
29
7
0.9
1
2
* 4
52
1
.3
30
- 3
4
38
,12
1
10
0.0
3
1,2
61
8
2.0
3
,25
8
8.5
1
,17
4
3.1
1
,64
0
4.3
2
79
0
.7
10
*
49
9
1.3
35
-3
9
35
,97
7
10
0.0
2
9,1
02
8
0.9
3
,32
6
9.2
1
,31
5
3.7
1
,48
4
4.1
2
59
0
.7
12
*
47
9
1.3
40
- 4
4
32
,56
9
10
0.0
2
6,4
13
8
1.1
2
,72
2
8.4
1
,40
7
4.3
1
,32
7
4.1
2
34
0
.7
13
*
45
3
1.4
45
-4
9
32
,64
5
10
0.0
2
6,5
28
8
1.3
2
,71
5
8.3
1
,20
4
3.7
1
,46
5
4.5
2
60
0
.8
12
*
46
1
1.4
50
- 5
4
30
,80
7
10
0.0
2
5,2
82
8
2.1
2
,47
5
8.0
8
05
2
.6
1,5
60
5
.1
25
5
0.8
1
7
0. 1
41
3
1.3
55
an
d a
bo
ve
29
,58
8
10
0.0
2
4,4
05
8
2.5
2
,27
8
7.7
7
06
2
.4
1,5
99
5
.4
26
4
0.9
1
3
* 3
23
1
.1
No
t sp
ecif
ied
5
46
1
00
.0
19
4
35
.5
32
5
.9
14
2
.6
8
1.5
-
* -
* 2
98
5
4. 6
* N
egli
gib
le o
r ze
ro P
erce
nta
ge
- N
ot
app
lica
ble
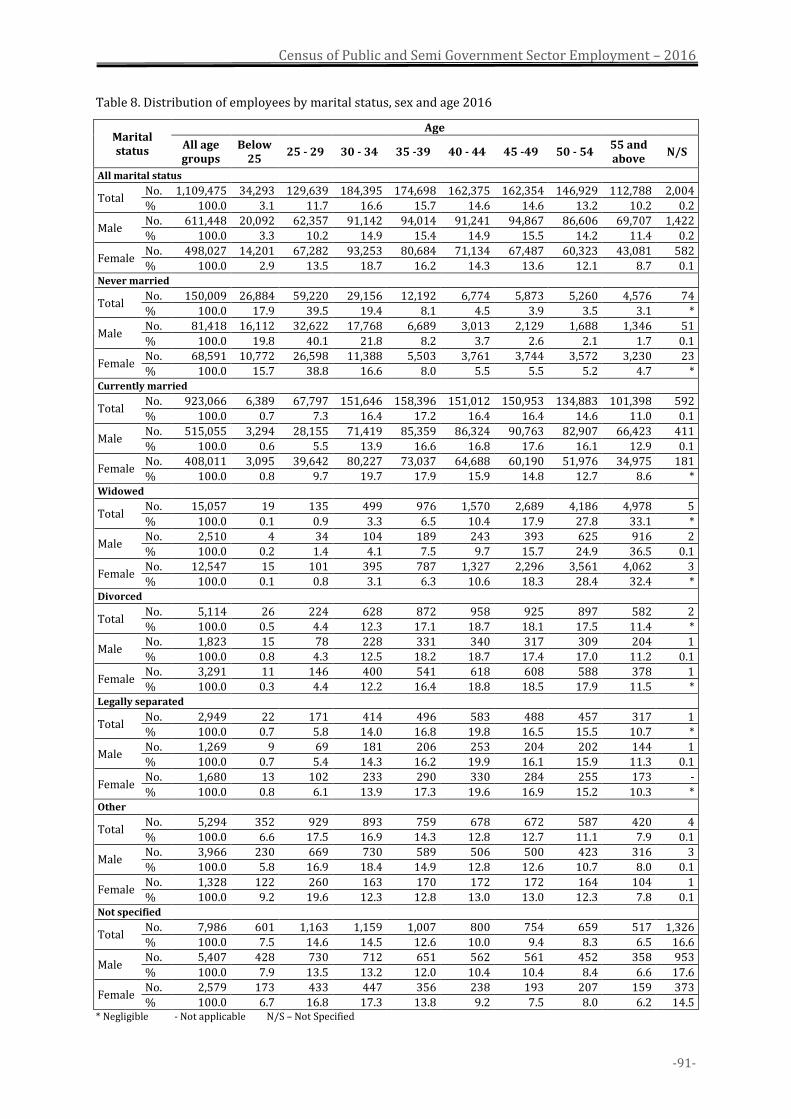
Census of Public and Semi Government Sector Employment – 2016
-91-
Table 8. Distribution of employees by marital status, sex and age 2016
Marital status
Age
All age groups
Below 25
25 - 29 30 - 34 35 -39 40 - 44 45 -49 50 - 54 55 and above
N/S
All marital status
Total No. 1,109,475 34,293 129,639 184,395 174,698 162,375 162,354 146,929 112,788 2,004
% 100.0 3.1 11.7 16.6 15.7 14.6 14.6 13.2 10.2 0.2
Male No. 611,448 20,092 62,357 91,142 94,014 91,241 94,867 86,606 69,707 1,422
% 100.0 3.3 10.2 14.9 15.4 14.9 15.5 14.2 11.4 0.2
Female No. 498,027 14,201 67,282 93,253 80,684 71,134 67,487 60,323 43,081 582
% 100.0 2.9 13.5 18.7 16.2 14.3 13.6 12.1 8.7 0.1 Never married
Total No. 150,009 26,884 59,220 29,156 12,192 6,774 5,873 5,260 4,576 74
% 100.0 17.9 39.5 19.4 8.1 4.5 3.9 3.5 3.1 *
Male No. 81,418 16,112 32,622 17,768 6,689 3,013 2,129 1,688 1,346 51
% 100.0 19.8 40.1 21.8 8.2 3.7 2.6 2.1 1.7 0.1
Female No. 68,591 10,772 26,598 11,388 5,503 3,761 3,744 3,572 3,230 23
% 100.0 15.7 38.8 16.6 8.0 5.5 5.5 5.2 4.7 * Currently married
Total No. 923,066 6,389 67,797 151,646 158,396 151,012 150,953 134,883 101,398 592
% 100.0 0.7 7.3 16.4 17.2 16.4 16.4 14.6 11.0 0.1
Male No. 515,055 3,294 28,155 71,419 85,359 86,324 90,763 82,907 66,423 411
% 100.0 0.6 5.5 13.9 16.6 16.8 17.6 16.1 12.9 0.1
Female No. 408,011 3,095 39,642 80,227 73,037 64,688 60,190 51,976 34,975 181
% 100.0 0.8 9.7 19.7 17.9 15.9 14.8 12.7 8.6 * Widowed
Total No. 15,057 19 135 499 976 1,570 2,689 4,186 4,978 5
% 100.0 0.1 0.9 3.3 6.5 10.4 17.9 27.8 33.1 *
Male No. 2,510 4 34 104 189 243 393 625 916 2
% 100.0 0.2 1.4 4.1 7.5 9.7 15.7 24.9 36.5 0.1
Female No. 12,547 15 101 395 787 1,327 2,296 3,561 4,062 3
% 100.0 0.1 0.8 3.1 6.3 10.6 18.3 28.4 32.4 * Divorced
Total No. 5,114 26 224 628 872 958 925 897 582 2
% 100.0 0.5 4.4 12.3 17.1 18.7 18.1 17.5 11.4 *
Male No. 1,823 15 78 228 331 340 317 309 204 1
% 100.0 0.8 4.3 12.5 18.2 18.7 17.4 17.0 11.2 0.1
Female No. 3,291 11 146 400 541 618 608 588 378 1
% 100.0 0.3 4.4 12.2 16.4 18.8 18.5 17.9 11.5 * Legally separated
Total No. 2,949 22 171 414 496 583 488 457 317 1
% 100.0 0.7 5.8 14.0 16.8 19.8 16.5 15.5 10.7 *
Male No. 1,269 9 69 181 206 253 204 202 144 1
% 100.0 0.7 5.4 14.3 16.2 19.9 16.1 15.9 11.3 0.1
Female No. 1,680 13 102 233 290 330 284 255 173 -
% 100.0 0.8 6.1 13.9 17.3 19.6 16.9 15.2 10.3 * Other
Total No. 5,294 352 929 893 759 678 672 587 420 4
% 100.0 6.6 17.5 16.9 14.3 12.8 12.7 11.1 7.9 0.1
Male No. 3,966 230 669 730 589 506 500 423 316 3
% 100.0 5.8 16.9 18.4 14.9 12.8 12.6 10.7 8.0 0.1
Female No. 1,328 122 260 163 170 172 172 164 104 1
% 100.0 9.2 19.6 12.3 12.8 13.0 13.0 12.3 7.8 0.1 Not specified
Total No. 7,986 601 1,163 1,159 1,007 800 754 659 517 1,326
% 100.0 7.5 14.6 14.5 12.6 10.0 9.4 8.3 6.5 16.6
Male No. 5,407 428 730 712 651 562 561 452 358 953
% 100.0 7.9 13.5 13.2 12.0 10.4 10.4 8.4 6.6 17.6
Female No. 2,579 173 433 447 356 238 193 207 159 373
% 100.0 6.7 16.8 17.3 13.8 9.2 7.5 8.0 6.2 14.5 * Negligible - Not applicable N/S – Not Specified
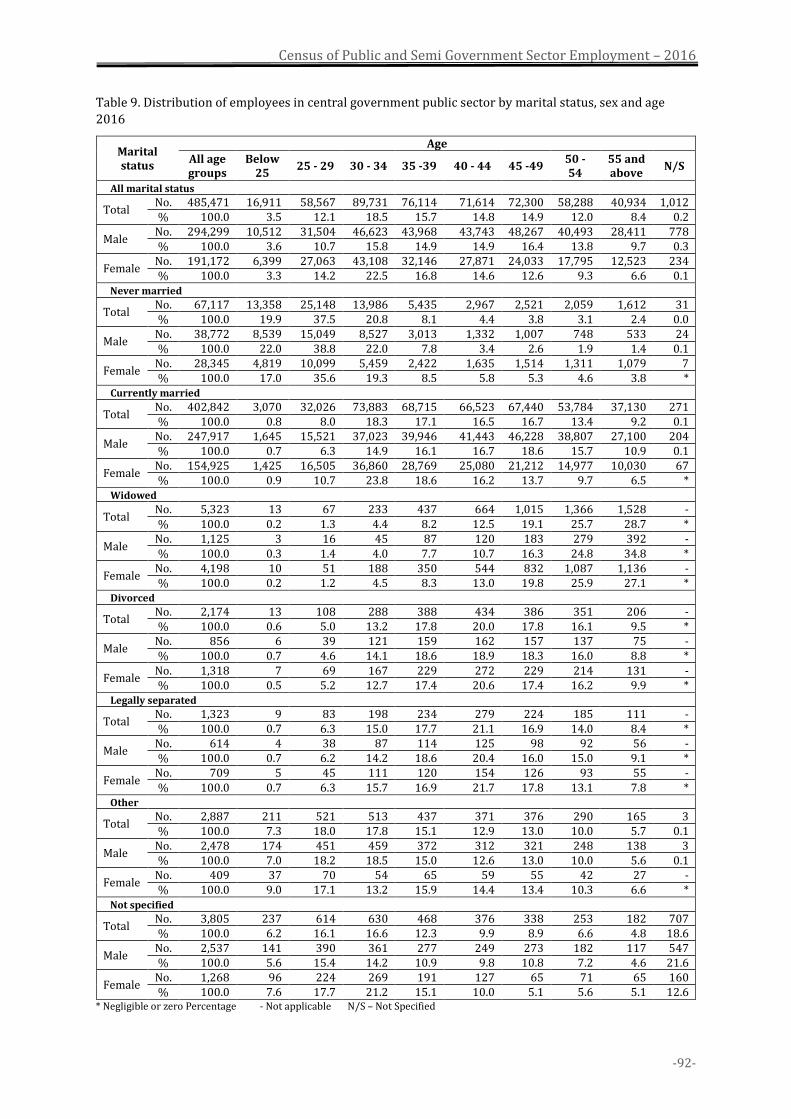
Census of Public and Semi Government Sector Employment – 2016
-92-
Table 9. Distribution of employees in central government public sector by marital status, sex and age
2016
Marital status
Age
All age groups
Below 25
25 - 29 30 - 34 35 -39 40 - 44 45 -49 50 - 54
55 and above
N/S
All marital status
Total No. 485,471 16,911 58,567 89,731 76,114 71,614 72,300 58,288 40,934 1,012 % 100.0 3.5 12.1 18.5 15.7 14.8 14.9 12.0 8.4 0.2
Male No. 294,299 10,512 31,504 46,623 43,968 43,743 48,267 40,493 28,411 778 % 100.0 3.6 10.7 15.8 14.9 14.9 16.4 13.8 9.7 0.3
Female No. 191,172 6,399 27,063 43,108 32,146 27,871 24,033 17,795 12,523 234 % 100.0 3.3 14.2 22.5 16.8 14.6 12.6 9.3 6.6 0.1
Never married
Total No. 67,117 13,358 25,148 13,986 5,435 2,967 2,521 2,059 1,612 31 % 100.0 19.9 37.5 20.8 8.1 4.4 3.8 3.1 2.4 0.0
Male No. 38,772 8,539 15,049 8,527 3,013 1,332 1,007 748 533 24 % 100.0 22.0 38.8 22.0 7.8 3.4 2.6 1.9 1.4 0.1
Female No. 28,345 4,819 10,099 5,459 2,422 1,635 1,514 1,311 1,079 7 % 100.0 17.0 35.6 19.3 8.5 5.8 5.3 4.6 3.8 *
Currently married
Total No. 402,842 3,070 32,026 73,883 68,715 66,523 67,440 53,784 37,130 271 % 100.0 0.8 8.0 18.3 17.1 16.5 16.7 13.4 9.2 0.1
Male No. 247,917 1,645 15,521 37,023 39,946 41,443 46,228 38,807 27,100 204 % 100.0 0.7 6.3 14.9 16.1 16.7 18.6 15.7 10.9 0.1
Female No. 154,925 1,425 16,505 36,860 28,769 25,080 21,212 14,977 10,030 67 % 100.0 0.9 10.7 23.8 18.6 16.2 13.7 9.7 6.5 *
Widowed
Total No. 5,323 13 67 233 437 664 1,015 1,366 1,528 - % 100.0 0.2 1.3 4.4 8.2 12.5 19.1 25.7 28.7 *
Male No. 1,125 3 16 45 87 120 183 279 392 - % 100.0 0.3 1.4 4.0 7.7 10.7 16.3 24.8 34.8 *
Female No. 4,198 10 51 188 350 544 832 1,087 1,136 - % 100.0 0.2 1.2 4.5 8.3 13.0 19.8 25.9 27.1 *
Divorced
Total No. 2,174 13 108 288 388 434 386 351 206 - % 100.0 0.6 5.0 13.2 17.8 20.0 17.8 16.1 9.5 *
Male No. 856 6 39 121 159 162 157 137 75 - % 100.0 0.7 4.6 14.1 18.6 18.9 18.3 16.0 8.8 *
Female No. 1,318 7 69 167 229 272 229 214 131 - % 100.0 0.5 5.2 12.7 17.4 20.6 17.4 16.2 9.9 *
Legally separated
Total No. 1,323 9 83 198 234 279 224 185 111 - % 100.0 0.7 6.3 15.0 17.7 21.1 16.9 14.0 8.4 *
Male No. 614 4 38 87 114 125 98 92 56 - % 100.0 0.7 6.2 14.2 18.6 20.4 16.0 15.0 9.1 *
Female No. 709 5 45 111 120 154 126 93 55 - % 100.0 0.7 6.3 15.7 16.9 21.7 17.8 13.1 7.8 *
Other
Total No. 2,887 211 521 513 437 371 376 290 165 3 % 100.0 7.3 18.0 17.8 15.1 12.9 13.0 10.0 5.7 0.1
Male No. 2,478 174 451 459 372 312 321 248 138 3 % 100.0 7.0 18.2 18.5 15.0 12.6 13.0 10.0 5.6 0.1
Female No. 409 37 70 54 65 59 55 42 27 - % 100.0 9.0 17.1 13.2 15.9 14.4 13.4 10.3 6.6 *
Not specified
Total No. 3,805 237 614 630 468 376 338 253 182 707 % 100.0 6.2 16.1 16.6 12.3 9.9 8.9 6.6 4.8 18.6
Male No. 2,537 141 390 361 277 249 273 182 117 547 % 100.0 5.6 15.4 14.2 10.9 9.8 10.8 7.2 4.6 21.6
Female No. 1,268 96 224 269 191 127 65 71 65 160 % 100.0 7.6 17.7 21.2 15.1 10.0 5.1 5.6 5.1 12.6
* Negligible or zero Percentage - Not applicable N/S – Not Specified
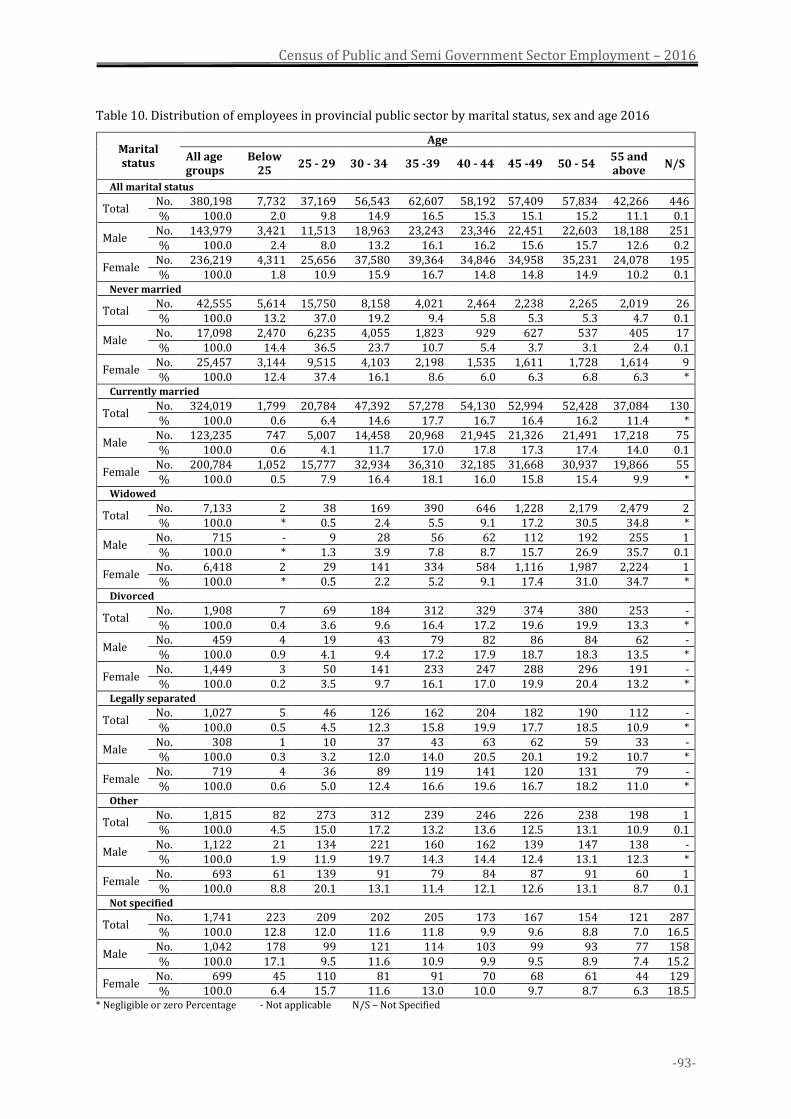
Census of Public and Semi Government Sector Employment – 2016
-93-
Table 10. Distribution of employees in provincial public sector by marital status, sex and age 2016
Marital status
Age
All age groups
Below 25
25 - 29 30 - 34 35 -39 40 - 44 45 -49 50 - 54 55 and above
N/S
All marital status
Total No. 380,198 7,732 37,169 56,543 62,607 58,192 57,409 57,834 42,266 446 % 100.0 2.0 9.8 14.9 16.5 15.3 15.1 15.2 11.1 0.1
Male No. 143,979 3,421 11,513 18,963 23,243 23,346 22,451 22,603 18,188 251 % 100.0 2.4 8.0 13.2 16.1 16.2 15.6 15.7 12.6 0.2
Female No. 236,219 4,311 25,656 37,580 39,364 34,846 34,958 35,231 24,078 195 % 100.0 1.8 10.9 15.9 16.7 14.8 14.8 14.9 10.2 0.1
Never married
Total No. 42,555 5,614 15,750 8,158 4,021 2,464 2,238 2,265 2,019 26 % 100.0 13.2 37.0 19.2 9.4 5.8 5.3 5.3 4.7 0.1
Male No. 17,098 2,470 6,235 4,055 1,823 929 627 537 405 17 % 100.0 14.4 36.5 23.7 10.7 5.4 3.7 3.1 2.4 0.1
Female No. 25,457 3,144 9,515 4,103 2,198 1,535 1,611 1,728 1,614 9 % 100.0 12.4 37.4 16.1 8.6 6.0 6.3 6.8 6.3 *
Currently married
Total No. 324,019 1,799 20,784 47,392 57,278 54,130 52,994 52,428 37,084 130 % 100.0 0.6 6.4 14.6 17.7 16.7 16.4 16.2 11.4 *
Male No. 123,235 747 5,007 14,458 20,968 21,945 21,326 21,491 17,218 75 % 100.0 0.6 4.1 11.7 17.0 17.8 17.3 17.4 14.0 0.1
Female No. 200,784 1,052 15,777 32,934 36,310 32,185 31,668 30,937 19,866 55 % 100.0 0.5 7.9 16.4 18.1 16.0 15.8 15.4 9.9 *
Widowed
Total No. 7,133 2 38 169 390 646 1,228 2,179 2,479 2 % 100.0 * 0.5 2.4 5.5 9.1 17.2 30.5 34.8 *
Male No. 715 - 9 28 56 62 112 192 255 1 % 100.0 * 1.3 3.9 7.8 8.7 15.7 26.9 35.7 0.1
Female No. 6,418 2 29 141 334 584 1,116 1,987 2,224 1 % 100.0 * 0.5 2.2 5.2 9.1 17.4 31.0 34.7 *
Divorced
Total No. 1,908 7 69 184 312 329 374 380 253 - % 100.0 0.4 3.6 9.6 16.4 17.2 19.6 19.9 13.3 *
Male No. 459 4 19 43 79 82 86 84 62 - % 100.0 0.9 4.1 9.4 17.2 17.9 18.7 18.3 13.5 *
Female No. 1,449 3 50 141 233 247 288 296 191 - % 100.0 0.2 3.5 9.7 16.1 17.0 19.9 20.4 13.2 *
Legally separated
Total No. 1,027 5 46 126 162 204 182 190 112 - % 100.0 0.5 4.5 12.3 15.8 19.9 17.7 18.5 10.9 *
Male No. 308 1 10 37 43 63 62 59 33 - % 100.0 0.3 3.2 12.0 14.0 20.5 20.1 19.2 10.7 *
Female No. 719 4 36 89 119 141 120 131 79 - % 100.0 0.6 5.0 12.4 16.6 19.6 16.7 18.2 11.0 *
Other
Total No. 1,815 82 273 312 239 246 226 238 198 1 % 100.0 4.5 15.0 17.2 13.2 13.6 12.5 13.1 10.9 0.1
Male No. 1,122 21 134 221 160 162 139 147 138 - % 100.0 1.9 11.9 19.7 14.3 14.4 12.4 13.1 12.3 *
Female No. 693 61 139 91 79 84 87 91 60 1 % 100.0 8.8 20.1 13.1 11.4 12.1 12.6 13.1 8.7 0.1
Not specified
Total No. 1,741 223 209 202 205 173 167 154 121 287 % 100.0 12.8 12.0 11.6 11.8 9.9 9.6 8.8 7.0 16.5
Male No. 1,042 178 99 121 114 103 99 93 77 158 % 100.0 17.1 9.5 11.6 10.9 9.9 9.5 8.9 7.4 15.2
Female No. 699 45 110 81 91 70 68 61 44 129 % 100.0 6.4 15.7 11.6 13.0 10.0 9.7 8.7 6.3 18.5
* Negligible or zero Percentage - Not applicable N/S – Not Specified
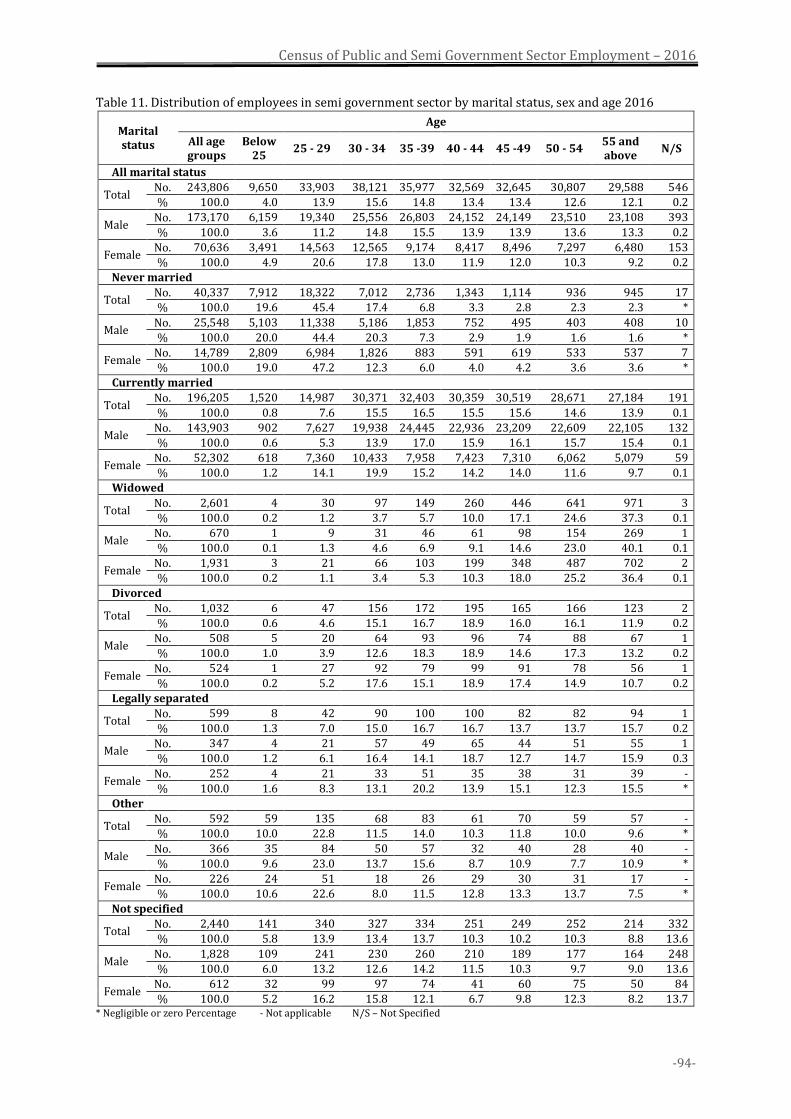
Census of Public and Semi Government Sector Employment – 2016
-94-
Table 11. Distribution of employees in semi government sector by marital status, sex and age 2016
Marital status
Age
All age groups
Below 25
25 - 29 30 - 34 35 -39 40 - 44 45 -49 50 - 54 55 and above
N/S
All marital status
Total No. 243,806 9,650 33,903 38,121 35,977 32,569 32,645 30,807 29,588 546
% 100.0 4.0 13.9 15.6 14.8 13.4 13.4 12.6 12.1 0.2
Male No. 173,170 6,159 19,340 25,556 26,803 24,152 24,149 23,510 23,108 393
% 100.0 3.6 11.2 14.8 15.5 13.9 13.9 13.6 13.3 0.2
Female No. 70,636 3,491 14,563 12,565 9,174 8,417 8,496 7,297 6,480 153
% 100.0 4.9 20.6 17.8 13.0 11.9 12.0 10.3 9.2 0.2
Never married
Total No. 40,337 7,912 18,322 7,012 2,736 1,343 1,114 936 945 17
% 100.0 19.6 45.4 17.4 6.8 3.3 2.8 2.3 2.3 *
Male No. 25,548 5,103 11,338 5,186 1,853 752 495 403 408 10
% 100.0 20.0 44.4 20.3 7.3 2.9 1.9 1.6 1.6 *
Female No. 14,789 2,809 6,984 1,826 883 591 619 533 537 7
% 100.0 19.0 47.2 12.3 6.0 4.0 4.2 3.6 3.6 *
Currently married
Total No. 196,205 1,520 14,987 30,371 32,403 30,359 30,519 28,671 27,184 191
% 100.0 0.8 7.6 15.5 16.5 15.5 15.6 14.6 13.9 0.1
Male No. 143,903 902 7,627 19,938 24,445 22,936 23,209 22,609 22,105 132
% 100.0 0.6 5.3 13.9 17.0 15.9 16.1 15.7 15.4 0.1
Female No. 52,302 618 7,360 10,433 7,958 7,423 7,310 6,062 5,079 59
% 100.0 1.2 14.1 19.9 15.2 14.2 14.0 11.6 9.7 0.1
Widowed
Total No. 2,601 4 30 97 149 260 446 641 971 3
% 100.0 0.2 1.2 3.7 5.7 10.0 17.1 24.6 37.3 0.1
Male No. 670 1 9 31 46 61 98 154 269 1
% 100.0 0.1 1.3 4.6 6.9 9.1 14.6 23.0 40.1 0.1
Female No. 1,931 3 21 66 103 199 348 487 702 2
% 100.0 0.2 1.1 3.4 5.3 10.3 18.0 25.2 36.4 0.1
Divorced
Total No. 1,032 6 47 156 172 195 165 166 123 2
% 100.0 0.6 4.6 15.1 16.7 18.9 16.0 16.1 11.9 0.2
Male No. 508 5 20 64 93 96 74 88 67 1
% 100.0 1.0 3.9 12.6 18.3 18.9 14.6 17.3 13.2 0.2
Female No. 524 1 27 92 79 99 91 78 56 1
% 100.0 0.2 5.2 17.6 15.1 18.9 17.4 14.9 10.7 0.2
Legally separated
Total No. 599 8 42 90 100 100 82 82 94 1
% 100.0 1.3 7.0 15.0 16.7 16.7 13.7 13.7 15.7 0.2
Male No. 347 4 21 57 49 65 44 51 55 1
% 100.0 1.2 6.1 16.4 14.1 18.7 12.7 14.7 15.9 0.3
Female No. 252 4 21 33 51 35 38 31 39 -
% 100.0 1.6 8.3 13.1 20.2 13.9 15.1 12.3 15.5 *
Other
Total No. 592 59 135 68 83 61 70 59 57 -
% 100.0 10.0 22.8 11.5 14.0 10.3 11.8 10.0 9.6 *
Male No. 366 35 84 50 57 32 40 28 40 -
% 100.0 9.6 23.0 13.7 15.6 8.7 10.9 7.7 10.9 *
Female No. 226 24 51 18 26 29 30 31 17 -
% 100.0 10.6 22.6 8.0 11.5 12.8 13.3 13.7 7.5 *
Not specified
Total No. 2,440 141 340 327 334 251 249 252 214 332
% 100.0 5.8 13.9 13.4 13.7 10.3 10.2 10.3 8.8 13.6
Male No. 1,828 109 241 230 260 210 189 177 164 248
% 100.0 6.0 13.2 12.6 14.2 11.5 10.3 9.7 9.0 13.6
Female No. 612 32 99 97 74 41 60 75 50 84
% 100.0 5.2 16.2 15.8 12.1 6.7 9.8 12.3 8.2 13.7 * Negligible or zero Percentage - Not applicable N/S – Not Specified
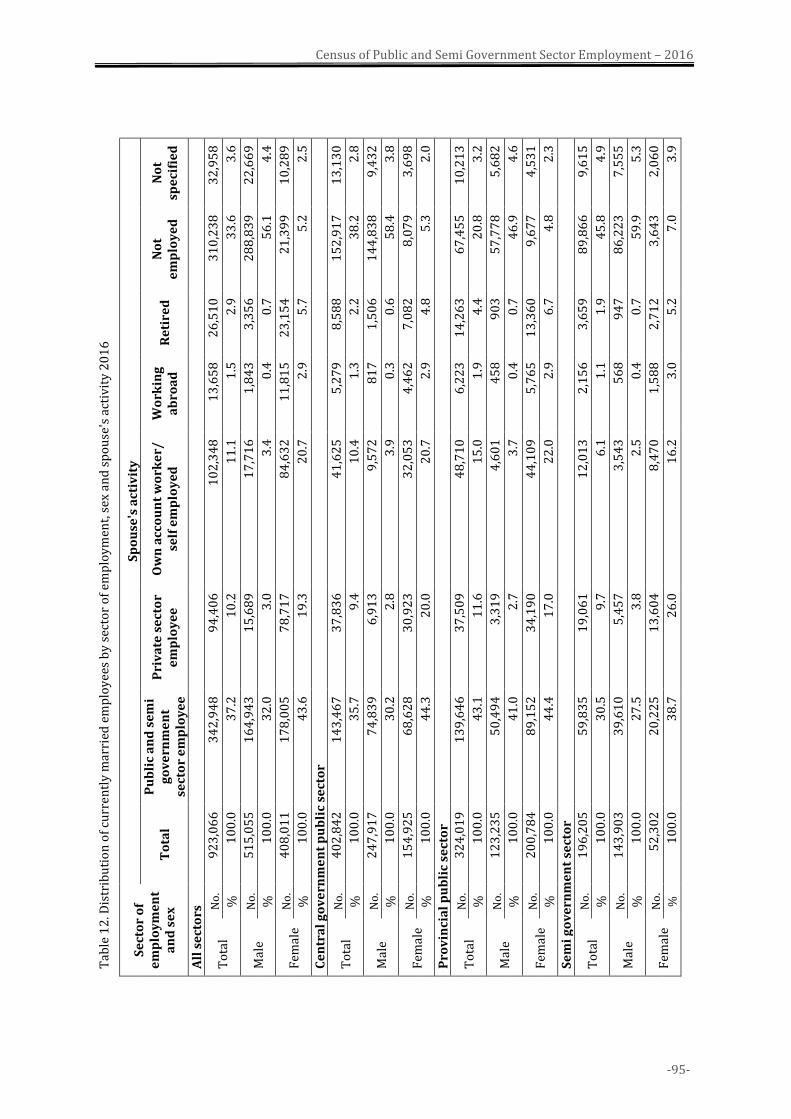
-95-
Census of Public and Semi Government Sector Employment – 2016
Tab
le 1
2. D
istr
ibu
tio
n o
f cu
rren
tly
mar
ried
em
plo
yee
s b
y s
ecto
r o
f em
plo
ym
ent,
sex
an
d s
po
use
's a
ctiv
ity
20
16
Se
cto
r o
f e
mp
loy
me
nt
an
d s
ex
Sp
ou
se's
act
ivit
y
To
tal
Pu
bli
c a
nd
se
mi
go
ve
rnm
en
t se
cto
r e
mp
loy
ee
Pri
va
te s
ect
or
em
plo
ye
e
Ow
n a
cco
un
t w
ork
er/
se
lf e
mp
loy
ed
W
ork
ing
a
bro
ad
R
eti
red
N
ot
em
plo
ye
d
No
t sp
eci
fie
d
All
se
cto
rs
To
tal
No
. 9
23
,06
6
34
2,9
48
9
4,4
06
1
02
,34
8
13
,65
8
26
,51
0
31
0,2
38
3
2,9
58
%
10
0.0
3
7.2
1
0.2
1
1.1
1
.5
2.9
3
3.6
3
.6
Mal
e N
o.
51
5,0
55
1
64
,94
3
15
,68
9
17
,71
6
1,8
43
3
,35
6
28
8,8
39
2
2,6
69
%
10
0.0
3
2.0
3
.0
3.4
0
.4
0.7
5
6.1
4
.4
Fem
ale
No
. 4
08
,01
1
17
8,0
05
7
8,7
17
8
4,6
32
1
1,8
15
2
3,1
54
2
1,3
99
1
0,2
89
%
10
0.0
4
3.6
1
9.3
2
0.7
2
.9
5.7
5
.2
2.5
Ce
ntr
al
go
ve
rnm
en
t p
ub
lic
sect
or
To
tal
No
. 4
02
,84
2
14
3,4
67
3
7,8
36
4
1,6
25
5
,27
9
8,5
88
1
52
,91
7
13
,13
0
%
10
0.0
3
5.7
9
.4
10
.4
1.3
2
.2
38
.2
2.8
Mal
e N
o.
24
7,9
17
7
4,8
39
6
,91
3
9,5
72
8
17
1
,50
6
14
4,8
38
9
,43
2
%
10
0.0
3
0.2
2
.8
3.9
0
.3
0.6
5
8.4
3
.8
Fem
ale
No
. 1
54
,92
5
68
,62
8
30
,92
3
32
,05
3
4,4
62
7
,08
2
8,0
79
3
,69
8
%
10
0.0
4
4.3
2
0.0
2
0.7
2
.9
4.8
5
.3
2.0
Pro
vin
cia
l p
ub
lic
sect
or
To
tal
No
. 3
24
,01
9
13
9,6
46
3
7,5
09
4
8,7
10
6
,22
3
14
,26
3
67
,45
5
10
,21
3
%
10
0.0
4
3.1
1
1.6
1
5.0
1
.9
4.4
2
0.8
3
.2
Mal
e N
o.
12
3,2
35
5
0,4
94
3
,31
9
4,6
01
4
58
9
03
5
7,7
78
5
,68
2
%
10
0.0
4
1.0
2
.7
3.7
0
.4
0.7
4
6.9
4
.6
Fem
ale
No
. 2
00
,78
4
89
,15
2
34
,19
0
44
,10
9
5,7
65
1
3,3
60
9
,67
7
4,5
31
%
10
0.0
4
4.4
1
7.0
2
2.0
2
.9
6.7
4
.8
2.3
Se
mi
go
ve
rnm
en
t se
cto
r
To
tal
No
. 1
96
,20
5
59
,83
5
19
,06
1
12
,01
3
2,1
56
3
,65
9
89
,86
6
9,6
15
%
10
0.0
3
0.5
9
.7
6.1
1
.1
1.9
4
5.8
4
.9
Mal
e N
o.
14
3,9
03
3
9,6
10
5
,45
7
3,5
43
5
68
9
47
8
6,2
23
7
,55
5
%
10
0.0
2
7.5
3
.8
2.5
0
.4
0.7
5
9.9
5
.3
Fem
ale
No
. 5
2,3
02
2
0,2
25
1
3,6
04
8
,47
0
1,5
88
2
,71
2
3,6
43
2
,06
0
%
10
0.0
3
8.7
2
6.0
1
6.2
3
.0
5.2
7
.0
3.9
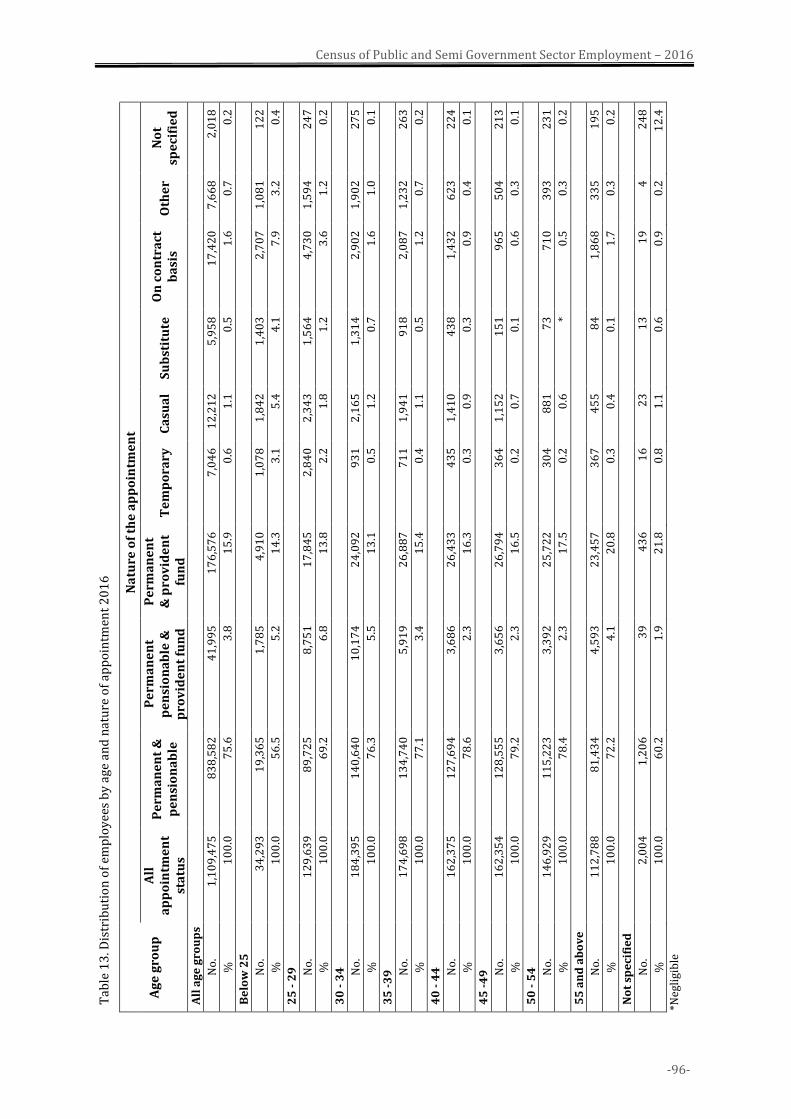
-96-
Census of Public and Semi Government Sector Employment – 2016
Tab
le 1
3. D
istr
ibu
tio
n o
f em
plo
yee
s b
y a
ge a
nd
nat
ure
of
app
oin
tmen
t 2
01
6
Ag
e g
rou
p
Na
ture
of
the
ap
po
intm
en
t
All
a
pp
oin
tme
nt
sta
tus
Pe
rma
ne
nt
&
pe
nsi
on
ab
le
Pe
rma
ne
nt
pe
nsi
on
ab
le &
p
rov
ide
nt
fun
d
Pe
rma
ne
nt
& p
rov
ide
nt
fun
d
Te
mp
ora
ry
Ca
sua
l S
ub
stit
ute
O
n c
on
tra
ct
ba
sis
Oth
er
No
t sp
eci
fie
d
All
ag
e g
rou
ps
No
. 1
,10
9,4
75
8
38
,58
2
41
,99
5
17
6,5
76
7
,04
6
12
,21
2
5,9
58
1
7,4
20
7
,66
8
2,0
18
%
10
0.0
7
5.6
3
.8
15
.9
0.6
1
.1
0.5
1
.6
0.7
0
.2
Be
low
25
No
. 3
4,2
93
1
9,3
65
1
,78
5
4,9
10
1
,07
8
1,8
42
1
,40
3
2,7
07
1
,08
1
12
2
%
10
0.0
5
6.5
5
.2
14
.3
3.1
5
.4
4.1
7
.9
3.2
0
.4
25
- 2
9
No
. 1
29
,63
9
89
,72
5
8,7
51
1
7,8
45
2
,84
0
2,3
43
1
,56
4
4,7
30
1
,59
4
24
7
%
10
0.0
6
9.2
6
.8
13
.8
2.2
1
.8
1.2
3
.6
1.2
0
.2
30
- 3
4
No
. 1
84
,39
5
14
0,6
40
1
0,1
74
2
4,0
92
9
31
2
,16
5
1,3
14
2
,90
2
1,9
02
2
75
%
10
0.0
7
6.3
5
.5
13
.1
0.5
1
.2
0.7
1
.6
1.0
0
.1
35
-3
9 No
. 1
74
,69
8
13
4,7
40
5
,91
9
26
,88
7
71
1
1,9
41
9
18
2
,08
7
1,2
32
2
63
%
10
0.0
7
7.1
3
.4
15
.4
0.4
1
.1
0.5
1
.2
0.7
0
.2
40
- 4
4
No
. 1
62
,37
5
12
7,6
94
3
,68
6
26
,43
3
43
5
1,4
10
4
38
1
,43
2
62
3
22
4
%
10
0.0
7
8.6
2
.3
16
.3
0.3
0
.9
0.3
0
.9
0.4
0
.1
45
-4
9 No
. 1
62
,35
4
12
8,5
55
3
,65
6
26
,79
4
36
4
1,1
52
1
51
9
65
5
04
2
13
%
10
0.0
7
9.2
2
.3
16
.5
0.2
0
.7
0.1
0
.6
0.3
0
.1
50
- 5
4
No
. 1
46
,92
9
11
5,2
23
3
,39
2
25
,72
2
30
4
88
1
73
7
10
3
93
2
31
%
10
0.0
7
8.4
2
.3
17
.5
0.2
0
.6
* 0
.5
0.3
0
.2
55
an
d a
bo
ve
No
. 1
12
,78
8
81
,43
4
4,5
93
2
3,4
57
3
67
4
55
8
4
1,8
68
3
35
1
95
%
10
0.0
7
2.2
4
.1
20
.8
0.3
0
.4
0.1
1
.7
0.3
0
.2
No
t sp
eci
fie
d
No
. 2
,00
4
1,2
06
3
9
43
6
16
2
3
13
1
9
4
24
8
%
10
0.0
6
0.2
1
.9
21
.8
0.8
1
.1
0.6
0
.9
0.2
1
2.4
*
Neg
ligi
ble
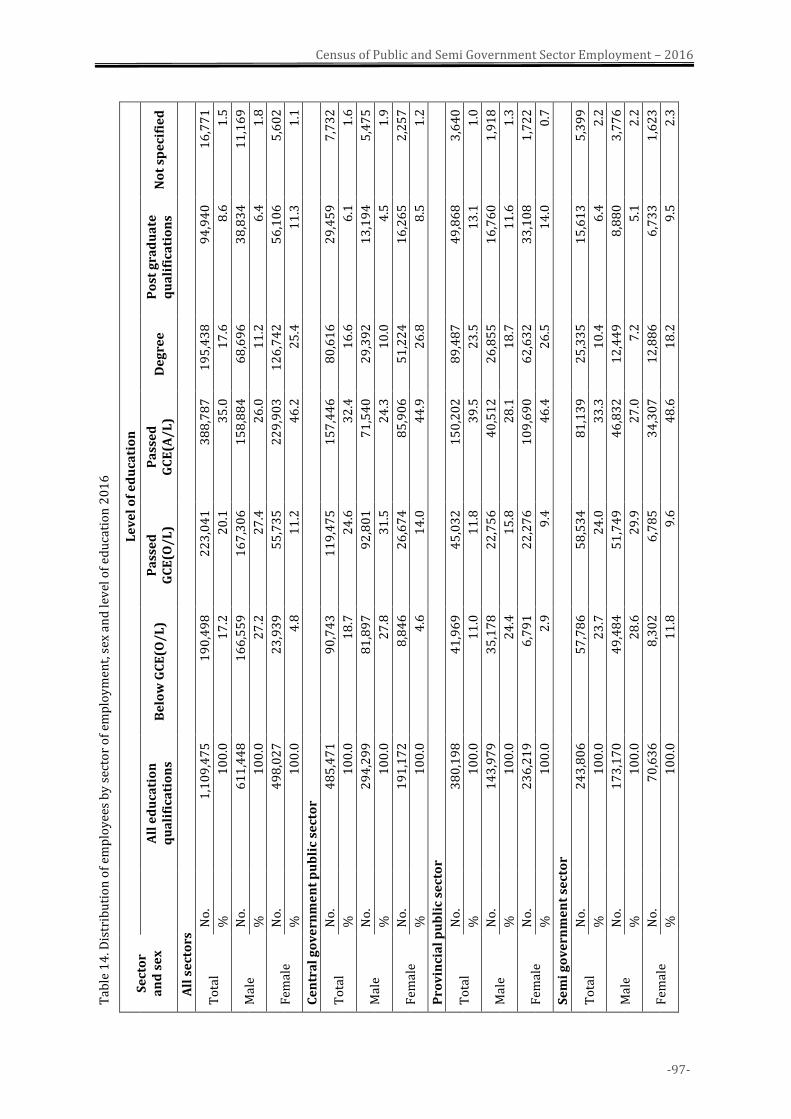
-97-
Census of Public and Semi Government Sector Employment – 2016
Tab
le 1
4. D
istr
ibu
tio
n o
f em
plo
yee
s b
y s
ecto
r o
f em
plo
ym
ent,
sex
an
d le
vel
of
edu
cati
on
20
16
Se
cto
r a
nd
se
x
L
ev
el
of
ed
uca
tio
n
A
ll e
du
cati
on
q
ua
lifi
cati
on
s B
elo
w G
CE
(O/
L)
Pa
sse
d
GC
E(O
/L
) P
ass
ed
G
CE
(A/
L)
De
gre
e
Po
st g
rad
ua
te
qu
ali
fica
tio
ns
No
t sp
eci
fie
d
A
ll s
ect
ors
To
tal
No
. 1
,10
9,4
75
1
90
,49
8
22
3,0
41
3
88
,78
7
19
5,4
38
9
4,9
40
1
6,7
71
%
10
0.0
1
7.2
2
0.1
3
5.0
1
7.6
8
.6
1.5
Mal
e N
o.
61
1,4
48
1
66
,55
9
16
7,3
06
1
58
,88
4
68
,69
6
38
,83
4
11
,16
9
%
10
0.0
2
7.2
2
7.4
2
6.0
1
1.2
6
.4
1.8
Fem
ale
No
. 4
98
,02
7
23
,93
9
55
,73
5
22
9,9
03
1
26
,74
2
56
,10
6
5,6
02
%
10
0.0
4
.8
11
.2
46
.2
25
.4
11
.3
1.1
Ce
ntr
al
go
ve
rnm
en
t p
ub
lic
sect
or
To
tal
No
. 4
85
,47
1
90
,74
3
11
9,4
75
1
57
,44
6
80
,61
6
29
,45
9
7,7
32
%
10
0.0
1
8.7
2
4.6
3
2.4
1
6.6
6
.1
1.6
Mal
e N
o.
29
4,2
99
8
1,8
97
9
2,8
01
7
1,5
40
2
9,3
92
1
3,1
94
5
,47
5
%
10
0.0
2
7.8
3
1.5
2
4.3
1
0.0
4
.5
1.9
Fem
ale
No
. 1
91
,17
2
8,8
46
2
6,6
74
8
5,9
06
5
1,2
24
1
6,2
65
2
,25
7
%
10
0.0
4
.6
14
.0
44
.9
26
.8
8.5
1
.2
Pro
vin
cia
l p
ub
lic
sect
or
To
tal
No
. 3
80
,19
8
41
,96
9
45
,03
2
15
0,2
02
8
9,4
87
4
9,8
68
3
,64
0
%
10
0.0
1
1.0
1
1.8
3
9.5
2
3.5
1
3.1
1
.0
Mal
e N
o.
14
3,9
79
3
5,1
78
2
2,7
56
4
0,5
12
2
6,8
55
1
6,7
60
1
,91
8
%
10
0.0
2
4.4
1
5.8
2
8.1
1
8.7
1
1.6
1
.3
Fem
ale
No
. 2
36
,21
9
6,7
91
2
2,2
76
1
09
,69
0
62
,63
2
33
,10
8
1,7
22
%
10
0.0
2
.9
9.4
4
6.4
2
6.5
1
4.0
0
.7
Se
mi
go
ve
rnm
en
t se
cto
r
To
tal
No
. 2
43
,80
6
57
,78
6
58
,53
4
81
,13
9
25
,33
5
15
,61
3
5,3
99
%
10
0.0
2
3.7
2
4.0
3
3.3
1
0.4
6
.4
2.2
Mal
e N
o.
17
3,1
70
4
9,4
84
5
1,7
49
4
6,8
32
1
2,4
49
8
,88
0
3,7
76
%
10
0.0
2
8.6
2
9.9
2
7.0
7
.2
5.1
2
.2
Fem
ale
No
. 7
0,6
36
8
,30
2
6,7
85
3
4,3
07
1
2,8
86
6
,73
3
1,6
23
%
10
0.0
1
1.8
9
.6
48
.6
18
.2
9.5
2
.3
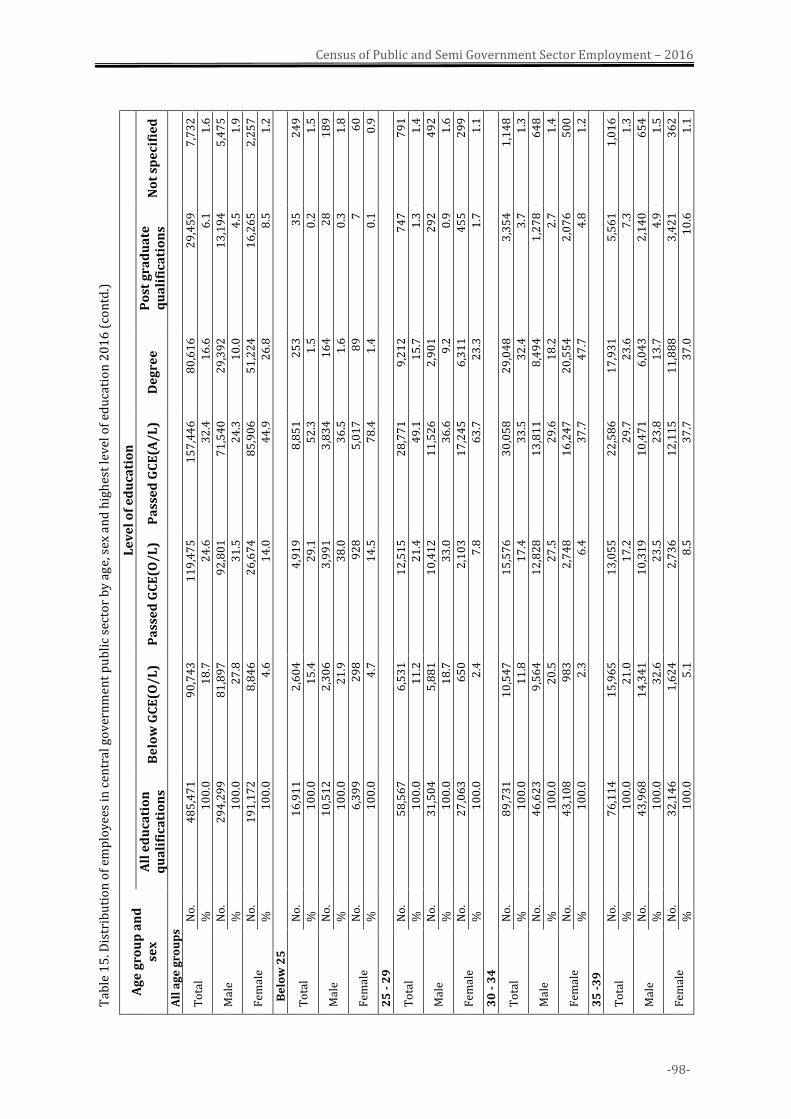
-98-
Census of Public and Semi Government Sector Employment – 2016
Tab
le 1
5. D
istr
ibu
tio
n o
f em
plo
yee
s in
cen
tral
go
ver
nm
ent
pu
bli
c se
cto
r b
y a
ge,
sex
an
d h
igh
est
lev
el o
f ed
uca
tio
n 2
01
6 (
con
td.)
Ag
e g
rou
p a
nd
se
x
Le
ve
l o
f e
du
cati
on
A
ll e
du
cati
on
q
ua
lifi
cati
on
s B
elo
w G
CE
(O/
L)
Pa
sse
d G
CE
(O/
L)
Pa
sse
d G
CE
(A/
L)
De
gre
e
Po
st g
rad
ua
te
qu
ali
fica
tio
ns
No
t sp
eci
fie
d
All
ag
e g
rou
ps
To
tal
No
. 4
85
,47
1
90
,74
3
11
9,4
75
1
57
,44
6
80
,61
6
29
,45
9
7,7
32
%
10
0.0
1
8.7
2
4.6
3
2.4
1
6.6
6
.1
1.6
Mal
e N
o.
29
4,2
99
8
1,8
97
9
2,8
01
7
1,5
40
2
9,3
92
1
3,1
94
5
,47
5
%
10
0.0
2
7.8
3
1.5
2
4.3
1
0.0
4
.5
1.9
Fem
ale
No
. 1
91
,17
2
8,8
46
2
6,6
74
8
5,9
06
5
1,2
24
1
6,2
65
2
,25
7
%
10
0.0
4
.6
14
.0
44
.9
26
.8
8.5
1
.2
Be
low
25
To
tal
No
. 1
6,9
11
2
,60
4
4,9
19
8
,85
1
25
3
35
2
49
%
10
0.0
1
5.4
2
9.1
5
2.3
1
.5
0.2
1
.5
Mal
e N
o.
10
,51
2
2,3
06
3
,99
1
3,8
34
1
64
2
8
18
9
%
10
0.0
2
1.9
3
8.0
3
6.5
1
.6
0.3
1
.8
Fem
ale
No
. 6
,39
9
29
8
92
8
5,0
17
8
9
7
60
%
10
0.0
4
.7
14
.5
78
.4
1.4
0
.1
0.9
25
- 2
9
To
tal
No
. 5
8,5
67
6
,53
1
12
,51
5
28
,77
1
9,2
12
7
47
7
91
%
10
0.0
1
1.2
2
1.4
4
9.1
1
5.7
1
.3
1.4
Mal
e N
o.
31
,50
4
5,8
81
1
0,4
12
1
1,5
26
2
,90
1
29
2
49
2
%
10
0.0
1
8.7
3
3.0
3
6.6
9
.2
0.9
1
.6
Fem
ale
No
. 2
7,0
63
6
50
2
,10
3
17
,24
5
6,3
11
4
55
2
99
%
10
0.0
2
.4
7.8
6
3.7
2
3.3
1
.7
1.1
30
- 3
4
To
tal
No
. 8
9,7
31
1
0,5
47
1
5,5
76
3
0,0
58
2
9,0
48
3
,35
4
1,1
48
%
10
0.0
1
1.8
1
7.4
3
3.5
3
2.4
3
.7
1.3
Mal
e N
o.
46
,62
3
9,5
64
1
2,8
28
1
3,8
11
8
,49
4
1,2
78
6
48
%
10
0.0
2
0.5
2
7.5
2
9.6
1
8.2
2
.7
1.4
Fem
ale
No
. 4
3,1
08
9
83
2
,74
8
16
,24
7
20
,55
4
2,0
76
5
00
%
10
0.0
2
.3
6.4
3
7.7
4
7.7
4
.8
1.2
35
-3
9
To
tal
No
. 7
6,1
14
1
5,9
65
1
3,0
55
2
2,5
86
1
7,9
31
5
,56
1
1,0
16
%
10
0.0
2
1.0
1
7.2
2
9.7
2
3.6
7
.3
1.3
Mal
e N
o.
43
,96
8
14
,34
1
10
,31
9
10
,47
1
6,0
43
2
,14
0
65
4
%
10
0.0
3
2.6
2
3.5
2
3.8
1
3.7
4
.9
1.5
Fem
ale
No
. 3
2,1
46
1
,62
4
2,7
36
1
2,1
15
1
1,8
88
3
,42
1
36
2
%
10
0.0
5
.1
8.5
3
7.7
3
7.0
1
0.6
1
.1
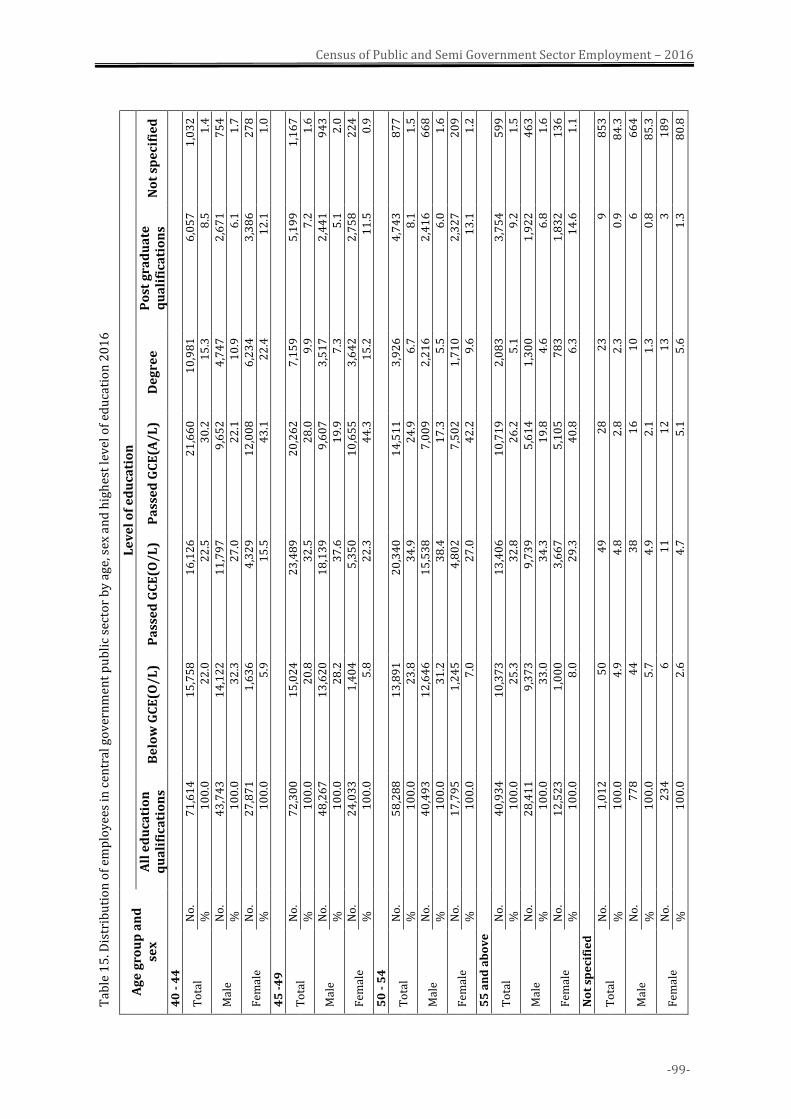
-99-
Census of Public and Semi Government Sector Employment – 2016
Tab
le 1
5. D
istr
ibu
tio
n o
f em
plo
yee
s in
cen
tral
go
ver
nm
ent
pu
bli
c se
cto
r b
y a
ge,
sex
an
d h
igh
est
lev
el o
f ed
uca
tio
n 2
01
6
Ag
e g
rou
p a
nd
se
x
Le
ve
l o
f e
du
cati
on
A
ll e
du
cati
on
q
ua
lifi
cati
on
s B
elo
w G
CE
(O/
L)
Pa
sse
d G
CE
(O/
L)
Pa
sse
d G
CE
(A/
L)
De
gre
e
Po
st g
rad
ua
te
qu
ali
fica
tio
ns
No
t sp
eci
fie
d
40
- 4
4
To
tal
No
. 7
1,6
14
1
5,7
58
1
6,1
26
2
1,6
60
1
0,9
81
6
,05
7
1,0
32
%
1
00
.0
22
.0
22
.5
30
.2
15
.3
8.5
1
.4
Mal
e N
o.
43
,74
3
14
,12
2
11
,79
7
9,6
52
4
,74
7
2,6
71
7
54
%
1
00
.0
32
.3
27
.0
22
.1
10
.9
6.1
1
.7
Fem
ale
No
. 2
7,8
71
1
,63
6
4,3
29
1
2,0
08
6
,23
4
3,3
86
2
78
%
1
00
.0
5.9
1
5.5
4
3.1
2
2.4
1
2.1
1
.0
45
-4
9
To
tal
No
. 7
2,3
00
1
5,0
24
2
3,4
89
2
0,2
62
7
,15
9
5,1
99
1
,16
7
%
10
0.0
2
0.8
3
2.5
2
8.0
9
.9
7.2
1
.6
Mal
e N
o.
48
,26
7
13
,62
0
18
,13
9
9,6
07
3
,51
7
2,4
41
9
43
%
1
00
.0
28
.2
37
.6
19
.9
7.3
5
.1
2.0
Fem
ale
No
. 2
4,0
33
1
,40
4
5,3
50
1
0,6
55
3
,64
2
2,7
58
2
24
%
1
00
.0
5.8
2
2.3
4
4.3
1
5.2
1
1.5
0
.9
50
- 5
4
To
tal
No
. 5
8,2
88
1
3,8
91
2
0,3
40
1
4,5
11
3
,92
6
4,7
43
8
77
%
1
00
.0
23
.8
34
.9
24
.9
6.7
8
.1
1.5
Mal
e N
o.
40
,49
3
12
,64
6
15
,53
8
7,0
09
2
,21
6
2,4
16
6
68
%
1
00
.0
31
.2
38
.4
17
.3
5.5
6
.0
1.6
Fem
ale
No
. 1
7,7
95
1
,24
5
4,8
02
7
,50
2
1,7
10
2
,32
7
20
9
%
10
0.0
7
.0
27
.0
42
.2
9.6
1
3.1
1
.2
55
an
d a
bo
ve
To
tal
No
. 4
0,9
34
1
0,3
73
1
3,4
06
1
0,7
19
2
,08
3
3,7
54
5
99
%
1
00
.0
25
.3
32
.8
26
.2
5.1
9
.2
1.5
Mal
e N
o.
28
,41
1
9,3
73
9
,73
9
5,6
14
1
,30
0
1,9
22
4
63
%
1
00
.0
33
.0
34
.3
19
.8
4.6
6
.8
1.6
Fem
ale
No
. 1
2,5
23
1
,00
0
3,6
67
5
,10
5
78
3
1,8
32
1
36
%
1
00
.0
8.0
2
9.3
4
0.8
6
.3
14
.6
1.1
N
ot
spe
cifi
ed
To
tal
No
. 1
,01
2
50
4
9
28
2
3
9
85
3
%
10
0.0
4
.9
4.8
2
.8
2.3
0
.9
84
.3
Mal
e N
o.
77
8
44
3
8
16
1
0
6
66
4
%
10
0.0
5
.7
4.9
2
.1
1.3
0
.8
85
.3
Fem
ale
No
. 2
34
6
1
1
12
1
3
3
18
9
%
10
0.0
2
.6
4.7
5
.1
5.6
1
.3
80
.8
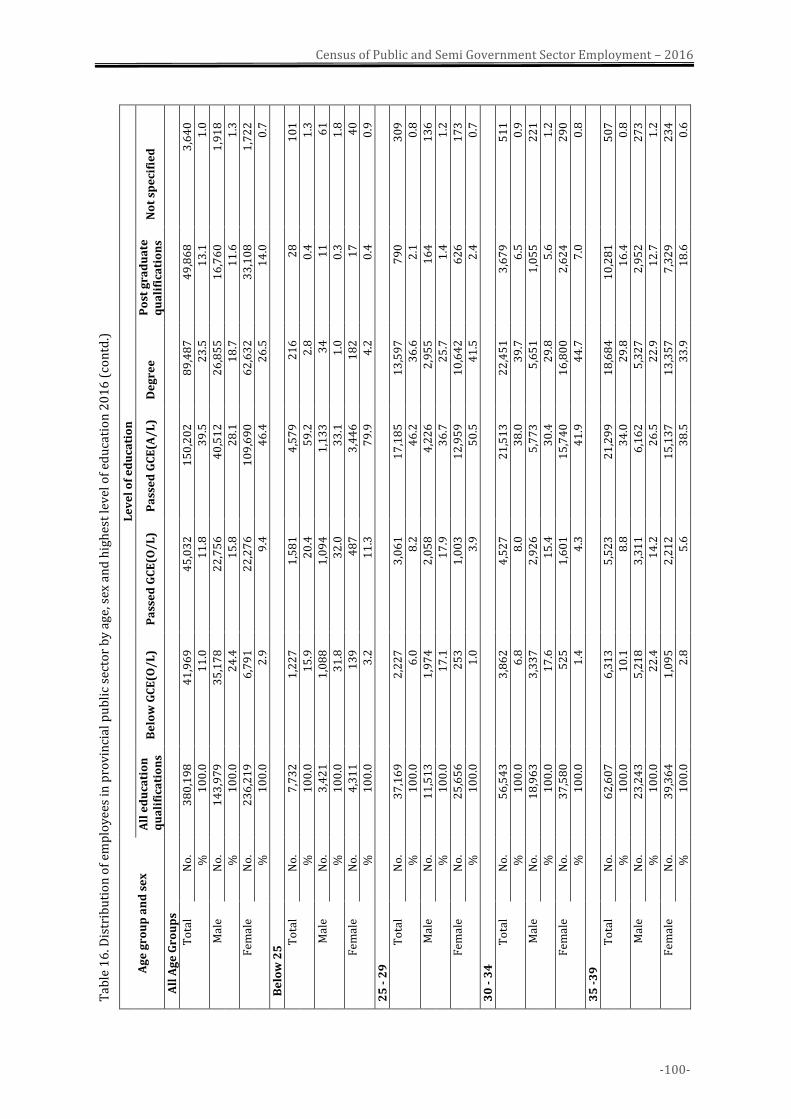
-100-
Census of Public and Semi Government Sector Employment – 2016
Tab
le 1
6. D
istr
ibu
tio
n o
f em
plo
yee
s in
pro
vin
cial
pu
bli
c se
cto
r b
y a
ge,
sex
an
d h
igh
est
lev
el o
f ed
uca
tio
n 2
01
6 (
con
td.)
Ag
e g
rou
p a
nd
se
x
Le
ve
l o
f e
du
cati
on
All
ed
uca
tio
n
qu
ali
fica
tio
ns
Be
low
GC
E(O
/L
) P
ass
ed
GC
E(O
/L
) P
ass
ed
GC
E(A
/L
) D
eg
ree
P
ost
gra
du
ate
q
ua
lifi
cati
on
s N
ot
spe
cifi
ed
A
ll A
ge
Gro
up
s
To
tal
No
. 3
80
,19
8
41
,96
9
45
,03
2
15
0,2
02
8
9,4
87
4
9,8
68
3
,64
0
%
10
0.0
1
1.0
1
1.8
3
9.5
2
3.5
1
3.1
1
.0
Mal
e N
o.
14
3,9
79
3
5,1
78
2
2,7
56
4
0,5
12
2
6,8
55
1
6,7
60
1
,91
8
%
10
0.0
2
4.4
1
5.8
2
8.1
1
8.7
1
1.6
1
.3
Fem
ale
No
. 2
36
,21
9
6,7
91
2
2,2
76
1
09
,69
0
62
,63
2
33
,10
8
1,7
22
%
10
0.0
2
.9
9.4
4
6.4
2
6.5
1
4.0
0
.7
Be
low
25
To
tal
No
. 7
,73
2
1,2
27
1
,58
1
4,5
79
2
16
2
8
10
1
%
10
0.0
1
5.9
2
0.4
5
9.2
2
.8
0.4
1
.3
Mal
e N
o.
3,4
21
1
,08
8
1,0
94
1
,13
3
34
1
1
61
%
10
0.0
3
1.8
3
2.0
3
3.1
1
.0
0.3
1
.8
Fem
ale
No
. 4
,31
1
13
9
48
7
3,4
46
1
82
1
7
40
%
10
0.0
3
.2
11
.3
79
.9
4.2
0
.4
0.9
25
- 2
9
To
tal
No
. 3
7,1
69
2
,22
7
3,0
61
1
7,1
85
1
3,5
97
7
90
3
09
%
10
0.0
6
.0
8.2
4
6.2
3
6.6
2
.1
0.8
Mal
e N
o.
11
,51
3
1,9
74
2
,05
8
4,2
26
2
,95
5
16
4
13
6
%
10
0.0
1
7.1
1
7.9
3
6.7
2
5.7
1
.4
1.2
Fem
ale
No
. 2
5,6
56
2
53
1
,00
3
12
,95
9
10
,64
2
62
6
17
3
%
10
0.0
1
.0
3.9
5
0.5
4
1.5
2
.4
0.7
30
- 3
4
To
tal
No
. 5
6,5
43
3
,86
2
4,5
27
2
1,5
13
2
2,4
51
3
,67
9
51
1
%
10
0.0
6
.8
8.0
3
8.0
3
9.7
6
.5
0.9
Mal
e N
o.
18
,96
3
3,3
37
2
,92
6
5,7
73
5
,65
1
1,0
55
2
21
%
10
0.0
1
7.6
1
5.4
3
0.4
2
9.8
5
.6
1.2
Fem
ale
No
. 3
7,5
80
5
25
1
,60
1
15
,74
0
16
,80
0
2,6
24
2
90
%
10
0.0
1
.4
4.3
4
1.9
4
4.7
7
.0
0.8
35
-3
9
To
tal
No
. 6
2,6
07
6
,31
3
5,5
23
2
1,2
99
1
8,6
84
1
0,2
81
5
07
%
10
0.0
1
0.1
8
.8
34
.0
29
.8
16
.4
0.8
Mal
e N
o.
23
,24
3
5,2
18
3
,31
1
6,1
62
5
,32
7
2,9
52
2
73
%
10
0.0
2
2.4
1
4.2
2
6.5
2
2.9
1
2.7
1
.2
Fem
ale
No
. 3
9,3
64
1
,09
5
2,2
12
1
5,1
37
1
3,3
57
7
,32
9
23
4
%
10
0.0
2
.8
5.6
3
8.5
3
3.9
1
8.6
0
.6
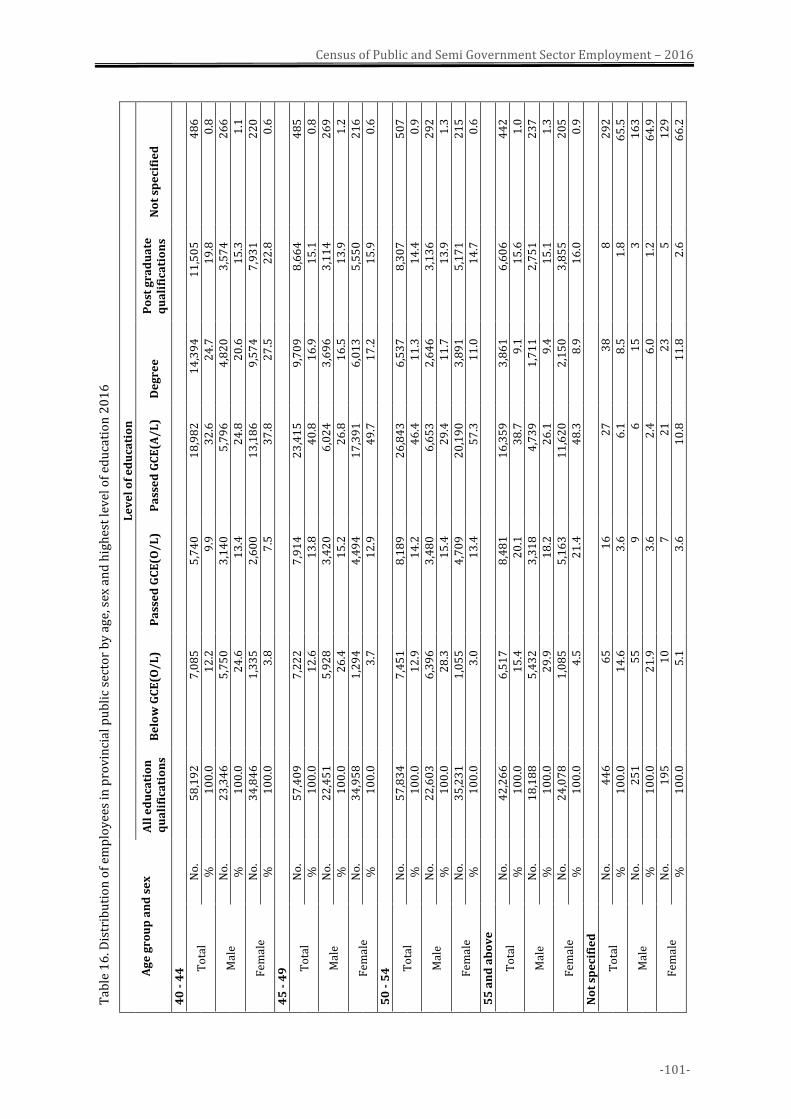
-101-
Census of Public and Semi Government Sector Employment – 2016
Tab
le 1
6. D
istr
ibu
tio
n o
f em
plo
yee
s in
pro
vin
cial
pu
bli
c se
cto
r b
y a
ge,
sex
an
d h
igh
est
lev
el o
f ed
uca
tio
n 2
01
6
Ag
e g
rou
p a
nd
se
x
Le
ve
l o
f e
du
cati
on
All
ed
uca
tio
n
qu
ali
fica
tio
ns
Be
low
GC
E(O
/L
) P
ass
ed
GC
E(O
/L
) P
ass
ed
GC
E(A
/L
) D
eg
ree
P
ost
gra
du
ate
q
ua
lifi
cati
on
s N
ot
spe
cifi
ed
40
- 4
4 To
tal
No
. 5
8,1
92
7
,08
5
5,7
40
1
8,9
82
1
4,3
94
1
1,5
05
4
86
%
1
00
.0
12
.2
9.9
3
2.6
2
4.7
1
9.8
0
.8
Mal
e N
o.
23
,34
6
5,7
50
3
,14
0
5,7
96
4
,82
0
3,5
74
2
66
%
1
00
.0
24
.6
13
.4
24
.8
20
.6
15
.3
1.1
Fem
ale
No
. 3
4,8
46
1
,33
5
2,6
00
1
3,1
86
9
,57
4
7,9
31
2
20
%
1
00
.0
3.8
7
.5
37
.8
27
.5
22
.8
0.6
4
5 -
49
To
tal
No
. 5
7,4
09
7
,22
2
7,9
14
2
3,4
15
9
,70
9
8,6
64
4
85
%
1
00
.0
12
.6
13
.8
40
.8
16
.9
15
.1
0.8
Mal
e N
o.
22
,45
1
5,9
28
3
,42
0
6,0
24
3
,69
6
3,1
14
2
69
%
1
00
.0
26
.4
15
.2
26
.8
16
.5
13
.9
1.2
Fem
ale
No
. 3
4,9
58
1
,29
4
4,4
94
1
7,3
91
6
,01
3
5,5
50
2
16
%
1
00
.0
3.7
1
2.9
4
9.7
1
7.2
1
5.9
0
.6
50
- 5
4 To
tal
No
. 5
7,8
34
7
,45
1
8,1
89
2
6,8
43
6
,53
7
8,3
07
5
07
%
1
00
.0
12
.9
14
.2
46
.4
11
.3
14
.4
0.9
Mal
e N
o.
22
,60
3
6,3
96
3
,48
0
6,6
53
2
,64
6
3,1
36
2
92
%
1
00
.0
28
.3
15
.4
29
.4
11
.7
13
.9
1.3
Fem
ale
No
. 3
5,2
31
1
,05
5
4,7
09
2
0,1
90
3
,89
1
5,1
71
2
15
%
1
00
.0
3.0
1
3.4
5
7.3
1
1.0
1
4.7
0
.6
55
an
d a
bo
ve
To
tal
No
. 4
2,2
66
6
,51
7
8,4
81
1
6,3
59
3
,86
1
6,6
06
4
42
%
1
00
.0
15
.4
20
.1
38
.7
9.1
1
5.6
1
.0
Mal
e N
o.
18
,18
8
5,4
32
3
,31
8
4,7
39
1
,71
1
2,7
51
2
37
%
1
00
.0
29
.9
18
.2
26
.1
9.4
1
5.1
1
.3
Fem
ale
No
. 2
4,0
78
1
,08
5
5,1
63
1
1,6
20
2
,15
0
3,8
55
2
05
%
1
00
.0
4.5
2
1.4
4
8.3
8
.9
16
.0
0.9
N
ot
spe
cifi
ed
To
tal
No
. 4
46
6
5
16
2
7
38
8
2
92
%
1
00
.0
14
.6
3.6
6
.1
8.5
1
.8
65
.5
Mal
e N
o.
25
1
55
9
6
1
5
3
16
3
%
10
0.0
2
1.9
3
.6
2.4
6
.0
1.2
6
4.9
Fem
ale
No
. 1
95
1
0
7
21
2
3
5
12
9
%
10
0.0
5
.1
3.6
1
0.8
1
1.8
2
.6
66
.2
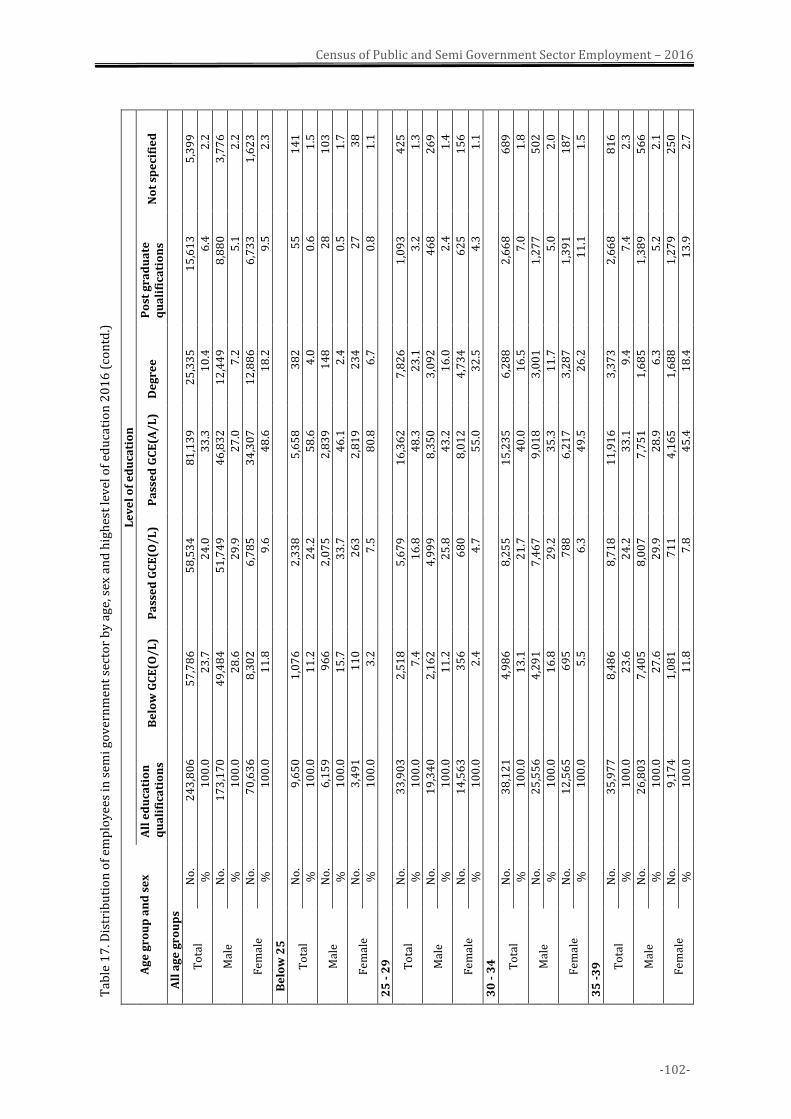
-102-
Census of Public and Semi Government Sector Employment – 2016
Tab
le 1
7. D
istr
ibu
tio
n o
f em
plo
yee
s in
sem
i go
ver
nm
ent
sect
or
by
ag
e, s
ex a
nd
hig
hes
t le
vel
of
edu
cati
on
20
16
(co
ntd
.)
Ag
e g
rou
p a
nd
se
x
Le
ve
l o
f e
du
cati
on
All
ed
uca
tio
n
qu
ali
fica
tio
ns
Be
low
GC
E(O
/L
) P
ass
ed
GC
E(O
/L
) P
ass
ed
GC
E(A
/L
) D
eg
ree
P
ost
gra
du
ate
q
ua
lifi
cati
on
s
No
t sp
eci
fie
d
A
ll a
ge
gro
up
s
To
tal
No
. 2
43
,80
6
57
,78
6
58
,53
4
81
,13
9
25
,33
5
15
,61
3
5,3
99
%
10
0.0
2
3.7
2
4.0
3
3.3
1
0.4
6
.4
2.2
Mal
e N
o.
17
3,1
70
4
9,4
84
5
1,7
49
4
6,8
32
1
2,4
49
8
,88
0
3,7
76
%
10
0.0
2
8.6
2
9.9
2
7.0
7
.2
5.1
2
.2
Fem
ale
No
. 7
0,6
36
8
,30
2
6,7
85
3
4,3
07
1
2,8
86
6
,73
3
1,6
23
%
10
0.0
1
1.8
9
.6
48
.6
18
.2
9.5
2
.3
Be
low
25
To
tal
No
. 9
,65
0
1,0
76
2
,33
8
5,6
58
3
82
5
5
14
1
%
10
0.0
1
1.2
2
4.2
5
8.6
4
.0
0.6
1
.5
Mal
e N
o.
6,1
59
9
66
2
,07
5
2,8
39
1
48
2
8
10
3
%
10
0.0
1
5.7
3
3.7
4
6.1
2
.4
0.5
1
.7
Fem
ale
No
. 3
,49
1
11
0
26
3
2,8
19
2
34
2
7
38
%
10
0.0
3
.2
7.5
8
0.8
6
.7
0.8
1
.1
25
- 2
9
To
tal
No
. 3
3,9
03
2
,51
8
5,6
79
1
6,3
62
7
,82
6
1,0
93
4
25
%
10
0.0
7
.4
16
.8
48
.3
23
.1
3.2
1
.3
Mal
e N
o.
19
,34
0
2,1
62
4
,99
9
8,3
50
3
,09
2
46
8
26
9
%
10
0.0
1
1.2
2
5.8
4
3.2
1
6.0
2
.4
1.4
Fem
ale
No
. 1
4,5
63
3
56
6
80
8
,01
2
4,7
34
6
25
1
56
%
10
0.0
2
.4
4.7
5
5.0
3
2.5
4
.3
1.1
30
- 3
4
To
tal
No
. 3
8,1
21
4
,98
6
8,2
55
1
5,2
35
6
,28
8
2,6
68
6
89
%
10
0.0
1
3.1
2
1.7
4
0.0
1
6.5
7
.0
1.8
Mal
e N
o.
25
,55
6
4,2
91
7
,46
7
9,0
18
3
,00
1
1,2
77
5
02
%
10
0.0
1
6.8
2
9.2
3
5.3
1
1.7
5
.0
2.0
Fem
ale
No
. 1
2,5
65
6
95
7
88
6
,21
7
3,2
87
1
,39
1
18
7
%
10
0.0
5
.5
6.3
4
9.5
2
6.2
1
1.1
1
.5
35
-3
9
To
tal
No
. 3
5,9
77
8
,48
6
8,7
18
1
1,9
16
3
,37
3
2,6
68
8
16
%
10
0.0
2
3.6
2
4.2
3
3.1
9
.4
7.4
2
.3
Mal
e N
o.
26
,80
3
7,4
05
8
,00
7
7,7
51
1
,68
5
1,3
89
5
66
%
10
0.0
2
7.6
2
9.9
2
8.9
6
.3
5.2
2
.1
Fem
ale
No
. 9
,17
4
1,0
81
7
11
4
,16
5
1,6
88
1
,27
9
25
0
%
10
0.0
1
1.8
7
.8
45
.4
18
.4
13
.9
2.7

-103-
Census of Public and Semi Government Sector Employment – 2016
Tab
le 1
7. D
istr
ibu
tio
n o
f em
plo
yee
s in
sem
i go
ver
nm
ent
sect
or
by
ag
e, s
ex a
nd
hig
hes
t le
vel
of
edu
cati
on
20
16
Ag
e g
rou
p a
nd
se
x
Le
ve
l o
f e
du
cati
on
All
ed
uca
tio
n
qu
ali
fica
tio
ns
Be
low
GC
E(O
/L
) P
ass
ed
GC
E(O
/L
) P
ass
ed
GC
E(A
/L
) D
eg
ree
P
ost
gra
du
ate
q
ua
lifi
cati
on
s
No
t sp
eci
fie
d
40
– 4
4
To
tal
No
. 3
2,5
69
9
,31
1
7,6
50
9
,74
3
2,4
91
2
,66
3
71
1
%
10
0.0
2
8.6
2
3.5
2
9.9
7
.6
8.2
2
.2
Mal
e N
o.
24
,15
2
8,0
15
6
,93
1
5,8
14
1
,36
7
1,5
13
5
12
%
1
00
.0
33
.2
28
.7
24
.1
5.7
6
.3
2.1
Fem
ale
No
. 8
,41
7
1,2
96
7
19
3
,92
9
1,1
24
1
,15
0
19
9
%
10
0.0
1
5.4
8
.5
46
.7
13
.4
13
.7
2.4
4
5 -
49
To
tal
No
. 3
2,6
45
1
0,0
44
8
,66
5
8,7
74
2
,03
0
2,3
97
7
35
%
1
00
.0
30
.8
26
.5
26
.9
6.2
7
.3
2.3
Mal
e N
o.
24
,14
9
8,3
51
7
,61
9
5,0
67
1
,15
8
1,4
61
4
93
%
1
00
.0
34
.6
31
.5
21
.0
4.8
6
.0
2.0
Fem
ale
No
. 8
,49
6
1,6
93
1
,04
6
3,7
07
8
72
9
36
2
42
%
1
00
.0
19
.9
12
.3
43
.6
10
.3
11
.0
2.8
5
0 -
54
To
tal
No
. 3
0,8
07
1
0,8
60
8
,55
7
6,8
80
1
,60
4
2,1
75
7
31
%
1
00
.0
35
.3
27
.8
22
.3
5.2
7
.1
2.4
Mal
e N
o.
23
,51
0
9,2
37
7
,40
3
3,9
63
1
,02
9
1,3
86
4
92
%
1
00
.0
39
.3
31
.5
16
.9
4.4
5
.9
2.1
Fem
ale
No
. 7
,29
7
1,6
23
1
,15
4
2,9
17
5
75
7
89
2
39
%
1
00
.0
22
.2
15
.8
40
.0
7.9
1
0.8
3
.3
55
an
d a
bo
ve
To
tal
No
. 2
9,5
88
1
0,4
61
8
,65
2
6,5
49
1
,32
4
1,8
79
7
23
%
1
00
.0
35
.4
29
.2
22
.1
4.5
6
.4
2.4
Mal
e N
o.
23
,10
8
9,0
27
7
,23
1
4,0
22
9
61
1
,34
8
51
9
%
10
0.0
3
9.1
3
1.3
1
7.4
4
.2
5.8
2
.2
Fem
ale
No
. 6
,48
0
1,4
34
1
,42
1
2,5
27
3
63
5
31
2
04
%
1
00
.0
22
.1
21
.9
39
.0
5.6
8
.2
3.1
N
ot
spe
cifi
ed
To
tal
No
. 5
46
4
4
20
2
2
17
1
5
42
8
%
10
0.0
8
.5
3.9
7
.5
3.3
2
.9
17
4
Mal
e N
o.
39
3
30
1
7
8
8
10
3
20
%
1
00
.0
8.2
4
.7
5.3
2
.2
2.7
1
76
.8
Fem
ale
No
. 1
53
1
4
3
14
9
5
1
08
%
1
00
.0
9.2
2
9
.2
5.9
3
.3
70
.6
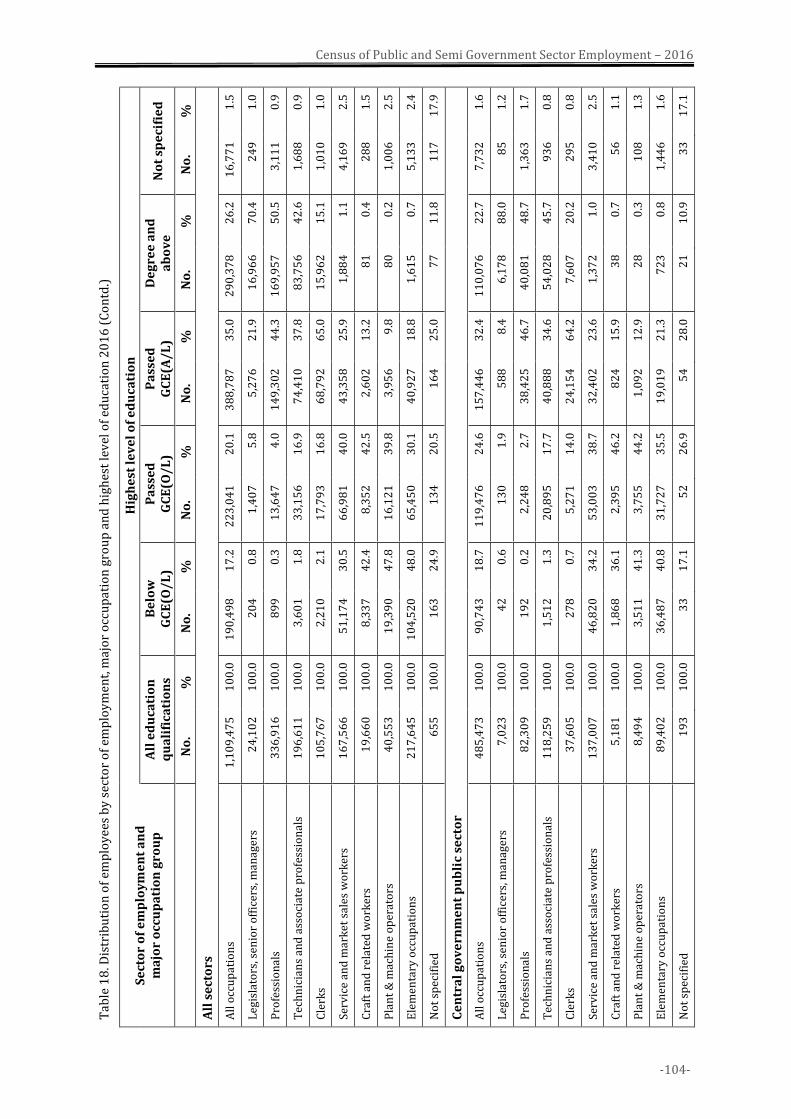
-104-
Census of Public and Semi Government Sector Employment – 2016
Tab
le 1
8. D
istr
ibu
tio
n o
f em
plo
yee
s b
y s
ecto
r o
f em
plo
ym
ent,
maj
or
occ
up
atio
n g
rou
p a
nd
hig
hes
t le
vel
of
edu
cati
on
20
16
(C
on
td.)
Se
cto
r o
f e
mp
loy
me
nt
an
d
ma
jor
occ
up
ati
on
gro
up
Hig
he
st l
ev
el
of
ed
uca
tio
n
All
ed
uca
tio
n
qu
ali
fica
tio
ns
Be
low
G
CE
(O/
L)
Pa
sse
d
GC
E(O
/L
) P
ass
ed
G
CE
(A/
L)
De
gre
e a
nd
a
bo
ve
N
ot
spe
cifi
ed
N
o.
%
No
. %
N
o.
%
No
. %
N
o.
%
No
. %
All
se
cto
rs
All
occ
up
atio
ns
1,1
09
,47
5
10
0.0
1
90
,49
8
17
.2
22
3,0
41
2
0.1
3
88
,78
7
35
.0
29
0,3
78
2
6.2
1
6,7
71
1
.5
Leg
isla
tors
, sen
ior
off
icer
s, m
anag
ers
24
,10
2
10
0.0
2
04
0
.8
1,4
07
5
.8
5,2
76
2
1.9
1
6,9
66
7
0.4
2
49
1
.0
Pro
fess
ion
als
33
6,9
16
1
00
.0
89
9
0.3
1
3,6
47
4
.0
14
9,3
02
4
4.3
1
69
,95
7
50
.5
3,1
11
0
.9
Tec
hn
icia
ns
and
ass
oci
ate
pro
fess
ion
als
19
6,6
11
1
00
.0
3,6
01
1
.8
33
,15
6
16
.9
74
,41
0
37
.8
83
,75
6
42
.6
1,6
88
0
.9
Cle
rks
10
5,7
67
1
00
.0
2,2
10
2
.1
17
,79
3
16
.8
68
,79
2
65
.0
15
,96
2
15
.1
1,0
10
1
.0
Serv
ice
and
mar
ket
sal
es w
ork
ers
16
7,5
66
1
00
.0
51
,17
4
30
.5
66
,98
1
40
.0
43
,35
8
25
.9
1,8
84
1
.1
4,1
69
2
.5
Cra
ft a
nd
rel
ated
wo
rker
s 1
9,6
60
1
00
.0
8,3
37
4
2.4
8
,35
2
42
.5
2,6
02
1
3.2
8
1
0.4
2
88
1
.5
Pla
nt
& m
ach
ine
op
erat
ors
4
0,5
53
1
00
.0
19
,39
0
47
.8
16
,12
1
39
.8
3,9
56
9
.8
80
0
.2
1,0
06
2
.5
Ele
men
tary
occ
up
atio
ns
21
7,6
45
1
00
.0
10
4,5
20
4
8.0
6
5,4
50
3
0.1
4
0,9
27
1
8.8
1
,61
5
0.7
5
,13
3
2.4
No
t sp
ecif
ied
6
55
1
00
.0
16
3
24
.9
13
4
20
.5
16
4
25
.0
77
1
1.8
1
17
1
7.9
Ce
ntr
al
go
ve
rnm
en
t p
ub
lic
sect
or
All
occ
up
atio
ns
48
5,4
73
1
00
.0
90
,74
3
18
.7
11
9,4
76
2
4.6
1
57
,44
6
32
.4
11
0,0
76
2
2.7
7
,73
2
1.6
Leg
isla
tors
, sen
ior
off
icer
s, m
anag
ers
7,0
23
1
00
.0
42
0
.6
13
0
1.9
5
88
8
.4
6,1
78
8
8.0
8
5
1.2
Pro
fess
ion
als
82
,30
9
10
0.0
1
92
0
.2
2,2
48
2
.7
38
,42
5
46
.7
40
,08
1
48
.7
1,3
63
1
.7
Tec
hn
icia
ns
and
ass
oci
ate
pro
fess
ion
als
11
8,2
59
1
00
.0
1,5
12
1
.3
20
,89
5
17
.7
40
,88
8
34
.6
54
,02
8
45
.7
93
6
0.8
Cle
rks
37
,60
5
10
0.0
2
78
0
.7
5,2
71
1
4.0
2
4,1
54
6
4.2
7
,60
7
20
.2
29
5
0.8
Serv
ice
and
mar
ket
sal
es w
ork
ers
13
7,0
07
1
00
.0
46
,82
0
34
.2
53
,00
3
38
.7
32
,40
2
23
.6
1,3
72
1
.0
3,4
10
2
.5
Cra
ft a
nd
rel
ated
wo
rker
s 5
,18
1
10
0.0
1
,86
8
36
.1
2,3
95
4
6.2
8
24
1
5.9
3
8
0.7
5
6
1.1
Pla
nt
& m
ach
ine
op
erat
ors
8
,49
4
10
0.0
3
,51
1
41
.3
3,7
55
4
4.2
1
,09
2
12
.9
28
0
.3
10
8
1.3
Ele
men
tary
occ
up
atio
ns
89
,40
2
10
0.0
3
6,4
87
4
0.8
3
1,7
27
3
5.5
1
9,0
19
2
1.3
7
23
0
.8
1,4
46
1
.6
No
t sp
ecif
ied
1
93
1
00
.0
33
1
7.1
5
2
26
.9
54
2
8.0
2
1
10
.9
33
1
7.1
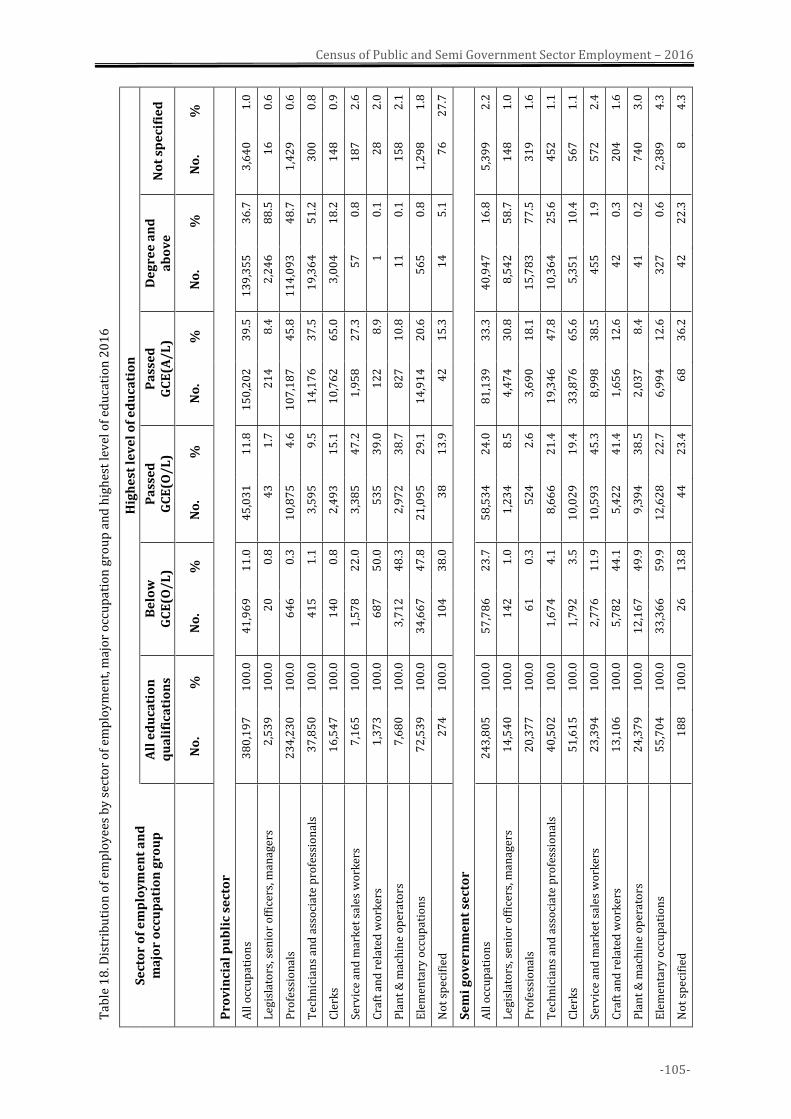
-105-
Census of Public and Semi Government Sector Employment – 2016
Tab
le 1
8. D
istr
ibu
tio
n o
f em
plo
yee
s b
y s
ecto
r o
f em
plo
ym
ent,
maj
or
occ
up
atio
n g
rou
p a
nd
hig
hes
t le
vel
of
edu
cati
on
20
16
Se
cto
r o
f e
mp
loy
me
nt
an
d
ma
jor
occ
up
ati
on
gro
up
Hig
he
st l
ev
el
of
ed
uca
tio
n
All
ed
uca
tio
n
qu
ali
fica
tio
ns
Be
low
G
CE
(O/
L)
Pa
sse
d
GC
E(O
/L
) P
ass
ed
G
CE
(A/
L)
De
gre
e a
nd
a
bo
ve
N
ot
spe
cifi
ed
N
o.
%
No
. %
N
o.
%
No
. %
N
o.
%
No
. %
Pro
vin
cia
l p
ub
lic
sect
or
All
occ
up
atio
ns
38
0,1
97
1
00
.0
41
,96
9
11
.0
45
,03
1
11
.8
15
0,2
02
3
9.5
1
39
,35
5
36
.7
3,6
40
1
.0
Leg
isla
tors
, sen
ior
off
icer
s, m
anag
ers
2,5
39
1
00
.0
20
0
.8
43
1
.7
21
4
8.4
2
,24
6
88
.5
16
0
.6
Pro
fess
ion
als
23
4,2
30
1
00
.0
64
6
0.3
1
0,8
75
4
.6
10
7,1
87
4
5.8
1
14
,09
3
48
.7
1,4
29
0
.6
Tec
hn
icia
ns
and
ass
oci
ate
pro
fess
ion
als
37
,85
0
10
0.0
4
15
1
.1
3,5
95
9
.5
14
,17
6
37
.5
19
,36
4
51
.2
30
0
0.8
Cle
rks
16
,54
7
10
0.0
1
40
0
.8
2,4
93
1
5.1
1
0,7
62
6
5.0
3
,00
4
18
.2
14
8
0.9
Serv
ice
and
mar
ket
sal
es w
ork
ers
7,1
65
1
00
.0
1,5
78
2
2.0
3
,38
5
47
.2
1,9
58
2
7.3
5
7
0.8
1
87
2
.6
Cra
ft a
nd
rel
ated
wo
rker
s 1
,37
3
10
0.0
6
87
5
0.0
5
35
3
9.0
1
22
8
.9
1
0.1
2
8
2.0
Pla
nt
& m
ach
ine
op
erat
ors
7
,68
0
10
0.0
3
,71
2
48
.3
2,9
72
3
8.7
8
27
1
0.8
1
1
0.1
1
58
2
.1
Ele
men
tary
occ
up
atio
ns
72
,53
9
10
0.0
3
4,6
67
4
7.8
2
1,0
95
2
9.1
1
4,9
14
2
0.6
5
65
0
.8
1,2
98
1
.8
No
t sp
ecif
ied
2
74
1
00
.0
10
4
38
.0
38
1
3.9
4
2
15
.3
14
5
.1
76
2
7.7
Se
mi
go
ve
rnm
en
t se
cto
r
All
occ
up
atio
ns
24
3,8
05
1
00
.0
57
,78
6
23
.7
58
,53
4
24
.0
81
,13
9
33
.3
40
,94
7
16
.8
5,3
99
2
.2
Leg
isla
tors
, sen
ior
off
icer
s, m
anag
ers
14
,54
0
10
0.0
1
42
1
.0
1,2
34
8
.5
4,4
74
3
0.8
8
,54
2
58
.7
14
8
1.0
Pro
fess
ion
als
20
,37
7
10
0.0
6
1
0.3
5
24
2
.6
3,6
90
1
8.1
1
5,7
83
7
7.5
3
19
1
.6
Tec
hn
icia
ns
and
ass
oci
ate
pro
fess
ion
als
40
,50
2
10
0.0
1
,67
4
4.1
8
,66
6
21
.4
19
,34
6
47
.8
10
,36
4
25
.6
45
2
1.1
Cle
rks
51
,61
5
10
0.0
1
,79
2
3.5
1
0,0
29
1
9.4
3
3,8
76
6
5.6
5
,35
1
10
.4
56
7
1.1
Serv
ice
and
mar
ket
sal
es w
ork
ers
23
,39
4
10
0.0
2
,77
6
11
.9
10
,59
3
45
.3
8,9
98
3
8.5
4
55
1
.9
57
2
2.4
Cra
ft a
nd
rel
ated
wo
rker
s 1
3,1
06
1
00
.0
5,7
82
4
4.1
5
,42
2
41
.4
1,6
56
1
2.6
4
2
0.3
2
04
1
.6
Pla
nt
& m
ach
ine
op
erat
ors
2
4,3
79
1
00
.0
12
,16
7
49
.9
9,3
94
3
8.5
2
,03
7
8.4
4
1
0.2
7
40
3
.0
Ele
men
tary
occ
up
atio
ns
55
,70
4
10
0.0
3
3,3
66
5
9.9
1
2,6
28
2
2.7
6
,99
4
12
.6
32
7
0.6
2
,38
9
4.3
No
t sp
ecif
ied
1
88
1
00
.0
26
1
3.8
4
4
23
.4
68
3
6.2
4
2
22
.3
8
4.3
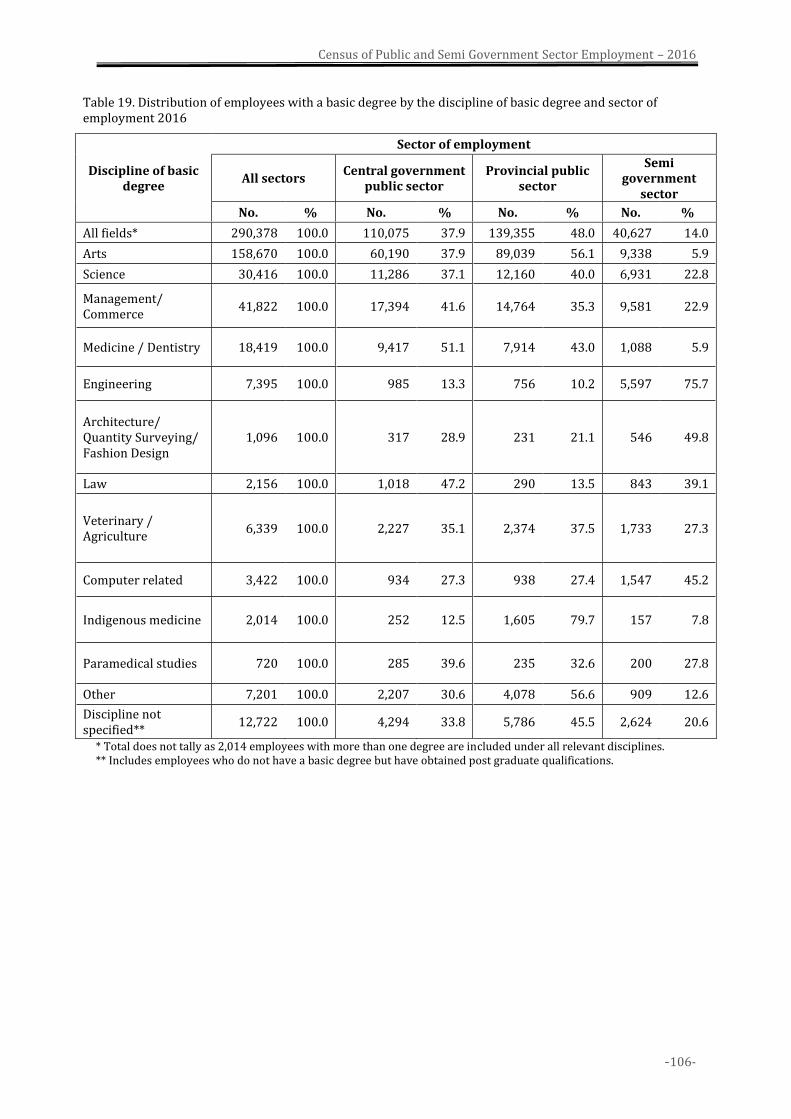
Census of Public and Semi Government Sector Employment – 2016
-106-
Table 19. Distribution of employees with a basic degree by the discipline of basic degree and sector of employment 2016
Discipline of basic degree
Sector of employment
All sectors Central government
public sector Provincial public
sector
Semi government
sector
No. % No. % No. % No. %
All fields* 290,378 100.0 110,075 37.9 139,355 48.0 40,627 14.0
Arts 158,670 100.0 60,190 37.9 89,039 56.1 9,338 5.9
Science 30,416 100.0 11,286 37.1 12,160 40.0 6,931 22.8
Management/ Commerce
41,822 100.0 17,394 41.6 14,764 35.3 9,581 22.9
Medicine / Dentistry 18,419 100.0 9,417 51.1 7,914 43.0 1,088 5.9
Engineering 7,395 100.0 985 13.3 756 10.2 5,597 75.7
Architecture/ Quantity Surveying/ Fashion Design
1,096 100.0 317 28.9 231 21.1 546 49.8
Law 2,156 100.0 1,018 47.2 290 13.5 843 39.1
Veterinary / Agriculture
6,339 100.0 2,227 35.1 2,374 37.5 1,733 27.3
Computer related 3,422 100.0 934 27.3 938 27.4 1,547 45.2
Indigenous medicine 2,014 100.0 252 12.5 1,605 79.7 157 7.8
Paramedical studies 720 100.0 285 39.6 235 32.6 200 27.8
Other 7,201 100.0 2,207 30.6 4,078 56.6 909 12.6
Discipline not specified**
12,722 100.0 4,294 33.8 5,786 45.5 2,624 20.6
* Total does not tally as 2,014 employees with more than one degree are included under all relevant disciplines. ** Includes employees who do not have a basic degree but have obtained post graduate qualifications.
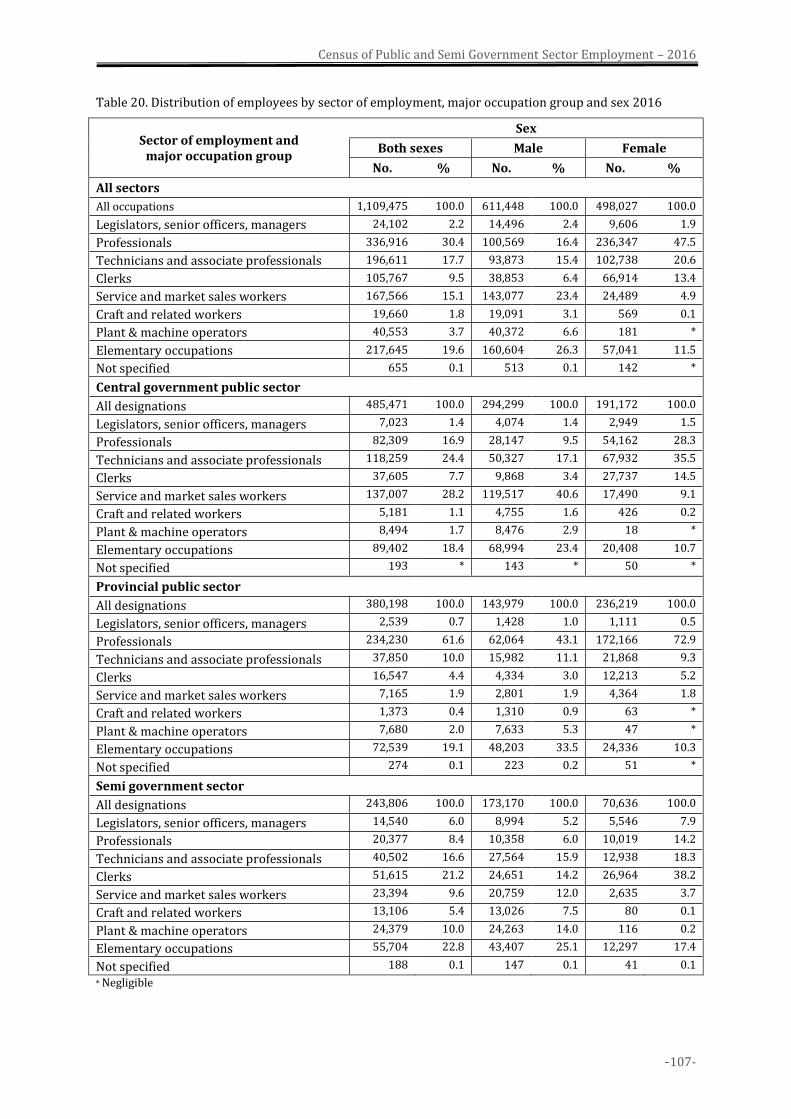
Census of Public and Semi Government Sector Employment – 2016
-107-
Table 20. Distribution of employees by sector of employment, major occupation group and sex 2016
Sector of employment and major occupation group
Sex
Both sexes Male Female
No. % No. % No. %
All sectors
All occupations 1,109,475 100.0 611,448 100.0 498,027 100.0
Legislators, senior officers, managers 24,102 2.2 14,496 2.4 9,606 1.9
Professionals 336,916 30.4 100,569 16.4 236,347 47.5
Technicians and associate professionals 196,611 17.7 93,873 15.4 102,738 20.6
Clerks 105,767 9.5 38,853 6.4 66,914 13.4
Service and market sales workers 167,566 15.1 143,077 23.4 24,489 4.9
Craft and related workers 19,660 1.8 19,091 3.1 569 0.1
Plant & machine operators 40,553 3.7 40,372 6.6 181 *
Elementary occupations 217,645 19.6 160,604 26.3 57,041 11.5
Not specified 655 0.1 513 0.1 142 *
Central government public sector
All designations 485,471 100.0 294,299 100.0 191,172 100.0
Legislators, senior officers, managers 7,023 1.4 4,074 1.4 2,949 1.5
Professionals 82,309 16.9 28,147 9.5 54,162 28.3
Technicians and associate professionals 118,259 24.4 50,327 17.1 67,932 35.5
Clerks 37,605 7.7 9,868 3.4 27,737 14.5
Service and market sales workers 137,007 28.2 119,517 40.6 17,490 9.1
Craft and related workers 5,181 1.1 4,755 1.6 426 0.2
Plant & machine operators 8,494 1.7 8,476 2.9 18 *
Elementary occupations 89,402 18.4 68,994 23.4 20,408 10.7
Not specified 193 * 143 * 50 *
Provincial public sector
All designations 380,198 100.0 143,979 100.0 236,219 100.0
Legislators, senior officers, managers 2,539 0.7 1,428 1.0 1,111 0.5
Professionals 234,230 61.6 62,064 43.1 172,166 72.9
Technicians and associate professionals 37,850 10.0 15,982 11.1 21,868 9.3
Clerks 16,547 4.4 4,334 3.0 12,213 5.2
Service and market sales workers 7,165 1.9 2,801 1.9 4,364 1.8
Craft and related workers 1,373 0.4 1,310 0.9 63 *
Plant & machine operators 7,680 2.0 7,633 5.3 47 *
Elementary occupations 72,539 19.1 48,203 33.5 24,336 10.3
Not specified 274 0.1 223 0.2 51 *
Semi government sector
All designations 243,806 100.0 173,170 100.0 70,636 100.0
Legislators, senior officers, managers 14,540 6.0 8,994 5.2 5,546 7.9
Professionals 20,377 8.4 10,358 6.0 10,019 14.2
Technicians and associate professionals 40,502 16.6 27,564 15.9 12,938 18.3
Clerks 51,615 21.2 24,651 14.2 26,964 38.2
Service and market sales workers 23,394 9.6 20,759 12.0 2,635 3.7
Craft and related workers 13,106 5.4 13,026 7.5 80 0.1
Plant & machine operators 24,379 10.0 24,263 14.0 116 0.2
Elementary occupations 55,704 22.8 43,407 25.1 12,297 17.4
Not specified 188 0.1 147 0.1 41 0.1
* Negligible
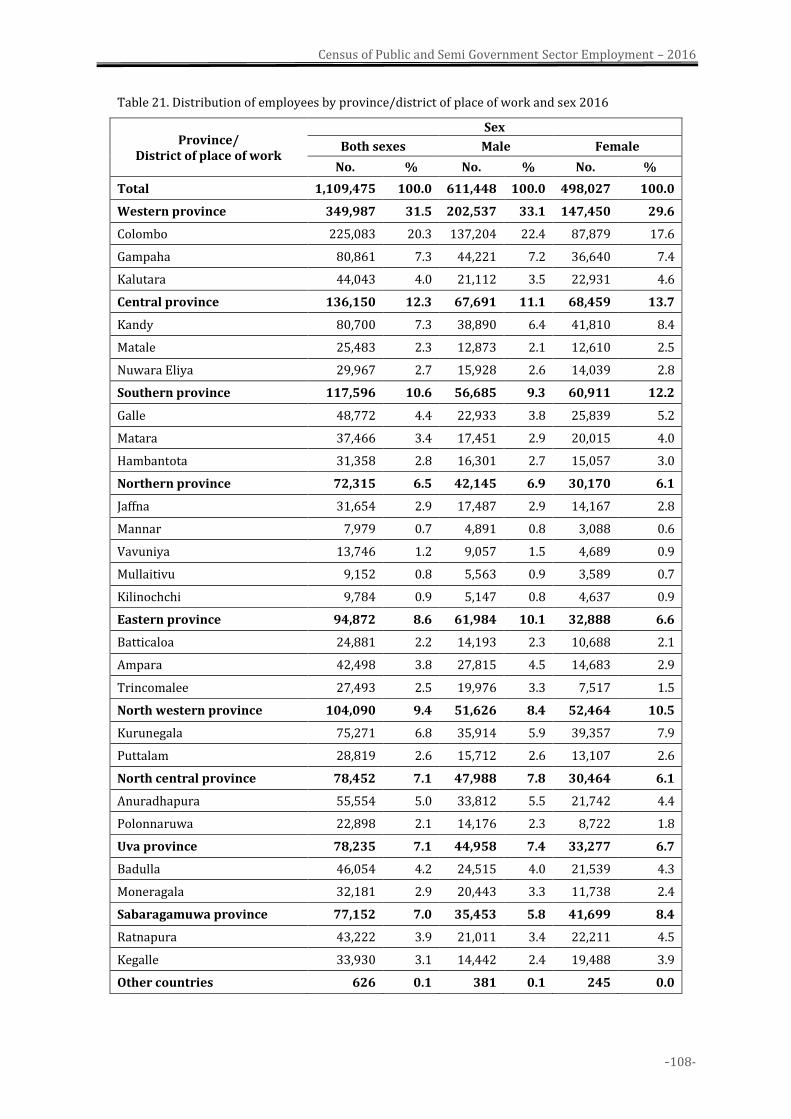
Census of Public and Semi Government Sector Employment – 2016
-108-
Table 21. Distribution of employees by province/district of place of work and sex 2016
Province/ District of place of work
Sex
Both sexes Male Female
No. % No. % No. %
Total 1,109,475 100.0 611,448 100.0 498,027 100.0
Western province 349,987 31.5 202,537 33.1 147,450 29.6
Colombo 225,083 20.3 137,204 22.4 87,879 17.6
Gampaha 80,861 7.3 44,221 7.2 36,640 7.4
Kalutara 44,043 4.0 21,112 3.5 22,931 4.6
Central province 136,150 12.3 67,691 11.1 68,459 13.7
Kandy 80,700 7.3 38,890 6.4 41,810 8.4
Matale 25,483 2.3 12,873 2.1 12,610 2.5
Nuwara Eliya 29,967 2.7 15,928 2.6 14,039 2.8
Southern province 117,596 10.6 56,685 9.3 60,911 12.2
Galle 48,772 4.4 22,933 3.8 25,839 5.2
Matara 37,466 3.4 17,451 2.9 20,015 4.0
Hambantota 31,358 2.8 16,301 2.7 15,057 3.0
Northern province 72,315 6.5 42,145 6.9 30,170 6.1
Jaffna 31,654 2.9 17,487 2.9 14,167 2.8
Mannar 7,979 0.7 4,891 0.8 3,088 0.6
Vavuniya 13,746 1.2 9,057 1.5 4,689 0.9
Mullaitivu 9,152 0.8 5,563 0.9 3,589 0.7
Kilinochchi 9,784 0.9 5,147 0.8 4,637 0.9
Eastern province 94,872 8.6 61,984 10.1 32,888 6.6
Batticaloa 24,881 2.2 14,193 2.3 10,688 2.1
Ampara 42,498 3.8 27,815 4.5 14,683 2.9
Trincomalee 27,493 2.5 19,976 3.3 7,517 1.5
North western province 104,090 9.4 51,626 8.4 52,464 10.5
Kurunegala 75,271 6.8 35,914 5.9 39,357 7.9
Puttalam 28,819 2.6 15,712 2.6 13,107 2.6
North central province 78,452 7.1 47,988 7.8 30,464 6.1
Anuradhapura 55,554 5.0 33,812 5.5 21,742 4.4
Polonnaruwa 22,898 2.1 14,176 2.3 8,722 1.8
Uva province 78,235 7.1 44,958 7.4 33,277 6.7
Badulla 46,054 4.2 24,515 4.0 21,539 4.3
Moneragala 32,181 2.9 20,443 3.3 11,738 2.4
Sabaragamuwa province 77,152 7.0 35,453 5.8 41,699 8.4
Ratnapura 43,222 3.9 21,011 3.4 22,211 4.5
Kegalle 33,930 3.1 14,442 2.4 19,488 3.9
Other countries 626 0.1 381 0.1 245 0.0
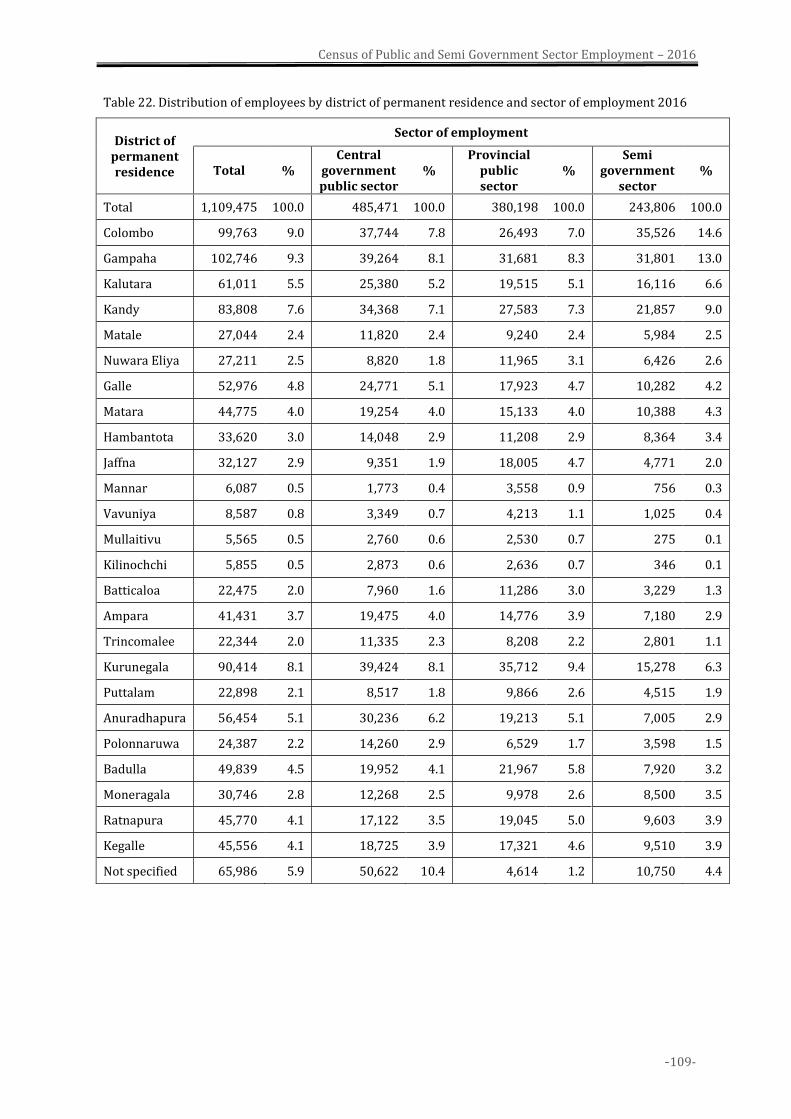
Census of Public and Semi Government Sector Employment – 2016
-109-
Table 22. Distribution of employees by district of permanent residence and sector of employment 2016
District of permanent residence
Sector of employment
Total % Central
government public sector
% Provincial
public sector
% Semi
government sector
%
Total 1,109,475 100.0 485,471 100.0 380,198 100.0 243,806 100.0
Colombo 99,763 9.0 37,744 7.8 26,493 7.0 35,526 14.6
Gampaha 102,746 9.3 39,264 8.1 31,681 8.3 31,801 13.0
Kalutara 61,011 5.5 25,380 5.2 19,515 5.1 16,116 6.6
Kandy 83,808 7.6 34,368 7.1 27,583 7.3 21,857 9.0
Matale 27,044 2.4 11,820 2.4 9,240 2.4 5,984 2.5
Nuwara Eliya 27,211 2.5 8,820 1.8 11,965 3.1 6,426 2.6
Galle 52,976 4.8 24,771 5.1 17,923 4.7 10,282 4.2
Matara 44,775 4.0 19,254 4.0 15,133 4.0 10,388 4.3
Hambantota 33,620 3.0 14,048 2.9 11,208 2.9 8,364 3.4
Jaffna 32,127 2.9 9,351 1.9 18,005 4.7 4,771 2.0
Mannar 6,087 0.5 1,773 0.4 3,558 0.9 756 0.3
Vavuniya 8,587 0.8 3,349 0.7 4,213 1.1 1,025 0.4
Mullaitivu 5,565 0.5 2,760 0.6 2,530 0.7 275 0.1
Kilinochchi 5,855 0.5 2,873 0.6 2,636 0.7 346 0.1
Batticaloa 22,475 2.0 7,960 1.6 11,286 3.0 3,229 1.3
Ampara 41,431 3.7 19,475 4.0 14,776 3.9 7,180 2.9
Trincomalee 22,344 2.0 11,335 2.3 8,208 2.2 2,801 1.1
Kurunegala 90,414 8.1 39,424 8.1 35,712 9.4 15,278 6.3
Puttalam 22,898 2.1 8,517 1.8 9,866 2.6 4,515 1.9
Anuradhapura 56,454 5.1 30,236 6.2 19,213 5.1 7,005 2.9
Polonnaruwa 24,387 2.2 14,260 2.9 6,529 1.7 3,598 1.5
Badulla 49,839 4.5 19,952 4.1 21,967 5.8 7,920 3.2
Moneragala 30,746 2.8 12,268 2.5 9,978 2.6 8,500 3.5
Ratnapura 45,770 4.1 17,122 3.5 19,045 5.0 9,603 3.9
Kegalle 45,556 4.1 18,725 3.9 17,321 4.6 9,510 3.9
Not specified 65,986 5.9 50,622 10.4 4,614 1.2 10,750 4.4
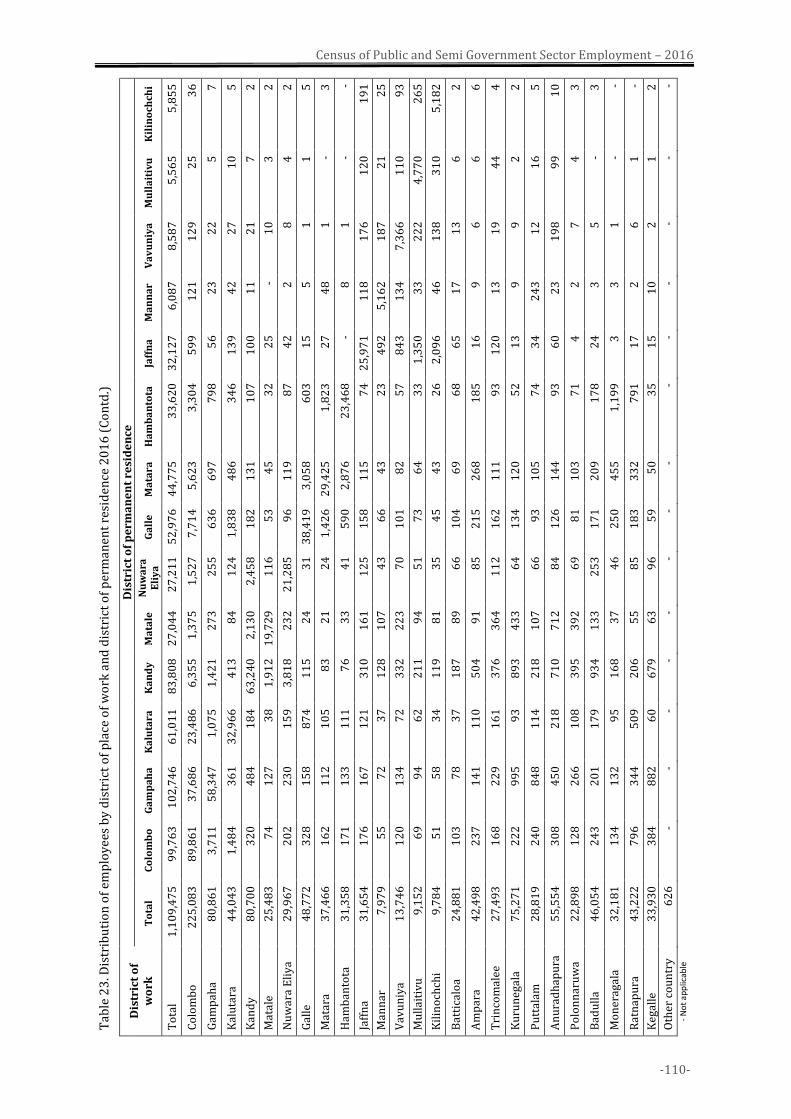
-110-
Census of Public and Semi Government Sector Employment – 2016
Tab
le 2
3. D
istr
ibu
tio
n o
f em
plo
yee
s b
y d
istr
ict
of
pla
ce o
f w
ork
an
d d
istr
ict
of
per
man
ent
resi
den
ce 2
01
6 (
Co
ntd
.)
Dis
tric
t o
f w
ork
Dis
tric
t o
f p
erm
an
en
t re
sid
en
ce
To
tal
Co
lom
bo
G
am
pa
ha
K
alu
tara
K
an
dy
M
ata
le
Nu
wa
ra
Eli
ya
G
all
e
Ma
tara
H
am
ba
nto
ta
Jaff
na
M
an
na
r V
av
un
iya
M
ull
ait
ivu
K
ilin
och
chi
To
tal
1,1
09
,47
5
99
,76
3
10
2,7
46
6
1,0
11
8
3,8
08
2
7,0
44
2
7,2
11
5
2,9
76
4
4,7
75
3
3,6
20
3
2,1
27
6
,08
7
8,5
87
5
,56
5
5,8
55
Co
lom
bo
2
25
,08
3
89
,86
1
37
,68
6
23
,48
6
6,3
55
1
,37
5
1,5
27
7
,71
4
5,6
23
3
,30
4
59
9
12
1
12
9
25
3
6
Gam
pah
a 8
0,8
61
3
,71
1
58
,34
7
1,0
75
1
,42
1
27
3
25
5
63
6
69
7
79
8
56
2
3
22
5
7
Kal
uta
ra
44
,04
3
1,4
84
3
61
3
2,9
66
4
13
8
4
12
4
1,8
38
4
86
3
46
1
39
4
2
27
1
0
5
Kan
dy
80
,70
0
32
0
48
4
18
4
63
,24
0
2,1
30
2
,45
8
18
2
13
1
10
7
10
0
11
2
1
7
2
Mat
ale
25
,48
3
74
1
27
3
8
1,9
12
1
9,7
29
1
16
5
3
45
3
2
25
-
10
3
2
Nu
war
a E
liy
a 2
9,9
67
2
02
2
30
1
59
3
,81
8
23
2
21
,28
5
96
1
19
8
7
42
2
8
4
2
Gal
le
48
,77
2
32
8
15
8
87
4
11
5
24
3
1
38
,41
9
3,0
58
6
03
1
5
5
1
1
5
Mat
ara
37
,46
6
16
2
11
2
10
5
83
2
1
24
1
,42
6
29
,42
5
1,8
23
2
7
48
1
-
3
Ham
ban
tota
3
1,3
58
1
71
1
33
1
11
7
6
33
4
1
59
0
2,8
76
2
3,4
68
-
8
1
- -
Jaff
na
31
,65
4
17
6
16
7
12
1
31
0
16
1
12
5
15
8
11
5
74
2
5,9
71
1
18
1
76
1
20
1
91
Man
nar
7
,97
9
55
7
2
37
1
28
1
07
4
3
66
4
3
23
4
92
5
,16
2
18
7
21
2
5
Vav
un
iya
13
,74
6
12
0
13
4
72
3
32
2
23
7
0
10
1
82
5
7
84
3
13
4
7,3
66
1
10
9
3
Mu
llai
tiv
u
9,1
52
6
9
94
6
2
21
1
94
5
1
73
6
4
33
1
,35
0
33
2
22
4
,77
0
26
5
Kil
ino
chch
i 9
,78
4
51
5
8
34
1
19
8
1
35
4
5
43
2
6
2,0
96
4
6
13
8
31
0
5,1
82
Bat
tica
loa
24
,88
1
10
3
78
3
7
18
7
89
6
6
10
4
69
6
8
65
1
7
13
6
2
Am
par
a 4
2,4
98
2
37
1
41
1
10
5
04
9
1
85
2
15
2
68
1
85
1
6
9
6
6
6
Tri
nco
mal
ee
27
,49
3
16
8
22
9
16
1
37
6
36
4
11
2
16
2
11
1
93
1
20
1
3
19
4
4
4
Ku
run
egal
a 7
5,2
71
2
22
9
95
9
3
89
3
43
3
64
1
34
1
20
5
2
13
9
9
2
2
Pu
ttal
am
28
,81
9
24
0
84
8
11
4
21
8
10
7
66
9
3
10
5
74
3
4
24
3
12
1
6
5
An
ura
dh
apu
ra
55
,55
4
30
8
45
0
21
8
71
0
71
2
84
1
26
1
44
9
3
60
2
3
19
8
99
1
0
Po
lon
nar
uw
a 2
2,8
98
1
28
2
66
1
08
3
95
3
92
6
9
81
1
03
7
1
4
2
7
4
3
Bad
ull
a 4
6,0
54
2
43
2
01
1
79
9
34
1
33
2
53
1
71
2
09
1
78
2
4
3
5
- 3
Mo
ner
agal
a 3
2,1
81
1
34
1
32
9
5
16
8
37
4
6
25
0
45
5
1,1
99
3
3
1
-
-
Rat
nap
ura
4
3,2
22
7
96
3
44
5
09
2
06
5
5
85
1
83
3
32
7
91
1
7
2
6
1
-
Keg
alle
3
3,9
30
3
84
8
82
6
0
67
9
63
9
6
59
5
0
35
1
5
10
2
1
2
Oth
er c
ou
ntr
y
62
6
- -
- -
- -
- -
- -
- -
- -
- N
ot
app
licab
le
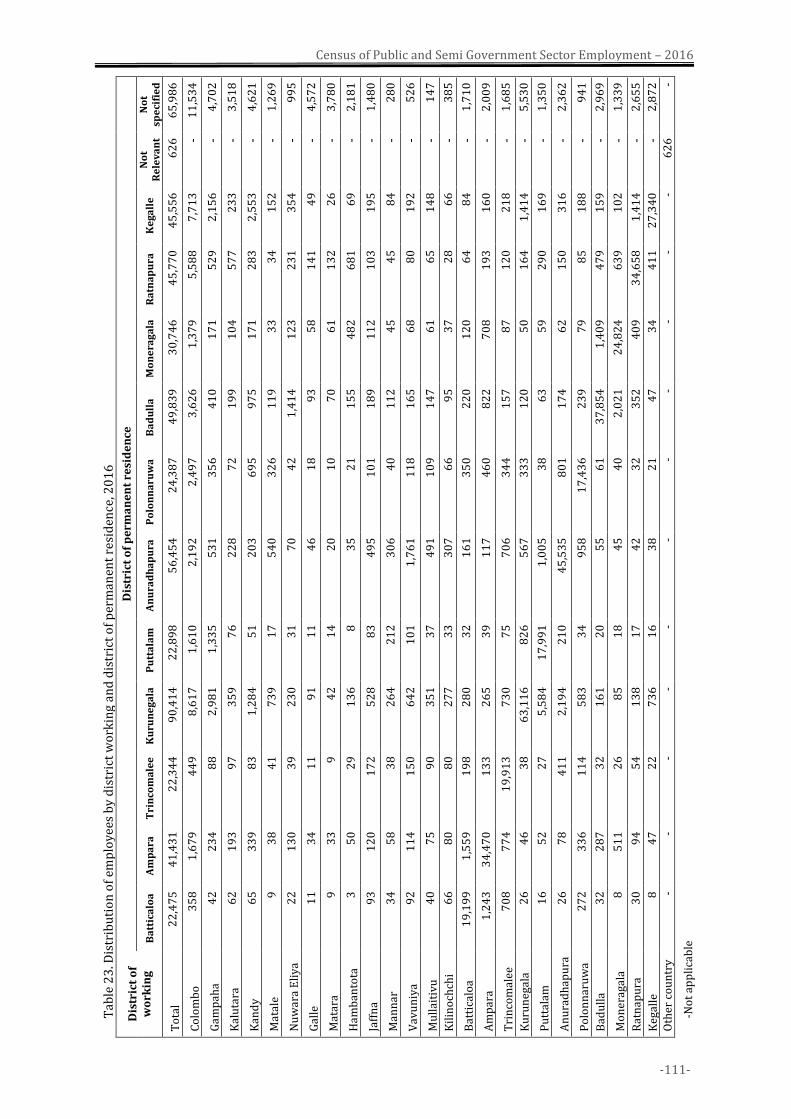
-111-
Census of Public and Semi Government Sector Employment – 2016
Tab
le 2
3. D
istr
ibu
tio
n o
f em
plo
yee
s b
y d
istr
ict
wo
rkin
g an
d d
istr
ict
of
per
man
ent
resi
den
ce, 2
01
6
Dis
tric
t o
f w
ork
ing
Dis
tric
t o
f p
erm
an
en
t re
sid
en
ce
Ba
ttic
alo
a
Am
pa
ra
Tri
nco
ma
lee
K
uru
ne
ga
la
Pu
tta
lam
A
nu
rad
ha
pu
ra
Po
lon
na
ruw
a
Ba
du
lla
M
on
era
ga
la
Ra
tna
pu
ra
Ke
ga
lle
N
ot
Re
lev
an
t N
ot
spe
cifi
ed
To
tal
22
,47
5
41
,43
1
22
,34
4
90
,41
4
22
,89
8
56
,45
4
24
,38
7
49
,83
9
30
,74
6
45
,77
0
45
,55
6
62
6
65
,98
6
Co
lom
bo
3
58
1
,67
9
44
9
8,6
17
1
,61
0
2,1
92
2
,49
7
3,6
26
1
,37
9
5,5
88
7
,71
3
- 1
1,5
34
Gam
pah
a 4
2
23
4
88
2
,98
1
1,3
35
5
31
3
56
4
10
1
71
5
29
2
,15
6
- 4
,70
2
Kal
uta
ra
62
1
93
9
7
35
9
76
2
28
7
2
19
9
10
4
57
7
23
3
- 3
,51
8
Kan
dy
65
3
39
8
3
1,2
84
5
1
20
3
69
5
97
5
17
1
28
3
2,5
53
-
4,6
21
Mat
ale
9
38
4
1
73
9
17
5
40
3
26
1
19
3
3
34
1
52
-
1,2
69
Nu
war
a E
liy
a 2
2
13
0
39
2
30
3
1
70
4
2
1,4
14
1
23
2
31
3
54
-
99
5
Gal
le
11
3
4
11
9
1
11
4
6
18
9
3
58
1
41
4
9
- 4
,57
2
Mat
ara
9
33
9
4
2
14
2
0
10
7
0
61
1
32
2
6
- 3
,78
0
Ham
ban
tota
3
5
0
29
1
36
8
3
5
21
1
55
4
82
6
81
6
9
- 2
,18
1
Jaff
na
93
1
20
1
72
5
28
8
3
49
5
10
1
18
9
11
2
10
3
19
5
- 1
,48
0
Man
nar
3
4
58
3
8
26
4
21
2
30
6
40
1
12
4
5
45
8
4
- 2
80
Vav
un
iya
92
1
14
1
50
6
42
1
01
1
,76
1
11
8
16
5
68
8
0
19
2
- 5
26
Mu
llai
tiv
u
40
7
5
90
3
51
3
7
49
1
10
9
14
7
61
6
5
14
8
- 1
47
Kil
ino
chch
i 6
6
80
8
0
27
7
33
3
07
6
6
95
3
7
28
6
6
- 3
85
Bat
tica
loa
1
9,1
99
1
,55
9
19
8
28
0
32
1
61
3
50
2
20
1
20
6
4
84
-
1,7
10
Am
par
a 1
,24
3
34
,47
0
13
3
26
5
39
1
17
4
60
8
22
7
08
1
93
1
60
-
2,0
09
Tri
nco
mal
ee
70
8
77
4
19
,91
3
73
0
75
7
06
3
44
1
57
8
7
12
0
21
8
- 1
,68
5
Ku
run
egal
a 2
6
46
3
8
63
,11
6
82
6
56
7
33
3
12
0
50
1
64
1
,41
4
- 5
,53
0
Pu
ttal
am
16
5
2
27
5
,58
4
17
,99
1
1,0
05
3
8
63
5
9
29
0
16
9
- 1
,35
0
An
ura
dh
apu
ra
26
7
8
41
1
2,1
94
2
10
4
5,5
35
8
01
1
74
6
2
15
0
31
6
- 2
,36
2
Po
lon
nar
uw
a 2
72
3
36
1
14
5
83
3
4
95
8
17
,43
6
23
9
79
8
5
18
8
- 9
41
Bad
ull
a 3
2
28
7
32
1
61
2
0
55
6
1
37
,85
4
1,4
09
4
79
1
59
-
2,9
69
Mo
ner
agal
a 8
5
11
2
6
85
1
8
45
4
0
2,0
21
2
4,8
24
6
39
1
02
-
1,3
39
Rat
nap
ura
3
0
94
5
4
13
8
17
4
2
32
3
52
4
09
3
4,6
58
1
,41
4
- 2
,65
5
Keg
alle
8
4
7
22
7
36
1
6
38
2
1
47
3
4
41
1
27
,34
0
- 2
,87
2
Oth
er c
ou
ntr
y
- -
- -
- -
- -
- -
- 6
26
-
-No
t ap
pli
cab
le
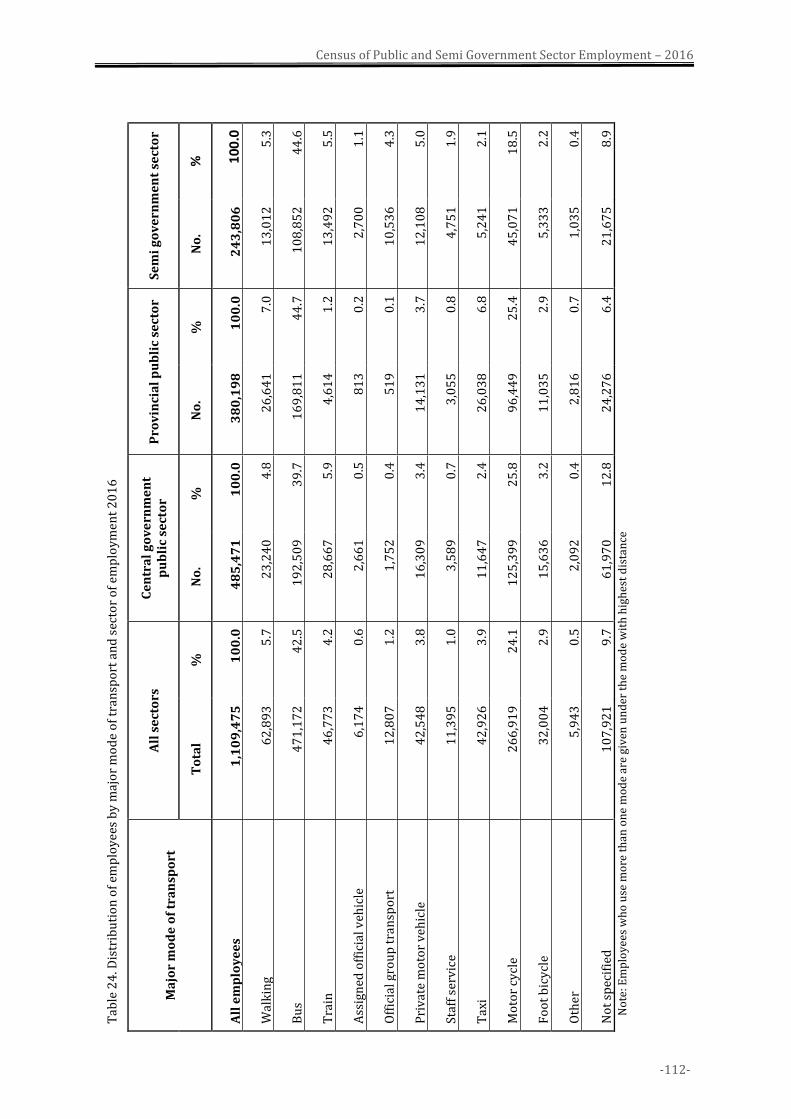
-112-
Census of Public and Semi Government Sector Employment – 2016
Tab
le 2
4. D
istr
ibu
tio
n o
f em
plo
yee
s b
y m
ajo
r m
od
e o
f tr
ansp
ort
an
d s
ecto
r o
f em
plo
ym
ent
20
16
Ma
jor
mo
de
of
tra
nsp
ort
A
ll s
ect
ors
C
en
tra
l g
ov
ern
me
nt
pu
bli
c se
cto
r P
rov
inci
al
pu
bli
c se
cto
r S
em
i g
ov
ern
me
nt
sect
or
To
tal
%
No
. %
N
o.
%
No
. %
All
em
plo
ye
es
1,1
09
,47
5
10
0.0
4
85
,47
1
10
0.0
3
80
,19
8
10
0.0
2
43
,80
6
10
0.0
Wal
kin
g
62
,89
3
5.7
2
3,2
40
4
.8
26
,64
1
7.0
1
3,0
12
5
.3
Bu
s 4
71
,17
2
42
.5
19
2,5
09
3
9.7
1
69
,81
1
44
.7
10
8,8
52
4
4.6
Tra
in
46
,77
3
4.2
2
8,6
67
5
.9
4,6
14
1
.2
13
,49
2
5.5
Ass
ign
ed o
ffic
ial v
ehic
le
6,1
74
0
.6
2,6
61
0
.5
81
3
0.2
2
,70
0
1.1
Off
icia
l gro
up
tra
nsp
ort
1
2,8
07
1
.2
1,7
52
0
.4
51
9
0.1
1
0,5
36
4
.3
Pri
vat
e m
oto
r v
ehic
le
42
,54
8
3.8
1
6,3
09
3
.4
14
,13
1
3.7
1
2,1
08
5
.0
Staf
f se
rvic
e 1
1,3
95
1
.0
3,5
89
0
.7
3,0
55
0
.8
4,7
51
1
.9
Tax
i 4
2,9
26
3
.9
11
,64
7
2.4
2
6,0
38
6
.8
5,2
41
2
.1
Mo
tor
cycl
e
26
6,9
19
2
4.1
1
25
,39
9
25
.8
96
,44
9
25
.4
45
,07
1
18
.5
Fo
ot
bic
ycl
e 3
2,0
04
2
.9
15
,63
6
3.2
1
1,0
35
2
.9
5,3
33
2
.2
Oth
er
5,9
43
0
.5
2,0
92
0
.4
2,8
16
0
.7
1,0
35
0
.4
No
t sp
ecif
ied
1
07
,92
1
9.7
6
1,9
70
1
2.8
2
4,2
76
6
.4
21
,67
5
8.9
N
ote
: Em
plo
yee
s w
ho
use
mo
re t
han
on
e m
od
e ar
e gi
ven
un
der
th
e m
od
e w
ith
hig
hes
t d
ista
nce
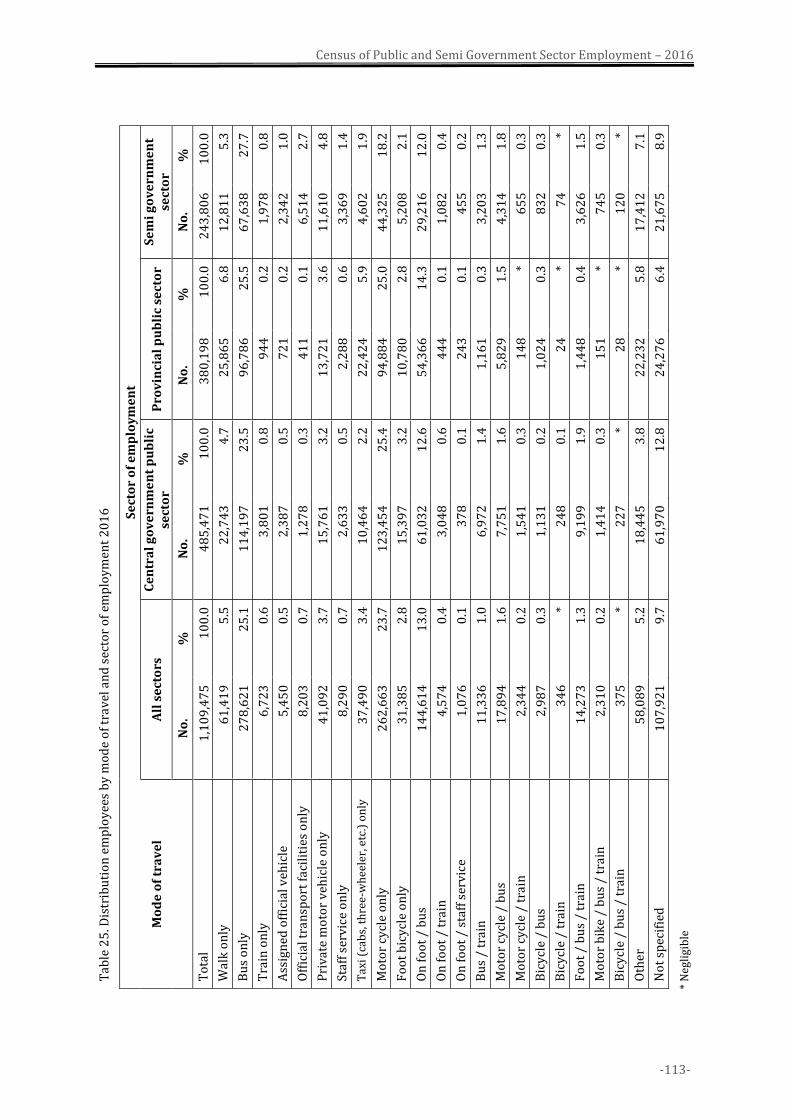
-113-
Census of Public and Semi Government Sector Employment – 2016
Tab
le 2
5. D
istr
ibu
tio
n e
mp
loy
ees
by
mo
de
of
tra
vel
an
d s
ecto
r o
f em
plo
ym
ent
20
16
Mo
de
of
tra
ve
l
Se
cto
r o
f e
mp
loy
me
nt
All
se
cto
rs
Ce
ntr
al
go
ve
rnm
en
t p
ub
lic
sect
or
Pro
vin
cia
l p
ub
lic
sect
or
Se
mi
go
ve
rnm
en
t se
cto
r
No
. %
N
o.
%
No
. %
N
o.
%
To
tal
1,1
09
,47
5
10
0.0
4
85
,47
1
10
0.0
3
80
,19
8
10
0.0
2
43
,80
6
10
0.0
Wal
k o
nly
6
1,4
19
5
.5
22
,74
3
4.7
2
5,8
65
6
.8
12
,81
1
5.3
Bu
s o
nly
2
78
,62
1
25
.1
11
4,1
97
2
3.5
9
6,7
86
2
5.5
6
7,6
38
2
7.7
Tra
in o
nly
6
,72
3
0.6
3
,80
1
0.8
9
44
0
.2
1,9
78
0
.8
Ass
ign
ed o
ffic
ial v
ehic
le
5,4
50
0
.5
2,3
87
0
.5
72
1
0.2
2
,34
2
1.0
Off
icia
l tra
nsp
ort
fac
ilit
ies
on
ly
8,2
03
0
.7
1,2
78
0
.3
41
1
0.1
6
,51
4
2.7
Pri
vat
e m
oto
r v
ehic
le o
nly
4
1,0
92
3
.7
15
,76
1
3.2
1
3,7
21
3
.6
11
,61
0
4.8
Staf
f se
rvic
e o
nly
8
,29
0
0.7
2
,63
3
0.5
2
,28
8
0.6
3
,36
9
1.4
Tax
i (c
abs,
th
ree-
wh
eele
r, e
tc.)
on
ly
37
,49
0
3.4
1
0,4
64
2
.2
22
,42
4
5.9
4
,60
2
1.9
Mo
tor
cycl
e o
nly
2
62
,66
3
23
.7
12
3,4
54
2
5.4
9
4,8
84
2
5.0
4
4,3
25
1
8.2
Fo
ot
bic
ycl
e o
nly
3
1,3
85
2
.8
15
,39
7
3.2
1
0,7
80
2
.8
5,2
08
2
.1
On
fo
ot
/ b
us
14
4,6
14
1
3.0
6
1,0
32
1
2.6
5
4,3
66
1
4.3
2
9,2
16
1
2.0
On
fo
ot
/ tr
ain
4
,57
4
0.4
3
,04
8
0.6
4
44
0
.1
1,0
82
0
.4
On
fo
ot
/ st
aff
serv
ice
1
,07
6
0.1
3
78
0
.1
24
3
0.1
4
55
0
.2
Bu
s /
trai
n
11
,33
6
1.0
6
,97
2
1.4
1
,16
1
0.3
3
,20
3
1.3
Mo
tor
cycl
e /
bu
s 1
7,8
94
1
.6
7,7
51
1
.6
5,8
29
1
.5
4,3
14
1
.8
Mo
tor
cycl
e /
trai
n
2,3
44
0
.2
1,5
41
0
.3
14
8
* 6
55
0
.3
Bic
ycl
e /
bu
s 2
,98
7
0.3
1
,13
1
0.2
1
,02
4
0.3
8
32
0
.3
Bic
ycl
e /
trai
n
34
6
* 2
48
0
.1
24
*
74
*
Fo
ot
/ b
us
/ tr
ain
1
4,2
73
1
.3
9,1
99
1
.9
1,4
48
0
.4
3,6
26
1
.5
Mo
tor
bik
e /
bu
s /
trai
n
2,3
10
0
.2
1,4
14
0
.3
15
1
* 7
45
0
.3
Bic
ycl
e /
bu
s /
trai
n
37
5
* 2
27
*
28
*
12
0
*
Oth
er
58
,08
9
5.2
1
8,4
45
3
.8
22
,23
2
5.8
1
7,4
12
7
.1
No
t sp
ecif
ied
1
07
,92
1
9.7
6
1,9
70
1
2.8
2
4,2
76
6
.4
21
,67
5
8.9
* N
egli
gib
le
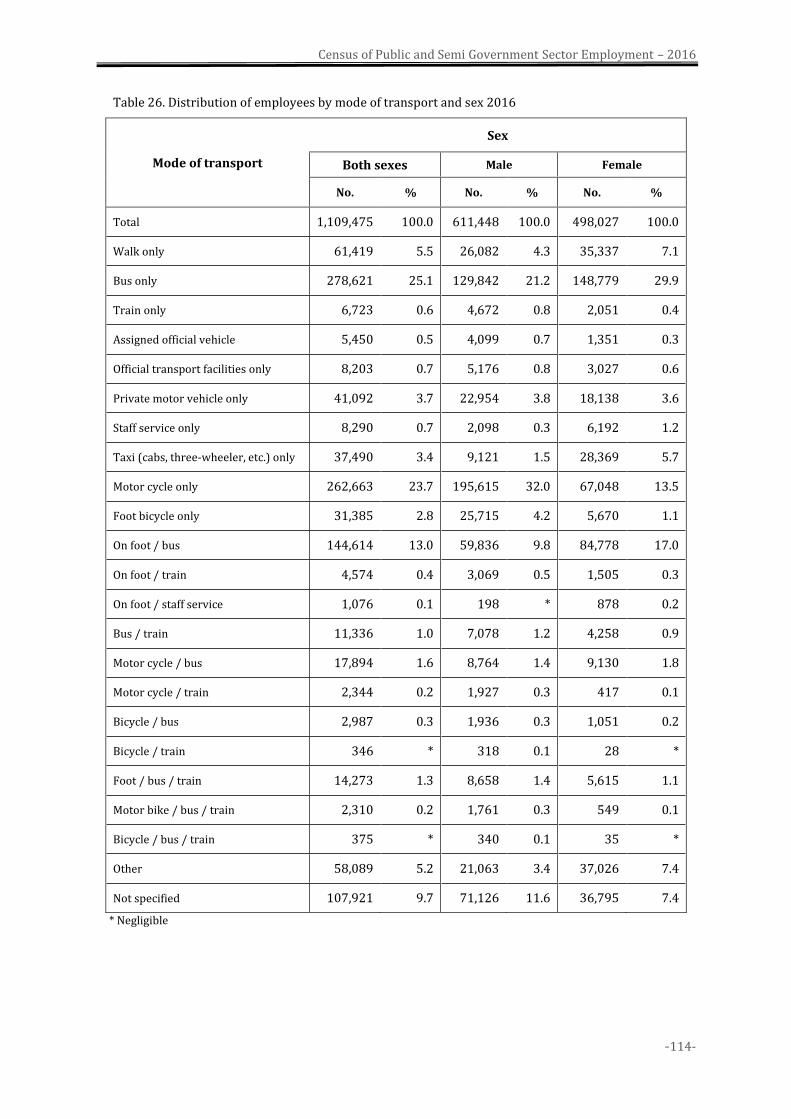
Census of Public and Semi Government Sector Employment – 2016
-114-
Table 26. Distribution of employees by mode of transport and sex 2016
Mode of transport
Sex
Both sexes Male Female
No. % No. % No. %
Total 1,109,475 100.0 611,448 100.0 498,027 100.0
Walk only 61,419 5.5 26,082 4.3 35,337 7.1
Bus only 278,621 25.1 129,842 21.2 148,779 29.9
Train only 6,723 0.6 4,672 0.8 2,051 0.4
Assigned official vehicle 5,450 0.5 4,099 0.7 1,351 0.3
Official transport facilities only 8,203 0.7 5,176 0.8 3,027 0.6
Private motor vehicle only 41,092 3.7 22,954 3.8 18,138 3.6
Staff service only 8,290 0.7 2,098 0.3 6,192 1.2
Taxi (cabs, three-wheeler, etc.) only 37,490 3.4 9,121 1.5 28,369 5.7
Motor cycle only 262,663 23.7 195,615 32.0 67,048 13.5
Foot bicycle only 31,385 2.8 25,715 4.2 5,670 1.1
On foot / bus 144,614 13.0 59,836 9.8 84,778 17.0
On foot / train 4,574 0.4 3,069 0.5 1,505 0.3
On foot / staff service 1,076 0.1 198 * 878 0.2
Bus / train 11,336 1.0 7,078 1.2 4,258 0.9
Motor cycle / bus 17,894 1.6 8,764 1.4 9,130 1.8
Motor cycle / train 2,344 0.2 1,927 0.3 417 0.1
Bicycle / bus 2,987 0.3 1,936 0.3 1,051 0.2
Bicycle / train 346 * 318 0.1 28 *
Foot / bus / train 14,273 1.3 8,658 1.4 5,615 1.1
Motor bike / bus / train 2,310 0.2 1,761 0.3 549 0.1
Bicycle / bus / train 375 * 340 0.1 35 *
Other 58,089 5.2 21,063 3.4 37,026 7.4
Not specified 107,921 9.7 71,126 11.6 36,795 7.4
* Negligible
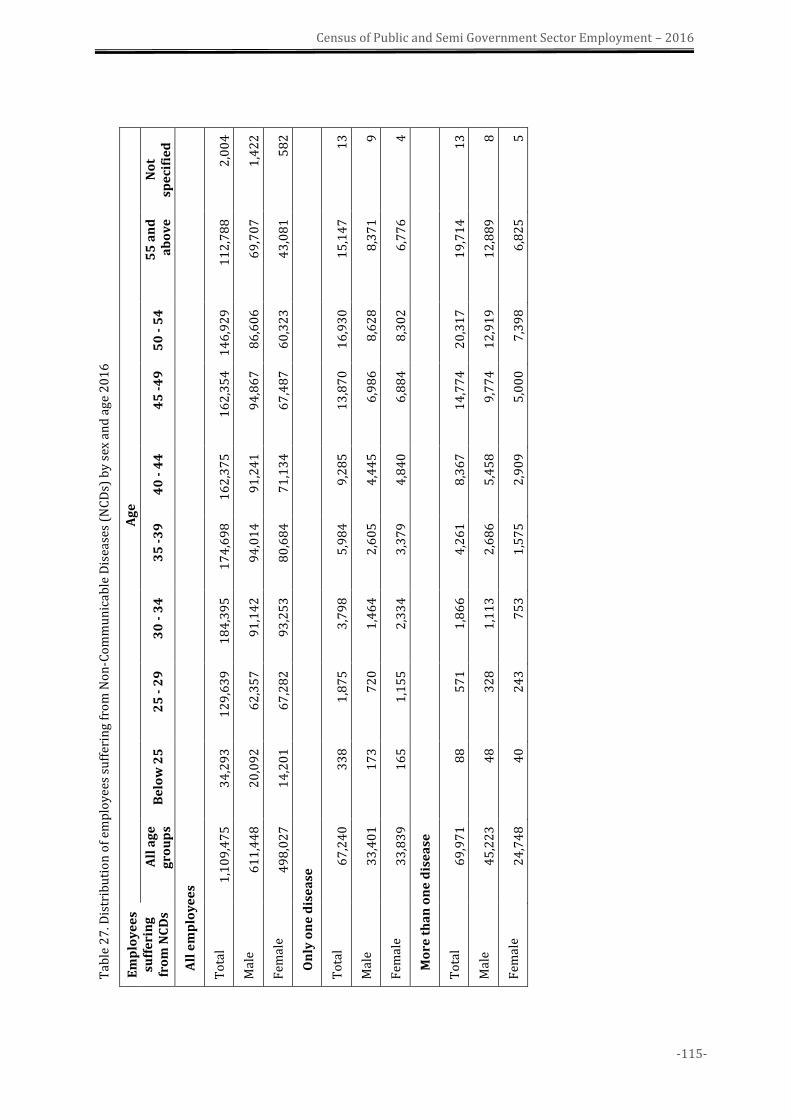
-115-
Census of Public and Semi Government Sector Employment – 2016
Tab
le 2
7. D
istr
ibu
tio
n o
f em
plo
yee
s su
ffer
ing
fro
m N
on
-Co
mm
un
ica
ble
Dis
ease
s (N
CD
s) b
y s
ex a
nd
ag
e 2
01
6
Em
plo
ye
es
suff
eri
ng
fr
om
NC
Ds
Ag
e
All
ag
e
gro
up
s B
elo
w 2
5
25
- 2
9
30
- 3
4
35
-3
9
40
- 4
4
45
-4
9
50
- 5
4
55
an
d
ab
ov
e
No
t sp
eci
fie
d
A
ll e
mp
loy
ee
s
To
tal
1,1
09
,47
5
34
,29
3
12
9,6
39
1
84
,39
5
17
4,6
98
1
62
,37
5
16
2,3
54
1
46
,92
9
11
2,7
88
2
,00
4
Mal
e 6
11
,44
8
20
,09
2
62
,35
7
91
,14
2
94
,01
4
91
,24
1
94
,86
7
86
,60
6
69
,70
7
1,4
22
Fem
ale
49
8,0
27
1
4,2
01
6
7,2
82
9
3,2
53
8
0,6
84
7
1,1
34
6
7,4
87
6
0,3
23
4
3,0
81
5
82
O
nly
on
e d
ise
ase
To
tal
67
,24
0
33
8
1,8
75
3
,79
8
5,9
84
9
,28
5
13
,87
0
16
,93
0
15
,14
7
13
Mal
e 3
3,4
01
1
73
7
20
1
,46
4
2,6
05
4
,44
5
6,9
86
8
,62
8
8,3
71
9
Fem
ale
33
,83
9
16
5
1,1
55
2
,33
4
3,3
79
4
,84
0
6,8
84
8
,30
2
6,7
76
4
M
ore
th
an
on
e d
ise
ase
To
tal
69
,97
1
88
5
71
1
,86
6
4,2
61
8
,36
7
14
,77
4
20
,31
7
19
,71
4
13
Mal
e 4
5,2
23
4
8
32
8
1,1
13
2
,68
6
5,4
58
9
,77
4
12
,91
9
12
,88
9
8
Fem
ale
24
,74
8
40
2
43
7
53
1
,57
5
2,9
09
5
,00
0
7,3
98
6
,82
5
5
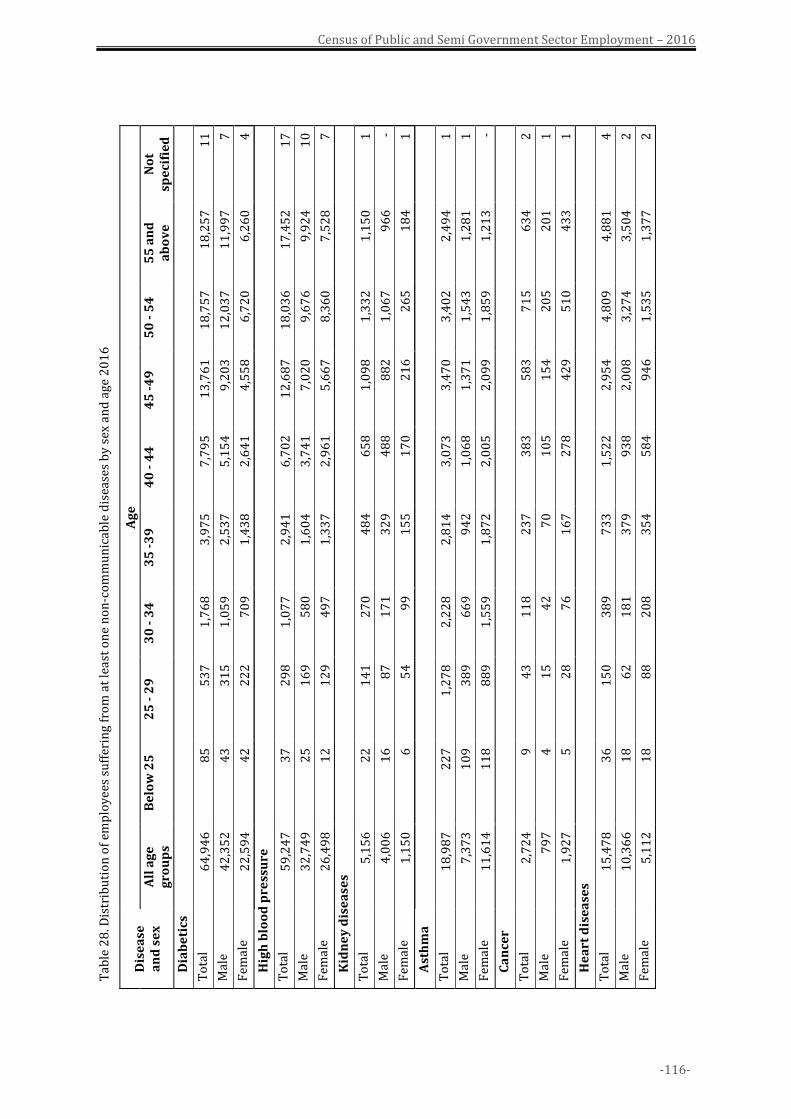
-116-
Census of Public and Semi Government Sector Employment – 2016
Tab
le 2
8. D
istr
ibu
tio
n o
f em
plo
yee
s su
ffer
ing
fro
m a
t le
ast
on
e n
on
-co
mm
un
icab
le d
isea
ses
by
sex
an
d a
ge 2
01
6
Dis
ea
se
an
d s
ex
Ag
e
All
ag
e
gro
up
s B
elo
w 2
5
25
- 2
9
30
- 3
4
35
-3
9
40
- 4
4
45
-4
9
50
- 5
4
55
an
d
ab
ov
e
No
t sp
eci
fie
d
D
iab
eti
cs
To
tal
64
,94
6
85
5
37
1
,76
8
3,9
75
7
,79
5
13
,76
1
18
,75
7
18
,25
7
11
Mal
e 4
2,3
52
4
3
31
5
1,0
59
2
,53
7
5,1
54
9
,20
3
12
,03
7
11
,99
7
7
Fem
ale
22
,59
4
42
2
22
7
09
1
,43
8
2,6
41
4
,55
8
6,7
20
6
,26
0
4
H
igh
blo
od
pre
ssu
re
To
tal
59
,24
7
37
2
98
1
,07
7
2,9
41
6
,70
2
12
,68
7
18
,03
6
17
,45
2
17
Mal
e 3
2,7
49
2
5
16
9
58
0
1,6
04
3
,74
1
7,0
20
9
,67
6
9,9
24
1
0
Fem
ale
26
,49
8
12
1
29
4
97
1
,33
7
2,9
61
5
,66
7
8,3
60
7
,52
8
7
K
idn
ey
dis
ea
ses
To
tal
5,1
56
2
2
14
1
27
0
48
4
65
8
1,0
98
1
,33
2
1,1
50
1
Mal
e 4
,00
6
16
8
7
17
1
32
9
48
8
88
2
1,0
67
9
66
-
Fem
ale
1,1
50
6
5
4
99
1
55
1
70
2
16
2
65
1
84
1
A
sth
ma
To
tal
18
,98
7
22
7
1,2
78
2
,22
8
2,8
14
3
,07
3
3,4
70
3
,40
2
2,4
94
1
Mal
e 7
,37
3
10
9
38
9
66
9
94
2
1,0
68
1
,37
1
1,5
43
1
,28
1
1
Fem
ale
11
,61
4
11
8
88
9
1,5
59
1
,87
2
2,0
05
2
,09
9
1,8
59
1
,21
3
-
C
an
cer
To
tal
2,7
24
9
4
3
11
8
23
7
38
3
58
3
71
5
63
4
2
Mal
e 7
97
4
1
5
42
7
0
10
5
15
4
20
5
20
1
1
Fem
ale
1,9
27
5
2
8
76
1
67
2
78
4
29
5
10
4
33
1
H
ea
rt d
ise
ase
s
To
tal
15
,47
8
36
1
50
3
89
7
33
1
,52
2
2,9
54
4
,80
9
4,8
81
4
Mal
e 1
0,3
66
1
8
62
1
81
3
79
9
38
2
,00
8
3,2
74
3
,50
4
2
Fem
ale
5,1
12
1
8
88
2
08
3
54
5
84
9
46
1
,53
5
1,3
77
2
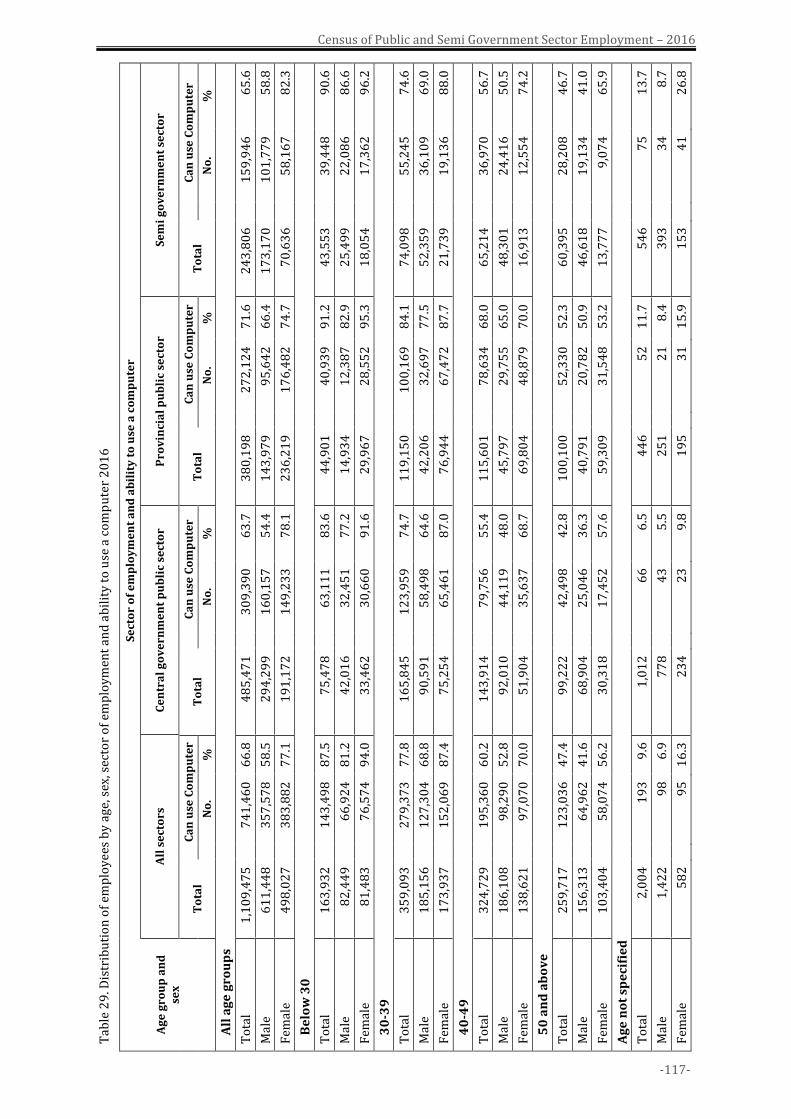
-117-
Census of Public and Semi Government Sector Employment – 2016
Tab
le 2
9. D
istr
ibu
tio
n o
f em
plo
yee
s b
y a
ge, s
ex, s
ecto
r o
f em
plo
ym
ent
and
ab
ilit
y t
o u
se a
co
mp
ute
r 2
01
6
Ag
e g
rou
p a
nd
se
x
Se
cto
r o
f e
mp
loy
me
nt
an
d a
bil
ity
to
use
a c
om
pu
ter
All
se
cto
rs
Ce
ntr
al
go
ve
rnm
en
t p
ub
lic
sect
or
Pro
vin
cia
l p
ub
lic
sect
or
Se
mi
go
ve
rnm
en
t se
cto
r
To
tal
C
an
use
Co
mp
ute
r T
ota
l
Ca
n u
se C
om
pu
ter
To
tal
C
an
use
Co
mp
ute
r T
ota
l
Ca
n u
se C
om
pu
ter
N
o.
%
N
o.
%
N
o.
%
N
o.
%
A
ll a
ge
gro
up
s
To
tal
1,1
09
,47
5
7
41
,46
0
66
.8
48
5,4
71
30
9,3
90
6
3.7
3
80
,19
8
2
72
,12
4
71
.6
24
3,8
06
15
9,9
46
6
5.6
Mal
e 6
11
,44
8
3
57
,57
8
58
.5
29
4,2
99
16
0,1
57
5
4.4
1
43
,97
9
9
5,6
42
6
6.4
1
73
,17
0
1
01
,77
9
58
.8
Fem
ale
49
8,0
27
38
3,8
82
7
7.1
1
91
,17
2
1
49
,23
3
78
.1
23
6,2
19
17
6,4
82
7
4.7
7
0,6
36
58
,16
7
82
.3
B
elo
w 3
0
To
tal
16
3,9
32
14
3,4
98
8
7.5
7
5,4
78
63
,11
1
83
.6
44
,90
1
4
0,9
39
9
1.2
4
3,5
53
39
,44
8
90
.6
Mal
e 8
2,4
49
66
,92
4
81
.2
42
,01
6
3
2,4
51
7
7.2
1
4,9
34
12
,38
7
82
.9
25
,49
9
2
2,0
86
8
6.6
Fem
ale
81
,48
3
7
6,5
74
9
4.0
3
3,4
62
30
,66
0
91
.6
29
,96
7
2
8,5
52
9
5.3
1
8,0
54
17
,36
2
96
.2
3
0-3
9
To
tal
35
9,0
93
27
9,3
73
7
7.8
1
65
,84
5
1
23
,95
9
74
.7
11
9,1
50
10
0,1
69
8
4.1
7
4,0
98
55
,24
5
74
.6
Mal
e 1
85
,15
6
1
27
,30
4
68
.8
90
,59
1
5
8,4
98
6
4.6
4
2,2
06
32
,69
7
77
.5
52
,35
9
3
6,1
09
6
9.0
Fem
ale
17
3,9
37
15
2,0
69
8
7.4
7
5,2
54
65
,46
1
87
.0
76
,94
4
6
7,4
72
8
7.7
2
1,7
39
19
,13
6
88
.0
4
0-4
9
To
tal
32
4,7
29
19
5,3
60
6
0.2
1
43
,91
4
7
9,7
56
5
5.4
1
15
,60
1
7
8,6
34
6
8.0
6
5,2
14
36
,97
0
56
.7
Mal
e 1
86
,10
8
9
8,2
90
5
2.8
9
2,0
10
44
,11
9
48
.0
45
,79
7
2
9,7
55
6
5.0
4
8,3
01
24
,41
6
50
.5
Fem
ale
13
8,6
21
97
,07
0
70
.0
51
,90
4
3
5,6
37
6
8.7
6
9,8
04
48
,87
9
70
.0
16
,91
3
1
2,5
54
7
4.2
5
0 a
nd
ab
ov
e
To
tal
25
9,7
17
12
3,0
36
4
7.4
9
9,2
22
42
,49
8
42
.8
10
0,1
00
52
,33
0
52
.3
60
,39
5
2
8,2
08
4
6.7
Mal
e 1
56
,31
3
6
4,9
62
4
1.6
6
8,9
04
25
,04
6
36
.3
40
,79
1
2
0,7
82
5
0.9
4
6,6
18
19
,13
4
41
.0
Fem
ale
10
3,4
04
58
,07
4
56
.2
30
,31
8
1
7,4
52
5
7.6
5
9,3
09
31
,54
8
53
.2
13
,77
7
9
,07
4
65
.9
Ag
e n
ot
spe
cifi
ed
To
tal
2,0
04
19
3
9.6
1
,01
2
6
6
6.5
4
46
52
1
1.7
5
46
75
1
3.7
Mal
e 1
,42
2
9
8
6.9
7
78
43
5
.5
25
1
2
1
8.4
3
93
34
8
.7
Fem
ale
58
2
9
5
16
.3
23
4
2
3
9.8
1
95
31
1
5.9
1
53
41
2
6.8
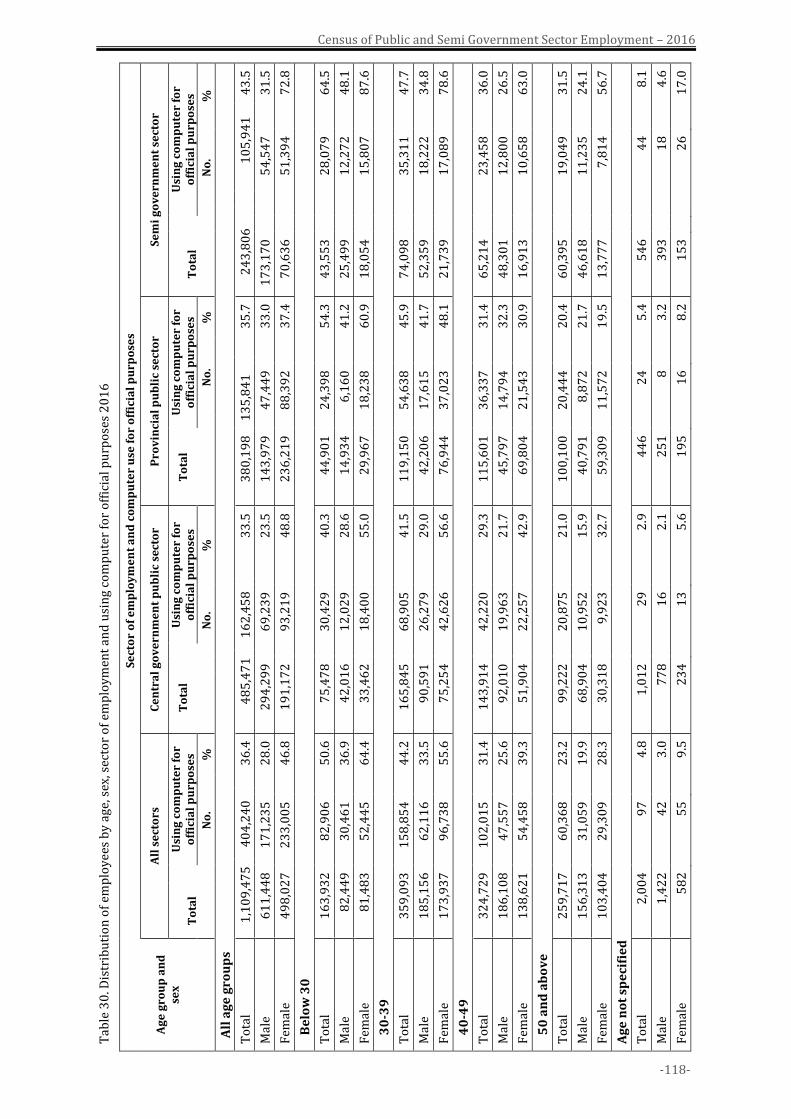
-118-
Census of Public and Semi Government Sector Employment – 2016
Tab
le 3
0. D
istr
ibu
tio
n o
f em
plo
yee
s b
y a
ge, s
ex, s
ecto
r o
f em
plo
ym
ent
and
usi
ng
com
pu
ter
for
off
icia
l pu
rpo
ses
20
16
Ag
e g
rou
p a
nd
se
x
Se
cto
r o
f e
mp
loy
me
nt
an
d c
om
pu
ter
use
fo
r o
ffic
ial
pu
rpo
ses
All
se
cto
rs
Ce
ntr
al
go
ve
rnm
en
t p
ub
lic
sect
or
Pro
vin
cia
l p
ub
lic
sect
or
Se
mi
go
ve
rnm
en
t se
cto
r
To
tal
U
sin
g c
om
pu
ter
for
off
icia
l p
urp
ose
s T
ota
l
Usi
ng
co
mp
ute
r fo
r o
ffic
ial
pu
rpo
ses
To
tal
Usi
ng
co
mp
ute
r fo
r o
ffic
ial
pu
rpo
ses
To
tal
U
sin
g c
om
pu
ter
for
off
icia
l p
urp
ose
s
N
o.
%
No
. %
No
. %
No
. %
All
ag
e g
rou
ps
To
tal
1,1
09
,47
5
40
4,2
40
3
6.4
4
85
,47
1
16
2,4
58
3
3.5
3
80
,19
8
13
5,8
41
3
5.7
2
43
,80
6
10
5,9
41
4
3.5
Mal
e 6
11
,44
8
17
1,2
35
2
8.0
2
94
,29
9
69
,23
9
23
.5
14
3,9
79
4
7,4
49
3
3.0
1
73
,17
0
5
4,5
47
3
1.5
Fem
ale
49
8,0
27
2
33
,00
5
46
.8
19
1,1
72
9
3,2
19
4
8.8
2
36
,21
9
88
,39
2
37
.4
70
,63
6
5
1,3
94
7
2.8
B
elo
w 3
0
To
tal
16
3,9
32
8
2,9
06
5
0.6
7
5,4
78
3
0,4
29
4
0.3
4
4,9
01
2
4,3
98
5
4.3
4
3,5
53
28
,07
9
64
.5
Mal
e 8
2,4
49
3
0,4
61
3
6.9
4
2,0
16
1
2,0
29
2
8.6
1
4,9
34
6
,16
0
41
.2
25
,49
9
1
2,2
72
4
8.1
Fem
ale
81
,48
3
52
,44
5
64
.4
33
,46
2
18
,40
0
55
.0
29
,96
7
18
,23
8
60
.9
18
,05
4
1
5,8
07
8
7.6
3
0-3
9
To
tal
35
9,0
93
1
58
,85
4
44
.2
16
5,8
45
6
8,9
05
4
1.5
1
19
,15
0
54
,63
8
45
.9
74
,09
8
3
5,3
11
4
7.7
Mal
e 1
85
,15
6
62
,11
6
33
.5
90
,59
1
26
,27
9
29
.0
42
,20
6
17
,61
5
41
.7
52
,35
9
1
8,2
22
3
4.8
Fem
ale
17
3,9
37
9
6,7
38
5
5.6
7
5,2
54
4
2,6
26
5
6.6
7
6,9
44
3
7,0
23
4
8.1
2
1,7
39
17
,08
9
78
.6
4
0-4
9
To
tal
32
4,7
29
1
02
,01
5
31
.4
14
3,9
14
4
2,2
20
2
9.3
1
15
,60
1
36
,33
7
31
.4
65
,21
4
2
3,4
58
3
6.0
Mal
e 1
86
,10
8
47
,55
7
25
.6
92
,01
0
19
,96
3
21
.7
45
,79
7
14
,79
4
32
.3
48
,30
1
1
2,8
00
2
6.5
Fem
ale
13
8,6
21
5
4,4
58
3
9.3
5
1,9
04
2
2,2
57
4
2.9
6
9,8
04
2
1,5
43
3
0.9
1
6,9
13
10
,65
8
63
.0
5
0 a
nd
ab
ov
e
To
tal
25
9,7
17
6
0,3
68
2
3.2
9
9,2
22
2
0,8
75
2
1.0
1
00
,10
0
20
,44
4
20
.4
60
,39
5
1
9,0
49
3
1.5
Mal
e 1
56
,31
3
31
,05
9
19
.9
68
,90
4
10
,95
2
15
.9
40
,79
1
8,8
72
2
1.7
4
6,6
18
11
,23
5
24
.1
Fem
ale
10
3,4
04
2
9,3
09
2
8.3
3
0,3
18
9
,92
3
32
.7
59
,30
9
11
,57
2
19
.5
13
,77
7
7
,81
4
56
.7
Ag
e n
ot
spe
cifi
ed
To
tal
2,0
04
9
7
4.8
1
,01
2
29
2
.9
44
6
24
5
.4
54
6
4
4
8.1
Mal
e 1
,42
2
42
3
.0
77
8
16
2
.1
25
1
8
3.2
3
93
18
4
.6
Fem
ale
58
2
55
9
.5
23
4
13
5
.6
19
5
16
8
.2
15
3
2
6
17
.0
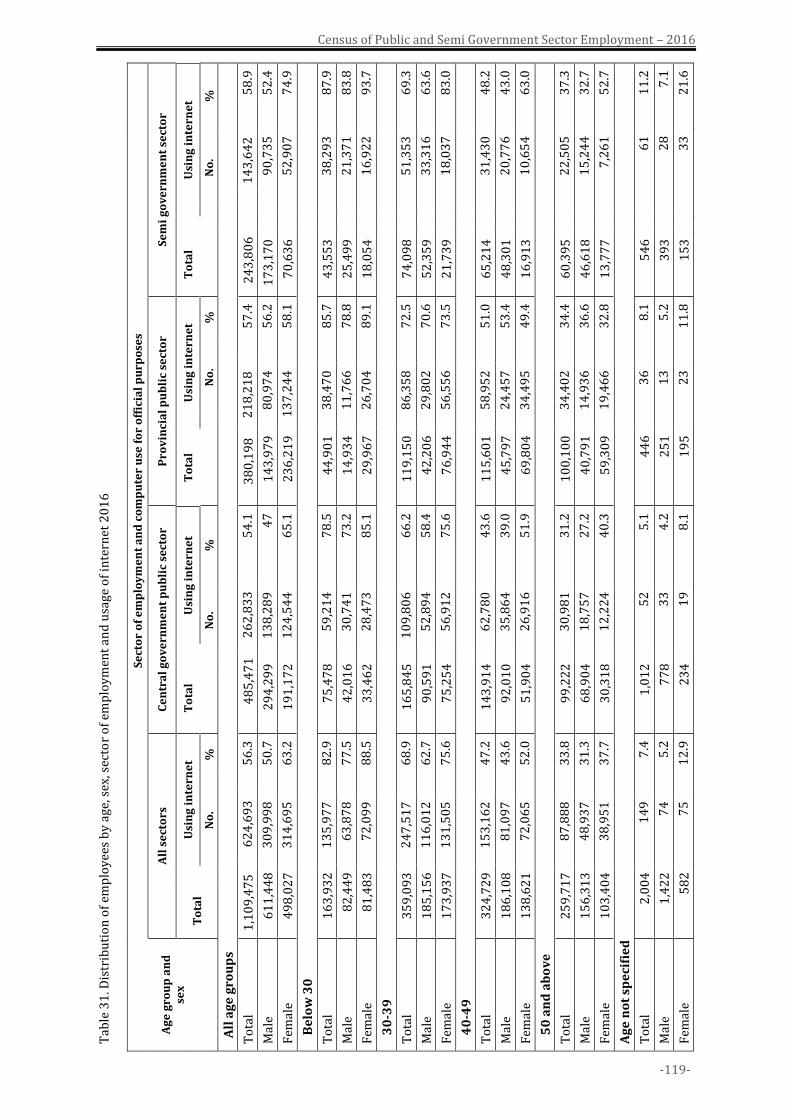
-119-
Census of Public and Semi Government Sector Employment – 2016
Tab
le 3
1. D
istr
ibu
tio
n o
f em
plo
yee
s b
y a
ge, s
ex, s
ecto
r o
f em
plo
ym
ent
and
usa
ge
of
inte
rnet
20
16
Ag
e g
rou
p a
nd
se
x
Se
cto
r o
f e
mp
loy
me
nt
an
d c
om
pu
ter
use
fo
r o
ffic
ial
pu
rpo
ses
All
se
cto
rs
Ce
ntr
al
go
ve
rnm
en
t p
ub
lic
sect
or
Pro
vin
cia
l p
ub
lic
sect
or
Se
mi
go
ve
rnm
en
t se
cto
r
To
tal
U
sin
g i
nte
rne
t T
ota
l
Usi
ng
in
tern
et
To
tal
Usi
ng
in
tern
et
To
tal
U
sin
g i
nte
rne
t
N
o.
%
No
. %
No
. %
N
o.
%
All
ag
e g
rou
ps
To
tal
1,1
09
,47
5
62
4,6
93
5
6.3
4
85
,47
1
26
2,8
33
5
4.1
38
0,1
98
2
18
,21
8
57
.4
24
3,8
06
14
3,6
42
5
8.9
Mal
e 6
11
,44
8
30
9,9
98
5
0.7
2
94
,29
9
13
8,2
89
4
7
14
3,9
79
8
0,9
74
5
6.2
1
73
,17
0
9
0,7
35
5
2.4
Fem
ale
49
8,0
27
3
14
,69
5
63
.2
19
1,1
72
1
24
,54
4
65
.1
23
6,2
19
1
37
,24
4
58
.1
70
,63
6
5
2,9
07
7
4.9
B
elo
w 3
0
To
tal
16
3,9
32
1
35
,97
7
82
.9
75
,47
8
59
,21
4
78
.5
44
,90
1
38
,47
0
85
.7
43
,55
3
3
8,2
93
8
7.9
Mal
e 8
2,4
49
6
3,8
78
7
7.5
4
2,0
16
3
0,7
41
7
3.2
1
4,9
34
1
1,7
66
7
8.8
2
5,4
99
21
,37
1
83
.8
Fem
ale
81
,48
3
72
,09
9
88
.5
33
,46
2
28
,47
3
85
.1
29
,96
7
26
,70
4
89
.1
18
,05
4
1
6,9
22
9
3.7
3
0-3
9
To
tal
35
9,0
93
2
47
,51
7
68
.9
16
5,8
45
1
09
,80
6
66
.2
11
9,1
50
8
6,3
58
7
2.5
7
4,0
98
51
,35
3
69
.3
Mal
e 1
85
,15
6
11
6,0
12
6
2.7
9
0,5
91
5
2,8
94
5
8.4
4
2,2
06
2
9,8
02
7
0.6
5
2,3
59
33
,31
6
63
.6
Fem
ale
17
3,9
37
1
31
,50
5
75
.6
75
,25
4
56
,91
2
75
.6
76
,94
4
56
,55
6
73
.5
21
,73
9
1
8,0
37
8
3.0
4
0-4
9
To
tal
32
4,7
29
1
53
,16
2
47
.2
14
3,9
14
6
2,7
80
4
3.6
1
15
,60
1
58
,95
2
51
.0
65
,21
4
3
1,4
30
4
8.2
Mal
e 1
86
,10
8
81
,09
7
43
.6
92
,01
0
35
,86
4
39
.0
45
,79
7
24
,45
7
53
.4
48
,30
1
2
0,7
76
4
3.0
Fem
ale
13
8,6
21
7
2,0
65
5
2.0
5
1,9
04
2
6,9
16
5
1.9
6
9,8
04
3
4,4
95
4
9.4
1
6,9
13
10
,65
4
63
.0
5
0 a
nd
ab
ov
e
To
tal
25
9,7
17
8
7,8
88
3
3.8
9
9,2
22
3
0,9
81
3
1.2
1
00
,10
0
34
,40
2
34
.4
60
,39
5
2
2,5
05
3
7.3
Mal
e 1
56
,31
3
48
,93
7
31
.3
68
,90
4
18
,75
7
27
.2
40
,79
1
14
,93
6
36
.6
46
,61
8
1
5,2
44
3
2.7
Fem
ale
10
3,4
04
3
8,9
51
3
7.7
3
0,3
18
1
2,2
24
4
0.3
5
9,3
09
1
9,4
66
3
2.8
1
3,7
77
7,2
61
5
2.7
Ag
e n
ot
spe
cifi
ed
To
tal
2,0
04
1
49
7
.4
1,0
12
5
2
5.1
4
46
3
6
8.1
5
46
61
1
1.2
Mal
e 1
,42
2
74
5
.2
77
8
33
4
.2
25
1
13
5
.2
39
3
2
8
7.1
Fem
ale
58
2
75
1
2.9
2
34
1
9
8.1
1
95
2
3
11
.8
15
3
3
3
21
.6

Census of Public and Semi Government Sector Employment – 2016
-120-
Census of Public and Semi Government Sector Employment – 2016
-121-
ANNEXURES
A. CLASSIFICATION OF OCCUPATIONS
The classification of occupations used in the Census of Public and Semi Government Sector
Employment is based on the Sri Lanka Standard Classification of Occupation (SLSCO) 1998
revision. In line with the International Standard Classification of Occupations, all occupations
have been categorized into nine major groups.
Major Group 1 – Legislators, Senior Officials and Managers This group of occupations covers the persons who are involved in planning, formulating and
deciding on policies and hence Policy Makers, Administrators and Managers are categorized
under this group.
This group consists of higher officials such as Commissioners, Secretaries, Directors and
Controllers etc. in public sector and Managers & Executive level officials in the Semi government
sector also fall into this group.
Major Group 2 – Professionals
This group includes the occupations whose main tasks require a high level of professional
knowledge and experience in related fields.
Accordingly, this group covers higher level professionals which are Doctors, Engineers, Lecturers,
Accountants, Lawyers etc. and Pharmacists, Nurses, Midwives, Teachers, Librarians etc. are
covered middle level professionals.
Major Group 3 – Technicians and Associate Professionals
This group covers the occupations which require the experience and knowledge necessary to
assume operational responsibility and to give technical support to the administrators and the
professionals in the Major Group 1 and 2. Field officers which are Grama Niladhari, Agriculture
Instructors etc. included in this group and this group consists middle level administration
categories such as Administrative Officers. The occupations which are Engineering Technicians,
Inspectors, Health Associate Professionals, Assistants etc. are included this group.
Major Group 4 – Clerks
This group covers occupations whose main tasks require the knowledge and experience
necessary in recording, organizing, storing and retrieving, information, computing, numerical,
financial and statistical data and also performing a number of client oriental clerical duties. All
clerical parallel officials such as Shroffs, Book Keepers, Receptionists, Clerks, Stenographers,
Typists, Data Entry Operators, Private Secretaries etc. are included in this group.
Major Group 5 – Service Workers and Shop & Market Sales Workers
This group covers occupations whose main tasks require the knowledge and experience
necessary to provide protective services, personal services related to travel, housekeeping,
catering and personal care or to sell and demonstrate goods for wholesale or retail shops and
similar establishments. All security related personnel including Police Staff below the rank of
Assistant Superintendent of Police, Home Guards etc. come under this group.
Census of Public and Semi Government Sector Employment – 2016
-122-
This group also includes occupations such as House Keepers, Cooks, Protective Service Workers,
Sales Persons, Travel Guides, Bus Conductors etc.
Major Group 6 – Skilled Agricultural and Fishery Workers
This group covers occupations whose main tasks require the knowledge and experience
necessary to grow and harvest crops, breed, feed or hunt animals, catch or breed fish or cultivate
or gather other forms of aquatic life.
(Public and semi government sector occupations do not come under major group 6)
Major Group 7 – Craft and Related Workers
This group covers occupations whose main tasks require the knowledge and experience
necessary to extract and treat raw materials, manufacture and repair goods and construct,
maintain and repair roads, structures and machinery. Skilled Labourers having professional
training which includes Minor staff level occupations such as Carpenters, Painters, Fitters,
Mechanics, Printing Workers, Textile related Workers etc. are categorized under this group.
Major Group 8 – Plant and Machine Operators and Assemblers
This group covers occupations whose main tasks require the knowledge and experience
necessary to operate vehicles and other mobile equipment, control and monitor the operations
of industrial plant and machinery. In this group occupations are parallel to skilled labourers. This
group consists of Drivers, Mobile Machine Operators, Stationary Machine Operators etc.
Major Group 9 – Elementary Occupations
This major group covers occupations which mostly require simple and routine tasks, performed
with physical effort and hand held simple tools with little initiative and judgment which means
simple knowledge and experience. This group contains all unskilled labourers classified under all
occupations. Cleaners, Messengers, Watchers, KKS, Agricultural Labourers, Semi-skilled and
Unskilled Labourers etc. are included in major group 9.
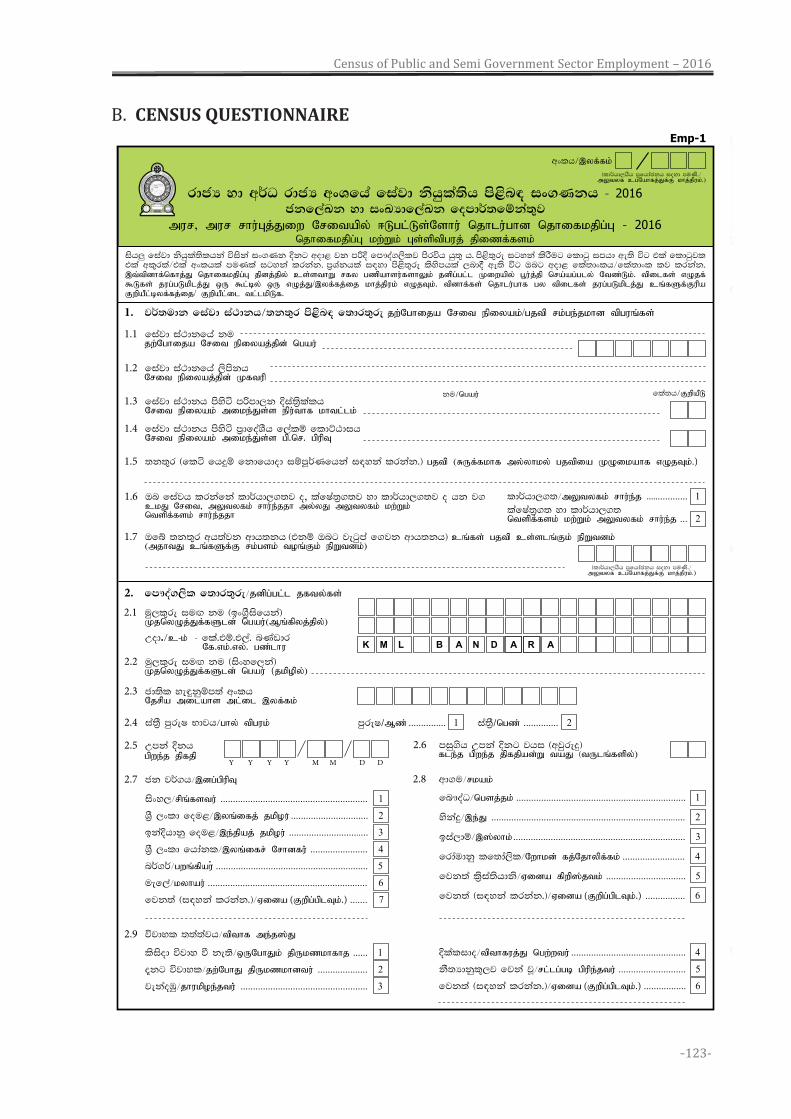
Census of Public and Semi Government Sector Employment – 2016
-123-
B. CENSUS QUESTIONNAIRE
mur> mur rhu;Gj;Jiw Nritapy; <Lgl;Ls;Nshu; njhlu;ghd njhifkjpg;G - 2016njhifkjpg;G kw;Wk; Gs;sptpguj; jpizf;fsk;
ish¨ fiajd kshqla;slhka úiska ix.Kk Èkg wod< jk mßÈ fm!oa.,slj msrúh hq;= h' ms<s;=re igyka lsrSug fldgq imhd we;s úg tla fldgqjl tla wl=rla$tla wxlhla muKla igyka lrkak. m%Yakhla i|yd ms<s;=re lsysmhla ,nd§ we;s úg Tng wod< fla;dxlh$fla;dxl lj lrkak' ,t;tpdhf;nfhj;J njhifkjpg;G jpdj;jpy; cs;sthW rfy gzpahsu;fshYk; jdpg;gl;l Kiwapy; g+u;j;jp nra;ag;gly; Ntz;Lk;. tpilfs; vOjf; $Lfs; jug;gLkplj;J xU $l;by; xU vOj;J/,yf;fj;ij khj;jpuk; vOjTk;. tpdhf;fs; njhlu;ghf gy tpilfs; jug;gLkplj;J cq;fSf;Fupa FwpaPl;byf;fj;ij/ FwpaPl;il tl;lkpLf.
1. j¾;udk fiajd ia:dkh$;k;=r ms<sn| f;dr;=re jw;Nghija Nrit epiyak;/gjtp rk;ge;jkhd tpguq;fs;
2. fm!oa.,sl f;dr;=re$jdpg;gl;l jfty;fs;
rdcH yd w¾O rdcH wxYfha fiajd kshqla;sh ms<sn| ix.Kkh - 2016ckf,aLk yd ixLHdf,aLk fomd¾;fïka;=j
1.1 fiajd ia:dkfha ku jw;Nghija Nrit epiyaj;jpd; ngau;
1.2 fiajd ia:dkfha ,smskh Nrit epiyaj;jpd; Kftup
2.1 uq,l=re iuÕ ku ^bx.%Sisfhka& KjnyOj;Jf;fSld; ngau;(Mq;fpyj;jpy;;)
K M L B A N D A R A
2.2 uq,l=re iuÕ ku ^isxyf,ka& KjnyOj;Jf;fSld; ngau; (jkpopy;)
1.3 fiajd ia:dkh msysá mßmd,k Èia;%slalh Nrit epiyak; mike;Js;s epu;thf khtl;lk;
1.4 fiajd ia:dkh msysá m%dfoaYSh f,alï fldÜGdih Nrit epiyak; mike;Js;s gp.nr. gpupT
1.6 Tn fiajh lrkafka ld¾hd,.;j o, lafIa;%.;j yd ld¾hd,.;j o hk j. ckJ Nrit> mYtyfk; rhu;e;jjh my;yJ mYtyfk; kw;Wk; ntspf;fsk; rhu;e;jjh
ld¾hd,.;$mYtyfk; rhu;e;j ................. 1lafIa;%.; yd ld¾hd,.;ntspf;fsk; kw;Wk; mYtyfk; rhu;e;j ... 2
Wod.$c-k; - fla'tï't,a' nKavdr Nf.vk;.vy;. gz;lhu
wxlh$,yf;fk;
^ld¾hd,hSh m%fhdackh ioyd muKs'$ mYtyf cgNahfj;Jf;F khj;jpuk;.)
2.6 miq.sh Wmka Èkg jhi ^wjqreÿ& fle;j gpwe;j jpfjpad;W taJ ^tUlq;fspy;)
isxy,$rpq;fstu; ........................................................... 1Y%S ,xld fou<$,yq;ifj; jkpou; ............................... 2bkaÈhdkq fou<$,e;jpaj; jkpou; ................................ 3Y%S ,xld fhdakl$,yq;ifr; Nrhdfu;; ....................... 4n¾.¾$gwq;fpau; ............................................................. 5
uef,a$kyhau; ................................................................ 6
fjk;a ^i|yka lrkak'&$Vida (Fwpg;gplTk;.) ....... 7
2.3 cd;sl ye÷kqïm;a wxlh Njrpa milahs ml;il ,yf;fk;
2.4 ia;%S mqreI Ndjh$ghy; tpguk;
2.5 Wmka Èkh gpwe;j jpfjp 2.7 ck j¾.h$,dg;gpupT 2.8 wd.u$rkak;
mqreI/Mz; ............... 1 ia;%S/ngz; .............. 2
Y Y Y Y M M D D
fn!oaO$ngsj;jk; .................................................................... 1yskaÿ$,e;J .............................................................................. 2
bia,dï$,];yhk;; ..................................................................... 3
frdaudkq lf;da,sl$Nwhkd; fj;Njhypf;fk; ......................... 4
fjk;a l%sia;shdks$Vida fpwp];jtk; ................................ 5fjk;a ^i|yka lrkak'&$Vida (Fwpg;gplTk;.) ................ 6
ku$ngau; fla;h$FwpaPL
1.5 ;k;=r ^flá fhÿï fkdfhdod iïmQ¾Kfhka i|yka lrkak'& gjtp (RUf;fkhf my;yhky; gjtpia KOikahf vOjTk;.)
lsisod újdy ù ke;s$xUNghJk; jpUkzkhfhj ...... 1
±kg újdyl$jw;NghJ jpUkzkhdtu; .................... 2jekaoUq$jhukpoe;jtu;; ................................................... 3
2.9 újdyl ;;a;ajh$tpthf me;j];J
Èlalido$tpthfuj;J ngw;wtu;; .............................................. 4
kS;Hdkql+,j fjka jQ$rl;lg;gb gpupe;jtu; ........................... 5fjk;a ^i|yka lrkak'&$Vida (Fwpg;gplTk;.) ................. 6
1.7 Tfí ;k;=r wh;ajk wdh;kh ^tkï Tng jegqma f.jk wdh;kh& cq;fs; gjtp cs;slq;Fk; epWtdk; (mjhtJ cq;fSf;F rk;gsk; toq;Fk; epWtdk;)
^ld¾hd,hSh m%fhdackh ioyd muKs'$mYtyf cgNahfj;Jf;F khj;jpuk;.)
Emp-1
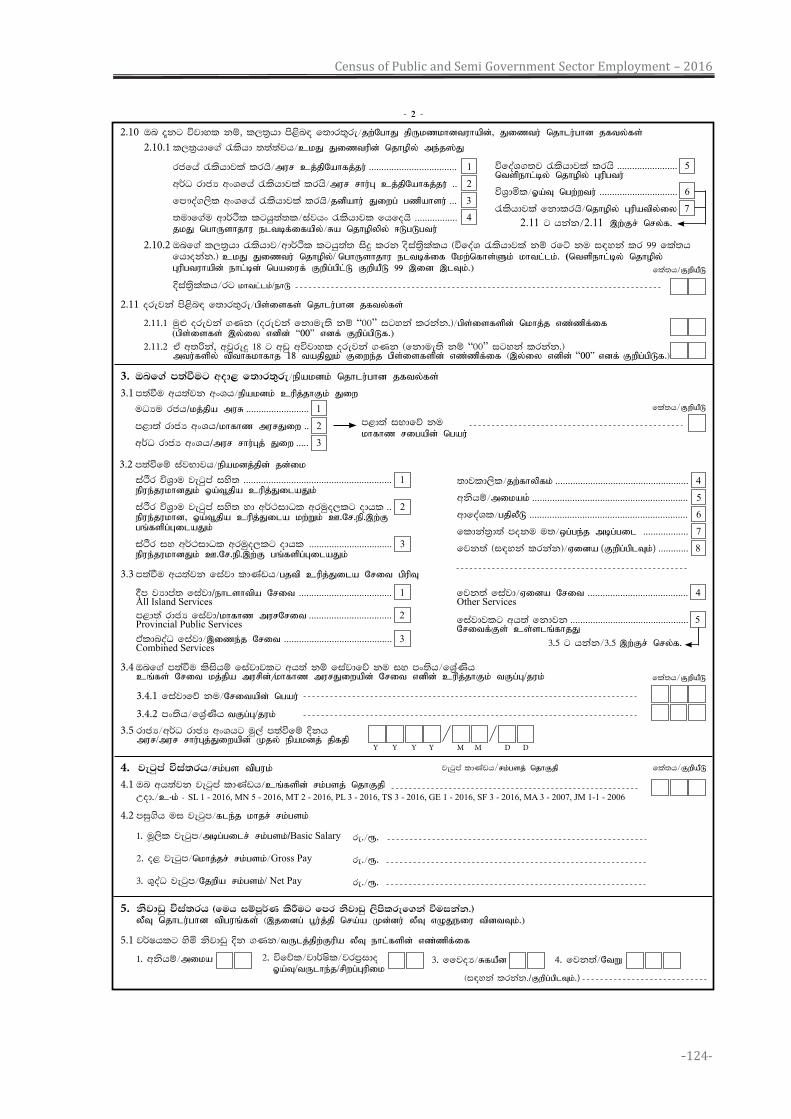
Census of Public and Semi Government Sector Employment – 2016
-124-
4.1 Tn wh;ajk jegqma ldKavh$cq;fspd; rk;gsj; njhFjp
Wod'$c-k; - SL 1 - 2016, MN 5 - 2016, MT 2 - 2016, PL 3 - 2016, TS 3 - 2016, GE 1 - 2016, SF 3 - 2016, MA 3 - 2007, JM 1-1 - 2006
4. jegqma úia;rh$rk;gs tpguk;
4.2 miq.sh ui jegqm$fle;j khjr; rk;gsk;
1' uQ,sl jegqm$mbg;gilr; rk;gsk;/Basic Salary
2' o< jegqm$nkhj;jr; rk;gsk;$Gross Pay
3' Y=oaO jegqm$Njwpa rk;gsk;/ Net Pay
3. Tnf.a m;aùug wod< f;dr;=re$epakdk; njhlu;ghd jfty;fs;
3.1 m;aùu wh;ajk wxYh$epakdk; cupj;jhFk; Jiw
uOHu rch/kj;jpa muR ......................... 1m<d;a rdcH wxYh/khfhz murJiw .. 2
w¾O rdcH wxYh/mur rhu;Gj; Jiw ..... 3
3.4 Tnf.a m;aùu lsishï fiajdjlg wh;a kï fiajdfõ ku iy mx;sh$fY%aKsh cq;fs; Nrit kj;jpa murpd;/khfhz murJiwapd; Nrit vdpd; cupj;jhFk; tFg;G/juk;
3.5 rdcH$w¾O rdcH wxYhg uq,a m;aùfï Èkh mur/mur rhu;Gj;Jiwapd; Kjy; epakdj; jpfjp
Y Y Y Y M M D D
2.11 orejka ms<sn| f;dr;=re$gps;isfs; njhlu;ghd jfty;fs; 2.11.1 uq¿ orejka .Kk ^orejka fkdue;s kï “00” igyka lrkak'&$gps;isfspd; nkhj;j vz;zpf;if (gps;isfs; ,y;iy vdpd; “00” vdf; Fwpg;gpLf.) 2.11.2 ta w;ßka, wjqreÿ 18 g wvq wújdyl orejka .Kk ^fkdue;s kï “00” igyka lrkak'& mtu;fspy; tpthfkhfhj 18 tajpYk; Fiwe;j gps;isfspd; vz;zpf;if ^,y;iy vdpd; “00” vdf; Fwpg;gpLf.&
3.3 m;aùu wh;ajk fiajd ldKavh$gjtp cupj;Jila Nrit gpupT
3.2 m;aùfï iajNdjh$epakdj;jpd; jd;ik
iaÒr úY%du jegqma iys; ........................................................... 1 epue;jukhdJk; Xa;t+jpa cupj;JilaJk;
iaÒr úY%du jegqma iys; yd w¾:idOl wruqo,lg odhl .. 2epue;jukhd> Xa;t+jpa cupj;Jila kw;Wk; C.Nr.ep.,w;F gq;fspg;GilaJk;
iaÒr iy w¾:idOl wruqo,lg odhl ................................. 3epue;jukhdJk; C.Nr.ep.,w;F gq;fspg;GilaJk;
;djld,sl$jw;fhypfk; ..................................................... 4wkshï$mikak; .............................................................. 5
wdfoaYl$gjpyPL ............................................................... 6
fldka;%d;a moku u;$xg;ge;j mbg;gil .................. 7fjk;a ^i|yka lrkak&$Vida (Fwpg;gplTk;) ............ 8
2.10.2 Tnf.a l,;%hd /lshdj$wd¾Ól lghq;a; isÿ lrk osia;%slalh ^úfoaY /lshdjla kï rfÜ ku i|yka lr 99 fla;h fhdokak'& ckJ Jiztu; njhopy;/ nghUshjhu eltbf;if Nkw;nfhs;Sk; khtl;lk;. (ntspehl;by; njhopy; Gupgtuhapd; ehl;bd; ngaiuf; Fwpg;gpl;L FwpaPL 99 ,id ,lTk;.) fla;h$FwpaPL
Èia;%slalh$rg khtl;lk;/ehL
3.4.1 fiajdfõ ku$Nritapd; ngau;
3.4.2 mx;sh$fY%aKsh tFg;G/juk;
2.10 Tn ±kg újdyl kï, l,;%hd ms<sn| f;dr;=re$jw;NghJ jpUkzkhdtuhapd;> Jiztu; njhlu;ghd jfty;fs;
rcfha /lshdjla lrhs$mur cj;jpNahfj;ju; ................................... 1w¾O rdcH wxYfha /lshdjla lrhs$mur rhu;G cj;jpNahfj;ju; .. 2
fm!oa.,sl wxYfha /lshdjla lrhs$jdpahu; Jiwg; gzpahsu; ... 3;udf.au wd¾Ól lghq;a;l$iajhx /lshdjl fhfohs ................. 4 jkJ nghUshjhu eltbf;ifapy;$Ra njhopypy; <LgLgtu;
2.11 g hkak$2.11 ,w;Fr; nry;f.
úfoaY.;j /lshdjla lrhs ........................ 5ntspehl;by; njhopy; Gupgtu;
úY%dñl$Xa;T ngw;wtu; ............................... 6/lshdjla fkdlrhs$njhopy; Gupatpy;iy 7
m<d;a iNdfõ ku
khfhz rigapd; ngau;
fla;h$FwpaPL
fla;h$FwpaPL
fla;h$FwpaPL
§m jHdma; fiajd/ehlshtpa Nrit ..................................... 1All Island Services m<d;a rdcH fiajd/khfhz murNrit ................................. 2Provincial Public ServicestaldnoaO fiajd$,ize;j Nrit ........................................... 3Combined Services
fjk;a fiajd$Vida Nrit ........................................ 4Other Services
fiajdjlg wh;a fkdjk ............................................... 5Nritf;Fs; cs;slq;fhjJ
3'5 g hkak$3'5 ,w;Fr; nry;f.
5. ksjdvq úia;rh ^fuh iïmQ¾K lsÍug fmr ksjdvq ,smslref.ka úuikak'&yPT njhlu;ghd tpguq;fs; ^,jidg; g+u;j;jp nra;a Kd;du; yPT vOJeiu tpdtTk;.)
5.1 j¾Ihlg ysñ ksjdvq Èk .Kk$tUlj;jpw;Fupa yPT ehl;fspd; vz;zpf;if
1' wkshï$mika 2' úfõl$jd¾Isl$jrm%ido Xa;T/tUlhe;j/rpwg;Gupik
3' ffjoH$RfaPd 4' fjk;a$NtW
^i|yka lrkak'/Fwpg;gplTk;.)
re.$&.
re.$&.
re.$&.
2.10.1 l,;%hdf.a /lshd ;;a;ajh$ckJ Jiztupd; njhopy; me;j];J
- 2 -
jegqma ldKavh$rk;gsj; njhFjp
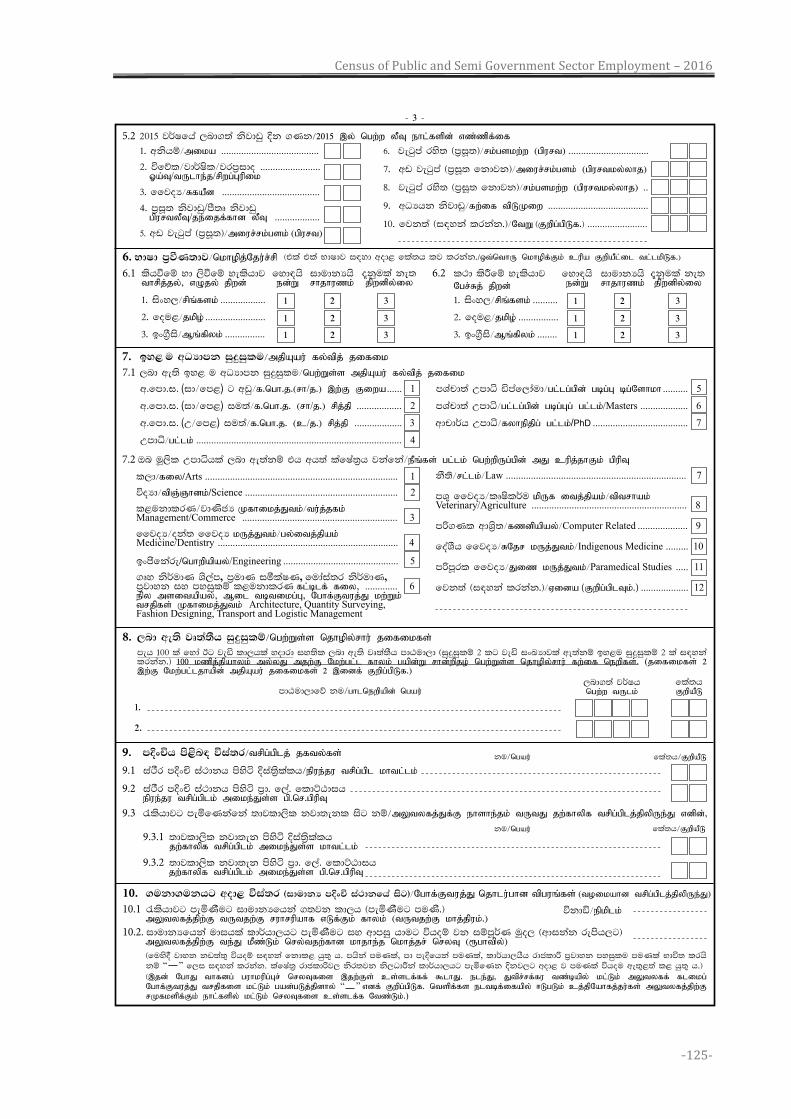
Census of Public and Semi Government Sector Employment – 2016
-125-
w.fmd.i. (id$fm<) g wvq$f.ngh.j.(rh/j.) ,w;F Fiwa ...... 1 mYapd;a Wmdê ämaf,daud$gl;lg;gpd; gbg;G bg;Nshkh .......... 5
w.fmd.i. (id$fm<) iu;a$f.ngh.j. (rh/j.) rpj;jp .................. 2 mYapd;a Wmdê$gl;lg;gpd; gbg;Gg; gl;lk;/Masters ................... 6w.fmd.i. (W$fm<) iu;a$f.ngh.j. (c/j.) rpj;jp ................... 3 wdpd¾h Wmdê$fyhepjpg; gl;lk;/PhD ...................................... 7Wmdê$gl;lk; .................................................................................. 4
7. by< u wOHdmk iqÿiqlu$mjpAau; fy;tpj; jifik
7.2 Tn uQ,sl Wmdêhla ,nd we;akï th wh;a lafIa;%h jkafka$ePq;fs; gl;lk; ngw;wpUg;gpd; mJ cupj;jhFk; gpupT
7.1 ,nd we;s by< u wOHdmk iqÿiqlu$ngw;Ws;s mjpAau; fy;tpj; jifik
8. ,nd we;s jD;a;Sh iqÿiqlï$ngw;Ws;s njhopy;rhu; jifikfs;
meh 100 la fyda Bg jeä ld,hla yodrd iy;sl ,nd we;s jD;a;Sh mdGud,d ^iqÿiqlï 2 lg jeä ixLHdjla we;akï by<u iqÿiqlï 2 la i|yka lrkak.& 100 kzpj;jpahyk; my;yJ mjw;F Nkw;gl;l fhyk; gapd;W rhd;wpjo; ngw;Ws;s njhopy;rhu; fw;if newpfs;. (jifikfs; 2 ,w;F Nkw;gl;ljhapd; mjpAau; jifikfs; 2 ,idf; Fwpg;gpLf.)
fla;h FwpaPL mdGud,dfõ ku$ghlnewpapd; ngau;
1'
2'
10.1 /lshdjg meñKSug idudkHfhka .;jk ld,h ^meñKSug muKs'& mYtyfj;jpw;F tUtjw;F ruhrupahf vLf;Fk; fhyk; (tUtjw;F khj;jpuk;.)
9. mÈxÑh ms<sn| úia;r$trpg;gplj; jfty;fs;
9.1 iaÒr mÈxÑ ia:dkh msysá Èia;%slalh$epue;ju trpg;gpl khtl;lk; 9.2 iaÒr mÈxÑ ia:dkh msysá m%d' f,a' fldÜGdih epue;ju trpg;gplk; mike;Js;s gp.nr.gpupT 9.3 /lshdjg meñfKkafka ;djld,sl kjd;ekl isg kï$mYtyfj;Jf;F ehshe;jk; tUtJ jw;fhypf trpg;gplj;jpypUe;J vdpd;>
9.3.1 ;djld,sl kjd;ek msysá Èia;%slalh jw;fhypf trpg;gplk; mike;Js;s khtl;lk;
9.3.2 ;djld,sl kjd;ek msysá m%d. f,a. fldÜGdih jw;fhypf trpg;gplk; mike;Js;s gp.nr.gpupT
,nd.;a j¾Ihngw;w tUlk;
fla;h$FwpaPLku$ngau;
ku$ngau; fla;h$FwpaPL
l,d$fiy/Arts ............................................................................. 1úoHd$tpQ;Qhdk;/Science ............................................................. 2l<ukdlrK$jdKscH Kfhikj;Jtk;$tu;j;jfk; Management/Commerce .............................................................. 3ffjoH$oka; ffjoH kUj;Jtk;$gy;itj;jpak; Medicine/Dentistry ........................................................................ 4bxcsfkare/nghwpapay;/Engineering .............................................. 5.Dy ks¾udK Ys,am, m%udK iólaIK, fudaia;r ks¾udK, m%jdyk iy myiqlï l<ukdlrK fl;blf; fiy> ............. 6epy msitapay;> Mil tbtikg;G> Nghf;Ftuj;J kw;Wk; trjpfs; Kfhikj;Jtk; Architecture, Quantity Surveying, Fashion Designing, Transport and Logistic Management
kS;s$rl;lk;$Law ........................................................................ 7mY= ffjoH$lDIsl¾u kpUf itj;jpak;$tptrhak; Veterinary/Agriculture .............................................................. 8mß.Kl wdY%s;$fzdpapay;$Computer Related .................... 9
foaYSh ffjoH$RNjr kUj;Jtk;$Indigenous Medicine ......... 10
mßmQrl ffjoH$Jiz kUj;Jtk;$Paramedical Studies ..... 11
fjk;a ^i|yka lrkak'&$Vida (Fwpg;gplTk;.) ................... 12
10.2. idudkHfhka udihla ld¾hd,hg meñKSug iy wdmiq hdug úhoï jk iïmQ¾K uqo, ^wdikak remsh,g& mYtyfj;jpw;F te;J kPz;Lk; nry;tjw;fhd khjhe;j nkhj;jr; nryT (&ghtpy;)
^tla tla NdIdj i|yd wod< fla;h lj lrkak'/xt;nthU nkhopf;Fk; cupa FwpaPl;il tl;lkpLf.)6. NdId m%ùK;dj$nkhopj;Nju;r;rp
lshùfï yd ,sùfï yelshdjthrpj;jy;> vOjy; jpwd;
1' isxy,$rpq;fsk; ..................
2' fou<$jkpo; ........................
3' bx.%Sis$Mq;fpyk; ................
fyd|hsed;W
1
1
1
±kqula ke;jpwdpy;iy
3
3
3
idudkHhsrhjhuzk;
2
2
2
l:d lsÍfï yelshdjNgr;Rj; jpwd;
6.1 6.2
5.2 2015 j¾Ifha ,nd.;a ksjdvq Èk .Kk$2015 ,y; ngw;w yPT ehl;fspd; vz;zpf;if
1' wkshï$mika .......................................2' úfõl$jd¾Isl$jrm%ido ........................ Xa;T/tUlhe;j/rpwg;Gupik
3' ffjoH$RfaPd .......................................4' m%iQ; ksjdvq/mS;D ksjdvq gpurtyPT/je;ijf;fhd yPT ..................5' wv jegqma ^m%iQ;&$miur;rk;gsk; (gpurt)
6' jegqma rys; ^m%iQ;&$rk;gskw;w (gpurt) ................................
7' wv jegqma ^m%iQ; fkdjk&$miur;rk;gsk; (gpurtky;yhj)
8' jegqma rys; ^m%iQ; fkdjk&$rk;gskw;w (gpurtky;yhj) ..
9' wOHhk ksjdvq$fw;if tpLKiw ........................................
10' fjk;a ^i|yka lrkak'&$NtW ^Fwpg;gpLf.& ........................
^fuys§ jdyk kv;a;= úhoï i|yka fkdl< hq;= h. mhska muKla, md meÈfhka muKla, ld¾hd,hSh rdcldß m%jdyk myiqlu muKla Ndú; lrhs kï “ ” f,i i|yka lrkak. lafIa;% rdcldßj, ksr;jk ks,OdÍka ld¾hd,hg meñfKk Èkj,g wod< j muKla úhou we;=<;a l< hq;= h.& ^,jd; NghJ thfdg; guhkupg;Gr; nryTfis ,jw;Fs; cs;slf;ff; $lhJ. ele;J> Jtpr;rf;fu tz;bapy; kl;Lk; mYtyff; flikg; Nghf;Ftuj;J trjpfis kl;Lk; gad;gLj;jpdhy; “ ” vdf; Fwpg;gpLf. ntspf;fs eltbf;ifapy; <LgLk; cj;jpNahfj;ju;fs; mYtyfj;jpw;F rKfkspf;Fk; ehl;fspy; kl;Lk; nryTfis cs;slf;f Ntz;Lk;.)
10. .ukd.ukhg wod< úia;r ^idudkH mÈxÑ ia:dkfha isg&$Nghf;Ftuj;J njhlu;ghd tpguq;fs; (toikahd trpg;gplj;jpypUe;J)
úkdä$epkplk;
- 3 -
1' isxy,$rpq;fsk; ..........
2' fou<$jkpo; ................
3' bx.%Sis$Mq;fpyk; ........
fyd|hsed;W
1
1
1
±kqula ke;jpwdpy;iy
3
3
3
idudkHhsrhjhuzk;
2
2
2
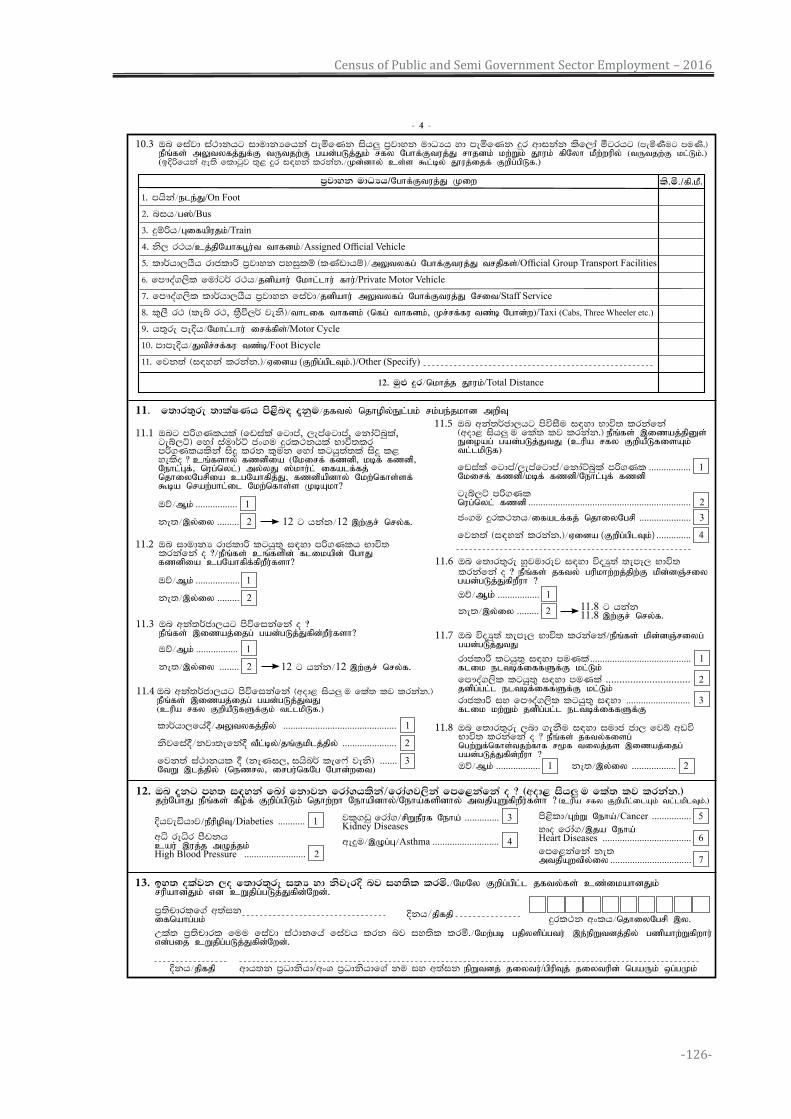
Census of Public and Semi Government Sector Employment – 2016
-126-
10.3 Tn fiajd ia:dkhg idudkHfhka meñfKk ish¨ m%jdyk udOHh yd meñfKk ÿr wdikak lsf,da ógrhg ^meñKSug muKs'& ePq;fs; mYtyfj;Jf;F tUtjw;F gad;gLj;Jk; rfy Nghf;Ftuj;J rhjdk; kw;Wk; J}uk; fpNyh kPw;wupy; (tUtjw;F kl;Lk;.) (bÈßfhka we;s fldgqj ;=< ÿr i|yka lrkak'$Kd;dhy; cs;s $l;by; J}uj;ijf; Fwpg;gpLf.)
Èkh$jpfjp wdh;k m%Odkshd/wxY m%Odkshdf.a ku iy w;aik epWtdj; jiytu;/gpupTj; jiytupd; ngaUk; xg;gKk;
1' mhska$ele;J/On Foot
2' nih$g];/Bus
3' ÿïßh$Gifapujk;/Train
4' ks, r:h/cj;jpNahfg+u;t thfdk;$Assigned Official Vehicle
5' ld¾hd,hSh rdcldß m%jdyk myiqlï ^lKavdhï&$mYtyfg; Nghf;Ftuj;J trjpfs;/Official Group Transport Facilities
6' fm!oa.,sl fudag¾ r:h$jdpahu; Nkhl;lhu; fhu;/Private Motor Vehicle 7' fm!oa.,sl ld¾hd,hSh m%jdyk fiajd$jdpahu; mYtyfg; Nghf;Ftuj;J Nrit/Staff Service 8' l=,S r: ^leí r:, ;%Sù,¾ jeks&$thlif thfdk; (nfg; thfdk;> Kr;rf;fu tz;b Nghd;w)/Taxi (Cabs, Three Wheeler etc.)
9' h;=re meÈh$Nkhl;lhu; irf;fps;/Motor Cycle
10' mdmeÈh$Jtpr;rf;fu tz;b/Foot Bicycle
11' fjk;a ^i|yka lrkak'&$Vida (Fwpg;gplTk;.)/Other (Specify)
12' uq¿ ÿr$nkhj;j J}uk;/Total Distance
ls.ó./fp.kP.m%jdyk udOHh/Nghf;Ftuj;J Kiw
11. f;dr;=re ;dlaIKh ms<sn| ±kqu$jfty; njhopy;El;gk; rk;ge;jkhd mwpT
11.1 Tng mß.Klhla ^fviala fgdma, ,emafgdma, fkdaÜnqla, geí,Ü& fyda iaud¾Ü cx.u ÿrl:khla Ndú;lr mß.Klhlskaa isÿ lrk l=uk fyda lghq;a;la isÿ l< yelso @ cq;fshy; fzdpia (Nkirf; fzdp> kbf; fzdp> Nehl;Gf;> nug;nyl;) my;yJ ];khu;l; ifalf;fj; njhiyNgrpia cgNahfpj;J> fzdpapdhy; Nkw;nfhs;sf; $ba nraw;ghl;il Nkw;nfhs;s KbAkh?
Tõ$Mk; ................. 1ke;$,y;iy ......... 2
11.2 Tn idudkH rdcldß lghq;= i|yd mß.Klh Ndú; lrkafka o @$ePq;fs; cq;fspd; flikapd; NghJ fzdpia cgNahfpf;fpwPu;fsh?
Tõ$Mk; .................. 1
ke;$,y;iy ......... 2
11.4 Tn wka;¾cd,hg msúfikafka ^wod< ish¨ u fla; lj lrkak'& ePq;fs; ,izaj;ijg; gad;gLj;JtJ (cupa rfy FwpaPLfSf;Fk; tl;lkpLf.)
ld¾hd,fha§$mYtyfj;jpy; .............................................. 1
ksjfia§$kjd;efka§ tPl;by;/jq;Fkplj;jpy; ...................... 2fjk;a ia:dkhl § ^keKi,, ihsn¾ lef*a jeks& ....... 3NtW ,lj;jpy; (nezry> irgu;nfNg Nghd;wit)
11.6 Tn f;dr;=re yqjudrej i|yd úoHq;a ;emE, Ndú; lrkafka o @ ePq;fs; jfty; gupkhw;wj;jpw;F kpd;dQ;riy gad;gLj;JfpwPuh ?
11.8 g hkak 11.8 ,w;Fr; nry;f.
Tõ$Mk; ................. 1ke;$,y;iy ......... 2
11.7 Tn úoHq;a ;emE, Ndú; lrkafka$ePq;fs; kpd;dQ;riyg; gad;gLj;JtJ
rdcldß lghq;= i|yd muKla ......................................... 1flik eltbf;iffSf;F kl;Lk; fm!oa.,sl lghq;= i|yd muKla ............................... 2jdpg;gl;l eltbf;iffSf;F kl;Lk; rdcldß iy fm!oa.,sl lghq;= i|yd .......................... 3flik kw;Wk; jdpg;gl;l eltbf;iffSf;F
12 g hkak$12 ,w;Fr; nry;f.
11.3 Tn wka;¾cd,hg msúfikafka o @ ePq;fs; ,izaj;ijg; gad;gLj;Jfpd;wPu;fsh?
Tõ$Mk; ................. 1ke;$,y;iy ........ 2 12 g hkak$12 ,w;Fr; nry;f.
11.5 Tn wka;¾cd,hg msúiSu i|yd Ndú; lrkafka ^wod< ish¨ u fla; lj lrkak'& ePq;fs; ,izaj;jpDs; Eioag; gad;gLj;JtJ (cupa rfy FwpaPLfisAk; tl;lkpLf)
fviala fgdma/,emafgdma$fkdaÜnqla mß.Kl ................. 1Nkirf; fzdp/kbf; fzdp/Nehl;Gf; fzdp
geí,Ü mß.Kl nug;nyl; fzdp .................................................................. 2cx.u ÿrl:kh$ifalf;fj; njhiyNgrp ..................... 3fjk;a ^i|yka lrkak'&$Vida (Fwpg;gplTk;) .............. 4
11.8 Tn f;dr;=re ,nd .ekSu i|yd iudc cd, fjí wvú Ndú; lrkafka o @ ePq;fs; jfty;fisg; ngw;Wf;nfhs;tjw;fhf r%f tiyj;js ,izaj;ijg; gad;gLj;Jfpd;wPuh ?
Tõ$Mk; .................. 1 ke;$,y;iy .................. 2
12. Tn ±kg my; i|yka fnda fkdjk frda.hlska$frda.j,ska fmf<kafka o @ ^wod< ish¨ u fla; lj lrkak'& jw;NghJ ePq;fs; fPo;f; Fwpg;gpLk; njhw;wh Nehapdhy;/Neha;fspdhy; mtjpAWfpwPu;fsh ? ^cupa rfy FwpaPl;ilAk; tl;lkplTk;.&
Èhjeähdj$ePupopT$Diabeties ........... 1wê reêr mSvkhcau; ,uj;j mOj;jk;High Blood Pressure ......................... 2
jl=.vq frda.$rpWePuf Neha; .............. 3Kidney Diseasesweÿu$,Og;G$Asthma ........................... 4
ms<sld$Gw;W Neha;$Cancer ................ 5yDo frda.$,ja Neha;Heart Diseases .................................... 6fmf<kafka ke;mtjpAwtpy;iy ................................. 7
- 4 -
13. by; olajk ,o f;dr;=re i;H yd ksjerÈ nj iy;sl lrñ'$NkNy Fwpg;gpl;l jfty;fs; cz;ikahdJk; rupahdJk; vd cWjpg;gLj;Jfpd;Nwd;.
m%;spdrlf.a w;aikifnahg;gk; ÿrl:k wxlh$njhiyNgrp ,y.Wla; m%;spdrl fuu fiajd ia:dkfha fiajh lrk nj iy;sl lrñ'$Nkw;gb gjpyspg;gtu; ,e;epWtdj;jpy; gzpahw;Wfpwhu; vd;gij cWjpg;gLj;Jfpd;Nwd;.
Èkh$jpfjp
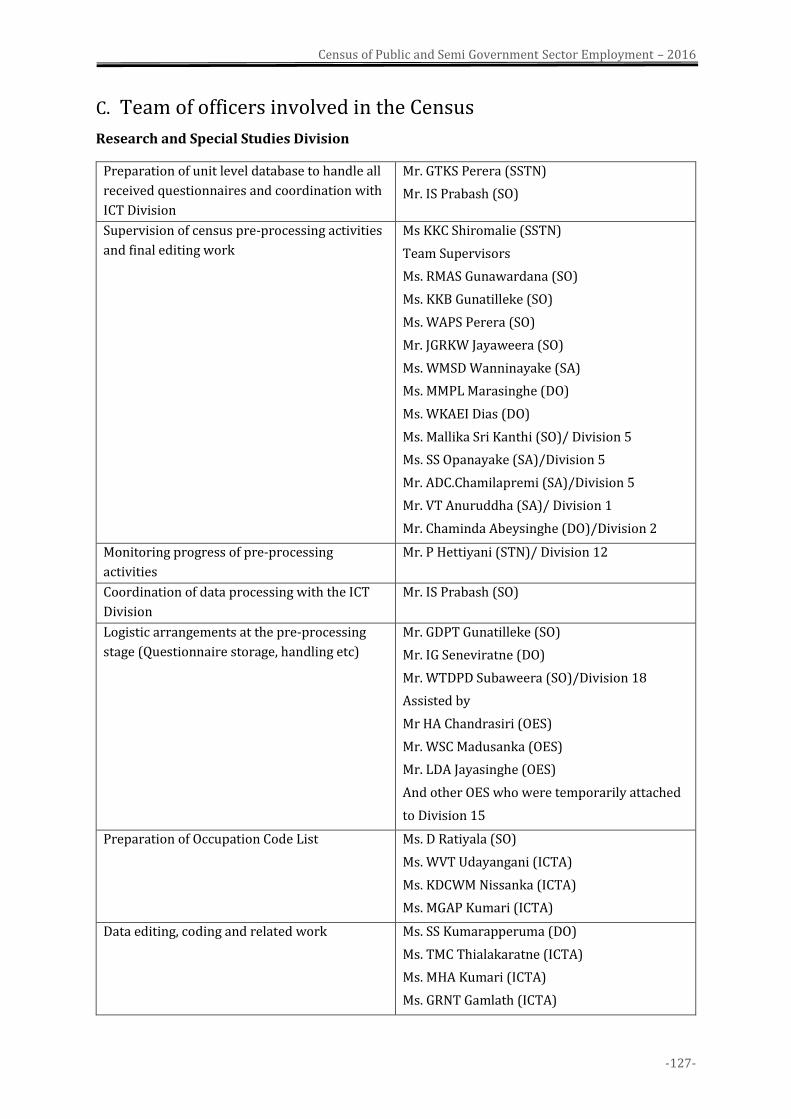
Census of Public and Semi Government Sector Employment – 2016
-127-
C. Team of officers involved in the Census
Research and Special Studies Division
Preparation of unit level database to handle all
received questionnaires and coordination with
ICT Division
Mr. GTKS Perera (SSTN)
Mr. IS Prabash (SO)
Supervision of census pre-processing activities
and final editing work
Ms KKC Shiromalie (SSTN)
Team Supervisors
Ms. RMAS Gunawardana (SO)
Ms. KKB Gunatilleke (SO)
Ms. WAPS Perera (SO)
Mr. JGRKW Jayaweera (SO)
Ms. WMSD Wanninayake (SA)
Ms. MMPL Marasinghe (DO)
Ms. WKAEI Dias (DO)
Ms. Mallika Sri Kanthi (SO)/ Division 5
Ms. SS Opanayake (SA)/Division 5
Mr. ADC.Chamilapremi (SA)/Division 5
Mr. VT Anuruddha (SA)/ Division 1
Mr. Chaminda Abeysinghe (DO)/Division 2
Monitoring progress of pre-processing
activities
Mr. P Hettiyani (STN)/ Division 12
Coordination of data processing with the ICT
Division
Mr. IS Prabash (SO)
Logistic arrangements at the pre-processing
stage (Questionnaire storage, handling etc)
Mr. GDPT Gunatilleke (SO)
Mr. IG Seneviratne (DO)
Mr. WTDPD Subaweera (SO)/Division 18
Assisted by
Mr HA Chandrasiri (OES)
Mr. WSC Madusanka (OES)
Mr. LDA Jayasinghe (OES)
And other OES who were temporarily attached
to Division 15
Preparation of Occupation Code List Ms. D Ratiyala (SO)
Ms. WVT Udayangani (ICTA)
Ms. KDCWM Nissanka (ICTA)
Ms. MGAP Kumari (ICTA)
Data editing, coding and related work Ms. SS Kumarapperuma (DO)
Ms. TMC Thialakaratne (ICTA)
Ms. MHA Kumari (ICTA)
Ms. GRNT Gamlath (ICTA)
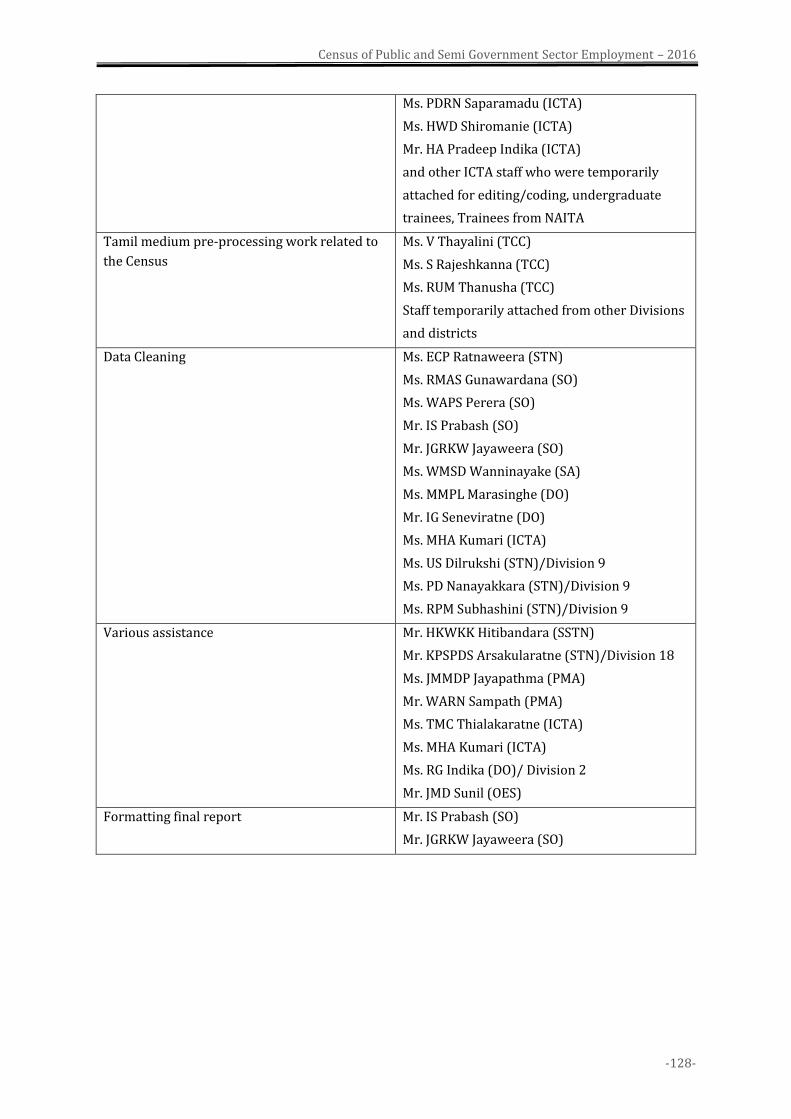
Census of Public and Semi Government Sector Employment – 2016
-128-
Ms. PDRN Saparamadu (ICTA)
Ms. HWD Shiromanie (ICTA)
Mr. HA Pradeep Indika (ICTA)
and other ICTA staff who were temporarily
attached for editing/coding, undergraduate
trainees, Trainees from NAITA
Tamil medium pre-processing work related to
the Census
Ms. V Thayalini (TCC)
Ms. S Rajeshkanna (TCC)
Ms. RUM Thanusha (TCC)
Staff temporarily attached from other Divisions
and districts
Data Cleaning Ms. ECP Ratnaweera (STN)
Ms. RMAS Gunawardana (SO)
Ms. WAPS Perera (SO)
Mr. IS Prabash (SO)
Mr. JGRKW Jayaweera (SO)
Ms. WMSD Wanninayake (SA)
Ms. MMPL Marasinghe (DO)
Mr. IG Seneviratne (DO)
Ms. MHA Kumari (ICTA)
Ms. US Dilrukshi (STN)/Division 9
Ms. PD Nanayakkara (STN)/Division 9
Ms. RPM Subhashini (STN)/Division 9
Various assistance Mr. HKWKK Hitibandara (SSTN)
Mr. KPSPDS Arsakularatne (STN)/Division 18
Ms. JMMDP Jayapathma (PMA)
Mr. WARN Sampath (PMA)
Ms. TMC Thialakaratne (ICTA)
Ms. MHA Kumari (ICTA)
Ms. RG Indika (DO)/ Division 2
Mr. JMD Sunil (OES)
Formatting final report Mr. IS Prabash (SO)
Mr. JGRKW Jayaweera (SO)
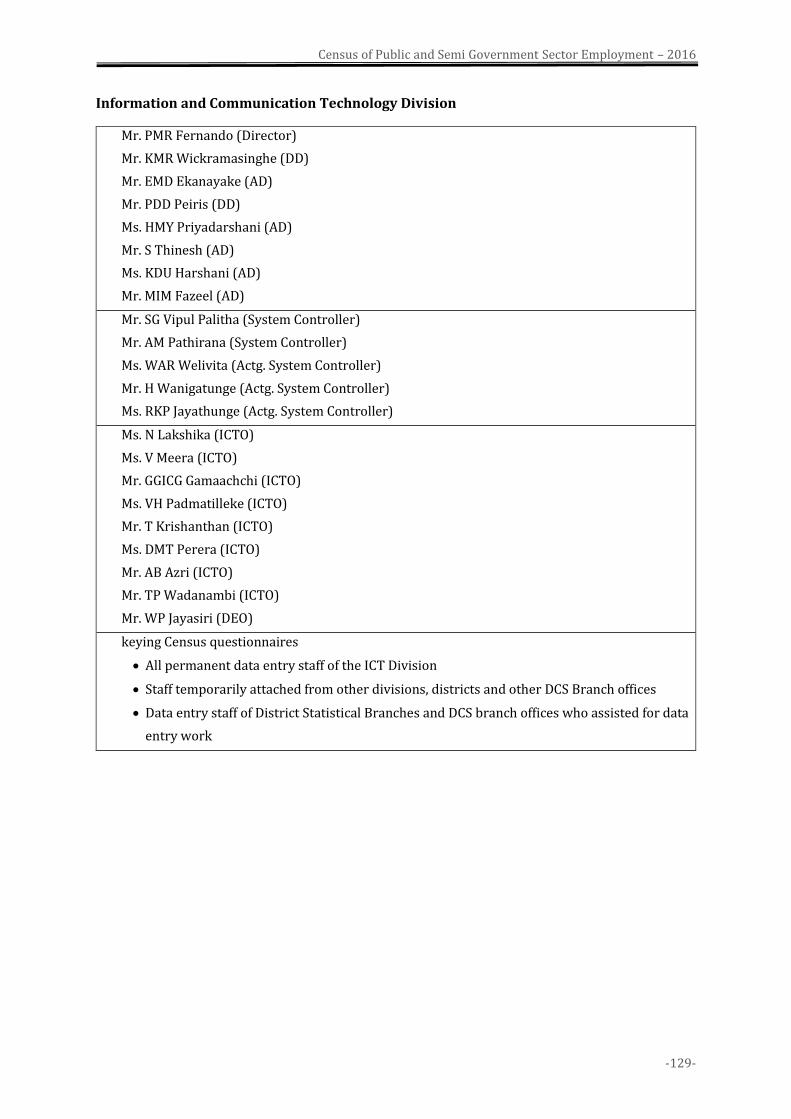
Census of Public and Semi Government Sector Employment – 2016
-129-
Information and Communication Technology Division
Mr. PMR Fernando (Director)
Mr. KMR Wickramasinghe (DD)
Mr. EMD Ekanayake (AD)
Mr. PDD Peiris (DD)
Ms. HMY Priyadarshani (AD)
Mr. S Thinesh (AD)
Ms. KDU Harshani (AD)
Mr. MIM Fazeel (AD)
Mr. SG Vipul Palitha (System Controller)
Mr. AM Pathirana (System Controller)
Ms. WAR Welivita (Actg. System Controller)
Mr. H Wanigatunge (Actg. System Controller)
Ms. RKP Jayathunge (Actg. System Controller)
Ms. N Lakshika (ICTO)
Ms. V Meera (ICTO)
Mr. GGICG Gamaachchi (ICTO)
Ms. VH Padmatilleke (ICTO)
Mr. T Krishanthan (ICTO)
Ms. DMT Perera (ICTO)
Mr. AB Azri (ICTO)
Mr. TP Wadanambi (ICTO)
Mr. WP Jayasiri (DEO)
keying Census questionnaires
All permanent data entry staff of the ICT Division
Staff temporarily attached from other divisions, districts and other DCS Branch offices
Data entry staff of District Statistical Branches and DCS branch offices who assisted for data
entry work
Department of Census and Statistics No. 306/71, Poldoowa Road
Battaramulla. Tel : +94 11.2147479 Fax : +94 11 2147474
Email : [email protected] Web : www.statistics.gov.lk
ISBN 978-955-702-103-4

Census of Public andSemi Government SectorEmployment - 2016
Department of Census and StatisticsMinistry of National Policies and Economic Affairs
Final Report
Printed by : Printing Division - Department of Census & Statistics