Cement Slury
6
C ha ra c te rizi ng C uri ng -C e m e nt Slurrie s b y Pe rm e a b ili ty , Te nsile S tre ng th, a nd Shrinka g e K.R. Backe, O.B. Lile, SPE, S.K. Lyomov, SPE, Harald Elvebakk,* a nd P a ˚ l Skalle, S PE , Norweg ian U. o f S c ience a nd T ec hnolog y Summary This work was carried out to obtain more knowledge about the transition period of curing oilwell cements. The results show that the curing characteristics are a function of temperature and that there is a correlation between shrinkage and cement content. The paper also introduce s a new mechani sm for gas migratio n and discusses how the studied parameters can be used to predict gas migration. Introduction The setting process of cement slurries in oil wells is very com- plex. Many parameters contribute to the final result, such as gel- ling, shrinkage, temperature, pressure, filter loss, cement structure and strength buildup, slurry permeability, entry pressure, capillary pressure, mud and mud cake, formation properties, well history, and possibly other parameters as well. Some of these parameters are next to impossible to characterize. Others are simple to mea- sure in a laboratory setup, but may not reflect downhole condi- tions. The cement sett ing proce ss has been investig ated exten- sively, but there are still many factors not fully understood. We have tried to exte nd the knowledge by monit oring tempera ture evolution, hydrostatic pressure, permeability, tensile strength, and total chemical shrinkage during hydration. We will in turn discuss the importance of these parameters. Cement hydration is an exothermic reaction which can be ob- served as a temperature increase. Temperature is easy to measure, and the shape and peak of the temperature curve give valuable informatio n on the hydration process , i.e. , hydrat ion onset and rate. The hydrostatic pressure is important as gas flow into the cement will be initiated when the pressure of the cement column falls below that of a gas bearing formation. 1-3 This pressure drop is due to cement shrinkage at the same time as the shear strength develops, enabling the cement to hang onto the wellbore and cas- ing. But what mechanism will govern inflow of gas when the ce- ment pressu re has droppe d far enough? We think the capilla ry entry pressure of the cement pore structure is important. When exposing gas to the water-saturated cement, the nonwetting gas phase has to overcome the entry pressure of the cement pore sys- tem due to the interfacial tension between cement pore fluid and gas. The entry pressure is high when the pores are small while the permeability on the other hand is low, and entry pressure is, in general, inversely proportional to permeability. After having over- come the entry pressure, the relative permeability and the differ- ential pressure between the formation gas and the cement column control how much cement pore water will be displaced by gas. This is a complicated process where the permeability and pressure change continuously. Considering how important the permeability is for governing flow into and through the cement pores, surprisingly little work has been carried out on permeability during setting. Sutton and Ravi 4 state that low fluid loss slurries exhibit a permeability of less than 100 md at a static gel strength of 200 lb/100 ft 2 and that it approaches 5 md at 500 lb/100 ft 2 . Plee et al. 5 have studied the perme abili ty of bento nite–cement slurri es and found a typic al value of 50 to 100 md for fresh slurries and that decreasing per- meab ilit y corre late s line arly with incr easi ng surfac e area. Only Appleby and Wilson 6 have monitored the permeability at several points of time up till and past final set. Their results show an initial permeability about 1 darcy falling down to around 1 md at the temperature peak. When the cement slurry is in the process of losing its hydraulic liquid properties, the strength of the cement matrix is still low. The pressure difference between the formation gas and the hydro- static pressure of the cement slurry may overcome the strength of the matrix. In this situation it is the compressional strength of a confined cement which is of importance and this strength param- eter is the highest one. Therefore, we think that it is not very probable that gas will break the matrix from outside and migrate through the created microfractures. However, if gas has entered the cement through its pores, it is the tensile strength of the ce- ment which has to be overcome in order to break the cement matrix. The tensile strength is the lowest strength parameter, and we believe that this is a likely mechanism of fracturing the ce- ment, leading to gas migration. We, therefore, propose a new mechanism for initiating gas mi- gration. After the gas has entered the pore system of the cement, the gas inside may overcome the tensile strength of the cement structure, break the cement matrix, and migrate through the mi- crofractures. Durin g the hydration process all the studied param- eters change continuously. The hydrostatic pressure inside the ce- ment slurry column drops and the gas bubbles already inside the cement will, therefore, try to expand. The decreasing pore radii of the cement matrix stop this expansion and the bubbles may main- tain their pressure while the ceme nt press ure will continue to de- crease. This leads to a pressure difference which may be large enough to overcome the tensile strength of the cement structure and thus creating fractures. The hydrostatic pressure drop of the cement column is mainly govern ed by the chemical shrin kage of the cement. Before initia l set, a low shrinkage rate is preferable because the resulting hydro- sta ti c pre ssure dec li ne will be slower than for a slu rry with a higher shrinkage rate. Slow shrinkage has two advantages: pres- sure equilibrium between formation and slurry column is reached at a la ter poi nt of time and aft erwards the pressure dif fer enc e between formation and slurry, the driving force behind flow of por e flui d int o the cement, will be lower. Both fac tors sho uld reduce the risk of early time gas migration. After initial set, how- *Now with the Geological Survey of Norway. Copyright © 1999 Society of Petroleum Engineers This paper (SPE 57712) was revised for publication from paper SPE 38267, first presented at the 1997 SPE Western Regional Meeting held in Long Beach, California, 25 –27 June. Orig inal manuscri pt recei ved for revie w 25 June 1997. Revised manuscrip t recei ved 13 May 1999. Paper peer approved 21 June 1999. 16 2 S PE Dr il l. & Comp leti on 14 3, September 1999 1064-6671/99/14 3 /162/6/$3.500.15
-
Upload
ary-rachman -
Category
Documents
-
view
219 -
download
0
Transcript of Cement Slury

8/7/2019 Cement Slury
http://slidepdf.com/reader/full/cement-slury 1/6
Cha ra c te rizing Curing -Cem ent Slurriesb y Perm ea b ility, Tensile Streng th,
a nd Shrinka g eK.R. Backe, O.B. Lile, SPE, S.K. Lyomov, SPE, Harald Elvebakk,* a nd Pa l Skalle, SPE, Norweg ian U. o f Sc ience a nd
Tec hnolog y
SummaryThis work was carried out to obtain more knowledge about the
transition period of curing oilwell cements. The results show that
the curing characteristics are a function of temperature and that
there is a correlation between shrinkage and cement content. The
paper also introduces a new mechanism for gas migration and
discusses how the studied parameters can be used to predict gas
migration.
Introduction
The setting process of cement slurries in oil wells is very com-
plex. Many parameters contribute to the final result, such as gel-ling, shrinkage, temperature, pressure, filter loss, cement structure
and strength buildup, slurry permeability, entry pressure, capillary
pressure, mud and mud cake, formation properties, well history,
and possibly other parameters as well. Some of these parameters
are next to impossible to characterize. Others are simple to mea-
sure in a laboratory setup, but may not reflect downhole condi-
tions. The cement setting process has been investigated exten-
sively, but there are still many factors not fully understood. We
have tried to extend the knowledge by monitoring temperature
evolution, hydrostatic pressure, permeability, tensile strength, and
total chemical shrinkage during hydration. We will in turn discuss
the importance of these parameters.
Cement hydration is an exothermic reaction which can be ob-
served as a temperature increase. Temperature is easy to measure,and the shape and peak of the temperature curve give valuable
information on the hydration process, i.e., hydration onset and
rate. The hydrostatic pressure is important as gas flow into the
cement will be initiated when the pressure of the cement column
falls below that of a gas bearing formation.1-3 This pressure drop
is due to cement shrinkage at the same time as the shear strength
develops, enabling the cement to hang onto the wellbore and cas-
ing.
But what mechanism will govern inflow of gas when the ce-
ment pressure has dropped far enough? We think the capillary
entry pressure of the cement pore structure is important. When
exposing gas to the water-saturated cement, the nonwetting gas
phase has to overcome the entry pressure of the cement pore sys-
tem due to the interfacial tension between cement pore fluid andgas. The entry pressure is high when the pores are small while the
permeability on the other hand is low, and entry pressure is, in
general, inversely proportional to permeability. After having over-
come the entry pressure, the relative permeability and the differ-
ential pressure between the formation gas and the cement column
control how much cement pore water will be displaced by gas.This is a complicated process where the permeability and pressure
change continuously.
Considering how important the permeability is for governing
flow into and through the cement pores, surprisingly little work
has been carried out on permeability during setting. Sutton and
Ravi4 state that low fluid loss slurries exhibit a permeability of
less than 100 md at a static gel strength of 200 lb/100 ft 2 and that
it approaches 5 md at 500 lb/100 ft2. Plee et al.5 have studied the
permeability of bentonite–cement slurries and found a typical
value of 50 to 100 md for fresh slurries and that decreasing per-
meability correlates linearly with increasing surface area. Only
Appleby and Wilson6 have monitored the permeability at several
points of time up till and past final set. Their results show an
initial permeability about 1 darcy falling down to around 1 md atthe temperature peak.
When the cement slurry is in the process of losing its hydraulic
liquid properties, the strength of the cement matrix is still low.
The pressure difference between the formation gas and the hydro-
static pressure of the cement slurry may overcome the strength of
the matrix. In this situation it is the compressional strength of a
confined cement which is of importance and this strength param-
eter is the highest one. Therefore, we think that it is not very
probable that gas will break the matrix from outside and migrate
through the created microfractures. However, if gas has entered
the cement through its pores, it is the tensile strength of the ce-
ment which has to be overcome in order to break the cement
matrix. The tensile strength is the lowest strength parameter, andwe believe that this is a likely mechanism of fracturing the ce-
ment, leading to gas migration.
We, therefore, propose a new mechanism for initiating gas mi-
gration. After the gas has entered the pore system of the cement,
the gas inside may overcome the tensile strength of the cement
structure, break the cement matrix, and migrate through the mi-
crofractures. During the hydration process all the studied param-
eters change continuously. The hydrostatic pressure inside the ce-
ment slurry column drops and the gas bubbles already inside the
cement will, therefore, try to expand. The decreasing pore radii of
the cement matrix stop this expansion and the bubbles may main-
tain their pressure while the cement pressure will continue to de-
crease. This leads to a pressure difference which may be large
enough to overcome the tensile strength of the cement structure
and thus creating fractures.
The hydrostatic pressure drop of the cement column is mainly
governed by the chemical shrinkage of the cement. Before initial
set, a low shrinkage rate is preferable because the resulting hydro-
static pressure decline will be slower than for a slurry with a
higher shrinkage rate. Slow shrinkage has two advantages: pres-
sure equilibrium between formation and slurry column is reached
at a later point of time and afterwards the pressure difference
between formation and slurry, the driving force behind flow of
pore fluid into the cement, will be lower. Both factors should
reduce the risk of early time gas migration. After initial set, how-
*Now with the Geological Survey of Norway.
Copyright © 1999 Society of Petroleum Engineers
This paper (SPE 57712) was revised for publication from paper SPE 38267, first presentedat the 1997 SPE Western Regional Meeting held in Long Beach, California, 25 –27 June.Original manuscript received for review 25 June 1997. Revised manuscript received 13May 1999. Paper peer approved 21 June 1999.
162 SPE Drill. & Completion 14 3, September 1999 1064-6671/99/143 /162/6/$3.50
0.15
8/7/2019 Cement Slury
http://slidepdf.com/reader/full/cement-slury 2/6
ever, when high shrinkage and pressure loss are inevitable, a short
transition time will reduce the time during which gas migration
can be initiated.The chemical shrinkage may be divided in two parts, external
and internal. The external shrinkage is the bulk or external dimen-
sional volume change of the slurry leading to a possible microan-
nulus between the cement and the wellbore. The internal chemical
shrinkage is caused by formation of contraction pores which con-
tribute to the connectivity between pores in a set cement, and
hence, to permeability. The total chemical shrinkage is the sum of
the external and internal shrinkage.
Chemical shrinkage of oilwell cements has been investigated
by several researchers. The most extensive tests have been carried
out by Chenevert and Shrestha,7 and by Sabins and Sutton,8 but
other papers have also been presented.9-11 The applied tempera-
tures and pressures range from ambient conditions9 up to 224 °C
and 121 MPa.7
Both total8-11
and external chemical shrinkage7-9
were reported with a total shrinkage at 20 or 24 hours varying
from 0.6 to 6 vol%, while most results were in the range of 1.5 to
3 vol%. Only Sabins and Sutton8 have performed measurements
of external shrinkage under realistic downhole conditions. Ac-
cording to them, most of this shrinkage occurs when the slurry
still is plastic. Their results showed an average of 0.15 vol% and
from this they calculated the contraction pores to account for 97.5
to 99% of the total shrinkage. Thus, from a gas migration point of
view, the formation of contraction pores is by far the largest and
most important part of the chemical shrinkage.
Experimental Setup and Procedure
Permeability and Tensile Strength. The permeability and the
tensile strength of a cement slurry were measured in the same cellwhere measurements can be done at temperatures up to 200 °C
and at pressures up to 20 bars. In addition, the temperature evo-
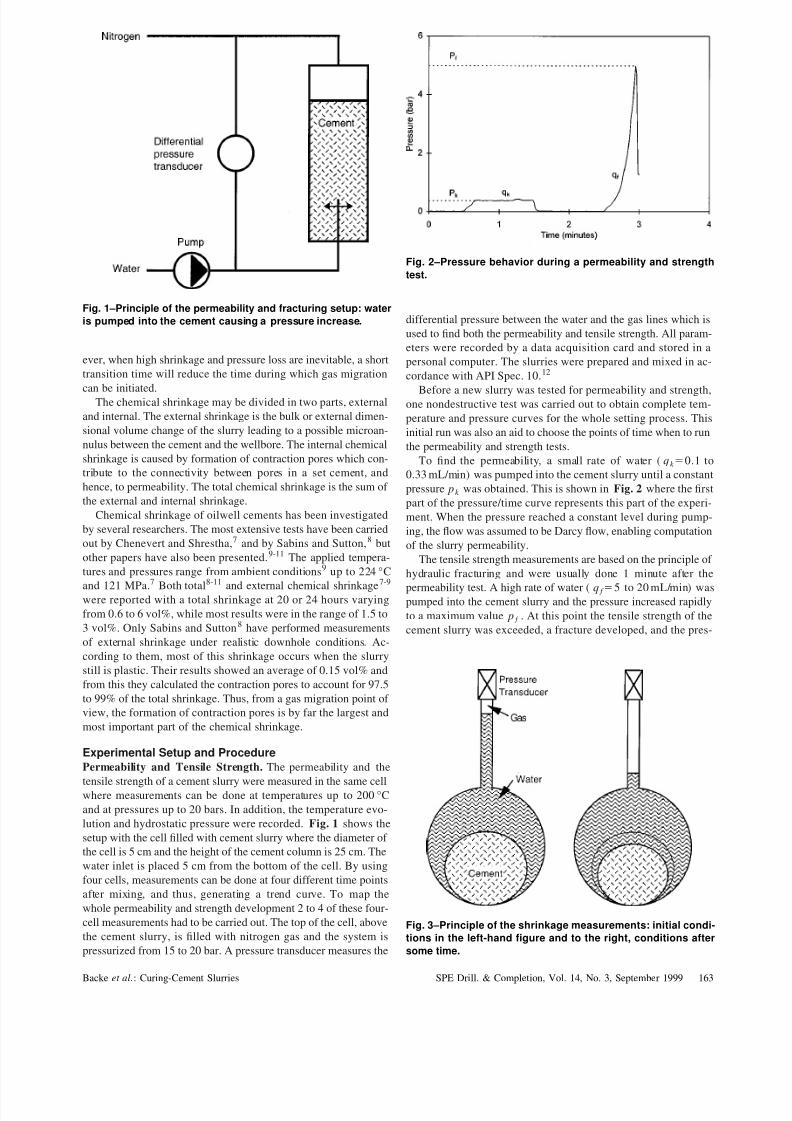
lution and hydrostatic pressure were recorded. Fig. 1 shows the
setup with the cell filled with cement slurry where the diameter of
the cell is 5 cm and the height of the cement column is 25 cm. The
water inlet is placed 5 cm from the bottom of the cell. By using
four cells, measurements can be done at four different time points
after mixing, and thus, generating a trend curve. To map the
whole permeability and strength development 2 to 4 of these four-
cell measurements had to be carried out. The top of the cell, above
the cement slurry, is filled with nitrogen gas and the system is
pressurized from 15 to 20 bar. A pressure transducer measures the
differential pressure between the water and the gas lines which is
used to find both the permeability and tensile strength. All param-
eters were recorded by a data acquisition card and stored in a
personal computer. The slurries were prepared and mixed in ac-
cordance with API Spec. 10.12
Before a new slurry was tested for permeability and strength,one nondestructive test was carried out to obtain complete tem-
perature and pressure curves for the whole setting process. This
initial run was also an aid to choose the points of time when to run
the permeability and strength tests.
To find the permeability, a small rate of water (q k 0.1 to
0.33 mL/min) was pumped into the cement slurry until a constant
pressure p k was obtained. This is shown in Fig. 2 where the first
part of the pressure/time curve represents this part of the experi-
ment. When the pressure reached a constant level during pump-
ing, the flow was assumed to be Darcy flow, enabling computation
of the slurry permeability.
The tensile strength measurements are based on the principle of
hydraulic fracturing and were usually done 1 minute after the
permeability test. A high rate of water ( q f 5 to 20 mL/min) waspumped into the cement slurry and the pressure increased rapidly
to a maximum value p f . At this point the tensile strength of the
cement slurry was exceeded, a fracture developed, and the pres-
Fig. 1–Principle of the permeability and fracturing setup: water
is pumped into the cement causing a pressure increase.
Fig. 2–Pressure behavior during a permeability and strength
test.
Fig. 3–Principle of the shrinkage measurements: initial condi-
tions in the left-hand figure and to the right, conditions after
some time.
Backe et al.: Curing-Cement Slurries SPE Drill. & Completion, Vol. 14, No. 3, September 1999 163
8/7/2019 Cement Slury
http://slidepdf.com/reader/full/cement-slury 3/6
sure dropped instantly. In Fig. 2 the second peak of the pressure/
time curve represents the fracturing pressure. After the test, a
horizontal fracture at the level of the water inlet could be observedin the cement and the maximum strength that can be measured
with the apparatus is 5 bar. At this strength the cement has
reached final set and is quite hard for comparison, sandstones
have a tensile strength of 40 to 150 bar.
Shrinkage. For the shrinkage measurements a second cell was
made. The measurements were based on the pressure/volume re-
lationship of a gas. The principle is shown in Fig. 3, indicating
initial conditions in the left-hand figure. At a later stage, shown in
the right of Fig. 3, the shrinkage process leads to a lower gas
pressure. When the initial temperature, pressure, and volumes are
known, the shrinkage can be calculated on the basis of the con-
tinuously declining pressure during the test. The calculation is
also corrected for gas temperature. Total shrinkage was measuredby placing the cement in a slightly permeable paper cup contain-
ing around 50 mL of slurry. All samples were weighed before and
after each test, and the volume of the hardened sample was found
by applying Archimedes’ principle. The applied pressure was in
the range of 6 to 16 bar, which was measured with an accuracy of
0.15%. All parameters were recorded by a data logger and
stored in a personal computer.
The method works well but has some drawbacks. It requires
precision in the initial values and it is sensitive to temperature
changes. The shrinkage calculations are taken from the point of
maximum pressure or when the test temperature stabilizes because
we were unable to quantify the water expansion that occurs before
this point of time. This has the advantage that any shrinkage oc-
curring before placement of the cement in a well will not be taken
into account, even though some initial shrinkage may not be re-corded.
Results and Discussion
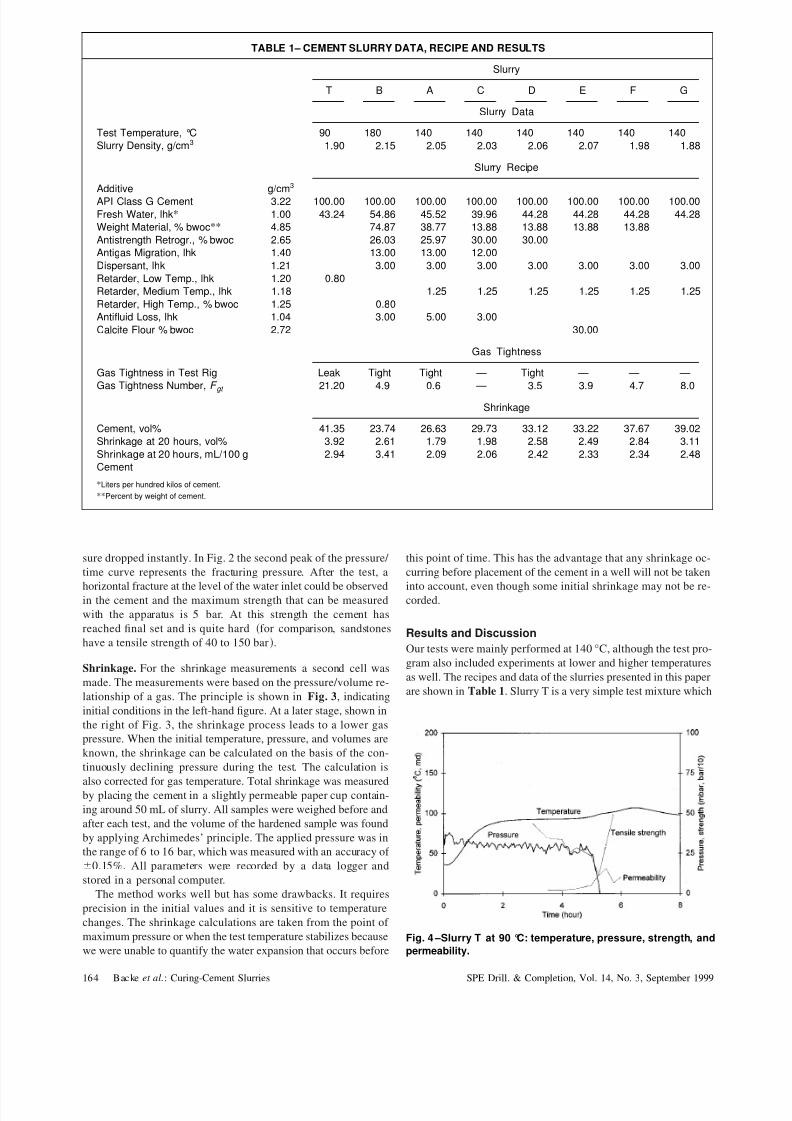
Our tests were mainly performed at 140 °C, although the test pro-
gram also included experiments at lower and higher temperatures
as well. The recipes and data of the slurries presented in this paper
are shown in Table 1. Slurry T is a very simple test mixture which
Fig. 4 –Slurry T at 90 °C: temperature, pressure, strength, and
permeability.
TABLE 1– CEMENT SLURRY DATA, RECIPE AND RESULTS
Slurry
T B A C D E F G
Slurry Data
Test Temperature, °C 90 180 140 140 140 140 140 140
Slurry Density, g/cm3 1.90 2.15 2.05 2.03 2.06 2.07 1.98 1.88
Slurry Recipe
Additive g/cm3
API Class G Cement 3.22 100.00 100.00 100.00 100.00 100.00 100.00 100.00 100.00
Fresh Water, lhk* 1.00 43.24 54.86 45.52 39.96 44.28 44.28 44.28 44.28
Weight Material, % bwoc** 4.85 74.87 38.77 13.88 13.88 13.88 13.88
Antistrength Retrogr., % bwoc 2.65 26.03 25.97 30.00 30.00
Antigas Migration, lhk 1.40 13.00 13.00 12.00
Dispersant, lhk 1.21 3.00 3.00 3.00 3.00 3.00 3.00 3.00
Retarder, Low Temp., lhk 1.20 0.80
Retarder, Medium Temp., lhk 1.18 1.25 1.25 1.25 1.25 1.25 1.25
Retarder, High Temp., % bwoc 1.25 0.80
Antifluid Loss, lhk 1.04 3.00 5.00 3.00
Calcite Flour % bwoc 2.72 30.00
Gas Tightness
Gas Tightness in Test Rig Leak Tight Tight — Tight — — —
Gas Tightness Number, F gt 21.20 4.9 0.6 — 3.5 3.9 4.7 8.0
Shrinkage
Cement, vol% 41.35 23.74 26.63 29.73 33.12 33.22 37.67 39.02
Shrinkage at 20 hours, vol% 3.92 2.61 1.79 1.98 2.58 2.49 2.84 3.11
Shrinkage at 20 hours, mL/100 g
Cement
2.94 3.41 2.09 2.06 2.42 2.33 2.34 2.48
*Liters per hundred kilos of cement.
**Percent by weight of cement.
164 Backe et al.: Curing-Cement Slurries SPE Drill. & Completion, Vol. 14, No. 3, September 1999

8/7/2019 Cement Slury
http://slidepdf.com/reader/full/cement-slury 4/6
is not gas tight, while slurries A and B are commercial recipes
containing all the necessary additives to avoid gas migration. Slur-
ries C-G will be discussed below. The permeability, tensile
strength, and shrinkage results of slurries T, A, and B are pre-
sented in Figs. 4 through 9, where the shrinkage is given as both
vol% and mL/100 g cement. The mL/100 g values are a measure
of degree of hydration.
It is difficult to compare our permeability results with some of those from the literature4,5 because of differing conditions. How-
ever, Appleby and Wilson’s6 data compare well with our results
where the curve shapes and the permeabilities at the temperature
peak are similar. Our shrinkage results at 20 hours fall within the
range presented in the literature.7-11
Temperature Influence. From Figs. 4 through 9 it is evident that
there is a considerable difference in behavior between the three
slurries at 90, 140, and 180 °C. For slurry A at 140 °C all param-
eters change very rapidly when the hydration starts, whereas the
other two slurries at 90 and 180 °C are slower. For all three slur-
ries the temperature peaks coincide with the most marked changes
of the other measured parameters, and the higher the cement tem-
perature is above the set temperature, the more rapid are thesechanges. As an example, slurry A with the most pronounced tem-
perature peak also shows the fastest initial shrinkage up to 1 vol%
and thereafter a decaying shrinkage rate and temperature. The
temperature peak of slurry B is the lowest corresponding to the
slowest initial shrinkage see Fig. 9. The same is true for its
permeability and tensile strength. This correlation is to be ex-
pected as the temperature evolution is a measure of the rate of
hydration, and hence, the parameter behavior. Later in the curing
process, after around 15 hours, the shrinkage measured in mL/100
g is higher for slurries T and B than for slurry A. More interesting
from a hydration point of view, though, are the two temperature
peaks of slurries T and B, the first being at 5 to 7 hours and the
second around 15 to 20 hours, seen in Figs. 7 and 9.
We also tested several other slurries at the temperatures 90, 140
and 180 °C and they exhibited the same behavior, demonstrating
that this is a general trend. A closer look at the literature also
confirm this behavior. The freshwater-based slurries of Chenevert
and Shrestha7 at 93, 121, and 177 °C are not strictly comparable
as they measured the external and not total shrinkage. Neverthe-
less, their medium temperature slurry does show the fastest initial
shrinkage. Sabins et al.13 carried out a substantial number of com-
pressive strength tests and their 24 hour results are plotted in Fig.
10. Apart from two slurries at 143 °C with a strength above 20
MPa, the strength of the cements above 135 °C is lower than those
below this temperature. Sabins and Sutton14 extended this work
and the results follow the same trend although not so clearly.
However, one question remains, how can this temperature in-
fluence be explained? The recipes of the slurries A and B at 140
and 180 °C, respectively, are very similar, but their behavior is
quite different, implying that this difference may be a temperature
effect on the cement hydration chemistry. We leave this question
open.
Gas Tightness. With respect to gas migration, a short transition
period as with slurry A will limit the period in which gas can
enter the cement, thus reducing the hazard of gas migration. All
three slurries were also tested in the gas migration rig of Jamth
et al.,15 where the T slurry was leaking and the other two were
Fig. 5 –Slurry A at 140 °C: temperature, pressure, strength, and
permeability.
Fig. 6 –Slurry B at 180 °C: temperature, pressure, strength, and
permeability.
Fig. 7 –Slurry T at 90 °C: temperature and shrinkage.
Fig. 8 –Slurry A at 140 °C: temperature and shrinkage.
Backe et al.: Curing-Cement Slurries SPE Drill. & Completion, Vol. 14, No. 3, September 1999 165

8/7/2019 Cement Slury
http://slidepdf.com/reader/full/cement-slury 5/6
tight. This may be due to the simple composition of this slurry.
In order to relate the hydrostatic pressure, tensile strength, and
permeability to gas tightness, a systematic interpretation of the
results for several slurries were performed. For the untight
cements, the hydrostatic pressure dropped almost immediately
down to the water column pressure 30 mbar in Fig. 4, stayed
constant for some time, and then fell abruptly. The gas tight pastes
in Figs. 5 and 6 were better at maintaining the hydrostatic cementpressure until the onset of hydration. Buildup of tensile strength
was generally also faster for the tight cements, indicating the im-
portance of a short transition period.
Based on the tensile strength buildup we have defined a time
window, t t 2t 1 . The two points of time t 1 and t 2 represent a
tensile strength of 0.3 and 5 bars, respectively. At time t 2 the
cement is hard. The strength buildup should be rapid, thus t
should be small. For the basic slurry, we found in Fig. 4 that t is
2 hours, while in Fig. 5 t is 15 minutes for the gas tight slurry A.
Slurry B at 180 °C exhibited a time window of 1.6 hours. At the
same points of time, the permeabilities k 1 and k 2 are recorded. In
order to avoid gas intrusion into the pores, the permeability should
be low within the time window. The theoretical initial hydrostatic
pressure of the fresh cement slurry is denoted p i . The drop of the
hydrostatic pressure at the time when the strength starts building
up, i.e., p 1 at t 1 , should be small. Therefore, the value of ( p i
p1) should be small.
The three parameters, the time window, the permeabilities, and
the hydrostatic pressures may be combined in various ways to find
a factor that can characterize a cement’s ability to resist gas mi-
gration. We have tested the following combination of the param-
eters, called the gas tightness factor:
F gt t k 1k 2
k 1k 2 p i p 1
p i
1 . 1
From the discussion above, we conclude that the factor should be
as small as possible to have a gas-tight cement.
In Table 1 the leaking slurry T has a F gt value above 20
whereas the three tight slurries exhibit values below 5. Thus,
based on these slurries, the threshold is somewhere between 5 and
20. To further test the F gt factor, slurry A was used as a starting
point for simplifying the cement composition to study the influ-
ence of additives on gas migration. The recipes and F gt factors of
slurries D–G are shown in Table 1 and the results show that
simplifying the recipe will increase the F gt factor. These slurries
were not tested in the gas rig, but slurry G with a value of 8 would
probably leak due to its simple recipe. Later results, however,
show some overlap between tight and leaking slurries; but the
general trend is still clear, i.e., a short transition period is essential
for a gas-tight cement.
Shrinkage vs. Cement Content. With one addition, the 140 °Cslurries tested for the F gt factor were also tested for shrinkage.
The recipes and data of slurries C-G are shown in Table 1. The
shrinkage at 20 hours was found to be correlated to the cement
content, as shown in Fig. 11, where the curve is forced through
zero, as zero-cement content should yield no shrinkage. This cor-
relation is self-evident and has been reported previously, 7,8 with-
out being linked to the gas migration problem, however. As long
as the strength development of the cement slurry is satisfactory,
more use of inert extender will reduce the shrinkage and the risk
of gas migration. The data in Table 1 support this conclusion,
where the only leaking recipe, slurry T, shows the highest abso-
lute shrinkage at 20 hours.
Conclusions
1. Two cells were successfully developed to study hydrostatic
pressure, temperature evolution, tensile strength, permeability,
and total shrinkage during cement hydration.
2. A new mechanism for gas migration is proposed. First, the
gas has to overcome the entry pressure of the cement pores, and
once inside the cement caused by the continuously changing
pressure conditions the gas may fracture the cement structure.
3. There is a marked contrast in behavior of slurries at 90, 140
and 180 °C where the 90 and 180 °C slurries exhibit two tempera-
ture peaks. This difference is most likely due to a temperature
effect on the cement hydration chemistry.
Fig. 9 –Slurry B at 180 °C: temperature and shrinkage.
Fig. 10– Compressive strength at 24 hours. The dotted lines
represent the average within the two temperature ranges „ex-
cluding the two gray points…. Data from Sabins et al. „Ref. 13….
Fig. 11–Shrinkage at 20 hours vs. cement content.
166 Backe et al.: Curing-Cement Slurries SPE Drill. & Completion, Vol. 14, No. 3, September 1999
8/7/2019 Cement Slury
http://slidepdf.com/reader/full/cement-slury 6/6
4. To predict migration problems, a gas-tightness factor based
on the collected data was defined and compared to results in a gas
migration test rig. A short transition period is important.
5. There is a positive correlation between total chemical shrink-
age and cement content. A low shrinkage will reduce the risk of
gas migration.
Nomenclature
F gt gas tightness factor as defined in Eq. 1
k permeability, L2, md
p pressure, m/Lt2, bar, mbar, MPa
q flow rate, L3
/t, mL/mint time, t , hour, minute
t time difference, t , hour, minute
Subscripts
1,2 point of time
f fracture
i initial
k permeability
Acknowledgments
The authors would like to extend their thanks to the sponsors of
this work: The Research Council of Norway, Norsk Hydro A/S,
Saga Petroleum A/S, and Statoil A/S, and their respective repre-
sentatives Svein Joakimsen, O” ystein Kalvenes, Jan Erik Olvin,and Nils Egil No”dland for their personal engagement and contri-
butions. We also thank Vincent H. J. Bosch for carrying out some
of the experiments, and Harald Justnes and John Jamth for valu-
able discussions.
References
1. Carter, G. and Slagle, K.: ‘‘A Study of Completion Practices to Mini-
mize Gas Communications,’’ JPT September 1972 24, 1170.
2. Tinsley, J.M. et al.: ‘‘Study of Factors Causing Annular Gas Flow
Following Primary Cementing,’’ JPT August 1980 328, 1427.
3. Cooke, E., Kluck, M.P., and Medrano, R.: ‘‘Field Measurements of
Annular Pressure and Temperature During Primary Cementing,’’ JPT
August 1983 359, 1429.
4. Sutton, D.L. and Ravi, K.M.: ‘‘New method for Determining Down-
hole Properties That Affect Gas Migration and Annular Sealing,’’paper SPE 19520 presented at the 1989 SPE Annual Technical Con-
ference and Exhibition, San Antonio, 8– 11 October.
5. Plee, D. et al.: ‘‘Microstructure, Permeability and Rheology of
Bentonite–Cement Slurries,’’ Cem. Concr. Res. January 1990 201,
45.
6. Appleby, S. and Wilson, A.: ‘‘Permeability and Suction in Setting
Cement,’’ Chem. Eng. Sci. January 1996 512, 251.
7. Chenevert, M.E. and Shrestha, B.K.: ‘‘Chemical Shrinkage Properties
of Oilfield Cements,’’ SPEDE March 1991 61, 37.
8. Sabins, F.L. and Sutton, D.L.: ‘‘Interrelationship Between Critical
Cement Properties and Volume Changes During Cement Setting,’’
SPEDE June 1991 62, 88; Trans., AIME, 291.
9. Justnes, H. et al.: ‘‘Chemical Shrinkage of Oil Well Cement Slur-
ries,’’ Adv. Cem. Res. April 1995 726, 85.
10. Parcevaux, P.A. and Sault, P.H.: ‘‘Cement Shrinkage and Elasticity:
A New Approach for a Good Zonal Isolation,’’ paper SPE 13176
presented at the 1984 SPE 59th Annual Technical Conference and
Exhibition, Houston, 16–19 September.
11. Stewart, R.B. and Schouten, F.C.: ‘‘Gas Invasion and Migration in
Cemented Annuli: Causes and Cures,’’ SPEDE March 1988 31,
77.
12. Spec. 10, Specification for Materials and Testing for Well Cements ,
fifth ed., API, Dallas 1990.
13. Sabins, F.L., Sutton, D.L., and Cook, Jr., C.: ‘‘Effect of Excessive
Retardation on the Physical Properties of Cement Slurries,’’ JPT Au-
gust 1984 369, 1357.
14. Sabins, F.L. and Sutton, D.L.: ‘‘The Relationship of Thickening
Time, Gel Strength and Compressive Strength of Oil Well Cements,’’
SPEPE March 1986 12, 143.
15. Jamth, J. et al.: ‘‘Large scale testing system to evaluate the resistance
of cement slurries to gas migration during hydration,’’ paper 95-405
presented at the 1995 CADE/CAODC Spring Drilling Conference,
Calgary, 19– 21 April.
SI Metric Conversion Factors
bar 1.0* E01 MPa
°F (°F32)/1.8 °C
ft 3.048* E01 m
g/cm3 1.0* E03 kg/m3
in. 2.54* E00 cm
lb/100 ft2 4.788 026 E01 Pa
lbm 4.535 924 E01 kgmd 9.869 233 E04 m2
mL 1.0* E00 cm3
psi 6.894 757 E03 MPa
gal 3.785 412 E03 m3
*Conversion factors are exact. SPEDC
Knut R. Backe is a resea rch scientist at the Norwegian U. of
Sc ienc e a nd Tec hnolo gy (NTNU) in Trondh eim, No rway. Hisin-
terests are c eme nt, d rilling fluids, and elect rica l geo physical
method s. Bac ke holds an MS deg ree in petroleum engineer-
ing from NTNU. Ole Bernt Lile is an assoc iate professor in ap -
plied geo physics at NTNU. He holds a PhD de gree from NTNU.Shteryo K. Lyomov is a resea rch sc ientist a t NTNU and an a s-
soc iate professor in drilling a t the U. of Mining and Geo logy
(MGU) in Sofia, Bulga ria. He holds MSa nd PhD d egrees in drill-
ing from MGU. Harald Elveba kk is a resea rch scientist with
the Geological Survey of Norwa y, G eop hysics Section, in
Trondheim. He previously worked at NTNU in the area of oil
well cement. His interests are app lied geophysics, EM-
me tho d s, e le c tric me tho d s, a n d g ra v ity in min e ra l a n d
groundwater prospec ting. Elveba kk holds an MS degree in
mining and ge ology from NTNU. Pal Skalle is an associate
profe ssor o f drilling at NTNU. His interests are drilling fluid tec h-
nology a nd hyd raulics. Skalle holds an M S de gree from the U.
of Leoben, Austria and a PhD degree in petroleum engineer-
ing from NTNU.
Backe et al.: Curing-Cement Slurries SPE Drill. & Completion, Vol. 14, No. 3, September 1999 167