SUZANO PAPEL E CELULOSE - Sustainalytics · S.A. Farnam Bidgoli (London)

(A free translation of the original in Portuguese)
Celulose Irani S.A.
Financial statements at
December 31, 2015 and 2014

Independent auditor's report To the Board of Directors and Stockholders Celulose Irani S.A. We have audited the accompanying parent company financial statements of Celulose Irani S.A. ("Parent company" or "Company"), which comprise the balance sheet as at December 31, 2015 and the statements of income, comprehensive result, changes in equity and cash flows for the year then ended, as well as the accompanying consolidated financial statements of Celulose Irani S.A. and its subsidiaries ("Consolidated"), which comprise the consolidated balance sheet as at December 31, 2015 and the consolidated statements of income, comprehensive result, changes in equity and cash flows for the year then ended, and a summary of significant accounting policies and other explanatory information. Management's responsibility for the financial statements Management is responsible for the preparation and fair presentation of these financial statements in accordance with accounting practices adopted in Brazil and the International Financial Reporting Standards (IFRS) issued by the International Accounting Standards Board (IASB), and for such internal control as management determines is necessary to enable the preparation of financial statements that are free from material misstatement, whether due to fraud or error. Auditor's responsibility Our responsibility is to express an opinion on these financial statements based on our audit. We conducted our audit in accordance with Brazilian and International Standards on Auditing. Those standards require that we comply with ethical requirements and plan and perform the audit to obtain reasonable assurance about whether the financial statements are free from material misstatement. An audit involves performing procedures to obtain audit evidence about the amounts and disclosures in the financial statements. The procedures selected depend on the auditor's judgment, including the assessment of the risks of material misstatement of the financial statements, whether due to fraud or error. In making those risk assessments, the auditor considers internal control relevant to the entity's preparation and fair presentation of the financial statements in order to design audit procedures that are appropriate in the circumstances, but not for the purpose of expressing an opinion on the effectiveness of the entity's internal control. An audit also includes evaluating the appropriateness of accounting policies used and the reasonableness of accounting estimates made by management, as well as evaluating the overall presentation of the financial statements.

(A free translation of the original in Portuguese)
We believe that the audit evidence we have obtained is sufficient and appropriate to provide a basis for our audit opinion. Opinion In our opinion, the financial statements referred to above present fairly, in all material respects, the financial position of Celulose Irani S.A. and of Celulose Irani S.A. and its subsidiaries as at December 31, 2015, and the parent company financial performance and cash flows, as well as the consolidated financial performance and cash flows, for the year then ended, in accordance with accounting practices adopted in Brazil and the IFRS issued by the IASB. Other matters Supplementary information - Statement of value added We have also audited the parent company and consolidated statements of value added for the year ended December 31, 2015, which are the responsibility of the Company's management. The presentation of these statements is required by the Brazilian corporate legislation for listed companies, but it is considered supplementary information for IFRS. These statements were subject to the same audit procedures described above and, in our opinion, are fairly presented, in all material respects, in relation to the financial statements taken as a whole.
Porto Alegre, February 26, 2016 PricewaterhouseCoopers Auditores Independentes CRC 2SP000160/O-5 "F" RS Maurício Colombari Contador CRC 1SP195838/O-3 "S" RS

CELULOSE IRANI S.A.
BALANCE SHEET AT DECEMBER 31
(In thousands of reais) (A free translation of the original in Portuguese)
ASSETS Note LIABILITIES AND EQUITY Note
12/31/2015 12/31/2014 12/31/2015 12/31/2014 12/31/2015 12/31/2014 12/31/2015 12/31/2014
CURRENT ASSETS CURRENT LIABILITIES
Cash and cash equivalents 5 80.079 153.948 125.732 165.985 Borrowings 16 195.620 125.235 195.620 125.235
Trade receivables 6 135.277 127.605 135.854 129.922 Debentures 17 21.248 44.382 21.248 44.382
Inventories 7 67.119 62.588 67.219 62.649 Trade payables 18 86.793 80.383 70.135 65.239
Taxes recoverable 8 9.245 7.094 9.245 7.094 Social and labor obligations 40.774 40.240 41.152 40.440
Dividends receivable - 5.245 - - Tax liabilities 18.815 19.576 19.256 19.880
Bank - restricted account 9 19.722 2.073 19.722 2.073 Income tax and social contribution payable - 475 805 787
Other assets 10 19.293 28.676 19.413 28.763 Taxes payable in installments 2.192 2.281 2.222 2.309
Total current assets 330.735 387.229 377.185 396.486 Advances from customers 1.197 1.995 1.218 2.538
Dividends payable 479 12.964 479 12.964
NON-CURRENT ASSETS Other payables 28.076 15.669 28.278 15.946
Taxes recoverable 8 3.066 3.625 3.066 3.625 Total current liabilities 395.194 343.200 380.413 329.720
Court deposits 1.370 1.136 1.475 1.185
Other assets 10 23.557 2.430 23.584 2.457 NON-CURRENT LIABILITIES
Related parties 19 1.154 1.093 1.154 1.093 Borrowings 16 665.761 537.490 665.761 537.490
Total long-term receivables 29.147 8.284 29.279 8.360 Debentures 17 39.791 69.738 39.791 69.738
Provision for civil, labor and
Investments in subsidiaries 12 272.231 245.174 - - tax contingencies 20 17.485 32.398 17.583 32.482
Investment properties 13 35.332 20.354 19.137 4.087 Taxes payable in installments 1.918 3.635 1.920 3.665
Biological assets 15 92.870 101.114 261.559 281.621 Tax liabilities 10.298 11.293 10.298 11.293
Property, plant and equipment 14.a 789.527 804.143 860.410 875.472 Deferred income tax and
Intangible assets 14.b 110.486 112.276 111.021 112.811 social contribution 11 133.266 183.209 146.197 196.824
Total non-current assets 1.329.593 1.291.345 1.281.406 1.282.351 Total non-current liabilities 868.519 837.763 881.550 851.492
TOTAL LIABILITIES 1.263.713 1.180.963 1.261.963 1.181.212
EQUITY
Share capital 21.a 161.895 151.895 161.895 151.895
Capital reserve 960 960 960 960
Revenue reserves 21.e 160.731 166.139 160.731 166.139
Carrying value adjustments 21.f 73.029 178.617 73.029 178.617
Equity attributable to
owners of the parent 396.615 497.611 396.615 497.611
Non-controlling interests - - 13 14
Total equity 396.615 497.611 396.628 497.625
TOTAL LIABILITIES AND
ASSETS 1.660.328 1.678.574 1.658.591 1.678.837 EQUITY 1.660.328 1.678.574 1.658.591 1.678.837
- - - -
The accompanying notes are an integral part of these financial statements.
ConsolidatedParent Consolidated Parent

CELULOSE IRANI S.A.
STATEMENT OF INCOME FOR THE YEARS ENDED DECEMBER 31
(All amounts in thousands of reais unless otherwise stated) (A free translation of the original in Portuguese)
Note
12/31/2015 12/31/2014 12/31/2015 12/31/2014
NET SALES REVENUE 23 747.123 666.347 758.758 738.499
Change in the fair value of biological assets 15.a 13.749 8.973 (6.450) 29.416
Cost of goods sold 24 (535.478) (512.514) (530.437) (545.224)
GROSS PROFIT 225.394 162.806 221.871 222.691
OPERATING INCOME (EXPENSES)
Selling expenses 24 (81.133) (55.584) (81.133) (70.738)
General and administrative expenses 24 (44.826) (43.533) (46.415) (46.970)
Other operating income 5.163 4.758 5.180 11.158
Other operating expenses (5.883) (9.340) (5.913) (10.139)
Management profit sharing 19 (55) (6.287) (55) (6.287)
Equity in the results of investees 12 (2.877) 55.647 - -
PROFIT BEFORE FINANCE RESULT AND
TAXES 95.783 108.467 93.535 99.715
Finance costs, net 26 (95.495) (59.234) (92.573) (71.339)
Finance income 32.292 23.569 35.228 25.159
Finance costs (127.787) (82.803) (127.801) (96.498)
OPERATING PROFIT BEFORE
TAXATION 288 49.233 962 28.376
Current income tax and social contribution 25 (2) - (1.360) (400)
Deferred income tax and social contribution 25 209 7.346 893 28.603
PROFIT FOR THE YEAR 495 56.579 495 56.579
Profit attributable to owners of the parent 495 56.579 495 56.579
495 56.579 495 56.579
BASIC AND DILUTED EARNINGS PER COMMON SHARE - R$ 22 0,0030 0,3443 0,0030 0,3443
BASIC AND DILUTED EARNINGS PER PREFERRED SHARE - R$ 22 0,0030 0,3443 0,0030 0,3443
The accompanying notes are an integral part of these financial statements.
Parent Consolidated

CELULOSE IRANI S.A.
STATEMENT OF COMPREHENSIVE RESULT FOR THE YEARS ENDED DECEMBER 31
(In thousands of reais) (A free translation of the original in Portuguese)
12/31/2015 12/31/2014 12/31/2015 12/31/2014
Profit for the year 495 56,579 495 56,579
Items to be subsequently reclassified to profit or loss (96,541) (31,530) (96,541) (31,530)
Cash flow hedge accounting (146,274) (47,772) (146,274) (47,772)
Income tax and social contribution on cash flow hedge
accounting 49,733 16,242 49,733 16,242
Other comprehensive results (96,541) (31,530) (96,541) (31,530)
Attributable to owners of the parent (96,046) 25,049 (96,046) 25,049
Comprehensive income (loss) for the year (96,046) 25,049 (96,046) 25,049
The accompanying notes are an integral part of these financial statements.
Parent Consolidated

CELULOSE IRANI S.A.
STATEMENT OF CHANGES IN EQUITY 0
(In thousands of reais) (A free translation of the original in Portuguese)
Share- Statutory Carrying Retained earnings Attributable to Attributable to
Share Treasury based for biological Profit Tax incentives value (Accumulated owners of the non-controlling
Note capital shares payment Legal assets retention reserve adjustments deficit) parent interests Total
BALANCE AT DECEMBER 31, 2013 116.895 (6.834) 960 5.156 65.047 87.911 - 219.094 - 488.229 12 488.241
Total comprehensive income (loss) for the year
Profit for the year 21 d. 56.579 56.579 - 56.579
Cash flow hedge accounting 21 f. (31.530) (31.530) - (31.530)
Realization - deemed cost (8.101) 8.101 - - -
Realization - deemed cost (subsidiaries) (846) 846 - - -
Realized revenue reserve - biological assets (4.394) 4.394 - - -
Realized revenue reserve - biological assets (subsidiaries) (98) 98 - - -
Total comprehensive income (loss) for the year - - - - (4.492) - - (40.477) 70.018 25.049 - 25.049
Total contributions by and distributions to stockholders
Capital increase 21 a. 35.000 (5.156) (29.844) - 4 4
Proposed allocations
Legal reserve 21 e. 2.829 (2.829) - - -
Dividends 21 d. (15.667) (15.667) (2) (15.669)
Tax incentives reserve 21 e. 4.520 (4.520) - - -
Profit retention reserve 21 e. 47.002 (47.002) - - -
Total contributions by and distributions to stockholders 35.000 - - (2.327) - 17.158 4.520 - (70.018) (15.667) 2 (15.665)
-
BALANCE AT DECEMBER 31, 2014 151.895 (6.834) 960 2.829 60.555 105.069 4.520 178.617 - 497.611 14 497.625
Total comprehensive income (loss) for the year
Profit for the year 21 d. 495 495 - 495
Cash flow hedge accounting 21 f. (96.541) (96.541) - (96.541)
Realization - deemed cost (9.047) 9.047 - - -
Realized revenue reserve - biological assets (4.068) 4.068 - - -
Realized revenue reserve - biological assets (subsidiaries) (257) 257 - - -
Total comprehensive income (loss) for the year - - - - (4.325) - - (105.588) 13.867 (96.046) - (96.046)
Total contributions by and distributions to stockholders
Capital increase 21 a. 10.000 (2.829) (7.171) - - -
Dilution of non-controlling interests - (1) (1)
Proposed allocations -
Legal reserve 21 e. 25 (25) - - -
Dividends 21 d. (4.950) (4.950) - (4.950)
Tax incentives reserve 21 e. 470 (470) - - -
Profit retention reserve 21 e. 8.422 (8.422) - - -
Total contributions by and distributions to stockholders 10.000 - - (2.804) - 1.251 470 - (13.867) (4.950) (1) (4.951)
-
BALANCE AT DECEMBER 31, 2015 161.895 (6.834) 960 25 56.230 106.320 4.990 73.029 - 396.615 13 396.628
The accompanying notes are an integral part of these financial statements.
Revenue reserves

CELULOSE IRANI S.A.
STATEMENT OF CASH FLOWS FOR THE YEARS ENDED DECEMBER 31
(In thousands of reais) (A free translation of the original in Portuguese)
Note 12/31/2015 12/31/2014 12/31/2015 12/31/2014
CASH FLOWS FROM OPERATING ACTIVITIES
Profit before income tax and social contribution 288 49.233 962 28.376
Reconciliation of profit with net cash provided by operating activities:
Change in the fair value of biological assets 15.a (13.749) (8.973) 6.450 (29.416)
Depreciation, amortization and depletion 13,14,15 60.438 43.984 79.696 72.172
Dilution of non-controlling interests - - (1) -
Proceeds from sale of permanent assets (319) (209) (319) (158)
Equity in the results of investees 12 2.877 (55.647) - -
Constitution/reversal of provision for civil, labor and tax contingencies 20 (14.415) (4.728) (14.401) (11.206)
Provision for impairment of trade receivables 6 897 644 897 705
Provision for losses on other assets 10 2.006 203 2.006 203
Monetary variations and charges 117.715 73.624 117.715 81.350
Profit sharing 19 55 6.287 55 6.287
Enrollment in REFIS (Subsidiary) - 5.287 - 4.725
Write-down to (reversal of) net realizable value (250) 537 (250) 537
155.543 110.242 192.810 153.575
(Increase) decrease in assets:
Accounts receivable (8.257) (282) (6.518) (657)
Inventories (4.281) (3.620) (4.320) (2.348)
Taxes recoverable (1.592) (1.948) (1.592) 627
Other assets (14.357) (11.315) (14.445) (10.791)
Dividends received 21.501 53.922 - -
Increase (decrease) in liabilities:
Trade payables 5.864 (64.538) 4.494 (1.377)
Social and labor obligations 479 862 657 1.366
Advances from customers (798) 1.343 (1.320) 920
Tax liabilities (4.039) (8.709) (4.793) (29.877)
Other payables 7.088 2.000 7.013 (1.053)
Cash provided by operations 157.151 77.957 171.986 110.385
Payment of interest on borrowings (65.800) (42.338) (65.800) (45.657)
Payment of interest on debentures (16.277) (13.725) (16.277) (18.687)
Net cash provided by operating activities 75.074 21.894 89.909 46.041
CASH FLOWS FROM INVESTING ACTIVITIES
Purchases of property, plant and equipment (42.904) (60.061) (43.381) (64.305)
Transfers to investment properties (10.404) - (10.404) -
Purchases of biological assets (4.767) (5.054) (6.509) (5.713)
Purchases of intangible assets (970) (276) (970) (811)
Capital decrease in subsidiaries 12 - 394 - -
Capital contribution - - - 4
Proceeds from sale of assets 2.596 1.259 2.524 572
Advance for future capital increase (21.072) (10.779) - -
Net cash arising from merger - 3.626 - -
Banks - restricted account (17.649) (912) (17.649) (912)
Net cash used in investing activities (95.170) (71.803) (76.389) (71.165)
CASH FLOWS FROM FINANCING ACTIVITIES
Dividends and interest on capital paid (17.435) (22.475) (17.435) (22.477)
Debentures paid - (41.704) - (48.923)
Proceeds from borrowings 163.853 250.812 163.853 252.519
Repayments of borrowings (200.191) (105.076) (200.191) (125.015)
Net cash provided by (used in) financing activities (53.773) 81.557 (53.773) 56.104
INCREASE (DECREASE) IN CASH AND CASH EQUIVALENTS IN THE YEAR (73.869) 31.648 (40.253) 30.980
CASH AND CASH EQUIVALENTS AT THE BEGINNING OF THE YEAR 5 153.948 122.300 165.985 135.005
CASH AND CASH EQUIVALENTS AT THE END OF THE YEAR 5 80.079 153.948 125.732 165.985
(73.869) 31.648 (40.253) 30.980
The accompanying notes are an integral part of these financial statements.
Parent Consolidated

CELULOSE IRANI S.A.
STATEMENT OF VALUE ADDED FOR THE YEARS ENDED DECEMBER 31
(In thousands of reais) (A free translation of the original in Portuguese)
12/31/2015 12/31/2014 12/31/2015 12/31/2014
1. REVENUES 1.002.231 862.563 1.015.308 969.858
1.1) Sales of products 984.594 858.449 997.652 959.405
1.2) Other revenues 18.534 4.758 18.553 11.158
1.3) Provision for impairment of trade receivables (897) (644) (897) (705)
2. INPUTS PURCHASED FROM THIRD PARTIES 561.796 525.352 527.143 539.664
2.1) Cost of goods sold 508.549 494.989 469.883 458.921
2.2) Materials, electricity, outsourced services and others 51.491 29.623 55.504 80.003
2.3) Impairment/recovery of assets 1.756 740 1.756 740
3. GROSS VALUE ADDED (1-2) 440.435 337.211 488.165 430.194
4. DEPRECIATION, AMORTIZATION AND DEPLETION 60.438 43.984 79.696 72.172
5. CHANGE IN THE FAIR VALUE OF BIOLOGICAL ASSETS (13.749) (8.973) 6.450 (29.416)
6. NET VALUE ADDED GENERATED BY THE ENTITY (3-4-5) 393.746 302.200 402.019 387.438
7. VALUE ADDED RECEIVED THROUGH TRANSFER 29.415 79.216 35.228 25.159
7.1) Equity in the results of investees (2.877) 55.647 - -
7.2) Finance income 32.292 23.569 35.228 25.159
8. TOTAL VALUE ADDED TO DISTRIBUTE (6+7) 423.161 381.416 437.247 412.597
9. DISTRIBUTION OF VALUE ADDED 423.161 381.416 437.247 412.597
9.1) Personnel 148.564 118.044 155.845 145.409
9.1.1 - Direct remuneration 116.425 95.737 121.255 115.059
9.1.2. - Benefits 25.051 16.821 27.162 23.610
9.1.3. - Government Severance Indemnity Fund for Employees (FGTS) 7.088 5.486 7.428 6.740
9.2.) Taxes and contributions 120.231 84.943 127.011 95.501
9.2.1. - Federal 86.084 66.066 92.001 66.032
9.2.2. - State 32.799 18.231 33.495 27.985
9.2.3. - Municipal 1.348 646 1.515 1.484
9.3) Remuneration of third-party capital 140.443 115.563 140.468 108.821
9.3.1. - Interest 127.787 82.803 127.801 96.498
9.3.2. - Rentals 12.656 32.760 12.667 12.323
9.4) Remuneration of own capital 13.923 62.866 13.923 62.866
9.4.1 - Dividends 4.950 15.667 4.950 15.667
9.4.2 - Retained earnings (accumulated deficit) for the year 8.918 40.912 8.918 40.912
9.4.3 - Profit sharing 55 6.287 55 6.287
The accompanying notes are an integral part of these financial statements.
Parent Consolidated

(A free translation of the original in Portuguese)
CELULOSE IRANI S.A.
1. OPERATIONS
2. PRESENTATION OF THE FINANCIAL STATEMENTS
3. SIGNIFICANT ACCOUNTING PRACTICES
4. CONSOLIDATION OF THE FINANCIAL STATEMENTS
5. CASH AND CASH EQUIVALENTS
6. TRADE RECEIVABLES
7. INVENTORIES
8. TAXES RECOVERABLE
9. BANK - RESTRICTED ACCOUNT
10. OTHER ASSETS
11. DEFERRED INCOME TAX AND SOCIAL CONTRIBUTION ON NET INCOME
12. INVESTMENTS
13. INVESTMENT PROPERTIES
14. PROPERTY, PLANT AND EQUIPMENT AND INTANGIBLE ASSETS
15. BIOLOGICAL ASSETS
16. BORROWINGS
17. DEBENTURES
18. TRADE PAYABLES
19. RELATED-PARTY TRANSACTIONS
20. PROVISION FOR CIVIL, LABOR AND TAX CONTINGENCIES
21. EQUITY
22. EARNINGS PER SHARE
23. NET SALES REVENUE
24. COSTS AND EXPENSES BY NATURE
25. INCOME TAX AND SOCIAL CONTRIBUTION
26. FINANCE INCOME AND COSTS
27. INSURANCE
28. FINANCIAL INSTRUMENTS
29. OPERATING SEGMENTS
30. OPERATING LEASE AGREEMENTS (PARENT COMPANY)
31. GOVERNMENT GRANTS
32. TRANSACTIONS NOT AFFECTING CASH
CONTENTS

(A free translation of the original in Portuguese)
Celulose Irani S.A. - National Corporate Taxpayers' Registry (CNPJ)
92.791.243/0001-03
NOTES TO THE FINANCIAL STATEMENTS AT DECEMBER 31, 2015
(All amounts in thousands of reais unless otherwise stated)
1. OPERATIONS
Celulose Irani S.A. ("Company") is a corporation listed on the São Paulo Futures,
Commodities and Stock Exchange (BM&FBovespa S.A.), and headquartered at Rua
General João Manoel, 157, 9th floor, in the city of Porto Alegre, State of Rio Grande do
Sul, Brazil. The Company and its subsidiaries are mainly engaged in manufacturing
corrugated cardboard packaging, packaging paper, resin products and their byproducts.
The Company also operates in forestation and reforestation and utilizes the production
chain of planted forests and paper recycling as the basis for all its production.
On December 30, 2014, the Company's Board of Directors authorized the merger of the
subsidiaries Indústria de Papel e Papelão São Roberto S.A. and Irani Trading S.A., to
simplify their organizational and ownership structures, and, consequently, reduce their
administrative and operating costs. The balance of investments, as well as amounts
receivable and payable of the subsidiaries São Roberto S.A. and Irani Trading S.A.
were eliminated in the merger process. Additionally the Company absorbed the
goodwill recorded by the subsidiary São Roberto S.A. in the amount of R$ 104,380,
which was recognized under intangible assets, based on the expectation of future
profitability and subject to the annual analysis of impairment by the Company. The
equity of the subsidiaries São Roberto S.A. and Irani Trading S.A. merged into the
parent company totaled R$ 243,991 (R$ 123,358 and R$ 120,633, respectively), based
on the balance sheets prepared by the subsidiaries at November 30, 2014. The equity in
the results of the subsidiaries São Roberto S.A. and Irani Trading S.A., which totaled
R$ 3,144 (R$ 1,857 and R$ 1,287, respectively) was recognized in the parent
company's result for December 2014. The merger of the aforementioned subsidiaries
did not result in any changes to the Company's equity, since these subsidiaries were
already wholly owned by the Company.
The direct subsidiaries are listed in Note 4.
The Company is a direct subsidiary of Irani Participações S.A., a Brazilian privately-
held corporation. Its final parent company is D.P. Representações e Participações Ltda.,
which is also a company of the Habitasul Group.
The issue of these financial statements was authorized by the Board of Directors on
February 17, 2016.

2. PRESENTATION OF THE FINANCIAL STATEMENTS
The parent company and consolidated financial statements have been prepared and are
being presented in accordance with the accounting practices adopted in Brazil,
including the pronouncements issued by the Brazilian Accounting Pronouncements
Committee (CPC), and the International Financial Reporting Standards (IFRS), issued
by the International Accounting Standards Board (IASB), and disclose all (and only)
the applicable significant information related to the financial statements, which is
consistent with the information utilized by management in the performance of its duties.
The financial statements have been prepared under the historical cost convention,
except for the biological assets measured at fair value and property, plant and
equipment measured at deemed cost on the transition date to IFRS/CPCs.
2.1. New standards, amendments and interpretations of standards:
Standards, amendments and interpretations to existing standards that will be
mandatory for the periods from January 1, 2016 and have not been adopted
early by the Company.
The following new standards were issued and approved by IASB but are not
effective for 2015. The early adoption of standards, even though encouraged by
IASB, has not been implemented in Brazil by the Brazilian Accounting
Pronouncements Committee (CPC), and the Company is assessing the potential
impact of their adoption.
IFRS 9 - Financial Instruments: addresses the classification, measurement and
recognition of financial assets and liabilities. The standard is effective from
January 1, 2018. This standard replaces the guidance included in IAS 39,
regarding the classification and measurement of financial instruments. IFRS 9
retains but simplifies the combined measurement model and establishes three
primary measurement categories for financial assets: amortized cost, fair value
through other comprehensive income (loss), and fair value through profit or
loss. It also institutes a model of expected credit losses, in replacement of the
current model of incurred losses. IFRS 9 relaxes the requirements for hedge
effectiveness, requiring an economic relationship between the hedged item and
the hedging instrument, and also that the hedging index be the same as that used
by management for risk management purposes.
IFRS 15 - Revenue from Contracts with Customers: this new standard
establishes the principles that should be applied by an entity to measure revenue
and when the revenue should be recognized. It takes effect on January 1, 2017
and replaces IAS 11 – “Construction Contracts”, IAS 18 – “Revenues” and
corresponding interpretations.
IFRS 16 - Leases: The new standard supersedes IAS 17 - Leasing Operations
and all related interpretations and requires lessees to recognize the liabilities of

future payments and the right of use of the leased asset for virtually all lease
agreements, including operating leases. Certain short-term and low-value
contracts may be out of the scope of this new standard. The criteria for
recognition and measurement of leases in the financial statements of the lessors
are substantially maintained. IFRS 16 is effective from January 1, 2019.
IAS 41 - Agriculture (equivalent to CPC 29 - Biological Assets and
Agricultural Products): This standard currently requires biological assets to be
measured at fair value less costs to sell. When revising the standard, IASB
decided that the so called bearer plants should be accounted for as fixed assets
(IAS 16/CPC 27), that is, at cost less depreciation or impairment. Bearer plants
are defined as those expected to produce agricultural products for various
periods, but which do not undergo significant transformations after harvest. The
standard is applicable from January 1, 2016. Management has concluded that
the adoption of the revision of this standard has no impact on the measurement
and presentation of the Company's biological assets, since these assets do not
fall under the definition of bearer plants.
There are no other standards, amendments and interpretations that are not yet
effective, which would be expected to have a material impact on the Company's
financial statements.

3. SIGNIFICANT ACCOUNTING PRACTICES
a) Functional currency and translation of foreign currencies
The parent company and consolidated financial statements are presented in
Brazilian reais (R$), which is the functional and reporting currency of the Company
and its subsidiaries.
Foreign-currency transactions are originally recorded at the exchange rate effective
on the transaction date. Gains and losses arising from the difference between the
balances in foreign currency and the translation into the functional currency are
recognized in the statement of income, except when designated for cash flow hedge
accounting and, therefore, deferred in equity as cash flow hedge transactions.
b) Cash and cash equivalents
Cash and cash equivalents comprise cash, deposits with banks and other highly
liquid investments with a low risk of change in value and a maturity of 90 days or
less, held for the purpose of meeting short-term cash commitments. They are
classified in financial assets in the category of "loans and receivables."
c) Trade receivables and provision for impairment of trade receivables
Trade receivables are recorded at their original amounts plus the effect of foreign
exchange rate changes, when applicable. The provision for impairment of trade
receivables is calculated based on losses estimated through an individual analysis of
trade receivables and considering the history of losses, and is recognized at an
amount considered sufficient by the Company's management to cover expected
losses on the collection of these receivables. Trade receivables are classified in
financial assets in the category of "Loans and receivables."
d) Offsetting of financial instruments
Financial assets and liabilities are offset and the net amount is reported in the
balance sheet when there is a legal right to offset the recognized amounts and there
is an intention to settle on a net basis, or to realize the asset and settle the liability
simultaneously.
e) Impairment of financial assets
The Company assesses, at each balance sheet date, whether there is objective
evidence that a financial asset or group of financial assets is impaired, with the
recognition of impairment losses only if there is objective evidence that one or more
events have an impact on the estimated future cash flows of the financial asset or
group of financial assets, which can be estimated reliably.

The criteria that the Company uses to determine whether there is objective evidence
of an impairment loss include:
i) significant financial difficulty of the issuer or debtor;
ii) a breach of contract, such as a default in interest or principal payments;
iii) it becomes probable that the borrower will enter bankruptcy or other financial
reorganization;
iv) the disappearance of an active market for that financial asset because of financial
difficulties;
v) adverse changes in the conditions and/or the economy that indicate a reduction in
estimated future cash flows of the portfolios of financial assets.
If there is evidence that a financial asset or a group of financial assets is impaired,
the difference between the carrying amount and the present value of the future cash
flows is estimated, and the impairment loss is recognized in the statement of
income.
f) Inventories
Inventories are stated at the lower of average production or acquisition cost and net
realizable value. Net realizable value is the estimated selling price in the ordinary
course of business, less the estimated costs of completion and the costs necessary to
make the sale.
g) Investments
Investments in subsidiaries are accounted for in the parent company financial
statements by the equity method, whereby the investments are adjusted to recognize
the Company's share of the profit or loss and other comprehensive results of the
subsidiary.
Intercompany transactions, balances and unrealized gains on transactions between
related parties are eliminated. Unrealized losses are also eliminated, unless the
transaction provides evidence of impairment of the asset transferred. The accounting
policies of the subsidiaries are altered, when necessary, to ensure consistency with
the policies adopted by the Company.
h) Investment properties
Investment properties are stated at cost, less depreciation recognized based on the
estimated useful life of each asset on the straight-line basis, to fully write off the
cost less residual value of each asset over its expected life. The estimated useful life,
residual values and depreciation methods are reviewed annually, and the effects of
any changes in estimates are accounted for prospectively.
Income from rented investment properties is recognized in the statement of income
on the accrual basis of accounting.
Any gain or loss from the sale or write-off of an item recorded in investment
properties is determined by the difference between the sales amount received and
the carrying amount of the asset sold, and recognized in the statement of income.
i) Property, plant and equipment and intangible assets
Property, plant and equipment are stated at deemed cost less accumulated
depreciation and impairment losses, when applicable. In the case of qualifying
assets, borrowing costs are capitalized as part of the costs of construction in
progress. These assets are classified in the proper categories of property, plant and
equipment when completed and ready for their intended use. Depreciation begins
when these assets become ready for their intended use and is calculated on the same
basis as that of other property, plant and equipment items.
The Company calculates depreciation on the straight-line method, taking into
consideration the estimated useful lives of the assets, based on expectations of the
generation of future economic benefits, except for land, which is not depreciated.
The estimated useful lives of the assets are reviewed annually and adjusted, if
necessary, and may vary based on the technological stage of each unit.
The Company's intangible assets comprise goodwill, computer software licenses,
trademarks and the customer portfolio.
Goodwill represents the positive difference between the amount paid and/or payable
for the acquisition of a business and the net fair value of the assets and liabilities of
the acquiree. Goodwill on acquisitions of subsidiaries is recorded as "Intangible
assets" in the consolidated financial statements. If a gain on advantageous purchase
is determined, the amount is recorded as a gain in the statement of income for the
period, at the acquisition date. Goodwill is tested for impairment annually and
carried at cost less accumulated impairment losses. Impairment losses on goodwill
are not reversed. Gains and losses on the disposal of an entity include the carrying
amount of goodwill relating to the entity sold.
Goodwill is allocated to cash-generating units (CGUs) for the purpose of
impairment testing. The allocation is made to those CGUs or groups of CGUs that
are expected to benefit from the business combination from which the goodwill
arose, identified according to the operating segment.
Computer software licenses acquired are capitalized on the basis of the costs
incurred to acquire and bring to use the specific software. These costs are amortized
over the estimated useful life of the software (three to five years). Costs associated
with maintaining computer software programs are expensed as incurred.
Separately acquired trademarks and licenses are initially stated at historical cost.
Trademarks and licenses acquired in a business combination are recognized at fair
value, at the acquisition date. The Company's trademarks do not have a defined
useful life and, therefore, are not amortized.

The customer portfolio acquired in a business combination is recognized at fair
value on the acquisition date, and is accounted for at fair value less the accumulated
amortization. Amortization is calculated on the straight-line basis, over the expected
life of the relationship with the customer.
j) Biological assets
The Company's biological assets are represented mainly by pine forests, which are
used in the production of packaging papers, corrugated cardboard boxes and sheets,
and also for sale to third parties and extraction of gum resin. Pine forests are located
near the pulp and paper plant in the State of Santa Catarina and also in the State of
Rio Grande do Sul, where they are used for the production of gum resin and the sale
of timber logs.
Biological assets are periodically measured at fair value less selling expenses, and
the variation during each period is recognized in the statement of income as a
change in the fair value of biological assets. The measurement of the fair value of
biological assets is based on certain assumptions, as disclosed in Note 15.
k) Assessment of the impairment of non-financial assets
The Company reviews the balance of non-financial assets for impairment whenever
events or changes in circumstances indicate that the carrying amount of an asset or
group of assets may not be recoverable, based on future cash flows. The reviews
conducted in 2015 did not indicate the need to recognize impairment losses.
l) Income tax and social contribution (current and deferred)
A provision is recorded for current income tax and social contribution based on the
taxable profit determined according to the prevailing tax legislation, which differs
from the profit reported in the statement of income, since it excludes income or
expenses taxable or deductible in other periods, as well as permanently non-taxable
or non-deductible items. The provision for income tax and social contribution is
calculated for each company individually, based on the statutory rates prevailing at
year end. The Company calculates its taxes at a rate of 34% on its taxable profit;
however, the subsidiaries Habitasul Florestal S.A. and Iraflor - Comércio de
Madeiras Ltda. adopt a presumed rate of 3.08%.
The Company recognizes deferred income tax and social contribution on temporary
differences for tax purposes, tax losses, deemed cost adjustments and changes in the
fair value of biological assets. Deferred tax liabilities are generally recognized for
all taxable temporary differences, and deferred tax assets are recognized for all
deductible temporary differences and tax losses, only if it is probable that the
Company will have sufficient future taxable income against which such deductible
temporary differences and tax losses can be utilized. Deferred income tax and social
contribution are recorded for the subsidiaries that adopt the presumed taxable profit

regime, in respect of the fair value of biological assets and the deemed cost of
property, plant and equipment.
Deferred tax assets and liabilities are presented net in the balance sheet when there
is a legally enforceable right and the intention to offset them on the calculation of
current taxes, generally when related to the same legal entity and the same tax
authority.
m) Borrowings and debentures
Borrowings and debentures are stated at their original amounts, less the related
transaction costs, when applicable, and adjusted based on indices established in the
contracts entered into with the creditors. The balance includes interest calculated
using the effective interest rate method, as well as the effects of foreign exchange
rate changes, when applicable, through the balance sheet dates, as described in the
explanatory notes.
n) Hedge accounting
The Company documents, at the inception of the transaction, the relationship
between hedging instruments and hedged items, as well as its risk management
objectives and strategy for undertaking hedging transactions. The Company also
documents its assessment, both at hedge inception and on an ongoing basis, of
whether the derivatives that are used in hedging transactions are highly effective in
offsetting changes in the cash flows of hedged items.
The changes in the hedging amounts, classified in "Carrying value adjustments" in
equity, are shown in Note 21.
The effective portion of changes in the fair value of hedging instruments that are
designated and qualify as cash flow hedges is recognized in equity within "Carrying
value adjustments". The gain or loss relating to the ineffective portion is recognized
immediately in the statement of income.
The amounts accumulated in equity are reclassified to the statement of income in
the periods when the hedged item affects the results of operations (for example,
when the forecast sale that is being hedged takes place). The gain or loss relating to
the effective portion of instruments hedging highly probable transactions is
recognized in the statement of income within "Finance results".
When a transaction is no longer expected to occur, the cumulative gain or loss that
was reported in equity is immediately transferred to the statement of income.
o) Leases
The Company as the lessee

Leases of property, plant and equipment where the Company has substantially all
the risks and rewards of ownership are classified as finance leases. All other leases
are classified as operating leases and recorded in the statement of income. These
financial leases are recorded in the same manner as a financed purchase,
recognizing a property, plant and equipment item and a financing liability (lease) at
the beginning of the lease agreement. Property, plant and equipment items acquired
under finance leases are depreciated at the rates disclosed in Note 14.
Operating lease payments (net of any incentives received from the lessor) are
recognized in the statement of income on the straight-line method, over the lease
term.
The Company as the lessor
Lease income from operating leases is recognized on a straight-line basis over the
lease term. Initial direct costs incurred in negotiating and arranging an operating
lease are added to the carrying amount of the leased assets and also recognized on a
straight-line basis over the lease term.
p) Provisions
A provision is recognized in the balance sheet when the Company has a present
obligation (legal or constructive) as a result of a past event, it is probable that an
outflow of resources will be required to settle this obligation, and the amount can be
reliably estimated. Provisions are recorded at amounts considered sufficient by
management to cover probable losses, and are adjusted through the balance sheet
date, based on the nature of each risk and the opinion of the Company's legal
counsel.
q) Employee benefits
Profit sharing
The Company recognizes liabilities and expenses for profit sharing based on a
methodology that takes into consideration the profit attributable to each of the
operating segments. The provisions are recognized according to the terms of the
agreement entered into between the Company and the employees' representatives,
which are reviewed on an annual basis.
r) Significant accounting judgments, estimates and assumptions
In preparing the financial statements, judgments, estimates and assumptions were
utilized to account for certain assets, liabilities, income and expenses.
The accounting judgments, estimates and assumptions adopted by management
were based on the best information available at the reporting date, experience with
past events, projections about future events, and the assistance of experts, when
applicable.

Therefore, the financial statements contain a number of estimates, including, but not
limited to, the determination of the useful lives of property, plant and equipment
(Note 14), the realization of deferred tax assets (Note 11), the provision for
impairment of trade receivables (Notes 6 and 10), the measurement of the fair value
of biological assets (Note 15), the provision for tax, social security, civil and labor
claims (Note 20), and the provision for impairment of assets.
Actual results involving accounting judgments, estimates and assumptions, when
realized, could differ from those recognized in the financial statements.
The Company has a Value-added Tax on Sales and Services (ICMS) incentive
granted by the Governments of the States of Santa Catarina and Minas Gerais. The
Federal Supreme Court (STF) issued decisions in Direct Actions, declaring the
unconstitutionality of several state laws that granted ICMS tax benefits without any
previous agreement between the States.
Although the Company has no tax incentive being judged by the STF, it has been
monitoring, together with its legal advisors, the evolution of this issue in the courts
to assess possible impacts on its operations and consequent effects on the financial
statements (Note 31).
s) Determination of the results of operations
Revenue and expenses are recognized on the accrual basis and include interest,
charges and the effects of exchange rate changes at official rates, applicable to
current and non-current assets and liabilities and, when applicable, adjustments to
realizable value.
t) Revenue recognition
Revenue is measured at the fair value of the consideration received or receivable for
the sale of products, less any expected returns, trade discounts and/or bonuses
granted to the customer and other similar deductions. Revenue between the parent
company and its subsidiaries is eliminated from the consolidated results.
Sales revenue is recognized when all of the following conditions are met:
The Company has transferred to the buyer the significant risks and rewards of
ownership of the products;
The Company retains neither continuing managerial involvement to the degree
usually associated with ownership, nor effective control over the products sold;
The amount of revenue can be measured reliably;
It is probable that the economic benefits associated with the transaction will
flow to the Company; and

The costs incurred or to be incurred in respect of the transaction can be
measured reliably.
u) Government grants
The financing of taxes, directly or indirectly granted by the Government, at interest
rates below market rates, are recognized as government grants and measured at the
difference between the amounts received and the fair value calculated based on
market interest rates. This difference is recorded with a corresponding entry to sales
revenue in the statement of income and is appropriated based on the amortized cost
and the effective interest rate.
v) Statement of value added
The Brazilian corporate law requires the presentation of the statement of value
added, parent company and consolidated, as an integral part of the set of financial
statements presented by a publicly-traded entity. Under IFRS, the presentation of
this statement is considered supplementary information, and not a required part of
the set of financial statements. The purpose of this statement is to show the wealth
created by the Company and its distribution during the reporting period.
The statement of value added was prepared pursuant to the provisions of CPC 09 -
Statement of Value Added, with information obtained from the same accounting
records as those used to prepare the financial statements.

4. CONSOLIDATION OF THE FINANCIAL STATEMENTS
The consolidated financial statements include the accounts of Celulose Irani S.A. and
the following subsidiaries:
Ownership interest - (%)
Subsidiaries - direct ownership Business activity 12/31/2015 12/31/2014
Habitasul Florestal S.A. Forest production 100,00 100,00
HGE - Geração de Energia Sustentável S.A. * Power generation 100,00 100,00
Iraflor - Comércio de Madeiras LTDA. Timber sales 99,99 99,99
HGE - Geração de Energia Sustentável S.A. Power generation 99,43 99,43
* currently evaluating wind power projects for implementation
The accounting practices of the subsidiaries are consistent with those adopted by the
Company. Intercompany balances and investments and equity of the subsidiaries, as
well as intercompany transactions and unrealized profits and/or losses, have been
eliminated in consolidation. The accounting information of the subsidiaries used for
consolidation was prepared on the same date as that of the Company's accounting
information.
5. CASH AND CASH EQUIVALENTS
Cash and cash equivalents comprise the following:
12/31/2015 12/31/2014 12/31/2015 12/31/2014
Fixed-income fund 29 27 32 30
Cash at banks 3.275 4.224 3.499 4.411
Financial investments with immediate liquidity 76.775 149.697 122.201 161.544
80.079 153.948 125.732 165.985
Parent Consolidated
The financial investments with immediate liquidity in Bank Deposit Certificates
(CDBs) earn an average of 99.97 % of the Interbank Deposit Certificate (CDI) interest
rate and have a maturity of 90 days or less. These investments are held for the purpose
of meeting short-term commitments.

6. TRADE RECEIVABLES
12/31/2015 12/31/2014 12/31/2015 12/31/2014
Trade receivables:
Domestic market 130.605 130.196 131.839 133.171
Foreign market 19.405 11.245 19.405 11.245
150.010 141.441 151.244 144.416
Provision for impairment of trade receivables (14.733) (13.836) (15.390) (14.494)
135.277 127.605 135.854 129.922
Parent Consolidated
At December 31, 2015, the amount of R$ 19,145 in consolidated trade receivables was
overdue and not subject to a provision, as it related to independent customers with no
history of default.
The maturity analysis of trade receivables is as follows:
12/31/2015 12/31/2014 12/31/2015 12/31/2014
Not yet due 116.233 108.576 116.709 110.364
Less than 30 days overdue 11.374 10.405 11.425 10.629
31 to 60 days overdue 3.662 3.580 3.666 3.719
61 to 90 days overdue 664 1.719 670 1.719
91 to 180 days overdue 2.059 1.541 2.059 1.698
More than 180 days overdue 16.018 15.620 16.715 16.287
150.010 141.441 151.244 144.416
Parent Consolidated
The average credit term on the sale of products is 48 days. The Company recognizes a
provision for impairment of trade receivables for balances past due for over 180 days,
based on an analysis of the financial position of each debtor and past default
experience. A provision for impairment of trade receivables is also recorded for
balances past due for less than 180 days when these balances are considered
uncollectible, considering the financial position of each debtor.
The changes in the provision were as follows:
12/31/2015 12/31/2014 12/31/2015 12/31/2014
Balance at the beginning of the year (13,836) (6,933) (14,494) (13,979)
Merger of the subsidiary São Roberto S.A. - (6,420) - -
Provision for losses recognized (897) (644) (897) (705)
Trade receivables written-off as uncollectible
during the year - 161 - 190
Amounts recovered during the year - - 1 -
Balance at the end of the year (14,733) (13,836) (15,390) (14,494)
ConsolidatedParent

A portion of the receivables, amounting to R$ 75,522, has been assigned as collateral
for certain financing transactions, as disclosed in Notes 16 and 17.
The credit quality of financial assets that were neither past due nor impaired at
December 31, 2015 was assessed with reference to historical information on default
rates, as follows:
Quality accounts receivable
Customer category History -% Amount receivable
a) Customers with no history of default 92,36 107.793
b) Customers with history of default of up to 7 days 6,58 7.679
c) Customers with history of default of more than 7 days 1,06 1.237
116.709
a) Performing customers with no history of default
b) Defaulting customers with a history of default of up to 7 days, without history of delinquency.
c) Defaulting customers with a history of default of more than 7 days, without history of delinquency.
Consolidated
7. INVENTORIES
12/31/2015 12/31/2014 12/31/2015 12/31/2014
Finished products 10.265 7.763 10.265 7.763
Production materials 32.046 32.025 32.046 32.025
Consumable materials 21.494 20.211 21.594 20.272
Other inventories 3.601 3.126 3.601 3.126
67.406 63.125 67.506 63.186
Write-down to net realizable value (287) (537) (287) (537)
67.119 62.588 67.219 62.649
Parent Consolidated
The cost of inventories recognized as an expense for the year totaled R$ 535,478
(R$ 512,514 in 2014) in the parent company and R$ 530,437 (R$ 545,224 in 2014) in
the consolidated.
The cost of inventories recognized in the statement of income for the year includes a
write-down to net realizable value of R$ 476. Management expects the remaining
inventory items to be realized in less than 12 months.

8. TAXES RECOVERABLE
Taxes recoverable consist of the following:
12/31/2015 12/31/2014 12/31/2015 12/31/2014
Value-added Tax on Sales
and Services (ICMS) 7.282 8.170 7.282 8.170
Social Integration Program (PIS)/ Social
Contribution on Revenues (COFINS) 894 695 894 695
Excise Tax (IPI) 101 333 101 333
Income tax (IRPJ) 340 255 340 255
Social contribution (CSLL) 39 87 39 87
Withholding Income Tax (IRFF) on
investments 3.655 1.179 3.655 1.179
12.311 10.719 12.311 10.719
- - - -
Current 9.245 7.094 9.245 7.094
Non-current 3.066 3.625 3.066 3.625
Parent Consolidated
ICMS credits basically comprise credits generated on purchases of property, plant and
equipment, which are recoverable in 48 consecutive monthly installments, as
determined by the applicable tax legislation.
9. BANK - RESTRICTED ACCOUNT
12/31/2015 12/31/2014 12/31/2015 12/31/2014
Banco do Brasil - New York – (a) 19.722 2.073 19.722 2.073
Total current 19.722 2.073 19.722 2.073
Parent Consolidated
The balance with Banco do Brasil - New York/ United States of America is represented
by amounts in U.S. dollars retained to guarantee the settlement of the quarterly
installments of the export prepayment loan obtained from Credit Suisse Bank, and
refers to the installment falling due in February 2016. The contract, which deals with
the retention realized on September 26, 2014, has been renegotiated and establishes that
only the contractual interest will be due up to May 2017.
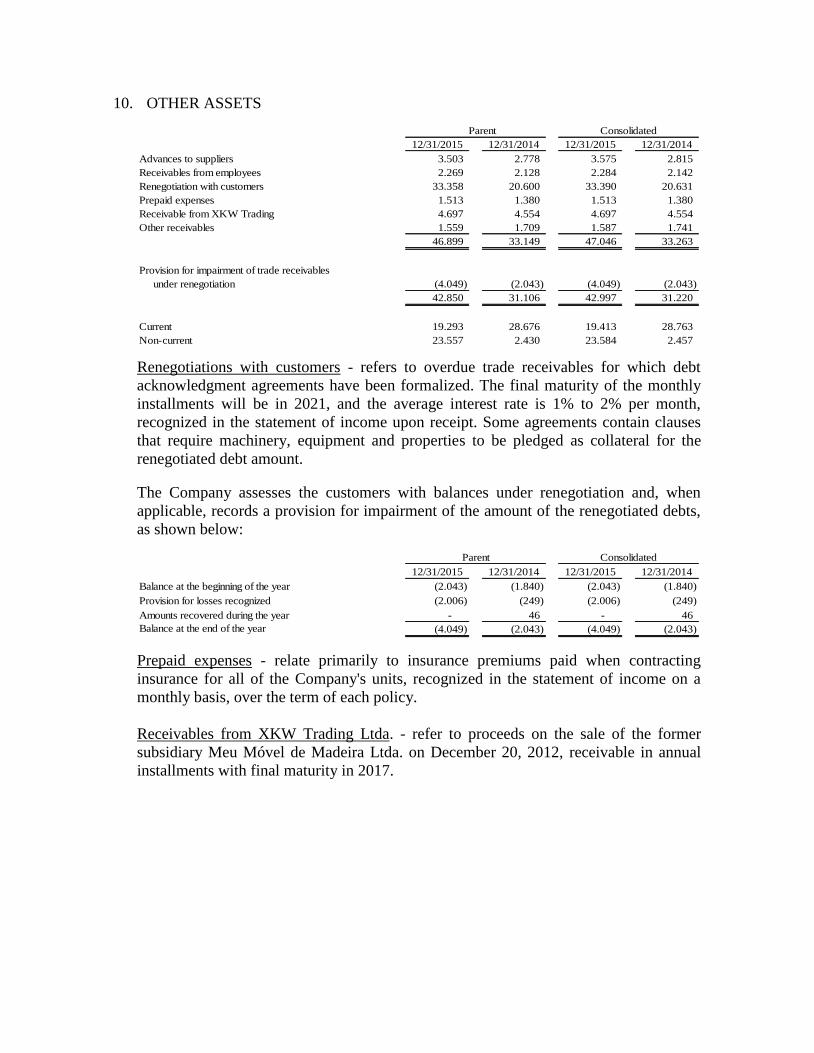
10. OTHER ASSETS
12/31/2015 12/31/2014 12/31/2015 12/31/2014
Advances to suppliers 3.503 2.778 3.575 2.815
Receivables from employees 2.269 2.128 2.284 2.142
Renegotiation with customers 33.358 20.600 33.390 20.631
Prepaid expenses 1.513 1.380 1.513 1.380
Receivable from XKW Trading 4.697 4.554 4.697 4.554
Other receivables 1.559 1.709 1.587 1.741
46.899 33.149 47.046 33.263
Provision for impairment of trade receivables
under renegotiation (4.049) (2.043) (4.049) (2.043)
42.850 31.106 42.997 31.220
Current 19.293 28.676 19.413 28.763
Non-current 23.557 2.430 23.584 2.457
Parent Consolidated
Renegotiations with customers - refers to overdue trade receivables for which debt
acknowledgment agreements have been formalized. The final maturity of the monthly
installments will be in 2021, and the average interest rate is 1% to 2% per month,
recognized in the statement of income upon receipt. Some agreements contain clauses
that require machinery, equipment and properties to be pledged as collateral for the
renegotiated debt amount.
The Company assesses the customers with balances under renegotiation and, when
applicable, records a provision for impairment of the amount of the renegotiated debts,
as shown below:
12/31/2015 12/31/2014 12/31/2015 12/31/2014
Balance at the beginning of the year (2.043) (1.840) (2.043) (1.840)
Provision for losses recognized (2.006) (249) (2.006) (249)
Amounts recovered during the year - 46 - 46
Balance at the end of the year (4.049) (2.043) (4.049) (2.043)
Parent Consolidated
Prepaid expenses - relate primarily to insurance premiums paid when contracting
insurance for all of the Company's units, recognized in the statement of income on a
monthly basis, over the term of each policy.
Receivables from XKW Trading Ltda. - refer to proceeds on the sale of the former
subsidiary Meu Móvel de Madeira Ltda. on December 20, 2012, receivable in annual
installments with final maturity in 2017.

11. DEFERRED INCOME TAX AND SOCIAL CONTRIBUTION ON NET INCOME
Deferred income tax and social contribution on net income are calculated on temporary
differences for tax purposes, tax losses, adjustments of deemed cost and changes in the
fair value of biological assets.
In 2015 and 2014, the Company computed income tax and social contribution on
foreign exchange variations on a cash basis, and recorded a deferred tax liability related
to unrealized foreign exchange variations.
Deferred tax liabilities were recognized based on the fair value of biological assets and
the deemed cost of property, plant and equipment.
The initial tax impacts on the deemed cost of property, plant and equipment were
recognized with a corresponding entry to equity. ASSETS
12/31/2015 12/31/2014 12/31/2015 12/31/2014
Deferred income tax assets
On temporary provisions 7.159 11.037 7.159 11.037
On tax losses 11.793 2.614 11.793 2.614
Cash flow hedges 54.922 18.353 54.922 18.353
Deferred social contribution assets
On temporary provisions 2.577 3.973 2.577 3.973
On tax losses 4.246 941 4.246 941
Cash flow hedges 19.772 6.607 19.772 6.607
100.469 43.525 100.469 43.525
Parent Consolidated
LIABILITIES
12/31/2015 12/31/2014 12/31/2015 12/31/2014
Deferred income tax liabilities
Unrealized foreign exchange gains taxed on a cash basis 1.922 1.793 1.922 1.793
Fair value of biological assets 37.565 35.687 39.251 37.817
Deemed cost of property, plant and equipment 122.764 122.852 130.363 130.451
Government grants 949 763 949 763
Customer portfolio 1.177 1.383 1.177 1.383
Trademarks - 327 - 327
Tax amortization of goodwill 7.487 3.892 7.487 3.892
Deferred social contribution liabilities
Unrealized foreign exchange gains taxed on a cash basis 692 645 692 645
Fair value of biological assets 13.523 12.847 14.434 13.997
Deemed cost of property, plant and equipment 44.195 44.255 46.930 46.991
Government grants 342 275 342 275
Customer portfolio 424 495 424 495
Trademarks - 118 - 118
Tax amortization of goodwill 2.695 1.402 2.695 1.402
233.735 226.734 246.666 240.349
Deferred tax liabilities (net) 133.266 183.209 146.197 196.824
Parent Consolidated

Management recorded deferred income tax and social contribution on temporary
differences and tax losses. Based on budget forecasts approved by the Board of
Directors, management expects these consolidated balances to be realized as follows:
Deferred tax liabilities (net) Consolidated
Period 12/31/2015
2016 8.387
2017 9.225
2018 10.148
2019 10.930
2020 onward 107.507
146.197
The changes in deferred income tax and social contribution were as follows:
Parent Company assets
Opening
balance –
12/31/2014
Recognized in
profit or lossRecognized in
equity
Closing balance
- 12/31/2015
Deferred tax assets related to:
Provision for profit sharing (3.896) 144 - (3.752)
Provision for sundry risks (11.063) 5.079 - (5.984)
Cash flow hedges (24.960) - (49.734) (74.694)
Other (51) 51 - -
Total temporary differences (39.970) 5.274 (49.734) (84.430)
Tax losses (3.555) (12.484) - (16.039)
(43.525) (7.210) (49.734) (100.469)
Consolidated assets
Opening
balance –
12/31/2014
Recognized in
profit or loss
Recognized in
equity
Closing balance
- 12/31/2015
Deferred tax assets related to:
Provision for profit sharing (3.896) 144 - (3.752)
Provision for sundry risks (11.063) 5.079 - (5.984)
Cash flow hedges (24.960) - (49.734) (74.694)
Other (51) 51 - -
Total temporary differences (39.970) 5.274 (49.734) (84.430)
Tax losses (3.555) (12.484) - (16.039)
(43.525) (7.210) (49.734) (100.469)

Parent Company liabilitiesOpening
balance
Recognized in
profit or loss Closing balance
12/31/2014 12/31/2015
Deferred tax liabilities related to:
Unrealized foreign exchange gains taxed on a cash basis 2.438 176 2.614
Fair value of biological assets 48.534 2.554 51.088
Deemed cost and useful life review 167.107 (148) 166.959
Government grants 1.038 253 1.291
Customer portfolio 1.878 (277) 1.601
Trademarks 445 (445) -
Tax amortization of goodwill 5.294 4.888 10.182
226.734 7.001 233.735
Consolidated liabilitiesOpening
balance
Recognized in
profit or loss Closing balance
12/31/2014 12/31/2015
Deferred tax liabilities related to:
Unrealized foreign exchange gains taxed on a cash basis 2.438 176 2.614
Fair value of biological assets 51.814 1.871 53.685
Deemed cost and useful life review 177.442 (149) 177.293
Government grants 1.038 253 1.291
Customer portfolio 1.878 (277) 1.601
Trademarks 445 (445) -
Tax amortization of goodwill 5.294 4.888 10.182
240.349 6.317 246.666

12. INVESTMENTS
Iraflor HGE Irani
Habitasul Irani Comércio Geração Geração
Florestal Trading de Madeiras de Energia São Roberto de Energia Total
At December 31, 2013 119.868 116.119 67.734 1.165 44.038 297 349.221
Equity in the results of investees 20.461 15.846 8.928 (26) 10.585 (147) 55.647
Proposed dividends (19.159) (10.046) (21.975) - - - (51.180)
Capital increase - 1 57.648 - 70.592 236 128.477
Advance for future capital increase 10.743 - - 31 - - 10.774
Other changes - - - (394) - - (394)
Spin-off - - - (236) - - (236)
Merger of Irani Trading into Irani - (121.920) - - - - (121.920)
Merger of São Roberto into Irani - - - - (125.215) - (125.215)
At December 31, 2014 131.913 - 112.335 540 - 386 245.174
Equity in the results of investees (6.575) - 3.897 (71) - (128) (2.877)
Proposed dividends (15.734) - (522) - - - (16.256)
Capital increase - - 25.118 - - - 25.118
Advance for future capital increase 20.978 - - 94 - - 21.072
At December 31, 2015 130.582 - 140.828 563 - 258 272.231
Liabilities 14.158 - 1.067 - - 4
Equity 130.584 - 140.837 563 - 260
Assets 144.742 - 141.904 563 - 264
Net revenue 12.279 - 35.510 - - -
Result for the year (6.575) - 3.897 (71) - (128)
Ownership interest - % 100,00 - 99,99 100,00 - 99,43
At the subsidiary Habitasul Florestal S.A., the dividends approved related to 2015, of
R$ 15,734 (R$ 19,159 in 2014), were paid in cash.
During 2015, the Company made an advance for future capital increase in the
subsidiary Habitasul Florestal S.A. in the amount of R$ 20,978.
In 2015, Iraflor Comércio de Madeiras Ltda. received a capital contribution from its
parent company Celulose Irani S.A., amounting to R$ 25,118, which was paid up
through the transfer of forest assets (R$ 57,648 in 2014, which was paid up through the
transfer of forest assets amounting to R$ 57,644 and R$ 4 in cash).
At the subsidiary Iraflor Comércio de Madeiras Ltda., the dividends approved related to
2015, of R$ 522, were paid in cash (R$ 21,975 in 2014).

13. INVESTMENT PROPERTIES
Parent
Land Buildings Total
At December 31, 2014
Opening balance - - -
Merger of São Roberto 16.267 - 16.267
Merger of Irani Trading 160 3.927 4.087
Net book value 16.427 3.927 20.354
Cost 16.427 4.403 20.830
Accumulated depreciation - (476) (476)
Net book value 16.427 3.927 20.354
At December 31, 2015
Opening balance 16.427 3.927 20.354
Purchases 6.926 8.299 15.225
Disposals (72) - (72)
Depreciation - (175) (175)
Net book value 23.281 12.051 35.332
Cost 23.281 12.702 35.983
Accumulated depreciation - (651) (651)
Net book value 23.281 12.051 35.332
Consolidated
Land Buildings Total
At December 31, 2014
Opening balance - - -
Merger of Irani Trading 160 3.927 4.087
Net book value 160 3.927 4.087
Cost 160 4.403 4.563
Accumulated depreciation - (476) (476)
Net book value 160 3.927 4.087
At December 31, 2015
Opening balance 160 3.927 4.087
Purchases 6.926 8.299 15.225
Depreciation - (175) (175)
Net book value 7.086 12.051 19.137
Cost 7.086 12.702 19.788
Accumulated depreciation - (651) (651)
Net book value 7.086 12.051 19.137

Land
Refers mainly to land held by the parent company for the future construction of wind
farms in the State of Rio Grande do Sul, recognized at cost of acquisition. The project
for the implementation of wind farms is currently in the evaluation phase, through the
subsidiary Irani Geração de Energia Sustentável Ltda.
At the meeting held on December 18, 2015, the Board of Directors approved the
purchase of land where the headquarters of Koch Metalúrgica S.A. are located, for R$
6,926. The land, in the municipality of Cachoeirinha, State of Rio Grande do Sul, has a
total area of 67,957 m² and will possibly be used for the implementation of a packaging
plant in the future.
Buildings
Refer to the buildings located in the town of Rio Negrinho, State of Santa Catarina,
with a constructed area of 25,271 m², which are rented to companies in the region and
are recorded based on net book value at the balance sheet date.
Investment properties also now include the buildings purchased together with the land
where the headquarters of Koch Metalúrgica S.A. are located, with a constructed area
of 16,339 m², amounting to R$ 8,229.
Rental income from investment properties is recognized in the statement of income.
The investment properties are stated at historical cost, and for disclosure purposes, the
Company assessed the fair value less cost to sell of these properties at R$ 53,312
(parent company) and R$ 37,118 (consolidated). The appraisals were conducted by
independent experts, who applied market evidences related to prices for recent
transactions with similar properties.

14. PROPERTY, PLANT AND EQUIPMENT AND INTANGIBLE ASSETS
a) Composition of property, plant and equipment
Parent Assets under
Buildings and Equipment Vehicles Construction in finance Leasehold
Land constructions and facilities and tractors Other (*) progress leases improvements Total
At December 31, 2014
Opening balance 123.887 32.923 326.117 651 4.419 74.424 12.949 12.741 588.111
Merger of São Roberto 74.421 33.977 11.979 386 609 6.239 55 - 127.666
Merger of Irani Trading 1.147 82.887 19 - 18 - - - 84.071
Additions - 47 36.559 2.605 671 29.445 - - 69.327
Disposals - - (1.243) (159) (27) (534) (483) - (2.446)
Transfers - 7.414 81.506 32 1.097 (90.049) - - -
Transfer to investment
properties (16.427) (3.898) (19) - (10) - - - (20.354)
Depreciation - (1.228) (35.451) (484) (1.058) - (3.369) (642) (42.232)
Net book value 183.028 152.122 419.467 3.031 5.719 19.525 9.152 12.099 804.143
Cost 183.028 201.052 762.975 5.119 14.837 19.525 28.678 16.061 1.231.275
Accumulated depreciation - (48.930) (343.508) (2.088) (9.118) - (19.526) (3.962) (427.132)
Net book value 183.028 152.122 419.467 3.031 5.719 19.525 9.152 12.099 804.143
At December 31, 2015
Opening balance 183.028 152.122 419.467 3.031 5.719 19.525 9.152 12.099 804.143
Additions - 580 7.943 539 761 33.675 - - 43.498
Disposals (1) - (518) - (24) (15) (90) - (648)
Transfers - 6.521 16.360 33 872 (23.786) - - -
Depreciation - (2.176) (48.977) (696) (2.132) - (2.845) (640) (57.466)
Net book value 183.027 157.047 394.275 2.907 5.196 29.399 6.217 11.459 789.527
Cost 183.027 208.300 786.102 5.532 14.167 29.399 28.583 16.061 1.271.171
Accumulated depreciation - (51.253) (391.827) (2.625) (8.971) - (22.366) (4.602) (481.644)
Net book value 183.027 157.047 394.275 2.907 5.196 29.399 6.217 11.459 789.527

Consolidated Assets under
Buildings and Equipment Vehicles Construction in finance Leasehold
Land constructions and facilities and tractors Other (*) progress leases improvements Total
At December 31, 2014
Opening balance 251.586 154.282 371.703 1.049 4.747 79.254 13.041 12.741 888.403
Additions 6 47 6.221 2.617 1.164 33.114 4 - 43.173
Disposals (33) - (1.310) (202) (39) (535) (507) - (2.626)
Transfers - 8.175 82.134 336 1.216 (91.861) - - -
Transfer to investment
properties (160) (3.898) (19) - (10) - - - (4.087)
Depreciation - (4.637) (39.244) (506) (990) - (3.372) (642) (49.391)
Net book value 251.399 153.969 419.485 3.294 6.088 19.972 9.166 12.099 875.472
Cost 251.399 205.574 763.001 5.454 15.390 19.972 28.718 16.061 1.305.569
Accumulated depreciation - (51.605) (343.516) (2.160) (9.302) - (19.552) (3.962) (430.097)
Net book value 251.399 153.969 419.485 3.294 6.088 19.972 9.166 12.099 875.472
At December 31, 2015
Opening balance 251.399 153.969 419.485 3.294 6.088 19.972 9.166 12.099 875.472
Additions 57 580 7.962 725 773 33.228 - - 43.325
Disposals (1) - (518) - (24) (15) (90) - (648)
Transfers - 6.521 16.360 33 872 (23.786) - - -
Depreciation - (2.359) (48.933) (715) (2.239) - (2.853) (640) (57.739)
Net book value 251.455 158.711 394.356 3.337 5.470 29.399 6.223 11.459 860.410
Cost 251.455 212.822 786.197 6.089 14.609 29.399 28.623 16.061 1.345.255
Accumulated depreciation - (54.111) (391.841) (2.752) (9.139) - (22.400) (4.602) (484.845)
Net book value 251.455 158.711 394.356 3.337 5.470 29.399 6.223 11.459 860.410
*Refers to assets such as furniture and fittings and IT equipment.

b) Composition of intangible assets
Parent Customer
Trademarks Goodwill Portfolio Software Total
At December 31, 2014
Opening balance - - - 1.016 1.016
Additions - - - 276 276
Merger of São Roberto S.A. 1.473 104.380 5.502 - 111.355
Amortization - - - (371) (371)
Net book value 1.473 104.380 5.502 921 112.276
Cost 1.473 104.380 5.502 7.661 119.016
Accumulated amortization - - - (6.740) (6.740)
Net book value 1.473 104.380 5.502 921 112.276
At December 31, 2015
Opening balance 1.473 104.380 5.502 921 112.276
Additions - - - 970 970
Disposals (1.473) - - (84) (1.557)
Amortization - - (792) (411) (1.203)
Net book value - 104.380 4.710 1.396 110.486
Cost - 104.380 5.502 8.547 118.429
Accumulated amortization - - (792) (7.151) (7.943)
Net book value - 104.380 4.710 1.396 110.486
Consolidated Customer
Trademarks Goodwill Portfolio Software Total
At December 31, 2014
Opening balance 1.473 104.380 6.294 1.016 113.163
Additions - - - 811 811
Amortization - - (792) (371) (1.163)
Net book value 1.473 104.380 5.502 1.456 112.811
Cost 1.473 104.380 7.081 6.621 119.555
Accumulated amortization - - (1.579) (5.165) (6.744)
Net book value 1.473 104.380 5.502 1.456 112.811
At December 31, 2015
Opening balance 1.473 104.380 5.502 1.456 112.811
Additions - - - 970 970
Disposals (1.473) - - (84) (1.557)
Amortization - - (792) (411) (1.203)
Net book value - 104.380 4.710 1.931 111.021
Cost - 104.380 7.081 7.507 118.968
Accumulated amortization - - (2.371) (5.576) (7.947)
Net book value - 104.380 4.710 1.931 111.021

c) Depreciation/amortization method
The table below shows the annual rates of depreciation/amortization based on the
economic useful lives of the assets. The rates are presented at the annual weighted
average.
12/31/2015 12/31/2014
Buildings and constructions * 2,19 2,19
Equipment and facilities ** 5,86 5,86
Furniture, fittings and IT
equipment 5,71 5,71
Vehicles and tractors 20,00 20,00
Software 20,00 20,00
Customer portfolio 11,11 11,11
* include weighted rates of leasehold improvements
** include weighted rates of finance leases
Rate - %
d) Other information
Construction in progress refers to projects for the improvement and maintenance of the
Company's production process, among which should be highlighted the technological
update of equipment for the output of the corrugator machine at the Vila Maria
packaging plant in São Paulo, intended to increase production and improve quality,
which was completed in 2015.
The Company has finance lease agreements for machinery, IT equipment and vehicles,
with purchase option clauses, negotiated at a fixed rate and with 1% of the guaranteed
residual value, payable at the end or diluted during the period of the lease. The
agreements are collateralized by the leased assets. The commitments assumed are
recorded as borrowings in current and non-current liabilities.
Leasehold improvements refer to the renovation of the Corrugated Cardboard
packaging plant in Indaiatuba – State of São Paulo, and are being depreciated on the
straight-line method, at the rate of 4% per year. The property is owned by the
companies MCFD - Administração de Imóveis Ltda. and PFC - Administração de
Imóveis Ltda. and the costs of the renovation were fully absorbed by Celulose Irani
S.A.
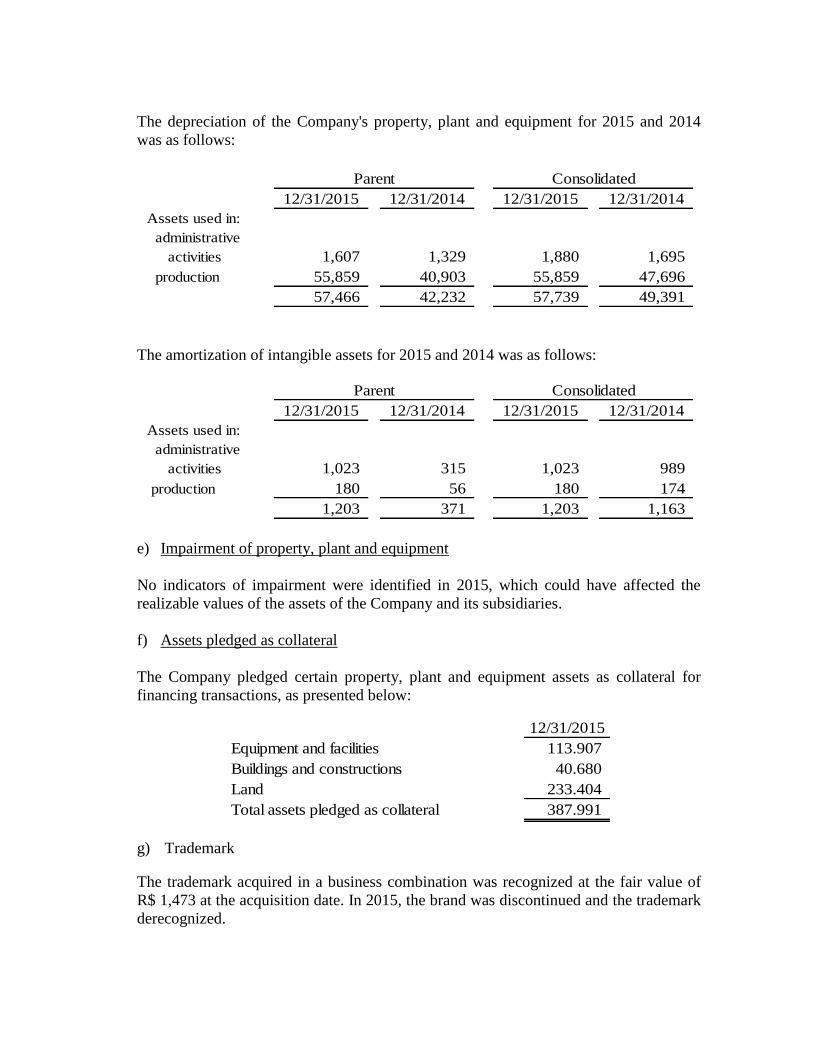
The depreciation of the Company's property, plant and equipment for 2015 and 2014
was as follows:
12/31/2015 12/31/2014 12/31/2015 12/31/2014
Assets used in:
administrative
activities 1,607 1,329 1,880 1,695
production 55,859 40,903 55,859 47,696
57,466 42,232 57,739 49,391
Parent Consolidated
The amortization of intangible assets for 2015 and 2014 was as follows:
12/31/2015 12/31/2014 12/31/2015 12/31/2014
Assets used in:
administrative
activities 1,023 315 1,023 989
production 180 56 180 174
1,203 371 1,203 1,163
Parent Consolidated
e) Impairment of property, plant and equipment
No indicators of impairment were identified in 2015, which could have affected the
realizable values of the assets of the Company and its subsidiaries.
f) Assets pledged as collateral
The Company pledged certain property, plant and equipment assets as collateral for
financing transactions, as presented below:
12/31/2015
Equipment and facilities 113.907
Buildings and constructions 40.680
Land 233.404
Total assets pledged as collateral 387.991
g) Trademark
The trademark acquired in a business combination was recognized at the fair value of
R$ 1,473 at the acquisition date. In 2015, the brand was discontinued and the trademark
derecognized.

h) Customer portfolio
The customer portfolio acquired in the business combination is recognized at the fair
value of R$ 6,617, and the amortization in 2015 amounted to R$ 792 (R$ 792 in 2014),
resulting in a net book balance of R$ 4,710. Amortization is calculated on the straight-
line basis, over the expected life of the relationship with the customer.
i) Goodwill
The goodwill arising from the business combination with São Roberto S.A., recognized
at the amount of R$ 104,380, is attributable to the expectation of future profitability.
Impairment tests for intangible assets:
At December 31, 2015, the Company assessed the impairment of the goodwill based on
its value in use, using the discounted cash flow method for the Cash-generating Unit
(CGU). The recoverable value of the CGU was based on the expected future
profitability. These calculations utilized cash flow projections based on financial
budgets approved by management, covering a six-year period and extrapolating to
perpetuity in the other periods, considering estimated growth rates.
The cash flows were discounted to present value through the application of a rate
determined by the Weighted Average Cost of Capital (WACC), which was calculated
through the Capital Asset Pricing Model (CAPM) method, considering a number of
components of borrowings, debt and own capital utilized by the Company to finance its
activities.
The main data utilized for the calculation of the discounted cash flow is presented
below:
Assumptions
Average sales prices of Packaging Paper and Corrugated
Cardboard Packaging (% of the annual growth rate) 5,5%
Gross margin (% of net income) 29,3%
Estimated growth rate 5,0%
Discount rate (WACC) 9,56%
The impairment test of the cash generating units did not identify the need for
recognizing a loss in the year.
Management believes that future changes in the sale price net of taxes may change the
recoverable value of the CGU. For sensitivity calculation purposes, management
understands that, even if the net selling price of the products falls by 5% over the next
six years of the discounted cash flow projections, the recoverable value will still remain
higher than the value in use.

15. BIOLOGICAL ASSETS
The Company's biological assets mainly comprise the planting and cultivation of pine
trees to supply raw materials for the production of pulp used in the packaging paper
production process, production of resins and sales of timber logs to third parties. All of
the Company's biological assets form a single group named "forests", measured
together at fair value on a quarterly basis. Because the harvesting of the forests planted
is carried out based on the consumption of raw materials and timber sales, and also
considering that all areas are replanted, the fair values of these biological assets are not
significantly affected at the time of harvesting.
The balance of the Company's biological assets consists of the cost of formation of the
forests and the fair value differential in relation to the formation cost. Consequently, the
balance of biological assets as a whole is recorded at fair value as follows:
12/31/2015 12/31/2014 12/31/2015 12/31/2014
Expenses incurred with formation
of biological assets 38.599 36.509 58.727 55.681
Difference in the fair value of
biological assets 54.271 64.605 202.832 225.940
92.870 101.114 261.559 281.621
Parent Consolidated
Of the total biological assets, R$ 173,212 refers to forests used as raw material for the
production of pulp and paper, located close to the pulp and paper mill in the town of
Vargem Bonita, State of Santa Catarina, where they are consumed. Of this amount, R$
126,965 refers to mature forests which are more than six years old. The remaining
amount refers to growing forests, which still need forestry treatments.
The forests are harvested mainly based on the consumption of raw materials for pulp
and paper production, and are replanted as soon as harvested, forming a renovation
cycle that meets the production demand of the plant.
The biological assets utilized for the production of resins and the sale of timber logs
totaled R$ 88,347 and are located on the coast of Rio Grande do Sul. The resin is
extracted based on the capacity of the existing forest to generate this product, and the
trees for sale of logs are extracted based on the demand for wood in the region.
a) Assumptions for recognition of fair value less costs to sell of biological assets.
The Company recognizes its biological assets at fair value based on the following
assumptions:
(i) The methodology utilized to measure the fair value of biological assets
corresponds to the projection of future cash flows, in accordance with the
projected productivity of the forests in the cutting cycles, which are determined

based on the optimization of production, considering the price changes and the
growth of the biological assets;
(ii) The discount rate used for cash flows was the Cost of Own Capital (Capital
Asset Pricing Model - CAPM). The cost of capital is estimated through an
analysis of the return targeted by investors for forest assets;
(iii) The projected productivity volumes of the forests are defined based on
stratification, according to the type of species, inputs for production planning,
as well as the age, productive potential and production cycle of the forests. This
component of projected volume corresponds to the Average Annual Increase
(IMA). Forest management alternatives are created to establish the optimum
long-term production flow which is ideal to maximize the yield of the forests.
(iv) The prices adopted for biological assets are those practiced in the last three
years, based on market research in the regions where the assets are located.
Prices are calculated in R$/cubic meter, taking into consideration the costs
incurred to bring the assets to a condition that enables their sale or
consumption;
(v) Expenditure on planting corresponds to the costs incurred by the Company in
the formation of biological assets;
(vi) The depletion of biological assets is calculated based on their average fair
value, multiplied by the volume harvested in the period;
(vii) The Company reviews the fair value of its biological assets on a quarterly basis,
which is an interval considered to be sufficient to prevent any disparity in the
fair value balance of the biological assets recorded in the interim financial
statements.
2015 2014 Impact on fair value of biological assets
Planted area (in hectares) 23.909 24.038 Assumption increases, fair value increases
Remuneration of the Company's own contributing assets - % 3,00% 3,00% Assumption increases, fair value decreases
Discount rate - Own areas - % 9,50% 8,50% Assumption increases, fair value decreases
Discount rate - Partnerships - % 10,00% 9,50% Assumption increases, fair value decreases
Net average selling price (m³) 46,00 46,00 Assumption increases, fair value increases
Average annual increase - Forests in Santa Catarina (*) 39,4 39,6 Assumption increases, fair value increases
Average annual increase - Forests in Rio Grande do Sul (*) 22,3 22,5 Assumption increases, fair value increases
Consolidated
* The Average Annual Increase (IMA) of the Pine Forests in the States of Rio Grande do Sul and Santa
Catarina is different because of the specific forest management, species and soil and climatic conditions
of each State. The forests in Santa Catarina are managed with a view to the utilization for pulp
production, whereas the forests of Rio Grande do Sul are managed for the extraction of gum resin and
subsequent sale of timber logs.
During 2015, the Company validated the assumptions and criteria utilized to determine
the fair value of its biological assets, and realized the valuation of all its biological
assets.
No other events occurred in 2015 that affected the devaluation of the biological assets,
such as rainstorms, lightning and other events that could affect the forests.
In accordance with the hierarchy of the measurement at fair value, the calculation of
biological assets is classified as Level 3 due to its complexity and structure.

Main changes
The changes for the year were as follows:
Parent Consolidated
Balance at 12/31/2013 146.638 268.725
Planting 4.338 4.908
Acquisition of forests 190 190
Depletion
Historical cost (1.115) (3.692)
Fair value (266) (17.926)
Transfer for capitalization in the
subsidiary Iraflor (57.644) -
Change in fair value 8.973 29.416
Balance at 12/31/2014 101.114 281.621
Planting 4.719 6.662
Acquisition of forests - 305
Depletion
Historical cost (779) (3.635)
Fair value (815) (16.944)
Transfer for capitalization in the
subsidiary Iraflor (25.118) -
Change in fair value 13.749 (6.450)
Balance at 12/31/2015 92.870 261.559
The depletion of biological assets in 2015 and 2014 was substantially charged to cost of production, after an initial allocation to inventories when the forests are harvested and used in the production process or sold to third parties.
In 2015, the contribution of new biological assets, amounting to R$ R$ 25,118 (R$ 57,644 in 2014), was authorized. The purpose of this transaction was to improve the management of forest assets and the raising of funds through Agribusiness Credit Right Certificates (CDCA), as mentioned in Note 16.
b) Biological assets pledged as collateral
A portion of the biological assets of the Company and its subsidiaries, totaling R$ 143,437, is pledged as collateral for financing transactions. The pledged assets represent approximately 55% of the total biological assets, equivalent to 24.4 thousand hectares of land in use, with approximately 11.5 thousand hectares of planted forests.
c) Production on third-party land
The Company has entered into non-cancellable lease agreements for the production of biological assets on third-party land, called partnerships. These agreements are effective until all planted forests in these areas are harvested, over a cycle of approximately 15 years. The amount of biological assets on third-party land represents approximately 10% of the total area with the Company's biological assets.

16. BORROWINGS
a) Composition of accounting balances
12/31/2015 12/31/2014
Current
Local currency
FINAME Fixed at 3.49% and TJLP + 4.07% 7.521 8.487
Working capital Fixed at 8.13% and CDI + 3.94% 52.815 40.832
Working capital - CDCA IPCA + 10.22% 21.910 20.675
Finance leases Fixed at 15.3% 443 886
BNDES TJLP + 3.60% 13.737 12.499
Total in local currency 96.426 83.379
Foreign currency
Advances on foreign exchange contracts Fixed at 3.90% 34.174 20.074
Banco Credit Suisse - PPE Libor + 7.50% - 750
Banco Itaú BBA - CCE Fixed at 5.80% 19.509 13.422
Banco Santander PPE Libor + 5.50% 4.392 2.992
Banco do Brasil - FINIMP Libor + 2.50% 195 1.735
Banco Citibank - FINIMP Libor + 4.09% 915 2.883
Banco Rabobank and Santander - PPE Libor + 5.95% 38.683 -
Banco LBBW - FINIMP Euribor + 1.55% 1.326 -
Total in foreign currency 99.194 41.856
Total current 195.620 125.235
Non-current
Local currency
FINAME Fixed at 3.49% and TJLP + 4.07% 13.287 20.486
Working capital Fixed at 8.13% and CDI + 3.94% 183.207 121.056
Working capital - CDCA IPCA + 10.22% 20.008 36.085
Finance leases Fixed at 15.3% 114 557
BNDES TJLP + 3.60% 39.743 44.604
Total in local currency 256.359 222.788
Foreign currency
Banco Credit Suisse - PPE Libor + 7.50% 153.052 101.331
Banco Itaú BBA - CCE Fixed at 5.80% 9.537 19.434
Banco Santander PPE Libor + 5.50% 8.640 8.816
Banco do Brasil - FINIMP Libor + 2.50% - 133
Banco Citibank - FINIMP Libor + 4.09% - 619
Banco Rabobank and Santander - PPE Libor + 5.95% 233.138 184.369
Banco LBBW - FINIMP Euribor + 1.55% 5.035 -
Total in foreign currency 409.402 314.702
Total non-current 665.761 537.490
Total 861.381 662.725
Long-term maturities: 12/31/2015 31/12/2014
2016 - 99.254
2017 209.915 159.230
2018 180.339 104.735
2019 151.993 92.718
2020 to 2024 123.514 81.553
665.761 537.490
Annual charges - %
Parent and Consolidated
Parent and Consolidated

b) Amortization schedule for funding costs
Parent and Consolidated
2016 2017 2018 2019 2020 2021 Total
In local currency
Working capital (738) (449) (269) (119) (33) - (1.608)
Working capital - CDCA (310) (108) - - - - (418)
Total in local currency (1.048) (557) (269) (119) (33) - (2.026)
In foreign currency
Banco Credit Suisse - PPE (1.058) (1.086) (831) (396) (21) - (3.392)
Banco Itaú BBA - CCE (32) (4) - - - - (36)
Banco Rabobank and Santander - PPE (415) (385) (311) (233) (150) (71) (1.564)
Banco LBBW - FINIMP (146) (81) (15) - - - (242)
Total in foreign currency (1.651) (1.556) (1.157) (629) (171) (71) (5.234)
(2.699) (2.113) (1.426) (748) (204) (71) (7.260)
c) Significant operations contracted in the year
i) Working capital:
Banco Rabobank – CCE: Export Credit Bill (CCE) contract of R$ 50
million, entered into with Banco Rabobank, with maturity in 2020,
and subject to an interest rate equivalent to the CDI variation plus
3.75% p.a. The borrowing will be repaid in nine semi-annual
installments from August 2016.
Banco Itaú BBA - CCE Export Credit Bill contract of R$ 20 million,
entered into with Banco Itaú BBA, with maturity in 2018, and subject
to an interest rate equivalent to the CDI variation plus 3.50% p.a. The
borrowing will be repaid in three semi-annual installments from
January 2018.
Banco Safra – CCE: Export Credit Bill contract of R$ 30 million,
entered into with Banco Safra, with maturity in 2019, and subject to
an interest rate equivalent to 132% of the CDI variation. The
borrowing will be repaid in 14 monthly installments and five semi-
annual installments from February 2016.
ii) Advance on Foreign Exchange Contract (ACC): ACCs amounting to US$
8.5 million (equivalent to R$ 26,333 on the contract dates), with maturities
up to August 2016 and fixed interest rates between 3.55% and 4% p.a.
iii) Banco LBBW: Special credit facilities for the import of machinery and
equipment (FINIMP): Contract of EUR 1,724 thousand, entered into with
Banco BBW, with maturity in 2020, and subject to an interest rate equivalent
to the EURIBOR variation plus 1.55% p.a. The borrowing will be repaid in
ten semi-annual installments from December, 2015.

d) Collateral
Collateral for the borrowings include sureties of the controlling companies and/or
mortgages or statutory liens on land, buildings, machinery and equipment,
biological assets (forests), commercial pledges and assignments of receivables,
amounting to approximately R$ 305,859. Other transactions have specific
guarantees, as follows:
i) For working capital - CDCA (Agribusiness Credit Rights Certificate), the
Company provided collateral securities of approximately R$ 64,642, as follows:
• Assignment of credit rights relating to Rural Producer Notes (CPRs) in favor
of the creditor;
• Mortgages on some of the Company's properties, with a total area of 3,851
hectares, in favor of the banks;
• Statutory lien on pine and eucalyptus forests existing in the mortgaged
properties owned by the issuer.
ii) For the export prepayment financing granted by Banco Credit Suisse, the
Company pledged as collateral the shares held in its subsidiary Habitasul
Florestal S.A.
iii) For the export prepayment financing from Banco Rabobank and Santander, land
and forests amounting to R$ 116,008 were pledged as collateral.
e) Restrictive Financial Covenants:
Certain financing agreements with financial institutions have restrictive covenants
requiring the maintenance of financial ratios, calculated based on the consolidated
financial statements, as shown below:
i) Working capital - CDCA
ii) Banco Itaú BBA - CCE
iii) Banco Santander Brasil - PPE
iv) Banco Rabobank and Santander - PPE
v) Banco Rabobank - CCE
Restrictive financial covenants were determined requiring compliance with certain
financial ratios, on annual bases. Non-compliance could trigger the accelerated
maturity of the debt.
a) The ratio between net debt and EBITDA over the last 12 months must not exceed:
3.65 times for the year ended December 31, 2013; 3.25 times for the year ended
December 31, 2014; and 3.00 times as from the year ended December 31, 2015.

b) The ratio between EBITDA and net finance costs over the last 12 months must not
be lower than 2.00 times for the years ending as from December 31, 2013.
c) The ratio between EBITDA and net revenue over the last 12 months must not be
lower than 17% for the years ending as from December 31, 2013.
At December 31, 2015, the Company obtained a waiver from Banco Credit Suisse due
to non-compliance with the ratio mentioned in item "a".
vi) Banco Credit Suisse - PPE
a) Net debt/EBITDA ratio of (i) 3.00 times for the quarters ended between June 30,
2012 and September 30, 2013; (ii) 3.65 times for the quarter ended December 31,
2013; (iii) 3.75 times for the quarters ended March 31, 2014 and June 30, 2014; (iv)
4.50 times for the quarter ended September 30, 2014; (v) 3.25 times for the quarter
ended December 31, 2014; (vi) 4.25 times for the quarters ended between March 31,
2015 and September 30, 2015; and (vii) 3 times for the quarters ended as from
December 31, 2015; (viii) 4.50 times for the quarters ended between March 31,
2016 and December 31, 2016; (ix) 4.25 times for the quarters ended between March
31, 2017 and September 30, 2017; and 3.00 times for the quarters ended as from
December 31, 2017.
b) EBITDA/net finance costs ratio of 2.00 times for the quarters ended from June 30,
2012 up to 2021.
At December 31, 2015, the Company obtained a waiver from Banco Credit Suisse due
to non-compliance with the ratio mentioned in item "a".
Key:
FINAME - Government Agency for Machinery and Equipment Financing
TJLP - Long-term Interest Rate
CDI - Interbank Deposit Certificate
BNDES - National Bank for Economic and Social Development
IPCA - Amplified National Consumer Price Index
LIBOR - London Interbank Offered Rate
EBITDA - Operating income (loss) plus net finance income (costs) and depreciation,
depletion and amortization.
ROL - Net operating revenue

17. DEBENTURES
a) Composition of accounting balances
Parent and Consolidated
Current Date of issue Annual charges % 12/31/2015 31/12/2014
In local currency
Simple debentures 12/04/2010 CDI + 5.00% - 13.032
Simple debentures 30/11/2012 CDI + 2.75% 12.163 12.160
Simple debentures 20/05/2013 CDI + 2.75% 9.085 19.190
Total current 21.248 44.382
Non-current
In local currency
Simple debentures 30/11/2012 CDI + 2.75% 11.913 23.740
Simple debentures 20/05/2013 CDI + 2.75% 27.878 45.998
Total non-current 39.791 69.738
Total 61.039 114.120
Long-term maturities: 12/31/2015 12/31/2014
2016 - 29.315
2017 30.656 30.829
2018 9.135 9.594
39.791 69.738
Parent and Consolidated
The debentures issued by the Company are not convertible into shares.
The debentures issued on April 12, 2010 were settled in March 2015, on the maturity
established at the inception of the transaction.
b) Schedule for amortization of funding costs
Date of issue 2016 2017 2018
In local currency
Simple debentures 11/30/12 173 87 -
Simple debentures 20/05/2013 466 290 88
Total in local currency 639 377 88
c) Collateral
i) The debentures issued on November 30, 2012 have collateral totaling R$ 56,887,
as follows:
Statutory lien on pieces of land owned by Celulose Irani in favor of the Trustee,
in conformity with the terms and conditions of the Private Instrument of
Assignment of Real Estate of Irani and other Covenants, amounting to R$
10,263 (first degree) and R$ 32,079 (second degree).
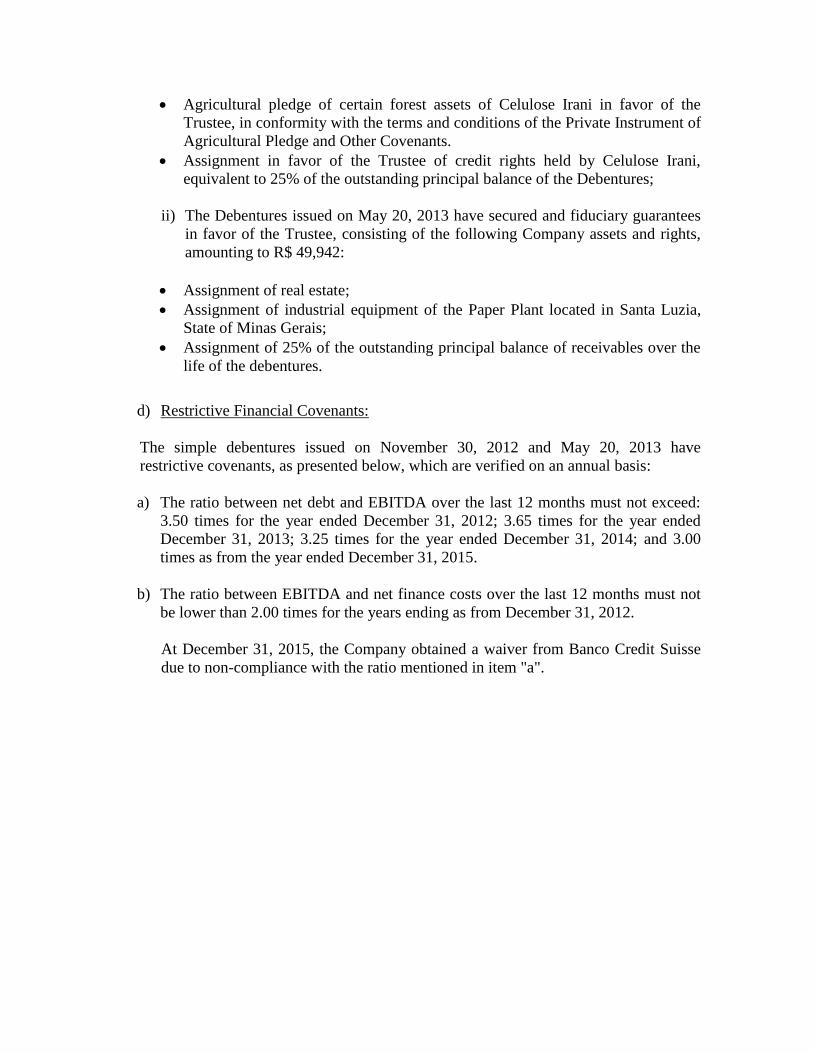
Agricultural pledge of certain forest assets of Celulose Irani in favor of the
Trustee, in conformity with the terms and conditions of the Private Instrument of
Agricultural Pledge and Other Covenants.
Assignment in favor of the Trustee of credit rights held by Celulose Irani,
equivalent to 25% of the outstanding principal balance of the Debentures;
ii) The Debentures issued on May 20, 2013 have secured and fiduciary guarantees
in favor of the Trustee, consisting of the following Company assets and rights,
amounting to R$ 49,942:
Assignment of real estate;
Assignment of industrial equipment of the Paper Plant located in Santa Luzia,
State of Minas Gerais;
Assignment of 25% of the outstanding principal balance of receivables over the
life of the debentures.
d) Restrictive Financial Covenants:
The simple debentures issued on November 30, 2012 and May 20, 2013 have
restrictive covenants, as presented below, which are verified on an annual basis:
a) The ratio between net debt and EBITDA over the last 12 months must not exceed:
3.50 times for the year ended December 31, 2012; 3.65 times for the year ended
December 31, 2013; 3.25 times for the year ended December 31, 2014; and 3.00
times as from the year ended December 31, 2015.
b) The ratio between EBITDA and net finance costs over the last 12 months must not
be lower than 2.00 times for the years ending as from December 31, 2012.
At December 31, 2015, the Company obtained a waiver from Banco Credit Suisse
due to non-compliance with the ratio mentioned in item "a".

18. TRADE PAYABLES
CURRENT LIABILITIES 12/31/2015 12/31/2014 12/31/2015 12/31/2014
Domestic suppliers
Materials 48.539 46.747 48.176 46.860
Service providers 6.143 5.818 6.305 5.895
Carriers 14.019 11.102 14.028 11.103
Related parties 16.466 15.335 - -
Other 520 1.111 520 1.111
Foreign suppliers
Materials 1.106 270 1.106 270
86.793 80.383 70.135 65.239
Parent Consolidated
19. RELATED PARTIES
Parent
12/31/2015 12/31/2014 12/31/2015 12/31/2014
Habitasul Florestal S.A. - 5.245 745 166
Management 1.154 1.093 - -
Iraflor - Com. de Madeiras Ltda - - 15.721 15.169
Management remuneration - - 716 1.446
Management profit sharing - - 17.780 17.725
Habitasul Desenvolvimentos Imobiliarios 54 - - -
Irani Geração de Energia Sustentável Ltda - - 23 159
Koch Metalúrgica S.A. - - 4.786 -
Total 1.208 6.338 39.771 34.665
Current 54 5.245 39.771 34.665
Non-current 1.154 1.093 - -
Receivables Payables

Parent
2015 2014 2015 2014
Companhia Com.de Imóveis - 5.471 - -
São Roberto S.A - 115.366 - 44.050
Irani Trading S.A. - - - 17.159
Habitasul Florestal S.A. - - 8.900 10.274
Iraflor - Com. de Madeiras Ltda - - 26.613 21.748
Druck, Mallmann, Oliveira & Advogados Associados - - 259 236
MCFD Administração de Imóveis Ltda - - 1.116 1.086
Irani Participações S/A - - 480 480
Habitasul Desenvolvimentos Imobiliarios 54 - 187 149
Koch Metalúrgica S.A. 35 - 64 -
Management remuneration - - 7.346 8.152
Management profit sharing - - 55 6.287
Total 89 120.837 45.020 109.621
Revenues Expenses
Consolidated
12/31/2015 12/31/2014 12/31/2015 12/31/2014
Habitasul Desenvolvimentos Imobiliarios 54 - - -
Koch Metalúrgica S.A. - - 4.786 -
Management remuneration - - 716 1.446
Management 1.154 1.093 - -
Management profit sharing - - 17.780 17.725
Total 1.208 1.093 23.282 19.171
Current 54 - 23.282 19.171
Non-current 1.154 1.093 - -
Receivables Payables
Consolidated
2015 2014 2015 2014
Irani Participações S/A - - 480 480
Companhia Com.de Imóveis - 5.471 - -
Druck, Mallmann, Oliveira & Advogados Associados - - 259 236
MCFD Administração de Imóveis Ltda - - 1.116 1.086
Management remuneration - - 7.402 8.228
Habitasul Desenvolvimentos Imobiliarios 54 - 187 149
Koch Metalúrgica S.A. 35 - 64 -
Management profit sharing - - 55 6.287
Total 89 5.471 9.563 16.466
Revenues Expenses
Receivables and payables with the subsidiaries Habitasul Florestal S.A. and Iraflor -
Comércio de Madeiras Ltda. refer to commercial transactions, and acquisitions of raw
materials and supply of products. The transactions were carried out in accordance with
the respective market conditions and prices.
Receivables from management refer to loans granted by the Company to its officers,
which will be settled up to 2016.
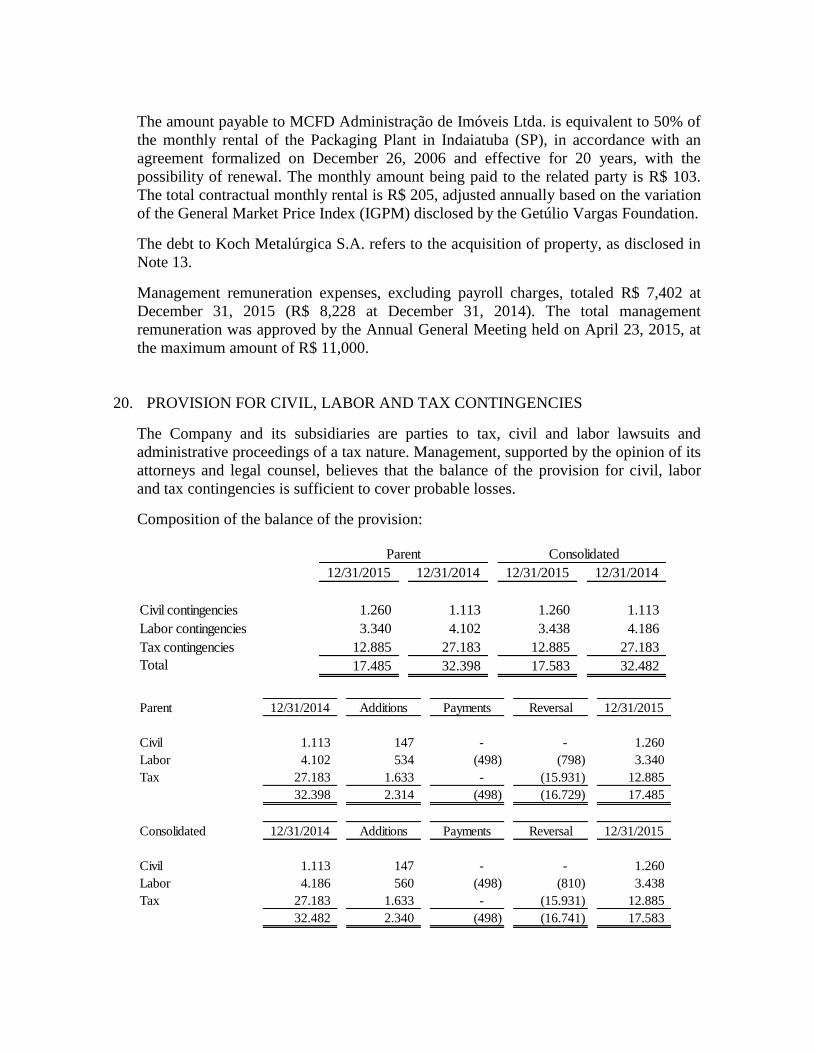
The amount payable to MCFD Administração de Imóveis Ltda. is equivalent to 50% of
the monthly rental of the Packaging Plant in Indaiatuba (SP), in accordance with an
agreement formalized on December 26, 2006 and effective for 20 years, with the
possibility of renewal. The monthly amount being paid to the related party is R$ 103.
The total contractual monthly rental is R$ 205, adjusted annually based on the variation
of the General Market Price Index (IGPM) disclosed by the Getúlio Vargas Foundation.
The debt to Koch Metalúrgica S.A. refers to the acquisition of property, as disclosed in
Note 13.
Management remuneration expenses, excluding payroll charges, totaled R$ 7,402 at
December 31, 2015 (R$ 8,228 at December 31, 2014). The total management
remuneration was approved by the Annual General Meeting held on April 23, 2015, at
the maximum amount of R$ 11,000.
20. PROVISION FOR CIVIL, LABOR AND TAX CONTINGENCIES
The Company and its subsidiaries are parties to tax, civil and labor lawsuits and
administrative proceedings of a tax nature. Management, supported by the opinion of its
attorneys and legal counsel, believes that the balance of the provision for civil, labor
and tax contingencies is sufficient to cover probable losses.
Composition of the balance of the provision:
12/31/2015 12/31/2014 12/31/2015 12/31/2014
Civil contingencies 1.260 1.113 1.260 1.113
Labor contingencies 3.340 4.102 3.438 4.186
Tax contingencies 12.885 27.183 12.885 27.183
Total 17.485 32.398 17.583 32.482
Parent Consolidated
Parent 12/31/2014 Additions Payments Reversal 12/31/2015
Civil 1.113 147 - - 1.260
Labor 4.102 534 (498) (798) 3.340
Tax 27.183 1.633 - (15.931) 12.885
32.398 2.314 (498) (16.729) 17.485
Consolidated 12/31/2014 Additions Payments Reversal 12/31/2015
Civil 1.113 147 - - 1.260
Labor 4.186 560 (498) (810) 3.438
Tax 27.183 1.633 - (15.931) 12.885
32.482 2.340 (498) (16.741) 17.583
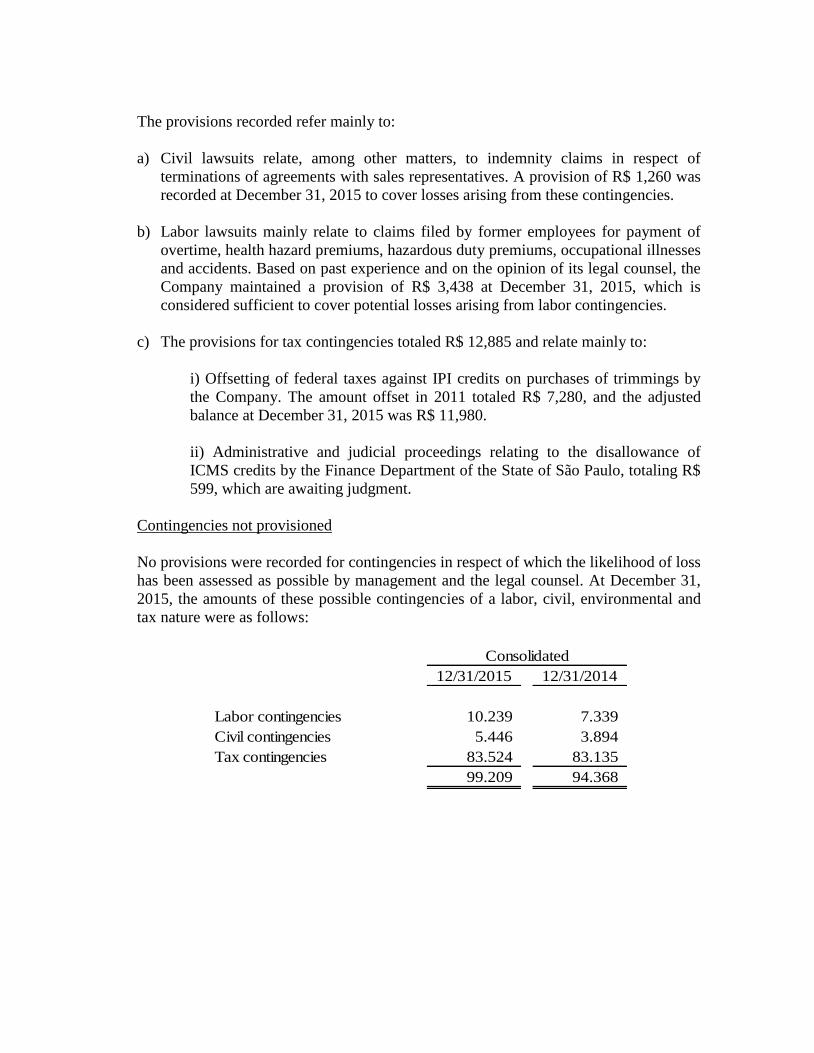
The provisions recorded refer mainly to:
a) Civil lawsuits relate, among other matters, to indemnity claims in respect of
terminations of agreements with sales representatives. A provision of R$ 1,260 was
recorded at December 31, 2015 to cover losses arising from these contingencies.
b) Labor lawsuits mainly relate to claims filed by former employees for payment of
overtime, health hazard premiums, hazardous duty premiums, occupational illnesses
and accidents. Based on past experience and on the opinion of its legal counsel, the
Company maintained a provision of R$ 3,438 at December 31, 2015, which is
considered sufficient to cover potential losses arising from labor contingencies.
c) The provisions for tax contingencies totaled R$ 12,885 and relate mainly to:
i) Offsetting of federal taxes against IPI credits on purchases of trimmings by
the Company. The amount offset in 2011 totaled R$ 7,280, and the adjusted
balance at December 31, 2015 was R$ 11,980.
ii) Administrative and judicial proceedings relating to the disallowance of
ICMS credits by the Finance Department of the State of São Paulo, totaling R$
599, which are awaiting judgment.
Contingencies not provisioned
No provisions were recorded for contingencies in respect of which the likelihood of loss
has been assessed as possible by management and the legal counsel. At December 31,
2015, the amounts of these possible contingencies of a labor, civil, environmental and
tax nature were as follows:
12/31/2015 12/31/2014
Labor contingencies 10.239 7.339
Civil contingencies 5.446 3.894
Tax contingencies 83.524 83.135
99.209 94.368
Consolidated

Labor contingencies:
The labor lawsuits assessed by management and the legal counsel as involving possible
losses total R$ 10,239 and refer mainly to indemnity claims (hazardous duty premiums,
health hazard premiums, overtime, salary premiums, damages and losses arising from
occupational accidents). Management expects a favorable outcome for these lawsuits,
which are currently at different court levels.
Civil contingencies:
The civil lawsuits classified by management and its legal counsel as possible losses
total R$ 5,446 and primarily include indemnity claims, which are currently at different
court levels and for which management expects a favorable outcome.
Tax contingencies:
The tax lawsuits assessed by management and its legal counsel as involving possible
losses total R$ 83,524 and mainly include the following:
Administrative proceeding 10925.000172/2003-66, related to a tax assessment
notice for an alleged irregularity in the offsetting of IPI credits, amounting to R$
9,921 at December 31, 2015. This proceeding is currently awaiting a decision on
the Special Appeal filed by the Company at the Taxpayers' Council.
Tax Collection Lawsuit 2004.72.03.001555-8, filed by the National Institute of
Social Security (INSS), with respect to a Debt Assessment Notice referring to the
payment of social security contributions on the gross revenue from the sale of the
production of agro-industrial companies, amounting to R$ 4,964 at December 31,
2015. The lawsuit has been suspended by court decision and is awaiting judgment
of the Action for Annulment 2005.71.00.002527-8.
Administrative Proceedings 11080.013972/2007-12 and 11080.013973/2007-67,
amounting to R$ 5,231 at December 31, 2015, related to tax assessments for PIS
and COFINS, originating from an alleged undue tax credit. The Company has
challenged these assessments at the administrative level and is awaiting judgment
of the Voluntary Appeals.
Administrative Proceedings 11080.014746/2008-30 and 11080.014747/2008-84,
amounting to R$ 2,757 at December 31, 2015, related to tax assessments for IRPJ
and CSLL, originating from an alleged undue tax credit. The Company has
challenged these assessments at the administrative level and is awaiting judgment
of the Special Appeals.
Administrative Proceedings 11080.009902/2006-89 and 11080.009904/2006-88,
related to federal taxes offset against presumed IPI credits on exports, which were

allegedly miscalculated. The restated amount involved was R$ 5,881 at December
31, 2015. The Company has challenged these assessments at the administrative
level and is awaiting a decision on the appeals filed at the Taxpayers' Council.
Administrative Proceeding 11080.009905/2006-12, with a restated amount of R$
4,413 at December 30, 2015, relating to federal taxes offset against presumed IPI
credits on exports, in respect of which an unappeasable decision had already been
rendered at the administrative level. The Company is currently awaiting the
formalization of the collection process to begin its judicial dispute.
Administrative and judicial proceedings referring to assessments by the State of
Santa Catarina for alleged undue claims for ICMS tax credits on the purchase of
materials used in the manufacturing units located in this state, which amounted to
R$ 38,301 at December 31, 2015. The Company is challenging these tax
assessments at the administrative and judicial levels.
Administrative Proceeding 11080.730311/2014-84, with a restated amount of R$
9,743 at December 31, 2015, referring to the allegation by the Brazilian Federal
Revenue Service (RFB) that IRANI failed to recognize income from the use of
PF/BCN established by Law 11,941/09. The Company is currently awaiting the
decision on the objection filed on December 8, 2014.
21. EQUITY
a) Share capital
The Company's share capital at December 31, 2015 was R$ 161,895 (R$ 151,895 at
December 31, 2014), represented by 153,909,975 common shares and 12,810,260
preferred shares, totaling 166,720,235 shares, without par value. The holders of
preferred shares are entitled to: dividends under the same conditions as those for
common shares; priority in the reimbursement of capital, without a premium, in the
event of liquidation of the Company, and 100% Tag Along rights. The Company can
issue preferred shares, without par value and without voting rights, up to the limit of 2/3
of the Company's total shares, and increase existing share types or classes without
maintaining the proportion among the shares of each type or class.
The Extraordinary General Meeting held on April 23, 2015 approved a proposal for an
increase in the Company's share capital, through the capitalization of the legal reserve,
in the amount of R$ 2,829, and the profit retention reserve, in the amount of R$ 7,171,
totaling R$ 10,000, thereby increasing the Company's share capital from R$ 151,895 to
R$ 161,895, without the issue of new shares.

b) Treasury shares
Number of
shares Value
Number of
shares Value
i) Share buyback plan Common 24.000 30 24.000 30
ii) Right of withdrawal Preferred 2.352.100 6.804 2.352.100 6.804
2.376.100 6.834 2.376.100 6.834
Parent
12/31/2015
Parent
12/31/2014
i) The objective of the share buyback plan was to maximize the value of the shares for
stockholders. This program was concluded within 365 days, on November 23, 2011.
ii) Right of withdrawal: the shares acquired suffered changes in relation to the
advantages attributed to the Company's preferred shares, as approved at the Annual and
Extraordinary General Meeting held on April 19, 2012. Dissenting holders of preferred
shares had the right to withdraw from the Company and receive a reimbursement for
their shares, based on the equity value recorded in the balance sheet at December 31,
2011.
The Company's management will in due course propose the allocation of the treasury
shares, or their cancellation.
c) Share-based payment
In 2013, the Company realized a share-based remuneration program, called the First
Stock Option Plan Program (Program I), settled with its own shares, under which the
Company received services from employees as consideration for equity instruments
(stock options) of the Company.
The stock options were granted to management and certain employees, in accordance
with the decision of the Board of Directors on May 9, 2012, approved at the
Extraordinary General Meeting held on May 25, 2012. The options were exercised from
April 1 to April 30, 2013. The Company has no legal or constructive obligation to
repurchase or settle the options in cash.
The options exercised by the participants totaled 1,612,040 shares, at the average
exercise price of R$ 1.26 per share.
d) Profit for the year
In accordance with Art.202 of Law 6,404/1976, the stockholders are entitled to
minimum and mandatory dividends. In accordance with the Company's bylaws,
stockholders are entitled to a minimum mandatory dividend of 25% of the profit
computed after the offset of any accumulated deficit, transfer to the legal reserve and

allocation to the tax incentive reserve. Dividends credited in 2015, referring to profit for
the year, amounted to R$ 3,343.
The calculation of dividends and the balance of dividends payable are as follows:
2015 2014
Profit for the year 495 56.579
(-) Legal reserve (25) (2.829)
Tax Incentives Reserve (470) (4.520)
Realized revenue reserve - biological assets 4.068 4.394
Realized revenue reserve - biological assets (subsidiaries) 257 98
Realization - deemed cost 9.048 8.101
Realization - deemed cost (subsidiaries) - 846
Base profit for distribution of dividends 13.373 62.669
Mandatory minimum dividend 3.343 15.667
Prepaid dividends 4.950 3.000
Balance of dividends payable - 12.667
Total dividends per common share (R$ per share) 0,030120 0,095332
Total dividends per preferred share (R$ per share) 0,030120 0,095332
The Company adds to the base for distribution of dividends, the realizations of the
reserve of biological assets and the reserve for carrying value adjustments.
On August 20, 2015, the Board of Directors approved, pursuant to the sole paragraph of
Article 29 of the Company's bylaws, the payment of interim dividends based on the
balance sheet prepared at June 30, 2015, totaling R$ 3,720, corresponding to R$
0.0226354 per common and preferred share.
On November 18, 2015, the Board of Directors approved, pursuant to the sole
paragraph of Article 29 of the Company's bylaws, the payment of interim dividends
based on the balance sheet prepared at September 30, 2015, totaling R$ 1,230,
corresponding to R$ 0.0074843 per common and preferred share.
The dividends distributed in advance based on the interim balance sheets were higher
than the minimum mandatory dividend computed at the end of 2015. Management
believes that as all stockholders received the dividends and the amount involved was
not significant, there was neither prejudice to the stockholders, nor an impact on the
Company's liquidity.

e) Revenue reserve
The revenue reserves comprise: i) legal reserve, ii) biological assets reserve, iii) profit
retention reserve, and iv) tax incentives reserve.
i) In conformity with the Company's bylaws, 5% of the annual profit is transferred to
the legal reserve, which can be used to offset losses or increase capital.
ii) The biological assets reserve was constituted because the Company measured its
biological assets at fair value in the opening balance sheet on the first-time adoption
of IFRS. The creation of this statutory reserve was approved at the Extraordinary
General Meeting held on February 29, 2012, when the amount previously recognized
in the unrealized profits reserve was transferred to this account.
iii) The profit retention reserve comprises the remaining profits after the offsetting of
losses and the transfer to the legal reserve, as well as the distribution of dividends.
The respective resources will be allocated to investments in property, plant and
equipment previously approved by the Board of Directors, or may be distributed in
the future, if approved by the Annual General Meeting. Certain agreements with
creditors contain restrictive clauses relating to the distribution of dividends exceeding
the minimum mandatory dividend.
iv) The tax incentives reserve was constituted by the portion of profit arising from
government grants for investments, as disclosed in items (ii) and (iii) of Note 31, and
was not included in the mandatory dividend calculation basis.
f) Carrying value adjustments
The carrying value adjustments account was constituted when the Company measured
its property, plant and equipment (land, machinery and buildings) at deemed cost in the
opening balance sheet, on the first-time adoption of IFRS. The realization of the
reserve will occur as the related deemed cost is depreciated, at which time the related
amounts will also be adjusted in the basis for calculating dividends. The balance at
December 31, 2015, net of tax effects, represented a gain of R$ 218,022 (R$ 227,069 at
December 31, 2014).
The effects of the financial instruments designated as cash flow hedges, net of tax,
were also recorded in carrying value adjustments, and corresponded to a loss of
R$ 144,993 at December 31, 2015 (R$ 48,452 at December 31, 2014).

The changes in the carrying value adjustments account were as follows:
Consolidated
At December 31, 2013 219.094
Cash flow hedges (31.530)
Realization - deemed cost (8.101)
Realization - deemed cost (subsidiaries) (846)
At December 31, 2014 178.617
Cash flow hedges (96.541)
Realization - deemed cost (9.047)
At December 31, 2015 73.029
22. EARNINGS PER SHARE
Basic and diluted earnings per share are calculated by dividing the profit from
continuing and discontinued operations attributable to the Company's stockholders by
the weighted average number of shares outstanding during the year. The shares are not
subject to the effects of potential dilution, such as debt convertible into shares.
Consequently, the diluted earnings per share is equal to the basic earnings per share.
i) Basic and diluted earnings from continuing operations
Common Preferred ON and PN shares
shares (ON) shares (PN) Total
Weighted average number of shares 153.885.975 10.458.160 164.344.135
Profit for the year attributable to each
type of share 464 31 495
Basic and diluted earnings per share - R$ 0,0030 0,0030
Common Preferred ON and PN shares
shares (ON) shares (PN) Total
Weighted average number of shares 153.885.975 10.458.160 164.344.135
Profit for the year attributable to each
type of share 52.979 3.600 56.579
Basic and diluted earnings per share - R$ 0,3443 0,3443
2015
2014

23. NET SALES REVENUE
The Company's net sales revenue is comprised as follows:
2015 2014 2015 2014
Gross sales revenue 984.594 858.449 997.652 959.405
Taxes on sales (229.204) (185.907) (230.604) (213.239)
Returns (8.267) (6.195) (8.290) (7.667)
Net sales revenue 747.123 666.347 758.758 738.499
Parent Consolidated
24. COSTS AND EXPENSES BY NATURE
Costs and expenses by nature are as follows:
2015 2014 2015 2014
Fixed and variable costs (raw and consumable materials) (388.259) (414.315) (365.549) (394.338)
Personnel costs (118.831) (86.716) (118.831) (113.073)
Change in the fair value of biological assets 13.749 8.973 (6.450) 29.416
Depreciation, amortization and depletion (60.438) (43.984) (79.696) (72.172)
Freight (43.897) (24.876) (43.897) (33.891)
Outsourced services (14.015) (17.320) (14.015) (18.289)
Selling expenses (36.052) (30.707) (36.052) (37.456)
Total costs and expenses by nature (647.743) (608.945) (664.490) (639.803)
Costs of goods sold (535.478) (512.514) (530.437) (545.224)
Expenses (126.014) (105.404) (127.603) (123.995)
Change in the fair value of biological assets 13.749 8.973 (6.450) 29.416
Parent Consolidated

25. INCOME TAX AND SOCIAL CONTRIBUTION
The reconciliation of the effective tax rate is as follows:
2015 2014 2015 2014
Operating profit before taxation 288 49.233 962 28.376
Standard rate 34% 34% 34% 34%
Tax charge at the standard rate (98) (16.739) (327) (9.648)
Tax effect of permanent deductions (additions):
Equity in the results of investees (978) 18.920 - -
Subsidiaries taxed based on deemed income - - (2.209) 11.730
Income tax and social contribution on tax losses accumulated
in previous years in the subsidiary São Roberto - - - 17.007
Constitution of tax incentives reserve 2.234 1.537 2.234 1.537
Other permanent differences (951) 3.628 (165) 7.577
207 7.346 (467) 28.203
Current income tax and social contribution (2) - (1.360) (400)
Deferred income tax and social contribution 209 7.346 893 28.603
- - - -
- - - -
Effective rate - % (71,9) (14,9) 48,5 (99,4)
Parent Consolidated
On May 13, 2014, Provisional Measure (MP) 627 was converted into Law 12,973/14
and revoked the Transitional Tax System (RTT), among other measures. It is effective
as from 2015, but could be adopted early in 2014. After a detailed study, the Company
opted for the early adoption of the effects of Law 12,973/14 in 2014. The main impact
of this early adoption was related to the dividends calculated based on the profits
recorded up to the end of 2013, which were tax exempt.

26. FINANCE INCOME AND COSTS
2015 2014 2015 2014
Finance income
Income from financial investments 9.734 10.539 12.666 11.284
Interest 2.403 3.789 2.404 4.584
Discounts obtained 270 303 273 351
12.407 14.631 15.343 16.219
Foreign exchange variations
Foreign exchange gains 19.885 8.938 19.885 8.940
Foreign exchange losses (36.958) (12.097) (36.958) (12.109)
Net foreign exchange variations (17.073) (3.159) (17.073) (3.169)
Finance costs
Interest (87.657) (68.757) (87.663) (82.080)
Discounts granted (1.937) (1.186) (1.937) (1.344)
Bank charges and expenses (65) (102) (66) (110)
Other (1.170) (661) (1.177) (855)
(90.829) (70.706) (90.843) (84.389)
Net finance costs (95.495) (59.234) (92.573) (71.339)
Parent Consolidated
27. INSURANCE
Insurance coverage is determined according to the nature of the risks involving the
assets, and is considered sufficient to cover possible losses arising from damages. At
December 31, 2015, the Company had corporate insurance against fire, lightning,
explosions, electrical damage and wind storm damage to plants, residential locations
and offices, as well as general civil liability coverage and coverage of liabilities of
directors and officers (D&O), amounting to a total of R$ 576,240. The Company also
contracted group life insurance for employees with a minimum coverage of 24 times the
employee's salary, or a maximum coverage of R$ 500, in addition to insurance for the
fleet of vehicles with coverage at market value.
With respect to forests, the Company assessed the existing risks and elected not to
contract insurance coverage because the preventive measures against fire and other risks
to the forests have proven efficient. Management understands that the risk management
structure related to the forests is appropriate to ensure the continuity of the Company's
activities.
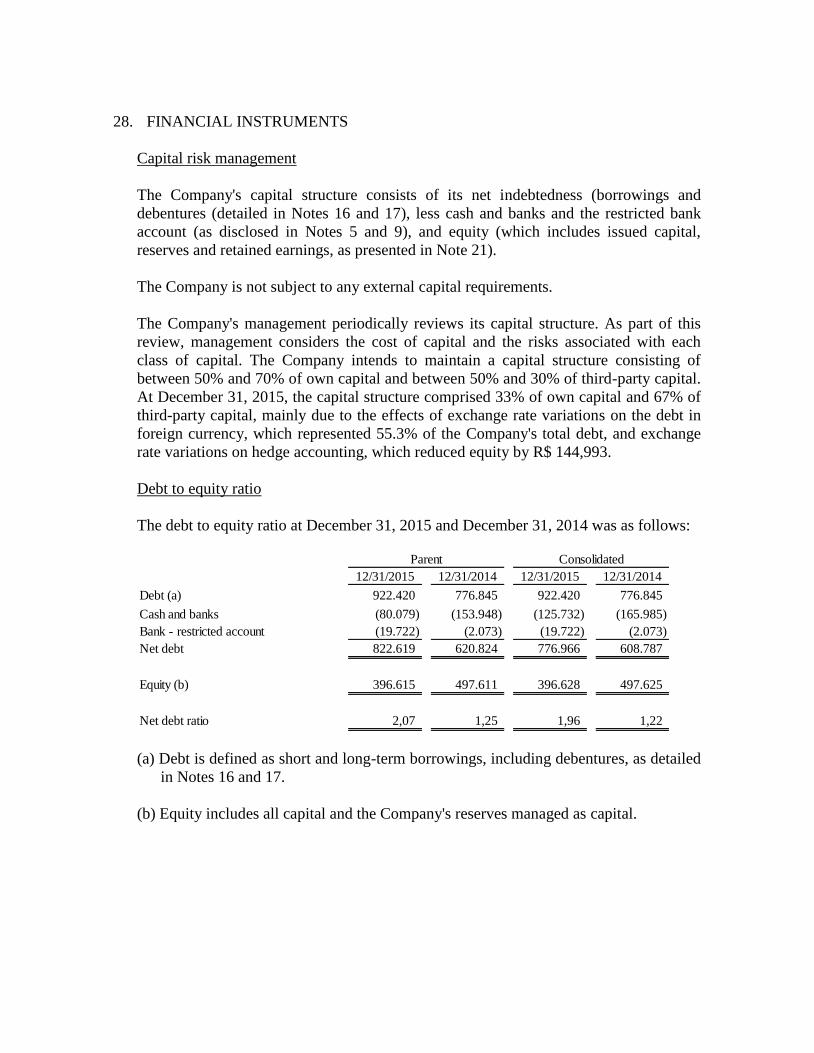
28. FINANCIAL INSTRUMENTS
Capital risk management
The Company's capital structure consists of its net indebtedness (borrowings and
debentures (detailed in Notes 16 and 17), less cash and banks and the restricted bank
account (as disclosed in Notes 5 and 9), and equity (which includes issued capital,
reserves and retained earnings, as presented in Note 21).
The Company is not subject to any external capital requirements.
The Company's management periodically reviews its capital structure. As part of this
review, management considers the cost of capital and the risks associated with each
class of capital. The Company intends to maintain a capital structure consisting of
between 50% and 70% of own capital and between 50% and 30% of third-party capital.
At December 31, 2015, the capital structure comprised 33% of own capital and 67% of
third-party capital, mainly due to the effects of exchange rate variations on the debt in
foreign currency, which represented 55.3% of the Company's total debt, and exchange
rate variations on hedge accounting, which reduced equity by R$ 144,993.
Debt to equity ratio
The debt to equity ratio at December 31, 2015 and December 31, 2014 was as follows:
12/31/2015 12/31/2014 12/31/2015 12/31/2014
Debt (a) 922.420 776.845 922.420 776.845
Cash and banks (80.079) (153.948) (125.732) (165.985)
Bank - restricted account (19.722) (2.073) (19.722) (2.073)
Net debt 822.619 620.824 776.966 608.787
Equity (b) 396.615 497.611 396.628 497.625
Net debt ratio 2,07 1,25 1,96 1,22
Parent Consolidated
(a) Debt is defined as short and long-term borrowings, including debentures, as detailed
in Notes 16 and 17.
(b) Equity includes all capital and the Company's reserves managed as capital.

Categories of financial instruments
Financial assets 12/31/2015 12/31/2014 12/31/2015 12/31/2014
Investments held to maturity 19.722 2.073 19.722 2.073
Bank - restricted account 19.722 2.073 19.722 2.073
Loans and receivables
Cash and banks 80.079 153.948 125.732 165.985
Trade receivables 135.277 127.605 135.854 129.922
Other receivables 31.578 20.685 31.625 20.730
Financial liabilities
Amortized cost
Borrowings 861.381 662.725 861.381 662.725
Debentures 61.039 114.120 61.039 114.120
Trade payables 86.793 80.383 70.135 65.239
Parent Consolidated
Financial risk factors
The Company is exposed to a variety of financial risks: market risk (including exchange
rate risk and interest rate risk), credit risk and liquidity risk.
In order to provide a framework for its financial management, the Company has
maintained in effect, since 2010, a Financial Management Policy that determines rules
and defines guidelines for the use of financial instruments.
The Company does not enter into derivative transactions or transactions involving other
financial assets for speculative purposes. The derivative instruments currently in effect
were contracted to hedge the obligations arising from the Company's borrowings in
foreign currencies or exports and were approved by the Board of Directors.
Foreign exchange rate risk
The Company has transactions exposed to fluctuations in the exchange rates of foreign
currencies. At December 31, 2015 and December 31, 2014, these transactions resulted
in a net liability exposure, as shown in the table below.
As most of the borrowings in foreign currency is repayable in the long-term, the
Company hedges the net foreign exchange exposure with the equivalent of 44 months
of exports, based on the average of exports realized in 2015, and 60 months of exports,
based on the average exports carried out in 2014.

12/31/2015 12/31/2014 12/31/2015 12/31/2014
Accounts receivable 19.405 11.245 19.405 11.245
Bank - restricted account 19.722 2.073 19.722 2.073
Advances from customers (443) (419) (443) (419)
Trade payables (1.106) (270) (1.106) (270)
Borrowings (508.596) (356.558) (508.596) (356.558)
Net exposure (471.018) (343.929) (471.018) (343.929)
Parent Consolidated
The Company identified the main risk factors that could generate losses to its
operations in connection with financial instruments. Accordingly, a sensitivity analysis
was developed, as determined by CVM Instruction 475, which requires the presentation
of two scenarios with deteriorations of 25% and 50% in the risk variable considered, in
addition to a base scenario. These scenarios could impact the Company's results and
equity, as described below:
1 – Base scenario: for the definition of the base scenario, the U.S. dollar quotation
utilized by the Company accompanied the future market projections of BMF&Bovespa
for the next reporting date (March 31, 2016).
2 – Adverse scenario: 25% deterioration in the foreign exchange rate compared to that
at March 31, 2016.
3 – Remote scenario: 50% deterioration in the foreign exchange rate compared to that at
March 31, 2016.
Base scenario Adverse scenario Remote scenario
Transaction Balance at 12/31/2015 Gain (loss) Gain (loss) Gain (loss)
US$ Rate R$ Rate R$ Rate R$
Assets
Trade receivables and Bank - restricted
account 10.020 4,05 1.435 5,06 11.575 6,07 21.713
Liabilities
Trade payables and advances from
customers (397) 4,05 (57) 5,06 (459) 6,07 (860)
Borrowings (130.249) 4,05 (18.649) 5,06 (150.461) 6,07 (282.250)
Net effect (17.271) (139.345) (261.397)
This sensitivity analysis is intended to measure the impact of changes in foreign
exchange market variables on each financial instrument of the Company. The balances
at December 31, 2015 were used as a basis for the projection of the future balances. The
actual behavior of debt balances and derivative instruments will depend on the
respective contracts, whereas balances receivable and payable could fluctuate due to the
normal activities of the Company and its subsidiaries. The settlement of transactions
involving these estimates could result in amounts that differ from those estimated, due
to the subjectivity of the process utilized in the preparation of these analyses. The
Company tries to maintain the level of its borrowings and derivative transactions
exposed to foreign exchange changes with annual net payments equivalent to or below
the receipts from its exports. Consequently, the Company seeks to hedge its cash flow

against foreign currency risks, and the effects of the above scenarios, if they
materialize, are not expected to generate material impacts on the cash flow.
Interest rate risk
The Company may be affected by adverse changes in interest rates. This exposure to
interest rate risk relates primarily to changes in market interest rates that affect the
Company's assets and liabilities indexed to the TJLP (Long-term interest rate of
BNDES), CDI (Interbank Deposit Certificate), SELIC (Official Interest Rate), LIBOR
(London Interbank Offered Rate) or IPCA (Amplified National Consumer Price Index).
The sensitivity analysis calculated for the base, adverse and remote scenarios on the
borrowings subject to floating interest rates is as follows:
1 – Base scenario: maintenance of the CDI and TJLP interest rates for the next
reporting date (March 31, 2016). These estimates were based on future market
projections of BMF&Bovespa for the CDI and for the TJLP extracted from BNDES.
2 – Adverse scenario: 25% adjustment of interest rates compared to the level at March
31, 2016.
3 – Remote scenario: 50% adjustment of interest rates compared to the level at March
31, 2016.
Transaction
Index
Balance at
12/31/2015
Rate (%)
p.a. R$
Rate (%)
p.a. R$
Rate (%)
p.a. R$
Cash and cash equivalents
Bank Deposit Certificates (CDB) CDI 122.171 14,18% 59 17,73% 4.259 21,27% 8.459
Funding
Working capital CDI (181.121) 14,18% (104) 17,73% (7.503) 21,27% (14.902)
Debentures CDI (62.143) 14,18% (32) 17,73% (2.295) 21,27% (4.559)
BNDES TJLP (53.480) 7,50% (535) 9,38% (1.538) 11,25% (2.540)
FINAME TJLP (3.281) 7,50% (33) 9,38% (94) 11,25% (155)
Working capital IPCA (42.336) 10,67% (483) 13,34% (1.612) 16,01% (2.741)
Financing in foreign currency Libor 3M (430.940) 0,23% 396 0,29% 144 0,35% (107)
Financing in foreign currency Libor 12M (13.033) 0,55% 40 0,68% 22 0,82% 4
Financing in foreign currency Euribor 6M (6.602) 0,15% (9) 0,19% (11) 0,23% (14)
Net effect on result (701) (8.628) (16.555)
Remote scenario
Gain (loss)
Base scenario
Gain (loss)
Adverse scenario
Gain (loss)

Fair value vs. book value
Fair value is the price which would be received for an asset sold or a liability
transferred in a transaction between parties willing to negotiate, determined on the
measurement date. The following methods and assumptions were used to estimate the
fair value:
- Cash and cash equivalents, accounts receivable and short-term accounts payable are
presented in the Company's balance sheet at fair values due to the short terms of
settlement.
- Borrowings are presented at their fair values due to the fact that these financial
instruments are subject to floating interest rates.
The fair value of financial liabilities is equivalent to their carrying amount, since the
impact of the discount to present value is not significant.
Credit risks
The Company's credit sales are managed through a credit rating and credit concession
policy. Doubtful receivables are properly covered by the provision for impairment.
Trade receivables comprise a large number of customers from different sectors and
geographical areas. A continuous credit assessment is conducted on the financial
position of receivables and, when appropriate, credit guarantee coverage is requested.
Additionally, the Company is exposed to credit risk in relation to the financial
investments that comprise its cash and cash equivalents, which are maintained to meet
the cash flow requirements, and management ensures that the investments are made in
financial institutions with which the Company has a stable relationship, by means of the
application of the financial policy that determines the allocation of cash, without
limitations, to:
i) Government securities issued by and/or with the co-obligation of the National
Treasury;
ii) CDBs in banks with a stable relationship with the Company;
iii) Debentures issued by banks with a stable relationship with the Company;
iv) Fixed-income investment funds of conservative profile.
It is forbidden to invest funds in the variable-income market.
Liquidity risk
Management monitors the liquidity level based on the expected cash flow, which
comprises cash, short-term financial investments, flows of receivables and payables,

and the repayment of borrowings. The liquidity management policy involves the
projection of cash flows in the applicable currencies, and the consideration of the level
of net assets necessary to achieve these projections, the monitoring of the liquidity
ratios of the balance sheet in relation to internal and external regulatory requirements,
and the maintenance of debt financing plans.
The table below shows the maturity ranges of the financial liabilities contracted by the
Company, where the reported amounts include the principal and fixed interest on
transactions, calculated using rates and indices in effect at December 31, 2015, and the
details on the expected maturity dates for non-derivative, undiscounted financial assets,
including interest that will be earned on these assets. The inclusion of information on
non-derivative financial assets is necessary to understand the Company's liquidity risk
management, since it is based on net assets and liabilities.
Parent
2016 2017 2018 2019 2020 onward
Liabilities
Trade payables 86.793 - - - -
Borrowings 200.176 224.362 192.942 162.691 134.215
Debentures 22.489 31.386 9.978 - -
Other liabilities 2.192 1.841 335 - -
311.650 257.589 203.255 162.691 134.215
Assets
Cash and cash equivalents 80.079 - - - -
Bank - restricted account 19.722 - - - -
Trade receivables not yet due 135.277 - - - -
Renegotiations with customers 14.838 4.829 5.713 3.123 806
Other assets 11.436 2.105 - - -
261.352 6.934 5.713 3.123 806
(50.298) (250.655) (197.542) (159.568) (133.409)

Consolidated
2016 2017 2018 2019 2020 onward
Liabilities
Trade payables 70.135 - - - -
Borrowings 200.176 224.362 192.942 162.691 134.215
Debentures 22.489 31.386 9.978 - -
Other liabilities 2.222 1.843 335 - -
295.022 257.591 203.255 162.691 134.215
Assets
Cash and cash equivalents 125.732 - - - -
Bank - restricted account 19.722 - - - -
Trade receivables not yet due 135.854 - - - -
Renegotiations with customers 14.870 4.829 5.713 3.123 806
Other assets 11.551 2.105 - - -
307.729 6.934 5.713 3.123 806
12.707 (250.657) (197.542) (159.568) (133.409)
The amounts included above for non-derivative financial assets and liabilities at
floating rates are subject to changes in the event the floating interest rates differ from
the estimates made at the end of the reporting period.
At the end of the reporting period, the Company had unused credit facilities totaling
R$ 41,417, which increase as borrowings are repaid. The Company expects to meet its
other obligations using the cash flow from operating activities and income earned on
financial assets.
Derivative financial instruments measured at fair value
The Company did not have any derivative financial instruments measured at fair value
at December 31, 2015.
Derivative financial instruments linked to borrowings (recognized directly in the
statement of income)
Considering their nature, the derivative instruments described below were considered,
together with the debt, to be a single instrument at amortized cost.
i) On March 23, 2012, the Company entered into a cash flow swap transaction with
Banco Itaú BBA to change the remuneration and risks associated with the
interest rate of the transaction entered into between the parties on the same date,
under an export Credit Bill (CCE) contract. The notional value attributed at the
contracting date was R$ 40,000 (equivalent to US$ 21,990 thousand on that
date), decreasing as the payments of the semi-annual installments are made under
the contract, until its final maturity in March 2017.

The purpose of this swap transaction was to align the transaction price and the
related maturity dates to the original transaction. The swap contract cannot be
settled separately. The Export Credit Note (CCE) contract began to be
remunerated at a fixed interest rate plus the U.S. dollar variation, and,
consequently, it is no longer exposed to the CDI variations. Considering the
characteristics of this swap contract together with the CCE contract, the
Company considers the two instruments to be a single instrument. This contract
is included in the sensitivity analysis of currency exposure disclosed in this same
note.
This transaction was approved by the Company's Board of Directors on March
23, 2012.
ii) On July 25, 2014, the Company contracted an interest rate swap with Banco
Santander, in order to change the remuneration associated with the interest rate of
the transactions entered into between the parties in January 2013, under Export
Credit Bill (CCE) and Export Credit Note (NCE) contracts, the maturity of which
would have been January 2016, but was extended to June 2017. The current fixed
rates of the contracts were changed to rates that are indexed to the TJLP.
The notional amount attributed at the contracting date was R$ 30,000, payable
only at the end of the contract term.
The purpose of this swap transaction was to align the transaction price and the
related maturity dates to the original transaction. The swap contract cannot be
settled separately.
Cash flow hedge
The Company adopted hedge accounting on May 1, 2012 for transactions contracted to
cover the foreign exchange variation risk of exports, which were classified as a cash
flow hedge.
The Company hedges the foreign exchange rate variation risk of its future cash flows
through a cash flow hedge, in which the hedging instruments are non-derivative
financial liabilities contracted by the Company. The currently effective hedged financial
instruments contracted by the Company include a PPE (Export Prepayment) contract
with Banco Credit Suisse, a CCE (Export Credit Bill) contract with Banco Itaú BBA, a
PPE contract with Banco Rabobank and Santander, and another PPE contract with
Banco Santander.
The hedged cash flows comprise the exports projected up to 2021, and the amount
recorded in equity in respect of hedge accounting amounted to R$ 144,993 at December
31, 2015 (R$ 48,452 in December 2014).

Change in cash flow hedges
12/31/2015 12/31/2014
Opening balance 73.412 25.640
Changes in cash flow hedges 158.165 50.746
Reclassification to the statement of income (11.891) (2.974)
219.686 73.412
Opening balance (24.960) (8.718)
Taxes on changes in cash flow hedges (53.776) (17.254)
Taxes on reclassification to the statement of income 4.043 1.011
(74.693) (24.960)
Closing balance 144.993 48.452
Parent and
Consolidated
Parent and
Consolidated
The Company estimates the effectiveness based on the U.S. dollar offset methodology,
according to which the variations in the fair value of the hedge instrument are compared
with the variations in the fair value of the hedged item, which should range between
80% and 125%.
The balances of variations on transactions designated as cash flow hedges are
reclassified from equity to the statement of income in the period in which the foreign
exchange rate variation which is the object of the hedge is effectively realized. The cash
flow hedge results which are effective in the offsetting of the variations of the hedged
expenses are recorded as a reduction of these expenses, decreasing or increasing the
operating result, whereas the non-effective portion is recorded as finance income or
costs for the period.
The Company did not identify any ineffectiveness in the period.
The sensitivity analysis of the hedge instruments of the cash flow hedge transactions is
considered in this same note, in the item "Foreign exchange exposure risk", together
with the other financial instruments.
29. OPERATING SEGMENTS
a) Identification criteria for operating segments
The Company has segmented its operating structure based on the manner in which
management runs the business.
Management defined the operating segments as follows: corrugated cardboard
packaging; packaging paper; RS forest and resins, described below:

Corrugated Cardboard (PO) Packaging segment: manufactures light and heavy
corrugated cardboard boxes and sheets, and has three production units: Campina da
Alegria (SC), Indaiatuba (SP), and Vila Maria (SP).
Packaging Paper Segment: manufactures low and high-grade Kraft paper and recycled
paper for the domestic and foreign markets. In addition, part of the production is sent to
the Corrugated Cardboard Packaging segment. It has two production units: Campina da
Alegria (SC) and Santa Luzia (MG).
RS Forest and Resins segment: in this segment, the Company plants pine trees for its
own consumption, sells wood and extracts resin from pines trees, which is used as raw
material for the production of tar and turpentine.
b) Consolidated information on operating segments
Corrugated
Cardboard
Packaging
Packaging
Paper
Forest RS
and Resins
Corporate/
eliminations Total
Net sales:
Domestic market 497.152 127.450 5.365 - 629.967
Foreign market - 78.828 49.963 - 128.791
Revenues from sales to third parties 497.152 206.278 55.328 - 758.758
Inter-segment revenues - 23.908 - (23.908) -
Total net sales 497.152 230.186 55.328 (23.908) 758.758
Changes in the fair value of
biological
assets - 41 (6.491) - (6.450)
Cost of goods sold (424.348) (89.996) (38.810) 22.717 (530.437)
Gross profit (loss) 72.804 140.231 10.027 (1.191) 221.871
Operating expenses (66.046) (19.196) (4.717) (38.377) (128.336)
Operating result before finance
result 6.758 121.035 5.310 (39.568) 93.535
Finance income (costs) (48.498) (45.832) 1.757 - (92.573)
Net operating result (41.740) 75.203 7.067 (39.568) 962
Total assets 585.990 757.548 154.303 160.750 1.658.591
Total liabilities 390.320 635.897 15.579 220.167 1.261.963
Equity 46.231 156.448 130.584 63.365 396.628
Consolidated
2015

Corrugated
Cardboard
Packaging
Paper for
Packaging
Forest RS
and Resins
Corporate/
eliminations Total
Net sales:
Domestic market 493.627 140.979 8.627 726 643.959
Foreign market - 53.536 41.004 - 94.540
Revenues from sales to third parties 493.627 194.515 49.631 726 738.499
Inter-segment revenues - 17.694 - (17.694) -
Total net sales 493.627 212.209 49.631 (16.968) 738.499
Changes in the fair value of
biological
assets - 12.306 17.110 - 29.416
Cost of goods sold (425.006) (94.963) (38.194) 12.939 (545.224)
Gross profit (loss) 68.621 129.552 28.547 (4.029) 222.691
Operating expenses (48.778) (14.824) (4.176) (55.198) (122.976)
Operating result before finance
result 19.843 114.728 24.371 (59.227) 99.715
Finance income (costs) (40.961) (35.368) 100 4.890 (71.339)
Net operating result (21.118) 79.360 24.471 (54.337) 28.376
Total assets 553.531 780.041 162.052 183.213 1.678.837
Total liabilities 125.461 534.155 18.036 503.560 1.181.212
Equity 56.940 302.676 131.914 6.095 497.625
Consolidated
2014
The amounts in the column "Corporate/eliminations" refer basically to the expenses of
the corporate support area, which are not apportioned between the segments, and the
eliminations refer to the adjustments of transactions between segments, which are
carried out under usual market prices and conditions.
Finance income (costs) were allocated to operating segments taking into consideration
the specific allocation of each item of finance income and costs to its segment, and the
allocation of common income and costs based on the working capital requirements of
each segment.
The information relating to income tax and social contribution is not disclosed because
the Company's management does not use this information by segment.
c) Net sales revenue
Net sales revenue in 2015 totaled R$ 758,758 (R$ 738,499 in 2014).

Net sales revenue from exports in 2015 amounted to R$ 128,791 (R$ 94,540 in 2014)
and related to various countries, as follows:
Net export % of total Net export % of total
Country revenues net revenues Country revenues net revenues
Germany 17.934 2,36% Netherlands 20.848 2,82%
Argentina 16.796 2,21% Argentina 16.931 2,29%
Saudi Arabia 16.505 2,18% Saudi Arabia 9.918 1,34%
France 11.206 1,48% France 9.678 1,31%
South Africa 7.403 0,98% South Africa 5.213 0,71%
Paraguay 6.425 0,85% Chile 4.132 0,56%
United Arab Emirates 6.014 0,79% Paraguay 4.084 0,55%
Chile 5.729 0,76% Peru 2.864 0,39%
Netherlands 4.860 0,64% Germany 2.736 0,37%
China 4.752 0,63% India 2.059 0,28%
Peru 4.393 0,58% Spain 1.932 0,26%
Japan 3.614 0,48% Bolivia 1.919 0,26%
Bolivia 3.089 0,41% Norway 1.843 0,25%
India 2.256 0,30% Kuwait 1.641 0,22%
Portugal 2.019 0,27% Portugal 1.335 0,18%
Uruguay 1.953 0,26% Japan 1.308 0,18%
Austria 1.938 0,26% China 983 0,13%
Spain 1.674 0,22% Venezuela 926 0,13%
Norway 1.630 0,21% Singapore 824 0,11%
Hong Kong 1.418 0,19% Turkey 705 0,10%
Singapore 1.357 0,18% Colombia 664 0,09%
Canada 1.141 0,15% Uruguay 521 0,07%
Other countries 4.685 0,62% Other countries 1.476 0,20%
128.791 16,97% 94.540 12,80%
2015 2014
Consolidated Consolidated
The Company's net sales revenue in 2015 in the domestic market amounted to
R$ 629,967 (R$ 643,959 in 2014).
In 2015, a single customer accounted for 6.8% of net sales in the domestic market of the
Corrugated Cardboard Packaging segment, equivalent to R$ 33,806. The Company's
other sales in the domestic and foreign markets were spread over a number of
customers, without any customer accounting for more than 10% of net sales.
30. OPERATING LEASE AGREEMENTS (PARENT COMPANY)
Rental of production plant properties
The Company had one rental agreement for a production unit at December 31, 2015, in
addition to other minor rental agreements for commercial and administrative units, all
of which were classified as operating leases, with the payments allocated to expenses on
the accrual basis over the lease period.

The rental agreement entered into on December 26, 2006, referring to the rental of the
Packaging Plant, in Indaiatuba, SP, is effective for 20 years, with a contracted monthly
rental of R$ 205, which is annually adjusted based on the IGPM variation.
During 2014, the Company had rental agreements in respect of the Vargem Bonita (SC)
and Santa Luzia (MG) production units with Irani Trading S.A. and São Roberto S.A.,
respectively, which were merged into the parent company Celulose Irani S.A. at
December 30, 2014. On the merger, the real estate properties related to the rental
agreements became the property of the Company and, consequently, the rentals ceased
to exist.
The rental expenses recognized by the parent company in 2015, net of taxes, when
applicable, were as follows:
- Rentals of production units = R$ 2,460 (R$ 24,452 in 2014).
- Rentals of commercial and administrative units = R$ 267 (R$ 257 in 2014).
The future commitments arising from these contracts totaled a minimum amount of R$
100,020 at December 31, 2015. The rentals were calculated at present value, using the
accumulated IGPM index in the last 12 months, i.e., 10.54% per year.
Up to 1 year From 1 to 5 years After 5 years Total
Future operating leases 3.015 15.591 81.414 100.020
Operating leases at present value 2.727 10.909 27.272 40.908
Lease of planting area
The Company entered into non-cancellable lease agreements for the production of
biological assets on third-party land, referred to as partnerships, for a total area of 3.3
thousand hectares, of which 2.2 thousand hectares comprised the planted area. For
certain areas, there is a lease commitment, with payments to be disbursed monthly, as
shown below.
These agreements are valid until all of the existing forests in these areas are harvested.
Non-cancellable operating lease commitments
The rentals were calculated at present value, using the accumulated IGPM index in the
last 12 months, i.e., 10.54% per year.
Up to 1 year
From 1 to 5
years
After 5
years Total
Future operating leases 500 2.559 1.244 4.303
Operating leases at present value 453 1.793 551 2.797

31. GOVERNMENT GRANTS
The Company has Value-added Tax on Sales and Services (ICMS) incentives in the
States of Santa Catarina and Minas Gerais:
i. ICMS/SC - Development Program for Companies of the State of Santa Catarina
(PRODEC): Allows 60% of the ICMS increase in the State of Santa Catarina,
calculated on an average basis (September 2006 to August 2007) prior to the
investments realized, to be deferred for payment after 48 months. This benefit is
calculated monthly and subject to the completion of the planned investments and the
maintenance of jobs, in addition to the maintenance of a regular status with the
State. These conditions are being complied with.
These incentives are subject to charges at an annual contractual rate of 4.0%. In
order to calculate the present value of these benefits, the Company used the average
rate of 16.99% as the cost of funding on the base date for credit lines with
characteristics similar to those applicable to the respective disbursements, which
would have been required in the absence of the benefits, and obtained the result of
R$ 3,797.
The benefit is effective for 14 years, from January 2009 to December 2022, or up to
the limit of R$ 55,199 of deferred ICMS. At December 31, 2015, the Company had
deferred ICMS liabilities of R$ 19,260 (net of government grants of R$ 15,463).
ii. ICMS/SC - Presumed Credit: For the purpose of enabling the expansion of the
industrial unit located in Vargem Bonita, the State of Santa Catarina grants as a
principal benefit the recording of a presumed credit, in an ICMS memorandum
account, on taxed shipments realized by the Company in the State, referring to
products manufactured with recyclable material corresponding to, at least, 40% of
the raw material cost, so that the final tax burden on the own operation is equivalent
to 2.25%. The expected investment is approximately R$ 600,000, which will be
incurred over the next five years, and will be used to expand the production capacity
of the Packaging Paper plant by 135,000 metric tons/year and of the Corrugated
Cardboard Packaging plant by 24,000 metric tons/year.
iii. ICMS/MG - Presumed Credit: For the purpose of enabling the expansion of the
industrial unit in Santa Luzia, the State of Minas Gerais grants the presumed ICMS
credit as a principal benefit, resulting in the effective payment of 2% of the amount
of the shipment of products manufactured by the Company. The total investment is
estimated at approximately R$ 220,000 and started in 2014 and is expected to be
concluded in 2017. This amount will be invested in the modernization and
expansion of the production capacity of the Paper Machine No. 7 (PM 7), and also
in the construction of a new corrugated cardboard packaging plant.

32. TRANSACTIONS NOT AFFECTING CASH
The Company carried out transactions not affecting cash relating to its investment
activities, which, therefore, were not reflected in the statement of cash flows.
During 2015, the Company made payments for purchases of property, plant and
equipment, amounting to R$ 5,223, which were directly financed by suppliers. It also
made a capital contribution of R$ 25,118 in the subsidiary Iraflor Comércio de
Madeiras Ltda., through planted forests.
During 2014, the Company made a capital contribution of R$ 57,648 through planted
forests in the subsidiary Iraflor Comércio de Madeiras Ltda. The Company also
approved the assumption of a debt, with the subsequent transfer to the Company of the
totality of the rights and obligations held by the subsidiary São Roberto S.A. under the
Issue, particularly the debt arising from the Debentures, totaling R$ 70,592.

(A free translation of the original in Portuguese)
MANAGEMENT REPORT
Dear stockholders,
The management of Celulose Irani S.A. submits to your appreciation the Company’s Management
Report and Financial Statements, together with the independent auditor’s report in respect of the
year ended December 31, 2015. The financial statements have been prepared in accordance with the
International Financial Reporting Standards (IFRS), and accounting practices adopted in Brazil,
based on the technical pronouncements issued by the Brazilian Accounting Pronouncements
Committee (CPC), which are fully convergent with IFRS, and the standards established by the
Brazilian Securities Commission (CVM).
Message to the Stockholders
Celulose Irani S.A. is an integrated company of the Paper Packaging sector, with a robust own
forest base. Its core business consists of the manufacture and sale of corrugated cardboard
packaging and packaging paper. The main raw materials in its operations are the planted pine
forests (long fiber) owned by the Company and long-fiber recycled paper (trimmings).
2015 Highlights
In 2015, the main Brazilian economic and
financial indicators deteriorated significantly.
The Gross Domestic Product (GDP) is
expected to present one of the sharpest
declines in recent years, inflation surpassed the
target ceiling, and the federal government's
primary fiscal result was the worst since the
Real Plan. Combined with the economic crisis
was the political crisis. The political and
economic uncertainties put pressure on the
foreign exchange rate, causing the U.S. dollar
to appreciate against the real at an
unprecedented level, with major impacts on
virtually all sectors of the economy. In the
international economic scenario, the
significant decreases in the prices of certain
commodities, especially of oil, as well as the
instability in the Chinese and North-American
markets, could postpone the recovery of the
Brazilian economy. The fiscal adjustment in
progress in Brazil, together with the rise in the
unemployment rate and the decline in
investments, brought pessimism to the market,
with impacts on the paper and packaging
sector. In 2015, the Brazilian Corrugated
Cardboard Association (ABPO) recorded a
drop of 3.1% in the number of metric tons of
corrugated cardboard shipped, compared to
2014.
However, despite this more challenging
scenario, the Company's cash provided by
operating activities (Adjusted EBITDA) grew
by 18.1% in 2015, compared to 2014.
In 2015, net revenue increased by 2.7%
compared to 2014, assisted by increased sales
to the foreign market as a result of the more
favorable foreign exchange rate. The foreign
market share increased by four percentage
points compared to 2014, reaching 17% of the
Company's sales at the end of 2015, whereas
the domestic market accounted for 83% of the
sales. In 2015, the Corrugated Cardboard
Packaging segment (PO) accounted for 66% of
IRANI's net revenue, whereas the Packaging
Paper and the Forest RS and Resins segments
represented 27% and 7%, respectively.

Key financial and economic indicators
KEY INDICATORS - CONSOLIDATED 4Q15 3Q15 4Q14 Variation
4Q15/3Q15
Variation 4Q15/4Q14
2015 2014 Variation
2015/2014
Economic and Financial Indicators (R$ thousand)
Net Operating Revenue 193,930
196,781
190,402
-1.4%
1.9%
758,758
738,499
2.7% Domestic Market 167,132
158,844
169,853
5.2%
-1.6%
629,967
643,959
-2.2%
Foreign Market 26,798
37,937
20,549
-29.4%
30.4%
128,791
94,540
36.2% Gross Profit (including*) 41,450
63,595
66,058
-34.8%
-37.3%
221,871
222,691
-0.4%
(*) Change in the Fair Value of Biological Assets (14,372)
783
10,966
-1935.5%
-231.1%
(6.450)
29.416
-121.9% Gross Margin 21.4%
32.3%
34.7%
-10.9 p.p.
-13.3 p.p.
29.2%
30.2%
-1.0 p.p.
Operating Result Before Taxes and Profit Sharing (15,162)
2,327
17,842
-751.6%
-185.0%
962
28,376
-96.6% Operating Margin -7.8%
1.2%
9.4%
-9.0 p.p.
-17.2 p.p.
0.1%
3.8%
-3.7 p.p.
Net Result (16,844)
3,686
27,924
-557.0%
-160.3%
495
56,579
-99.1% Net Margin -8.7%
1.9%
14.7%
-10.6 p.p.
-23.4 p.p.
0.1%
7.7%
-7.6 p.p.
Adjusted EBITDA 1 43,279
50,977
45,832
-15.1%
-5.6%
181,209
153,483
18.1% Adjusted EBITDA Margin 22.3%
25.9%
24.1%
-3.6 p.p.
-1.8 p.p.
23.9%
20.8%
3.1 p.p.
Net Debt [R$ million]
777.0
812.3
608.8
-4.3%
27.6%
777.0
608.8
27.6% Adjusted Net Debt/EBITDA (x) 4.29
4.42
3.97
-2.9%
8.1%
4.29
3.97
8.1%
Pro-forma Net Debt/ EBITDA (x) 2 3.08
3.17
n.a.
-2.8%
n.a.
3.08
n.a.
n.a.
Operating Data (in metric tons)
Corrugated Cardboard Packaging (PO)
Production/Sales
52,306
49,425
51,869
5.8%
0.8%
198,375
199,745
-0.7% Packaging Paper
Production
72,865
72,889
71,491
0.0%
1.9%
287,247
266,151
7.9% Sales
21,432
20,337
19,956
5.4%
7.4%
77,469
77,507
0.0%
RS Forest and Resins Production
1,677
2,596
1,559
-35.4%
7.6%
9,970
8,403
18.6%
Sales
1,252
2,642
1,558
-52.6%
-19.6%
9,582
8,365
14.5%
1 EBITDA (Earnings Before Interest, Taxes, Depreciation and Amortization) - see the related section in this release. 2 Excludes foreign exchange variations accounted for as hedge accounting from net debt.
The sales volume for the Corrugated Cardboard segment remained stable when compared to 2014
and totaled 198.4 thousand metric tons in 2015. The same occurred to the Packaging Paper
segment, which totaled 77.5 thousand metric tons. The Resins segment increased by 14.5%,
totaling 9.6 thousand metric tons.
The net revenue for 4Q15 was 1.9% higher than that for 4Q14, but 1.4% lower than that for 3Q15.
In the comparison between 2014 and 2015, net revenue grew by 2.7%, reaching R$ 758.8 million,
which reflects the good performance of sales in the foreign market.
The gross profit for 4Q15 decreased by 37.3% compared to 4Q14, and by 34.8% compared to
3Q15. In comparison to 2014, gross profit remained stable, and attained R$ 221.9 million.
The Company reported a loss of R$ 16.8 million for 4Q15, compared to profits of R$ 27.9 million
in 4Q14 and R$ 3.7 million in 3Q15. On an annual basis, the result for 2015 was a profit of R$
495 thousand, in comparison with a profit of R$ 56,579 thousand for 2014. The result for 2015
was adversely impacted by the change in the fair value of biological assets, as well as by the
effects of foreign exchange variations recognized in the statement of income.
In 4Q15, adjusted EBITDA amounted to R$ 43.3 million, with a 22.3% margin. In the year 2015,
adjusted EBITDA totaled R$ 181.2 million, an increase of 18.1% compared to 2014, with a 23.9%
margin, i.e., 3.1 percentage points above that for 2014.
The net debt/EBITDA ratio was 4.29 times in December 2015, compared to 3.97 times at the end
of 2014. This variation arose from the appreciation of the U.S. dollar, which increased the
Company's portion of debt denominated in U.S. dollars. Excluding from net debt the foreign
exchange variations recorded as hedge accounting, the net debt/EBITDA ratio would be 3.08
times.

The cash position at the end of 2015 was R$ 145.4 million, and 76% of the debts mature in the
long term.
BUSINESS OVERVIEW
The businesses of Celulose Irani S.A. comprise three segments and are organized in accordance with
the markets in which the Company operates. These segments are independent in their operations, but
are integrated in a balanced way, seeking to optimize the use of planted pine forests, through multiple
uses, paper recycling and the vertical integration of the businesses.
The Corrugated Cardboard Packaging (PO) Segment manufactures boxes and light and heavy
corrugated cardboard sheets, and has three packaging plants in the cities of Campina da Alegria
(State of Santa Catarina - SC), Indaiatuba (State of São Paulo - SP), and Vila Maria (SP).
The Packaging Paper Segment manufactures low- and high-grade Kraft paper and recycled paper
for the domestic and foreign markets and most of its production is destined to the Corrugated
Cardboard Packaging Segment. It has a plant with four paper machines, located in Vargem Bonita -
SC (Campina da Alegria Paper Plant), and another plant with one machine in Santa Luzia - MG
(Santa Luzia Paper Plant).
The RS Forest and Resins Segment sells wood, tar and turpentine. It manufactures forest-based
products in the State of Rio Grande do Sul, from the forest assets owned by the Company and located
in the region. The business unit called RS Balneário Pinhal - Resins, with an industrial plant located
in Balneário Pinhal, State of Rio Grande do Sul (RS), produces tar and turpentine, from the natural
resin of the pine forest, which are used in the preparation of varnishes, paints, soaps, glues and
adhesives, among others. The tar and the turpentine produced are destined mainly to the foreign
market.
Subsidiaries
Celulose Irani S.A. has the following wholly-owned subsidiaries:
Habitasul Florestal S.A., which has a forest base of 16.6 thousand hectares, of which 8.4 thousand
hectares are planted with pine trees in the State of Rio Grande do Sul, which supplies resin to
Celulose Irani S.A. and timber to customers in the region.
HGE - Geração de Energia Sustentável Ltda. and Irani Geração de Energia Sustentável Ltda.,
which operate in the generation, transmission and distribution of power sourced from wind energy,
and are currently in the pre-operating phase.
Iraflor Comércio de Madeiras Ltda., which carries out activities related to the management and
sale of timber and forests for the parent company Celulose Irani S.A. and the market.

1. OPERATING PERFORMANCE (not reviewed by independent auditors)
1.1. Corrugated Cardboard Packaging Segment (PO)
The volume in metric tons of corrugated cardboard packaging
sales in the ABPO Market decreased by 2.8% in 4Q15 compared
to 4Q14, whereas the IRANI Market remained stable in the same
period, totaling 52,306 metric tons. Compared to 3Q15, the
ABPO Market presented an increase of 1.3%, whereas the IRANI
Market increased by 5.8%. In 2015, the ABPO market declined
by 3.1% compared to 2014, whereas the IRANI market remained stable.
In metric tons, IRANI's market share in the last quarter was 6.1%, remaining stable in relation to the
5.9% recorded for 4Q14 and the 5.8% recorded for 3Q15. In the year 2015, IRANI's market share
was 5.9%, compared to 5.8% in 2014.
In 2015, the sales of boxes and sheets remained stable. The Indaiatuba (SP), Campina da Alegria
(SC) and Vila Maria (SP) Packaging Plants accounted for 39%, 30% and 31%, respectively, of the
total corrugated cardboard sold in 2015, and their entire production was allocated to the domestic
market.
Sales volume (in metric tons) - Corrugated Cardboard Packaging Segment (PO)
The volume of corrugated cardboard packaging sales in square meters (m²) decreased by 3.8% in
4Q15 in the ABPO market compared to 4Q14, and increased by 1.8% compared to 3Q15. In the
comparison between the years 2015 and 2014, there was a decrease of 3.2%. In the comparison
between 4Q15 and 4Q14, the IRANI Market declined by 1.5%. In relation to 3Q15, the IRANI
Market increased by 5.1%. In the year 2015, IRANI recorded a decrease of 1.2% compared to 2014.
The IRANI market share in square meters reached 6.6% in 4Q15, remaining stable compared to the
6.5% recorded for 4Q14 and the 6.4% for 3Q15. The volume sold by IRANI in 2015 totaled 421,970
thousand m², attaining a market share of 6.6% in the year.
Share of the 2015 Revenue
Corrugated
Cardboard
Packaging
66%

Sales Volume (in square meters) - Corrugated Cardboard Packaging Sector
The production in the Indaiatuba SP Packaging Plant totaled 54,676 metric tons of boxes and 22,390
metric tons of sheets in 2015 (compared to 53,438 metric tons of boxes and 21,950 metric tons of
sheets in 2014).
The production in the Campina da Alegria SC Packaging Plant totaled 44,974 metric tons of boxes
and 14,399 metric tons of sheets in 2015 (compared to 47,946 metric tons of boxes and 13,715 metric
tons of sheets in 2014).
The production in the Vila Maria SP Packaging Plant totaled 41,575 metric tons of boxes and 20,362
metric tons of sheets in 2015 (compared to 40,872 metric tons of boxes and 21,824 metric tons of
sheets in 2014).
The average IRANI (CIF) price per metric ton remained stable in 4Q15 compared to 4Q14, and there
was a decrease of 1.0% in comparison to the prices in 3Q15. In the year, there was a positive
variation of 2.0%, as shown below:
Note on methodology: IRANI prices exclude Excise Tax (IPI) but include Social Integration Program (PIS), Social Contribution on Revenues
(COFINS) and Value-added Tax on Sales and Services (ICMS) and are adjusted based on the market mix of boxes and sheets.

1.2. Packaging Paper Segment
IRANI operates in the Packaging Paper Segment, with activities
both in the hard packaging paper market (paper for corrugated
cardboard) and the flexible packaging paper market (paper for
sacks).
The Company's total packaging paper production in 4Q15 was 1.9% higher than that for the 4Q14,
and remained stable in relation to 3Q15. The sales in that quarter grew by 7.4% and 5.4%,
respectively, compared to 4Q14 and 3Q15. In the comparison between the years 2015 and 2014,
production totaled 287,247 metric tons, an increase of 7.9% over that for 2014, and sales totaled
77,469 metric tons, stable in relation to 2014.
The increase in the volumes of packaging paper produced in 2015 was mainly due to productivity
gains achieved through the expansion and modernization of Paper Machine I (MP I), which occurred
in May 2014.
51,632 53,966 52,934
190,085212,863
19,859 18,923 19,931
76,06674,384
71,491 72,889 72,865
266,151287,247
4Q14 3Q15 4Q15 2014 2015
+1.9%
-0.0%
+7.9%
Share of the 2015 Revenue
Packaging
Paper
27%
Total Production of Packaging Paper (in metric tons)
Hard Flexible

In 4Q15, the internal transfers of paper to hard packaging (Corrugated Cardboard) amounted to
52,819 metric tons (51,917 metric tons in 4Q14 and 54,299 metric tons in 3Q15), as follows: the
Indaiatuba - SP Packaging Plant received 20,549 metric tons (18,790 metric tons in 4Q14 and 21,458
metric tons in 3Q15); the Vila Maria SP Packaging Plant received 16,428 metric tons (17,371 metric
tons in 4Q14 and 16,629 metric tons in 3Q15); and the Campina da Alegria SC Packaging Plant
received 15,842 metric tons in 4Q15 (15,756 tons in 4Q14 and 16,212 metric tons in 3Q15). In the
year 2015, the transfers totaled 208,948 metric tons (188.553 metric tons in 2014), of which 80,645
metric tons were transferred to the Indaiatuba SP Packaging Plant (2014 - 63,367 metric tons),
65,452 to the Vila Maria SP Packaging Plant (2014 - 66,599 metric tons) and 62,851 metric tons to
the Campina da Alegria SC Packaging Plant (2014- 58,587 metric tons).
Of the total internal transfers in 2015, 39% was allocated to the Indaiatuba SP Packaging Plant, 31%
to the Vila Maria SP Packaging Plant, and 30% to the Campina da Alegria SC Packaging Plant (2014
- 34%, 35% and 31%, respectively).
The pieces of hard packaging paper, which represents a small share of the sales volume (only 1,413
metric tons in 4Q15, as shown in the chart above) and whose price is lower than the prices of the
other types of paper sold by the Company, increased by 3.5% and 10.6% in comparison with the
prices charged in 4Q14 and 3Q15, respectively. In the year 2015, there was an increase of 4.5%
compared to 2014. The Company's average prices accompanied the market trend. The prices of
flexible packaging paper increased by 11.1% and 4.5% in comparison with 4Q14 and 3Q15,
respectively. An increase of 9.1% was recorded in the comparison between 2014 and 2015.

Average prices of Packaging Paper (R$/metric ton)
1,640 1,535 1,697 1,568 1,639
4Q14 3Q15 4Q15 2014 2015
+10.6%+4.5%
+3.5%2,964 3,152 3,294
2,8563,115
4Q14 3Q15 4Q15 2014 2015
+4.5%
+9.1%
+11.1%
1.3. RS Forest and Resins Division
In 2015, the Rio Grande do Sul Forest Segment produced and sold 48
thousand m³ of pine logs to the domestic market (105 thousand m³ in
2014) and supplied 3,375 metric tons of natural resins to the parent
company Celulose Irani S.A. (3,409 metric tons in 2014), to be used in
the industrial production of tar and turpentine.
In 4Q15, the production and sales of the Balneário Pinhal RS Resins Plant increased by 7.6% and
decreased by 19.6%, respectively, compared to 4Q14. This plant's production and sales decreased by
35.4% and 52.6%, respectively, compared to the volumes recorded in 3Q15. In the annual
comparison, production and sales totaled 9,970 and 9,582 metric tons, increases of 18.6% and 14.5%,
respectively, in relation to 2014.
In 2015, the gross average price of tar was 3.0% higher than in 2014. The average price of turpentine
increased by 15.2% compared to 2014. The changes in the average prices of resins mainly resulted
from the effects of foreign exchange variations on the prices of the products.
Share of the 2015 Revenue
RS
Forest and
Resins
7%
Hard Flexible

5.436
4.636
5.601 5.341
Breu Terebintina
2014 2015
+15.2%+3.0%
2. ECONOMIC AND FINANCIAL PERFORMANCE
2.1. Net operating revenue
Net operating revenue for 4Q15 totaled R$ 193,930 thousand, an increase of 1.9% in relation to
4Q14, and a decrease of 1.4% in relation to 3Q15. Revenue totaled R$ 758,758 thousand in the year,
an increase of 2.7% over that in the previous year.
In the domestic market, net operating revenue amounted to R$ 167,132 thousand in 4Q15, which
represented a decrease of 1.6% compared to 4Q14 and an increase of 5.2% in relation to 3Q15. In
2015, net operating revenue totaled R$ 629,967 thousand, a decrease of 2.2% compared to 2014. The
domestic market accounted for 83% of IRANI's total revenue in 2015.
In 4Q15, exports totaled R$ 26,798 thousand, an increase of 30.4% compared to 4Q14, and a
decrease of 29.4% in relation to 3Q15. In 2015, exports totaled R$ 128,791 thousand, an amount
36.2% higher than that for 2014, representing 17% of the total net operating revenue, reflecting the
impact of a higher foreign exchange rate. Exports were mainly to Europe (33% of the export
revenue), followed by South America (31%). The other markets include: Asia (29%), Africa (6%)
and North America (1%).
Average prices (R$/metric tons)

169.9 158.9 167.1
644.0 630.0
20.5 37.9 26.8
94.5 128.8
190.4 196.8 193.9
738.5758.8
4Q14 3Q15 4Q15 2014 2015
-1.4%
+1.9%
+2.7%
IRANI's main operating segment is the Corrugated Cardboard (PO) Packaging Segment, which was
responsible for 66% of consolidated net revenue in 2015, followed by the Packaging Paper (27%)
and RS Forest and Resins (7%) segments.
Net revenue by segment
2014
2015
2.2. Cost of Products Sold
The cost of products sold amounted to R$ 530,437 thousand in 2015, a decrease of 2.7% compared to
2014. The change in the fair value of biological assets was not considered in the cost of products sold
for both periods.
In 2015, the costs per business segment were as follows:
Corrugated Cardboard Packaging
67%
Packaging Paper 26%
RS Forest and Resins
7%
Packaging Paper 27%
Corrugated Cardboard Packaging
66%
RS Forest and Resins
7%
Net revenue (R$ million)
Domestic Market Foreign Market
Net Revenue from the Foreign Market by Region
2015
Asia 29%
Europe 33%
South America
31%
North America
1%
Africa 6%
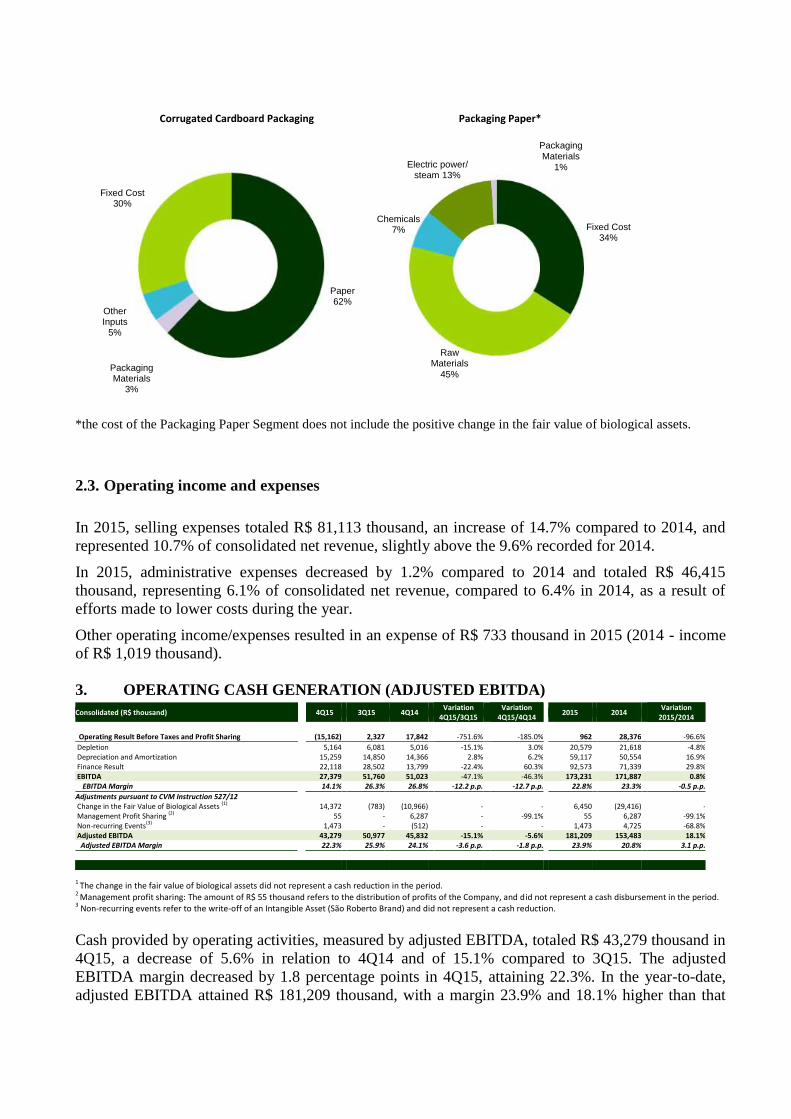
Corrugated Cardboard Packaging Packaging Paper*
*the cost of the Packaging Paper Segment does not include the positive change in the fair value of biological assets.
2.3. Operating income and expenses
In 2015, selling expenses totaled R$ 81,113 thousand, an increase of 14.7% compared to 2014, and
represented 10.7% of consolidated net revenue, slightly above the 9.6% recorded for 2014.
In 2015, administrative expenses decreased by 1.2% compared to 2014 and totaled R$ 46,415
thousand, representing 6.1% of consolidated net revenue, compared to 6.4% in 2014, as a result of
efforts made to lower costs during the year.
Other operating income/expenses resulted in an expense of R$ 733 thousand in 2015 (2014 - income
of R$ 1,019 thousand).
3. OPERATING CASH GENERATION (ADJUSTED EBITDA)
Consolidated (R$ thousand)
4Q15 3Q15 4Q14 Variation
4Q15/3Q15
Variation 4Q15/4Q14
2015 2014 Variation
2015/2014
Operating Result Before Taxes and Profit Sharing
(15,162)
2,327
17,842
-751.6%
-185.0%
962
28,376
-96.6%
Depletion
5,164
6,081
5,016
-15.1%
3.0%
20,579
21,618
-4.8% Depreciation and Amortization
15,259
14,850
14,366
2.8%
6.2%
59,117
50,554
16.9%
Finance Result
22,118
28,502
13,799
-22.4%
60.3%
92,573
71,339
29.8% EBITDA 27,379
51,760
51,023
-47.1%
-46.3%
173,231
171,887
0.8%
EBITDA Margin
14.1%
26.3%
26.8%
-12.2 p.p.
-12.7 p.p.
22.8%
23.3%
-0.5 p.p.
Adjustments pursuant to CVM Instruction 527/12 Change in the Fair Value of Biological Assets (1)
14,372
(783)
(10,966)
-
-
6,450
(29,416)
- Management Profit Sharing (2)
55
-
6,287
-
-99.1%
55
6,287
-99.1%
Non-recurring Events(3)
1,473
-
(512)
-
-
1,473
4,725
-68.8% Adjusted EBITDA 43,279
50,977
45,832
-15.1%
-5.6%
181,209
153,483
18.1%
Adjusted EBITDA Margin
22.3%
25.9%
24.1%
-3.6 p.p.
-1.8 p.p.
23.9%
20.8%
3.1 p.p.
1 The change in the fair value of biological assets did not represent a cash reduction in the period.
2 Management profit sharing: The amount of R$ 55 thousand refers to the distribution of profits of the Company, and did not represent a cash disbursement in the period.
3 Non-recurring events refer to the write-off of an Intangible Asset (São Roberto Brand) and did not represent a cash reduction.
Cash provided by operating activities, measured by adjusted EBITDA, totaled R$ 43,279 thousand in
4Q15, a decrease of 5.6% in relation to 4Q14 and of 15.1% compared to 3Q15. The adjusted
EBITDA margin decreased by 1.8 percentage points in 4Q15, attaining 22.3%. In the year-to-date,
adjusted EBITDA attained R$ 181,209 thousand, with a margin 23.9% and 18.1% higher than that
Paper 62%
Packaging Materials
3%
Other Inputs
5%
Fixed Cost 30%
Packaging Materials
1%
Raw Materials
45%
Fixed Cost 34%
Chemicals 7%
Electric power/ steam 13%

for 2014, totaling R$ 153,483 thousand. The growth of 3.1 percentage points in the margin resulted
mainly from the operating performance, reduction of variable production costs and administrative
expenses, and the appreciation of the U.S. dollar and euro.
4. FINANCE RESULT AND INDEBTEDNESS
In 4Q15, the Company recorded a negative finance result of R$ 22,118 thousand, which represented
an increase of 60.3% in relation to 4Q14. In comparison with 3Q15, the finance result presented a
reduction of 22.4%. In 2015, the Company recorded a negative finance result of R$ 92,573, an
increase of 29.8% compared to 2014 (negative finance result of R$ 71,339 thousand), mainly due to
the higher interest rate (CDI), inflation (Amplified Consumer Price Index - IPCA) and foreign
exchange variations.
In 4Q15, finance costs totaled R$ 30,895 thousand, compared to R$ 23,027 thousand in 4Q14, and
R$ 38,032 thousand in 3Q15. Finance costs totaled R$ 127,801 thousand, in 2015, compared to
R$ 96,498 thousand in 2014. Finance income totaled R$ 8,777 thousand in 4Q15, compared to
R$ 9,228 thousand in 4Q14 and R$ 9,530 thousand in 3Q15. Finance income amounted to R$ 35,228
thousand in 2015, compared to R$ 25,159 thousand in 2014.
The finance result was distributed as follows:
R$ thousand 4Q15 3Q15 4Q14 2015 2014
Finance income 8,777 9,530 9,228 35,228 25,159
Finance costs (30,895) (38,032) (23,027) (127,801) (96,498)
Finance result (22,118) (28,502) (13,799) (92,573) (71,339)
The table below shows the foreign exchange gains and losses included in the Company's finance
income and costs:
R$ thousand 4Q15 3Q15 4Q14 2015 2014
Foreign exchange gains 4,265 6,318 2,675 19,885 8,937
Foreign exchange losses (5,385) (15,873) (3,576) (36,958) (12,096)
Foreign exchange variations, net (1,120) (9,555) (901) (17,073) (3,159)
4Q14

The foreign exchange variations negatively impacted the Company's results by R$ 1,120 thousand in
4Q15 and R$ 17,073 thousand in 2015, due to the devaluation of the Brazilian Real against the U.S.
dollar during the year.
The finance result, net of the foreign exchange variations, was as follows:
R$ thousand 4Q15 3Q15 4Q14 2015 2014
Finance result net of foreign
exchange variations (20,998) (18,947) (12,898) (75,500) (68,180)
With the objective of hedging its exports in the coming years, the Company maintains the flow of the
maturities of its commitments in foreign currency (U.S. dollars) aligned with the estimated
receivables in U.S. dollars. The foreign exchange variations of these transactions are recorded
monthly in equity, and recognized in the statement of income as finance costs when realized (hedge
accounting). In 4Q15, the Company recognized hedge accounting gains of R$ 10,184 thousand (R$
6,721 thousand net of taxes in equity), and the amount recognized in the statement of income, as
finance cost, was R$ 1,695 thousand. In the accumulated for the year, the Company maintained
R$ 219,686 thousand recorded as foreign exchange variations on hedge accounting, to be recognized
in the statement of income on realization, over the coming years. The amount of R$ 144,993
thousand is recognized in Equity (net of taxes).
Foreign exchange rate
The exchange rate of R$ 2.66/US$ at December 31, 2014 increased by 46.62% to the end of
December 2015, reaching R$ 3.90/US$. The average exchange rate for the final quarter of 2015 was
R$ 3.84/US$, or 8.47% higher than that for 3Q15 and 51.18% higher than that for the same period of
2014. In the year 2015, the average exchange rate increased by 42.13%, reaching R$ 3.34/US$.
4Q15 3Q15 4Q14 Δ4Q15/3Q15 4Q15/4Q14 2015 2014 Δ2015/2014
Average U.S. dollar 3.84 3.54 2.54 +8.47% +51.18% 3.34 2.35 +42.13%
Final U.S. dollar 3.90 3.97 2.66 -1.76% +46.62% 3.90 2.66 +46.62%
Source: Brazilian Central Bank
Net Indebtedness
At December 31, 2015, consolidated gross indebtedness totaled R$ 922.4 million, compared to R$
776.8 million at December 31, 2014. The variation in this indicator was influenced by the exchange
rate variation during the year, arising from the portion of the Company's debt exposed to the U.S.
dollar, and also by the increase in the interest rate. At December 31, 2015, the Company's gross debt
profile presented 24% of debts maturing in the short term and 76% in the long term.
At December 31, 2015, consolidated cash and cash equivalents totaled R$ 145.4 million, compared to
R$ 168.1 million at December 31, 2014. The impact on cash was mainly due to repayments of the
principal of the debt. The consolidated net indebtedness at December 31, 2015 was R$ 777.0 million,
compared to R$ 608.8 million at December 31, 2014. The net debt/EBITDA ratio changed from 3.97
times at the end of 2014 to 4.29 times at the end of 2015. Excluding from net debt the exchange
variation recorded as hedge accounting (Note 30 - Cash flow hedge), the pro forma net debt/EBITDA

ratio would have been 3.08 at the end of 2015. The variation in this indicator was influenced by the
appreciation of the U.S. dollar during the year, which affected the portion of debt denominated in this
currency.
288.6 280.4 285.3 310.4
495.8
608.8
777.0
15,2 50.8 83.4
97.9
137.7
168.1
145.4
303.8 331.2
368.7 408.3
633.5
776.8
922.4
3.13 3.04 2.58 2.693.61 3.97
4.29
3.08
2009 2010 2011 2012 2013 2014 2015
Gross Debt Profile
5. VALUATION OF THE FAIR VALUE OF BIOLOGICAL ASSETS (FORESTS)
As from 2010, the Company started to measure the fair value of its biological assets (forests)
periodically, as determined by CPC 29. The change in fair value of the biological assets produced the
following effects in the Company's results for 2015:
Long-term Debt (%) Short-term Debt (%)
Indebtedness and Net Debt/EBITDA
Cash Balance (R$ million)
Gross Debt [R$ million]
Net Debt/Proforma EBITDA(x)
Net Indebtedness [R$ million]
Net Debt/EBITDA (x)

Effects of the changes in the fair value of biological assets
R$ thousand 2015 2014
Change in the fair value of biological assets (6,450) 29,416
Depletion of the fair value of biological assets (16,944) (17,926)
The fair value of biological assets decreased in 2015, mainly due to variations in certain assumptions
utilized in their valuation, such as an increase in the forest discount rate, change in production
planning and variation in production costs.
The change in the fair value of biological assets, as well as their depletion, is recognized in “Cost of
Goods Sold”. This new accounting determination improves the evaluation of the market value of the
Company's forests, increasing the accuracy of the financial statements.
6. OPERATING RESULT BEFORE TAXES AND PROFIT SHARING
In 4Q15, the operating result before taxes and profit sharing presented a loss of R$ 15,162 thousand,
compared to a profit of R$ 17,842 thousand in 4Q14 and of R$ 2,327 thousand in 3Q15. In the year
2015, the operating result before taxes and profit sharing presented a profit of R$ 962 thousand, but
was lower than that for 2014 (R$ 28,376 thousand).
7. PROFIT (LOSS)
The Company reported a loss of R$ 16,844 thousand for 4Q15, compared to profits of R$ 27,924
thousand in 4Q14 and R$ 3,686 thousand in 3Q15. In the year 2015, there was a profit of R$ 495
thousand, compared to a profit of R$ 56,579 thousand for 2014. The result for 2015 was adversely
impacted by the change in the fair value of biological assets, as well as by the effects of foreign
exchange variations recognized in the statement of income.
8. INVESTMENTS
The Company has maintained its strategy of
investing in the modernization and
automation of its production processes.
In 2015, these investments totaled R$ 66,487
thousand and were basically aimed at the
maintenance and improvement of machinery,
equipment and in the improvement of the
Company's physical structures.
The main investment made in 2015 related to the completion of the technological update of
equipment in the output of the Corrugator Machine of the Vila Maria SP Packaging Plant, aimed at
increasing production and improving quality.
9. SHARE CAPITAL
At December 31, 2015, IRANI's share capital was represented by 166,720,235 shares, of which
153,909,975 (92%) were common shares and 12,810,260 (8%), preferred shares. At December 31,
2015, the Company held in treasury 2,376,100 shares, of which 24,000 were common shares and
R$ thousand 4Q15 2015
Land 6,963 6,983
Buildings 8,299 8,879
Equipment 7,570 42,688
Intangible assets 368 970
Reforestation 2,367 6,967
Total 25,567 66,487

2,352,100, preferred shares. At the same date, the Company's market value was R$ 505,447
thousand, 7% lower than the amount in 2014 (R$ 543,636 thousand).
Dividends
In 2015, the minimum mandatory dividend was R$ 3,343 thousand, corresponding to R$ 0.0203422
per share. It should be noted that the interim dividends approved by the Company’s Board of
Directors on August 20, 2015 and November 18, 2015, totaling R$ 4,950 thousand, corresponding to
R$ 0.030120 per share, were higher than the minimum mandatory dividend calculated at the end of
the year. However, management understands that this fact has no negative impact on the Company,
since the amounts distributed are not significant, and, consequently, do not affect liquidity. In
addition, on the date of their approval, these dividends were in compliance with the minimum
mandatory limit.
10. SUSTAINABILITY
IRANI adopts an integrated management model, which incorporates a balanced economic, social and
environmental development into its strategy. By committing to sustainability, the Company
promotes a virtuous circle of environmental preservation and innovation, which enhances its
responsibility for being an environmentally correct, socially fair and economically viable
organization. The Company’s actions and results are disclosed in its Sustainability Report, which is
issued in the first half of each year. This report is prepared in accordance with the Global Reporting
Initiative (GRI) guidelines and guidance from the International Integrated Reporting Council (IIRC),
and is available for consultation at www.irani.com.br.
10.1 Awards and Recognitions
In 2015, the Company received the following social, environmental and market awards for actions
and projects developed throughout the year.
Social Responsibility Award: recognition by the joint commission of Social Responsibility of the
Legislative Assembly of Santa Catarina (Alesc) for the cases "Projeto Broto do Galho" (“Branch
Sprout Project”), “Avaliação do Ciclo de Vida de Papel” ("Assessment of the Paper Life Cycle")
and “Reciclagem de Pástico Misto” ("Recycling of Mixed Plastic").
Fritz Muller Award: The Foundation for the Environment (Fatma) presented the Company with
an award for outstanding environmental projects carried out in the State of Santa Catarina, as well
as for the Mixed Plastic Recycling Plant.
Abrasca Award: the Company was placed 10th in the ranking of the 17th Abrasca (Brazilian
Association of Listed Companies) Award for Annual Reports.
Época Negócios 360º: The Company ranked third among the five best pulp and paper companies
in Brazil. It received recognition in the “Human Resources” and “Vision of the Future” categories.
Additionally, it ranked fourth in “Financial Performance”, second in “Ability to Innovate”, and
fifth in “Social Responsibility”. It also ranked 64th among the 250 best large companies in Brazil
and was rated as an outstanding in the Southern region.

Brazilian Technical Association of Pulp and Paper (ABTCP) Award: The Company was
recognized for its sustainable management practices.
Agribusiness Annual Publication: The Company ranked 4th among the 10 best companies in the
Reforestation, Pulp and Paper sector. It also ranked 9th in Net Revenue, 8th in Total Assets, and
10th in Evolution of Assets. It obtained the 142nd place in the general ranking.
Annual Health, Safety and Environmental Award: This award, which is given by Pine
Chemicals Association (PCA), was received as a result of actions and projects developed by the
Balneário Pinhal RS Resins Plant, together with its employees, addressing health, quality and
responsibility in the production of tar and turpentine.
Onda Verde (Green Wave) Trophy: the Company was recognized for its Mixed Plastic
Recycling project at the 22nd edition of the “Expressão Ecologia” (Ecological Expression)
Award.
ADVB Citizen Company Award: the Company received an award in the “Environmental
Preservation” category for the Mixed Plastic Recycling project. This award is given by the
Marketing and Sales Directors Association of the State of Santa Catarina (ADVB/SC).
Boa Ideia (Good Idea) Award: As a result of a partnership between IRANI and the Social
Service for Industry (SESI) at the Santa Luzia MG Paper Plant, the Company was awarded first
place in Boa Ideia Award organized by the Federation of Industries of the State of Minas Gerais
(FIEMG), in the “Ensuring Effective Results” category.
Exportação RS Award: This award, which is given by the Marketing and Sales
Directors Association of the State of Rio Grande do Sul (ADVB/RS), recognized the Company’s
outstanding performance as an exporter in the south of Brazil.
10.2 Environmental Development Management
IRANI is aware of the importance of preserving the environment and seeks sustainable development
through clean, low-carbon technologies, thereby reducing the impacts of its activities on the
environment. The Company therefore operates in accordance with the best environmental
management practices, and, through its environmental policy, is committed to complying with the
prevailing environmental legislation, with a view to achieving continuous improvement and
preventing pollution.
A number of measures are adopted to minimize the impacts of the Company’s activities on the
environment. IRANI has implemented an innovative project for the recovery of plastic (residue
arising from recycling of paper trimmings), obtaining a new by-product called “mixed plastic
trimmings”, a raw material which is used by the plastic industry to manufacture recycled plastic
fence poles, roof tiles and sheets, thereby creating a new production chain with the environmental
advantage of avoiding the disposal of plastic waste in landfills. It is important to mention that this
plant was expanded in 2015 to enable an increase in the amount of plastic and fiber recovered.
A key component of our management system is to ensure the maintenance of quality and
environmental systems in all the units, by conducting internal and external audits to address the ISO
9001 certification, FSC Chain-of-Custody certification, and ISO 14001 certification in the Packaging

Plants, which shows the Company’s commitment to environmental issues and sustainability-oriented
practices, as well as enhances IRANI’s credibility with its stakeholders.
Every year, the Company realizes the verification of the Greenhouse Gas Inventory (GGI), pursuant
to the NBR ISO 14064 standard, by a certifying body. From 2006 to 2015, IRANI was classified as
being carbon neutral, i.e., it removed more greenhouse gases from the atmosphere than it released.
The progress achieved in environmental management also generated a product life cycle review,
whereby 19 categories of environmental impact were identified, resulting in the definition of action
plans to reduce these impacts on the paper and packaging production processes.
In addition to investing in eco-friendly technologies, IRANI also aims to raise the awareness of its
employees and the residents of the cities in which its facilities are located, and to support and
encourage environmental education projects, seeking to strengthen the concept and practice of
sustainable development.
11. SOCIAL PERFORMANCE INDICATORS
11.1. People Development
At the end of 2015, IRANI employed 2,562 people. The Company seeks to achieve excellence
through participatory management and investments in programs, actions and benefits that permit the
personal and professional development of its employees in a pleasant work environment. During
2015, the Company invested R$ 22,250 thousand in meal, transportation, life insurance and health
care plan benefits, R$ 1,021 thousand in qualification and personal development actions, and
R$ 5,176 thousand in the profit sharing program (PPR).
The Company maintains five structuring programs, which are aligned with its Mission, Vision and
Corporate Values and focus on providing the necessary conditions for people to achieve their
maximum potential, enabling their personal and professional development. These programs are called
“GERA”, “CRESCE”, “CUIDA”, “MOTIVA” and “SUPERA”. The GERA Program seeks to enable
a healthy renewal of the teams and ensure mutual success in the partnership between the employee
and the Company. This program is aligned with the professional cycle of the people in the
organization, and its primary aims are to attract, engage and monitor an employee in his/her
professional trajectory, encouraging personal development through recruitment, integration and on-
the-job monitoring processes. The CRESCE Program consists of qualification and development
actions, through technical and behavioral training courses in line with the Company’s strategies. The
CUIDA Program consists of a set of practical and applicable procedures within an integrated health
and safety management model, whose purpose is to reduce workplace accidents, increase compliance
with the legislation and expand the employees’ awareness of health and safety subjects. The
MOTIVA Program is the definition adopted by IRANI for its Organizational Climate Management
Program. Its main objective is to provide a stimulating and motivating workplace climate, with
engaged teams and with shared responsibility for the Company’s growth. Through the SUPERA
Program, the Company annually assesses individual performance, based on Competences and
Results, seeking to provide challenges for employees and to recognize their development, as well as
to stimulate a result-oriented culture and self-development.

11.2 Society
IRANI stimulates the development of its surrounding communities through investments and
participation in social entities that operate in these locations. Following the guidance of its Social
Responsibility Policy, the Company seeks to establish solid partnerships for the development of
projects in the areas of citizenship, socio-environmental education, culture and sports. The main
social projects supported by the Company in 2015 were as follows:
Partnership with Junior Achievement in the states of Santa Catarina, São Paulo, Rio Grande
do Sul and Minas Gerais, to encourage entrepreneurial volunteering actions and young
entrepreneurship;
SESI Atleta do Futuro (Athlete of the Future) Program, in partnership with SESI and the
municipal governments of Vargem Bonita (SC), Irani (SC), Ponte Serrada (SC), Indaiatuba (SP) and
Santa Luzia (MG), with a focus on the development of the citizenship of children and young people,
through the practice of sports and the discussion of transversal topics;
Volleyball training center for beginners, in partnership with the Volleyball Association of
Joaçaba (AJOV), in the towns of Joaçaba and Vargem Bonita (SC);
Environmental Protection project, realized in the town of Irani (SC), under the supervision of
the Environmental Military Police of the town of Concórdia (SC);
Broto do Galho Project, initiated in 2008, to provide a productive occupation and extra
income for residents of the town of Campina Grande, who make handcrafted goods from industrial
and forestry waste;
Aluno Destaque (Student of the Year) Project, created in 2013 to recognize the five best
students in the Galeazzo Paganelli Public School, in the town of Campina da Alegria (SC),
encouraging them to continue to achieve an excellent performance in school, with educational
follow-up during out-of-school hours.
12. AUDIT SERVICES
In conformity with CVM Instruction 381/03, we inform that the Company and its subsidiaries adopt
consultations with its independent auditors, PricewaterhouseCoopers Auditores Independentes, as a
formal procedure to ensure that the rendering of other services will not affect the auditors'
independence and objectivity necessary to perform the independent audit services. In this regard,
PricewaterhouseCoopers issues every year a statement of independence, in accordance with the terms
of NBC TA 260 of the Federal Accounting Council, in which they declare that, in conformity with
the provisions of the independence rules adopted by the Brazilian Securities Commission, there is no
relationship between PricewaterhouseCoopers, its associates and affiliates and the Company, which
could affect independence. This statement is submitted to the Board of Directors of Celulose Irani
S.A. The policy of the Company and its subsidiaries in the engagement of independent auditor
services ensures that there is neither a conflict of interest, nor loss of independence or objectivity.
During 2015, PricewaterhouseCoopers provided, in addition to the audit service and review of the
translation into English of the financial statements, supplementary audit services, as follows:

* All the services contracted refer to 2015 and there are no services to be provided with reference to
future years.
13. PROSPECTS
In 2016, we expect the challenging economic environment to continue, with the possibility of
increased complexity in the Brazilian economy due to adjustments in the world economy. In this
context, we believe that business competitiveness and strict financial management will be essential as
we go through this more difficult period. In addition, we believe that times of adversity, such as the
one we are currently facing, are inherent to economic cycles, especially in emerging economies such
as that of Brazil, and that they also provide business opportunities.
ACKNOWLEDGMENTS
We thank each one of our employees for their effort during this period, our stockholders and creditors
for the trust they have placed in us, and our customers, suppliers, financial institutions and
surrounding communities for their support and partnership, which were crucial for the growth and
development of Celulose Irani S.A. during 2015.
Porto Alegre, February 2016.
The Executive Office.
In thousands of
R$ %
Audit of the 2015 Financial Statements – Celulose Irani S.A. and
subsidiaries 509 60%
Other services*:
Review of the PIS and COFINS calculation basis 278 33%
Review of internal controls in connection with the requirements of the Tax
Accounting Bookkeeping (ECF) and Block k. 57 7%
Total 844 100%

(A free translation of the original in Portuguese)
To the Stockholders of
CELULOSE IRANI S.A.
Capital Budget Proposal
In accordance with the provisions of Article 196 of Law 6,404/76, with the wording provided by Law
10,303, of October 31, 2001, the Management of Celulose Irani S.A. ("Company") hereby submits
the Company's Capital Budget proposal.
The proposal for the appropriation of profit disclosed in the financial statements, as submitted to the
stockholders of the Company, for the year ended December 31, 2015, foresees that, after the
adjustments referred to by Articles 193 and 202 of Law 6,404/76, profits in the amount of R$ 8,422
thousand will be retained and allocated to the Profit Retention Reserve, which is intended to support
the Company's Investment Plan.
The Capital Budget for 2016, approved at the Board of Directors' meeting held on December 9, 2015,
totals R$ 56,615 thousand, in addition to R$ 15,880 thousand for working capital requirements,
distributed as follows:
Capital Budget for 2016
In thousands of reais Current Strategic Total
Packaging Segment PO - 6,615 6,615
Current investment budget 50,000 - 50,000
Total investments for 2016 50,000 6,615 56,615
Working Capital Requirements 15,880 15,880
Own resources (provided by the operating activity during the year) will be utilized in these
investments.
Summary of sources and uses
In thousands of reais Current % Strategic % Total %
Financed Resources - - - - - -
Own Resources 50,000 100% 6,615 100% 56,615 100%
Total 50,000 100% 6,615 100% 56,615 100%
Having presented this proposal, Management remains at your disposal for any further clarification.
Porto Alegre, RS, 29 February 2016.
The Executive Office.

(A free translation of the original in Portuguese)
DECLARATION OF EXECUTIVE DIRECTORS
For the purposes of Article 25 of CVM Instruction 480/09
As Executive Directors of Celulose Irani S.A., a corporation headquartered at Rua General João
Manoel, 157, 9th floor, room 903, in the city of Porto Alegre, State of Rio Grande do Sul, and
enrolled in the National Corporate Taxpayers Registry (CNPJ/MF) under No.92.791.243/0001-03,
WE DECLARE, in compliance with the terms of paragraph 1, Article 25 of CVM Instruction 480,
of December 7, 2009, that: (i) we reviewed, discussed and agreed with the opinion expressed in the
Company’s independent auditor's report, referring to the financial statements for the year ended
December 31, 2015; and (ii) we reviewed, discussed and agreed with the Company's financial
statements for the year ended December 31, 2015.
Porto Alegre, RS, February 29, 2016.
Pericles Pereira Druck - CEO
Odivan Carlos Cargnin – Director of Administration, Finance and Investors Relations
Sérgio Luiz Cotrim Ribas – Director of Paper and Packaging Business