
CEEAplA WP No. 05/2011 · Departamento de Economia e Gestão Universidade dos Açores Apartado 1422...
43
WORKING PAPER SERIES Universidade dos Açores Universidade da Madeira CEEAplA WP No. 05/2011 Situational Leadership and Professional Nurses’ Satisfaction: The Example of Hospitals Maria da Graça Batista Luís Furtado Francisco Silva February 2011
Transcript of CEEAplA WP No. 05/2011 · Departamento de Economia e Gestão Universidade dos Açores Apartado 1422...

WORKING PAPER SERIES
Universidade dos Açores Universidade da Madeira
CEEAplA WP No. 05/2011
Situational Leadership and Professional Nurses’ Satisfaction: The Example of Hospitals
Maria da Graça Batista Luís Furtado Francisco Silva February 2011

Situational Leadership and Professional Nurses’
Satisfaction: The Example of Hospitals
Maria da Graça Batista Universidade dos Açores (DEG e CEEAplA)
Luís Furtado
Departamento de Cirurgia Geral Hospital do Divino Espírito Santo, EPE
Francisco Silva
Universidade dos Açores (DEG e CEEAplA)
Working Paper n.º 05/2011 Fevereiro de 2011

CEEAplA Working Paper n.º 05/2011 Fevereiro de 2011
RESUMO/ABSTRACT
Situational Leadership and Professional Nurses’ Satisfaction: The Example of Hospitals
The purpose of this study is to describe the leadership behaviors of head nurses and compare them with the perceptions of their direct employees (nurses). The study also aims to determine the various components of leadership that have an impact on job satisfaction. Using descriptive, inferential and correlational analysis, the study was conducted in two hospitals. All nurses with either management or care duties were invited to participate, with the exception of those who work in the operating blocks and outpatient units. The final sample was comprised of 266 individuals, including 22 head nurses and 244 staff nurses. The questionnaire was organized into three sections (1) Sample characterization; (2) Leadership Effectiveness and Adaptability Description (LEAD), with 12 questions to determine the components of situational leadership; and (3) Professional Satisfaction Indicator (PSI), consisting of 30 questions that identified the satisfaction level among respondents. Data were collected in May 2009. In both groups, the most expressive leadership styles, dominant and alternative, were the S2 (persuading) and S3 (sharing). Head nurses and staff both had relatively low levels of job satisfaction, although head nurses were generally more satisfied than staff nurses. Keywords: Leadership Behaviors; Leadership Styles; Job Satisfaction. Maria da Graça Batista Universidade dos Açores Departamento de Economia e Gestão Rua da Mãe de Deus, 58 9501-801 Ponta Delgada Luís Furtado Departamento de Cirurgia Geral Hospital do Divino Espírito Santo, EPE Rua Grotinha 9500-3701 Ponta Delgada Francisco Silva Universidade dos Açores Departamento de Economia e Gestão Rua da Mãe de Deus, 58 9501-801 Ponta Delgada

1
SITUATIONAL LEADERSHIP AND PROFESSIONAL NURSES’
SATISFACTION: THE EXAMPLE OF HOSPITALS
MARIA DA GRAÇA BATISTA
Departamento de Economia e Gestão
Universidade dos Açores
Apartado 1422
9501-801 Ponta Delgada, Azores; Portugal
Tel.: 296 650 084
Fax: 296 650 083
LUÍS FURTADO
Departamento de Cirurgia Geral
Hospital do Divino Espírito Santo, EPE
Rua Grotinha
9500-3701 Ponta Delgada, Azores; Portugal
Tel.: 296 203 000
Fax: 296 650 090
FRANCISCO SILVA
Departamento de Economia e Gestão
Universidade dos Açores
Apartado 1422
9501-801 Ponta Delgada, Azores; Portugal
Tel.: 296 650 084
Fax: 296 650 083

2
SITUATIONAL LEADERSHIP AND PROFESSIONAL NURSES’
SATISFACTION: THE EXAMPLE OF HOSPITALS
ABSTRACT
The purpose of this study is to describe the leadership behaviors of head nurses and
compare them with the perceptions of their direct employees (nurses). The study also
aims to determine the various components of leadership that have an impact on job
satisfaction. Using descriptive, inferential and correlational analysis, the study was
conducted in two hospitals. All nurses with either management or care duties were
invited to participate, with the exception of those who work in the operating blocks and
outpatient units. The final sample was comprised of 266 individuals, including 22 head
nurses and 244 staff nurses. The questionnaire was organized into three sections (1)
Sample characterization; (2) Leadership Effectiveness and Adaptability Description
(LEAD), with 12 questions to determine the components of situational leadership; and
(3) Professional Satisfaction Indicator (PSI), consisting of 30 questions that identified
the satisfaction level among respondents. Data were collected in May 2009. In both
groups, the most expressive leadership styles, dominant and alternative, were the S2
(persuading) and S3 (sharing). Head nurses and staff both had relatively low levels of
job satisfaction, although head nurses were generally more satisfied than staff nurses.
Keywords: Leadership Behaviors; Leadership Styles; Job Satisfaction.

3
INTRODUCTION
Hospitals and health providers are adjusting to environmental change and
redirecting their management policies based on a new paradigm. Balsanelli and Cunha
(2006) contended that, despite rapid organizational and social transformations,
technology still cannot replace the need to guide people to achieve a particular
objective. Human capital remains organizations’ most valuable asset.
According Tannenbaun, Massarik and Weschler (1970) and Tannenbaun and
Schmidt (1973), leadership is the interpersonal influence exercised in a given situation
through a process of communication in order to reach a given goal. Yura, Ozimek and
Walsh (1981) argued that nursing leadership is the process by which an individual (a
nurse) influences the actions of others in determining and pursuing objectives, defining
actions and planning in a dynamic scenario. Bass (1999) argued that it is the charisma
and inspiration of the leader that triggers employees to promote organizational
outcomes; in nursing, this kind of leadership translates into real health benefits for
patients.
Rice et al. (1985) sought to explain why individuals differ in terms of work
characteristics related to job satisfaction, focusing on salary, promotion opportunities,
chief proximity and the degree of control the individual has over his or her tasks.
Despite the recognition of the influence of individual characteristics on expectations
towards work and personal achievements, researchers generally agree that job
satisfaction can be achieved only through effective leadership. This paper addresses
theoretical and methodological issues, describes the main findings of the study, and
presents a discussion on the convergence and divergence of issues regarding previous
work in this field.
4
SITUATIONAL LEADERSHIP MODEL
Jesuíno (2005) offered several definitions of leadership and argued that, in addition
to the concept of leadership, there should be an understanding of the concepts of power
and authority. Miguel, Rocha and Röhrich (2008) defined leadership as a process whose
essence lies in the ability to influence subordinates in a non-unidirectional way. Several
theories have been proposed to explain leadership phenomena, each with unique
characteristics and strengths and weaknesses. According to Hersey and Blanchard
(2005), the Situational Leadership Model is based on the interplay of three essential
characteristics: (1) the level of guidance or direction that the leader provides, (2) the
level of socio-emotional support provided by the leader, and (3) subordinates’ maturity
level for carrying out a particular task, function or purpose. One of the main concepts of
this model is maturity, which is the degree of ability and willingness that subordinates
show to take responsibility for a specific task.
Apart from maturity, Hersey and Blanchard (2005) defined four basic leadership
styles that arise from the model, from “high task orientation” and “low socio-emotional
support” and to the reverse. Leadership style, according to the authors, reflects a
leader’s pattern of behavior in influencing others, although the leader’s perception of
that pattern may differ from the perception of his or her subordinates. The comparison
between self-perception and others’ perception is useful since it can translate the actual
style of leadership in terms of the degree of rapprochement between the perception of
the leader and that of subordinates and determine if there is a gap between the leader's
vision of himself or herself and the vision of subordinates. This theoretical model also
covers the concepts of versatility, range of style, and leadership adaptability. . This
analysis can be graphically represented in the “Johari Window” (Figure 1) from Hersey
and Blanchard (2005).

5
----------------------- Figure 1 about here ---------------------
Little (2005) defined the four quadrants of the “Johari Window” as public area,
blind area, private area and unknown area. The work of Hersey and Blanchard (2005)
suggested that leadership style is made up of a basic style and a support style, resulting
in six leadership profiles: Profile S1-S2, S1-S3, S1-S4, S2-S3, S2-S4 and S3-S4.
PROFESSIONAL SATISFACTION
All human behavior is oriented to satisfying needs (McGregor 1973). From birth to
death, the individual is engaged in constant efforts to meet the varied needs, some
complex and even conflicting. Oliveira (1999) indicated that satisfaction derives from a
set of feelings, positive or not, regarding with whom the work is done, and that
satisfaction typically refers to the attitudes of a single employee but may also be a
general feeling of group of employees.
According to Cavanagh (1992), nurses’ job satisfaction is vital for health
organizations. Job satisfaction is an inherent feature of work and, as such, is valued in a
very particular way; for nurses, job satisfaction is related to the physical, mental and
emotional effort needed to perform. Cavanagh (1992) added that nurses’ job satisfaction
directly reflects the quality of care provided to the patient. Mrayyan (2006) also found
that nurses’ positive job satisfaction relates to better care outcomes, organizational
efficiency and reduced waste of skilled human capital.
Cortese (2007) argued that management practices should be revised to promote
nurses’ job satisfaction based on three key areas: (1) training, (2) the dynamics of the
organization and organizational culture, and (3) research. There are no easy solutions to
the question of how to promote satisfaction among nurses, yet research in this area seem
to agree on one thing: we must ensure that these professionals carry out their business in
6
a healthy environment and that their needs and aspirations are met, resulting in
improved performance with consequent health gains.
CORE CONCEPTS
Leadership style is a leader’s behavioral pattern, which combines task behavior and
relationship behavior. The leader progresses from S1 (“determining”), though the
intermediate styles S2 (“persuading”) and S3 (“sharing”), and finally to S4
(“delegating”). This development occurs as the leader moves from strong oversight and
low socio-emotional support to a stage at which a tight supervision is maintained but
there is more relationship behavior. In the third phase, supervision is significantly
reduced as positive reinforcement and rewarding good performance emerges, and at the
last stage, supervisory behaviors decline and default to relationship behavior by leaders
of highly mature groups.
A subordinate’s maturity, according to Gates, Blanchard and Hersey (1976), goes
through a similar progression, from M1 (“low maturity”) to M2 (“medium-low
maturity”), followed by M3 (“medium-high maturity”) and ending at M4 (“high
maturity”). During this progression, different leadership styles are essential to a
subordinates’ smooth adaptation to each development stage.
Hersey and Blanchard (1982) referred to leadership versatility as the extent to which
a leader can vary his or her leadership style and classified it into four categories:
“without versatility” (only one style of leadership), “weak versatility” (two styles of
leadership), “moderate versatility” (three styles of leadership) and “strong versatility”
(four styles leadership). Hersey and Blanchard (1981) related leadership adaptability to
the extent that leaders are able to vary their style appropriately in a particular situation
and classified a leader’s adaptability as either effective or ineffective.

7
The expansion of the Johari Window is conditioned by feedback and demonstration.
According to Galpin (1995) and Clayton (2008), the feedback process corresponds to
the degree to which individuals who interact with the leader are willing to share their
perceptions of themselves as well as the extent to which the leader attempts to
understand the feedback contained in verbal and nonverbal communication.
Demonstration is the extent to which the leader is willing to share information about
himself or herself with the other members of the organization.
For operationalization purposes, the variable for job satisfaction is arranged into
layers: “no satisfaction” (<50%); “low satisfaction” ([50% -70%[); “moderate
satisfaction” ([70% -85 %[), and “strong satisfaction” (≥ 85%).
METHOD
This is a prospective, descriptive, inferential and correlational study measures the
perceptions of head nurses and their direct employees in regard to the head nurses’
dominant and alternative leadership styles, leadership profiles, and leadership versatility
and adaptability, and the nurses’ level of job satisfaction.
HYPOTHESES
According to Cervo and Bervian (2002), hypotheses are developed to guide research
by temporarily explaining a phenomenon until facts are confirmed or refuted. The
assumptions reflect an attempt to preview the relationship between two or more
variables. The construction of the hypotheses for the current study was based on the
literature presented in Table 1.
----------------------- Table 1 about here ---------------------
Hypotheses 1, 2 and 3 are based on Kleinman (2004), which compared leaders’ and
followers’ perceptions of leadership behaviors. We implemented the same type

8
research, adjusting it to reflect the leadership profile, versatility and adaptability. The
studies of Graeff (1997), Avolio and Bass (1999) and Wehbe and Galvão (2005) are
also reflected in these hypotheses.
Hypothesis 4 was based on study conducted by Cavanagh (1992), who argued that
nurses with different work functions may have significantly different levels of job
satisfaction. Since head nurses have different functions than their subordinates, we
sought to determine whether there was any difference in the overall satisfaction levels
of these two groups.
Burke (2003) and Zeytinogle et al. (2007) conducted studies to determine the
impact on nurses’ job satisfaction of personal experience, organizational efficiency, and
system work load. This is the context from which hypothesis 5 emerged.
Finally, Hypothesis 6 was based on the findings of Newman, Maylor and Charsarkar
(2002) and Tallman (2007), which showed that nurses value their managers’ leadership
behaviors, although these behaviors may or may not promote their own job satisfaction.
SAMPLE
This study was conducted in two Portuguese public hospitals. The two units
comprise a total of 636 beds. We distributed 451 questionnaires and received 289
responses. 23 responses were considered invalid because they were not completed
adequately. Therefore, the final sample consisted of responses from 266 nurses,
including both operational chiefs and staff, and the overall rate of participation was
58.9%.
DATA COLLECTION
The questionnaire used for data collection consisted of three sections. The first
collected biographical data and information related to tasks performed. The second
section was designed to determine nursing leadership performance using the Leadership

9
Effectiveness and Adaptability Description (LEAD), and self-perception using an
adapted version of the original instrument developed by Hersey and Blanchard (1981).
The purpose of using both tools for leaders and followers was to measure and compare
each group’s mean values from LEAD for leadership style (dominant and alternative),
leadership profile, and leadership versatility and adaptability. The third section was the
application of the Professional Satisfaction Indicator (PSI) developed by Pike and
Hudson (1993).
PROCEDURES
We selected two hospitals in which to conduct this study and requested the proper
authorizations to collect data. The questionnaire had been tested previously on a similar
population, and some items were removed that were considered not useful and to
improve the organization of the questionnaire.
DATA ANALYSIS
Data was processed and analyzed using the SPSS 15.0 for Windows. The initial
procedures, after checking for outliers and missing data, consisted of data descriptive
analysis. Then we conducted an inferential analysis—hypothesis testing and
correlation—and fulfilled the requirements for each statistical test.
The statistical analysis focused on determining the differences between head nurses’
perceptions and staff nurses’ perceptions of what constitute the components of
situational leadership, and finding correlations between these determinants and job
satisfaction. We also verified statistical differences in the average job satisfaction levels
of the two groups.
RESULTS

10
The final sample consisted of 22 nurses in management or operational chief
positions and 244 direct employees. Tables 2 and 3 present the biographical data and
data relating to duties, respectively. The “average” head nurse is female, nearly 47 years
of age and with 26 years of professional experience, including 12 years of experience in
operational management and 8 years as the head of the unit. The “average” employee is
also female, 31 years old, with 7.5 years of professional experience and an average
length of stay in the unit of 5 years. Most respondents have a college degree and a
diploma of specialization in nursing. Among the staff, there is a clear predominance of
licensed nurses.
----------------------- Table 2 about here ---------------------
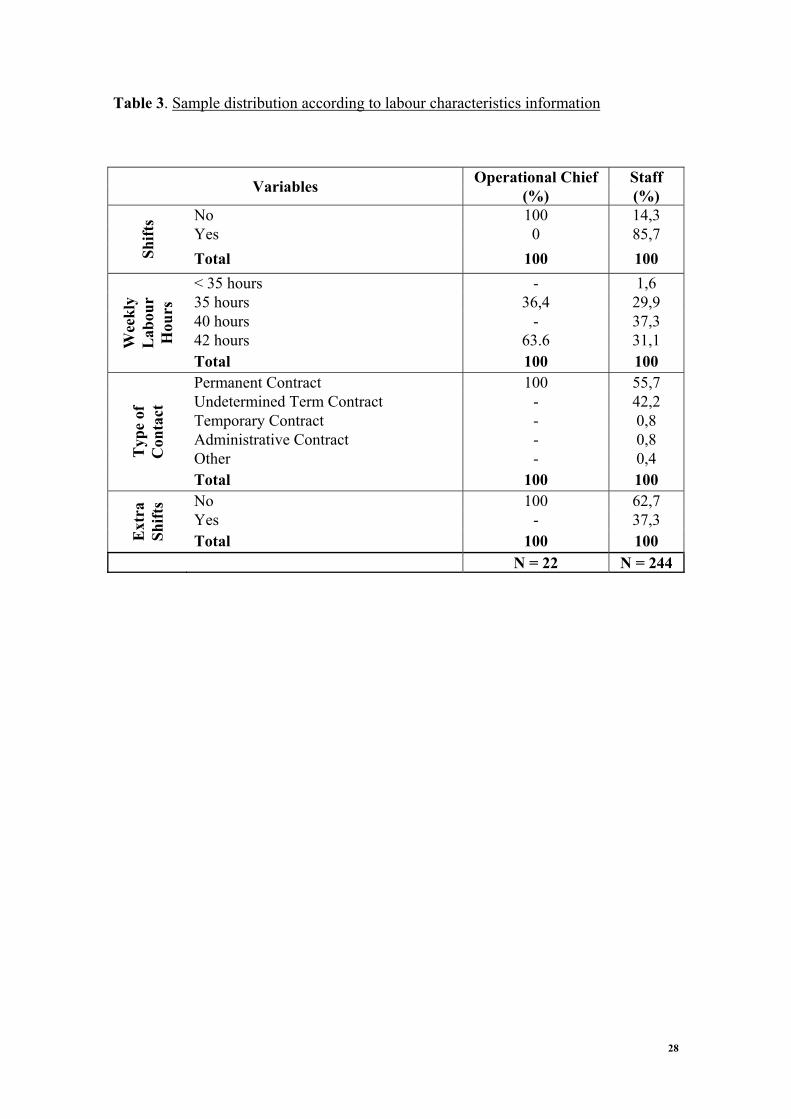
Head nurses work, on average, about 42 hours per week, two hours more than their
employees, and the overwhelming majority of these work in shifts. There is a wide
diversity of employment levels, but most employment is permanent and full time.
----------------------- Table 3 about here ---------------------
Head nurses were asked about management training they had received (Figure 2),
and they reported a satisfactory level of training in only two items (“benchmarking” and
“nursing care management”). The levels of satisfaction for the remaining items were
around 50% and, in some cases, considerably lower. More than 9% of nurses in
management positions have no formal qualifications for the tasks they in which they are
involved.
----------------------- Figure 2 about here ---------------------
SITUATIONAL LEADERSHIP PERCEPTION
There was a connection between head nurses and their direct employees’ vision of
the components of leadership, particularly in what concerns the most frequently

11
mentioned dominant style (S2), alternative style (S3) profile (S2-S3) and versatility
(moderate). The results are presented in Table 4 and Table 5.
----------------------- Table 4 about here ---------------------
The dominant style most often identified by both groups was “persuading” (S2),
followed by “sharing” (S3). For the alternative styles, the groups reversed the order,
with “sharing” (S3) followed by “persuading” (S2).
The profile is another important component of the model. A large concentration of
head nurses fell into only two profiles, the most common being the S2-S3, followed by
S1-S2. The staff nurse group was dispersed in all possible profiles, although the two
most often identified were S2-S3, followed by S1-S2.
In terms of leader versatility, the data analysis revealed a clear prevalence of
“moderate versatility” by both groups, followed by “strong versatility” and “poor
versatility,” but no leaders were seen as being “without versatility.” In terms of
adaptability, head nurses tended to rate themselves as “effective,” while direct
employees tended to consider their leaders’ adaptability “ineffective” (Table 5).
----------------------- Table 5 about here ---------------------
The study also looked at the core competencies required to act as head nurse and
found a similar pattern between leaders and followers, although there were some
differences between what the head nurses and nurses though was essential to understand
the functions in question (Figure 3).
----------------------- Figure 3 about here ---------------------
The importance of interpersonal skills had consensus, while there were major
differences between managerial and operational staff in their views of the roles of
“integrity” and “specific training in management” in competence. Followers gave them
less importance as meaningful leadership attributes than did head nurses.

12
PERCEPTION OF JOB SATISFACTION
Preliminary data obtained from the application of the ISP questionnaire reflect
levels of job satisfaction all the way from 0% to 100%. Thus, stages were defined to
categorize the level of job satisfaction in both groups. These data are presented in Table
6.
----------------------- Table 6 about here ---------------------
We found significant differences in the job satisfaction of head nurses and staff
nurses. Head nurses’ average levels are higher than those of staff nurses; head nurses’
job satisfaction level was predominantly “moderate,” followed by “low,” while staff
nurses’ job satisfaction tended to be “low,” followed by “moderate.” Some of the staff
nurses reported “no satisfaction.”
INFERENTIAL ANALYSIS
Inferential analysis is intended to validate or reject the research hypotheses in order
to provide consistency and robustness to the study’s findings. We subjected several
hypotheses to statistical tests (parametric and nonparametric) and to hypotheses testing.
In all cases, we assumed as the null hypothesis (H0) the non-existence of a relationship
between the variables.
Hypothesis 1 (H1) was tested using the Wilcoxon test to determine whether what
head nurses thought of their leadership profile was similar to what their subordinates
thought of it (Tables 7 and 8).
----------------------- Table 7 about here ---------------------
In most of the service units studied, there was no significant statistical difference
between head nurses’ self-perception and others’ perception of their leadership styles,
so H0 was rejected.
----------------------- Table 8 about here ---------------------

13
Similar to the results on dominant leadership profiles, we found no profound
differences between self-perception and others’ perception and rejected H0.
There was a clear difference in the leadership profiles identified by the two groups,
indicating a significant gap between head nurses’ self-perception and others’
perceptions of their dominant and alternative styles in four services where the study
took place.
Hypothesis 2 (H2) was also tested using the Wilcoxon test in order to determine
differences between head nurses’ self-perceptions and others’ perception of their
leadership styles, but only considering a sub-group of staff nurses that had had less than
one year of service at the current unit.
----------------------- Table 9 about here ---------------------
As shown by the data presented in Table 9, the perception that this group of
employees had of their superiors coincides with the image that the head nurses have of
themselves in relation to the dominant leadership styles. Thus, we do not reject H0.
----------------------- Table 10 about here ---------------------
The data in Table 10, referring to head nurses’ self-perception and others
perceptions of alternative leadership styles, restricted to nurses who had worked less
than one year at the current service unit, do not allow the rejection of H0.
Two other important components of situational leadership are versatility and
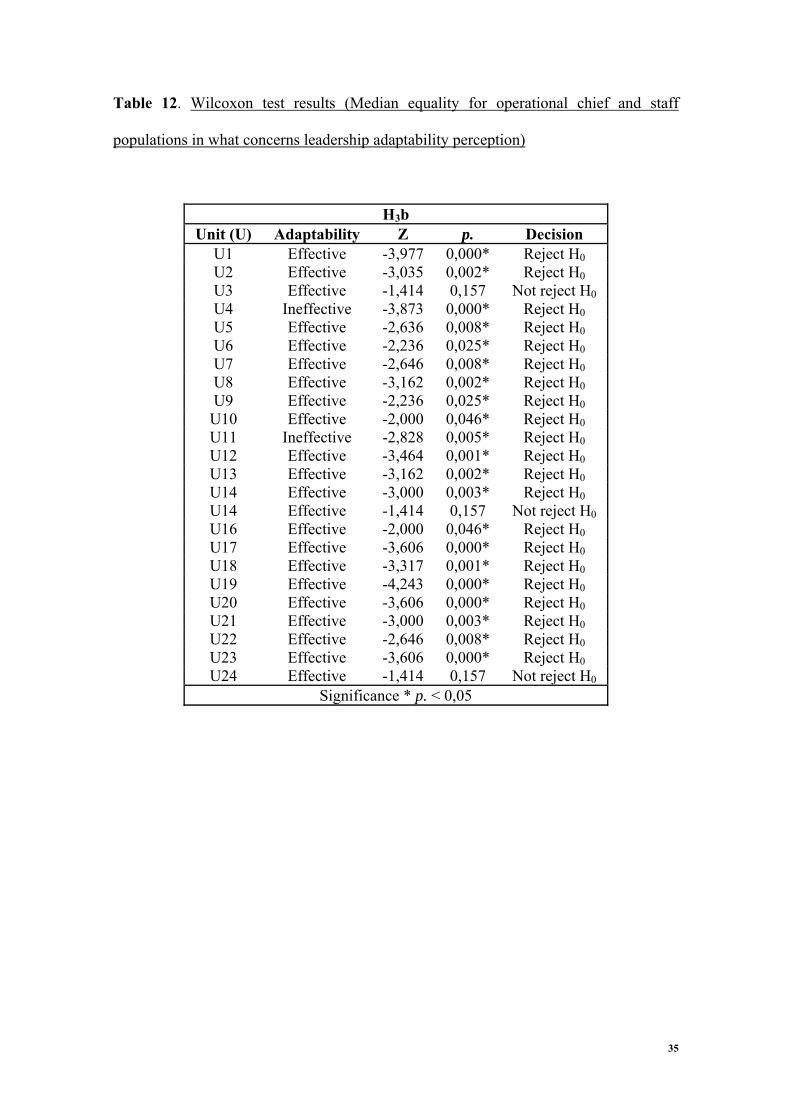
adaptability. Hypothesis 3 (H3) was tested with the Wilcoxon test in order to determine
whether the perception that the leaders have of these two dimensions corresponds to the
perception of their subordinates (Tables 11 and 12).
----------------------- Table 12 about here ---------------------

14
With regard to versatility, we can reject H0 because the perceptions of the two
populations do not match in the majority of the units. The head nurses’ notion of their
leadership versatility is different from that of their employees.
----------------------- Table 12 about here ---------------------
In terms of adaptability there is a deep difference between head nurses’ self-
perceptions and others’ perceptions in the majority of the studied services, so H0 is
rejected.
In addition to assessing qualities related to leadership in the sample, the study also
verified those qualities’ impact on nurses’ job satisfaction. Prior to proceeding with this
part of the analysis, the variable “job satisfaction” was submitted to normality and
homogeneity verification using the Kolmogorov-Smirnov and Levene tests. The results
are presented in Table 13.
----------------------- Table 13 about here ---------------------
After verifying that the “job satisfaction” variable follows a normal distribution and
has equal variances, we tested hypotheses 4, 5, and 6 using the T-Student test.
Hypothesis 4 (H4) was based on the assumption that the average level of job
satisfaction of head nurses and staff nurses would be different. The results after the
application of the T-Student test are shown in Table 14.
----------------------- Table 14 about here ---------------------
The rejection of H0 supports H4: Head nurses’ average level of job satisfaction is
higher than that of staff nurses.
We used the T-Student test to test Hypothesis 5 (H5), dealing with whether job
rotation and overtime work impact job satisfaction, and results are presented in Table
15.
----------------------- Table 15 about here ---------------------

15
The results show that working on a rotating schedule does not appear to be
statistically related to the level of satisfaction, so we do not reject H0.
We also tried to establish a causal relationship between job satisfaction and
overtime work by performing a T-Student test (Table 16).
----------------------- Table 16 about here ---------------------
Similar to what was found for the variable “job rotation,” overtime work does not
seem to impact staff nurses’ level of job satisfaction, so we do not reject H0.
Hypothesis 6 (H6), concerning the relationship between the components of
situational leadership identified in the study and employees’ job satisfaction, breaks
down into three sub-sets: (a) profile; (b) versatility; and (c) adaptability. The first two
sub-sets were analyzed using a One-Way ANOVA test, and the third via a T-Student
test. Table 17 presents the figures related to the influence of the leadership profile on
staff nurses’ job satisfaction.
----------------------- Table 17 about here ---------------------
We verified a statistically significant relationship between the leadership profile
identified by employees and their level of job satisfaction. Profile S2-S3, on average,
was related to higher levels of job satisfaction.
Table 18 presents the results of the One-Way ANOVA test on leadership versatility.
----------------------- Table 18 about here ---------------------
We were not able to establish a statistically significant relationship between
leadership versatility and the level of staff nurses’ job satisfaction, so we do not reject
H0.
Finally we checked to see if there was a link between leadership adaptability and
employees’ job satisfaction using a T-Student test.
----------------------- Table 19 about here ---------------------

16
The results presented in Table 19 show that there is no statistically significant
relationship between leadership adaptability and employees’ job satisfaction, so we do
not reject H0.
CORRELATIONAL ANALYSIS
We also established some correlations between employees’ job satisfaction and
certain variables using the Spearman Coefficient. The results are presented in Table 20.
----------------------- Table 20 about here ---------------------
Through the correlation matrix, we established three associations, with positive
signal and poor intensity, between the variables “job satisfaction,” “age groups,” “time
in the professional category” and “leadership profile.”
DISCUSSION
The qualifications of head nurses are in accordance with what is prescribed by law
(Law-Decree 437/91) that regulates nurses’ employment in Portugal. However, most
management positions are held by licensed nurses appointed directly by the hospital
Board of Directors. When such appointments are not combined with management-
specific training, process failures in operational management can result. Training for
skills in this area is an investment that complements the head nurse’s academic degree
and professional specialization.
We found that a large investment in training was made in areas such as performance
evaluation and nursing care management; however, there were significant deficits in
other important areas necessary to the efficient functioning of health facilities; these
areas include recruitment, selection, personnel integration, and organizational structure
and administrative processes. More than 9% of nurses who were leading hospital units

17
had no management training but were graduate nurses appointed by the hospital Board
of Directors.
Considering the requirements required to perform as head nurses that were
advocated by Frederico and Leitão (1999) and Gaspar et al. (2000), failing to train these
professionals in the necessary management and leadership skills is harmful to health
organizations. Pereira (1997) stated that, since health management is a serious matter, it
must be performed by seasoned professionals and not by amateurs. Lambert (2003)
added that leaders should be permanent learners, subjected to continuing education
programs that develop their potential and continuously improve their leadership skills.
The prevalence of structuring behaviors in the sample, rather than socio-emotional
support behaviors (S2), is not surprising because the staff nurse sample was relatively
young (age 31) and inexperienced (7 years in the profession). However, this style is
supported by behavioral alternative styles that do not focus entirely on supervision (S3)
and is adjusted to the staff’s stage of development. This is reflected on the profile
predominately identified by head nurses and staff (S2-S3), which will enhance
employees’ development. Shilling (2007) argued that there should be a perfect match
between how the leader sees herself or himself, the reality of his or her staff, and the
situation or context in which he or she operates to promote behavioral adequacy rather
than the forced adaptation of behaviors.
The hospital environment is prone to constant change, requiring head nurses
(leaders) to have higher levels of versatility in order to maximize efficiency. The results
of this study are similar to what is theoretically recommended for hospitals, and the
prevalence of a moderately versatile leadership shows that versatility is not in itself a
potential concern. Kosinska and Niebró (2003) also observed that nurses must assume

18
different roles and adjust them to sudden and unexpected scenarios in the environments
in which they operate.
In terms of the effectiveness of leadership adaptability, there was an almost
complete discrepancy between the perceptions of head nurses and staff nurses. Head
nurses reported that their leadership adaptability is effective, while the staff disagree.
This is a potentially dangerous situation since, according to Jooste (2004), head nurses
are facing a paradigm shift in health care that requires an adaptation to new realities in
order to lead and influence those under their supervision.
This study also identified core competencies to perform management functions.
Here there was not a big discrepancy in the two populations studied. The most
frequently referenced competencies were interpersonal skills and management integrity
and training, although head nurses attributed greater significance to management
training than staff nurses did. Jiang et al. (2008) suggested that head nurses, service and
department directors and top management must understand that there is a range of
essential behaviors and skills needed to perform in operational management.
Mentioning this issue is not the same as recommending the removal of those individuals
who do not fit the ideal profile but, rather, is intended to reinforce the idea that training
is essential for these individuals.
Inferential analysis on the components of situational leadership (styles, versatility
and adaptability) revealed a gap between the perceptions of the two groups. This gap
may be due to distortions of the feedback mechanisms. Strategies should be developed
to enhance the communication lines that maximize feedback in order to expand the
public area of the Johari Window and add efficiency for hospitals.
These kinds of results for leadership perception differences have already been
studied and reported in the literature. For example, Kleinman (2004) found
19
discrepancies between head nurses’ self-perceptions and the perceptions of others who
interacted directly with the head nurses a few hours per week. Other studies, such as
Galvão et al. (1998) and Wehbe and Galvão (2005), showed less pronounced
differences that were related only to leadership styles, but they still found that the two
key strengths of head nurses were communication and organization of work.
The only test that showed a total agreement between head nurses’ self-perceptions
and others’ perceptions concerning dominant and alternative leadership styles was when
the staff nurse sample was limited to those who had worked in the unit for less than a
year. This agreement may be due to the fact that the integration and socialization
process requires greater proximity to the operational chief, enhancing mutual
knowledge.
Our findings reveal average levels of job satisfaction for head nurses and lower
levels for staff nurses. This situation can have an adverse impact on the care provided to
patients since lower levels of job satisfaction can lead to feelings of emotional
detachment from the employer, which can result in decreased quality of health care. We
also verified that working in shifts and working overtime did not have a significant
impact on employee satisfaction, perhaps because these are considered as part of the job
in nursing. Lower rates of job satisfaction among staff nurses, particularly those who are
in effective care jobs, were described by Curtis (2007) and Cortese (2007), who pointed
out that the lack of prospects for career development, relational problems with other
professional classes working together, and the interaction with patients and their
families were major causes.
On the relationship between leadership components and job satisfaction, we found
that only the leadership profile, particularly the S2-S3, is statistically significantly related
to job satisfaction. This result may be due to the fact that the vast majority of

20
individuals in the workplace have average levels of maturity, requiring a profile that
combines average levels of task and relationship behaviors. This is considered a “safe
profile” and appears to be a promoter of job satisfaction. This relationship was
described by Cortese (2007), who showed that a leader can be a strong satisfaction-
promoter when she or he knows how to use influence appropriately.
In the correlation analysis the relationship between job satisfaction and the variables
of “age group” and “time in the professional category” may be due to the fact that,
overall, older nurses occupy higher professional categories, especially under the system
of automatic career progression and, therefore, receive higher salaries compared to their
peers who are in earlier stages of their careers. It should be no surprise that individuals
who have received promotions and salary increases and are near the top of their careers
report higher levels of job satisfaction.
The correlation between the leadership profile and job satisfaction makes sense
because nursing requires a high level of critical assessment and decision-making skill at
all stages of a patient’s therapeutic process, so leadership styles that are based on socio-
emotional support behaviors and less on structure and task supervision are likely to
enhance employees’ job satisfaction.
LIMITATIONS AND FUTURE RESEARCH
The primary limitation of the study is related to the sample. Although the overall
participation rate (58.9%) was satisfactory, we could have expanded the sample to
include more hospitals.
Another limitation is related to not examining the staff’s level of maturity as defined
by the situational leadership theoretical model. We decided not to include this variable
because it would further extend the size of the data collection questionnaire, which was
already very long.

21
Future research could address maturity as part of the study of leadership styles and
job satisfaction. It could also include breaking the general assessment of satisfaction
into a more detailed approach that covers all of its dimensions.
CONCLUSIONS
Understanding leadership and the perceptions that leaders and followers have of its
dimensions, as well its relationship to job satisfaction is important for operational,
middle and top management. This study determined a need to invest in head nurses’
training in managerial functions in order to improve management efficiency of health-
care units.
We also verified that a significant effort must be made to decrease the difference
between head nurses’ self-perception and that of their nursing staff so a common
language is shared within service units. Reinforcing the importance of leadership in
hospitals, the study demonstrated the strong impact of the leaders’ profile on their
staffs’ level of job satisfaction. Promoting leadership behaviors that enhance job
satisfaction among staff nurses will lead to improvements in service quality and result in
health gains for the population.

22
REFERÊNCIAS
Avolio, B. J., & Bass, B. M. (1999). Re-examining the components of
transformational and transactional leadership. Journal of Occupational Organizational
Psychology, 72 (3), 441-462.
Balsanelli, A. P., & Cunha, I. C. (2006). Liderança no contexto de enfermagem.
Revista de Enfermagem, 40 (1), 117-122.
Bass, B. M. (1999) On the taming of charisma. Leadership Quarterly, 10 (4), 541-
553.
Burke, R.J. (2003). Hospital restructuring, workload, and nursing staff satisfaction
and work experiences. Health Care Manager, 22 (2), 99-107.
Cavanagh, S. J. (1992). Job satisfaction of nursing staff working in hospitals.
Journal of Advanced Nursing, 17 (6), 704-711.
Cervo, A. L., & Bervian, P. A. (2002). Metodologia Cientifica. São Paulo: Prentice-
Hall.
Clayton, M. (2008). Super Models. Training Journal, 7 (6), 70.
Cortese, C. G. (2007). Job satisfaction of Italian nurses: An exploratory study.
Journal of Nursing Management, 15 (3), 303-312.
Curtis, E. A. (2007). Job satisfaction: A survey of nurses in the Republic of Ireland.
Journal of International Council of Nurses, 54 (1), 92-99.
Decreto-Lei n.º 437/91.
Frederico, M., & Leitão, M. A. (1999). Princípios de Administração para
Enfermeiros. Coimbra: Edições Sinais Vitais.
Galpin (1995) – Pruning the grapevine. Training & Development, 49 (4), 28-33.

23
Galvão, M. C., Trevizan, M. A., Sawada, N. O., & Coleta, J. A. D. (1998).
Liderança Situacional: Estrutura de referência para o trabalho do enfermeiro-líder no
contexto hospitalar. Revista Latino-americana de Enfermagem, 6 (1), 81-90.
Gaspar, M. F., Cardoso, M. B., Brites, M. F., & Briz, M. T. (2000). Percepção e
imagens do papel do enfermeiro-chefe. Pensar Enfermagem, 4 (2), 4-11.
Graeff, C. L. (1997). Evolution of Situational Leadership Theory: A Critical
Review. Leadership Quarterly, 18 (2), 110-116.
Gates, P. E., Blanchard, K. H., & Hersey, P. (1976). Diagnosing educational
leadership problems: A situational approach. Educational Leadership, 33 (4), 348-354.
Hersey, P., & Blanchard, K. H. (2005). Psicologia para Administradores – A Teoria
e as Técnicas da Liderança Situacional. São Paulo: Editora Pedagógica e Universitária.
Hersey, P., & Blanchard, K. H. (1982). Leadership style: Attitudes and behaviors.
Training and Development Journal, 36 (5), 50-52.
Hersey, P., & Blanchard, K. H. (1981). So you want to know your leadership style?
Training and Development Journal, 35 (6) 34-54.
Hersey, P., & Blanchard, K. H. (1974). What’s missing in MBO? Management
Review, 63 (10), 25-32.
Jesuíno, J. C. (2005). Processos de Liderança. Lisboa: Livros Horizonte.
Jiang, H., Lockee C., Bass, K., & Fraser, I. (2008). Board engagement in quality:
Findings of survey of hospital and system leaders. Journal of Health Care Management,
53 (2), 121-135.
Jooste, K. (2004). Leadership: A new perspective. Journal of Nursing Management,
12 (3), 217-223.

24
Kleinman, C. (2004). The relationship between managerial leadership behaviors and
staff nurse retention. Hospital Topics: Research and Perspectives on Healthcare, 82 (4),
2-9.
Kosinska, M., & Niebró, L. (2003) – The position of a leader nurse. Journal of
Nursing Management, 11 (2), 69-72.
Lambert, L. (2003). Leadership redefined: an evocative context for teacher
leadership. School Leadership & Management, 23(4), 421-430.
Little, L. (2005). Lessons in leadership: Leadership communication and the Johari
Window. Administrator, 24 (3), 4.
McGregor, D. (1973). Motivação e Liderança. São Paulo: Brasiliense.
Miguel, A., Rocha, A., & Röhrich, O. (2008). Gestão emocional de equipas em
ambiente de projecto. Lousã: Editora de Informática.
Mrayyan, M.T. (2006). Jordanian nurses’ job satisfaction, patients’ satisfaction and
quality of nursing care. International Nursing Review, 53 (3), 224–230.
Munari, D. B., & Bezerra, A. L. Q. (2004). Inclusão da competência interpessoal na
formação do enfermeiro como gestor. Revista Brasileira de Enfermagem, 57 (4), 484-
486.
Newman, K., Maylor, U., & Charsarkar, B. (2002). The nurse satisfaction, service
quality and nurse retention chain: Implications for management of recruitment and
retention. Journal of Management in Medicine, 16 (5), 271-292.
Oliveira, S. L. (1999). Sociologia das organizações: Uma análise dos homens e das
empresas no ambiente competitivo. São Paulo: Pioneira.
Pereira, T. Q. (1997). O enfermeiro gestor: Uma perspectiva portuguesa.
Enfermagem – Publicação da Associação Portuguesa de Enfermeiros e da Associação
de Enfermeiros de Sala de Operações Portugueses, 8 (2), 33-36.
25
Pike, C. K., & Hudson, W. W. (1993). Index of Job Satisfaction. Accessed through
http://www.walmyr.com/onlineorder.html.
Rice, R. W., McFarlin, D. B, Hunt, R. G., & Near, J. P. (1985). Job importance as a
moderator of the relationship between job satisfaction and life satisfaction. Basic and
Applied Social Physiology, 6 (4), 297-316.
Robbins, S. P. (2006). Comportamento Organizacional. São Paulo: Pearson
Education.
Shilling, J. (2007) Leaders romantic conceptions of the consequences of leadership.
Applied Psychology: An International Review, 56 (4), 602-623.
Tallman, R. (2007). Does trust matter?: Perceptions, trust and job satisfaction of
hospital nurses. International Journal of Business Research, 7 (4), 166-174.
Tannenbaun, R., & Schmidt, W. H. (1973). How to choose a leadership patterns.
Harvard Business Review, 51 (3), 162-180.
Tannenbaun, R., Weschler, J. R., & Massarik, F. (1970) Liderança e organização:
uma abordagem à ciência do comportamento. São Paulo: Atlas
Wehbe, G., & Galvão, M C. (2005). Aplicação da liderança situacional em
enfermagem de emergência. Revista Brasileira de Enfermagem, 58 (1), 33-38.
Yura, H., Ozimek, D., & Walsh, M. B. (1981). Nursing leadership: theory and
process. Nova Iorque: Appleton-Century-Crofts.
Zeytinoglu, I.U., Denton M, Davies, S., Baumann, A., Blythe, J., & Boos, L. (2007).
Associations between Work Intensification, Stress and Job Satisfaction: The Case of
Nurses in Ontario. Relations Industrielles/Industrial Relations, 62(2), 201-225.

26
Table 1. Research hypothesis
HYPOTHESIS 1 Self and others’ perception are different in what concerns: a. Dominant leadership styles
b. Alternative leadership styles
HYPOTHESIS 2 Self and others’ perception are different, for nurses that work in a unit for less than one year, in what concerns: c. Dominant leadership styles
a. Alternative leadership styles
HYPOTHESIS 3 Chief nurses and staff nurses values are different in what concerns: a. Leadership versatility
b. Leadership adaptability
HYPOTHESIS 4 Chief nurses and staff nurses’ job satisfaction related values are different.
HYPOTHESIS 5 Staff nurses level of job satisfaction is independent from: a. Working in shifts
b. Working overtime
HYPOTHESIS 6 Staff nurses level of job satisfaction is independent from: a. Leadership profile perception
b. Leadership versatility perception c. Leadership adaptability perception

27
Table 2. Sample distribution according to biographical data
Variables Operational Chief Staff (%) (%)
Sex Male 13,6 15,2
Female 86,4 84,8 Total 100 100
Age
Gro
ups
< 25 years old - 23,0 [25-30[ years old - 31,1 [30-35[ years old - 19,3 [35-40[ years old - 11,1 [40-45[ years old 31,8 9,4 [45-50[ years old 36,4 4,5 [50-55[ years old 27,1 1,2 ≥ 55 years old 4,5 0,4 Total 100 100
Prof
essi
onal
an
d A
cade
mic
Q
ualif
icat
ions
Degree 13,6 96,7 Degree and Specialization 63,6 2,9 Masters - 0,4 General Course and Specialization 18,2 - Masters and Specialization 4,5 - Total 100 100
Prof
essi
onal
C
ateg
ory
Level I - 53,7 Level II - 1,2 Graduate 13,6 42,2 Specialist 4,5 2,0 Chief 81,8 - Total 100 100
N = 22 N = 244
28
Table 3. Sample distribution according to labour characteristics information
Variables Operational Chief Staff (%) (%)
Shift
s No 100 14,3 Yes 0 85,7 Total 100 100
Wee
kly
Lab
our
Hou
rs
< 35 hours - 1,6 35 hours 36,4 29,9 40 hours - 37,3 42 hours 63.6 31,1 Total 100 100
Typ
e of
C
onta
ct
Permanent Contract 100 55,7 Undetermined Term Contract - 42,2 Temporary Contract - 0,8 Administrative Contract - 0,8 Other - 0,4 Total 100 100
Ext
ra
Shift
s No 100 62,7 Yes - 37,3 Total 100 100
N = 22 N = 244

29
Table 4. Sample distribution according to: dominant leadership styles; alternative
leadership styles; and leadership profiles
Variables Operational Chief Staff (%) (%)
Leadership Styles D
omin
ant
S1 4,5 17,2 S2 63,6 48,8 S3 31,8 19,7 S4 - 6,6 No style - 7,8 Total 100 100
Alte
rnat
ive
S1 18,2 24,2 S2 36,4 30,3 S3 45,5 31,6 S4 - 5,7 No style - 8,2 Total 100 100
Leadership Profiles
Lea
ders
hip
Prof
ile S1-S2 22,7 30,7
S1-S3 - 4,9 S1-S4 - 4,1 S2-S3 77,3 39,3 S2-S4 - 2,9 S3-S4 - 4,5 No profile - 13,5 Total 100 100
N = 22 N = 244

30
Table 5. Sample distribution according to leadership versatility and adaptability
Variables Operational Chief Staff (%) (%)
Leadership VersatilityV
ersa
tility
No versatility (1 style) - -
Weak versatility (2 styles) 9,1 14,8
Moderate versatility (3 styles) 68,2 54,9
Strong versatility (4 styles) 22,7 30,3
Total 100 100 Leadership Adaptability
Eff
ectiv
enes
s Ineffective [-24;0] 9,1 90,2
Effective [0;24[ 90,9 9,8
Total 100 100 N = 22 N = 244
Table 6. Sample distribution according to the level of job satisfaction
Variable Operational Chief Staff (%) (%)
Job
Satis
fact
ion
No Satisfaction < 50% 4,5 3,7
Weak Satisfaction [50%-70%[ 31,8 58,6
Moderate Satisfaction [70%85%[ 59,1 36,1
Strong Satisfaction ≤ 86% 4,5 1,6
Total 100 100 N = 22 N = 244

31
Table 7. Wilcoxon test results (Median equality for operational chief and staff
populations in what concerns leadership dominant styles perception)
H1a Unit (U) Dominant Style Z p. Decision
U1 S2 -3,624 0,000* Reject H0 U2 S2 -1,265 0,206 Not reject H0 U3 S2 -2,640 0,008* Reject H0 U4 S1 -3,531 0,000* Reject H0 U5 S2 -2,640 0,008* Reject H0 U6 S3 -2,041 0,041* Reject H0 U7 S2 -2,456 0,014* Reject H0 U8 S3 -2,919 0,004* Reject H0 U9 S3 -2,121 0,034* Reject H0
U10 S2 -1,890 0,059 Not reject H0 U11 S2 -2,598 0,009* Reject H0 U12 S2 -3,089 0,002* Reject H0 U13 S3 -2,859 0,004* Reject H0 U14 S2 -2,739 0,006* Reject H0 U14 S2 -1,414 0,157 Not reject H0 U16 S2 -1,841 0,066 Not reject H0 U17 S2 -3,213 0,001* Reject H0 U18 S3 -2,971 0,003* Reject H0 U19 S3 -3,752 0,000* Reject H0 U20 S2 -3,219 0,001* Reject H0 U21 S2 -2,739 0,006* Reject H0 U22 S2 -2,388 0,017* Reject H0 U23 S2 -3,500 0,000* Reject H0 U24 S3 -1,414 0,157 Not reject H0
Significance * p. < 0,05

32
Table 8. Wilcoxon test results (Median equality for operational chief and staff
populations in what concerns alternative leadership styles perception)
H1b Unit (U) Alternative Style Z p. Decision
U1 S3 -3,753 0,000* Reject H0 U2 S1 -0,614 0,539 Not reject H0 U3 S1 -1,298 0,194 Not reject H0 U4 S2 -3,464 0,001* Reject H0 U5 S3 -2,392 0,017* Reject H0 U6 S2 -2,041 0,041* Reject H0 U7 S3 -2,384 0,017* Reject H0 U8 S2 -2,831 0,005* Reject H0 U9 S2 -2,121 0,034* Reject H0
U10 S3 -2,000 0,046* Reject H0 U11 S1 -2,565 0,010* Reject H0 U12 S3 -3,082 0,002* Reject H0 U13 S2 -2,850 0,004* Reject H0 U14 S3 -2,719 0,007* Reject H0 U14 S1 -1,342 0,180 Not reject H0 U16 S3 -1,841 0,066 Not reject H0 U17 S3 -3,228 0,001* Reject H0 U18 S2 -2,994 0,003* Reject H0 U19 S2 -3,772 0,000* Reject H0 U20 S3 -3,246 0,001* Reject H0 U21 S3 -2,680 0,007* Reject H0 U22 S1 -2,388 0,017* Reject H0 U23 S3 -3,304 0,001* Reject H0 U24 S2 -1,414 0,157 Not reject H0
Significance * p. < 0,05

33
Table 9. Wilcoxon test results (Median equality for operational chief and staff
populations, with less than one year working at the current service unit, in what
concerns dominant leadership styles perception)
H2a Unit (U) Dominant Style Z p. Decision
U2 S2 -1,633 0,102 Not reject H0 U3 S2 -1,414 0,157 Not reject H0 U4 S1 -1,633 0,102 Not reject H0 U6 S3 -1,414 0,157 Not reject H0 U8 S3 -1,414 0,157 Not reject H0 U9 S3 -1,414 0,157 Not reject H0
U11 S2 -1,633 0,102 Not reject H0 U18 S3 -1,841 0,066 Not reject H0 U19 S3 -1,633 0,102 Not reject H0 U20 S2 -1,342 0,180 Not reject H0 U21 S2 -1,732 0,083 Not reject H0 U23 S2 -1,414 0,157 Not reject H0
Significance * p. < 0,05
Table 10. Wilcoxon test results (Median equality for operational chief and staff
populations, with less than one year working at the current service unit, in what
concerns alternative leadership styles perception)
H2b Unit (U) Alternative Style Z p. Decision
U2 S1 -1,633 0,102 Not reject H0 U3 S1 -1,000 0,317 Not reject H0 U4 S2 -1,633 0,102 Not reject H0 U6 S2 -1,342 0,180 Not reject H0 U8 S2 -1,342 0,180 Not reject H0 U9 S2 -1,414 0,157 Not reject H0
U11 S1 1,604 0,109 Not reject H0 U18 S2 -1,841 0,066 Not reject H0 U19 S2 -1,604 0,109 Not reject H0 U20 S3 1,342 0,180 Not reject H0 U21 S3 -1,633 0,102 Not reject H0 U23 S3 -1,414 0,157 Not reject H0
Significance * p. < 0,05

34
Table 11. Wilcoxon test results (Median equality for operational chief and staff
populations in what concerns leadership versatility perception)
H3a Unit (U) Versatility Z p. Decision
U1 Moderate -3,977 0,000* Reject H0 U2 Moderate -3,035 0,002* Reject H0 U3 Moderate -1,414 0,157 Not reject H0 U4 Moderate -3,419 0,001* Reject H0 U5 Moderate -2,636 0,008* Reject H0 U6 Strong -2,060 0,039* Reject H0 U7 Moderate -2,414 0,016* Reject H0 U8 Moderate -2,913 0,004* Reject H0 U9 Moderate -2,236 0,025* Reject H0
U10 Moderate -2,000 0,046* Reject H0 U11 Strong -2,565 0,010* Reject H0 U12 Strong -3,115 0,002* Reject H0 U13 Weak -2,913 0,004* Reject H0 U14 Moderate -2,701 0,007* Reject H0 U14 Weak -1,342 0,180 Not reject H0 U16 Moderate -1,841 0,066 Not reject H0 U17 Moderate -3,270 0,001* Reject H0 U18 Moderate -3,066 0,002* Reject H0 U19 Moderate -3,874 0,000* Reject H0 U20 Moderate -3,250 0,001* Reject H0 U21 Moderate -2,754 0,006* Reject H0 U22 Strong -2,530 0,011* Reject H0 U23 Moderate 3,270 0,001* Reject H0 U24 Strong -1,342 0,180 Not reject H0
Significance * p. < 0,05
35
Table 12. Wilcoxon test results (Median equality for operational chief and staff
populations in what concerns leadership adaptability perception)
H3b Unit (U) Adaptability Z p. Decision
U1 Effective -3,977 0,000* Reject H0 U2 Effective -3,035 0,002* Reject H0 U3 Effective -1,414 0,157 Not reject H0 U4 Ineffective -3,873 0,000* Reject H0 U5 Effective -2,636 0,008* Reject H0 U6 Effective -2,236 0,025* Reject H0 U7 Effective -2,646 0,008* Reject H0 U8 Effective -3,162 0,002* Reject H0 U9 Effective -2,236 0,025* Reject H0
U10 Effective -2,000 0,046* Reject H0 U11 Ineffective -2,828 0,005* Reject H0 U12 Effective -3,464 0,001* Reject H0 U13 Effective -3,162 0,002* Reject H0 U14 Effective -3,000 0,003* Reject H0 U14 Effective -1,414 0,157 Not reject H0 U16 Effective -2,000 0,046* Reject H0 U17 Effective -3,606 0,000* Reject H0 U18 Effective -3,317 0,001* Reject H0 U19 Effective -4,243 0,000* Reject H0 U20 Effective -3,606 0,000* Reject H0 U21 Effective -3,000 0,003* Reject H0 U22 Effective -2,646 0,008* Reject H0 U23 Effective -3,606 0,000* Reject H0 U24 Effective -1,414 0,157 Not reject H0
Significance * p. < 0,05

36
Table 13. Kolmogorov-Smirnov and Levene tests results concerning job satisfaction
Kolmogorov-Smirnov Test N. 244
Parameters Mean 66,0% Standard Deviation 10,3
Z 0,806 p. 0,534
Decision Not reject H0 Levene Test
F 0,054 p. 0,816
Decision Not reject H0
Table 14. T-Student test results for the mean comparison of job satisfaction
Group Mean Standard Deviation p. Decision Operational Chief 71,7% 10,0 0,015* Reject H0 Staff 66,0% 10,3
Significace * p. < 0,05
Table 15. T-Student test results to determine the influence of shift work in staff Job
satisfaction
H5a Rotation Schedule Mean Standard Deviation p. Decision No 64,5% 10,3 0,340 Not reject H0 Yes 66,3% 10,3
Significance * p. < 0,05

37
Table 16. T-Student test results to determine the influence of overtime work at the staff
level of job satisfaction
H5b Overtime Work Mean Standard Deviation p. Decision
No 66,4% 10,6 0,416 Not reject H0 Yes 65,3% 9,8 Significance * p. < 0,05
Table 17. One-way ANOVA test results to determine the influence of leadership profile
perception on the staff level of job satisfaction
H6a Profile Average Standard Deviation F. p. Decision S1-E2 63,6% 10,3
7,400 0,000* Reject H0
S1-E3 61,4% 11,3 S1-E4 56,3% 14,1 S2-E3 70,0% 8,5 S2-E4 66,0% 9,6 S3-E4 57,0% 10,1
Significance * p. < 0,05
Table 18. One-way ANOVA test results to determine the influence of leadership
versatility perception on the staff level of job satisfaction
H6b Versatility Average Standard Deviation F. p. Decision
Weak 66,9% 11,3 0,288 0,750 Not reject H0 Moderate 66,2% 10,3
Strong 65,4% 9,9 Significance * p. < 0,05

38
Table 19. T-Student test results to determine the influence of leadership adaptability on
the staff level of job satisfaction
H6c Adaptability Mean Standard Deviation p. Decision
Ineffective 64,6% 11,8 0,464 Not reject H0 Effective 66,2% 10,2 Significance * p. < 0,05
Table 20. T-Student test results to determine leadership adaptability influence on the
staff level of job satisfaction
Correlation Matrix
Job
Satis
fact
ion
0,131 Age groups 0,041*
244 0,127
Time at current professional category 0,048*
244 0,169
Leadership Profile 0,008** 244
Data sequence: coefficient, significance e cases * Correlation has significance at 0,05
** Correlation has significance at 0,01

39
Known to self Unknown to self
Known to others
Unknown to others Unknown
Public Blind
Secret
Figure 1. Johari Window
Hersey & Blanchard (2005)
Figure 2. Sample distribution according to management training received by nurses in
leadership roles
31,8%
59,1%
54,5%
45,5%
50,0%
95,5%
72,7%
40,9%
45,5%
9,1%
Organizational structure/Administrative processes
Material resources management
Personnel calculation and allocation
Recruitment and selection
Staff integration
Performance evaluation
Nurse care management
Global quality management
Internal auditing
Without management training

40
Figure 3. Sample distribution according to the main skills considered to perform tasks
as operational chief
22,7%
31,8%
50,0%
59,1%
72,7%
0,0%
0,0%
13,6%
86,4%
45,5%
45,5%
72,7%
38,3%
44,3%
52,9%
54,5%
56,1%
4,9%
13,5%
13,5%
84,8%
60,2%
35,7%
52,0%
Energy/Vitality
Stress tolerance
Self‐confidence
Emotional maturity
Integrity
Achievement need
Low affiliation need
Persuasion ability
Interpersonal abilities
Cognitive abilities
Technical abilities
Management specific training
Staff
Operational Chief
![lawfilesext.leg.wa.govlawfilesext.leg.wa.gov/law/WACArchive/2017/WAC 296... · (12/20/16) [Ch. 296-823 WAC p. 1] Chapter 296-823 Chapter 296-823 WAC OCCUPATIONAL EXPOSURE TO BLOODBORNE](https://static.fdocuments.us/doc/165x107/601395970217fa5158222c71/296-122016-ch-296-823-wac-p-1-chapter-296-823-chapter-296-823-wac-occupational.jpg)

![leg.wa.govleg.wa.gov/CodeReviser/WACArchive/Documents/2012/WAC-296-826... · (2/17/09) [Ch. 296-826 WAC—p. 1] Chapter 296-826 Chapter 296-826 WAC ANHYDROUS AMMONIA WAC 296-826-100](https://static.fdocuments.us/doc/165x107/5b2b78217f8b9ae6278b475f/legwa-21709-ch-296-826-wacp-1-chapter-296-826-chapter-296-826-wac.jpg)


![Chapter 296-841 Chapter 296-841 WAC AIRBORNE …lawfilesext.leg.wa.gov/law/WACArchive/2013/WAC-296-841-CHAPTE… · (2/20/07) [Ch. 296-841 WAC—p. 1] Chapter 296-841 Chapter 296-841](https://static.fdocuments.us/doc/165x107/605db1edd2831252ec0d5d41/chapter-296-841-chapter-296-841-wac-airborne-22007-ch-296-841-wacap-1.jpg)


