CEE Real Estate market outlook
16
CEE Real Estate market outlook | Mark Robinson February 2017
Transcript of CEE Real Estate market outlook

CEE Real Estate market outlook | Mark Robinson February 2017
Colliers International 20172
The CEE region is becoming more popular and relevantShare of mind: the largest share in a down-turning European cycle
0.0%
1.0%
2.0%
3.0%
4.0%
5.0%
6.0%
7.0%
Jun09
Jun10
Jun11
Jun12
Jun13
Jun14
Jun15
Jun16
% of total EMEA investment volumes into CEEcountries
% of half-yearly total European investment into CEE-6
0
2
4
6
8
0
40
80
120
160
200
Jun-07 Jun-09 Jun-11 Jun-13 Jun-15
Total European investment volume (EUR bn)
CEE investment volume (EUR bn, rhs)
European and CEE-6 investment flows (EUR bn)

Colliers International 20173
Investment state of play Hungary‘s investment volumes accelerating out of 2012-13 trough
4.7
3.8
1.7
0.87 0.850.26
0
1
2
3
4
5
Investment volumes into the region in 2016
(EUR bn)
Source: Real Capital Analytics, Colliers International, data as of 1 January 2017
1088
436
2103
755
364 305
660
122
361596 627
1687
0
500
1000
1500
2000
2500
Investment volumes in Hungary (EUR m)
Source: BRF, Colliers International
Colliers International 20174
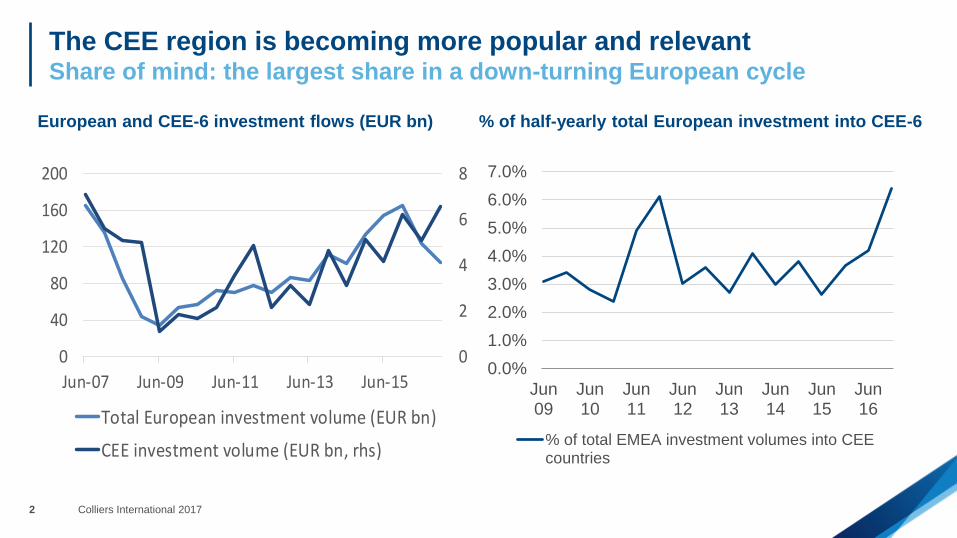
The continued domestication of investment in HungaryRise of Austrian, US and German money into Hungary
2014 origin of investments
Source: Colliers International
2016 origin of investments
Source: Colliers International
38.5%
18.0%
17.1%
9.2%
7.9%
7.4%1.6% 0.3%
37.2%
16.1%13.5%
13.3%
5.6%
3.4%
3.4%
3.1%1.7% 1.2% 0.8% 0.6% 0.3%Hungary
USAAustriaGermanyGreeceSlovakiaMENANetherlandsUKChinaSwitzerlandOtherIsrael

Colliers International 20175
Germany leads CEE – a steady ship, for nowLeading indicator of CEE economic sentiment with 4-month lag
German IFO Expectations survey and economic sentiment in CEE countries
Source: Bloomberg
70
80
90
100
110
120
German IFO Expectations subcomponent (lagged 4 months) CEE6 composite ESI sentiment indicator

Colliers International 20176
If CEE “is left alone”, future flows look promisingConsumers a leading indicator for likely investment volumes
Lagged composite consumer confidence versus investment volumes into CEE6
Source: Real Capital Analytics, Bloomberg, Colliers International
-48
-36
-24
-12
0
0
2
4
6
8
Jun-09 Jun-10 Jun-11 Jun-12 Jun-13 Jun-14 Jun-15 Jun-16 Jun-17 Jun-18
Investment into CEE6 real estate (EURbn)
EC composite consumer confidence for CE6 (18-month lagged, rhs)
?

Colliers International 20177
State of play with prime yields – still compressingQ4 2016 key sector capital city prime yields
Prime yields (compression vs Q3 2016 circled)
Source: Colliers International
4.85
6.50
5.25
6.50
7.50
9.00
6.25
8.25
6.50
7.75
9.00
11.00
5.00
6.25
5.255.75
7.00
8.50
0.00
2.00
4.00
6.00
8.00
10.00
12.00
Prague Budapest Warsaw Bratislava Bucharest Sofia
Office Industrial Retail TSC
Colliers International 20178
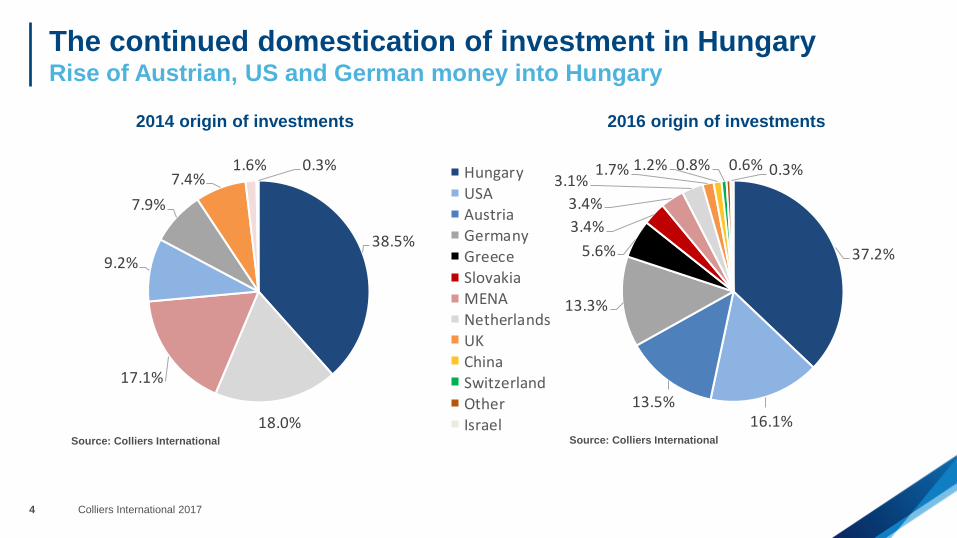
Chill wind for bonds in CEERiskier markets mirroring the move up in US Treasury yields
10-year bond yields in CEE and Turkey (%) * Change in 10-year yields since 31 Oct (bps) *
Source: Investing.com * Slovak yields are on 8-year bonds Source: Investing.com
3.10 3.08
0.47 0.20
3.001.93
9.82
3.863.69
0.69 0.54
3.69
1.74
10.69
0
2
4
6
8
10
12
Poland Hungary Czech R. Slovakia Romania Bulgaria Turkey
31/10/2016 16/02/2017
77
61
22
34
69
-19
87
67
-20
0
20
40
60
80
100
Colliers International 20179
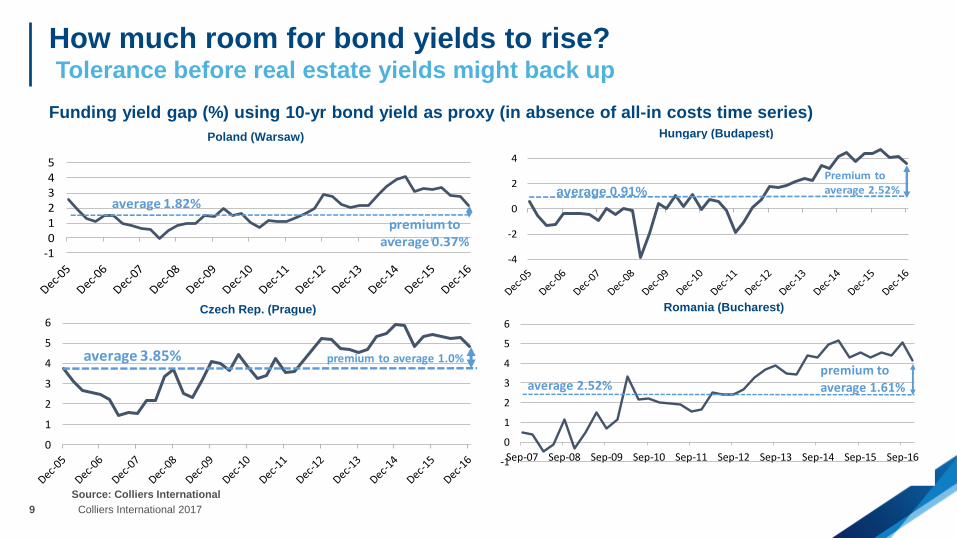
How much room for bond yields to rise?Tolerance before real estate yields might back up
Funding yield gap (%) using 10-yr bond yield as proxy (in absence of all-in costs time series)
Source: Colliers International
Czech Rep. (Prague)
Hungary (Budapest)
Romania (Bucharest)
Poland (Warsaw)
-4
-2
0
2
4
Premium to average 2.52%average 0.91%
-1012345
average 1.82%
premium to average 0.37%
0
1
2
3
4
5
6
average 3.85% premium to average 1.0%
-1
0
1
2
3
4
5
6
Sep-07 Sep-08 Sep-09 Sep-10 Sep-11 Sep-12 Sep-13 Sep-14 Sep-15 Sep-16
average 2.52%premium to average 1.61%

Colliers International 201710
Inputs to rents – Unemployment low, CPI risingTight labour markets and CPI picking up
Selected EU member unemployment rates (Nov 2016)
19.3%
11.7%10.2% 10.0% 9.4%
7.5%5.9% 5.7%
5.0% 4.9%4.1% 4.0%
0%
5%
10%
15%
20%
Source: Eurostat
Eurozone CPI and CEE-6 blended CPI (yoy, ave)
0.5%
-0.3% -0.2%
0.5%
2.2%
2.4%2.4%
1.5%
0.5%
0.2%
0.5%
2.5% 2.5%
2.0%
-0.5%
0.0%
0.5%
1.0%
1.5%
2.0%
2.5%
3.0%
2013 2014 2015 2016 2017E 2018E 2019ECEE-6 blended Eurozone
Boost to rents coming
Source: Oxford Economics, Colliers International
Colliers International 201711
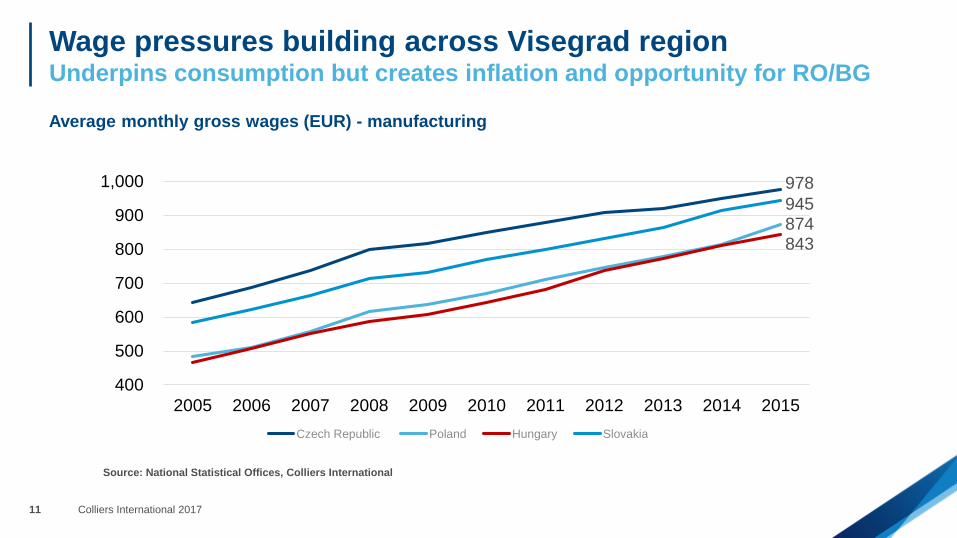
Wage pressures building across Visegrad regionUnderpins consumption but creates inflation and opportunity for RO/BG
Average monthly gross wages (EUR) - manufacturing
Source: National Statistical Offices, Colliers International
400
500
600
700
800
900
1,000
2005 2006 2007 2008 2009 2010 2011 2012 2013 2014 2015
Czech Republic Poland Hungary Slovakia
978
945
843874
Colliers International 201712
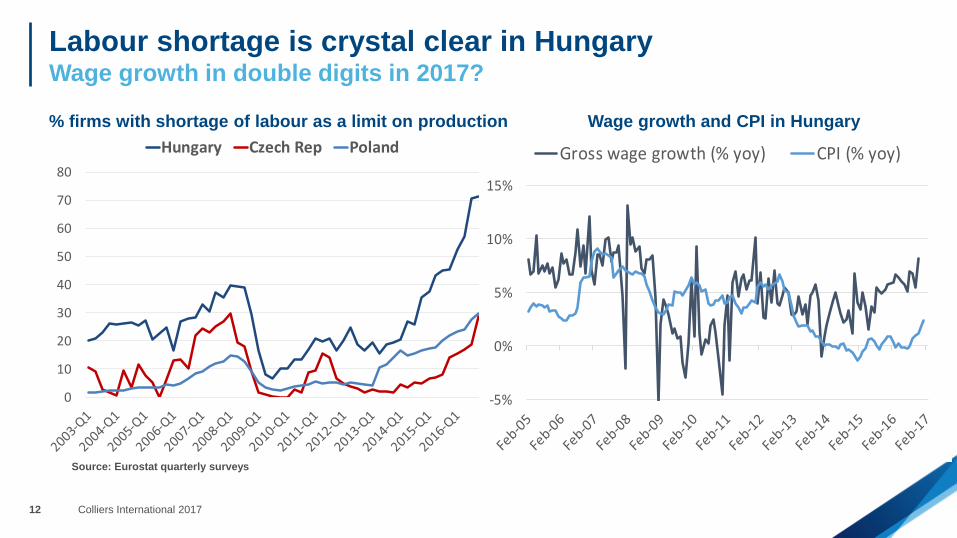
Labour shortage is crystal clear in HungaryWage growth in double digits in 2017?
% firms with shortage of labour as a limit on production
Source: Eurostat quarterly surveys
0
10
20
30
40
50
60
70
80
Hungary Czech Rep Poland
-5%
0%
5%
10%
15%
Gross wage growth (% yoy) CPI (% yoy)
Wage growth and CPI in Hungary

Colliers International 201713
Potential disrupter to CEE retail story in 2017Growth rates at 10%-20% in the region
% of people in 2015 shopping online in the last 12 months
Source: Factset
81%73%
65%
53% 50%45% 42%
37% 36%
26%18%
11%
0%
10%
20%
30%
40%
50%
60%
70%
80%
90%
Greater growth potential
Growth in e-commerce revenues
12% 12%13%
12%
17%
10%10% 10%
13%11%
16%
10%
0%
5%
10%
15%
20%
Bulgaria Czech Rep Hungary Poland Romania Slovakia
2015-16 growth 2016-17 growth
Source: Statista

Colliers International 201714
2017 outlookPositives and negatives
Negatives
• Continued momentum in consumption-led GDP growth
• Firming rents, especially in retail
• Wage growth positive for retail
• Fiscal expansion in most countries
• Inflation spike in EUR terms is not impossible to see (rent
linkage to CPI across the region)
• Appreciation of Czech Koruna as currency “cap” removed
• Effect of rate rises on CEE is not immediate
Positives
• Rates rising and risk of inflation spike and strong USD
• E-commerce risk for retail
• Wage growth negative for BPO/SSC and industrial
• EU funding reduces as punishment for populism or as
a result of EU political instability
• Taxation risk (the Trump-Brexit World)
• China debt instability spikes strong Developed Market
sentiment sending all risky asset prices tumbling
(including Emerging Markets)
• Trump unpredictability (trade wars?)

| Mark Robinson January 2017
THANK YOU

Colliers International 201716
Colliers International | Prague
Slovansky Dum
Na Prikope 859/22
Prague 1 11000
Czech Republic
TEL +420 226 536 618
Mark RobinsonCEE Research Specialist | Prague
+420 226 537 646