CEDS Survey Committee Online Survey June 22, … Survey Executive Summary.pdf · CEDS Survey...
21
CEDS Survey Committee Online Survey June 22, 2017 – July 25, 2017 Executive Summary One Technology Drive Suite 1000 - Frostburg, Maryland 21532 - www.tccwmd.org - 301-689-1300
Transcript of CEDS Survey Committee Online Survey June 22, … Survey Executive Summary.pdf · CEDS Survey...
CEDS Survey Committee Online Survey
June 22, 2017 – July 25, 2017
Executive Summary
One Technology Drive Suite 1000 - Frostburg, Maryland 21532 - www.tccwmd.org - 301-689-1300
CEDS Survey Committee Roger Fairbourn, Chair, Roger Fairbourn Real Estate
David Nedved, Allegany County Department of Economic & Community Development
Andrew Sargent, Maryland Department of Commerce
Cindy Sharon, Garrett County Economic Development
Amy Jacobs, Tri-County Council for Western Maryland
Guy Winterberg, Tri-County Council for Western Maryland
Tri County Council for Western Maryland, Inc. (TCCWMD) is a local Development District serving
a three-county region in Appalachian Maryland. TCCWMD is owned by its member governments of Allegany,
Garrett and Washington Counties and has provided economic and community development assistance to its partners
since its inception in 1971. TCCWMD encourages and facilitates government cooperation by addressing issues of
greater than local significance on a regional basis.
The preparation of this survey was financially aided through funding from the Economic Development
Administration and the Maryland Department of Commerce.
Tri-County Council for Western Maryland is designated by the US Department of Commerce
Economic Development Administration (EDA) as the Economic Development District (EDD)
and regional planning organization. The Western Maryland region is comprised of Garrett,
Allegany and Washington Counties and their twenty-four municipalities. As an EDD, The
Council is required to prepare a Comprehensive Economic Development Strategy (CEDS) every
five years. Annual updates to the document are required for EDA funding of economic
development projects.
The Comprehensive Economic Development Strategy (CEDS) is a strategy-driven plan for
regional economic development. The CEDS will serve as the fundamental plan for the agency’s
economic development efforts for the communities it serves for the next five years. These
economic development programs create or retain full-time permanent jobs and improve income
characteristics, particularly for the unemployed and under-employed citizens of the region.
Established by local representatives from public, private and non-profit sectors of the three
Western Maryland counties, the document follows the CEDS Content Guidelines released by the
Economic Development Administration (EDA) in 2016.
As part of this process, CEDS committee members developed a brief online survey. The survey
was distributed throughout the three county region and assessed the views of community
members on the opportunities and threats associated with the region’s economic growth and
development. Tri-County Council invited the regional community to have strong and substantive
input in the process. Specifically, TCCWMD encouraged the region to guide its economic
development efforts by helping to prioritize issues that affect Western Maryland.
The Survey results, along with the SWOT analysis, will be considered when developing the
initiatives, goals and objectives, and action plan for the CEDS next five-year plan 2018-2022.
Online Survey:
Following recommendation by the CEDS Committee and approval by the TCCWMD board of
directors, the Survey launched to the region on Thursday, June 22, 2017. The initial release
included the TCCWMD membership, newsletter databases, chambers of commerce, offices of
economic development, community partners identified by the committee as well as the media.
The launch was followed by an email and social media outreach.
Community partners included civic organizations, education institutions, and municipalities.
These partners were personally invited to share the survey within their organizations. Many of
these organizations further extended the opportunity for community members to participate.
The survey was available on the Council’s website home page. Data indicates significant traffic
accessed the survey using this link from email and social media outreach.
The social media campaign included announcement of the survey release, press releases, and
reminders to participate. Facebook advertising was used to extend TCCWMD’s traditional reach
into the community.
When the survey closed on Tuesday, July 25, 2017 a total of 780 respondents from the region
had participated. This document summarizes the aggregate results from the 67-question survey.
Categories included: Business & Economic Development, Healthcare, Infrastructure, Local/State
Government, Real Estate, and Worforce.
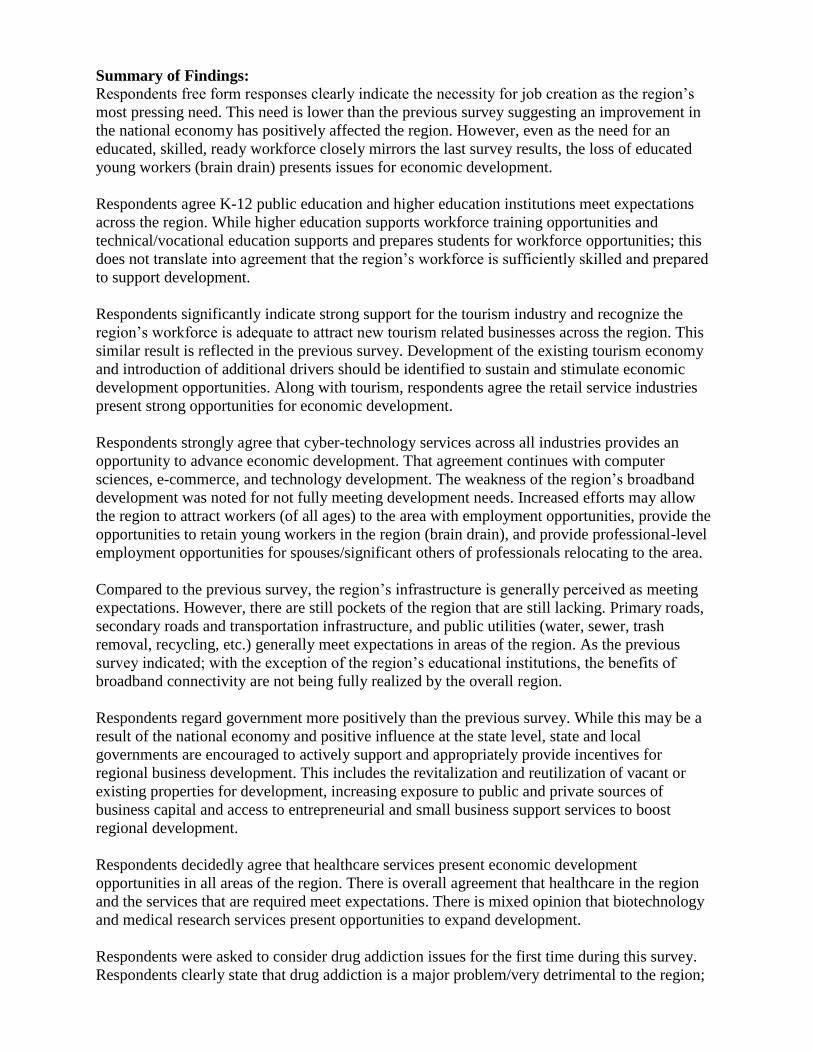
Summary of Findings:
Respondents free form responses clearly indicate the necessity for job creation as the region’s
most pressing need. This need is lower than the previous survey suggesting an improvement in
the national economy has positively affected the region. However, even as the need for an
educated, skilled, ready workforce closely mirrors the last survey results, the loss of educated
young workers (brain drain) presents issues for economic development.
Respondents agree K-12 public education and higher education institutions meet expectations
across the region. While higher education supports workforce training opportunities and
technical/vocational education supports and prepares students for workforce opportunities; this
does not translate into agreement that the region’s workforce is sufficiently skilled and prepared
to support development.
Respondents significantly indicate strong support for the tourism industry and recognize the
region’s workforce is adequate to attract new tourism related businesses across the region. This
similar result is reflected in the previous survey. Development of the existing tourism economy
and introduction of additional drivers should be identified to sustain and stimulate economic
development opportunities. Along with tourism, respondents agree the retail service industries
present strong opportunities for economic development.
Respondents strongly agree that cyber-technology services across all industries provides an
opportunity to advance economic development. That agreement continues with computer
sciences, e-commerce, and technology development. The weakness of the region’s broadband
development was noted for not fully meeting development needs. Increased efforts may allow
the region to attract workers (of all ages) to the area with employment opportunities, provide the
opportunities to retain young workers in the region (brain drain), and provide professional-level
employment opportunities for spouses/significant others of professionals relocating to the area.
Compared to the previous survey, the region’s infrastructure is generally perceived as meeting
expectations. However, there are still pockets of the region that are still lacking. Primary roads,
secondary roads and transportation infrastructure, and public utilities (water, sewer, trash
removal, recycling, etc.) generally meet expectations in areas of the region. As the previous
survey indicated; with the exception of the region’s educational institutions, the benefits of
broadband connectivity are not being fully realized by the overall region.
Respondents regard government more positively than the previous survey. While this may be a
result of the national economy and positive influence at the state level, state and local
governments are encouraged to actively support and appropriately provide incentives for
regional business development. This includes the revitalization and reutilization of vacant or
existing properties for development, increasing exposure to public and private sources of
business capital and access to entrepreneurial and small business support services to boost
regional development.
Respondents decidedly agree that healthcare services present economic development
opportunities in all areas of the region. There is overall agreement that healthcare in the region
and the services that are required meet expectations. There is mixed opinion that biotechnology
and medical research services present opportunities to expand development.
Respondents were asked to consider drug addiction issues for the first time during this survey.
Respondents clearly state that drug addiction is a major problem/very detrimental to the region;
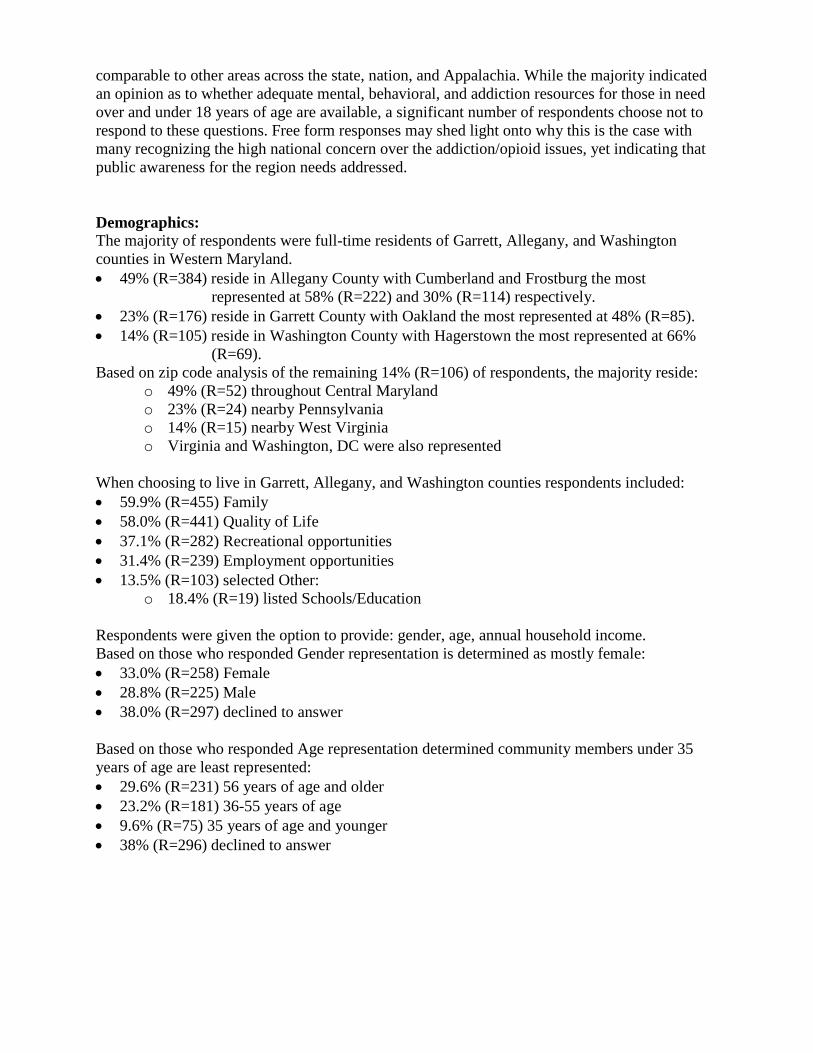
comparable to other areas across the state, nation, and Appalachia. While the majority indicated
an opinion as to whether adequate mental, behavioral, and addiction resources for those in need
over and under 18 years of age are available, a significant number of respondents choose not to
respond to these questions. Free form responses may shed light onto why this is the case with
many recognizing the high national concern over the addiction/opioid issues, yet indicating that
public awareness for the region needs addressed.
Demographics:
The majority of respondents were full-time residents of Garrett, Allegany, and Washington
counties in Western Maryland.
49% (R=384) reside in Allegany County with Cumberland and Frostburg the most
represented at 58% (R=222) and 30% (R=114) respectively.
23% (R=176) reside in Garrett County with Oakland the most represented at 48% (R=85).
14% (R=105) reside in Washington County with Hagerstown the most represented at 66%
(R=69).
Based on zip code analysis of the remaining 14% (R=106) of respondents, the majority reside:
o 49% (R=52) throughout Central Maryland
o 23% (R=24) nearby Pennsylvania
o 14% (R=15) nearby West Virginia
o Virginia and Washington, DC were also represented
When choosing to live in Garrett, Allegany, and Washington counties respondents included:
59.9% (R=455) Family
58.0% (R=441) Quality of Life
37.1% (R=282) Recreational opportunities
31.4% (R=239) Employment opportunities
13.5% (R=103) selected Other:
o 18.4% (R=19) listed Schools/Education
Respondents were given the option to provide: gender, age, annual household income.
Based on those who responded Gender representation is determined as mostly female:
33.0% (R=258) Female
28.8% (R=225) Male
38.0% (R=297) declined to answer
Based on those who responded Age representation determined community members under 35
years of age are least represented:
29.6% (R=231) 56 years of age and older
23.2% (R=181) 36-55 years of age
9.6% (R=75) 35 years of age and younger
38% (R=296) declined to answer
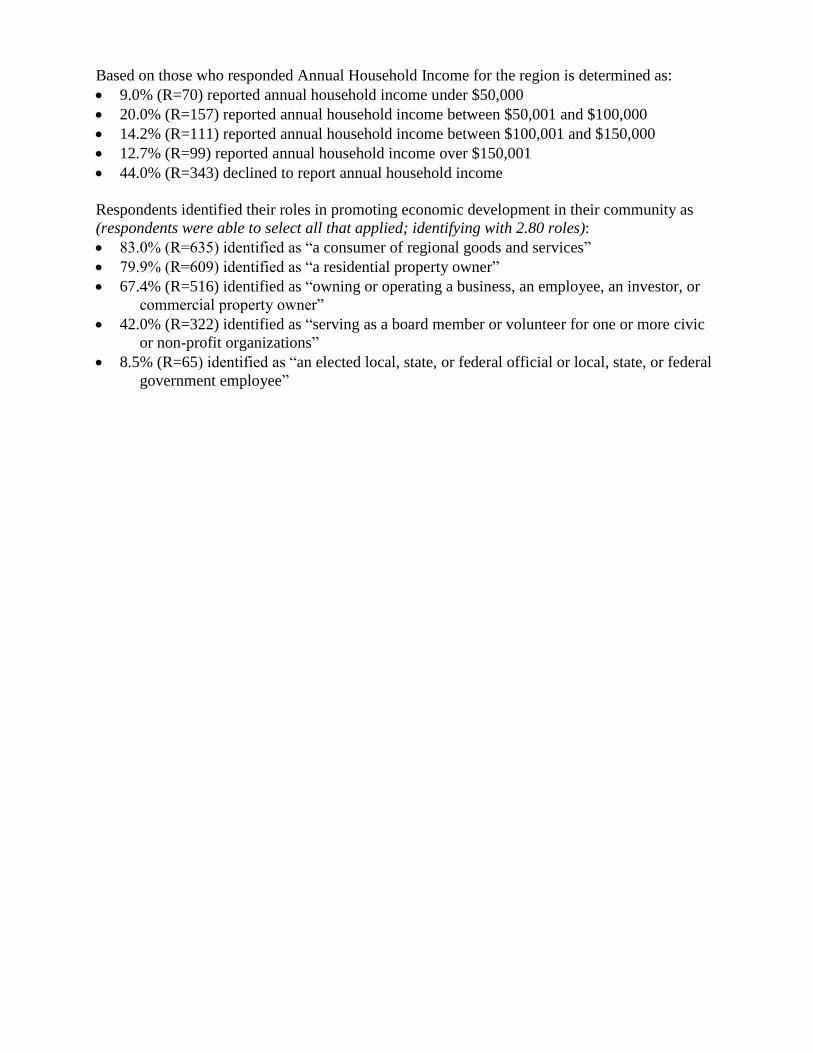
Based on those who responded Annual Household Income for the region is determined as:
9.0% (R=70) reported annual household income under $50,000
20.0% (R=157) reported annual household income between $50,001 and $100,000
14.2% (R=111) reported annual household income between $100,001 and $150,000
12.7% (R=99) reported annual household income over $150,001
44.0% (R=343) declined to report annual household income
Respondents identified their roles in promoting economic development in their community as
(respondents were able to select all that applied; identifying with 2.80 roles):
83.0% (R=635) identified as “a consumer of regional goods and services”
79.9% (R=609) identified as “a residential property owner”
67.4% (R=516) identified as “owning or operating a business, an employee, an investor, or
commercial property owner”
42.0% (R=322) identified as “serving as a board member or volunteer for one or more civic
or non-profit organizations”
8.5% (R=65) identified as “an elected local, state, or federal official or local, state, or federal
government employee”
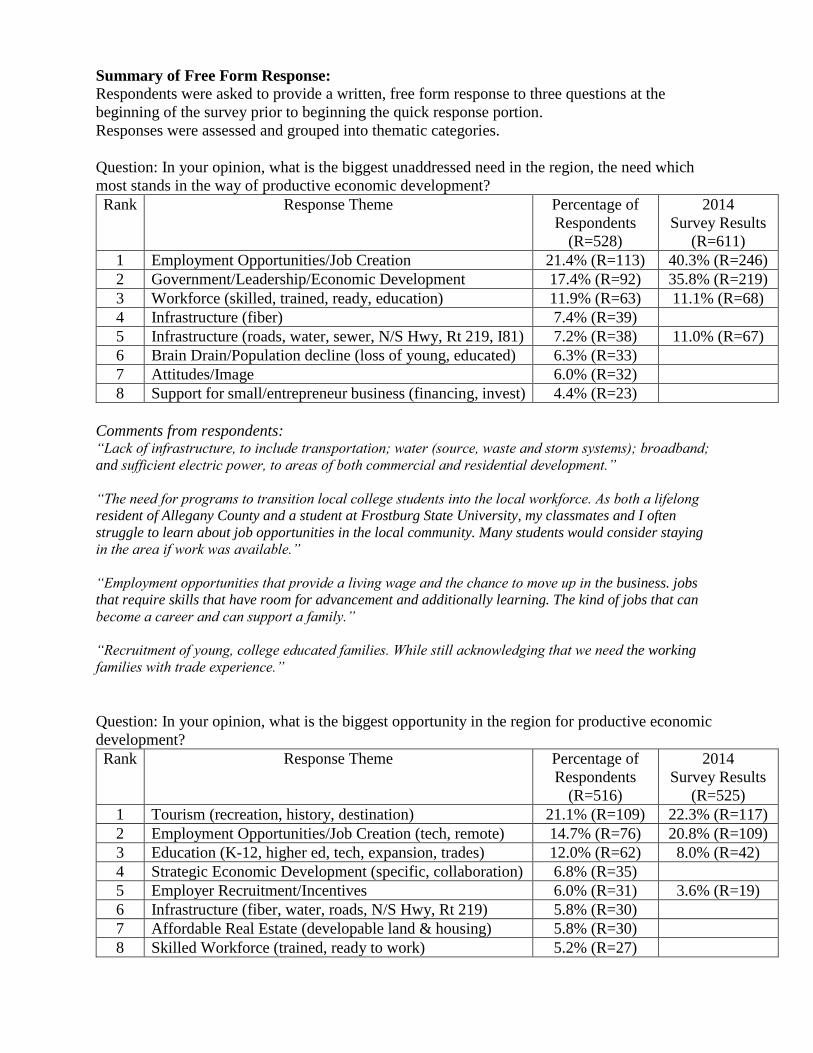
Summary of Free Form Response:
Respondents were asked to provide a written, free form response to three questions at the
beginning of the survey prior to beginning the quick response portion.
Responses were assessed and grouped into thematic categories.
Question: In your opinion, what is the biggest unaddressed need in the region, the need which
most stands in the way of productive economic development?
Rank Response Theme Percentage of
Respondents
(R=528)
2014
Survey Results
(R=611)
1 Employment Opportunities/Job Creation 21.4% (R=113) 40.3% (R=246)
2 Government/Leadership/Economic Development 17.4% (R=92) 35.8% (R=219)
3 Workforce (skilled, trained, ready, education) 11.9% (R=63) 11.1% (R=68)
4 Infrastructure (fiber) 7.4% (R=39)
5 Infrastructure (roads, water, sewer, N/S Hwy, Rt 219, I81) 7.2% (R=38) 11.0% (R=67)
6 Brain Drain/Population decline (loss of young, educated) 6.3% (R=33)
7 Attitudes/Image 6.0% (R=32)
8 Support for small/entrepreneur business (financing, invest) 4.4% (R=23)
Comments from respondents: “Lack of infrastructure, to include transportation; water (source, waste and storm systems); broadband;
and sufficient electric power, to areas of both commercial and residential development.”
“The need for programs to transition local college students into the local workforce. As both a lifelong
resident of Allegany County and a student at Frostburg State University, my classmates and I often
struggle to learn about job opportunities in the local community. Many students would consider staying
in the area if work was available.”
“Employment opportunities that provide a living wage and the chance to move up in the business. jobs
that require skills that have room for advancement and additionally learning. The kind of jobs that can
become a career and can support a family.”
“Recruitment of young, college educated families. While still acknowledging that we need the working
families with trade experience.”
Question: In your opinion, what is the biggest opportunity in the region for productive economic
development?
Rank Response Theme Percentage of
Respondents
(R=516)
2014
Survey Results
(R=525)
1 Tourism (recreation, history, destination) 21.1% (R=109) 22.3% (R=117)
2 Employment Opportunities/Job Creation (tech, remote) 14.7% (R=76) 20.8% (R=109)
3 Education (K-12, higher ed, tech, expansion, trades) 12.0% (R=62) 8.0% (R=42)
4 Strategic Economic Development (specific, collaboration) 6.8% (R=35)
5 Employer Recruitment/Incentives 6.0% (R=31) 3.6% (R=19)
6 Infrastructure (fiber, water, roads, N/S Hwy, Rt 219) 5.8% (R=30)
7 Affordable Real Estate (developable land & housing) 5.8% (R=30)
8 Skilled Workforce (trained, ready to work) 5.2% (R=27)
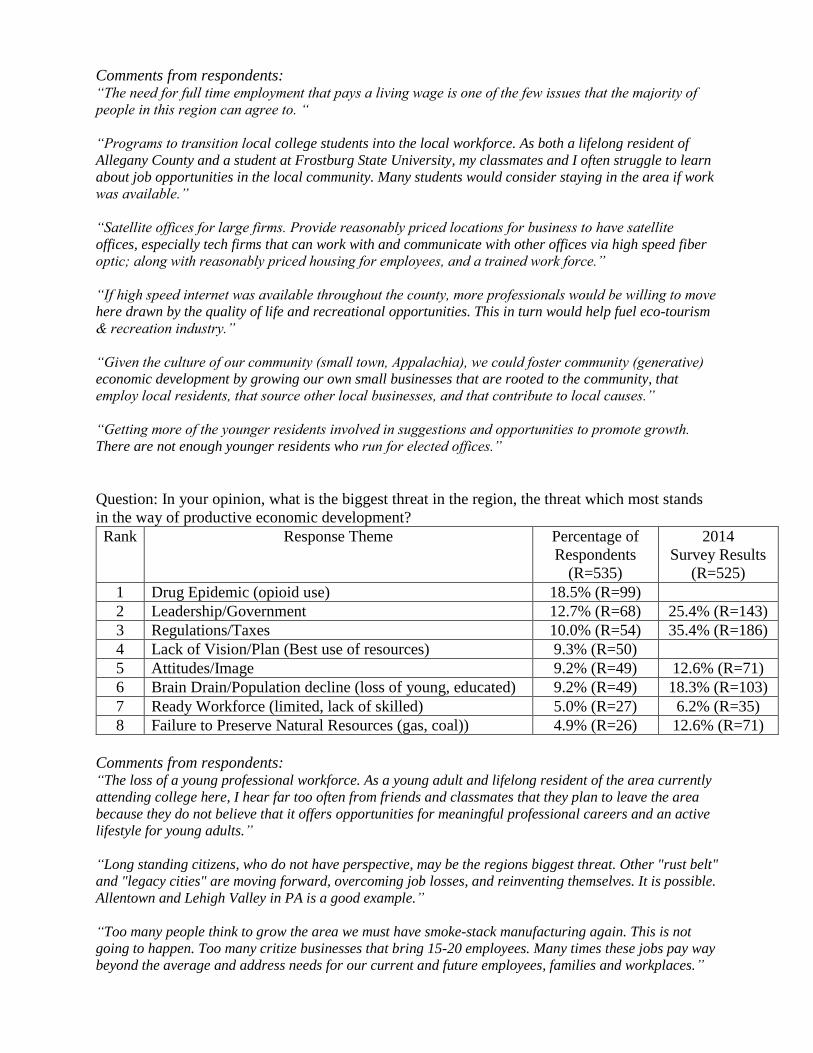
Comments from respondents: “The need for full time employment that pays a living wage is one of the few issues that the majority of
people in this region can agree to. “
“Programs to transition local college students into the local workforce. As both a lifelong resident of
Allegany County and a student at Frostburg State University, my classmates and I often struggle to learn
about job opportunities in the local community. Many students would consider staying in the area if work
was available.”
“Satellite offices for large firms. Provide reasonably priced locations for business to have satellite
offices, especially tech firms that can work with and communicate with other offices via high speed fiber
optic; along with reasonably priced housing for employees, and a trained work force.”
“If high speed internet was available throughout the county, more professionals would be willing to move
here drawn by the quality of life and recreational opportunities. This in turn would help fuel eco-tourism
& recreation industry.”
“Given the culture of our community (small town, Appalachia), we could foster community (generative)
economic development by growing our own small businesses that are rooted to the community, that
employ local residents, that source other local businesses, and that contribute to local causes.”
“Getting more of the younger residents involved in suggestions and opportunities to promote growth.
There are not enough younger residents who run for elected offices.”
Question: In your opinion, what is the biggest threat in the region, the threat which most stands
in the way of productive economic development?
Rank Response Theme Percentage of
Respondents
(R=535)
2014
Survey Results
(R=525)
1 Drug Epidemic (opioid use) 18.5% (R=99)
2 Leadership/Government 12.7% (R=68) 25.4% (R=143)
3 Regulations/Taxes 10.0% (R=54) 35.4% (R=186)
4 Lack of Vision/Plan (Best use of resources) 9.3% (R=50)
5 Attitudes/Image 9.2% (R=49) 12.6% (R=71)
6 Brain Drain/Population decline (loss of young, educated) 9.2% (R=49) 18.3% (R=103)
7 Ready Workforce (limited, lack of skilled) 5.0% (R=27) 6.2% (R=35)
8 Failure to Preserve Natural Resources (gas, coal)) 4.9% (R=26) 12.6% (R=71)
Comments from respondents: “The loss of a young professional workforce. As a young adult and lifelong resident of the area currently
attending college here, I hear far too often from friends and classmates that they plan to leave the area
because they do not believe that it offers opportunities for meaningful professional careers and an active
lifestyle for young adults.”
“Long standing citizens, who do not have perspective, may be the regions biggest threat. Other "rust belt"
and "legacy cities" are moving forward, overcoming job losses, and reinventing themselves. It is possible.
Allentown and Lehigh Valley in PA is a good example.”
“Too many people think to grow the area we must have smoke-stack manufacturing again. This is not
going to happen. Too many critize businesses that bring 15-20 employees. Many times these jobs pay way
beyond the average and address needs for our current and future employees, families and workplaces.”
“The biggest threat is in the region is the location. I believe that it is difficult to entice businesses to
locate here due to the fact that Western Maryland has a reputation for being economically poor but
recreationally rich. We are seen as a place to visit but not to live because there are no cultural centers to
entice top-notch employees.”
Summary of Results:
The survey provided respondent’s with the opportunity to express their level of agreement with
statements regarding the opportunities and threats associated with the region’s economic growth
and development. Those selections were ranked using the traditional Likert scale: “strongly
disagree,” “somewhat disagree,” “neutral,” “somewhat agree,” or “strongly agree.”
Assessed were: Business & Economic Development, Heathcare, Infrastructure, Local/State
Government, Real Estate, and Workforce.
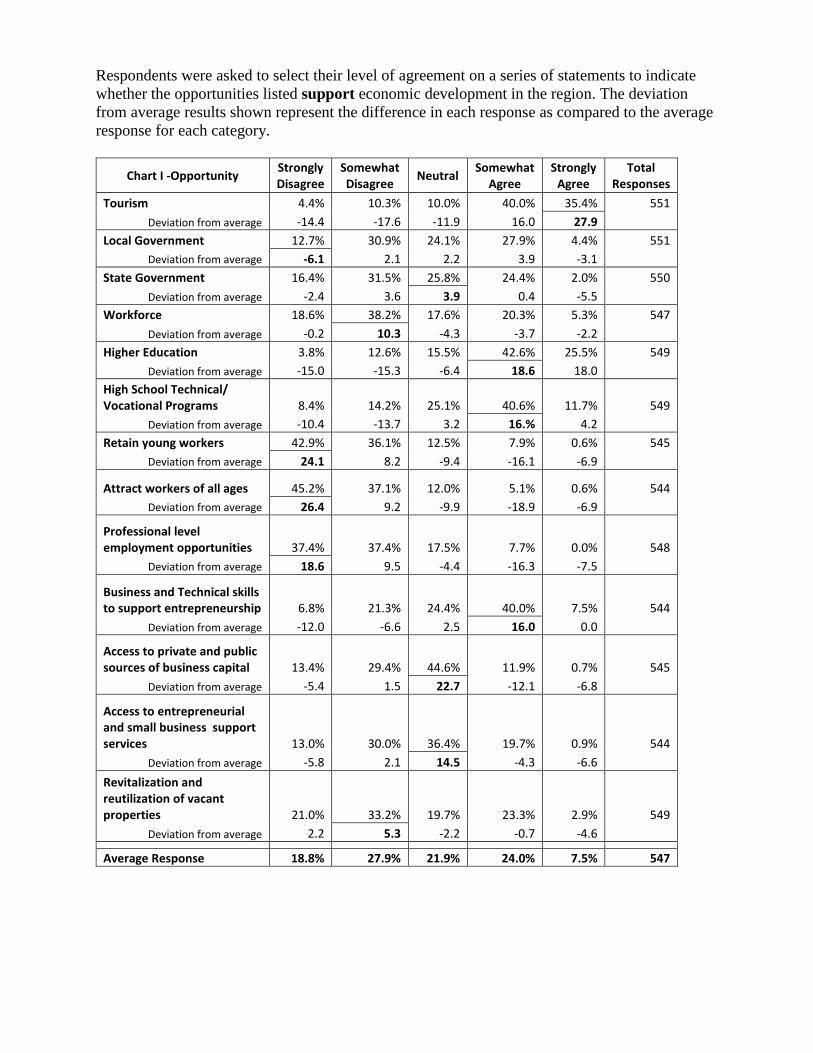
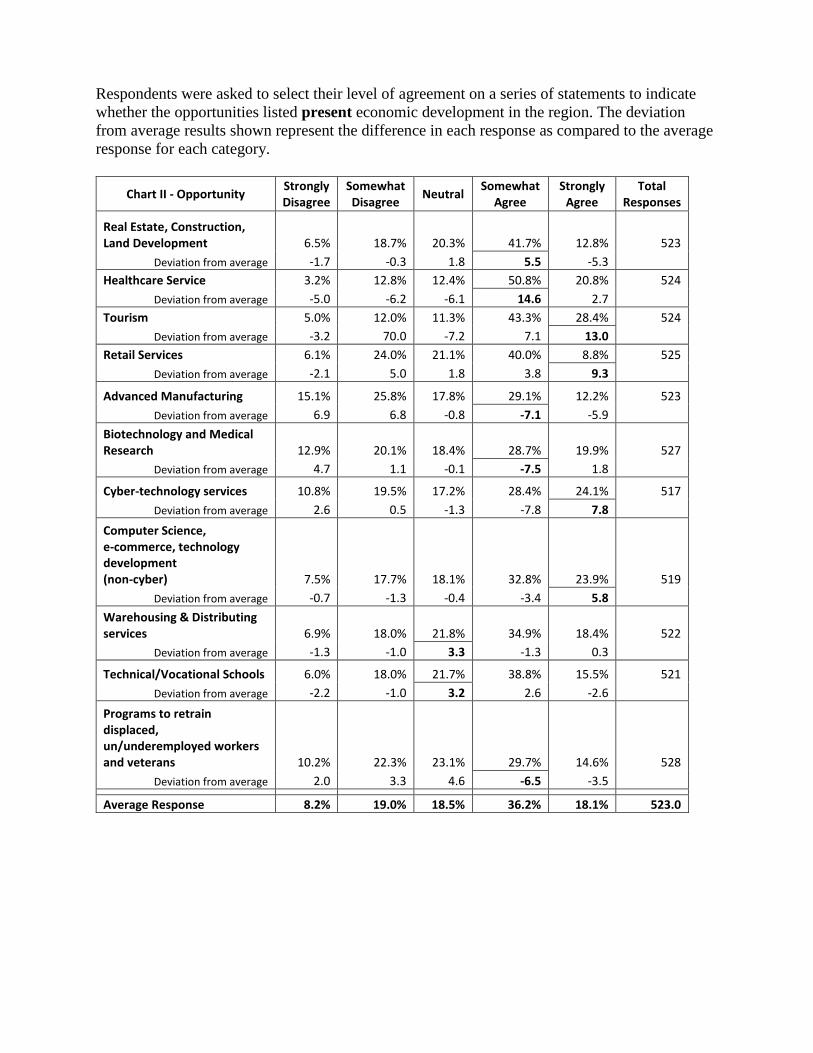
Respondents were asked to select their level of agreement on a series of statements to indicate
whether the opportunities listed support economic development in the region. The deviation
from average results shown represent the difference in each response as compared to the average
response for each category.
Chart I -Opportunity Strongly Disagree
Somewhat Disagree
Neutral Somewhat
Agree Strongly
Agree Total
Responses
Tourism 4.4% 10.3% 10.0% 40.0% 35.4% 551
Deviation from average -14.4 -17.6 -11.9 16.0 27.9 Local Government 12.7% 30.9% 24.1% 27.9% 4.4% 551
Deviation from average -6.1 2.1 2.2 3.9 -3.1 State Government 16.4% 31.5% 25.8% 24.4% 2.0% 550
Deviation from average -2.4 3.6 3.9 0.4 -5.5 Workforce 18.6% 38.2% 17.6% 20.3% 5.3% 547
Deviation from average -0.2 10.3 -4.3 -3.7 -2.2 Higher Education 3.8% 12.6% 15.5% 42.6% 25.5% 549
Deviation from average -15.0 -15.3 -6.4 18.6 18.0 High School Technical/ Vocational Programs 8.4% 14.2% 25.1% 40.6% 11.7% 549
Deviation from average -10.4 -13.7 3.2 16.% 4.2 Retain young workers 42.9% 36.1% 12.5% 7.9% 0.6% 545
Deviation from average 24.1 8.2 -9.4 -16.1 -6.9
Attract workers of all ages 45.2% 37.1% 12.0% 5.1% 0.6% 544
Deviation from average 26.4 9.2 -9.9 -18.9 -6.9
Professional level employment opportunities 37.4% 37.4% 17.5% 7.7% 0.0% 548
Deviation from average 18.6 9.5 -4.4 -16.3 -7.5
Business and Technical skills to support entrepreneurship 6.8% 21.3% 24.4% 40.0% 7.5% 544
Deviation from average -12.0 -6.6 2.5 16.0 0.0
Access to private and public sources of business capital 13.4% 29.4% 44.6% 11.9% 0.7% 545
Deviation from average -5.4 1.5 22.7 -12.1 -6.8
Access to entrepreneurial and small business support services 13.0% 30.0% 36.4% 19.7% 0.9% 544
Deviation from average -5.8 2.1 14.5 -4.3 -6.6 Revitalization and reutilization of vacant properties 21.0% 33.2% 19.7% 23.3% 2.9% 549
Deviation from average 2.2 5.3 -2.2 -0.7 -4.6 Average Response 18.8% 27.9% 21.9% 24.0% 7.5% 547
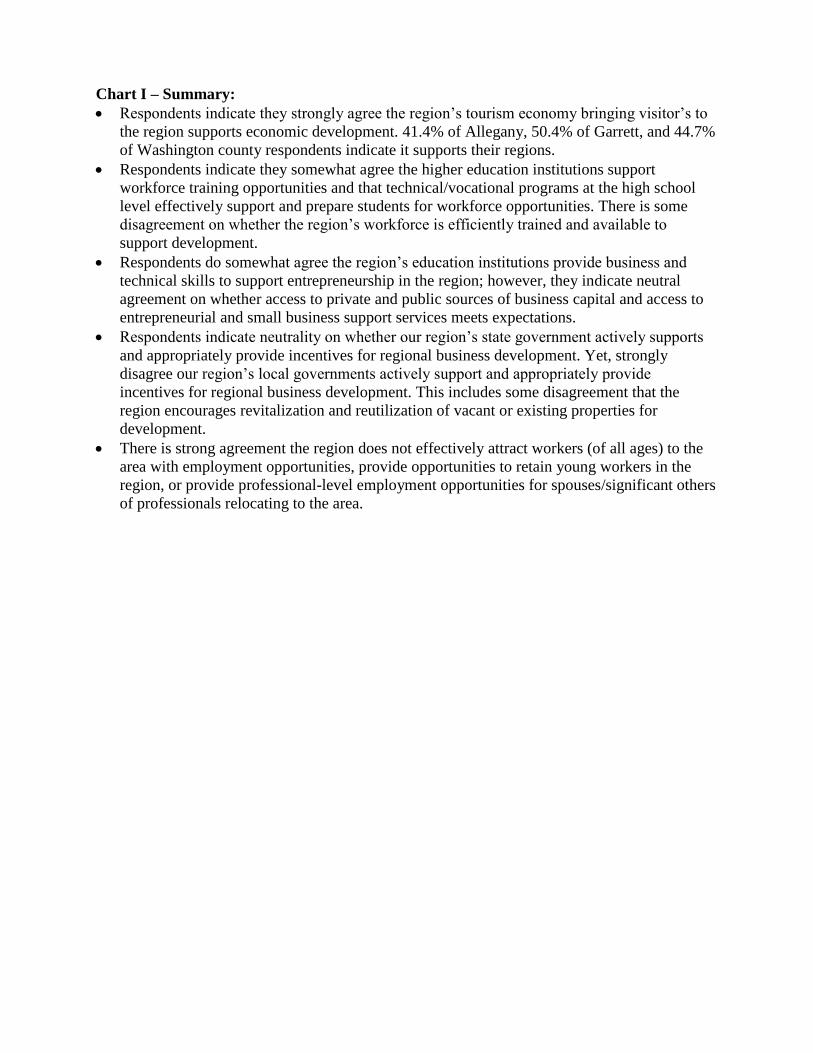
Chart I – Summary:
Respondents indicate they strongly agree the region’s tourism economy bringing visitor’s to
the region supports economic development. 41.4% of Allegany, 50.4% of Garrett, and 44.7%
of Washington county respondents indicate it supports their regions.
Respondents indicate they somewhat agree the higher education institutions support
workforce training opportunities and that technical/vocational programs at the high school
level effectively support and prepare students for workforce opportunities. There is some
disagreement on whether the region’s workforce is efficiently trained and available to
support development.
Respondents do somewhat agree the region’s education institutions provide business and
technical skills to support entrepreneurship in the region; however, they indicate neutral
agreement on whether access to private and public sources of business capital and access to
entrepreneurial and small business support services meets expectations.
Respondents indicate neutrality on whether our region’s state government actively supports
and appropriately provide incentives for regional business development. Yet, strongly
disagree our region’s local governments actively support and appropriately provide
incentives for regional business development. This includes some disagreement that the
region encourages revitalization and reutilization of vacant or existing properties for
development.
There is strong agreement the region does not effectively attract workers (of all ages) to the
area with employment opportunities, provide opportunities to retain young workers in the
region, or provide professional-level employment opportunities for spouses/significant others
of professionals relocating to the area.
Respondents were asked to select their level of agreement on a series of statements to indicate
whether the opportunities listed present economic development in the region. The deviation
from average results shown represent the difference in each response as compared to the average
response for each category.
Chart II - Opportunity Strongly Disagree
Somewhat Disagree
Neutral Somewhat
Agree Strongly
Agree Total
Responses
Real Estate, Construction, Land Development 6.5% 18.7% 20.3% 41.7% 12.8% 523
Deviation from average -1.7 -0.3 1.8 5.5 -5.3 Healthcare Service 3.2% 12.8% 12.4% 50.8% 20.8% 524
Deviation from average -5.0 -6.2 -6.1 14.6 2.7 Tourism 5.0% 12.0% 11.3% 43.3% 28.4% 524
Deviation from average -3.2 70.0 -7.2 7.1 13.0 Retail Services 6.1% 24.0% 21.1% 40.0% 8.8% 525
Deviation from average -2.1 5.0 1.8 3.8 9.3
Advanced Manufacturing 15.1% 25.8% 17.8% 29.1% 12.2% 523
Deviation from average 6.9 6.8 -0.8 -7.1 -5.9 Biotechnology and Medical Research 12.9% 20.1% 18.4% 28.7% 19.9% 527
Deviation from average 4.7 1.1 -0.1 -7.5 1.8
Cyber-technology services 10.8% 19.5% 17.2% 28.4% 24.1% 517
Deviation from average 2.6 0.5 -1.3 -7.8 7.8
Computer Science, e-commerce, technology development (non-cyber) 7.5% 17.7% 18.1% 32.8% 23.9% 519
Deviation from average -0.7 -1.3 -0.4 -3.4 5.8 Warehousing & Distributing services 6.9% 18.0% 21.8% 34.9% 18.4% 522
Deviation from average -1.3 -1.0 3.3 -1.3 0.3
Technical/Vocational Schools 6.0% 18.0% 21.7% 38.8% 15.5% 521
Deviation from average -2.2 -1.0 3.2 2.6 -2.6
Programs to retrain displaced, un/underemployed workers and veterans 10.2% 22.3% 23.1% 29.7% 14.6% 528
Deviation from average 2.0 3.3 4.6 -6.5 -3.5 Average Response 8.2% 19.0% 18.5% 36.2% 18.1% 523.0
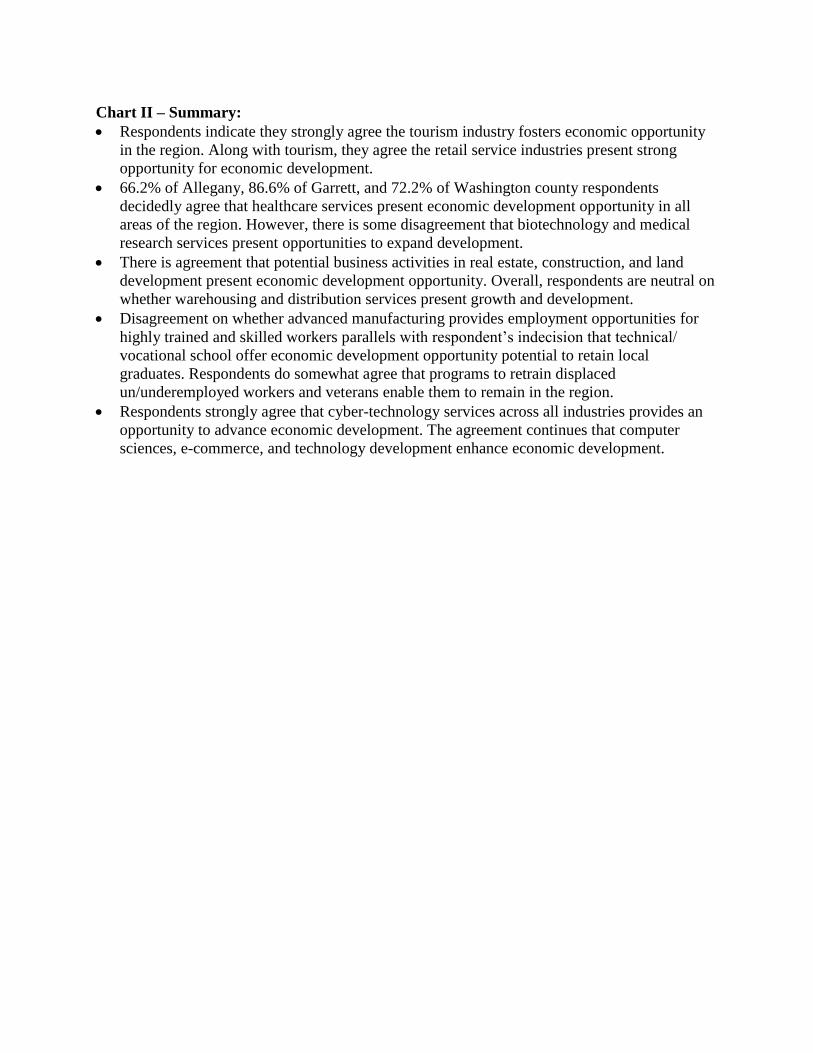
Chart II – Summary:
Respondents indicate they strongly agree the tourism industry fosters economic opportunity
in the region. Along with tourism, they agree the retail service industries present strong
opportunity for economic development.
66.2% of Allegany, 86.6% of Garrett, and 72.2% of Washington county respondents
decidedly agree that healthcare services present economic development opportunity in all
areas of the region. However, there is some disagreement that biotechnology and medical
research services present opportunities to expand development.
There is agreement that potential business activities in real estate, construction, and land
development present economic development opportunity. Overall, respondents are neutral on
whether warehousing and distribution services present growth and development.
Disagreement on whether advanced manufacturing provides employment opportunities for
highly trained and skilled workers parallels with respondent’s indecision that technical/
vocational school offer economic development opportunity potential to retain local
graduates. Respondents do somewhat agree that programs to retrain displaced
un/underemployed workers and veterans enable them to remain in the region.
Respondents strongly agree that cyber-technology services across all industries provides an
opportunity to advance economic development. The agreement continues that computer
sciences, e-commerce, and technology development enhance economic development.
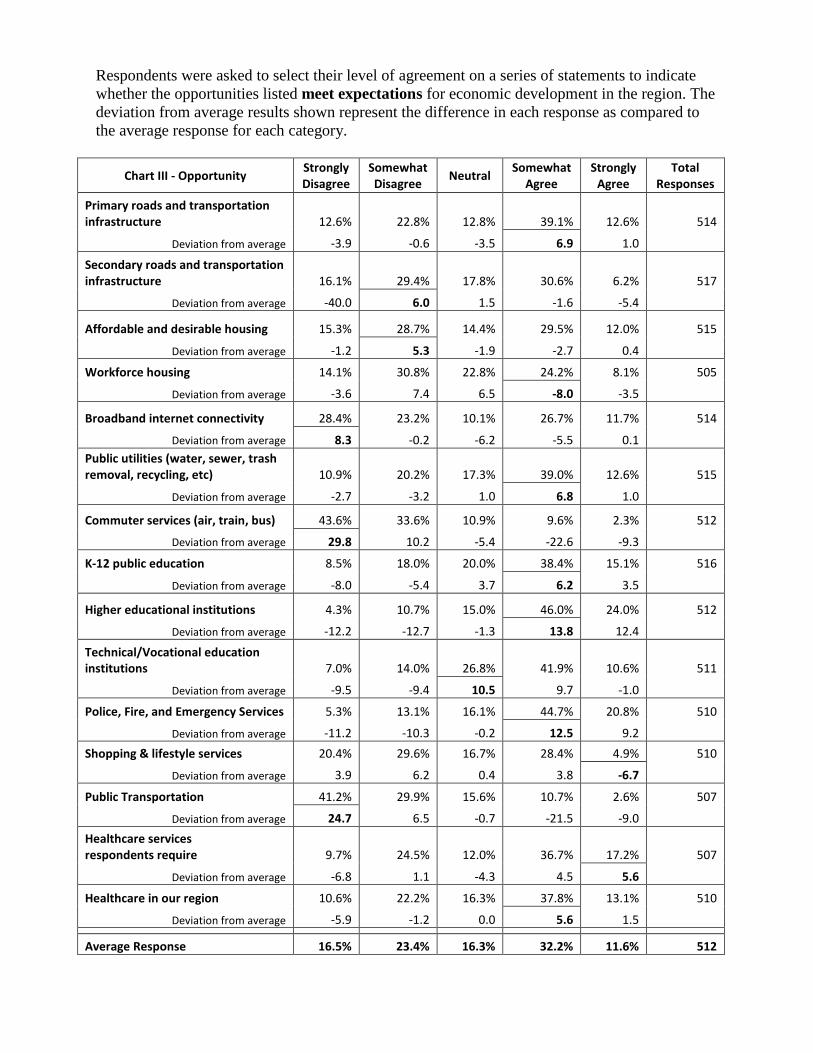
Respondents were asked to select their level of agreement on a series of statements to indicate
whether the opportunities listed meet expectations for economic development in the region. The
deviation from average results shown represent the difference in each response as compared to
the average response for each category.
Chart III - Opportunity Strongly Disagree
Somewhat Disagree
Neutral Somewhat
Agree Strongly
Agree Total
Responses
Primary roads and transportation infrastructure 12.6% 22.8% 12.8% 39.1% 12.6% 514
Deviation from average -3.9 -0.6 -3.5 6.9 1.0
Secondary roads and transportation infrastructure 16.1% 29.4% 17.8% 30.6% 6.2% 517
Deviation from average -40.0 6.0 1.5 -1.6 -5.4
Affordable and desirable housing 15.3% 28.7% 14.4% 29.5% 12.0% 515
Deviation from average -1.2 5.3 -1.9 -2.7 0.4
Workforce housing 14.1% 30.8% 22.8% 24.2% 8.1% 505
Deviation from average -3.6 7.4 6.5 -8.0 -3.5
Broadband internet connectivity 28.4% 23.2% 10.1% 26.7% 11.7% 514
Deviation from average 8.3 -0.2 -6.2 -5.5 0.1 Public utilities (water, sewer, trash removal, recycling, etc) 10.9% 20.2% 17.3% 39.0% 12.6% 515
Deviation from average -2.7 -3.2 1.0 6.8 1.0
Commuter services (air, train, bus) 43.6% 33.6% 10.9% 9.6% 2.3% 512
Deviation from average 29.8 10.2 -5.4 -22.6 -9.3
K-12 public education 8.5% 18.0% 20.0% 38.4% 15.1% 516
Deviation from average -8.0 -5.4 3.7 6.2 3.5
Higher educational institutions 4.3% 10.7% 15.0% 46.0% 24.0% 512
Deviation from average -12.2 -12.7 -1.3 13.8 12.4
Technical/Vocational education institutions 7.0% 14.0% 26.8% 41.9% 10.6% 511
Deviation from average -9.5 -9.4 10.5 9.7 -1.0
Police, Fire, and Emergency Services 5.3% 13.1% 16.1% 44.7% 20.8% 510
Deviation from average -11.2 -10.3 -0.2 12.5 9.2
Shopping & lifestyle services 20.4% 29.6% 16.7% 28.4% 4.9% 510
Deviation from average 3.9 6.2 0.4 3.8 -6.7
Public Transportation 41.2% 29.9% 15.6% 10.7% 2.6% 507
Deviation from average 24.7 6.5 -0.7 -21.5 -9.0
Healthcare services respondents require 9.7% 24.5% 12.0% 36.7% 17.2% 507
Deviation from average -6.8 1.1 -4.3 4.5 5.6
Healthcare in our region 10.6% 22.2% 16.3% 37.8% 13.1% 510
Deviation from average -5.9 -1.2 0.0 5.6 1.5
Average Response 16.5% 23.4% 16.3% 32.2% 11.6% 512
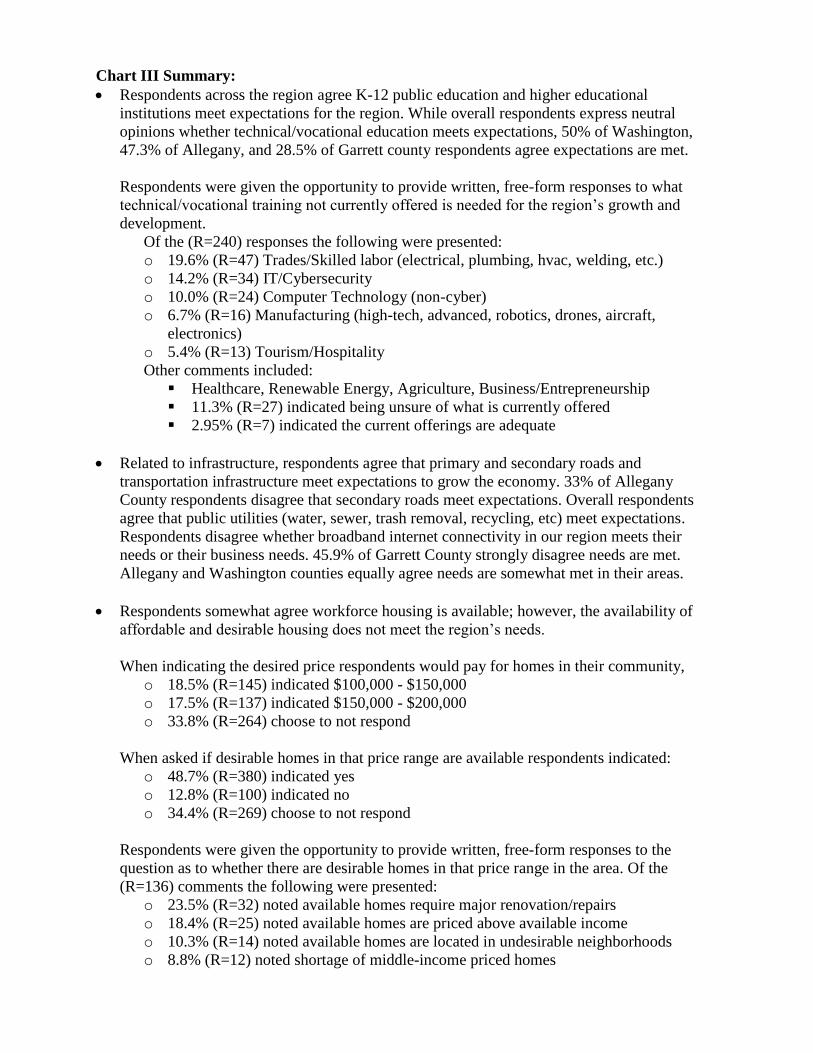
Chart III Summary:
Respondents across the region agree K-12 public education and higher educational
institutions meet expectations for the region. While overall respondents express neutral
opinions whether technical/vocational education meets expectations, 50% of Washington,
47.3% of Allegany, and 28.5% of Garrett county respondents agree expectations are met.
Respondents were given the opportunity to provide written, free-form responses to what
technical/vocational training not currently offered is needed for the region’s growth and
development.
Of the (R=240) responses the following were presented:
o 19.6% (R=47) Trades/Skilled labor (electrical, plumbing, hvac, welding, etc.)
o 14.2% (R=34) IT/Cybersecurity
o 10.0% (R=24) Computer Technology (non-cyber)
o 6.7% (R=16) Manufacturing (high-tech, advanced, robotics, drones, aircraft,
electronics)
o 5.4% (R=13) Tourism/Hospitality
Other comments included:
Healthcare, Renewable Energy, Agriculture, Business/Entrepreneurship
11.3% (R=27) indicated being unsure of what is currently offered
2.95% (R=7) indicated the current offerings are adequate
Related to infrastructure, respondents agree that primary and secondary roads and
transportation infrastructure meet expectations to grow the economy. 33% of Allegany
County respondents disagree that secondary roads meet expectations. Overall respondents
agree that public utilities (water, sewer, trash removal, recycling, etc) meet expectations.
Respondents disagree whether broadband internet connectivity in our region meets their
needs or their business needs. 45.9% of Garrett County strongly disagree needs are met.
Allegany and Washington counties equally agree needs are somewhat met in their areas.
Respondents somewhat agree workforce housing is available; however, the availability of
affordable and desirable housing does not meet the region’s needs.
When indicating the desired price respondents would pay for homes in their community,
o 18.5% (R=145) indicated $100,000 - $150,000
o 17.5% (R=137) indicated $150,000 - $200,000
o 33.8% (R=264) choose to not respond
When asked if desirable homes in that price range are available respondents indicated:
o 48.7% (R=380) indicated yes
o 12.8% (R=100) indicated no
o 34.4% (R=269) choose to not respond
Respondents were given the opportunity to provide written, free-form responses to the
question as to whether there are desirable homes in that price range in the area. Of the
(R=136) comments the following were presented:
o 23.5% (R=32) noted available homes require major renovation/repairs
o 18.4% (R=25) noted available homes are priced above available income
o 10.3% (R=14) noted available homes are located in undesirable neighborhoods
o 8.8% (R=12) noted shortage of middle-income priced homes
Other comments included:
shortage of housing for young professionals, young families, and independent
elderly desiring condos, townhouses, and apartments
shortage of family rentals in desirable neighborhoods
shortage of new construction
shortage of high-end priced homes for professionals
Comments from respondents: “While there is a surplus of housing overall due to a surplus of housing in the lower price ranges, there is
not anywhere near enough housing in the middle price ranges. This is real detriment for our area. Middle
class workers coming to this area are turned off by this. They shouldn't be forced to buy a smaller house
or to build a right sized house just to take a job in this area.”
“Affordable and attractive rental properties for young professionals and young families are what is
missing. Townhouses, condos and apartments are needed for young workers just starting out but want a
nice place to live.”
“The area has in issue with desirable homes. Near the lake the homes are out of local workers price
range. More support for local employees wanting to own a home (and maintain it) in Garrett County
could help.”
“Mid-range housing. There is a need for Mid-range housing, something between the blighted properties
that Cumberland is trying to get rid of, but less the $250,000. Properties were middle class families can
raise a family. The correct housing market is needed to help attract business and employees.”
Respondents strongly disagree that transportation needs meet expectations for the region.
44.9% of Allegany and 47.9% of Garrett county respondents strongly disagree and 26.8% of
Washington county respondents somewhat disagree that public transportation serves the
needs of the region. Likewise, 45.5% of Allegany and 56.6% of Garrett county respondents
strongly disagree commuter services (air, train, bus) meet expectations to grow the economy
in the region while 24% of Washington county respondents somewhat agree the expectations
are met.
Respondent results indicate they disagree that shopping and lifestyle services (health clubs,
day care services, etc.) meet expectations.
Respondents indicate overall agreement that the availability of police and fire and emergency
services meets expectations in the region. They also indicated the healthcare services they
personally require are available in the area and that healthcare in our region meets
expectations.
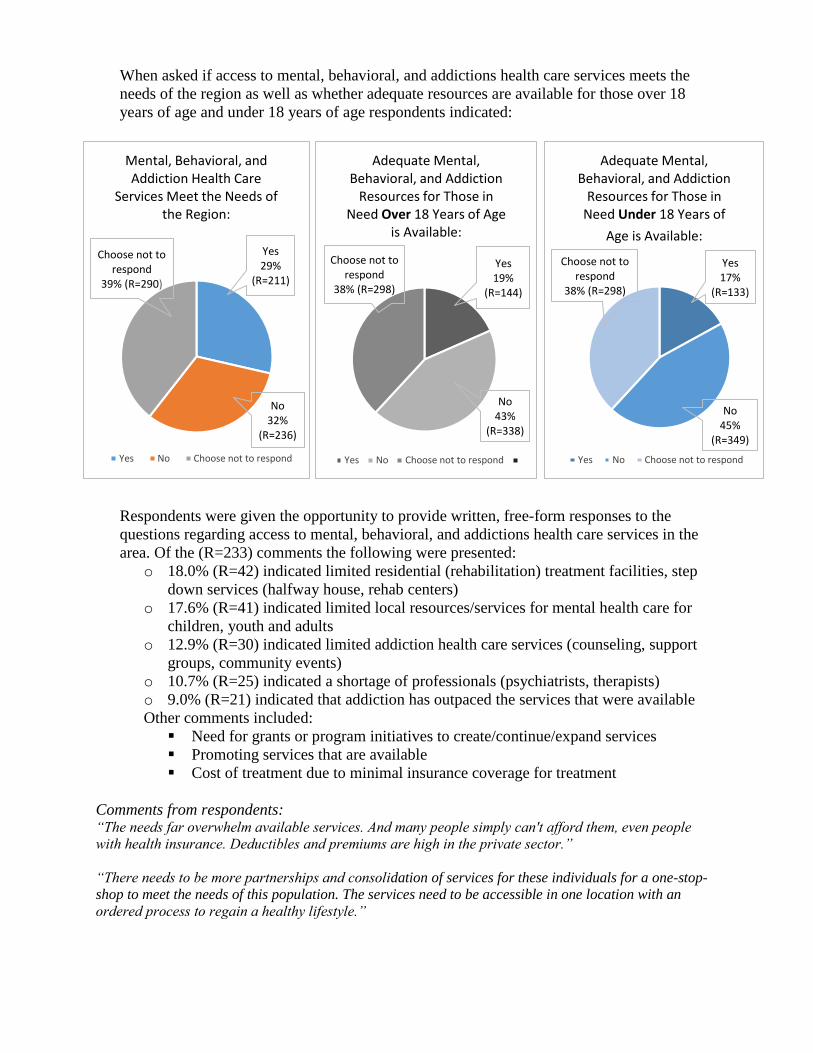
When asked if access to mental, behavioral, and addictions health care services meets the
needs of the region as well as whether adequate resources are available for those over 18
years of age and under 18 years of age respondents indicated:
Respondents were given the opportunity to provide written, free-form responses to the
questions regarding access to mental, behavioral, and addictions health care services in the
area. Of the (R=233) comments the following were presented:
o 18.0% (R=42) indicated limited residential (rehabilitation) treatment facilities, step
down services (halfway house, rehab centers)
o 17.6% (R=41) indicated limited local resources/services for mental health care for
children, youth and adults
o 12.9% (R=30) indicated limited addiction health care services (counseling, support
groups, community events)
o 10.7% (R=25) indicated a shortage of professionals (psychiatrists, therapists)
o 9.0% (R=21) indicated that addiction has outpaced the services that were available
Other comments included:
Need for grants or program initiatives to create/continue/expand services
Promoting services that are available
Cost of treatment due to minimal insurance coverage for treatment
Comments from respondents: “The needs far overwhelm available services. And many people simply can't afford them, even people
with health insurance. Deductibles and premiums are high in the private sector.”
“There needs to be more partnerships and consolidation of services for these individuals for a one-stop-
shop to meet the needs of this population. The services need to be accessible in one location with an
ordered process to regain a healthy lifestyle.”
Yes17%
(R=133)
No45%
(R=349)
Choose not to respond
38% (R=298)
Adequate Mental, Behavioral, and Addiction
Resources for Those in Need Under 18 Years of
Age is Available:
Yes No Choose not to respond
Yes19%
(R=144)
No43%
(R=338)
Choose not to respond
38% (R=298)
Adequate Mental, Behavioral, and Addiction
Resources for Those in Need Over 18 Years of Age
is Available:
Yes No Choose not to respond
Yes29%
(R=211)
No32%
(R=236)
Choose not to respond
39% (R=290)
Mental, Behavioral, and Addiction Health Care
Services Meet the Needs of the Region:
Yes No Choose not to respond
Respondents were given the opportunity to provide written, free-form responses
expressing their opinion of the current drug addiction issue and its detriment to the
region. Of the (R=464) comments the following were presented:
o 70.0% (R=325) indicated a major problem/very detrimental to the area;
comparable to others areas across the state, nation, and Appalachia
o 7.5% (R=35) indicated a strain on (or lack of) limited resources/programs
o 6.7% (R=31) indicated an impact to all facets of the community; particularly the
quality of the workforce
Other comments included:
The issue is a symptom of lack of area growth opportunities
The effects to children/youth being raised by grandparents or others (parents
incarcerated); including their education
The effects on the perception of the area
Comments from respondents: “Not only does it take people who could otherwise be productive members of their communities out of the
workforce, it creates a public health and public safety burden and undermines the next generation of
young Western Marylanders. There are many actors involved in this issue, but having a purpose in life
through meaningful employment would help.”
“Drug addiction is very detrimental to our region. It has become the biggest need/issue for our public
safety providers, medical facilities, human service providers and mental health staff. It has become a
financial strain as well as time commitment.”
“Serious, there are accounts of teachers dealing with children of addicts in class not being able to teach
because they were dealing with the fallout of children's mental health issues due to drug abuse. The
number of kids who has lost parents to OD is increasing as well.”
“We have a well-documented problem with heroin/opioids - the information that would help families and
individuals with this problem is difficult to obtain. This needs to be a primary focus of any grants or
program initiative that economic development authority undertakes.”
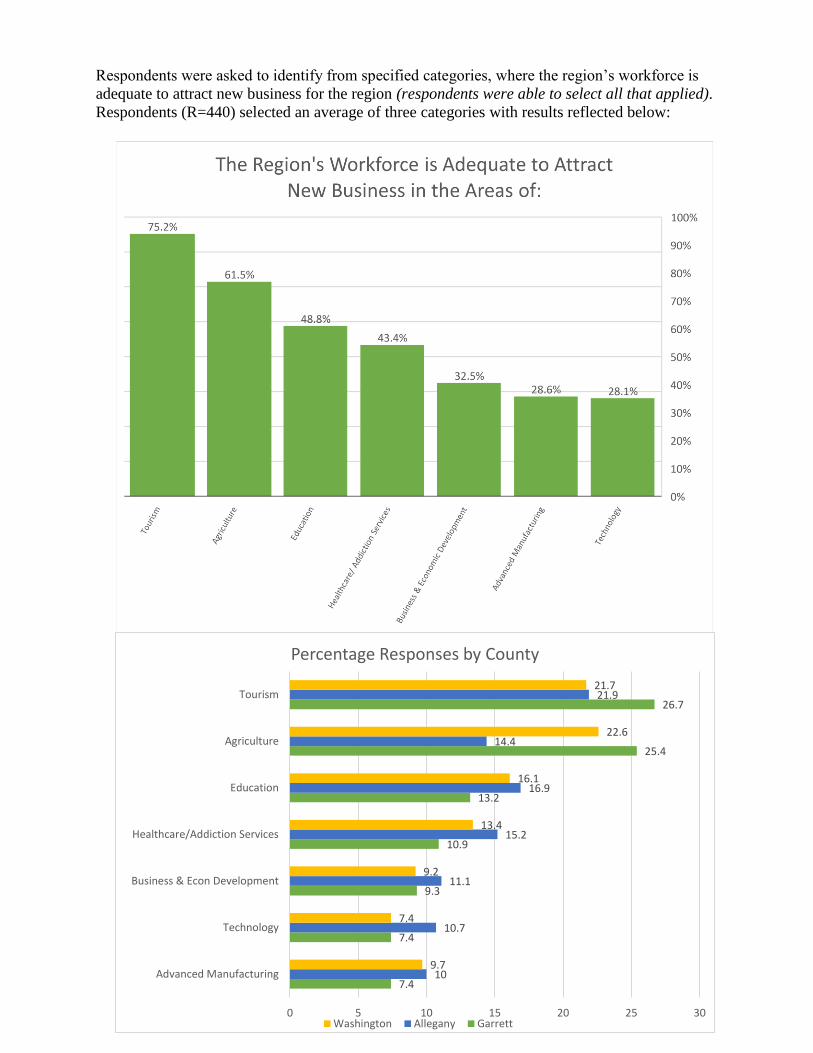
Respondents were asked to identify from specified categories, where the region’s workforce is
adequate to attract new business for the region (respondents were able to select all that applied).
Respondents (R=440) selected an average of three categories with results reflected below:
7.4
7.4
9.3
10.9
13.2
25.4
26.7
10
10.7
11.1
15.2
16.9
14.4
21.9
9.7
7.4
9.2
13.4
16.1
22.6
21.7
0 5 10 15 20 25 30
Advanced Manufacturing
Technology
Business & Econ Development
Healthcare/Addiction Services
Education
Agriculture
Tourism
Percentage Responses by County
Washington Allegany Garrett
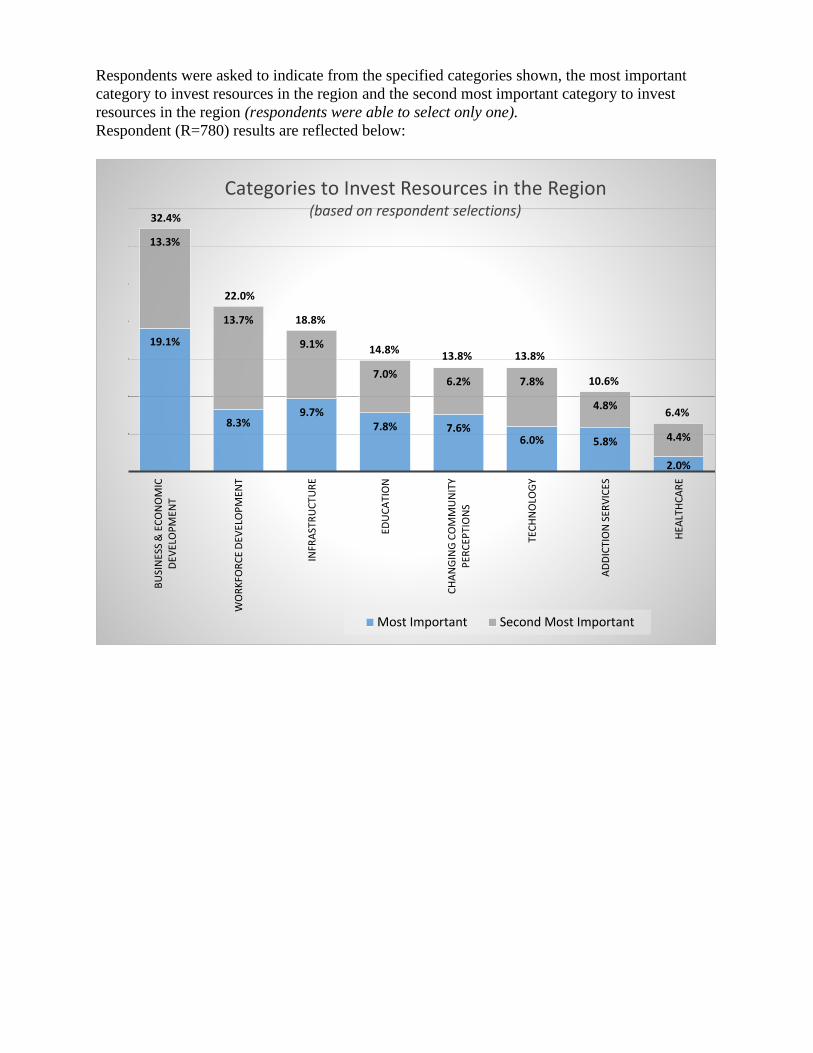
Respondents were asked to indicate from the specified categories shown, the most important
category to invest resources in the region and the second most important category to invest
resources in the region (respondents were able to select only one).
Respondent (R=780) results are reflected below:
19.1%
8.3%9.7%
7.8% 7.6%6.0% 5.8%
2.0%
13.3%
13.7%
9.1%
7.0%6.2% 7.8%
4.8%
4.4%
BU
SIN
ESS
& E
CO
NO
MIC
D
EVEL
OP
MEN
T
WO
RK
FOR
CE
DEV
ELO
PM
ENT
INFR
AST
RU
CTU
RE
EDU
CA
TIO
N
CH
AN
GIN
G C
OM
MU
NIT
Y P
ERC
EPTI
ON
S
TEC
HN
OLO
GY
AD
DIC
TIO
N S
ERV
ICES
HEA
LTH
CA
RE
Categories to Invest Resources in the Region(based on respondent selections)
Most Important Second Most Important
13.8% 13.8%
32.4%
18.8%
22.0%
14.8%
10.6%
6.4%
Respondents were given the option to provide how they use social media and/or traditional
media to stay up-to-date with current economic events/trends. The following were presented:
Facebook (social media) (total R=488)
48.2% (R=235) access multiple times per day
23.6% (R=115) access once or twice daily
14.3% (R=77) indicated not applicable
13.9% (R=68) access weekly or monthly
Twitter (social media) (total R=483)
61.0% (R=295) indicated not applicable
15.7% (R=76) access once or more daily
9.1% (R=44) access monthly
8.3% (R=40) access once or more weekly
The importance of social media in everyday life:
33.9% (R=164) indicated somewhat important
25.8% (R=124) indicated very important
15.3% (R=74) indicated slightly important
13.4% (R=65) indicated neutrality
11.6% (R=56) indicated no importance
Newspaper (traditional media) (total R=780)
33.0% (R=258) access daily
11.3% (R=88) access weekly
3.5% (R=27) access monthly
10.7% (R=84) indicated not applicable
Radio (traditional media) (total R=780)
23.7% (R=185) multiple times per day
20.0% (R=156) access once or twice daily
5.8% (R=45) access once or twice weekly
3.2% (R=25) access monthly
6.2% (R=49) indicated not applicable
Additional media outlets indicated from the (R=247) presented:
69.2% (R=171) online news outlets
26.7% (R=66) television
4.0% (R=10) word of mouth