Cedar Woods Properties Limited FY2016 Financial Results ... · 8/25/2016 · North Baldivis WA...
37
Cedar Woods Properties Limited FY2016 Financial Results 25 August 2016 For personal use only
Transcript of Cedar Woods Properties Limited FY2016 Financial Results ... · 8/25/2016 · North Baldivis WA...

Cedar Woods Properties Limited
FY2016 Financial Results 25 August 2016
For
per
sona
l use
onl
y

Cedar Woods Presentation | 2
Agenda
1 Company Overview
2 FY16 Financial Highlights
3 Operational Overview
4 Market Conditions
5
Company Outlook
For
per
sona
l use
onl
y

Cedar Woods Presentation | 3
Cedar Woods’ charter
Cedar Woods’ Purpose
“To create long term value for our shareholders through the disciplined acquisition, development and marketing of properties that meet the needs of our customers.” Cedar Woods’ Objective
“To manage our portfolio with the aim of delivering consistent annual growth in profits and dividends.” Cedar Woods’ Values
• Integrity • Performance • Innovation • People and environment F
or p
erso
nal u
se o
nly
Cedar Woods Presentation | 4
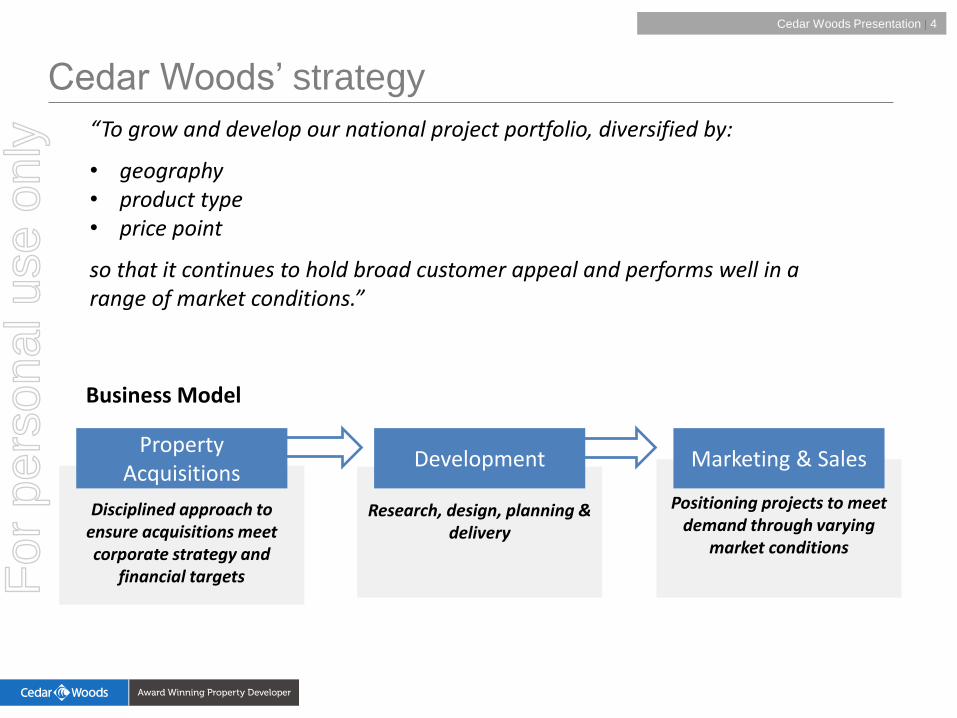
Cedar Woods’ strategy
“To grow and develop our national project portfolio, diversified by:
• geography • product type • price point
so that it continues to hold broad customer appeal and performs well in a range of market conditions.”
Positioning projects to meet demand through varying
market conditions
Research, design, planning & delivery
Disciplined approach to ensure acquisitions meet corporate strategy and
financial targets
Property Acquisitions
Development Marketing & Sales
Business Model
For
per
sona
l use
onl
y
Cedar Woods Presentation | 5
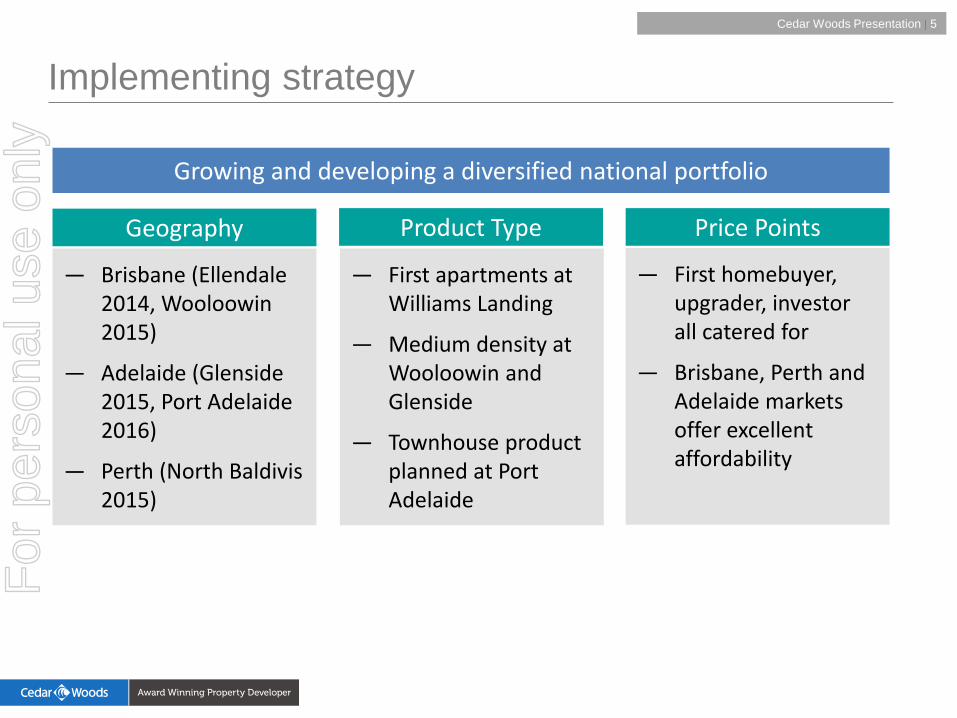
Implementing strategy
Geography Product Type Price Points
— Brisbane (Ellendale 2014, Wooloowin 2015)
— Adelaide (Glenside 2015, Port Adelaide 2016)
— Perth (North Baldivis 2015)
— First apartments at Williams Landing
— Medium density at Wooloowin and Glenside
— Townhouse product planned at Port Adelaide
— First homebuyer, upgrader, investor all catered for
— Brisbane, Perth and Adelaide markets offer excellent affordability
Growing and developing a diversified national portfolio
For
per
sona
l use
onl
y

Cedar Woods Presentation | 6
Agenda
1 Company Overview
2 FY16 Financial Highlights
3 Operational Overview
4 Market Conditions
5
Company Outlook
For
per
sona
l use
onl
y

Cedar Woods Presentation | 7
A strong track record of consistent profitability and growth
Historical financial performance
• Consistent growth in NPAT and dividends
— delivered year-on-year NPAT growth since FY10
— sixth consecutive record profit in FY16 & record EPS and DPS
• Strong return on equity
• Investor focussed
— Quarterly shareholder updates
— Regularly providing earnings guidance
Total Assets $m NPAT $m
-
10.0
20.0
30.0
40.0
50.0
60.0
0
50
100
150
200
250
300
350
400
450
2011 2012 2013 2014 2015 2016
Total assets Statutory NPAT
Financial Year For
per
sona
l use
onl
y

Cedar Woods Presentation | 8
Strategy delivering continued profit growth
FY16 FY15 Change
Net Profit after tax $43.6m $42.6m 2.4%
Earnings per share 55.3 cents 54.3 cents 1.8%
Dividends per share 28.5 cents 28.0 cents 1.8%
Dividend yield (based on 30 June share price)
6.1% 5.3% 0.8%
Return on equity 14.2% 14.9% 0.7%
• NPAT consistent with guidance
– Stronger second half as expected
• Contribution across portfolio
– Lot sales at residential communities in WA and Victoria
– Medium density housing & apartments
– Williams Landing town centre development
• Healthy ROE
• Dividend payout remains at 50%
For
per
sona
l use
onl
y

Cedar Woods Presentation | 9
Balance sheet strength and access to funding
30 June 2016 $m
30 June 2015 $m
Total assets (book value) 452.7 383.3
Net bank debt 50.3 27.9
Net assets (equity) 307.2 285.6
Net bank debt to equity 16.4% 9.8%
Finance facilities 165.0 158.0
Finance facility headroom 98.5 114.2
Interest cover 16.6x 9.9x
• Net bank debt to equity at 16.4%, to continue well within target range for FY17 • $98.5m in finance facility headroom at 30 June 2016 • Approval in July for increase in finance facilities from $165m to $205m, now
provides over $130m in headroom for acquisitions and development • Strong interest cover confirms comfortable debt servicing ability
Gearing (%)
21.1 12.5 35.6 9.8 25.9 16.5 0
20
40
60
80
100
Target Gearing
25 – 75%
Dec 13 Jun 14 Dec 14 Jun 15 Dec 15 Jun 16
For
per
sona
l use
onl
y

Cedar Woods Presentation | 10
Agenda
1 Company Overview
2 FY16 Financial Highlights
3 Operational Overview
4 Market Conditions
5
Company Outlook
For
per
sona
l use
onl
y

Cedar Woods Presentation | 11
National footprint with well located projects
For
per
sona
l use
onl
y

Cedar Woods Presentation | 12
Positioned for continued growth
Project State Acquired Acquisition Cost
($m) Lots / Units
Project Life (Years)
Ellendale - Upper Kedron QLD 2014 68.0 480 10
Wooloowin QLD 2015 24.6 279 6
Jackson Green - Clayton South VIC 2013 25.3 350 5
St A - St Albans VIC 2012 12.0 250 4
Newton Apartments VIC 1998 0.1 57 1
North Baldivis WA 2011 & 2015 47.0 1,580 10+
Bushmead – Hazelmere WA 2010 18.0 935 8
Mangles Bay Marina WA N/A N/A TBA 10
Glenside SA 2016 25.8 1,000 5-10
Port Adelaide (2) SA TBA TBA 500 7
New Projects Contributing to Revenue in Coming Years
(1) Initial approval for 480 lots. It is anticipated that further stages will be approved in due course. (2) Cedar Woods selected as preferred proponent by Renewal SA
(1)
For
per
sona
l use
onl
y

Cedar Woods Presentation | 13
Product mix – settled sales FY16
• Focus on land and housing, with niche apartment product • Maintaining acquisition focus on well located sites
Housing 15%
Apartments 8%
Land sales 77%
Housing Apartments Land sales
For
per
sona
l use
onl
y

Cedar Woods Presentation | 14
Anticipated acquisition and development spend FY17
VIC
WA • Geographic diversification strategy providing national footprint in key metropolitan markets
• Acquisition focus in Melbourne in FY17
• Majority of portfolio’s value located in Eastern States
30%
14%
31%
25%
For
per
sona
l use
onl
y

Cedar Woods Presentation | 15
VIC portfolio update
• Strategy of acquiring well located infill projects has delivered quality portfolio
• Melbourne – strongest housing market over the past 5 years
• Positive conditions across land and housing with high level of sales, anticipate steady growth in sales and prices for CWP into FY17
• Williams Landing 10+ years remaining
• Pleasing progress at St. A, Jackson Green and Newton Apartments projects
For
per
sona
l use
onl
y

Cedar Woods Presentation | 16
VIC project highlights
• Strong price growth on residential lots achieved resulting in higher margin
• First stage of new Addison neighbourhood released in January with strong price points achieved
• Council constructing central sporting facilities
• Shopping Centre has approximately 6800sqm retail, 1800sqm office and 440 car bays
• Construction of a further 1200m2 of retail space almost complete, expansion to include childcare centre, restaurant and retail tenancies
• Provision made for $780,000 of overdue rent and lease incentives, review of tenancy mix and performance ongoing
• Newton Apartments comprising 57 apartments, with a mix of 1 and 2 bedrooms, 100% pre-sold
• Under construction – completion anticipated in April 2017
• Marketing of commercial, office, showroom uses continues
WILLIAMS LANDING SHOPPING CENTRE
WILLIAMS LANDING
WILLIAMS LANDING TOWN CENTRE
For
per
sona
l use
onl
y

Cedar Woods Presentation | 17
Williams Landing remaining life 2026+
For
per
sona
l use
onl
y

Cedar Woods Presentation | 18
Williams Landing Town Centre – indicative stages
For
per
sona
l use
onl
y

Cedar Woods Presentation | 19
• 350 dwellings planned on 6.5ha site in Melbourne’s south-east
• Strong sales achieved in FY16 for settlement in FY18, price range $500 - 960k
• Established new price points well above suburb’s median house price
• Civil construction underway
• 5-year staged project
• Approx 250 dwellings on a 6.8ha site in Melbourne’s north-west
• Strong sales momentum with 18 sales in FY17 YTD, price range $400 – 600k
• 10% growth in St Albans suburb median price in FY16
• 4-year staged project, civil construction underway
VIC project highlights
JACKSON GREEN
ST. A
For
per
sona
l use
onl
y

Cedar Woods Presentation | 20
WA portfolio update
• Market showing early signs of improvement
— improvement in HIA new home sales in May and June
— CWP sales lifted 4Q FY16 • Sales supported by selective
incentives and price discounting in areas of increased competition
• Demand/supply varies from corridor to corridor
• First release of Bushmead project sold out, construction scheduled to commence September 2016
For
per
sona
l use
onl
y

Cedar Woods Presentation | 21
WA project highlights
• Master-planned community of 480 lots 17km from Perth CBD in growth corridor
• New sales centre recently opened and strong sales in first two stages
• Construction of 94-lot second stage completed, stage 3 planned for FY17
• 120 lots sold to date
• Master-planned community of over 1,400 lots, 42km from Perth CBD
• New primary school opened within the estate adjoining existing high school
• Sale of Child Care site adjacent to school
• Premium estate in the area with no comparable product available
• Demand consistent throughout FY16
• New planning approvals achieved for release of next stages
• Construction of stage 8A commencing (45 lots)
• Stage 1 largely sold out, stage 2 construction complete
• Established community within the project as construction continues
• Major landscape works nearing completion
THE BROOK AT BYFORD
BYFORD ON THE SCARP
ARIELLA
THE RIVERGUMS
For
per
sona
l use
onl
y

Cedar Woods Presentation | 22
WA project highlights
• Sales and settlements of last remaining stage of 40 lots continuing
• Strong sales and buyer interest for remaining canal lots
• Planning design advanced for development of group housing site – yield 31 units
• Purchase of 50.74 hectares at North Baldivis in early August 2015
• Site adjoins company’s existing 68 hectare holding
• Combined property will allow master-planned development of approximately 1,580 lots
• Construction planned Q2 FY17
• 273ha site, 15km from Perth CBD, expected to yield approx 935 lots
• First release lots all sold
• Construction of stage 1 (90 lots) scheduled to commence in late August/early September 2016, titles April 2017
• 66ha Marina-Based tourist precinct 39km from Perth CBD
• State & Federal environment approvals achieved
• Rezoning and detailed planning underway
• Construction anticipated to commence in FY18
NORTH BALDIVIS
MANGLES BAY MARINA
MARINERS COVE
BUSHMEAD
For
per
sona
l use
onl
y

Cedar Woods Presentation | 23
QLD portfolio update
• Qld new home sales expected to continue at robust levels for the next 3 years
• Strength in the established housing sector and inner-city urban developments
• Consistent with diversification strategy, CWP has acquired two well-located projects offering mix of land and built form product
For
per
sona
l use
onl
y

Cedar Woods Presentation | 24
QLD project highlights
• 227 ha situated 12 km west of Brisbane’s CBD
• Initial approval granted for the first 480 lots with a planning
process underway for the remaining 160 hectares
• Stage 1, 143 lots - construction commenced in Q4 FY16.
Settlements expected Q4 FY17
• Stage 1 sales launched in Q4 FY16, approx. 50 sales to date
• 29 lot display village – builder allocation complete
• Subdivision approval process underway for stage 2
• 3.81 hectare site, 6 km north of the Brisbane CBD, train
stations nearby
• Site has current approval for 279 residential dwellings up to 8
storeys
• CWP is revising the masterplan to provide an integrated
housing development, comprising premium terrace homes,
duplexes and low to mid- rise apartments
• Construction and sales commencing FY18
• Target market predominantly local buyers
WOOLOOWIN
ELLENDALE
For
per
sona
l use
onl
y

Cedar Woods Presentation | 25
SA portfolio update
• Recent entry in to SA market consistent with strategy, places CWP in 4 key Australian metropolitan markets
• SA housing market forecast to grow
over the next 3 years • Government focus on consolidating
growth in existing urban areas • CWP active with two well located
projects F
or p
erso
nal u
se o
nly

Cedar Woods Presentation | 26
• 16.5 hectare site just 3km south-east of Adelaide CBD
• Sale approved by SA Gov’t for $25.86M plus GST
• Masterplan of 1,000 apartments and townhouses
• Rezoning underway, expected to be approved in mid FY17
• Settlement conditional upon rezoning
SA project highlights
• 12.6 hectare site 14km north-west of Adelaide CBD
• Cedar Woods is preferred proponent to purchase the site, subject to due diligence
• Masterplan of 500 townhouses and apartments
PORT ADELAIDE
GLENSIDE
For
per
sona
l use
onl
y

Cedar Woods Presentation | 27
Agenda
1 Company Overview
2 FY16 Financial Highlights
3 Operational Overview
4 Market Conditions
5
Company Outlook
For
per
sona
l use
onl
y

Cedar Woods Presentation | 28
Residential property market drivers Positive outlook in all CWP markets
Tren
d Population
growth forecast to accelerate
GDP forecast to grow 2.5-3.5% pa in 2016 and
2017
Employment outlook stable
Changing demographics driving buyer preferences
Interest rates at historical
lows, RBA cash rate 1.5%
Met
ric Growth in year to
Dec 2015 (and 5 year capital
city forecast)
GSP growth for FY17
Unemployment as at May 2016
Forecast annual growth in capital city households
Affordability in CWP’s markets
to remain positive
VIC 1.9% (2%) 3.0% 5.8% 1.99%
QLD 1.3% (2.2%) 4.5% 6.4% 2.1%
WA 1.2% (1.7%) 1.25% 5.7% 2.89%
SA 0.7% (0.9%) 1.75% 6.9% 1.21%
Sources: ABS, State Treasuries
For
per
sona
l use
onl
y

Cedar Woods Presentation | 29
Median sales & rental prices CWP markets more affordable than Sydney
Median Price
(House)
Median Price
(Unit)
Median Price
(All)
YOY Median Price Change
(All)
Sydney $1,079,060 $734,060 $996,140 11.3%
Melbourne $852,420 $528,380 $803,290 11.5%
Brisbane $544,930 $406,200 $528,370 5.3%
Perth $596,100 $456,290 $584,110 -4.7%
Adelaide $481,990 $346,210 $467,520 2.2%
Median Rents (per month)
Median rental change (YOY)
Rental vacancy rates
Sydney $596 0.4% 1.8%
Melbourne $457 1.7% 2.1%
Brisbane $432 -0.3% 2.8%
Perth $431 -8.6% 5%
Adelaide $366 -0.4% 2%
Source: Corelogic as at 30 June 2016
For
per
sona
l use
onl
y

Cedar Woods Presentation | 30
Dwelling start forecasts Housing markets less volatile than apartments
VIC QLD
WA SA
Source: HIA
For
per
sona
l use
onl
y

Cedar Woods Presentation | 31
Agenda
1 Company Overview
2 FY16 Financial Highlights
3 Operational Overview
4 Market Conditions
5
Company Outlook
For
per
sona
l use
onl
y

Cedar Woods Presentation | 32
Company outlook
• Positive outlook underpinned by strong pre-sales of $184 million, up 20% on
last year
• Development program is on track, backed by continued strong pre-sales and disciplined project execution and delivery
• Landmark projects in Queensland, Victoria and Western Australia underway, placing the company in a strong position for FY17
• Assuming current market conditions continue, the company is well placed to
maintain profit momentum into FY17, with a similar profit result anticipated to that achieved in FY16
• New projects commencing and already under construction provide positive growth outlook for FY18 and future financial years
For
per
sona
l use
onl
y

Perth Office Melbourne Office
Ground Floor, 50 Colin Street Level 1, 476 St Kilda Road
West Perth WA 6005 Melbourne VIC 3004
T: (08) 9480 1500 T: (03) 9820 1777
E: [email protected] E: [email protected]
Brisbane Office Adelaide Office
Level 6, 12 Creek Street Level 21, 25 Grenfell Street
Brisbane QLD 4000 Adelaide SA 5000
T: (07) 3007 2900 T: (08) 8424 2343
E: [email protected] E: [email protected]
Disclaimer of liability While every effort is made to provide complete and accurate information, Cedar Woods Properties Limited does not warrant or represent that the information in this presentation is free from errors or omissions or is suitable for your intended use. Subject to any terms implied by law and which cannot be excluded, Cedar Woods Properties Limited accepts no responsibility for any loss, damage, cost or expense (whether direct or indirect) incurred by you as a result of any error, omission or misrepresentation in information in this presentation. All information in this presentation is subject to change without notice.
This presentation is not financial advice or a recommendation to acquire Cedar Woods Properties Limited securities and has been prepared without taking into account the objectives, financial situation or needs of individuals.
For
per
sona
l use
onl
y

Cedar Woods Presentation | 34
Appendices
For
per
sona
l use
onl
y

Cedar Woods Presentation | 35
Cedar Woods’ investment highlights
ASX 300 company with a proven track record of consistent earnings growth
Attractive, fully-franked dividend yield
Attractive valuation metrics
Strategically located portfolio, diversified by geography, product type and price point
Strong balance sheet and capacity to fund growth
Experienced and proven management team
For
per
sona
l use
onl
y

Cedar Woods Presentation | 36
Project Pipeline
For
per
sona
l use
onl
y

Cedar Woods Presentation | 37
Cedar Woods P/E over time1 Relative FY16 P/E
Note: (1) P/E over time based on share price at 30 June in each relevant year and earnings for relevant financial year. CWP’s current P/E based on final FY16 NPAT of $43.6m and share price as at 2 August 2016. (2) ASX Peers consist of PPC, FRI, VLW, AVJ & SDG. Multiple represents the average FY16 P/E of the peer group, using analyst consensus estimates and share prices as at 2 August 2016. (3) Benchmark indices P/E based on trailing 12 month EPS and share prices as at 2 August.
Attractive Valuation
• FY16 below historical average
• Trading at a discount to benchmark indices
10.4x
14.2x
9.7x
7.9x 8.5x
-
3.0x
6.0x
9.0x
12.0x
15.0x
18.0x
30-Jun-13 30-Jun-14 30-Jun-15 30-Jun-16 Current
8.5x 8.6x
15.6x
13.7x
-
3.0x
6.0x
9.0x
12.0x
15.0x
18.0x
CWP ASX Peers ASX 300 ASX SmallIndustrials
2 3
3
For
per
sona
l use
onl
y