Cedar Stewardship Area Management Plan 2016...Distribution of Red cedar and Yellow cedar within the...
60
Cedar Stewardship Area Management Plan 2016 Heritage and Natural Resource Department Council of the Haida Nation
Transcript of Cedar Stewardship Area Management Plan 2016...Distribution of Red cedar and Yellow cedar within the...

Cedar Stewardship Area Management Plan2016
Heritage and Natural Resource Department Council of the Haida Nation

Cover – Bear den tree at Jiinanga, Haida Gwaii. Photo: S. Davies
Published by:Heritage and Natural Resource Department Council of the Haida Nation2016

Cedar Stewardship Area Management Plan • 2016Heritage and Natural Resource Department
Council of the Haida Nation


1.0 INTRODUCTION1.1 PLAN PURPOSE 11.2 PLAN AREA 11.3 PLAN AUTHORITY 101.4 CSA HISTORy 11
2.0 VALUES 142.1 INVENTORY 142.2 NADEN HARBOUR 152.3 MASSETT 172.4 AIN 172.5 JUSKATLA 182.6 YAKOUN 182.7 EAST COAST GRAHAM 202.8 SKIDEGATE INLET 212.9 AROUND LOUISE ISLAND 212.2 OVERVIEW OF CURRENT INVENTORY IN CSAs 21
3.0 MANAGEMENT 24 3.1 ADAPTIVE MANAGEMENT 243.1.1 Amendments to CSAs 243.1.2. Priorities for Future Inventories 243.2 USE 263.2.1 Commercial Salvage Opportunities 273.2.2. Commercial Harvest Opportunities 333.3 RESTORATION 293.3.1 Recruitment 313.3.2 Silviculture 313.4 RESEARCH 333.5 MANAGEMENT GOAL SUMMARIES 33
BIBLIOGRAPHY 39
APPENDIX 1 INVENTORY METHODS 41 APPENDIX 2 AREAS WHERE SURVEYS HAVE BEEN COMPLETED 46
CONTENTS

TABLESTABLE 1. Harvest origin second growth cedar areas. 23
FIGURESFIGURE 1. Distribution of Red cedar and Yellow cedar within the CSAs. 15FIGURE 2. Logging CMTs up the Yakoun river in the 1980’s. Photo: Bernick,1984. 17FIGURE 3. Overview of the ages classes of Red and Yellow cedar within all the CSAs. 21FIGURE 4. Hectares of CSA by elevation: most CSAs are in low elevation areas. 22
PHOTOS PHOTO 1 Lignite Creek: CMTs and Monumental cedar logged. 12PHOTO 2 The Dist lans or Lignite area is known to have many standing trees with planks removed, which is not very common on Haida Gwaii. 15PHOTO 3 Looking east towards a Cedar Stewardship Area along the access road to the Upper Chinukundl watershed. 19PHOTO 4 A cedar veteran in a fire-origin stand near Lawn Hill. 23PHOTO 5 Fire-origin cedar stand and second growth plantation. 21PHOTO 6 Yellow cedar in West Chichagof-Yakobi Island in Alaska. 27PHOTO 7 Yellow cedar decline within a CSA in Florence Creek. 28PHOTO 8 A three hectare high quality cedar site caused from wind throw within a CSA. 28PHOTO 9 Yakoun Lake Exclosure. 30

1.1 PLAN PURPOSE
This document is meant to serve as reference and policy for the Council of the Haida Nation for the long term management of the Cedar Stewardship Areas. The Cedar Stewardship Areas (CSAs) have been designated under the direction and authority of the House of Assembly (HOA 2007-42) through the Strategic Land Use Agreement. Industrial logging has been ongoing on Haida Gwaii for the last 100 year. Since the signing of the Kunst’aa guu Kunst’aayah Reconciliation Pro-tocol logging will continue under the guidance of yaagudaang (respect) to ensure for the natural func-tion of the forests which include wildlife, water and fish, culture and cedar.
Cedar began growing on Haida Gwaii just over 5,000 years ago and has become integral to the ecosystems and culture of Haida Gwaii. The primary objective of the CSAs is maintain an ongoing supply of cultural cedar in the context of fully functioning old growth forests.
This Management Plan is meant address the following in the CSAs:• Describe the Plan Area • Describe the Purpose• Describe the History • Describe the Values and Known Inventory• Describe Management Direction
1.2 PLAN AREA
This section provides a geographic description of the Cedar Stewardship Areas on Haida Gwaii. The majority of CSAs are within the physiographic area called the Skidegate Plateau. This region is typical-ly made up of well drained soils which are part of deep glacial tills, a rolling topography with elevations rising up to 700 metres where mountain tops have been rounded by glaciation.
The plan area is divided into seven general regions, as described in the following text and combine to make up 25,353 hectares.
1.0 INTRODUCTION
Cedar Stewardship Area Management Plan 1

MAP 1. The CSAs are outlined in red, Heritage sites are green, main access roads in yellow. 1:110 000 scale.
NADEN HARBOURThe CSAs around Naden Harbour make up 3,707 hectares, or approximately 15% of the CSA reserves on the Islands and are low elevation with gentle slopes. Cedar Stewardship Areas in this region cover coastal areas near the mouths of Naden River, Stanley Creek, Lignite Creek and Davidson Creek. The CSA reserves also extend inland around the west side of Marian Lake, along the north side of the
Lignite River on Dist lan Hill and the east side of the Davidson River. Access to this area is by boat or sea plane to Naden Harbour. There is an extensive and well maintained road network which includes the Peregrine Main, Jaalun Main, Lignite Main and Na-den Main. These roads run adjacent to all the areas, except around Whale Creek.
Cedar Stewardship Area Management Plan 2

MASSETTThe areas south of Massett make up 397 hectares or 2% of the CSAs. The area extends south from RivTow or Skoglands Landing along the inlet to Deep Creek north of Watun River. The southern part of the CSA reserve extends up the east side of Deep Creek and is met on the west side of the hill by the Naang Xaldaangas Heritage Site/Conservancy. Another area 112 hectare site is on the west side of Masset Inlet behind Collison Point.
Access to the area close to Masset is from Highway 16 as well as the gravel pit road accessed at the junction of the RivTow barge facility. Collison Point is only accessible by boat and then forest service road.
MAP 2. Masset Inlet: The CSAs are outlined in red, Heritage sites are green, main access roads in yellow. 1:60:000 scale
Cedar Stewardship Area Management Plan 3

AIN and NORTHERN MASSETT INLETThe Ain River watershed CSAs are 6,420 hectares or 25% of all the CSAs. A special House of Assembly resolution was passed in 2001 directing the CHN to protect remaining old growth forest in the Ain River valley in light of the probable impact of Weyerhaeus-er’s 20 year development plan in the area. Now the protection for cedar extends along the Ain Creek, including Bill Creek, all the way to Ian Lake. The protection also includes the south side of Tara Creek (a tributary into Ian lake) and the entirety of Crease Creek. Crease Creek is the only intact or unlogged watershed on the Skidegate Plateau (hills and moun-tains east of the west coast) on Graham Island and was subject to intensive logging pressures leading up to a blockade by the CHN Heritage and Forest Guardians in the winter of 2006 prior to its protec-tion.
A portion of the Ain CSAs are in young second growth less than 20 years old with planted cedar. The areas southeast of Ian lake have significant ar-chaeological values. The inland areas (Crease Creek and Tara Creek) have significant reserves of mon-umental Yellow cedar, however Crease Creek has little to no access. Access by truck from Juskatla to Dinan Bay along Tracy Main, Ian Main, Deuce Main and Bill Main logging roads.
MAP 4. Plan area map for Aayan. CSAs outlined in red, main access roads are yellow lines. 1:100,000 scale.
Cedar Stewardship Area Management Plan 4

JUSKATLAThe CSAs around Juskatla Inlet including around Awun Lake and Mamin River represent 2,935 hectares or 11% of the CSAs on the Islands. Most of these areas have significant archaeological and monumental cedar values. This area contains some of the highest elevation CSAs which are in the Awun watershed and the top of the Begbie Peninsula which contain greater amounts of Yellow cedar. The area also contains the ‘Raven’s Nest’ site, a well known site with significant CMT values adjacent to the former Juskatla camp.
Access to these areas is from Ferguson Main, QC Main and Datlaman hook-up to the Awun Main and Begbie Main logging roads, all accessible from Port Clements.
MAP 5. Plan area map for Juus Kaahlii. CSAs outlined in red, main access roads are yellow lines. 1:80,000 scale
Cedar Stewardship Area Management Plan 5

YAKOUN The CSAs along the Yakoun River represent the most significant areas of cedar reserves on Haida Gwaii, containing 8,160 hectares or 32% of the CSAs on the Islands. These areas include extensive continuous reserves along the Yakoun River corri-dor, Canyon Creek, Wilson and Drill Creeks, Black Bear Creek, Gold Creek, Florence Creek and Canoe Creek. Some higher elevation sites for Yellow cedar can be found in the upper Florence Creek and south-ern portions of the Canyon Creek area (along Drill ridge). The areas around Gold Creek are well known for some of the highest densities of monumental ce-dar. This area also encompasses the greatest variety of ages of cedar forest, including the highest con-
centration of fire-origin second growth cedar (120+ years old) on the east side of the Yakoun River, as well as many areas of planted second growth (under 20 years old). The area intersects with the Yaagun Gaandlay Heritage site to the north, and the Tlall Heritage site to the south east.
Access to this area is primarily along East Yakoun Main, Canyon Main, Drill Main, Black bear Main, Feather Main, QC Main S, Gold Main, Florence Main and Yakoun Main, all of which are maintained.
MAP 6. Yakoun River area. CSAs outlined in red, main access roads are yellow lines.
Cedar Stewardship Area Management Plan 6

EAST COAST GRAHAMThe CSAs along the east coast of Graham Island extend from Chinukundl Creek up to the northern end of the Tlell watershed and encompass a total of 933 hectares or 4% of all the CSAs on Haida Gwaii. While the Chinukundl Creek areas and Upper Lawn Hill areas have significant culturally modified trees (see VALUES section following), other areas consist mainly of second growth stands that became estab-
lished after fires in the 1850s (Golumbia, 2007). This area is physiographically unique within the CSAs because they represent some of the few areas within the physiographic region called the Queen Char-lotte Lowlands. The areas are easily accessible from Highway 16 and many of these areas are adjacent to the Tlall Heritage Site/Conservancy.
MAP 7. East coast Graham Island. 1:90,000 scale.
Cedar Stewardship Area Management Plan 7

SKIDEGATE INLETThe CSAs around Skidegate Inlet account for 1857 hectares or 7% of all the CSAs on Haida Gwaii. These extend from Haans Creek, Sachs Creek, South Bay Creek to the East Narrows on Moresby Island. There are small coastal areas with significant
MAP 8. Skidegate Inlet. 1:90,000 scale
CMT values on Maude, Sandilands and Lina Island, along with areas on the Kagan Peninsula and directly north of Queen Charlotte.
Cedar Stewardship Area Management Plan 8

AROUND LOUISE ISLANDThe CSAs around Louise Island make up 617 hect-ares, or 2% of the CSAs. Two small areas are on Louise Island. One is on the Moresby side of Cum-shewa inlet, and there are two small areas in Sewell Inlet. Access to the Sewell Inlet areas, and the rock fish harbour area on Louise Island can be made by boat. One area further inland on Louise Island is in-
accessible by boat or road, whereas the area on the north shore of Cumshewa Inlet is accessible from the Heather Main logging road.
MAP 9. Louise Island and Sewell inlet. 1:90,000 scale
Cedar Stewardship Area Management Plan 9

1.3 PLAN AUTHORITY
A mandate for the Council of the Haida Nation to create Cedar Stewardship Area’s was brought forward by the people of the Haida Nation during the 1993 and 2001 House of Assemblies:
HoA RESOLUTION 93-01-HOA-02
POLICY FOR PROTECTION OF RED CEDAR STANDS
WHEREAS stands for mature Red cedar are diminishing on Haida Gwaii due to logging and other activities; and
WHEREAS stands for Red cedar are sacred places to the Haida but also contribute to Haida culture as material necessary for building canoes, carving and raising totem poles and building of longhouses:
BE IT RESOLVED that the 1993 House Assembly directs the Haida Forestry Committee to develop policies to set aside stands of mature Red cedar from logging or other use;
BE IT FURTHER RESOLVED that a further policy be developed to guide Haida access to these sites. MOVED BY Gary RussSECONDED BY Ernie CollisonCarried
HoA RESOLUTION 01 – 1
RESERVES FOR OLD GROWTH CEDAR
WHEREAS Old growth forests in Haida Gwaii have been cut at an alarming rate and Haida Gwaii forests are not currently managed to provide for the cultural needs of Haida over the long term;
And an adequate supply of Red and Yellow cedar is essential over the long term to provide for carving of Haida monumental art and other cultural needs.
THEREFORE BE IT RESOLVED THAT the CHN is directed by the 2001 Annual House of Assembly to develop a 1000 year plan for Haida Gwaii forests that will ensure a long term supply of Red and Yellow cedar for Haida cultural needs by:
assessing current and future Haida cultural needs for Red and Yellow cedar,assessing potential risks to the existing forests and identifying areas of current and future supply of Red and Yellow cedar across the Haida Gwaii landscape,developing policies and procedures for designating Red and Yellow cedar reserves to be protected for Haida cultural uses,and, engaging the Province of BC, local governments and third parties interests in implementing measures to protect Red and Yellow cedar for Haida cultural uses until the 1,000 Year Plan for Haida Gwaii is implemented.
Moved by Charlie BellisSeconded by Lois Rullin Carried
Cedar Stewardship Area Management Plan 10

Further to the House of Assembly Resolutions, the CHN protected archaeological and important cultural cedar forests illustrated in MAP 3 of the Haida Land Use Vision (2004) which was adopted by the 2005 House of Assembly.
The MAP 3 areas were recognized for temporary protection by the Province of BC in 2005 under the Forest Act RSBC 1994, c.157, Part 13 sec. 169 as a result of the Understanding Arising from April 22 2005 Discussions Between the Province and the Council of the Haida Nation. The areas were further earmarked for long term protection under Attach-ment C of the Haida Gwaii Strategic Land Use Agreement between the CHN and BC in 2007.
While the areas were designated for protection by the CHN in 2005, formal legal protection by BC did not come until 2010 when the areas were mapped within s.3.1, 3.2 and Schedule 8 of the Haida Gwaii Land Use Objectives Order (LUOO) which was an or-der jointly written by the CHN and the government of BC. The LUOO was further authorized by the Council of the Haida Nation in 2010 under the KaayGuu Gag a Kyah ts;as – Gin ‘inaas ‘laas ‘waadluwaan gud tl’a gud giidaa (Stewardship Law) which made the Land Use Objectives legal under Haida Kil yah das – Gin yah Kil sGun (law). The government of BC recog-nized the LUOO under the Land Act, R.S.B.C. 1996, c.245, ss.8, 93.4 and it was implemented under the Forests and Range Practices Act, S.B.C . 2002, c.69, ss.149.
1.4 CSA HISTORY
By the 1990‘s there were a number of factors that led to the need for a precautionary approach to ce-dar management for Haida cultural use. In 1993 the Haida Nation’s House of Assembly passed a resolu-tion that directed the Haida Forestry Committee to develop policies to set aside stands of mature Red cedar from logging or other use. By 2001, the House of Assembly passed a resolution called Reserves for Old Growth Cedar that directed the CHN to develop a 1000-year plan for Haida Gwaii forests to ensure a long term supply of Red and Yellow cedar for Haida cultural needs. The plan was also to include long term reserves for cedar.
By the early 2000s, inventory data analysed through the Land Use Planning Forum identified a 47% decrease in higher productivity cedar growing sites on the Lowlands of Haida Gwaii (Holt & Utzig, 2009). While the overall harvest rate fell on the Islands by about 56% between 1982 and 2004, over the same period the proportionate amount of cedar harvest-ed increased to close to 50% of the harvest profile (CHN & BC, Haida Gwaii Timber Supply Review: Timber Supply Analysis Report , 2012), providing ev-idence of old growth cedar being targeted by logging companies.
In addition to industrial harvesting, there was in-creasing concern about the lack of naturally regen-erating cedar and doubt that the second growth inventory would contribute to monumental cedar supplies. These concerns were compounded when considering a growing population rooted in the cul-ture of traditional art and practice. This emphasized the need to identify areas that could be managed for the long-term supply of cultural cedar.
Cedar Stewardship Area’s (CSA) were first intro-duced as Haida Protected Areas as well as Cultural Cedar and Cedar Archaeology areas in the Haida Land Use Vision (Nation, 2004) at the community planning forum in 2004. The Haida Land Use Vision (HLUV) reiterated the growing concerns of the high
Cedar Stewardship Area Management Plan 11


rate of cut of cedar as a direct threat to current and future Haida cultural practices. The text of the HLUV was complimented with a map of important archae-ological forests, and cultural cedar areas identified through traditional knowledge interviews and forest inventory data, which were subsequently supported by almost 80% of the Land Use Planning Communi-ty Planning Forum (PMT, 2006).
However, tensions increased soon after the areas were made public, as logging companies began tar-geting the areas and the Ministry of Forests contin-ued authorizing cutting permits for close to 180 hect-ares of cedar areas identified within the HLUV map. These actions, along with a provincially proposed increase in the Allowable Annual Cut, the provinces withdrawal from the Land Use Planning process and a lack of meaningful consultation in tenure transfers, contributed towards the general mistrust between industry, government and the Haida and Island com-munities.
As a result of the successful court case in Haida Na-tion v. British Columbia (Minister of Forests), 20041, along with Haida and Islands’ community action – Islands Spirit Rising – in the spring of 2005, the Council of the Haida Nation entered into government to government negotiations with BC resulting in an agreement2 that ultimately led BC to issuing Part 133 Orders (protection under the Forest Act) on areas identified within the HLUV maps. This agreement and subsequent government to government nego-tiations led to the Strategic Land Use Agreement4 (SLUA) which emphasized the need to refine precise locations for these areas.
In 2008-2009, work was completed by the CHN, in collaboration with the province under Detailed Stra-tegic Planning, to refine the boundaries of the areas
1 Haida Nation v. British Columbia (Minister of Forests), [2004] 3 S.C.R. 511, 2004 SCC 732 Understanding Arising from April 22 2005 Discussions between the Province and the Council of the Haida Nation.3 Four separate Part 13 designations we signed into protection by Order in Council’s (Duu Guusd DA, HGQCI DA, HGQCI DA 3, HGQCI DA 4)4 Council of the Haida Nation, Province of British Columbia. 2007. Strategic Land Use Agreement. Attachment C: Map of Monumental, Archaeological and Cultural Cedar Forest Resource Value Areas.
designated as Part 13. Field surveys were con-ducted in over 168 polygons and 50 kilometres of traversing was completed to identify sites that were low quality cedar sites within the CSAs as well as high quality cedar sites that were not in the CSAs. This work resulted in some additions and deletions to the areas and a recognition of further work required to refine the boundaries of these cedar reserves.
PHOTO 1. A CMT and Monumental cedar at Lignite Creek. Photo: Haida Laas, 2005 13


We will look into the heart of cedar and walk in the majesty of the great magician.
For thousands of years the people went into the forest for cedar.
Among the living trees we find some with strips of bark removed to makeclothes, hats, and baskets.
We find cedar with planks split off – planks for a baby’s cradle, a cooking box,a drum, a house, and a coffin.
In the remaining forests we find stumps marking the remains of trees crafted into canoes, houses, and to display the crests.
Some tluu will be shaped in various stages of construction.
Guujaaw
2.0 VALUES
The primary values that are protected in CSAs are for cultural uses, and include, but are not limited to: monumental cedar, culturally modified trees, other archaeological sites, barkstrip cedar areas, recruit-ment of juvenile cedar, future cedar use for utility grade lumber, medicinal uses and spiritual uses.
The abundance or scarcity of any of the above val-ues will be key indicators for maintaining the current CSAs and considered when new CSAs are created. Adaptive management will play a key role in defin-ing levels of these values that should be reserved in CSAs for long term cultural use.
The primary role of a CSA is for the protection and sustainable use of cedar that is the rarest on the landscape – monumental and archaeological cedar. The existence of monumental cedar will ensure that the Haida will continue to have the ability to carry on cultural practices thus protecting our cultural iden-tity. Archaeological cedar provides a link to our an-cestors that clearly show that we not only occupied Haida Gwaii, but took it upon ourselves to protect and steward the land as our primary responsibility. That evidence can be clearly seen in every test hole,
barkstrip, or sap tree, that is still alive hundreds of years after our people used it originally.
2.1 INVENTORYThere are two types of inventory used to de-scribe known values in this report – strategic and field based. Strategic inventory is made up of forest cover information, which are maps created from aerial photo interpretations of the forests. Field based inventory is information gathered from archaeological assessments, CHNs cedar inventory project, or Cultural Feature Identifica-tion surveys.
Undertaking an inventory of a CSA is a key component of determining what values are in the CSA and how they should be managed. To date much of the CSA has limited field inventory infor-mation. This information is key to determining if areas should be added or dropped from the CSAs. Survey priorities have been identified in Section 3 to help guide inventory programs.
PHOTO. Clockwise from top left: A Haida forestry crew surveying for values in the early 2000s. Gwaayk’yaa (S) or gwaayk’aa(M) is one of many plants surveyed for in the forest. A barkstripped Red cedar. Cedar photo: Lloyd Atler, all others Haida Laas.
15

FIGURE 1. Distribution of Red cedar and Yellow cedar within the CSAs.
The following summaries describe known inventory information on an area by area basis. These summa-ries are based upon a compilation of data, including forest inventory data (mapping), a collation of CHN field data and CHN and BC archaeological inventory information.
2.2 NADEN HARBOURApproximately 15% of this area has been field surveyed according to CHN records5. Note that a large volume of archaeological reports at the CHN still need to be cross-referenced to determine if the spatial data within the reports have been included in the overall inventory.
Although only 15% of Naden has been surveyed, over 1,250 Culturally Modified Trees have been documented. Additionally, there are184 registered archaeological sites within the CSAs around Naden Harbour.
Industrial logging in the Naden Habour area began in the 1960s with Goodwin Johnson Ltd., then CIPA Lumber Company Ltd., and today under Dave Hus-by’s forest license. There have been many battles over forest development in the area. Over 46 Archae-ological Impact Assessments have been done in the area around Naden Harbour and subsequent reports contain huge amounts of archaeological data6. BC’s Archaeology Branch issued as many as 19 archae-
5 Recorded archaeological sites, CHN cedar inventories, Haida Land Value Surveys.6 Reports housed at the CHNs Hertiage and Natural Resource Department, Old Massett.
PHOTO 2. The Dist lans or Lignite area is known to have many standing cedar trees with planks removed, which is not very common on Haida Gwaii.


ological site alteration permits7 between 2003 and 2011 in the area where many CMTs were destroyed and many areas with archaeological resources were insufficiently buffered, which failed to protect the values8.
While the CSAs around Naden Harbour account for over 3,700 hectares, only approximately 1,523 hectares or 41% of the area is Red cedar and only 16 hectares is Yellow cedar. All of the areas are in old growth except 13 hectares.
As an example of both cultural and scientific archae-ological values, some CMTs have been dated in the Naden habour area, with one rectangular barkstrip in the Lignite area (LIG213) (Grant, 2010) dated back to 1679 AD (F1Ud-185).
Aside from specific cedar values, the CSA on the east side of Davidson Creek is also a Wildlife Habitat Area for Marbled murrelet nesting.
2.3 MASSETT The Massett CSAs, situated along the inlet, are the smallest CSAs and approximately 57 hectares (or 14%) of the area has been surveyed. Out of these surveys 54 CMTs have been identified within these CSAs although certain areas like Deep Creek are used as CMT training areas and not all the CMTs have been registered. As many as 24 provincially registered archaeological sites within or immediately adjacent to the boundaries of the CSAs exist. Some of them are of incredible cultural and scientific sig-nificance. For example the FiUa-I site at Skoglund`s Landing has a total of 1,197 artifacts and flakes, dating back to 4,165 +/- 130 years B.P. (Fladmark, 1970).
Out of the 397 hectares in this area, all of it is old growth (greater than 250 years old) and 207 hectares or 52% of the area is made up of Red cedar. These
stands are well drained with gentle to steep terrain and are very productive. There is no Yellow cedar in these low elevation stands.
2.4 AIN Out of the 6,170 hectares of CSAs around the Ain watersheds, only about 640 hectares or 10% of the area has been surveyed on the ground.
Known values include 207 CMTs and 21 registered archaeological sites.
Around 31% or 1,940 hectares of this area are made up Red cedar, while another 10% or 610 hectares are made up of Yellow cedar. This area has some of the highest elevations of CSAs (up to 550m), which is where most of the Yellow cedar is found. These higher elevation areas are behind Ain IR (Galgam Mountain) and the upper watershed of Crease Creek.
The area has some second growth, about 17 hect-ares around the Ain IR that are predominantly Sitka spruce and Western hemlock (logged between 1920 and 1951) as well as approximately 20 hectares of young second growth (less than 20 years old) around the Skundale and Ain lakes.
The CSA forests on either side of the Ain River all the way up to Ian Lake are well known for supporting sockeye salmon and Crease Creek is the only un-logged watershed within the Skidegate Plateau that support sockeye spawning grounds.
The area is also known for incredible monumental cedars, including the infamous Ain 21 block, which had some of the highest concentrations of monu-mental cedar that CHN forest guardians had inven-toried. Much of the area around this cutblock (east of Ain lake) has evidence of a major, catastrophic fire that pre-dates contact.
7 Archaeology Branch query received from Jessica Ruskin, December 2012.8 Examples of blocks with insufficient management to protect heritage values include: TOR37, TOR38, TAR41, TAR42, DIV431, NAD507.
Cedar Stewardship Area Management Plan 17

Other values that share legislated protection within the CSAs are two Northern Goshawk (skyaamskun9) nests. One is east of Ain Lake, and one is in the mid-dle of the Crease Creek watershed.
2.5 JUSKATLAApproximately 493 hectares, or 17% of the 2,935 hectares in the CSAs around Juskatla have been surveyed for cultural features. From that approx-imately 558 CMTs have been documented in the area. In addition, 42 provincially registered archae-ological sites are within these CSAs, the majority of which are on and around the Begbie peninsula which is well known for its canoe building sites. Many other registered archaeological sites are immediately adjacent to these CSAs including raised lithic sites,
intertidal lithic sites and shell middens (Eldridge & Young, 2001).
The forests in these CSAs contain approximately 1,098 hectares of Red cedar and 103 hectares of Yellow cedar for a total of 41% of the area com-prising of both Red and Yellow cedar trees. The majority of the area is old growth (greater than 250 years old) with only 84 hectares as mature forest (less than 250 years and greater than 80 years) likely as a result of early A-frame logging along the coast of Juskatla and Masset Inlets in the earlier 1900’s.
2.6 YAKOUNThis is the largest area of the CSAs. It has the easiest access of any of the CSAs, which may account for why up to 1,065 hectares or 13% of the 7,990 hectares has been surveyed.
While this area is entirely inland, there are cedar areas that have been intensively managed for hundreds, if not thousands of years, in the Yakoun watershed. Family knowledge of these managed sites and the area’s unique ability to grow monumental cedar, as well as the evidence of past use, is one of the reasons why this area has been designated a CSA.
Of the area surveyed by the CHN, 68 CMTs have been recorded, however most of the areas sur-veyed have been far away from the Yakoun River itself where many CMTs occur along its tribu-taries. A total of seven provincially registered archaeological sites exist within the Yakoun CSAs. Documenting these inland Yakoun sites should be a major priority for archaelogoical inventories. One small site, recorded as FkUb 7, illustrates the intensive and multi generational use within a stand, where there are five bark-strips, four canoes, 20 test holes, and 14 modi-fied logs (slabbed logs etc.) (Bernick, 1984). Ages
FIGURE 1. CMTs were logged in the Yakoun River area in the 1980s. Photo: Bernick, 1984.
9 From Skaay, 2001. Being in Being: The collected works of Skaay of the Qquuna Qiighawaay. Douglas & McIntyre.
Cedar Stewardship Area Management Plan 18

taken from this site in 1984 by the BC Archaeology Branch shows that the stand was used many times over many generations ranging from the 1930’s back to the 1790’s, and likely much earlier10.
The CSAs in the Yakoun River area are made up of approximately 31% or 2,500 hectares of Red cedar and 6% or 480 hectares of Yellow cedar.
The age range for the Yakoun areas is the most di-verse. While there are close to 2,580 hectares of Red and Yellow cedar old growth, there is also about 350 hectares of Red and Yellow cedar that are fire-origin second growth (since the 1850’s). In addition, there are approximately 50 hectares of young second growth (less than 20 years old) mainly around the Canyon Creek and Florence Creek areas.
MAP 10. Other legal protection within the CSA along the Yakoun River.
Goshawk Reserves
Saw whet owl Reserves
10 The oldest ring count from that study shows ages from 192 years before 1984 but from a hemlock nurse tree on top of a stump. Likely the nurse tree took many years under closed canopied forest to reach diametre at breast height.
Cedar Stewardship Area Management Plan 19

PHOTO 3. Looking east towards a CSA along the access road to the Upper Chinukundl Watershed
Aside from specific cedar values, the CSA for the Yakoun river contain two Northern Goshawk nesting reserves (Florence Creek and Black Bear Creek). Both of these reserves are approximately 200 hect-ares each (see MAP 9). In addition there are two Northern Saw-whet owl reserves that overlap the CSAs. Commercial harvest within these areas is not permitted.
2.7 EAST COAST GRAHAMApproximately 216 hectares or 23% of the 933 hectares that make up the CSAs along the east coast of Graham Island have been field surveyed. In this area there are over 950 CMTs, initially recorded through archaeological surveys associated with the Teal Jones development of the Mill blocks – most of which were deferred due to archaeological signifi-cance. There are 15 registered archaeological sites within these CSAs, most of which are in the Chinu-kundl drainage and a majority being barkstrips, many
are along what is considered the ancient Chinukundl (Chini Kundlai) trail (pers. com. Jim Stafford 2011) (Stafford, Maxwell, & Christensen, 2003).
The forest inventory identifies approximately 16 hectares of Yellow cedar, compared to 316 hectares of Red cedar in the area. Of these, approximately 56 hectares are of younger but mature Red cedar stands, likely remnants of a fire in the 1850s. Oth-er known and legally protected values that overlap these CSAs include two Blue heron nests in CSA polygon #19 (western most polygon in the Chinu-kundl drainage) along with another three that are immediately adjacent to the same polygon on the southern boundary. If monitored and deemed to be active, then these nesting areas do not allow for commercial timber harvesting within a minimum of 350 metres from the nests.
Another legally protected wildlife feature is a Northern goshawk nesting reserve in the Skowkona
Cedar Stewardship Area Management Plan 20
FIGURE 2. Overview of the age classes of Red and Yellow cedar within all the CSAs.
Cedar Stewardship Area Management Plan 21
Watershed that overlaps with half of the CSA polygon #22.
2.8 SKIDEGATE INLETA total of around 712 hectares or 38% of the area of CSAs around Skidegate Inlet have been field sur-veyed. These inventories have accounted for ap-proximately 463 CMTs along with approximately 11 provincially registered archaeological sites.
Approximately 450 hectares in this area are made up of Red cedar, and another 150 hectares of Yellow ce-dar. Most of the Red cedar is old growth forest, but around 85 hectares are younger, (>80 year) fire origin stands. The age breakdown is proportionately similar with Yellow cedar, with approximately 28 hectares made up of fire origin stands.
2.9 AROUND LOUISE ISLANDApproximately 174 hectares or 28% of the 617 hect-ares of CSAs around Louise Island have been field inventoried. Currently around 48 CMTs have been
catalogued in this area, along with five registered archaeological sites. Two hundred seventy-six hect-ares are made up of Red cedar and only 25 hectares are Yellow cedar, approximately 12 hectares of the 617 hectares are younger than 250 years old, but older than 80. None of these areas have ever been formally surveyed for monumental or other cultural features, other than CMTs.
2.9 OVERVIEW CURRENT INVENTORY IN CSAsThirty-four per cent of the overall areas (all ages) are made up of Red cedar (8,423 hectares) and only 6% of the area is made up of Yellow cedar (1,477 hect-ares). The CSAs are primarily made up of old growth forests (80%). The remaining second growth areas are outlined in FIGURE 2.
Elevational gradientsMost of the area that make up Cedar Stewardship Areas are relatively low elevation within the phys-iological area known as the Skidegate Plateau and Queen Charlotte Lowlands. Almost no area is protected under CSAs on the west coast. FIGURE 3

FIGURE 3. Hectares of CSA by elevation. Most CSAs are in low elevation areas
Cedar Stewardship Area Management Plan 22
illustrates the number of hectares in CSAs by eleva-tion bands, with a comparative bench mark of Mount Moresby (the highest elevation on Haida Gwaii). Few hectares are higher than 350 metres, which helps to explains the small representation of Yellow cedar in the CSAs.
Second Growth AreasFire Origin SitesAll the ages between 80 and less than 250 years old, which are around 1,600 hectares, represent the area of fire-origin second growth stands which are pri-marily within the Yaagun G and East Coast Graham.
In the mid 1850’s over 60,000 hectares of area burned north of Lawn hill (Pearson, 1963) up towards Port Clements. Much of this area now is made up of many high quality Red cedar leading sites. These areas are typically most abundant with trees of the right size for barkstripping and represent important recruitment areas for old growth in the next 150-200 years.
PHOTO 4. A veteran cedar tree in a fire-origin stand near Lawnhill.
PHOTO 5. Fire origin cedar stand and second growth plantation. Photo: S. Muise

TABLE 1. Harvest origin of second growth cedar areas.
11 No hectares were spaced or pruned12 Note that only 1,722 hectares are accounted for in the RESULTS inventory database as second growth between 0-20 years old.13 Note that the RESULTS inventory has digital records only going back to 1987.
Age of Total Hectares Hectares Hectares Hectares Hectares Hectares Hectaresstand hectares planted Cw planted brushed 11 burned fertilized previously not satis. with seedling Yc (site prep) Cw leading restocked protection but now Hw/Ss
0-20 2,08412 1,192 2 44 93 84 262 70years
2113-40 1,004 Less than 10 2 0 0 unknown 0
Cedar Stewardship Area Management Plan 23

Cedar Stewardship Area Management Plan 24
3.0 MANAGEMENT MANAGEMENT GOALS 1 – PROTECT: Maintain CSAs as protected areas for Haida cultural use 2 – INVENTORY: Continue to inventory cultural and archaeological cedar in these areas to ensure they represent the best sites for long term cedar use 3 – ACCESS: Mitigate long-term impacts for access to cedar 4 – RESPECTFUL USE: Ensure commercial access is conducted in a measured and respectful way 5 – RESTORE: Restore CSAs so they are representing the natural capacity of the land
3.1 ADAPTIVE MANAGEMENTAdaptive management is the key to preserving the health and function of the CSA for present and future use. Put simply, adaptive management is learning by doing and then adapting your actions to better fit your objectives. Adaptive management relates to ev-ery management goal for the CSAs. This translates into actively updating our inventory inside CSAs so we can better manage for the Haida values. It also means monitoring the management decisions we make inside CSA and improve on them for future management.
3.1.1 Amendments to CSAs Regarding Management Goal 2, over time inven-tories outside of the CSAs will identify stands that should qualify as being CSAs and stands inside of the CSAs that should not be reserved for cultural purpose because they do not fit the criteria.
Legal amendments to the CSA are authorized by the Haida Gwaii Management Council (HGMC). As a result of surveys conducted by the CHN areas will be proposed to the HGMC to be added or removed from the CSAs. All proposed areas need to be en-dorsed by the Heritage and Natural Resource Com-mittee prior to being submitted for consideration to the HGMC. Upon HGMCs approval, the amend-ments will follow the established process for the amendment of the Haida Gwaii Land Use Objectives.
When amendments are made, there should be a no net loss of area to the CSAs (i.e. the area deleted/
excised should approximate the area added) by Landscape Unit.
Criteria for excising areas from a CSA:1. Area is identified by public, industry, FLNRO,
CHN;2. Area does not meet CSA value standards in sec-
tion 2 of this management plan to the extent that the cultural values can be sufficiently managed under the Land Use Objectives Order/EBM.
3. Area to be advertised in Haida Laas, web and local newspaper for public input;
4. Area to be reviewed and endorsed by the CHNs Heritage and Natural Resource Committee and CHN Executive Committee;
5. The Haida Gwaii Management Council must approve areas for deletion to Schedule 3 Cedar Stewardship Areas within the Haida Gwaii Land Use Objectives Order (HGLUOO). Depending on the size of the proposed removal, this may require either a minor or major amendment to the HGLUOO.
Criteria for adding areas to a CSA1. Candidate areas with high cedar values are iden-
tified by CHN, public, industry, FLNRO 2. Candidate areas must meet CSA value stan-
dards in section 2 of this management plan. 3. Area to be advertised in Haida Laas, web and
local newspaper for public input;4. Area to be reviewed and endorsed by the CHNs
Heritage and Natural Resource Committee;

Cedar Stewardship Area Management Plan 25
5. The Haida Gwaii Management Council must ap-prove areas for additions to the Schedule 3 Cedar Stewardship Areas within the Haida Gwaii Land Use Objectives Order. Depending on the size of the proposed removal, this may require either a minor or major amendment to the HGLUOO.
3.1.2 Priorities for future inventoriesApproximately 15% of the CSAs have been field surveyed for cultural features. Many of the areas that have not been formally field surveyed are well known to contain CMTs and monumental cedar, based on traditional knowledge. However for many other areas, mostly associated with inland sites away from water bodies, the quality of the inventory is not known. For these areas, ground truthing is the most reliable way to document values for long term management. See Appendix 2 for maps of areas currently known to have been inventoried for cultural values within the CSAs. The following sections out-line CHNs priorities for conducting an inventory.
Old Forest/Natural Stands1. Areas that are considered to have few cultural
cedar values either currently or in the long term should not remain within the CSA unless there are other values (such as landscape connectivity, cultural or spiritual values) that the CHN wishes to maintain. Forest cover inventory can identi-fy the following attributes to prioitize areas for surveying:• Sitka spruce or Western hemlock as leading
or secondary species in the forest cover inventory;
• Sites with a height class of 2 or less;2. There are many other areas in old forest that like-
ly do contain values but have not been invento-ried.
These areas can be inventoried for monumental ce-dar, Culturally Modified Trees, Red and Yellow cedar barkstrip areas, cedar recruitment zones as well as medicinal plants and/or plants and trees that are important to the Haida
PHOTO. A natural stand in an old forest.
3. Through the implementation of the Haida Gwaii Land Use Objectives Order, licensees annually report spatial information about cultural cedar stands that have been protected within their development areas. The CHN can use this information to help prioritize areas outside of the CSAs that contain very high densities of CMTs or monumental cedar that are candidates for long term protection within CSAs.
Young forestSome of the most important areas for long term cultural cedar are in second growth reserves. Many of these sites are in early ecological succession, with young trees in closed canopied stands, however there is still a need to field survey these sites to de-termine the volume and age of cedar. Field invento-ries for young stands should focus on identifying:
• barkstrip areas• cedar recruitment zones (areas with high
cedar content).

Cedar Stewardship Area Management Plan 26
MethodsSurveying within CSAs must follow a consistent methodology that can be reliable, repeatable and easy to report. The intent of the survey is to sample a representative area of the CSA polygon using a va-riety of line transects, variable plots and fixed plots. This can be achieved by stratifying the CSA area into stand type, age or site series as necessary. The surveys should complete at minimum 20% of the stratification areas (20% of the polygons identified at a 1:5,000 scale).
The transects are meant to quantify the density of features per hectare as a representative sample of a CSA polygon. The variable plots (using prisms) are meant to quantify the amount of cedar (basal area and stems per hectare) and the relative health of the stand.
The fixed plots are meant to qualify the regeneration
PHOTO. A young forest.
of cedar (seedlings, saplings) in the stands. (See Appendix 1 for a more detailed description of attributes and sampling methods.)
LiDAR (Light and Range Detection) data may be use-ful to help prioritize field inventory survey effort.
Annual survey effort will be stratified by geograph-ic area (ex. Juskatla, East Coast Graham etc.) and divided into one square kilometre grid systems to ensure systematic coverage. Forest inventory mapping will identify priority areas based upon the criteria listed in this section
3.2 USEThis section covers a description of allowable com-mercial uses, as well as outlines processes for Haida Traditional Use with respect to Management Goal 4.

Cedar Stewardship Area Management Plan 27
All CSAs that have proposed development – for Haida cultural or commercial use require a Cultural Feature Identification survey (CFI) in the proposed area. This survey must be completed by certified CFI surveyors that are employees of the CHN, or directly hired by the CHN, in order to account for addition-al values (such as bark-stripping areas, or areas of spiritual significance) that are not otherwise captured under regular CFI protocols. All surveys conducted in CSAs for the purpose of development that require any trees to be cut, must be Level 2 (high survey intensity) as per the Cultural Feature Identification standards manual.
3.2.1 Commercial Salvage OpportunitiesAll commercial salvage opportunities referred to in this section are for dead or down wood (wood that is not self-supporting). All commercial salvage appli-cations must be go through the Solutions Table by submitting applications to Front Counter Haida Gwaii at the Haida Gwaii Natural Resource District office. All applications must have a Level 2 CFI survey com-pleted for the immediate area surrounding the sal-vage area (within one tree length of salvage areas).
a. Ground based (machine) salvage oppor- tunities are only permitted within 50 metres of a CSA edge unless the application is through a Forest Stewardship Plan holder. If the application is through a Forest Stew- ardship Plan holder (licensee) then the appli- cation must go through the Solutions Table and be consistent with the Haida Gwaii Land Use Objectives Order.b. Helicopter salvage is permitted anywhere within CSA as long as:
• the integrity of cultural values outlined in Section 2 of this management plan are protected;
• other values and reserves identified through the Land Use Objectives Or-
ders are followed (ex. nesting or forest reserves that overlap with CSAs);
• the volume of wood salvaged is consid-ered small (less than 2,000m3) for any given application and are not succes-sively submitted by the same proponent.
d. No commercial salvage will be permitted in areas containing archaeological values.e. Commercial salvage will not be permitted if it has direct affects on bear dens or bear den recruiting habitat.
3.2.2. Commercial Harvest OpportunitiesCommercial harvest opportunities in CSAs are restricted by the Haida Gwaii Strategic Land Use Agreement and its subsequent legal counterpart the Haida Gwaii Land Use Objectives Order (LUOO). Section 3 of the LUOO states that up to 10% of the CSAs can be commercially harvested. It is also intended that commercial activity occur in areas of the CSA that do not have significant cultural cedar values14. Also, this opportunity is meant to be distrib-uted proportionally to the occurrence of CSAs within a given landscape unit.
In order to propose a commercial harvest within a CSA the following legal conditions under the Haida Gwaii LUOO must be adhered to:
a. An intergovernmental process must be com- pleted (via the Solutions Table);b. Cultural values within the specific CSA proposed for harvesting are identified in accordance with the Cultural Feature Identi- fication Standardsc. The distribution of harvest is proportional to the occurrence of CSAs within a given land scape unit.
Additional considerations for commercial harvest opportunities:
a. The proposal is presented by the Solutions
14 CHN/BC, 2010. Background and Intent for the Haida Gwaii Land Use Objectives Order. Joint Technical Team for the implementation of the Strategic Land Use Agreement.

Cedar Stewardship Area Management Plan 28
Table and is vetted through the Heritage and Natural Resource Committee.b. Short and Long term goals of CSA must be considered in approval of the application. This includes consideration for short and long term road access for Haida cultural use. c. Commercial opportunities should favour sites that provide access to resources that otherwise are isolated by a CSA. d. That the commercial harvesting does not damage or create undue risk to the areas outside of commercial harvesting within the adjacent CSA.e. Windthrow risk and hazard assessments are conducted on block edges adjacent to CSAs. Appropriate treatments are imple- mented and outcomes monitored 2-3 years after harvest.f. Tracking and updating a spatial data base must be completed if any development occurs.
Appropriate reforestation is carried out based upon the ecology of the site.
3.2.3 Haida Cultural HarvestingThe Cedar Stewardship Areas have been set aside for long term cultural use by the Haida. This man-agement plan defines and manages access in consideration of the collective or individual rights of the Haida citizen. This section is meant to clarify the relationship between the CHNs long term manage-ment goals of the CSA with current and future Haida needs and uses within the context of Haida law.For the purpose of cultural harvesting, this section is divided into log access and other use.
Log AccessRecent studies by the CHN and the Province of BC have found that Red and Yellow cedar in the forestry
operating land base (outside of all protected areas) may run out within the next 40 years (2050) and is projected to not contribute to the commercial har-vest again until approximately 2110. This is because there is very little cedar younger than 120 years15 on Haida Gwaii. It is also well known that within the next 60 to 100 years the operational land base for forestry will have switched to harvesting only second growth timber.
It is for these reasons that the CHN sets out the fol-lowing policy for access to logs for cultural use:
a. All applications for wood in a CSA for cultural use reviewed by the Cultural Wood Advisory Board( CWAB ) should be reviewed against the short and long term management objectives set out in this planb. Log resources are available through the CWAB and accessed from the operating land base before being made available from the CSAsc. Selective logging is preferable (maintaining forest integrity)d. Costs associated with logging are borne by the individuale. Log resources must be applied for by a citizen of the Haida Nation as defined in the CHN constitution.f. Cultural resource use inside a CSA must be used solely for cultural or traditional practices. g. Approved harvesting by the CHN must be undertaken within one year of approval, with an allowance of a six month extension being considered by the CHN under extenuating circumstances.
The following are points for consideration by the Cultural Wood Access program when adjudicating log access within the CSAs:
• Does the individual applying have un-avoidable time constraints that require
15 CHN/BC. 2012. Haida Gwaii Timber Supply Review Analysis Report. Joint Technical Working Group report for the Haida Gwaii Man-agement Council.

Cedar Stewardship Area Management Plan 29
the use of CSA resources? Can the ap-plicant undertake the harvesting within one year?
• Does the monumental cedar have specific criteria that make it useful for a particular type of project – size, shape, twist, species etc.?
• Is the wood quality matched to the pro-posed policy?
• Does the monumental cedar have spiri-tual value to the artist/project/area?
• Are there many monumental cedars in the area? Is the monumental cedar in an area where cultural cedar is scarce?
• Will the logging affect juvenile cedar? Will the applicant replant or have a strategy to protect natural young cedar in the area to account for what they have taken?
• Is the logging in the vicinity of archeo-logical sites?
• Will the logging affect the integrity of the forest?
Other UsesOther uses may include but are not limited to bark-stripping, root gathering, food or medicinal plant gathering. As the CHN does not regulate these uses, all Haida citizens should consider the following when using these areas.
Barkstripping• Does the barkstripping interfere with
long term monumental cedar recruit-ment?
• Is the barkstripping in an area that has an abundance of resources so that barkstripping will have no effect on the cultural importance of the site. Is the barkstripping in an area where cultural resources are scarce? Are there juvenile cedar in the area?
3.3 RESTORATIONWith respect to Management Goal 5, the restoration of areas inside the CSAs are a key component to ensuring an ongoing supply of cultural cedar. Past logging practices, a changing global climate that may lead to tree species shifts or changes in natu-ral disturbance intensity and frequency, as well as numerous introduced species on Haida Gwaii all play active roles in the degradation of cultural values within CSAs.
The regrowth of juvenile cedar in an old growth setting is extremely important for continued cultural use. Cedar regeneration in commercially harvested areas or by seedlings whose genetic material was not originally from Haida Gwaii have no guarantee of being able to produce culturally appropriate cedar for the Haida. This is why the protection of natural regrowth of cedar in old-growth or mature stands of trees is essential.
Threats to cedar: Yellow cedar declineYellow cedar decline is a documented phenome-non (Hennon, Schaberg, Wittwer, & Shanley, 2012) extensively mapped in south eastern Alaska with up to 50,000 hectares documented on the BC coast (Westfall & Ebata, 2009) (Stan, Maertens, Daniels, & Zeglen, 2010). Research suggests that Yellow cedar has a greater proportion of shallow fine roots than many of its competitors, especially in areas of wet soil or general poor drainage. In higher elevation stands where snow pack is common in winter and freezing temperatures are common occurrences in spring, a declining snow pack due to changing climate is leading to vulnerability towards fine-root mortality in Yellow cedars. In other words, without the insulation of snowpack, and within an elevation band where freezing persists into the spring, fine and shallow roots of Yellow cedar are damaged leading to die back within certain areas. This phenomenon occurs at considerably lower elevations in northern latitudes (See PHOTO 6).

Cedar Stewardship Area Management Plan 30
On Haida Gwaii, mid to upper elevation stands are more vulnerable to soil thaw and subsequent freezing injury. While Yellow cedar decline has been documented as being one of the leading abiotic loss factors on Haida Gwaii (CHN & BC, 2012) its full ex-tent has not been determined. The reason for decline has not been positively correlated with the abiotic damage hypothesis discussed above, as there are many low elevation areas of Yellow cedar decline, outside the range of typical snowpack that lead to suspicions of biotic causes such as fungal patho-gens or insect.
If Yellow cedar is maladapted to certain areas, it may be futile to try to conserve those areas as Yellow ce-dar sites if there is slow and continuous mortality. A number of conservation strategies are outlined under Section 3.6 Management Goal Summaries. These strategies include targeted dispersal (planting in new sites); incorporation of suitable Yellow cedar sites outside of CSAs to incorporate into CSAs; identify-ing areas of Yellow cedar decline within the CSA to exclude from the CSAs, and; planting and thinning to expand habitat niches.
WindthrowSome areas in the CSAs have incurred significant blowdown, both along edges (endemic windthrow), as well as within the interior of polygons (from cat-astrophic windthrow). (See PHOTO 8). The area of disturbance should be qualified through the usage of satellite imagery (ex. SPOT 2.5m resolution panchro-matic bands) to determine the extent of unsalvaged loss.
Threats to cedar: Introduced speciesSitka black-tailed deer browsing on cedar regener-ation has been well documented on Haida Gwaii. Cedar regeneration has been seriously depleted or eliminated in many old forests. In some place cedar regenerates very slowly in the understory (gap-phase regeneration strategy); generally re-produces less than its competition (both sexually and asexually), and is very palatable to deer. These three factors have left Red and Yellow cedar very
PHOTO 6. Yellow cedar in West Chichagof-Yakobi island in Alaska, 300 kilometres north of Haida Gwaii. Photo: USDA Forest Service photo.
PHOTO 7. Yellow cedar decline within a CSA in Florence Creek. Photo: A.Lachapelle.
PHOTO 8. A three hectare high quality cedar site within a CSA, damaged from windthrow.
Cedar Stewardship boundary
Cutblock boundary
Windthrow boundary
•
•
•

Cedar Stewardship Area Management Plan 31
vulnerable to browsing pressure both in old growth (Stroh, Baltzinger, & Martin, 2008) and in managed stands (Grossnickle S., 2005). Population densities range from 13 deer per km2 (Engelstoft, 2001) up to 33 deer per km2 on smaller islands (Daufresne & J, 1997), underlining a major threat to long term natural cedar regeneration. A number of restoration pros-pects are outlined in the following sections.
3.3.1 RECRUITMENT• Old growth planting: We know, and have known
for generations, that the best monumental cedar grows in the darkest parts of the forest. Naturally growing suppressed trees, contribute to a tight ring width and is a well-known management technique that the Haida have used for ages. This recruitment project would help ensure that natural generation of cedar is happening in old forests through protecting seedlings/saplings from deer browse.
While Red cedar take advantage of canopy gaps for seedling establishment, they also recruit in-dependent of canopy gaps in old forest (Daniels, 2003). Red cedar also uses a different strategy than its competitors as it has different modes of recruitment and regeneration niches (intermit-tent seedlings, vegetative layering, germination substrates, apical dominance, growth indepen-dent of ‘releases’ in the sub-canopy). These different ‘modes’ and ‘niches’ for growth mean that relatively few saplings or seedlings can be in the sub-canopy for a long time (Daniels, 2003)16. In old growth forests where the understory is open, due to deer browsing, these seedlings and saplings are more vulnerable to browsing.
An old growth planting project can identify stands in which the understory is most vulnera-ble to deer browse (likely zonal or slightly richer sites). A project can take advantage of optimum
16 One study of 50 saplings in old growth showed that the first release (big growth spurt) for western redcedar didn’t happen for an average of 111 years.
mineral substrate while using tree protectors (ex. vexars) to protect natural stems (or planted stems of appropriate local genetic stock). Also, while Red cedar doesn’t require canopy gaps, solar radiation has a direct influence on growth. Red cedar seedlings reach 90% of their max-imum rate of photosynthesis, maximum radial and height growth rates at about 30% of full sunlight (Drever & Lertzman, 2001) (Grossnick-le S., 2005). A recruitment project could take advantage of natural canopy gaps to encourage initial growth so that seedlings escape browsing pressure (1.2 m height).
• Second growth planting: As discussed in Section 2 of this management plan, there are hundreds of hectares of second growth spruce and hemlock within the CSAs that used to be cedar-leading old growth stands. Many of these stands are easily accessible and some of them may be close to harvestable age. Opportunities may exist to harvest the Western hemlock/Sitka spruce sites and replant them with Red cedar under the auspice of restoration. Harvesting may be designed in a manner in which regeneration suits long term cultural use (slow growing), which may include selection harvesting (high retention). Stocking should be from Haida Gwaii stock and to approved stocking standards (see Haida Gwaii Natural Resource District, 2003 minimum cedar stocking standards based on preharvest composition).
• Exclosures: Many organizations over the last decade, including the Council of the Haida Na-tion, the Research Group on Introduced Species, BC Ministry of the Environment and the Laskeek Bay Conservation Society and Parks Canada have collaborated and designed a number of deer exclosure sites throughout the Islands. While deer exclosure sites may be impractical for large cedar reserves, they may prove to be

Cedar Stewardship Area Management Plan 32
PHOTO 9. Lana Wilhelm, Gerry Morigeau and Jaalen Edenshaw at the Yakoun Lake Exclosure. Photo: Farah Nosh
necessary for the protection of rare and import-ant Haida plants.
Most notably there are ten research sites (25m2) throughout Graham Island (Stroh, Baltzinger, & Mar-tin, 2008) and three sites established by the CHN. Some small research plots exist near the ‘second’ canoe near Juskatla (south of the Port Main/QC Main junction), near the Golden Spruce Trail, there are several small exclosures along Yakoun Lake, as well as some larger (two hectare) ones around Yakoun Lake, however the largest of these along the trail, is almost entirely dismantled.
The purpose of some of the sites has been to study long term effects of herbivory-browse on plant growth and cedar growth. Another significant objec-tive was for the establishment of the larger exclo-sures in 2002-03 was to protect the rich understory vegetation which included rare Haida medicinal plants. The project meant to provide a place with easy access and rich ecology, to preserve genetic material, and provide access for continued use. The exclosures have been compromised on many oc-
casions and have since been maintained to varying degrees by the CHN and BC Parks.
Further work can be done to:a. Determine the status of the current exclo- sures;b. Summarize report/literature findings on the efficacy of the exclosures;c. Review/identify alternative fencing tech- niques and determine feasibility;d. Compile and review sensitive plant inventory data within the CSAs and develop an exclo- sure strategy to protect them, if necessary;e. Secure funding to maintain current exclo- sures and erect new exclosures in strategic places.
• Deer Culls: While Sitka black-tailed deer have proven to have impacted the ecology of Haida Gwaii, they have also become an important part of the Islands culture as a food source. While large scale culling of deer may be unwanted and/or impractical, it has been used as a eco-logical restoration measure in many places on

Cedar Stewardship Area Management Plan 33
Haida Gwaii, typically on Islands within Gwaii Haanas or Laskeek Bay (Gaston, Stockton, & Smith, 2006). As smaller islands tend to support greater species diversity (Ibid.), islands in Masset Inlet could be considered as candidates for deer culls and inclusion into CSAs based on the result of further study.
3.3.2 SilvicultureConsidering the extent of second growth forests within the CSAs, there are many aspects of silvicul-ture that may contribute to the long term objective of maintaining a long term supply of cultural cedar for the Haida Nation. The following provides some brief examples of applicable silviculture strategies.• Working with Taan Forest Products Ltd. and
other licensees to identify and prioritize areas where vexar or browse protection or removal is necessary within the CSAs.
• Identifying areas to conduct silviculture surveys that are considered ‘not sufficiently re-stocked’ within the CSAs. Work with licensees to en-sure they can use the information to prioritize fill-planting and updating inventories.
• Strip cutting is a system in which trees are re-moved in a series of cuts where the newly plant-ed areas are designed to be under the shelter of the remaining trees. This system may work as a restoration technique in areas of second growth where Red cedar is ecologically appropriate but where the areas are currently dominated by Western hemlock or Sitka spruce.
• Prescribed burning studies show that cedar responds positively to prescribed burning, par-ticularly for 20 year height growths on burned sites (Beese & Chrimes, 2010). This helps reduce competition from ericaceous shrubs (like salal) and gives cedar a head start for healthy estab-lishment. Prescribed burning has occurred in over 90 hectares already within the CSAs. These areas can be revisited with paired plots with con-trol sites to determine cedar response. Outcomes of a review may lead to more prescribed burns in low productivity second growth cedar sites.
3.4 ResearchA number of research initiatives are possible with-in the CSAs. This section of the management plan outlines examples of some long term research ideas that could benefit the management of the CSAs:
• Plant response to herbivore-herbivore inter-actions: Dietary competition is potentially an important interaction between ungulates. When resources are limited and species are forced to compete for the same resource, it may lead to the exclusion of one of them. There has been evidence of Roe deer in Europe, who are territo-rial and solitary (like the Sitka black-tailed deer on Haida Gwaii), being intimidated/displaced by species such as Red deer which gather in herds when natural predators have been elim-inated (Lantham, 1999). A similar relationship may exist on Haida Gwaii in areas where the introduced Rocky Mountain elk (Cervus elaphus nelson), which were introduced in 1929 (Golum-bia, Bland, Moore, & Bartier, 2002) compete with the Sitka black-tailed deer. Anecdotal evidence suggests significant increase in understory veg-etation around the elk habitat found in drainages such as Canyon Creek, Feather Lake, Three Mile Creek and Survey Creek. There have been similar studies that point to sapling recruitment or survival based upon certain thresholds of her-bivore densities (Hester, Edenius, Buttenschon, & Kuiters, 2000). Similarly, interactions between different herbivores (ex. elk as grazers, deer as browsers) can have significant impacts on forest dynamics (Mitchell & Kirby, 1990).
• Understanding growth patterns for sup-
pressed Red cedar: It is well known that the best monumental cedar grow in the darkest forest. It is known that cedars can remain in a suppressed state under the canopy as saplings for many years or even decades, leading to vul-nerability from browsing. However it is unknown how long saplings take to reach breast height under closed canopied natural forest conditions in order to escape deer.

Cedar Stewardship Area Management Plan 34
• Use and development of browse resistant cedar: The palatability of cedar to deer and the associated likelihood of browse are influenced by the phytochemical content of individual seedlings. Results from studies suggest that both plant tissue development (ontogeny) and monoterpene concentrations can greatly reduce browse (Vourc’h, de Garine-Wichatitsky, Labbe, Rosolowski, Martin, & Fritz, 2002). Selective breeding programs through the Cowichan Lake Research Station (Ministry of Forests, Lands and Natural Resource Operations) may be able to provide locally suitable cedar trees for such a trial (Russell & Kimball, 2010). Areas that are ‘not satisfactorily restocked’ within the CSAs may be also suitable for such a trial.
• Deficiencies in the establishment of young cedar in natural/old growth forests: Research suggests that deer populations in old growth forest, combined with cedar’s palatability, slow growth rate under closed canopy conditions and lack of physical defences may lead to potential
elimination of cedar in old growth forest over time (Stroh, Baltzinger, & J-L, 2008). However the extent of this issue has not been qualified across the range of growing conditions for cedar on Haida Gwaii. A research study within the CSAs can easily determine the presence, age range, crown class and diameter range of cedar in natural stands by site series. This research would help to quantify the scale of the issue of establishment for young cedar across different growing sites/site series on Haida Gwaii.
3.3.5 Mangement Goal Summaries
33
3.6 Management Goal Summaries
Management Goal Issue Strategy Performance measure
Commercial access
Many edges of CSA’s have blown down and the value of the timber (for culture or economy) will be lost unless salvaged
Follow the policy outlined in 3.2.1 Commercial Salvage Opportunity. Conduct windthrow assessment first to determine whether salvage of the blown edge will exacerbate windthrow.
Windthrown wood is salvaged for cultural or economic use.
Where appropriate, use tree crown modification within the edge of the CSA to help prevent blowdown, or Buffer the edges of the CSA from a harvest area to account for consequences to adjacent values.
Blowdown along the harvested edge of a CSA is minimized.
Licensees would like to harvest 10% of the area of CSA’s
Through the Solutions Table, determine a CFI survey has identified cultural values within the area for protection. Ensure that the distribution of harvest is proportional to the occurrence of cedar stewardship areas within a given landscape unit. Ensure that the amount of area by Landscape Unit that is harvested commercially is tracked in a database on an annual basis. Ensure that strategies outlined in section 3.2.2 are considered or applied.
Minor amounts of commercial harvesting occurs in a way that is consistent with this Management Plan and the Haida Gwaii Land Use Objective Order.
Respectful Use:Commercial Access

Cedar Stewardship Area Management Plan 35
34
Management Goal Issue Strategy Performance measure
Commercial access
Monumental cedar has blown down, and commercial salvagers would like to harvest them.
Any area for commercial salvaging within the CSAs requires what is noted under section 3.2.1, which includes a CFI survey. The CFI standards says that dead and down cedar that have monumental attributes are qualified as ‘Monumental Quality Wood’. Monumental Quality Wood should be made available to the Council of the Haida Nation through the Cultural Wood Access Program.
Monumental Quality Wood is made available to the Council of the Haida Nation. If the CHN does not require the wood, then it can be available for commercial purposes.
Salvagers would like to harvest down wood immediately adjacent (less than a half a tree length) to a monumental cedar or cultural plant (considered to be in its reserve zone).
Ensure that harvesting operations do not affect the tree or the roots of the tree. Ensure that the wood that is salvaged is not bear den recruitable habitat (>80cm diameter log with evidence of black bear winter hibernation) and follows the salvage policy outlined in section 3.2.1 Commercial Salvage Opportunity.
Damage to monumental cedars or cultural plants is avoided when commercially salvaging trees in a CSA.
CSA’s represent the best sites for long term cedar
Some CSA areas do not contain any cultural cedar
The CHNs Heritage and Natural Resource department will conduct field surveys annually. A no net loss principle applies here (as outlined under section 3.1.1).
Between 0.1-1% of CSAs surveyed and reported annually to the Heritage and Natural Resource Committee.
Some areas outside of CSA’s have better cedar sites
Conduct an annual review of digital spatial data that are submitted by licensees as part of their HG Land Use Order requirements. Areas that have considerable Cultural Cedar stands become prioritized for field inventory. If the areas are deemed to have significant long term cultural cedar value, then they are proposed to the HGMC by the Heritage and Natural Resource Committee for consideration for inclusion as CSA protection in the Land Use Order.
Areas with high potential cedar value outside of the CSAs are surveyed. Areas that have been verified are included into protection in the Land Use Order.
35
Management Goal Issue Strategy Performance measure
CSA’s represent the best sites for long term cedar
Many older second growth sites for cedar are being logged and do not form part of the CSA’s
Conduct inventory surveys in the areas known with fire-origin second growth. Identify hectares of high quality cedar that can support long term monumental trees. Propose sites for long term retention, and/or work with licensees to keep these areas retained as part of their retention strategy. If areas are set aside for long term conservation, then propose a similar area to be removed from the CSA which do not contain cedar values.
Areas are annually surveyed for long term monumental recruitment. Work with the Haida Gwaii Management Council and/or licensees to protect areas for long term cultural use.
Maintain access
Gaining access into CSA’s is costly Ensure that when roads are built for commercial harvesting up to or within the CSA’s, that they can benefit access for long term cultural use in the area. Propose roads to bi-sect CSA polygons and propose that roads within the CSA’s are not decommissioned unless required to restore aquatic or hydrological integrity.
Road infrastructure is not completely decommissioned up to and within CSA’s unless for soil conservation, fish habitat or maintaining hydrologic integrity.
Many existing roads that gain access into CSA’s are de-commissioned
Work with licensees to identify what Permanent Access Structures exist up to or within the CSA’s and request that roads within the CSA’s are no longer decommissioned unless required to restore soil, fish habitat or hydrological integrity.
Respectful Use:Commercial Access
Inventory:CSA’s represent the bestsites for long term cedar

Cedar Stewardship Area Management Plan 36
36
Management Goal Issue Strategy Performance measure
Restoration
Many second growth areas of CSA’s were never planted with cedar
Identify areas that are not ecologically appropriate to grow cedar, and if there is not a major second growth component of cedar propose that these second growth stands be withdrawn from the CSAs. Otherwise, conduct restoration where commercial thinning or shelterwood harvesting is done and the area is regenerated with an appropriate stocking standard of cedar.
Second growth areas that do not have red cedar are either removed from the CSA, or re-stocked with cedar for long term cultural use.
Many second growth areas are not free-growing and need re-planting
Conduct Free Growing silviculture surveys to determine the scale and extent of ‘Not Satisfactorily Restocked’ areas. Conduct surveys in a manner that the data can be used to update the forest inventory and/or compliments a licensees tracking system. Work with the licensee with the silviculture liability to ensure that the areas are re-stocked with cedar from Haida Gwaii.
Second growth areas with deficient stocking is re-planted with cedar at an appropriate stocking standard.
37
Management Goal Issue Strategy Performance measure
Restoration
Many second growth areas need vexar-maintenance
Conduct reconnaissance and silviculture surveys to determine the scale and extent that vexar maintenance is needed. Conduct surveys in a manner that the data can be used to update the forest inventory and/or compliments a licensees tracking system .Work with the licensee with the silviculture liability to ensure that the vexar maintenance is completed and the employment benefits Haida people.
Silvicultural surveys are conducted annually in cooperation between CHN and licensees.
Many areas of old growth do not have a range of cedar ages because of deer browse
Follow recruitment strategies identified in section 3.3.1 of this management plan along with research studies identified in section 3.5 of this management plan.
Recruitment strategies and research is conducted to help mitigate the homogeneity of some old forest cedar stands.

Cedar Stewardship Area Management Plan 37
38
Management Goal Issue Strategy Performance measure
Restoration
Yellow cedar is declining in specific areas
• Conduct targeted dispersal (assisted migration)- deliberate movement of species into areas which the projected climate is believed to be associated with persistence.
• Identification of suitable yc sites outside of CSA to incorporate into the CSA’s
• Id areas of yc decline within the csa to remove.
• Review potential for planting and thinning to expand their habitat niche.
• Conduct research into potential abiotic or biotic causation of declines
Stands with declining yellow cedar are identified in the CSA’s. Strategies are applied to mitigate the decline in Yc representation in the CSA’s.
Some older second growth sites are dominated by spruce and hemlock
Prescribe shelterwood or strip cut harvest system that allows for a certain amount of shade in the opening where cedar can naturally regenerate or can be planted if ecologically appropriate
Areas of merchantable second growth spruce/hemlock identified.
Some areas of the CSA have incurred significant blowdown
Follow the strategy outlined in section 3.2.1 of this management plan.
Blowdown is salvaged in accordance with the management plan policies.
39
Management Goal Issue Strategy Performance measure
Restoration
Many rare and important Haida plants are found in the CSAs and are at risk from browse
a) Determine the status of the current exclosures (are they intact?);
b) Summarize report/literature findings on the efficacy of the exclosures;
c) Review/identify alternative fencing techniques and determine feasibility;
d) Compile and review sensitive plant inventory data within the CSA’s and develop an exclosure strategy to protect them if necessary.
Strategies are implemented, rare plants are identified and protected.

Cedar Stewardship Area Management Plan 39
Beese, B., & Chrimes, D. (2010). Comparison of Western Red cedar and Yellow cedar growth under different silvicultural treatments. A Tale of Two Cedars PNW-GTR-828 (p. 96). Portland, Oregon: US Agricultural Service.
Bernick, K. (1984). Haida Trees: Remains of Canoe manufacture in the forests of southern Masset Inlet. Victoria, B.C.: Heritage Conservation Branch, Ministry of Provincial Secretary and Government Services.
CHN, & B.C., (2012). Haida Gwaii Timber Supply Review Data Package. Old Massett, B.C.: Haida Gwaii Management Council.
CHN, & BC. (2012). Haida Gwaii Timber Supply Review: Timber Supply Analysis Report. Old Massett, B.C.: Haida Gwaii Management Council.
Daniels, L. (2003). Western redcedar population dynamics in old-growth forests: Contrasting ecologi-cal paradigms using tree rings. The Forestry Chronicle, 517-530.
Daufresne, T., & J, M. (1997). Changes in vegetation structure and diversity as a result of browsing by a large herbivore: the impact of introduced black-tailed deer in the primary forest of Haida Gwaii, British Columbia. In: Gaston, A.J (Ed.) Laskeek Bay Research, Vol. 7. Queen Charlotte City, B.C.: Laskeek Bay Conservation Society.
Drever, C., & Lertzman, K. (2001). Light growth response of coastal Douglas fir and Western redcedar saplings under different regimes of soil moisture and nutrients. Canadian Journal of Forest Research, 2124-2133.
Eldridge, M., & Young, S. (2001). Final Report for the archaeological inventory study of Begbie Peninsula, Kumdis Island, Walthus Island, and Ain River Haida Gwaii. Victoria, B.C.: Heritage Conservation Branch, Province of B.C. .
Engelstoft, C. (2001). Effects of Sitka Black-tailed Deer on Understorey in Old-growth forest on Haida Gwaii (Queen Charlotte Islands). Victoria, British Columbia: University of Victoria.
Fladmark, K. (1970). Preliminary Report on the Archaeology of the Queen Charlotte Islands: 1969 Field Season. B.C. Studies , vol. 6 and 7 18-45.
Gaston, J., Stockton, S., & Smith, J. (2006). Species-area relationships and the impact of deer-browse in the complex phytogeography of the Haida Gwaii Archipelago (Queen Charlotte Islands), British Columbia. Ecoscience , 511-522.
Golumbia, T. (2007). Terrestrial Plant Communities and Ecosystems of Gwaii Haanas National Park Re-serve and Haida Heritage Site. Queen Charlotte, B.C.: Parks Canada Technical Report in Ecosystem Science No.47.
Golumbia, T., Bland, L., Moore, K., & Bartier, P. (2002). History and current status of introduced ver-tebrates on Haida Gwaii. In Lessons from the Islands: introduced species and what they tell us about ecosystems work. Ottawa: Canadian Wildlife Service, Environment Canada.
Grant, O. (2010). Results of Culturally Modified Tree Dating from Archaeological Sites located within Blocks NAD507 and LIG213, FLA16869, Graham Island BC. Permit 2009-0041. Baseline Archaeologi-cal Services Ltd.
Grossnickle, S. (2005). Regeneration of Western Redcedar in Managed Cutblocks of Queen Charlotte Islands. Queen Charlotte City, B.C.: South Moresby Forest Replacement Account.
Grossnickle, S. (2005). Regeneration of Western Redcedar in Managed Cutblocks of Queen Charlotte Islands. Queen Charlotte: South Moresby Forest Replacement Account.
Hennon, P., Schaberg, P., Wittwer, D., & Shanley, C. (2012). Shifting climate, altered niche, and a dynamic conservation strategy for yellow-cedar in the North Pacific Coastal Rainforest. BioScience , Vol. 62, No.2.
BIBLIOGRAPHY

Hester, J., Edenius, L., Buttenschon, R., & Kuiters, A. (2000). Interactions between forests and herbi-vores: the role of controlled grazing experiments. Forestry, Vol 73. 382-391.
Holt, R., & Utzig, G. (2009). Haida Gwaii cedar inventory report. Nelson, B.C.: Veridian Ecological Consulting Ltd.
Lantham, J. (1999). Interspecific interactions of ungulates in European forests: An overview. Forest Ecology and Management, 13-21.
Mitchell, F., & Kirby, K. (1990). The impact of large herbivores on the conservation of semi-natural woods in the British uplands. Forestry, Vol 63, 333-353.
Nation, C. o. (2004). Haida Land Use Vision. Old Massett, B.C.: Council of the Haida Nation.
Pearson, W. (1963). A review and analysis of the fire history of the Queen Charlotte Islands. A report submitted in fulfillment of the requirements of the British Columbia Forester’s Act. Victoria: Association of BC Forest Professionals.
PMT. (2006). Haida Gwaii/Queen Charlotte Islands Land Use Plan Recommendations Report and Adden-da. Queen Charlotte, B.C.: South Moresby Replacement Fund Account.
Russell, J., & Ferguson, D. (2010). Western Redcedar Browse Resistance Breeding and Deployment Material. A Tale of Two Cedars (pp. 160-162). Portland, Oregon: US Agricultural Service.
Russell, J., & Kimball, B. (2010). Summary of Western Redcedar Browse Resistance Research. A Tale of Two Cedars - International Symposium on Western redcedar and yellowcedar. Gen. Tech Rep. PNW-GTR-828., 163-164.
Stafford, J., Maxwell, J., & Christensen, T. (2003). Upper Chinukundl (Chini Kundlai) Drainage, Haida Gwaii: Archaeological Impact Assessment: Permit 2003-0118. Victoria, B.C.: Heritage Conservation Branch, Province of B.C. .
Stan, A., Maertens, T., Daniels, L., & Zeglen, S. (2010). Determining the Potential to Reconstruct Pop-ulation Dynamics of Yellow-Cedar in Declining Stands Using Dendrochronology. A Tale of Two Cedars PNW-GTR-828 (pp. 41-46). Portland, Oregon: US Department of Agriculture.
Stroh, N., Baltzinger, C., & J-L, M. (2008). Deer prevent western redcedar (Thuja plicata) regeneration in old-growth forests of Haida Gwaii: Is there a potential for recovery? Forest Ecology and Manage-ment, Vol. 255 3973-3979.
Stroh, N., Baltzinger, C., & Martin, J. (2008). Deer prevent western redcedar (Thuya plicata) regen-eration in old-growth forests of Haida Gwaii: Is there a potential for recovery? Forest Ecology and Management, 255 (2008) 3973-3979.
Stroh, N., Baltzinger, C., & Martin, J.-L. (2008). Deer prevent western redcedar (Thuja plicata) regen-eration in old-growth forests of haida Gwaii: Is there a potential for recovery? Forest Ecology and Management, 3973-3979.
Turner, N., & Wilson, B. (2009). The Culture of Forests- Haida Traditional Knowledge and Forestry in the 21st Century. In A. Drengson, & D. Taylor, Wild Foresting: Practicing Nature’s Wisdom (pp. 130-137). Gabriola Island: New Society Publishers.
Vourc’h, G., de Garine-Wichatitsky, M., Labbe, A., Rosolowski, D., Martin, J.-L., & Fritz, H. (2002). Monoterpene effect on feeding choice by deer. Journal of Chemical Ecology , Vol.28 2411-2427.
Westfall, J., & Ebata, T. (2009). 2008 Summary of forest health conditions in British Columbia. British Columbia Ministry of Forests and Range. Pest Management Report No.15.
Cedar Stewardship Area Management Plan 40

APPENDIX 1Survey methods for Cedar Stewardship Areas
Objective Qualify Cedar Stewardship Area polygons that have not been previously surveyed by the CHN and that are made up of mature or old forest. The intent is to determine the density of cedar and archaeological features to confirm the value of the area under pro-tection. Each area is to be surveyed for:
a. CMTs;b. Monumental cedar;c. cultural cedar (volumes and general wood quality);d. barkstrip potential (40cm to 100cm Cw/Yc with min. 3m clear face), and;e. cedar regeneration.
If any area has a high density of any of these fea-tures then the area is to be maintained within the CSAs. If an area has none of or a low density of any of these features- and can be managed in forestry
Cedar Stewardship Area Management Plan 41
under EBM, then the CHN may consider removing those areas from the CSA and replacement areas added.
Survey method/Sample designThe intent of the survey is to sample a representative area of the CSA polygon. This can be achieved by stratifying the CSA area into stand type, age or site series as necessary. Each stratification area should have at minimum 20% of the area surveyed.
TransectsEach transect is 50m x 200m (1 hectare coverage) at minimum, but may be longer depending on the site. Each transect should be representative of the stands found in the CSA polygon. For each data point along the transect collect the geographic co-ordinate17 and attributes below:
17 Except for bark-strip potential trees which is collected as a single point at the end of the transect.
Monumental Cedar Species DBH Log length Top height (if necessary for measuring defects- fork, candelabra or dead top) Dead top height (if applicable) Fork height (if applicable) Candelabra top height (if applicable) Twist (%)(if applicable) Visible rot (low/medium/high) (if applicable) Corrugation (low/medium/high) (if applicable) Sweep (low/medium/high (if applicable) Scar (length) (if applicable) Knots over 5cm (if applicable) Comments
Table continued next page

Cedar Stewardship Area Management Plan 42
CMTs Species Diameter Class (AL, BS, OMT) Type (AL-) Distance to crown (if AL-S) Bearing to crown (if AL-S) For consideration-attributes used by BC Archaeology branch: Slope Length, Width, Thickness, Height above ground, Side, Nursing tree, Suitability for Dating.
Yew trees Number of stems (point at geographic centre of patch)
Haida Traditional Forest Features Type Number of stems
Haida Traditional Heritage Features Type Comments
Barkstrip potential trees Number of stems by diameter class
Table continued from previous page

Cedar Stewardship Area Management Plan 43
Random plotsRandom plots are conducted at the POC, POT and every 100m along the transect. The intent of the random plots are to record the volume and quality of the wood in the stand, as well as to qualify the ex-tent of cedar regeneration. If a stand does not have monumental quality wood or CMTs, the stand may
still be important for long term cultural wood. Each plot has a variable (standing mature/old trees) and a fixed plot for future analysis purposes.
Information at the plot includes geographic co-ordi-nates of the plot centre as well as the following:
Plot DescriptionCSA number transect number plot number crown closure % estimate within 5% dimensional area within variable plotAspect In degreesSlope % In percentmeso slope position Plain Depression Lower slope Mid slope Upper slope Crest
structural stage 1 Sparse/byroad 2 Herb 3 Shrub 4 Pole/sapling 5 Young forest 6 Mature forest 7 Old forest
A1 layer % Dominant treesA2 layer % Co-dominant treesA3 layer % Intermediate treesB1 layer % Tall shrub layer (2m-10m)B2 layer % Low shrub layer (<2m)BAF used Basal Area Factor usedSite Series Biogeoclimatic zone, variant and site series (ex. CWHwh1 01)
Photo number Representative photo from the plot centre

Cedar Stewardship Area Management Plan 44
Variable plotIn order to quantify cedar volume and quality of the stand for long term cultural use purpose, choose a Basal Area Factor prism (8 to 16) and collect the following data based on the prism sweep:
Tree number Species Cw, Hw, Yc, Ss, Hm, Pl or Dr DBH Height Measured or Estimated M or E Crown class Dominant, Co-dominant, Intermediate, Supressed
Conk Code 1 to 7 Blind Conk Code 1 to 7 Scar Code 1 to 7 Fork or Crook Code 1 to 7 Frost Crack Code 1 to 7 Mistletoe Code 1 to 7 Dead or Broken Top Code 1 to 7 Rotten Branch Code 1 to 7 Sweep Code 1 to 7 Damage Type See appendix Damage Severity Low, Moderate, Severe
Fixed plotIn order to quantify the amount of cedar regenera-tion in a stand, conduct a dot count tally in either an 11.3m radius (0.04 ha) or 5.64m (0.01 ha) radius plot, measured from the centre of the plot. Dot count tally’s are broken up into the following regeneration classes in order capture the presence/abundance of trees ranging from seedlings to
Less than 10cm tall Number of stems to nearest 5 Seedlings per speciesBetween 0.01m and 1.3m tall Number of stems Established stems per speciesBetween 1.3m tall and 12.5cm DBH Number of stems Free growing stems per speciesSeedlings Percent cover % of fixed plot Percent cover per seedling species For 5.64m plot 1/100% (1H)= 10 x 10 cm 1/1000% (1T)= 3 x 3 cm
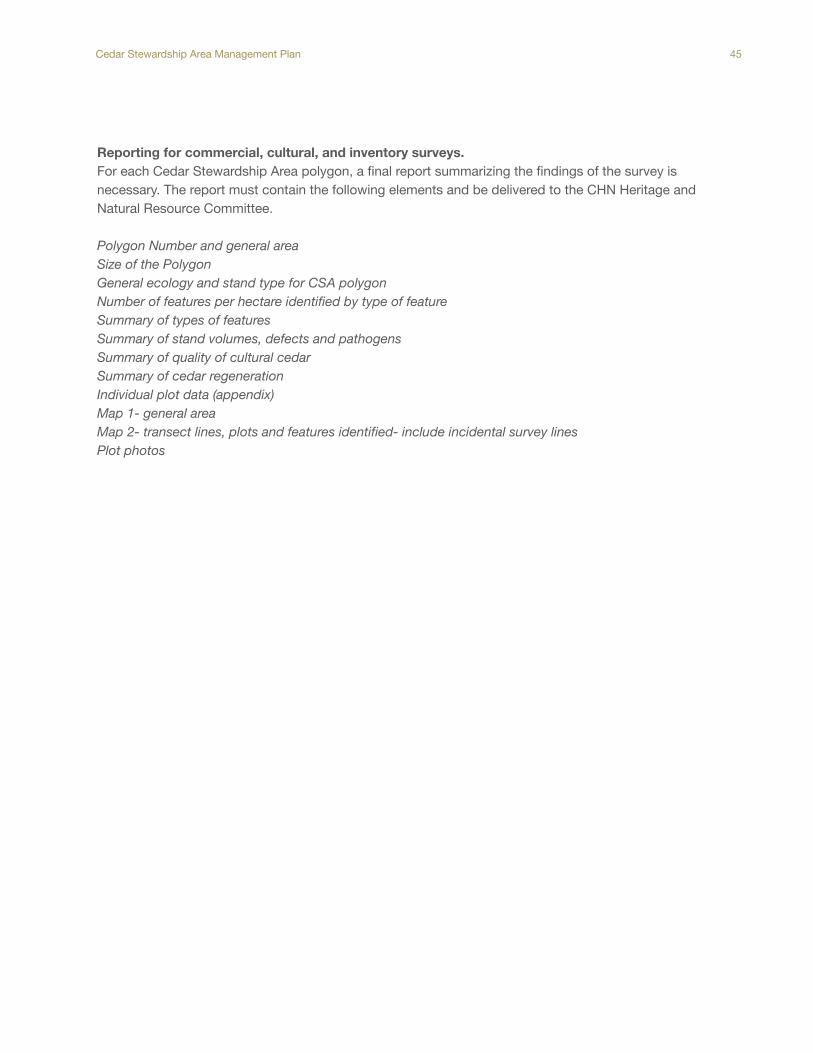
Cedar Stewardship Area Management Plan 45
Reporting for commercial, cultural, and inventory surveys. For each Cedar Stewardship Area polygon, a final report summarizing the findings of the survey is necessary. The report must contain the following elements and be delivered to the CHN Heritage and Natural Resource Committee.
Polygon Number and general areaSize of the PolygonGeneral ecology and stand type for CSA polygonNumber of features per hectare identified by type of featureSummary of types of featuresSummary of stand volumes, defects and pathogensSummary of quality of cultural cedarSummary of cedar regenerationIndividual plot data (appendix)Map 1- general areaMap 2- transect lines, plots and features identified- include incidental survey lines Plot photos

Cedar Stewardship Area Management Plan 46
APPENDIX 2Areas where surveys have been completed.
Otun
Rive
r
Hancock Rive rLigni t e Creek
Tara Creek
Ain
Riv
er
Martin Creek
Ira Cree k
Sea
l Inlet Creek
Naden River
McClin ton
Creek
Dinan Creek
Crease Creek
Tatzu
n Cr
eek
Awun
Rive
r
Ian M
ain
Tara Main
Tracy M
ain
Bill Main
Deuce Main
Bill Main 4000Deu
ce M
ain 11
00
Ian Main
Otun
Rive
r
Hancock Rive rLigni t e Creek
Tara Creek
Ain
Riv
er
Martin Creek
Ira Cree k
Se
al Inlet Creek
Naden River
McClin ton
Creek
Dinan Creek
Crease Creek
Tatzu
n Cr
eek
Awun
Rive
r
Crease Creek
Ain River
C rease Creek
Tan Mountain
Drake, Mount
Begbie, Mount
Wiah IslandRoss Islets
Gray Island
Smyth Island
Ohala Islets
Mutus Island
Deasy Island
Wathus IslandPowell Island
Fraser Island
Steilta Islets
Simpson Island
Dawson Islands
Cowley Islands
Richards Island
Kwaikans Island
McCreight Island
Learmonth Island
Harrison Islands
Roy Lake
Ian Lake
Ain Lake
Eden Lake
Marian Lake
Skundale Lake
Awun Bay
Dinan BayMasset Inlet
Buckley Cove
Yestalton BayMcClinton Bay
Shannon M
ain
Shann
on M
ain 11
50
Lignite Creek
Tara Creek
Martin Creek
Otun R iver
Naden
Rive
r
Areas where field surveys have been completedCSA's Surveyed
CSA's Not Surveyed
Main access
Heritage Sites/Protected Areas
Streams
Lakes
Wetland
.0 3,200 6,4001,600
Meters
1:125,000
Appendix 2 Maps

Cedar Stewardship Area Management Plan 47
Jungle Creek
M iller Creek
Chinukundl Creek
Law n Creek
Slarkedus Creek
Gore Brook
Crabapple Brook
Sybi
l Cre
ek
Mun
cord
Cre
ek
Prem
ier C
reek
Jungle Creek
M iller Creek
Chinukundl Creek
Law n Creek
Slarkedus Creek
Gore B
rook
Crabapple Brook
Sybi
l Cre
ek
Mun
cord
Cre
ek
Prem
ier C
reek
Double Mountain
Skowkona Mountain
Lina Island
Maple Island Jewell IslandGooden Island
Torrens Island
Gillatt Island
Robertson Island
Feather Lake
Rooney Bay
Shingle BayBearskin Bay
Skidegate Inlet
Tlell R
iver
Jun gle Creek
Mil ler Creek
C hinukund
l Creek
Skid Creek
Areas where field surveys have been completedCSA's Surveyed
CSA's Not Surveyed
Main access
Heritage Sites/Protected Areas
Streams
Lakes
Wetland
.0 2,400 4,8001,200
Meters
1:95,000
Appendix 2 Maps

Cedar Stewardship Area Management Plan 48
Mamin R iver
Martin Creek
Ira Cree k
Datlamen Creek
McClin
ton
Creek
Bird
Lake C
reek
Crease CreekTa
tzun
Creek
Tartu
Inlet
Hea
d C
reek
Awun
Rive
r
Tartu In
let O
uter
Cre
ekAw
un R
iver
Ian M
ain
Tracy M
ain
Bill Main
Deuce Main
Deuce
Main
1100
Ian Main
Mamin River
Martin Creek
Ira Cree k
Datlamen Creek
McClin
ton
Creek
Bird
Lake C
reek
Crease CreekTa
tzun
Creek
Tartu
Inlet
Hea
d C
reek
Awun
Rive
r
Tartu In
let O
uter
Cre
ek
Crease Creek
Ain River
C rease Creek
Awun
Riv
er
Tan Mountain
Drake, Mount
Begbie, Mount
Juskatla Mountain
Wiah IslandRoss Islets
Gray Island
Smyth Island
Ohala Islets
Mutus Island
Mamin Islets
Deasy Island
Wathus Island
Seegay Islets
Powell Island
Fraser Island
Steilta Islets
Simpson Island
Dawson Islands
Cowley Islands
Richards Island
Modeets Islands
Kwaikans Island
McCreight Island
Learmonth Island
Harrison Islands
Ship Kieta Island
Que
en C
harlo
tte M
ain
Florence Main
Carey
Main
Queen Charlotte Main 35
Pam Lake
Ian Lake
Ain Lake
Paul Lake
Bird Lake
Awun Lake
Peter LakeMarie Lake
Skundale Lake
Collinson Lake
Awun Bay
Mamin Bay
Dinan Bay
Cowhoe Bay
Stilique Bay
Masset Inlet
Ferguson Bay
Buckley Cove
Yestalton BayMcClinton Bay
Juskatla Inlet
Datlamen Main
Awun
Main
Begb
ie M
ain
Shannon M
ain
Shann
on M
ain 11
50M
amin
River
Martin Creek
Aw
un R
iver
Areas where field surveys have been completedCSA's Surveyed
CSA's Not Surveyed
Main access
Heritage Sites/Protected Areas
Streams
Lakes
Wetland
.0 3,100 6,2001,550
Meters
1:125,000
Appendix 2 Maps

Cedar Stewardship Area Management Plan 49
Tasu C reek
Fla t Cre ek
Lagoon Creek
Chadse y Creek
T h orse
n C
reek
Clin
t Cre
e k
Fairfax Creek
Pacofi Creek
Big Goo
se Creek
Edwards C
reek
Car
mich
ael Cr e
ek
Crazy Creek
Dass Creek
Sewell Inlet Creek
Dan a #1 Cr eek
Littl
e
Goose Creek
Dan
a
# 3 Cre
ek
Bot
any
Inle
t Hea
d C
reek
Peel Inlet 1St Left Hand Creek
Fairfa
x In let Outer Creek
Se
well Point Creek
Longfellow Creek
Tasu Creek
Fla t Cre ek
Lagoon Creek
Chadse y Creek
Thorsen C
reek
Fairfax Creek
Pacofi Creek
Big Goo
se Creek
Edwards C
reek
Car
mich
ael Cr e
ek
Crazy Creek
Dass Creek
Sewe
ll Inlet Creek
Dan a #1 Cr eek
Littl
e
Goose Creek
Dan
a
# 3 Cre
ek
Bot
any
Inle
t Hea
d C
reek
Peel Inlet 1St Left Hand Creek
Fairfa
x In let Outer Creek
Se
well Point Creek
Clin
t Cre
ek
Longfellow Creek
Carl, Mount
Oliver, Mount
Kermode, Mount
Redtop Mountain
Queen Charlotte Mountains
Dog Island
Tanu Island
Mabbs Islet Haans Islet
Wilson Islet
Oliver Islet
Davey Islets
Nedden Island
Louise Island
Helmet Island
Gowing Island
Flyaway Islet
Botany Island
Haswell Island
Swinburne Islet
McLellan Island
Talunkwan Island
Richardson Island
Flower Pot Island
Queen Charlotte IslandsReine-Charlotte, Iles de la
HM240
Dass Lake
Takakia Lake
Mathers Lake
Wilson Bay
Pacofi Bay
Dana Inlet
Cecil Cove
Trotter Bay
Skedans Bay
Logan Inlet
Gordon CoveDawson Cove
Breaker Bay
Barrier Bay
Sewell Inlet
Selwyn Inlet
Lagoon Inlet
Botany InletFairfax Inlet
Stalkungi Cove
Louise Narrows
Cumshewa Inlet
Crescent Inlet
Two Mountain Bay
Thurston Harbour
Rockfish Harbour
Richardson Inlet
Areas where field surveys have been completedCSA's Surveyed
CSA's Not Surveyed
Main access
Heritage Sites/Protected Areas
Streams
Lakes
Wetland
.0 3,500 7,0001,750
Meters
1:140,000
Appendix 2 Maps

Cedar Stewardship Area Management Plan 50
Otun
Rive
r
Hancock Rive r
Watun R
iver
Delkatla Creek
Kitz-H
awn
Cre
ek
Kuk
a C
reek
Na du Rive
r
Bluejacket Creek
Deep Creek
Allan Point South Creek
Jowa Creek
Cook Point North #1 Creek
Carter Creek
Alder Creek
Otun
Rive
r
Hancock Rive r
Watun R
iver
Delkatla Creek
Kitz-H
awn
Cre
ek
Kuk
a C
reek
Na du Rive
r
Bluejacket Creek
Deep Creek
Allan Point South Creek
Jowa Creek
Cook Point North #1 Creek
Carter Creek
Alder Creek
Cub Island
Sloop IsletShip Island
Kumdis Island
Ship Kieta Island Watt Lake
Pure Lake
Skonun Lake
Kumdis Lake
Drizzle Lake
Boulton Lake
Hancock
Riv
er
Wat
un
Rive
r
Mayer R
iver
O
tun
Riv er
Areas where field surveys have been completedCSA's Surveyed
CSA's Not Surveyed
Main access
Heritage Sites/Protected Areas
Streams
Lakes
Wetland
.0 2,500 5,0001,250
Meters
1:100,887
Appendix 2 Maps

Cedar Stewardship Area Management Plan 51
J alun
Riv
er
Christie
R
iver
Ligni t e Creek
Davids
on Creek
Tara Creek
N o-Name Cre
ek
Sta nley Cre ek
Ma ry Cre ek
Naden River
Germania Creek
Big Raven Creek
Whaler Creek
Twin Creeks South Creek
Lignite East #1 Creek
Chr
istie
Wes
t Cre
ek
Tara Main
Jalun
Riv
er
Christi
e R
iver
Ligni t e Creek
Davids
on Creek
Tara Creek
N o-Name Cre
ek
Sta nley Creek
Ma ry Cre ek
Naden River
Germania Creek
Big Raven Creek
Whaler Creek
Twin Creeks South Creek
Lignite East #1 Creek
Chr
istie
Wes
t Cre
ek
Tee Island
Roy Lake
Eden Lake
Marian Lake
Craft BayNaden Harbour
Alexandra Narrows
Lignite Creek
David
son
Creek
J alun
Rive
r
Naden R
iver
Tara
Creek
Stanley Creek
No-Name Creek
Areas where field surveys have been completedCSA's Surveyed
CSA's Not Surveyed
Main access
Heritage Sites/Protected Areas
Streams
Lakes
Wetland
.0 2,500 5,0001,250
Meters
1:100,000
Appendix 2 Maps

Copper Creek
Deena Creek
Pallant Creek
Haa
ns C
ree k
Jungle Creek
B laine Creek
Sa
chs C
reek
M iller Creek
Chinukundl Creek
Honna River
Tarundl Creek
Jason Creek
Slatechuck Creek
Security Creek
Harriet Cre
ek
Macintyre Creek
Indian Cabin Creek
Macmillan Cr eek
Cameron Creek
Slarkedus Creek
South Ba y Creek
Shields Creek
Rockrun Creek
Hastings Point Creek
Gore B
rook
North Arm Head Creek
Saltspring Bay C
reek
Two Torrent Creek
Browns Cabin Creek
Crabapple Brook
Sybi
l Cre
ek
Peel Inlet 1St Left Hand Creek
Mun
cord
Cre
ek
Mud Bay Creek
Wesr S
kidegate Narrow
s Creek
Prem
ier C
reek
South Bay Creek
Boom
cha in Bay Creek
Copper Creek
Deena Creek
Pallant Creek
Haa
ns C
ree k
Jungle Creek
B laine Creek
Sa
chs C
reek
M iller Creek
Chinukundl Creek
Honna River
Tarundl CreekSlatechuck Creek
Security Creek
Harriet Cre
ek
Macintyre Creek
Jason C reek
Indian Cabin Creek
Macmillan Cr eek
Cameron Creek
Slarkedus Creek
South Ba y Creek
Shields Creek
Rockrun Creek
Hastings Point Creek
Gore Brook
North
Arm Head Creek
Saltspring Bay C
reek
Two Torrent Creek
Browns Cabin Creek
Crabapple Brook
Sybi
l Cre
ek
Peel Inlet 1St Left Hand Creek
Mun
cord
Cre
ek
Mud Bay Creek
Wesr S
kidegate Narrows Creek
Prem
ier C
reek
South Bay Creek
Boom
cha in Bay Creek
Rory, MountPoole, Mount
Seymour, Mount
Raymond, Mount
Needham, Mount
Birch Mountain
Nipple Mountain
Etheline, Mount
Double Mountain
Chisholm, Mount
Stapleton, Mount
Genevieve, Mount
Skowkona Mountain
Mosquito Mountain
Cumshewa Mountain
Tree Islet
Lina Island
Gust IslandBush Island
Oliver Islet
Meyer Island
Maude Island
Maple Island
Davey Islets
Burnt Island
Angle Island
Treble Island
Scalus IslandRobber Island
Nedden Island
Legace Island
Jewell Island
Hallet Island
Gooden Island
Fleury Island
Berry Islands
Transit Island
Torrens Island
Gillatt Island
Claudet Island
Roderick IslandRobertson Island
Lillihorn Island
Sandstone Islands
Sandilands Island
Highway
Haans Main
Haans Main 2000
Haans Main
Spur
30
Haans Main 6000
Yakoun Lake
Stanley Lake
Mosquito Lake
Skidegate Lake
South Bay
Rooney Bay
Long Inlet
Fannin Bay
Gordon CoveDawson Cove
Newcombe Bay
Lina Narrows
Etheline Bay
East Narrows
Bearskin Bay
Trounce Inlet
Security Cove
Mackenzie Bay
Skidegate Inlet
Copper Creek
Tle
ll R
iverYakoun
Riv
er
Deena C reek
Pallant CreekAreas where field surveys have been completedCSA's Surveyed
CSA's Not Surveyed
Main access
Heritage Sites/Protected Areas
Streams
Lakes
Wetland
.0 3,600 7,2001,800
Meters
1:145,000
Appendix 2 Maps
Cedar Stewardship Area Management Plan 52

Cedar Stewardship Area Management Plan 53
May
er R
iver
Tl
ell R ive
r
Mamin R iver
Kumdis Creek
Yakoun River
Jungle Creek
M iller Creek
Mountain C
reek
Gregory Creek
Bird
Lake C
reek
Shelly Creek
Cohoe Creek
Law n Creek
Shields Creek
Rockrun Creek
May
er R
iver
Tlell
River
Mamin River
Kumdis C reek
Ya k oun Rive r
Jungle Creek
M iller Creek
Gregory Creek
Mountain Creek
Bird
Lake C
reek
Shelly Creek
Cohoe Creek
Law n Creek
Shields Creek
Rockrun Creek
Parrish, Mount
Ross Islets
Ohala Islets
Mamin Islets
Deasy Island
Seegay Islets
Fraser Island
Steilta Islets
Richards Island
Harrison Islands
Que
en C
harlo
tte M
ain
East
Yak
oun
Mai
n
Drill M
ainFlorence M
ain
Yakoun Main
Canyon Main
Carey Main
Drill M
ain 8
Canyon Main 21
Y10
Dril
l Mai
n 8C
Yako
un M
ain
18
Yako
un M
ain
Sue Lake
Pam Lake
Paul Lake
Bird Lake
Peter Lake
Mayer Lake
Marie Lake
Sheila Lake
Little Lake
Hickey Lake
Feather Lake
New Year Lake
Mamin Bay
Yakoun Bay
Stewart Bay
Stilique Bay
Ferguson Bay
Etheline Bay
Juskatla Narrows
Yakoun RiverMam
in River
M
aye r River
Tlel
l Riv
er
Tlell R
iver
Areas where field surveys have been completedCSA's Surveyed
CSA's Not Surveyed
Main access
Heritage Sites/Protected Areas
Streams
Lakes
Wetland
.0 3,750 7,5001,875
Meters
1:150,000
Appendix 2 Maps

Heritage and Natural Resource Department Council of the Haida Nation
2016