2016 CED and CED HFFI Funding Opportunity Announcement Slides

II- r.
REPORT TO THE CONGRESS
BY THE COMPTROLLER GENERAL OF THE UNITED ST.TES
lllllll\llllillllIllllllllll~llllllllll~l~~ll~ LM101781
Comments On The Study: “Consequences Of Deregulation
Of The Scheduled Air Transportation Industry” Air Transport Association of Americ
The Air Transport Association of America study concluded that if air transport within the ‘Jnited States were deregulated, air ser- vices available to the public could be marked- iy reduced.
GAO assessed the study’s methods and as- sumptions and found that they were oiten faulty. It warns that conclusions drawn from the study should not be relied on as an esti-
CED-77-38

B-13dr22
.-
To the Fresieent cf the Senate and the Speaker of t.?e Bouse of Representatives
This report presents our comments on the Air Transoort Associat itin of Amer ica’ s study entitled “Consequences of Deregulation of the Scheduled -Air ‘Iransport Industry.” The report was requested by the Chairman, Subcommittee on Admin- istrative Practice and Procedure, Senate Committee on the Juci iciary , and is oeing sent to the Congress because cf its interest in the impact of Pederai economic regulation of the lessening of regulation on the airline industry and traveling pub1 ic. The Subcommittee asked us to assess the association’s conclusion that the level of service available to the public could be markedly reduced under a deregulated air transpoLt system.
Our review was made pursuant to the Dudget and Accounting Act, 19Zi (51 U.S.C. 531, and the Accountinq and Auditing Act of 1951, (31 U.S.C. 67).
Copies of this reper t are being sent to the Director, Office of Management and Budget; the Chairman, Civil Aeroqauticc Board; the Secretary of Transportation; and the President, Air Transport Association of America.
ACTING C!$8!&?g?!ener al of the United States
;. .
* - l!- I

! * I DIGEST
Contents -------e %
i
CHAPTER
1
2
INTRODUCTION 1 Federal airline regulation 1 Airline industry 1
Trunk airlines 2 Local service airlines 2 Intrastate airlines 2 Commuter airlines 2
Scope of review 3
AN ASSESSMENT OF ATA'S CONCLUSIONS Routes risking abandonment
Subsidy termination Trunk routes risking
abandonment Revenues not credited to
routes generating passengers for other routes
Many trr:rlk routes ATA lists as unprofitable appear profitable
Stabiiity of routes listed as unprofitable
Flight frequency reductions Eliminating flights with the
lowest load factors Eliminating unprofitable
flights Passengers denied service during
peak periods $1 billion subsidy needed
4 4 . 5
5
6
8
9 10
10
11
3 CONCLUSIONS 13
4 COMMENTS BY ATA, CAB, AND TRANSPORTATION AND GAO'S EVALUATI'JN 15
ATA's comments 15 Route abandonment 16 Service on unprofitable routes
CAB's comments i; Department of Transportation's
comments 18
.-.._ ---_--_ -- . -

Page
APPENDIX
.
. f I- .-
I
II
III
IV
ATA
CAB
GAO
Letter dated January 12, 1977 from the Senior Vice President for Economics and Finance, Air Transport Association of America 19
Letter dated January 24, 1977 from the Chairman, Civil Aeronautics Board
Letter dated January 17, 1977 from the Assistant Secretary for Administration, Department of Transportation
May 15, 1975 flight frequencies on routes listed by ATA as risking abandonment
ABBREVIATIONS -I-
Air Transport Association of America
Civil Aeronautics Board
General Accounting Office
40
42
45
-


C3WIFC.LCGR t’E?JEFPL’S iiEPcP*r TO ‘TUE CWGRESS
CCE??!ENTS ON THE STUDY: “CGNSEWENCES 0 F DEREGULATI3N OF THE SCHEDULED A I R TRANSPORT INDUSTRY” Air Transport Association
of America
DIGEST -e-e--
‘Ihe Air Transpcrt Association of hmer ica, represent ina domestic air1 ines, made a study entitled “Consequences of Deregulation of the Scheduled Air Transoort Industry.” The assoc iat ion sadc the study in resoonse to questions posed by the Chairman, Subcoa.mittee cn Administrative r / Practice ano srocetiure, Senate Committee cn the Judiciary. - AlSO, at the Subcommittee Chairman’s recuest, GA9 assessed the association’s conclusion that air services available to the public could b? markedlv reduced under a deregulated air transport system.
GAO’s overall assessment is that the sttidy’s methods and assumptions &re often faulty and that its conclusions should not be relied on as an estimate of the conseouences of a deregulated air transport industry. Other reviewers of the association’s study hao similar assessments. (;ee p. 13.)
The association concluded that 1,198 airline routes risk abandonment in a deregulated climate. This !s based on its assumption that Federal subsidies on d26 routes would end and that the remaining 373 are unprofitable according to its computer simulation of the airline industrv.
GAC be1 iever these conclusions are uuestionable because:
--Subsiaies are granted under conditions that probably would continue after deregulation.
--In determining that 372 routes were unprofitable, t the association did not properly credit routes with the revenue they generated.
--Many of the routes listed as unorofitablc appear profitable becatlse they were receiving substantiai air service from two or more unsubsidized airlines. (See p. 4 .)
Isa&&& Upon removal, the report cover date should be noted hereon. i ~~~-77-38

f
The association concluded that under deregulation, airlines might try to iE?rove their profit by significantly reducing the number of available flights, thus raising average load factors-- the percentage of total aircraft passenger seating capacity actually used. Increased profits would result from about the same number of passengers flying fewer flights.
The association's flight reduction estimates are overstated because in some cases, they did not adequately provide for passengers of discontinued flights being diverted to other flights. Many fiights which the association contends would be discontinued, may remain to the extent that load factors are increased by passengers being diverted to these flights from other discontinued flights.
The association also did not consider that many flights would be retained because they (1) provide passengers and/or make aircrait available for other routes or (2) receive Federal subsidy. (See p. 10.)
According to the association, raising average system load factors co~lli result in an increase in denial of service tc some passengers during peak travel periods. The association, however, did not assess the extent to which passengers may be denied service.
The association also concluded that maintaining the 1973 service levc!. on trunk airline routes flown that year could require as much as $1 billion in subsidies. Because the association's methodology in determining route profitability and flight reductions is questionable, its estimate of subsidies required to maintain the 1973 service level on these routes is also questionable. (See p. 12.)
COMMENTS AND GAO'S EVALUATION
The association generally disagreed with GAO's conclusions. It believes that its outlook as to what might occur in a deregulated environment remains valid, i.e., that the 1,198 unprofitable and unsubsidized routes might not survive except (1) in limited instances as an adjunct to more proflt- able routes or (2) under large subsidy payments.
I
I
The association said that its study has contributed signifi- cantly to the on-going debate over anticipated results of proposed changes in the aviation regulatory environment. (See p. 19.)
ii

I i
i GAO does not believe the association has provided any significant additional information which would alter GAOts overall assessment of the study.
-, The Civil Aeronautics Board and the Department of c Transportation agreed with GAO's overall conclusion. ,a (See pp. 40 and 42.)
Tear Skeet iii
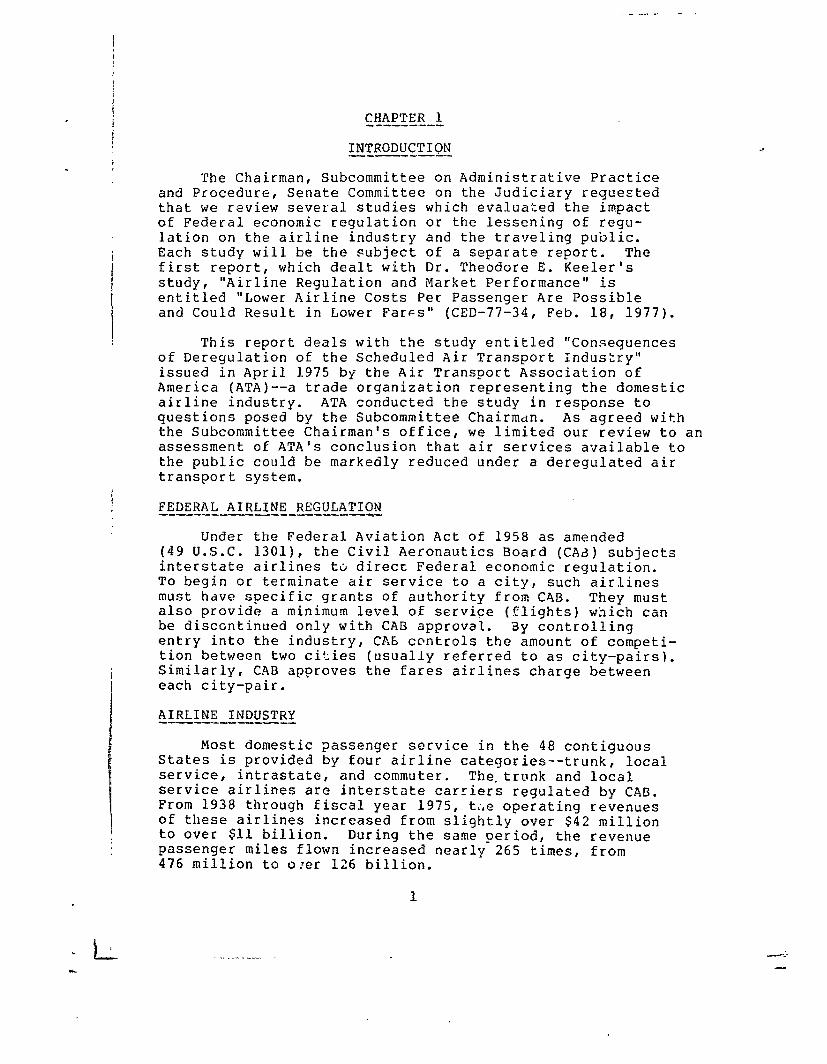
CHAPTER 1 - -------
INTRODUCTION --- -----
The Chairman, Subcommittee on Administrative Practice and Procedure, Senate Committee on the Judiciary requested that we review several studies which evaluated the impact of Federal economic regulation or the lessening of regu- lation on the airline industry and the traveling public. Each study will be the subject of a separate report. The first report, which dealt with Dr. Theodore E. Keeler's study, "Airline Regulation and Market Performance" is entitled "Lower Airline Costs Per Passenger Are Possible and Could Result in Lower FarGs" (CED-77-34, Feb. 18, 1977).
This report deals with the study entitled "Consequences of Deregulation of the Scheduled Air Transport Industry" issued in April 1975 by the Air Transport Association of America (ATA) --a trade organization representing the domestic airline industry. ATA conducted the study in response to questions posed by the Subcommittee Chairman. As agreed with the Subcommittee Chairman's office , we limited our review to an assessment of ATA's conclusion that air services available to the public could be markedly reduced under a deregulated air transport system.
i , FEDERAL AIRLINE REGULATION ---_-_--------w
Under the Federal Aviation Act of 1958 as amended (49 U.S.C. 1301), the Civil Aeronautics Board (CAd) subjects interstate airlines ta direct Federal economic regulation. To begin or terminate air service to a city, such airlines must have specific grants of authority from CAB. They must also provide a minimum level of service (flights) which can be discontinued only with CAB approval. i3y controlling entry into the industry, CAb controls the amount of competi- tion between two ci!:ies (usually referred to as city-pairs). Similarly, CAB approves the fares airlines charge between each city-pair.
AIRLINE INDUSTRY -----w-w---
Most domestic passenger service in the 48 contiguous States is provided by four airline categories--trunk, local service, intrastate, and commuter. The-trunk and local service airlines are interstate carriers regulated by CAB. From 1938 through fiscal year 1975, t;,e operating revenues of these airlines increased from slightly over $42 million to over $11 billion. During the same period, the revenue passenger miles flown increased nearly 265 times, from 476 million to o!er 126 billion.
1
. I

Trunk airlines ----v--e
Eleven trur.rc airlines, which include the largest carriers, provide most of the domestic air service:
American Airlines Northwest Airlines Braniff Airways Pan American World Airways Continental Air Lines Trans World Airlines Delta Air Lines United Air Lines Eastern Air Lines Western Air Lines National Airlines
CAB specifies the cities each airline can serve and th2 fares they can charge. CAB does not specify the number of flights that must be provided, but it does specify that a minimum level of service must be maintained.
Local service airline_: ---
Local service airlines generally serve cities in one region of the country. CAD regulation of local service carriers is similar to its regulation of trunk airlines. Honlever, unlike trunk airlines, some local service airlines are subsidized to provide service to some locations. The rine local service airlines are:
Air New England Allegheny Airlines Frontier Airlines Hughes Airwest
North Central Airiines Ozark Air Lines Piedmont Aviate;:,; Southern Airway? Texas Internationai ;r;:..ires
Intrastate airlines
Intrastate airlines operate entirely within the boundries of a single State and are not regulated by CAb. Unless restricted by the State, the airlines can serve a;.*( city within the State, use any type o.f aircraft, and charge any fare.
Commuter airlines
Commuter airlines provide service to cities in both the interstate and intrastate markets and are generally restricted by CAB to using aircraft with a capacity of not more than 30 passengers. The only other CAB require- ment of these airlines is that they register with CAB, carry prescribed insurance, and provide certain operational data. The establishment of routes, flight frequencies, and fares is not subject to CAB approval.
.
L L 2

SCCPE OF FEVIfk -__-_------
We analyzed ATA’s response to the Subcommittee’s question concerning deregulation’s impact on air service. We rev iewed critiques of the ATA study prepared by Mr. George Fads, Council on Wage and Price Stability: Yr. James Killer, Council of Economic Aciv isors ; the Civil 4eronautic Board’s Special Staff on Regulatory Reform; Dr. Drake, Professor of Economics, Purdue University; Dr. Keeler , Assistant Professor of Economics, Universitlr of California (i3erkley) ; Dr. Peltzman, ?rofessor of Econom icsl University of Chicago; Dr. Sherman, Professor of ECGnOilIi?s, University of Virr;inia: and Dr. Whinston, Professor Econom its s Management and Computer science, Purdue University.
We interviewed officials from ATA, CA3, and the Cockheed Aircraft Corporation, whose “Air1 ine Svstem Simulation f:odel” was used &y ATA to determine the profitability of trunk air-1 ine routes. Ldsing the May 15, 1475, Cfficial .Airline Guide ana C%G data, we analyzed the routes and frequency of fiights AT4 incluaed in its study.
,-: -
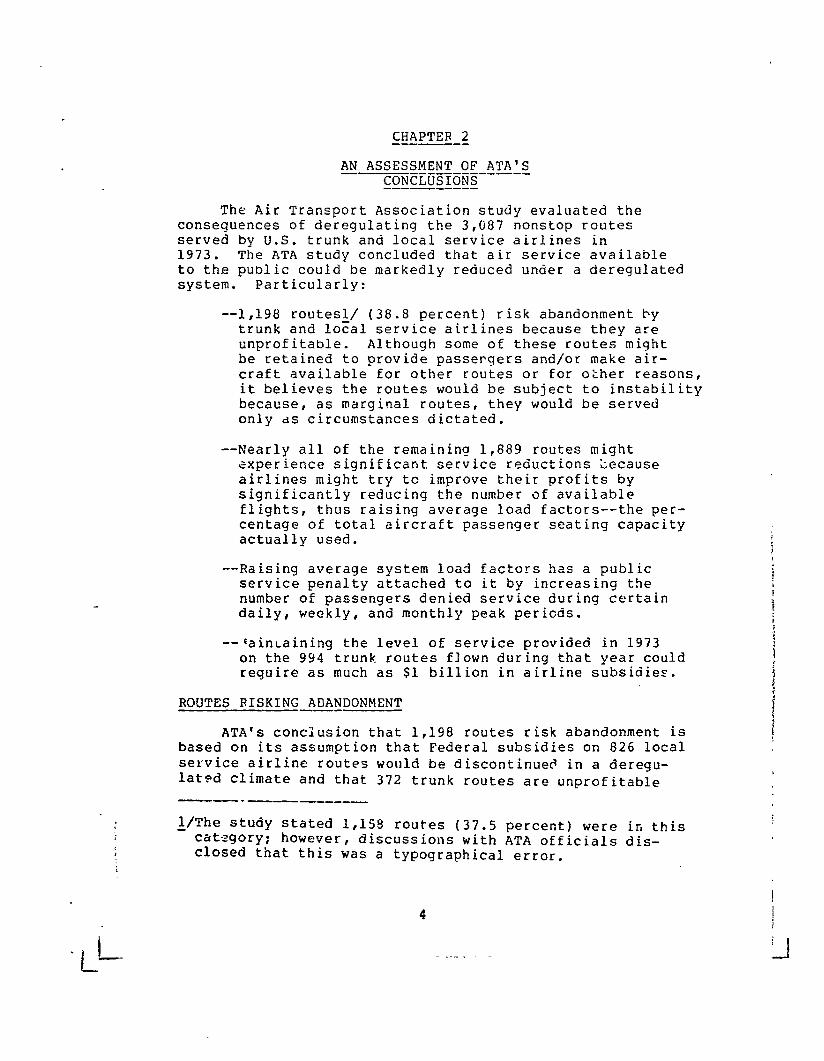
CHAPTER 2 -------
AN ASSESSMENT OF ATA’S --- -----se--- CONCLUSIONS -----_----
The Air Transport Association study evaluated the consequences of deregulating the 3,687 nonstop routes served by U.S. trunk and local service airlines in 1973. The ATA study concluded that air service available to the public could be markedly reduced under a deregulated system. Particularly:
-1,198 routesi/ (38.8 percent) risk abandonment by trunk and local service airlines because they are unprofitable. Although some of these routes might be retained to provide passergers and/or make air- craft available for other routes or for other reasons, it believes the routes would be subject to instability because, as marginal routes, they would be served only ds circumstances dictated.
--Nearly all of the remaining 1,889 routes might sxper ience significant service reductions Because airlines might try tc improve their profits by significantly reducing the number of available flights, thus raising average load factors--the per- centage of total aircraft passenger seating capacity actually used.
--Raising average system load factors has a public service penalty attached to it by increasing the number of passengers denied service during certain daily, weekly, and monthly peak pericds.
--GainLaining the level of service provided in 1973 on the 994 trunk routes flown during that year could require as much as $1 billion in airline subsidies.
ROUTES RISKING ADANDONMENT ----
ATA’S conciusion that 1,198 routes risk abandonment is based on its assumption that Federal subsidies on 826 local service airline routes would be discontinued in a derequ- latpd climate and that 372 trunk routes are unprofitable ----- -
L/The study stated 1,153 routes (37.5 percent) were ifi this category; however, discussions with ATA officials dis- closed that this was a typographical error.
4

according to its computer simulation of the trunk airline industry. (See app. IV). Although ATA stated some of the 1,198 routes might be retained under a deregulated system to provide passengers and/or make aircraft available for other routes, it believes these routes would be subject to instability because as marginal routes, they would be served only as circumstances d ictated.
We believe these conclusions are questionable because
--subsidies are granted under conditions that probably would continue after deregulation,
--ATA’s simulation of the trunk airline industry does not support its conclusion that 372 routes are un- profitable, and
--the stability of routes ATA listed as unorofitable would not change substantially under deregulation.
Subsidy termination ---- -----
ATA concluded that eliminating the Civil Aeronautics Board’s regulation of airlines would risk abandonment of 826 local service routes because subsidies would be dis- cant inued . ATA presented no data to support this assump+ion.
CA3 officials have stated that subsidies would continue to be provided under ueregulation to the extent that con- tinued service to small communities was deemed in the public interest. Along the same lines, the Council of Economic Advisers said it would be a mistake to conclude that all or a substantial part of the subsidized routes would be dis- cant inued under deregulation.
Trunk routes rrskiz-abandonment ---
ATA used a computer model to simulate the 1973 domestic trunk airline industry in the 48 contiguous States. Trunk airlines flew 994 routes durinq that year. The model (Air- line System Simulation Model) 6eveloped by Lockheed Aircraft Corporaticn was used to compute the point at which the number of routes and flights flown would produce the maximum profit for the entire airline system.
The simulation model adds f3 ights’ in much the same manner as the airlines develop their schedules:
--First, the model assumes there are no flights, but
5
. L * -;
-

that aircraft and a group of possible routes are available.
--The model computes the economic impact of usina each available aircraft on each route. The computation includes the amount of revenue and cost? which would result from adding a flight.
--The flight producing the greatest profit is then selected.
This process is repeated until no more profitable routes remain.
The simulation showed that the point of maximum profit would occur when the trunk airlines were servins 622 nonstop -routes, with 2,500 daily flights, at a load factor of 81.6 percent. ATA concluded that the 372 remaining routes served by the trunk airlines in 1473 were unprofitable and would be likely candidates for abandonment of service under deregulation.
Revenues not credited to routes generati$ oasse~Z?XZforE routes -- - ------ ----
Our analysis of the ATA F”. udy showed that revenues were not always credited to the flights from which they were generated. Thus, the pr*nf itability of some routes may be over or understated.
Both ATA and reviewers of ATA’s study pointed out that intercity air transportation often depex;fs on combining traffic flows between several city-paics over a single multistop route. For example, CAB said that an airline often schedules flights, eve I though they do not earn a profit, because many passengers on such flights connect with profitable flights of the same airline. According to CAB, these flights should be crediteo with some of the revenues derived from the flights to which passengers were provided.
The ATA study assumed that each city-pair had tc be individually profitable, but it did not consider route interaction-- alternate ways of going from one city to another --which can be accomplished with the use of one- stop and multistop routes. The follqwing are several types of route interaction.
6
L- ‘L
!
I 1 I
J i - -c----

CITY D
/ .
CITY A
CITY 6
The si r~plcst route between city A and city C is the nonstop route. AL alternate is a one-stop route with the inter- mediate point city B. Some people can travel from A to C by 3; and others from A to 3, and from I3 to C. Thus, there are three interacting passenger demands.
Another alternate is a one-stop route providing nonstop service to the principal cities (4 and C) with connections to some other point, in this case D. This rou;lc also involves three int,eract ing passenger demands. Higher orders of inter- action (two-stop routes , etc.) are also possible.
We found that as of May 1975, the majorrty of the trunk routes ATA listed as unprofitable were segments of multistop routes - The profitability of multistop routes is illustrated by the route between Baltimore, Maryland, and Washington, D.C. This route was unprofitable according to ATA’s study. How- ever, in May ,975 the route was served by 5 airlines which offered a total of 26 daily flights. During 1975, 72,717 pas- senger traveled between these two cities, boarding at either Baltimore or Washington. However 40,001 (55 percent) of the passengers traveled beyond either city rin the same airplane. Although passenger data is not available, some of the remain- ing 32,716 passengers probably continued their travel on connecting flights of the same or other airlines.
The incentive for serving the Baltimore-Washington route was not only the revenue obtained for the 72,717 passengers traveling between these cities, but also the revenue generated by passengers traveling to points beyond. The profitability of serving this route should include the effect of passengers who use it as a means to a longer journey.
To assume, as ATA did, that there is no route interaction as illustrated, is unrealistic and results in misstatement of a route’s profitability. ATA has not supported its conclusion that these routes are unprofitable.
7
_-

Many trunk routes ATA lists ---- as un=ofitable *pear profitable --- ----- ---
Many of the 372 trunk routes ATA lists as unprofitable appear profitable because of the extent of service provided by airlines on these routes.
CA& grants airlines a treat deal of freedom regarding the number of flights tCz- i can provide a particular city. tyzually , CAB merely recuires the airline to provide one flight each day to and from the city that CAB has authorized it to serve. For example, an airline could meet CA6 minimum service requirements on a route consisting of cities A, B, and C, by merely providing a round-trip flight each day between A and B, hnd A and C. .
CITY A
CITY 8
CITY C
The route between B and C therefore, is discretionary.
Of the 372 trunk routes ATA listed as unprofitable, 352 were being flown in May 1975--337 by trunk airlines and 15 by locai service airlines. Most of the air service on these routes was discretionary. In only two instances would CAB approval be necessary to discontinue service--Pan Amer ican Airways’ service to Philadelphia and United Air Lines ’ service to Sakersf ield, California. In addition, some of these 352 routes were receiving substantial air service; 1 route was served by 74 daily flights, as shown on the newt page.
’ i
f
I
8
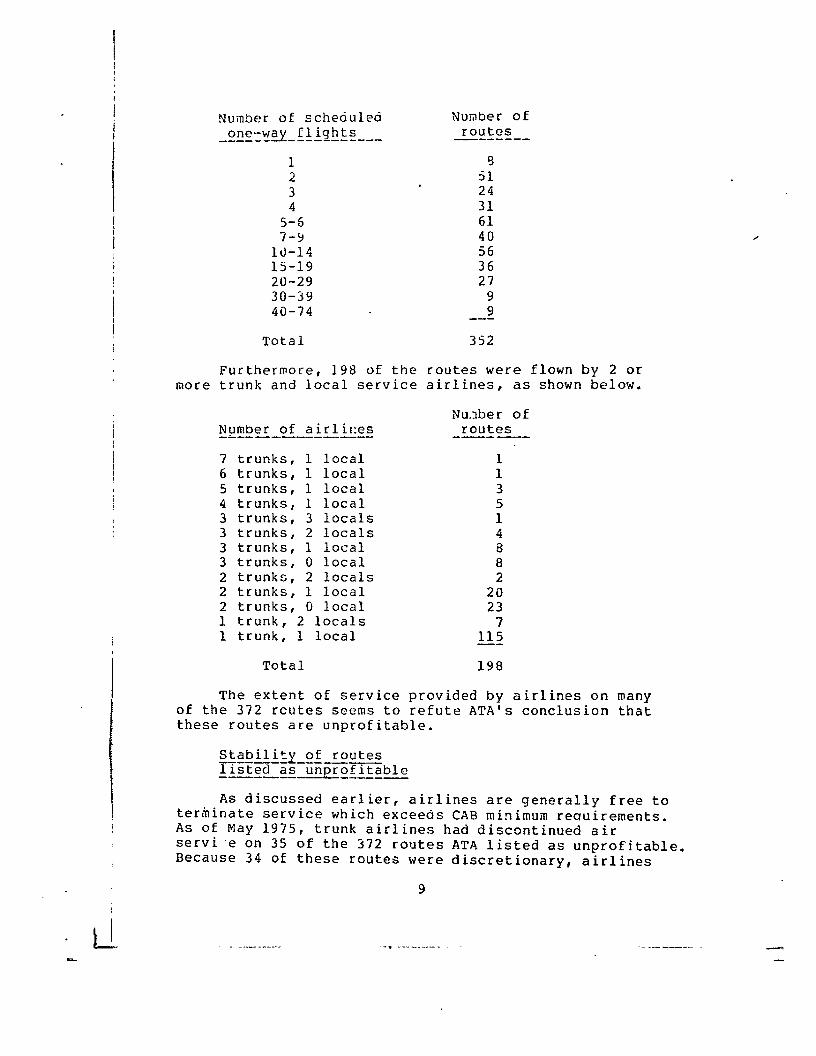
Number of scheduled one-w3 flights ___-_ _-____-----
Nunber of routes --------
1 2 3 4
5-5 7-9
13-14 15-19 20-29 30-39 40-74
9 51 24 31 61 40 56 36 27
9 9
Total 352
Furthermore, 198 of the routes were flown by 2 or more trunk and local service airlines, as shown below.
Number of airlines -i----------- Hu.lber of
routes ----
7 trunks, 1 local 6 trunks, 1 local 5 trunks, 1 local 4 trunks, 1 local 3 trunks, 3 locals 3 trunks, 2 locals 3 trunks, 1 local 3 trunks, 0 local 2 trunks, 2 locals 2 trunks, 1 local 2 trunks, 0 local 1 trunk, 2 locals 1 trunk, 1 local
1 1 3
1' 4 8 8 2
20 23
11; -- Total 198
The extent of service provided by airlines on many of the 372 rcutes seems to refute ATA's conclusion that these routes are unprofitable.
Stabili2 of routes --- 1 Isted asx=fitable ------ --- As discussed earlier, air1 ines are generally free to
tertiinate service which exceeds CAB minimum requirements. As of May 1975, trunk airlines had discontinued air servi -e on 35 of the 372 routes ATA listed as unprofitable. Because 34 of these routes were discretionary, airlines
9
.- --I~ -_-_ -. -.__ - - - - cc
-

were allowed to terminate service on these routes without CAB approval. Only one location, Titusville, Florida, required CAB approval to discontinue service.
Airlines were also free to terminate air service on most of the remaining 337 routes. Because air service on most routes ATA listed as unprofitable was discretionary, the stability of air service on these routes is not contingent on CAB's airline regulation.
FLIGHT FREQUENCY REDUCTIONS --------------
The ATA study concluded that the routes remaining under deregulation might provide signif icantiy reduced service to the public because airlines would be incline; to reduce the number of flights flown on a route to increase load factors and make the routes more profitable. ATA said that achieving a high load ;actor is not neces- sarily consistent with a high level of air service to communities across the Nat ion. It listed two ways c.f achieving a higher load factor: eliminating flights with the lowest load factors and/or eliminating unprofitable flights.
Eliminating flights with the lowest load factors -I__ --
To determine the impact of this method of raising load factors from 55 to 60 percent, ATA arrayed all trunk and local service airline flights for August 1973 from lowest to highest lc.ad factors. The average load factor for that month was 55.7 percent. Flights with the lowest load factors were eliminated from the list until an average load factor of 60 percent was obtained. At this point, 144,000 monthly trunk and local service flights had been eliminated.
We believe this method of estimating flight reductions cannot be relied on because it does not take into account
_ the likelihood that some of the passengers that had used the discontinued flights would now use other flights. ATA's estimates assumed these passengers would not fly at all. Thus, it seems reasonable that many of the 144,000 flight. would not be eliminated because their load factors would 5 /' raised by passengers being diverted tc theso flights from low load factor flights which are eliminated. Although ATA acknow- ledged '.his, it believes scme segments would lose all air service.
In addition, this method of computing fliqht reductions relies on only one element--load factor--as a reason for providing service. Other reasons, such as providing passengers and/or making. aircraft available for other routes or the
10
__ -----_ - .__II..

continuation of Federal subsidy, also need to be considered. Subsidies on routes with low load factors can be expected to continue to the extent that such service is deemed in the public interest.
Eliminating unprofitable flights
Using the computer simulation, ATA concluded that raising load factors to 60 percent, by eliminating the most unprofitable flights, would result in eliminating 20,000 flights a month or 9 percent of all trunk airline service.
Uniike the previous method, the simulation provided for the diversion of passengers of discontinued flights to some of the other flights. However, we believe the results are overstated because the simulation assumed these pas- sengers would only use alternate flights when
--the flight provided nonstop service between the same points,
--the flight had available seating for the additional passengers, and
--the timespan between the discontinued and alternative flights did not exceed a specified time-distance relationship.
The study ignored the possibility of travel between two cities on flights making one or more stops or on a series of connecting flights. Like the previous method, it did not determine how many flights would be retained because they provide passengers and/or make aircraft available for other routes or receive subsidy. Therefore the simulation can not be relied on to estimate flight reductons.
PASSENGERS DENIED SERVICE DURING PEAK PERIODS
ATA concluded that raising average system Toad factors could result in an increased denial of service to some passengers during peak periods of travel. For example, ATA said that routes with average load factors of 40 percent have individual flights with load factors from 70 to 90 per- cent. This means that at certain times of the day and on certain days of the week, some passengers may be turned away from flights of their choice even though, on a monthly average, 60 percent of the seats availab?e on the route are empty. ATA, however, did not assess the extent of these denials' occurrence.'
11
--. - -_.-_ _-I_--

$1 BILLION SUBSIDY NEEDED
ATA concluded that to maintain the level of service provided in 1973 on the 994 trunk routes flown that year, $1 billion in subsidies could be required. The $1 billion estimate represents the cost of (1) continuing service on 372 of the 994 trunk routes flown in 1973 which ATA's study indicated were unprofitable and (2) continuing flight frequencies at the 1973 level on the remaining 622 routes. In making its estimate of subsidies required, ATA excluded the cost of continued operation of an unspecified number of unprofitable flights which provide passengers and/or air- craft for other routes and for future route development.
Because the methodology used in determining route profitability and flight reductions is questionable, ATA's estimate of subsidies required to maintain the 1973 service level on the 994 trunk routes studied is also questionable.

CRAPPER 3 ---------
conclusions --___-_----
Our assessment is that the study’s methodologies and assumptions are often faulty and the conclusions drawn f ram the study should not be relied on as an estim’ate of the consequences of a deregulated air transport system. Other reviewers of the ATA study (see p. 3) had similar assessments.
ATA’s conclusion that 1,198 routes risk abandonment of service is quest ionable. No evidence suppcrts ATA’s assumption that subsidies would cease on the 826 local service airline routes listed as candidates for abandon- ment. ATA’s simulation of the trunk airlines does not support its conclusion that 372 such routes are unprofit- able. The simulation’s assessment of each route’s profit- ability did rot consider combining traffic flows between several city-pairs over a single multistop route, nor did it properly credit each nonstop route with the revenue it generated by providing Passengers for other routes. In addition, many of the 372 trunk routes listed as unprofit- able appear pr;;itable because they were receiving sub- s’ antial air service oy at least two airlines operating without subsidies.
Because trunk airlines are free to terminate air service without CAB approval on most of the 372 routes ATA identified as unprofitable, the stability of air service on these routes is not contingent on CAB’s airline regulation.
ATA concluded that under .deregulation, airlines might try to lmprcve their profits by significantly reducing the number of available flights, thus raising flight load factors. Increased profits would result from about the same number of passengers flying fewer f 1 ights. We believe ATA’s flight reduction estimates are overstated because they do not adequately provide for passengers of d iscontinued f 1 ights being diverted to other flights. Thus, many flights ATA contends would be discontinued may remain to the extent that load factors are increased by passengers being diverted to these flights from uiscontinued flights. In addition, ?TA did not consider that many flights would be retained because they provide passengers and/or make aircraft available for other routes or receive Federal subsidy.
ATA concluded that raising average system load.factors could increase denials of service to some passengers during peak periods of travel. ATA, however, did not assess the extent of service denied to passengers.
13

Finally, ATA concluded that maintaining the 1973 service level on the 994 trunk routes flown that year could require as much as $1 billion in subsidies. Because ATA’s methodology in determining route profitability and flight reductions is questionable, ATA’s estimate of subsidies required to maintain the 1973 service level on the 99 4 trunk routes studied is dlso questionable.
- 1 I- --

CW~PTEP 4 ---------
C-kM~N’I” .L. _u BY-I;TA, CAB, PND ------
TKANSPOPTATION hh’T? GAO’S EVALUATION ________ -_-_----_---~~----~-~-
ATA’ S CObfi3Ei~TS --------_
AT.4 said (see aDp. I) that its study and the discussion of its finoings have contributer! significantly to the on- going debate over anticipated results of proposed changes in the aviation regulatory environment.
AT.4 emphasize.. that its study was made in resDonse to the Chairman’s request of Feb. 7, 1975, for a 1 ist of those city-pairs that were unprof itabl e and might be abandoned under a more competitive system. ATA said that when the request was made (2 years ago), no specific proposals for regulatory reform had Seen introauced and ATA’s study approach was designed solely to provide, within the time constraints, an objective, detailed, industry-wide listing of unprofitable city-pairs. ATA said that the list of city-pairs represented unprof itaole markets from which inaividual carriers exercising their inciependent business judgment in a substantially un- regulated environment would cnose routes to be abandoned.
ATA generally disagreed with our conclusions. It be1 ieves that its outlook concerning what might occur in a deregulated environment rema ins I.-al id, namely that the 1,198 unprofitable and unsubsidized routes might not survive except in limited instances as an adjunct to more Drofitable routes or under large subsidy payments. It cite3 as further evidence of the validity of its conclusion, an indeDendent study by United Air Lines released after its report.
Although we did r.ot evaluate the United Air L,rnes we question whether a single airline’s operation can be
study,
indicative of i he entire tr:.nk airline industrv. AT4 has not provided any signif icant aaditional information which would alter our assessment that the study’s mcthodoloaies and assumptions are often faulty and that the conclL7sions drawn from the study should not be relied on as an estimate of the consequences of a deregulated air transport industry.
I.-I addition, ETA questioned thd val iditv of some factual data presented in our report. The following is a discussion of those matters which 4TA questioned.
15

Route abandonment ------------.----
Route abandonment, according to AI’A, is currently governed by law and economic marketing judgment. “TA cited Section 401(j) of the FAA Act which provides that
“NO air carrier shall abandon any route, or part thereof, for which a certificate has been issued by the Board unless, * * * the Board shall find such abandonment to be in the public interest.”
ATA also cited Section 401(j) of the Act as providing that, in the absence of CAB approval, no airline may totally abandon service to any city included in its certi- f icate, even if such abandonment leaves the city with other certificated air service to all pointr: formerly served.
ATA believes, based on this provision, that of the 372 unprofitable routes, the 154 which are served by only one airline can not be abandoned without CAB approval. In addition, it believes some of the remainir,g 198 routes may also require CAB approval for abandonment because termination would mean total abandonment of service by the airline to a city included in its certificate.
ATA’s comments on this matter are inaccurate. CAB has stateci that an airline’s routes consist, for the most part, of long linear segments describing a series of intermediate points (cities) between terminal points. In very few cases do route certificates consist of only two cities, thus requiring service to a specific city-pair.
For example, a route certificate which authorizes an air1ir.a to serve 13 cities, merely requires the airline to provide one or two flights per day to each city. The airline may provide service among any city-pairs or to any series of cities named in its certificate unless explicity prohibted by CAB. The airline might serve such cities by establishing a hub at one city, and serving every city from there or it could provide nonstop service between 211 of the 78 combinations of city-.pairs in a system of 13 cities which it is authorized to serve. The airline has a great deal of freedom in choosing the markets it wishes to serve and msy add or drop city-pair markets without CAB approval. We believe that the ex.ample cited on pV 8 adequately illust- rates this point.
The only guarantee of service for any city on an airline’s system is that one or two flights per day will continue to be provided. The flights may be to or from any other city 1 isted on the airline’s route certificate; they may arrive at any hour the airline chooses and with any equipment the airline chu&es.
16
4T.q said that we incorrectly stated it dill not Consider that some unprofitable routes might be retained to brovide oassencjers for other routes. ATA is in error. On page 5.we stated that ATA indicated some unprofitable routes might be retained to provide passengers and/or make aircraft available for other r lutes or for other reasons.
ke did, however, goint out that in estimating flight reductions on profitable routes, ATA did not take into account that ma;ly flights would be retained because they provide passengers and;/or make aircraft available for other routes or receive Federal subsidy.
Service on unprofitable routes ____-_____-_ --- -_---- . .
ATA believes that some of the data shown in appendix IV-- May 15, 1975 Flight Frequencies On Routes Listed By ATA As Risking Abandonment- -is in error because we did not distinguish between local service airlines and commuters operating in place of local service airlines. For example, it said the 41 local service daily f! igtts listed by us between Philadelphia and Wishington, D.C. is in error. According to AT4, the May 1, 1975 Official Airline Guide chows only 4 local service flights from Washington to Philade’pt- ia, and 29 commuter airline flights (26 by Ransome Airlines flying as “Allegheny Commuter” and 3 by Altair). ATA believes the Washington-Baltimore flight data was similarly distorted.
The flight data we used was taken from the May 15, 1975, Official Airline Guide. The guide listed the commuter airlines’ flights as Allegheny service because the commute; operated these flights on behalf of Allegheny pursuant to a CAB approved agree- ment. Alleghe:ly Air1 ine, however, retains its underlying obl iga- tion to insure adequate service. If the substitute fails to provide the required service, Allegheny must find another substi- tute or resume operations under the obligations of its certificate.
The Allegheny Commuter program is similar to a franchize. The substitute airlines use the name, “Allegheny Commuter” and paint their planes with Allegheny colors. Joint fares are offered, Allegheny furnishes computerized reservation service, and provides interline ticketing and baggage hand1 ing.
CAB’S COMMENTS -me--
CAB stated (see app. II) it is in general agreement witn our conclusion that the ATA study cannot be relied on as art estimate of the consequences of a deregulated air transport industry. In CAB’s opinion, the report successfully rebutted ATA’s study on its own terms.
17
- --_.-- -. 1
- - ;
- -
DEPARTMENT OF -------- TRANSPORTATION'S COMMENTS -c------------
The Department stated (see app. III) it was in agreement with our position that the ATA study's methodologies, assumptions and conclusions are frequently faulty.
,
18

APPEtmIX I APPENDIX I
Air Transport Association ata OF AMERICA
1709 NE-L% York Avenue N W Washmgton D C 20006
(202) 872-4000
,January 12, 1977
Xl r. Henry Eschwcge Director I!nittd States General -4ccounting Office Washington, 13. C. 20538
i>ear M r . Eschwege:
Th:lnk you for y*our letter of December 8 to Paul Ignatius in which you requcstec: AT.4 review and comments on the draft GAO report to the Chairman, Subcommittee on Administrative Practice and Procedure, Senate Committee on the Judiciary, entitled “Conimcnts of the Air Transport Association of America Study: (‘onsequence, of Deregulation of the -4ir Transport Industry”.
We welcome this opportunity, because we believe the ATA study and the subsequent discussion of its findings have con!ributed significantly to the on-going debate over anticipated results of proposed changes in the aviation regulatory environ- ment. Air transportation represents an essential public service to the nation, and the dgbbate now underway concerns the form ancI manner in which that service will be provided. \Ve believe it important that thoughtful considrration be given to the con.s~‘- quences of proposed alternatives for changes before the lcgisla- tlve course is set.
The ATA comments are set forth in Appendix I and are in two parts -- first, general remarks with respect to the ATA study, its, background and purpose, and the GAO’s analysis; and, second, more detailed discussion of certain specific points raised in the GAO p&per.
19
APYWDIX I
Mr. Henry Eschwege Page 2.
AFPENDIX I
January 12, 1977
We appreciate this opportunity to review the draft GAO report . If we can provide additional information, pltasc ltat me know.
Attachments
’ :
20
‘f ‘- -

APPENDIX I APPENDIX I
APPENDIX I Page 1 of 12
ATA RESPONSE TO GAO DRAFT COMMENTS ON ATA STUDY:
CONSEQUERCES OF DEREGULATION OF THE AIR TRANSPORT INDUSTRY
General Comments -.-
During ATA’s testimony before the Senate Judiciary Subcommittee on Administrative Practice and Procedure in February, 1975. and subsequently by letter, the Chairman requested that ATA “provide a list . . . of those city pairs that are now unprofitable and might be abandoned. ” He asked further that ATA “specify those city pairs of which the cost of servmg exceeds the incremental revenues generated. ” (Emphasis in original. 1
It was in response to this request that the ATA study was undertaken. At that early date no specific proposals ior regulatory reform had been intro- duced. The approach taken by ATA was designed solely to provide. within the required time constraints, an objective. detailed, industry-wide listing of unprofitable city-pairs. The city-pairs listed represented unprofitable markets from which individual carriers exercising their independent business judgment in a substantially unregulated environment would choose routes to be bandoned. These conditions were made clear by ATA in its study report and in its letter dated April 25, 1975. transmitting the study results to the Chairman (Attach- ment I).
The approach adopted by ATA employed a computer model (the Lockheed Airline System Simulation Model) addmg flights in an iterative process “in much the same manner as the airlines develop their schedules” (as noted by the GAO report), computing “the economic impact of using each available aircraft on each route.” The determinative measure employed was profitability based on incremental costs and revenues. as requested by the Chairman. Because of time constraints, the model was applied only to the 994 trunk airline non-stop city-pair routes operated during 1973 (the latest data f.iblicly available at the time 01 lhe st:dy). However, where non-stop service on tnese routes was also provided by local service carriers, this trafiic was also included.
Thus, the study results showing 372 unprofitable city-pair routes operated in 1973 probably represents an understatement of the total, given the iact that the unsubsidized local service carrier operations were not included (except as noted above).
On, the other hand, the unprofitable trunk city-pair market listing was augmented in the ATA report b:. an identifmation of all subsidized 1973 local servme routes as a demonstration to the Subcommittee of a substantial number of markets not included m the simulation that were potential targets for service reductlr.? or elimination under essen:ially “free market” conditions. ATA
-21

APPENDIX I 4PPENDIX I
APPENDLY I Page 2 of 12
made no assumption with respect to maintenance, reduction. or expansion of such subsidy, because pubIic policy considerations are not subject to objective quantification and analysis. ATA did, however, estimate that. if public policy led to maintaining the 1973 system (including all unprofitable trunk routes and absent the current balance of cross-subsidization). substantially increased levels of direct subsidy would be required in the assumed deregulated environ- ment -- perhaps as much as $1 billion. This rough estimate was based on the difference between costs and revenues attributable to the identified unpro- fitable markets, and to the cost of maintaining the 1973 profitable market structure. Given the extensive data furnished by ATA and o*ers, summar- ized on the following pages, this estimate appears reasonable.
It should be noted that, subsequent to publication of the ATA study, proponents of major regulatory change have indicated (as the GAO report states at several points -- e. g., pp. 13, 14, 17) that public policy may re- quire extension of direct subsidy to presently unsubsidized unprofitable routes, although there has been disagreement concerning the amount of subsidy that would ultimately be require<. As we pointed out in our April 25, 1975 letter to the Subcommittee Chairman, “It is conceivable that the 1.198 unprofitable, and subsidized, routes might not survive in a deregulated environment except in limited instances as an adjunct to more profitable routes or under large subsidy payments by cities or the federal government. ” We believe this out- look remains valid tooay [see GAO note, p. 32)
It should be not4 further, with respect to the city-pairs listed as unprofitable. that ATA never contended that all would be abandoned in the event of deregulation. Rather, as ATA related in the study report (see pp. 2, 9, of the ATA study report) and in letters to the Subcommi:tee rhairman dated April 25 and May 8. 1915. it has always been clear that a number of unprofitable routes would be maintained even in a deregulated environment for purposes of feeding heavier travelled routes or au-craft positioning, matters within the sole marketing discretion of individual .arriers ander such deregulated cir- cumstances.
Subsec\lent to the ATA report, United .&rlmes furnished the Subcom- mittee its independent analysis of its own system (see Attachment II). In a letter to the Subcommittee dated April 29, 1975, a company official noted that of 310 non-seasonal city-pairs operated by United in 1974. 147 did not generate sufficient revenues to cover “fully allocairu’ costs” and 58 failed to cover “in- cremental costs”. In the complete analysis, United jtidged that 21 of the 58 incrementally unprofitable markets and 58 of the 89 remaining unprofxtable markets would be retained for purposes of traffic control. combining markets, operational routings. future profit potential, or for other policy reasons. With regard to the 89 remaining unprofitable markets, United stated ‘I.. . (markets) where revenue exceeded incremental costs but did not cover fully allocated costs . . . are certainly those (markets) which would come under close scrutiny as to the wisdom of contmuing service if exit were permitted, inasmuch as it
22

APPENDIX I Page 3 of 12
would not appear economically justified to purchase replacement equipment on which an adequate return was not being earned. ” In any event, United roncluded that 79 of the I-17 unprofitable markets would be retained for those purposes.
The following table summarizes the results of both the United and ATA analyses:
TABLE UNITED AIRLINES
1974 Percent of
Number of Percent Unprofitable City- Pairs of Total Markets
UA L non- seasonal markets Profitable markets
310 100% 163 53%
Unprofitable 147 47%
Retained for: Traffic control, combining markets, operational routings, and future profit potential (or policy)
Remainder
79 25% 54%
68 22% 46%
ATA TRICK 1::‘XSTRY. SIhlULATiOS 1973
Percent of Number of Percent Unprofitable City- Pairs of Total Markets
Total trunk non-seasonal markets 994 100% Profitable markets 622 63% Unprofitable 372 37%
Retained for: 2:s 25%‘0” Traffic control, combining markets, operational routings, and future profit potential (or policy)
Remainder 219 22%”
Retained for: 201 20% 5458 Traffic control, com5Zng markets, operational routi‘lgs. and future profit potential (or policy)
Remainder 171 17% 46%b’; 0 From United Airlines Analysis
23
L .- -- -- ---....----- - -

APPEiJDIX I 9PPENDIX I
APPENDIX I Page 4 of 12
Both analyses empirically determined the profitability of individual non-stop routes without regard to combined markets. As noted above United determined that 147 of its 310 non-seasonal non-stop markets (or 47%) were unprofitable on this basis. ATA found that 372 of 994 trunk non-seasonal non- stop routes (or 37%) were unprofitable on the same (non-stop) basis. United then, employing the regular judgmental processes of its scheduhng experts, determined which of the 147 unprofitable routes United would probably retain for such purposes as combining markets, traffic control. operational routings, and future profit potential. In its sttldy, ATA expressly recognized that some unprofitable routes might be held for such purposes; quantification of a specific number of such routes was outside the scope of the question posed ATA by the Subcommittee. Further, ATA lacks the scheduling expertise to apply the detailed managerial judgments required for such quantification.
Because the empirical portions of both the United and ATA analyses were performed on a non-stop route profitability basis, application of the results of Urnted’: managerio judgment process to the ATA findings provides some insight into the number of unprofitable routes that would likely bc. elimi- nated, after cons:deration of combining markets, traffic control, operational routings, and future profit potential (or policy).
As shown in the Table, applying to the 994 trunk routes the percentage of total non-stop routes which United considered would likely be elm.inated (22%0), a to‘al af 219 trunk routes would be eliminated. Further. United found that 46% of its unprofitable non-stop routes would likely be eliminated. Apply- ing this percentage to the 372 unprofitable non-stop trunk routes results in 171 or 17% of the total trunk routes. In both cases, the percentages are based on non-stop routes.
It should be noted that, iu its April 29, 1975 letter, United went on to point out that,
,I . . . this list is . . . not complete in the sense zhat we might find it desirable to withdraw service from some nominally profitable markets under a condition of free exit and ent:y. ”
Thus, the percentage of total routes that might actually be efiminated under free market conditions could be higher than the cited proportions of unprofi- table routes.
24

i
-4FPENDIX I
A PPENDM I Page 5 of 12
*eeific Comments
e ISSUE: Subsidized Routes
GAO Statements
“GAO believes these conclusions are questionable because:
-- subsidies are granted under conditions that probably would continue after deregulation. ” (pp. i, 61
‘ATA concluded that. eliminating the Civil Aeronautics Board’s regulation of airlines would risk abandonment of 826 routes flown by local service airlines because the subsidies would be discontinued. No data was presented by ATA to SUPFW~ this conclusion other than it believed this to be a consequence of de-=gulation. ” (p. 71
‘There is no evidence to support ATA’s conclusion that subsidies would cease on the 826 local service airline routes listed as candidates for abandonment. ” fp. 161 [See GAO note, p. 321
ATA did not conclude that subsidies would cease on the 826 local service z-a&es. Subsidy is granted at the discrciion of the CAB. Accordingly, it was assumed, at the time the study was made, that abolishment of the CAB remit- ing from d-regulation could result in discontinuance of subsidies. A: that time, it was the view of many proponents of deregulation that all forms of economic regulation. including subsidies, should be abolished. “Free market” proposals then being offered contained no pro;%iotls for such continuance.
Since publication of the ATA study, proposed legislation has contained or has been modified to contain vari<..ls provisions for continuing subsidy at current or even increased levels. r’> -ions implicitly recognize the fact that, without subsidy. certain r@: endangered under free market conditions.
m ISSUE: Route Interactir
GAO Statements
“GAO believes thes , are questionable because:
-- the Association did not combine different passenger _ demands over a route, or properly credit routes with
the revenue generated by providing passengers for other routes in determining that 372 routes were unprofitable. ” (P- i) [See GAO note, p. 32]
25
. -- -

APPENDIX I
APPENDIX I Page 6 of 12
“Additionally, ATA did not consider that many flights would be retained because they provide passengers and/or make aircraft available for other routes. or receive Federal sub- sidy. ” (p. ii)
“Our analysis of the ATA study showed that re-venues werr not always credited to lights from which theI. were gonerated. Thus, the profitability of some routes may be over or under- stated. ” (p. 8)
“ATA did not consider route interaction -- alternate ways of going from one city to another -- which can be accomplished with the use of one and multi-stop routes. ” (p. 8)
“To assume, as ATA did, that there is no route interaction of the kinds described above. is unrealistic and resuIts in mxxtatementof a ruute’s profitability. ATA’s conclusion that these routes are unprofitable is not supported. ” (p. 10)
“The study ignored the possibility of travel between two cities on flights making one or more stops, or on a series of con- necting flights. Like the previous method, it did not determine how many flights would be retained because they provide pas- sengers and!or make aircraft available for other routes, or receive subsidy. ” (p. ldl
“The simulation’s assessment of each route’s profitability did not consider combining traffic flows between several city- pairs over a single multi-stop route, nor did it properly credit each non-t::op mute with the revenue it generated by providing p ,sengers for other routes. ” (p. 161
“Additionally, ATA did not consider that many flights would be retained because they provide passengers and/ or make aircraft available for other route ., OF receive Federal sub- sidy. ” (P- 17) [See GAO note, p. 321
As the GAO report properly points out, the ATA study treated each non-stop route as a separate entity in determining profitability. As pre- viously noted, which of the 372 roiites found unprofitable might be retained because they “feed” other routes (thereby rendering the latter profitable) was not determined through direct application of the model. However. the ATA study report explicitly stated that a portion of the unprofitable routes in fact could be retained for these purposes -- srlch determination in accordance with individual carrier marketing decisions to best suit its needs under the circum- stances within which it would be operati g.
26

APPENDIX I Page 7 of 12
A multi-stop route is simply a series of non-stops flown in sequence. By using service segment data derived from CAB ER-586 reports (instead of origination-destination data) for passenger flows, the cumulative effect of total passenger flow was included in the ATA simulation. The simulation assumed that the passengers flowing from unprofitable to profitable routes would remain cn the profitable routes, regardless of the disposition of the unprofitable. This assumption probably results in an inflation of earnings actually attributable te each route.
However, because the prsfitable route data does include revenue traffic which may or may not be carried in the event the “feeder” segments are no longer operated (often, today, carriers other than those operating a given profitable route “feed” that route). the effect of current route inter- action is contained in the ATA study methodology. ATA in its study scught to arrive at objective route profit data, to which individual carriers would apply bu.si.:t‘ss decision processes on a route-ky-route basis, determining which “u IX-~ 11 rble” routes they would maintain to support their own “profi- table” rn:ltk, ‘s. L
Tb.. . ‘.O report suggests that elimination of non-stop routes will not cause suba:antial diminution of total traffic, because the passengers would use a one-stop or multi-stop route in place of an eliminated non-stop. In some instances. this is true. However, 66% of the 372 unprofitable routPs listed by ATA are shorter than 500 miles with 25% shorter than 100 miles. (Attach- ment III) Because of the delays incurred in alternative one or multi-stop routings, mcst of the traffic currently carried on this 2/3 of all unprofitable routes would likely be diverted to other forms of transport. primarily auto- mobile.
Further, the CAB certificates carriers to serve routes, not cities. The figure appearing on p. 10 of the GAO report is inacccrate -- the carrier certificated to serve AB and AC is not certificated to serve BC unless ex- pressly authorized to do so. [See GAO note, p. 323
0 ISS:;E: Service on Unprofitable Routes
GAO Statements
“GAO believes these conclusions are questionable because:
-- many of the routes listed as unprofitable appear profitable because they are receiving substantial air service, by more than one airline operating without subsidy. ” (PP. iD ii) [See GAO note, p. 321
27

APPEMDIX I 4PPE?!DIY I
APPENDIX I Page 8 of 12
“Many of the 372 trunk routes ATA lists as unprofitable appear profitable because they were receiving air service which exceeded Federal minimum levels, by more than one airline operating without subsidies. ” (p.’ 10)
“As of May 1975, trunk airlines had discontinued air service on 35 of the 372 routes ATA listed as unprofitable. Recause 34 of these routes were discretionary, airlines were allowed to terminate service on these routes without CAB approval. Only one location -- required CAR approval to discontinue service.. . The fact that air service on most routes ATA listed as unprofitable was discretionary, indicates that the stability of air service on these routes is not contin- gent on CAB’s airline regulation. ” (p. 121
“Additionally, many of the 372 trunk routes listed as unprofitable appear profitable because they were receiving substantial air service, by more than one airline operating without subsioies. ” (P. 16) [See GAO note, p. 321
The GAO report indicates that the existence of service is itself evidence of profitability. The United Airlines’ findings (previously cited1 that of 310 non-seasonal markets served in 1974, 147 were unprofitable, should be sufficient evidence to refute this impression.
Whether or not carriers currently serve a route is not a sufficient criteria of profitability. Although the taper of fares was altered in the Domes- tic Passenger Fare Investigation in favor of the shorter haul routes, a consi- derable amount of cross-subsidy continues to exist in the industry. Unprofitable shorter-haul routes can be served because longer haul high-density routes pro- vide sufficient profits to offset these losses and still mainta:n an overall system profit.
As long as airlines remain profitable, even if profits are depressed below levels necessary, airline managements are reluctant to abandon por- tions of thex systems if there are reasonable prospects for future profitability. Moreover, they may not do so without specific approval of the CAB.
In recent years. the U. S. .?irlin,ps have operated under adverse financial conditions. With significant losses since 1969, Pan American, for example, has had to face up to the difficult decision to cut a large number of cities from its route system. In all, it has suspended service to 27 cities on its system in order to reduce losses.
If dcmestic carriers continue to experience overall financial difficulties. such as they have during the recent recession. the level of cross-subsidy avail- able will be diminished, and carriers will seek to abandon selected unprofitable
28

APPENDIX I
APPENDIX I Page 9 of 12
routes if so allowed by the CAB. Despite the significant procedural obstacles, carriers have abandoned 35 of the 372 routes ATA found to be unprofitable since 1973, a period of financial stress for the industry.
If unrestrained competition were to Je the rule for the domestic airline system, domestic trunks and local service carriers might well find themselves ’ in the positioii iha? Pan Am was in -- unable to contin.le Lo serve unprofitable routes because profits on the other routes become eroded by excessive service and consequent low load factors at uneconomic prices.
Some of the GAO appendix data, cited to support its position, is in error since it did not distinguish between local service airlines and commuters operating in place of local service airlines. For esample, the GAO report in- dicates 41 local service daily flights between Philadelphia and Washington, D. C. The May 1, 1975. Official Alriine Guide that was the GAO source shows only 4 local service flights from Washington to Philadelphia, and 29 commuter airline flights (26 by Ransome Airlines flying as “Allegheny Commuter” and 3 by Altairl. Washington- Raltimore flight data are similarly distorted.
0 ISSUE: Flight Reduction Estimates
GAO Statements
“GAO believes the Association’s flight reduction estimates are overstated becal- ,e it did not adequately provide for passengers of discontinued flights being diverted to other flights. ” (pm ii1
“--- the simulation provided for the diversion of passengers of disLontinued flights to some of the other nights. However, we believe the results are overstated because the simulation assumed these passengers would only use alternate flights when
-- The flight provided no .-stop service between the same points,
-- the night had available seating for the additional passengers, and
-- the time span between the discontinued and alternative flights did not exceed a specified time/distance relation- ship. ” (p. 14)
“We believe ATA’s night reduction estimates are overstated because it did not adequately provide for passengers of dis-
continued nights being divert’cd to other flights. ” (p. 16)
[See GAO note, p. 321
29

APPEtiDIX I
APPENDIX I Page 10 of 12
ATA maintains that the simulation assumptions with regard to diversion of passengers to alternate flights are valid.
The facts on which these assump:izms are based are:
-- Very few passengers will accept one-stop or multi-stop service in markets where non-stop service is available, particularly in very short-haul markets.
-- The number of pas..engers on a flight cannot exceed the seating capacity.
-- There is a relationship between time span between flights due to
frequency, distance (trip time), and demand for air service. This relationship is particularly critical in short-haul markets.
For example, an offering of only one or two f:ights a day will precipitate little demand for air service in a short-haul market even of high density, whereas hourly service in the same market will create substantial demands.
e ISSL’E: Route Abandonment
GAO Statements
“We believe these conclusions are questionable because:
-- ATA’s simulation of the trunk airline industry does not support its conclusicn that 372 routes are unprofitable. . . ” (P. 6) [See GAO note, p. 321
As noted previously, the ATA study did not forecast abandonment of the 372 trunk and 826 subsidized local service airline rot&s, but rather cited them as “candidates” for elimination under deregulation because they were found to be unprofitable under 1973 operating conditions. Continued service on those routes \-as made possible by profitable operation of other routes, or by government subsidy. They become candidates for elimination in tie event changing competitive conditions wzre to impair profitability on other routes, or subsidies were eliminated.
The question of subsidization has been discussed above. With respect to non-subsidized routes. the issue of abandonment currently is governed both by law and by economic and marketing judgment.
Section 401 Cjl of the Federal Aviation Act of 1958, as amended, states:
“NO air carrier shall 2 Jandon any route, or part thereof, for whi.h a certificate has l-aen issued by the Board.
30

APPEXDIX I 9PPEYSIY I
APPESBIX I Pagem
unless. upon the application of such air carrier, after notice and hearing, the Board shall find such aba.ldon- ment to be in the oublic interest. Any interested persoc nlay file wifh the Board a protest or memorandum of opposition to or in support of any such abandonment. The Board .m?y, by regulations or otherwise. authorize such temporary suspension of service as may be in the public interest. ”
The G-60 report sta;es (p. 11) that, of ihe 372 trunk routes listed by ATA as unprofitable (in 1973). 352 were being flown in hlay. 1975. Of these, 198 were flown by tw> or more aft-lines, leaving 154 monopoly routes. I’nder Section 401(~) of the Act, these monopoly routes could not be abandoned without Board approval. InexpIicably. the GAO report states (p. 11) that only 2 require CAB wPro=l. [See GAO note, p. 321
Further, Section 401(j) of the Act provides that, Ln the absence of CAB approval, no carrier may Ltariy abandon service to any point included in its certificate, even if such abandonment leaves that city with other certificated air service to all points formerly served. Under this interpretation, some of the unprofitable 198 routes receiving service from more than one certificated airline must be added to the Iist requiring CAB approval for abandonment.
There are. of course, reasons for not abandoning service on unprofit- able routes. As pointed out on page 9 of the ATA report, service tin such routes might be retained “for such purposes as providing feeder traffic, air- craft positioning. or market growth”. As noted above, in letters to the Sub- committee Chairman i;l i975, United Airlines stated that about 47% of its total 1974 non-seasonal rtiutes were unprofitable, and, of these. 46% would be con- sidered for deletion under condition? of de:-cguktion (see Attz zhment II). Although ATA made no soecific t=slimate of the number ofzrofitable rcut?s that might be retained to feea pzssenge.-s to other routes, it is mcorrect for the GAO to state that ATA did ilot consider this effect. ATA identified 372 routes as unprofitrhle BW? :andidates for abandonment, then stated that some weld be Fcla-ned Ior V3?3515 reasons.
l ISSC’E: Rmte sta; ility
G40 Statements
“We believe the;e cc.ILlttsiw.s are qccstiorable because:
-: the stabi;it!- af routes >l‘b listed as unprofitable d ould not change >-lbs?antially i,n<er deregulation. ” (P. 8) lSee GAO note, p. 321
--; -
APPENDIX I
APPENDIX I Page 12 of 12
The data provided by ATA in support of its conclusions. taken together with United Airlines’ findings cited above. amply demonstrate the instability of routes currently composing the air transportation network in the event of deregulation. The GAO comment is unsupported by contrary analysis.
In summary, the ATA study represented a response to the Subcommittee Chairman’s request for a list of unprofitable routes that might be abandoned. Even under adverse conditions, a carrier would likely retai-. some of the$-z loss routes on its system, because of aircraft positioning requirements or because of future growth potential. However, taking these factors into account both the ATA and the United studies show that. under deregulation, as many as 17 to 22% of the non-stop trunk routes could be deleted from aperation. This number could be higher when marginally profitable routes are also considered for abandonment in favor of more profitable opportunities.
The implications of the ATA study are important in a consideration of regulatory change; the degree to which balance within the national air transport system is maintained will directly affect the perpetuation of the pervasive air transportation networlc available today.
GAO note: Page references in this appendix refer to the draft report and do not necessarily agree with the page numbers in :inal report.
. ‘I I- - 32
3

APPENDIX I
Attachment I
Air Transport Association OF AMERICA
1709 New York Avenue. N.W. Washtngton. 0. C. 20006 Phone (202) 872-4000
April 25, 1975
Senator Edward M. Kennedy Chairman Subcommittee on Administrative
Practice and Procedure United States Senate Washington. D. C.
Dear Senator Kennedy:
During my testimony to your Subcommittee on Administrative Practice and Procedure, and subsequently by letter, you requested specific information on the impact of deregulatic.1 on the present scheduled air transportation net- work. You asked us to identify present scheduled routes where service might be reduced or eliminated if each airline could’ set its own prices and could enter or exit any market at will. Additionally, you requested further explana. tion of the “feeder line” argument and some comments on safety under deregulation.
The attached report represents the resuIts of the analysis that ATA performed in response to your requests , and includes the application of a computerized analysis of the large interpela’ed domestic trunk carrier sys- tem, We believe this information may represrnt the first aggregate analysis of its kind. Results of the analysis reveal the adverse impact on scheduled air service that mi?ht take place under ihe assumption of total deregulation that we were asked to make.
As we have discussed with members of your staff, our analysis SLOWS that under deregulation scheduled air service might be eliminated or substan- tially reduced on 1.820 non-stop routes throughout the nation. A list of these routes is attached. The 1,267 non-subsidized routes of the regional carriers were not included in this study.
Currently, trunk carriers serve 994 non-stop routes. 0f the&e, 372 could be candidates for elimination under deregulation, while nearly &l of the remaining 622 could experience sharp curtailment of service. Although a similar analysis has not been applied to the regional carriers, we have iden- tified 826 of their non-stop routes as currently receiving direct subsidy under regulatory procedures.
33
- . . -*
Senator Edward M. Kennedy Page 2.
AprG 25. 1975
It is conceivable that thC 1,198 unprofitable. and subsidized. routes might not survive m a deregulated environment except in limited instances as an adjunct to more profitable routes or under large subsidy payments by cities or the federal government.
Enclosed are maps of each of the 48 contiguous states and the District of Columbia with an identificatton of each of the routes that could be Jeopardized as’ well as a tabular listing of these routes.
Although each of the 1.198 routes would be = candldate for elimination under deregulation, it is recopnlzed that some might be held for such reasons hs feeding heavier travelled routes or aircraft positioning. Some also might be served by smaller cornmuter a:rlines. However. where such routes would remain, rhere would be 3 service Instability not present today because carriers would view these routes as .margmaI and would probably move in and out as circumstances dictated.
Our analysis has also been extended to deiermine the zmpact on levels of service iq a sltuatlon where significant fare reductions are made. \S’e have done this for the domestlc trunk system. The flndmgs show. for example, that where fares are reduced 20%, the unprofitable routes rise from 372 to 564.
Some have contended that deregulation could occur while subsId) remained. !n contrast wits today’s subsidy Ievel of less than 570 mrlllon for regional carriers only, we estimate that subsidy costs under deregulation could run as hiAh as $1 billion annually.
The analysis you requested has pr.-duced data shedding new light on load factors. The analysis shows, for example. that to raise :he average system load factor from 55% to 60%. solely by eliminating the lowest load factor routes. could requlrd dropping as many as 144,000 monthly flights, or 37% of all flights flown. If cllminatmg unprofitable routes Kerr the only criteria for raising load factors. the data show’that approximately 20,000 monthiy flights. or .% of the :-oute svstem. would need to be abandoned.
One final point of interest in the analysis i. that ?3 of the largest 100 markets of the scheduled carriers had load factors in the 60 to i?5? range. PS.l’s load factor on the Lns &geles/San Francisco routedurlng this time p’ riod was 60.0%. Similarly, If interstate scheduled carriers served only the 33 interstate high load factor routes, they could operate more profItably and at lower fares. However. service in the present U.S. 58,000 city-Parr network would be shattered.
34

APPEMXX I APPENDIX I
Senator Edward M. Kennedy Page 3.
April 25, 1975
We appreciate this opportunity to present relevant information regarding the public service impact of deregulation. We are hopeful that this information. will be reflected in the Subcommittee’s report.
Sincerely,
cc3. George W. James Senior Vice President- Economics and Finance
Attachment
3 - .__ -.. -2
-;

APPENDIX 1 ~PPErnIY I
ATTr;cHMENT II
Page 1 of 3
36

APPENDIX I APPENDIX I
ATTACHMENT fl Page 2 of 3
mdC8l hosin for mpI*.tI irr&e. ‘-.E.I? ?:.i~in:~=l 3~r&nl tow ct’mtw than current fully ~llcu nted n,rm’mc VI -1.~ inrlurlinc wwbPsd*. 0.x in’cmal rest stndles indl- catr tknt nverhmd ~$19 trnd tl) vary in the iarbg nm in the same way as xhort run Incremental costs
Some twhninl clcCnltinns mar awt~t you in interpreting the attached table. Contrlhutlnn-Tot 81 tewnue less In;rrmental cash costs tbased on system
37
.a --.. -5
-

ATTACHMENT IT Page 3 of 3
35
I

APPEW3IX
Attachment !II
i- 7409
?
2300
2200
+ 2100
h 2000
1900 I
1800
1600
1500
1400 2
1300 g ,
1200 : 4
1100 G 5
1000
900
600
39

A?PENDIX II
CiVlL AERONAUTICS BOARD
WASHINGT3K. > C SO4?0
January 24, 1977
Mr. Tienry Eschwege Director Commuility zlci Economic Development
Division United States General I! ccounting Office Washington, D. C. 80548
B-l-78
Dear Mr. Bschwege:
Here is a brief staff memorandum which responds to your letter of December 8, 1976, asking for our review and comment concerning a draft of your report, “Comments on the Air Transportation Association of America Study: Consequences of Deregulation of the Air Transport Industry. I’
The professional staff of the Civil Aeronautics Board has reviewed your draft report ant. their memorandum to me is attached.
Thank you for affording us this opportunity to comment on your report.
Enclosure
-I- !, 40
.’ ,

F,PPENCIX II
January 24. 1677
TO: The Cha lrm?n
FROM: Director, Bureau of Operating Rights
APPENDIX I I
ZE: GAO Request for Comments on Their Draft Report: “Comments on the Air Transportation Association of America Study: Co.lsequences of Deregulation of the Air Transport Lndustry. ”
The staff of the Civil Aeronaht:ts Board has reviewed the GA0 request The staff is in general agreement with the overall conclusion of the GAO that the ATLI s3.tiZ.v cannot be relied on as an estimate of the consequences of a deregulated air transport industry. In the staff’s opinion the report successfully rebutted ATA’s study on its own terms.
Rebuttal based on the study’s own terms is a totally acceptable ta -It- nique for demonstrating faulty methodology and analysis. It should be
pointed out, however, that in addition to the faulty analysis and assump- tions which the GAO has successfully refuted, both the ATA study and the GAO report failed to consider fundamental aspects of a deregulated environment. The full effects of the potential for expanded Lcheduled operations by present day intrastate carriers, commuter carriers, supplemental carriers and others was omitted. More importantly, the absolutely fundamental effects of wholly new entry and price competition were not explored. We believe these most basic mistakes in ATA’s approach should be pointed out in the GAO report, or. as an alternative, the GAO report should clearly be identified as a rebuttal of the study on its own terms.
Finally, the staff thinks the GAO report considered the effects of higher load factors only from the perspective of increased potential for denlrd se: vice on particular flights. The potential for lower fares resulting from higher load factors was not addressed.
e/r /f
i,. /‘.
f-2,
1’ *‘ :Lcrc : Bruce E. Cunningham ,.
:
.-- ---..-__ --
41
. .- . . - _ __ -
/’ /’

APPENDIX III .wr?Z;;2:Y III
OFFICE OF THE SECRETARY OF TRANSPORTATION WASHINGTON. O.C. 20590
Janmry 17, 1977
Mr. Henry Eschwege Director Community and Economic DevelopTent Division U. S. enera Accounting Office Washington, D. C. 20548
Dear Kr, Eschwege:
This is in response to your letter of December 10, 1976, requesting comments on the General Accounting Office draft report entitled, "Cornmernles on the Air TI.,nsport Association of America Study: Con- ' sequences of Deregulation of the Air Transport Industry." We have reviewed the report in detail and prepared a Department of Transportation reply.
Two copies of the reply are enclosed.
Sincerely,
25. +&4#‘~~’ \ William S. Ueffelfinger
42
I
-

APPENDIX III
DEPARTMENT 3F TRANSPORTATION REPLY --
TO -
GAO DRAFT REPOZT OF DECEMBER 10, 1976
ON -
THE AIR TRANSPCRT ASSOCIATION OF AMERICA STUDY: "CONSEQUENCES OF DEREGULATION OF THE AIR TRANSPOST INDUSTRY" __---_---____-__-
SUK4ARY OF GAO FINDINGS AND CONCLUSIONS
GAO limited their review of the Air Transport Association of America
(ATA)siudy to an assessment of ATA's conclusion that a "deregulation" of
the nation's air transport system wouid markedl:! reduce the level of ser-
vice available to the public. GAO reviewed critiqties of the ATA study
prepared by a number of recognized authorities in the field, including
that of the Civil Aeronautics Board's (CAB) Special Staff on Regulatory
Reform. They also interviewed officials from the Al:. CAB, and Lockheed
Aircraft CorporP'ion, whose "Airline System Simulation Model" was utilized
by the ATA for their study.
GAO's assessment was that the study's methodologies and assumptions
were frequently faulty to the extent that the conclusion of the ATA should
not be relied on as an estimate of ;he L3nseql.ences of deregulation.
GAO reached this conclusion by examining the 1198 routes which ATA
contends risk abandonment under deregulation. Of the 1198, 826 are sub-
sidized local service routes. GAO points out these 826 routes are claimed
by ATA to risk abandonment only because ATA makes the unfounded assumption
that deregulation implies elimination of the subsidy and the carriers will
subsequently drop service.
43
--- -_.._

ATA contends that 372 trunk routes would be subject to abandorment
because they were determined to be unprofitable or marginal on the basis of
ATA's ccmputer simulation of tne trunk nettiork. GAO concluded that the
simulation was defecti in ',hat the marginal or unprofitable routes were
not credited with revenues from passengers generated by other routes on
a conne$ting or multi-stop flight basis. Further, GAO examined-the 372
routes and found that a great majority received a level of service (flight
frequency) which was discretionary on the part of the airlines. More than
half of the 372 routes were found to be served by two or mnrrl airlines.
Further, GAO found th?t service contiriued to be provided at a discretionary
level after a two year period from the base year for the study.
GAO suggests that this evidence indicates these routes are,not ;:n-
profitable and unstable.
GAO's assessment is that the ATA conclusion is faulty.
DEPARTMENT OF TRANSPOPTATION POSITION STATEMENT
The GAO study is a useful addition to the substantial number of re-
riews of the ATA study undertaken by various academic and government sources.
The DOT is in agreement with GAO's position that the ATA study's methodologies.,
assumptions and conclusions are frequently faulty. i-he DOT is hopeful that
the WI study will be published and released as soo- as possible. Of part'-
cular value Is the GAO analysis of the service available over the 372 trunk
routes tne ATA suggests are unprofitable. The GAO conclusions and analysis
are similar in nature to a number of d er reviews of the ATA study.
Robert Henri Binder Assistant Secretary for
Policy, plans anti International iffairs
44

!!?PEPIDIX IV APPTVDIX IV
?JAY 13 lr75 FLIGHT FFZVENCIES ON ---,-L--,-----------------------
ROUTES LISTED BY AT4 -------------------
AS RISPIMG ABAVGGS+-E?T --------_-___---_--
City-pair ------
Akron, Chio - Cleveland, Ohio
Akron, Ohio - Pittsburgh, ?a.
Akron, Ohio '- New Yolk, k.Y.
Akron, Ohio - Youngstown, Ohio
Albany, N.Y. - New York, N.Y.
4lbuguerque, NV. Mex. - Amsrillo, Tex.
Albuquerque, N. ?!ex. - El Paso, Tex.
Aiexanaria, La. - &ton Rouge, La.
Alexandria, La. - Shreveport, L.z.
Allentown, Pa. - Cleveland, Ohio
Ailentown, Pa. - Washington, 3.C.
Allentown, Pa. - Wilkes Sarre, Pa;
Amarillo, Tex. - Lubbock, Tex.
Amarillo, Tex. - Wichita, Kens.
Asheville, N.C. - Atlanta, Ga.
5ailv fliqhts -------"--------- Trunk Local service
ilistances ;niles ------
40
70
396
47
136
airline airline flights flights ----- ---_-
277 2
224 12
9iJ 6
116 2
339 1
151
50
108
292
164
----- -_--- _._ - . . -_._ . .-
45
0
7
S
0
15
0
4
r .I
0
11
-

f
APPENEIX IV PFPENCIX IV
Distances City-pair miles -----__-_ ---------
Asheville, N.C. - Charleston, \<. Va. 209
Asheville, N.C. - Knoxville, Tenn. 86
Asheville, Y.C. - Raleigh, N.C. 214
Atlanta, Ga. - Augusta, Ga. 143
Atlanta, Ga. - Rirmingham, Ala. 134
Atlanta, Ga. - Chattanooga, Term. 1~6
Atlanta, Ga. - Columbia, E.C. 192
.Atlanta, Ga. - Columbus, Ga.
Atlanta, Ga. - Greenville, S.C.
Atlanta, Ga. - Knoxville, Tenn.
83
154
152
Atlanta, Ga. - Macon, Ga.
Atlanta, Ga. -- Montogmery, Ala.
Augusta, Ga. - Charlef*on, S.C.
Augusta, i;a. - Charlotte, N.C.
Augusta, Ga. - Columbia, S.C.
79 12 0
147 22 0
116 3 0
141 8 0
63 4 2
Augusta, Ga. - Savannah, Ga.
Austin, Tex. - Dallas, Tex.
Austin, Tex. - El Paso, Tex.
Austin, Tex. - Houston, Tex.
Austin, Tex. - San Antonio, Tex.
96 3 0
183 16 8
S26 5 0
143 5 9
70 4 1
46
nailv fliahts ----i----z-- Trunk L.ccal service
airline airline flights fliahts ------ ------A-----
1 3
2 2
2 2
18 4
33 3
lI3 2
16 4
18 4
9 6
18 0
--. . _.^_ -

APPENDIX IV APPENDIX IV
Truntaily flights Local service
City-pair --- -&--
Bakersfield, Calif. - Fresno, Calif.
Bakersfield, Calif. - Los Angeles, Calif.
Bakersfield, Calif. - San Francisco, Calif.
Bakersfield, Calif. - Santa Barbara, Calif.
Baltimore, Md. - Bcffalo, N.Y.
Distances airline airline miles flights flights ------- ------ -- .--__-_ .
100 3 0
109 6 0
239 4 2
82 1 2
281 2 2
Baltimore, Md. - Hartford, Conn. 283 3 4
Baltimore, Md. - Las Vegas, Nev. 2,105 3 0
Baltimore, Md. - New Haven, Conn. 247 . 0 0
Baltimore, Md. - Newport pews, Vd. 141 2 0
Baltimore, Md. - New York, N.Y. 179 12 12
Baltimore, Md. - Norfolk, Va. 159 0 0
Baltimore, Md. - Philadelphia, Pa. 96 12 11
Baltimore, Md. - Raleigh, N.C. 255 2 0
Baltimore, Yd. - Rochester, ti.Y. 277 2 1
Baltimore, Md. - Seattle, Wash. 2,334 2 0
Baltimore, Md. - Washington, D.C. 37 8 18
Bangor, Maine - Portland, Maine 109 5 0
Baton Rouge, La. - Birmingham, Ala. 332 0
Baton Roughe, La. 0
- New Orleans, La. 65 4
Baton Rouge, La. - 9
Shreveport, La. 206 4 0
L
47

APPEMDIX IV
.
I
City-h: --
aeaumont, Tex. - Houston, Tex.
Beaumont, Tex. - Shreveport, La.
Billings, Mont. - Hozeman, Mont.
Billings, Mont. - Casper, Wyo.
Billings, Mont. - Fargo, N. Dak.
Billings, Mont. - Great Falls, Mont.
Billings, Mont. - Helena, Mont.
Hillings, Mont. - Sheridan, Wyo.
Birmingham, Ala. - Knoxville, Tenn.
Birmingham, Ala. - Monroe, La.
Birmingham, Ala. - Nashville, Tenn.
Birmingham, Ala. - Pensacola, Fla.
Bismarck, N. Dak. - Fargo, N. Dak.
Bismarck, N. Dak. - Jamestown, W. Dak.
Bosie, I;iaho - Pendleton, Oreg.
Boise, Idaho -
DistanLcs miles --------
DaiQ fl iahts --- ------- Trunk Local service
airline airline f 1 iclhts a--i_- f 1 ights --------_-__-
79 0 5
172 0 0
12b 4 2
225 2 5
565 2 0
177
174
104
221
Jl5
10 4
5 0
2 0
1 0
2 0
177 2 4
214 5 0
18? 3 0
99 ;. 0
196 2 0
Salt Lake City, Utah 291 Boise, Idaho -
Spokane, Wash. 287 Boston, Mass. -
Burlington, Vt. 181 Boston, Mass. -
Hartford, Conn. 91 Boston, Mass. -
Houston, Tex. 1,603
8 8
0 4
2 14
9 2
12 0
48

AFPEKDIX IV 4PPENDI.X TV
c itzEair --- Distances
miles ________ _
Bcston, Mass. - Manchester, N.H.
Boston, Mass. - New Bedford, Mass.
Boston, Mass. - Portland, Maine
Boston, Mass. - Providence, R.I.
Bozeman, Mont. - Butte, Mont.
Bozeman, Martt. - Helena, Mont.
Brunswick, Ga. - Jacksonville, F'la.
Brunswick, Ga. - Macon, Ga.
Brunswick, Ga. - Savannah, Ca.
E~lffalo, N.Y. - Rochester, N.Y.
Buffalo, N.Y. - Syracuse, N.Y.
Burlington, Vt. - Portland, Maine
Butte, Mont. - Great Falls, Mont.
Butte, Mont. - Helena, Mont.
Butte, Mont. - Idaho Falls, Idaho
Butte, Mont. - Salt Lake City, Utah
Butte, Mont. - Spokane, Wash.
Casper, Wyo. - Cheyenne, Wyo.
Casper, Wyo. - Denver, Colo.
Casper, Wyo. - RaDid Citv. S. Dak
4s
48
95
45,
69
65
49
170
68
55
134
155
115 -
51
169
358
265
148
232
- t --- ---- --
49
Daily flights _-w--_--i- Trunk Local service
airline airline flights flights ___A___ _____i---em
2 0
0 11
11 8
3 0
2 0
4 0
0 0
0 0
0 0
10 13
0 7
2 0
3 0
3 0
3 0
5 0
4 0
2 3
5 8
5 0
. -:
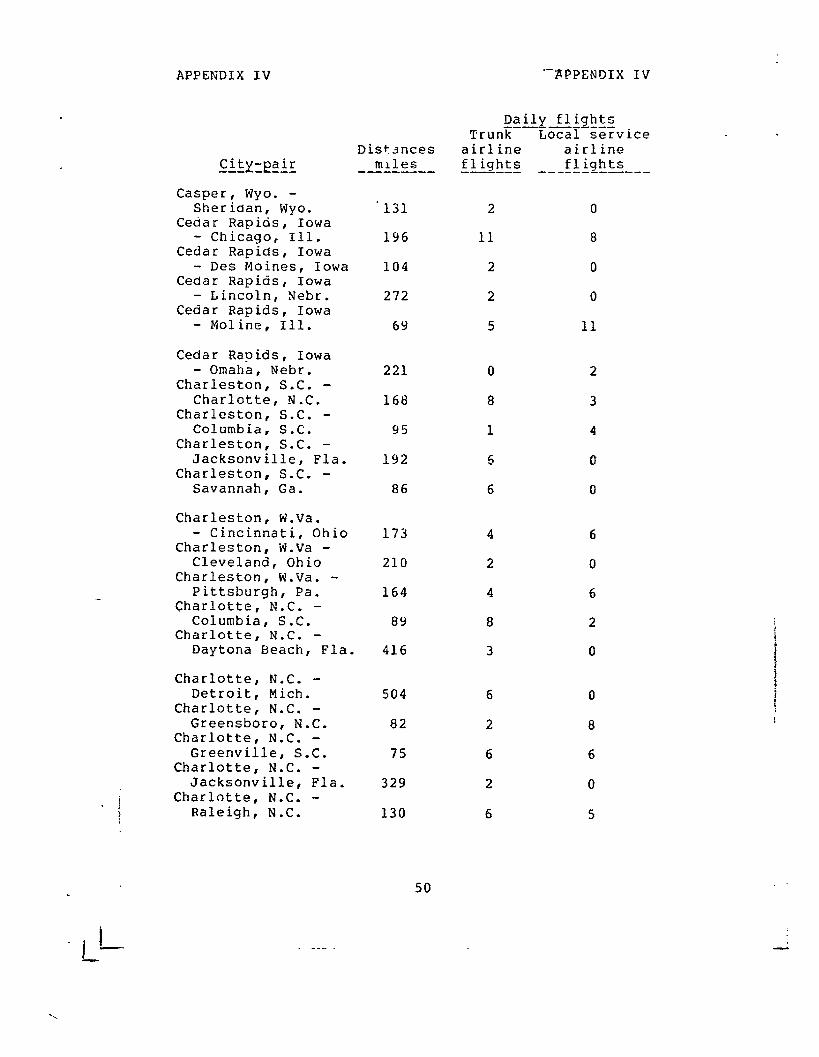
APPEKDIX IV "-APPENDIX IV
City-pair mm- - --- Distsnces
miles -------
Casper, Wyo. - Sheriaan, Wyo.
Cedar Rapids, Iowa - Chicago, Ill.
Cedar Rapids, Iowa - Des Moines, Iowa
Cedar Rapids, Iowa - Lincoln, Nebr.
Cedar Rapids, Iowa - Moline, Ill.
Cedar Rapids, Iowa - Omaha, Nebr.
Charleston, S.C. - Charlotte, N.C.
Charleston, S.C. - Columbia, S.C.
Charleston, S.C. - Jacksonville, Fla.
Charleston, S.C. - Savannah, Ga.
Charleston, W.Va. - Cincinnati, Ohio
Charleston, W.Va - Cleveland, Ohio
Charleston, W.Va. - Pittsburgh, Pa.
Charlotte, N.C. - Columbia, S.C.
Charlotte, N.C. - Daytona Beach, Fla
Charlotte, N.C. - Detroit, Mich.
Charlotte, N.C. - Greensboro, N.C.
Charlotte, N.C. - Greenville, S.C.
Charlotte, N.C. - Jacksonville, Fla.
Charlotte, N-C. - Raleigh, N.C.
131 2 0
196 11 8
104 2 0
272 2 0
69 5 11
221 0 2
168 8 3
95 1 4
192 5 0
86 6 0
173 4 6
210 2 0
164 4 6
89 8 2
416 3 0
so4 6 0
82 2 8
75 6 6
329 2 0
130 6 5
Daily flights --- -_---- Trunk Local service
airline airline fliqhts flights --A-_- ------_-----
50
. LL J

APPENDIX IV
City-pair --ei---
Charlotte, M.C. - Richmond, Va.
Chattanooga, Tenn. - Cincinnati, Ohio
Chattanooga, Tenn. - Columbus, Ohio
Chattanooga, Tenn. - Indianapolis, Ind.
Chattanooga, Tenn. - Knoxville, Tenn.
Chattanooga, Tenn. - Lexington, Ky.
Chattanooga, Tenn. - Louisville, Ky.
Cheyenne, Wyo. - Denver, Colo.
Chicago, Ill. - Cincinnati, Ohio
Chicago, Ill. - Dayton, Ohio
Chicago, Ill. - Detroit, Mich.
Chicago, 111. - Flint, Mich.
Chicago, Ill. - Fort Wayne, Ind.
Chicago, Ill. - s Grand Rapids, Mich.
Chicago, Ill. - Indianapolis, Ind.
Chicago, 111. - Lansing, Mich.
Chicago, 111. - Madison, Wis.
Chicago, Ill. - Milwaukee, Wis.
Chicago, Ill. - Moline, Ill.
Chicago, Ill. - Muskegon, Mich.
- . - _c___-._. . -
APPENDIX I Cr
Daily Flights TrunE-
---mm Local service
Distances airline airline miles flights flights --------- ------ --------w-s-
256 0 6
278 5 0
365 0 0
329 0 iI
87 10 2
210 2 0
219 2 0
96 2 11
254 28 0
231 13 2
238 44 22
223 8 . 3
157 8 0
137 12 14
177 14 5
179 8 8
109 10 19
74 4 39
139 11 8
118 4 8
51
. - __ .- -

APPENDIX IV APPENDIX IV
City-~~f: --
Chicago, Ill. - Saginaw, Mich.
Chicago, 111. - St. Louis, MO.
Chicago, 111. - South Bend, Ind.
Chicago, Ill. - Toledo, Ohio
Cincinnati, Ohio - Cleveland, Ohio
Cincinnati, Ohio - Columbus, Ohio
Cincinnati, Ohio - Dayton, Ohio
Cincinnati, Ohio - Indianapolis, Ind.
Cincinnati, Ohio - Lexington, Ky.
Cincinnati, Ohio - Los Angeles, Calif.
Cincinnati, Ohio - Louisville, Ky.
Cincinnati, Ohio - Minneapolis, Minn.
Cincinnati, Ohio - Toledo, Ohio
Cleve;land, Ohio - Columbus, Ohio
Cleveland, Ohio - Dayton, Ohio
Cleveland, Ohio - Detroit, Mich.
Cleveland, Ohio - Flint, Mich.
Cleveland, Ohio - Fort Wayne, Ind.
Clevelmd, Ohio - Grand Rapids, Mich.
Cleveland, Ohio - Indianapolis, Ind.
Distances airline Piles fliahts ------- ---A-
222 10
256 31
a4 8
214 10
226 8
airline flights --s---m-
l
43
9
0
2
116 5 2
63 4 6
98 10 3
70 5 4
1,888 8 0
83 3 13
596 2 2
181 2 0
117 0 5
16d 1 6
94 5 32
145 5 1
177 6 0
214 7 6
266 2 6
52
DaiQ f 1 ights TKUn~ --- Local service
,
_ _ - . _ 1 - - . - -
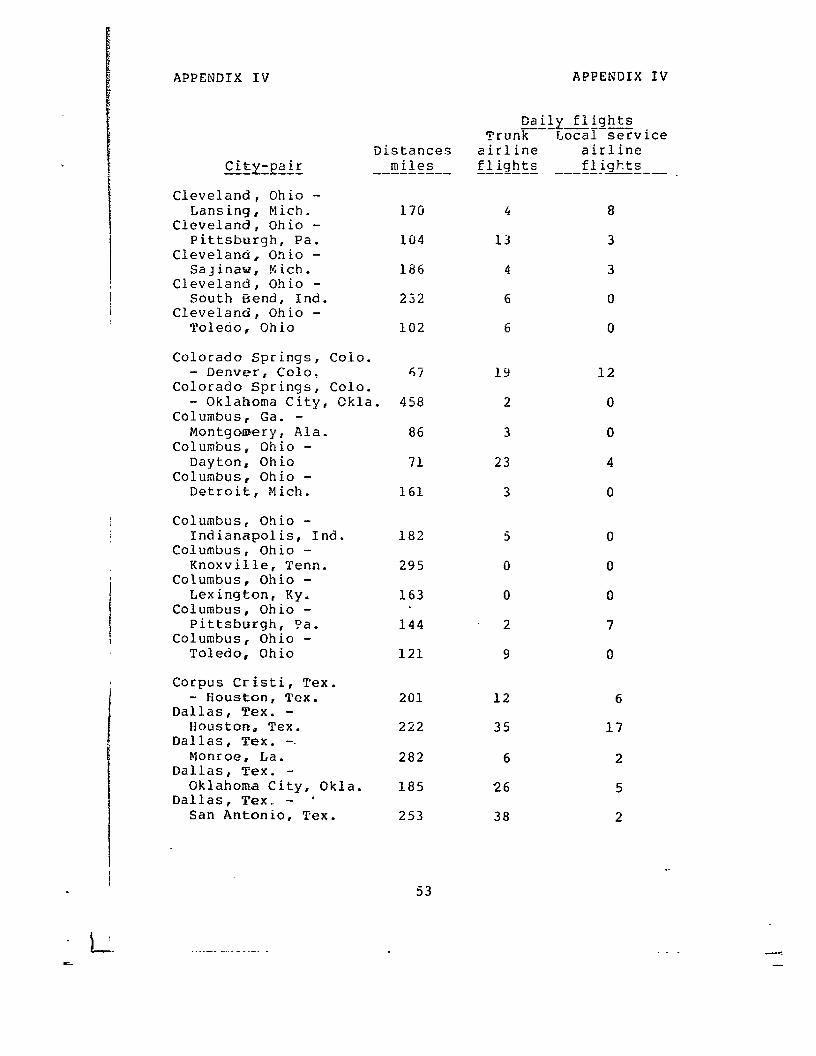
APPENDIX IV APPEh'DIX IV
City-pair - ---- Distances
miles --------_
Cleveland, Ohio - Lansing, Mich.
Cleveland, Ohio - Pittsburgh, Pa.
Cleveland,, Otlio - Saginaw, Kich.
Cleveland, Ohio - South Bend, Ind.
Cleveland, Ohio - Toledo, Ohio
Colorado Springs, Colo. - Denver, Cola,
Colorado Springs, Colo. - Oklahoma City, Ckla
Columbus, Ga. - Montgorwry, Ala.
Columbus, Ohio - Dayton, Ohio
Columbus, Ohio - Detroit, Mich.
Columbus, Ohio - Indianapolis, Ind.
Columbus, Ohio - Knoxville, Term.
Columbus, Ohio - Lexington, Ky.
Columbus, Ohio - Pittsburgh, Da,
Columbus, Ohio - Toledo, Ohio
COrpUS CrbSti, Tex. - Houston, Tex.
Dallas, Tex. - Houstons Tex.
Dallas, Tex. -. Monroe, La.
Dallas, Tex. - Oklahoma City, Okla.
Dallas, Tex, - ' San Antonio, Tex.
170 4
104 13
186 4
232 6
102 6
67 19 12
458 2 0
86 3 0
71 23 4
161 3 0
182
295
163
144
121
201 12 6
222 35 17
282 6 2
185 26 5
253 38 2
Daily flights --- ----- Trunk Local service
airline airline flights flights ------- ------.--a-
53
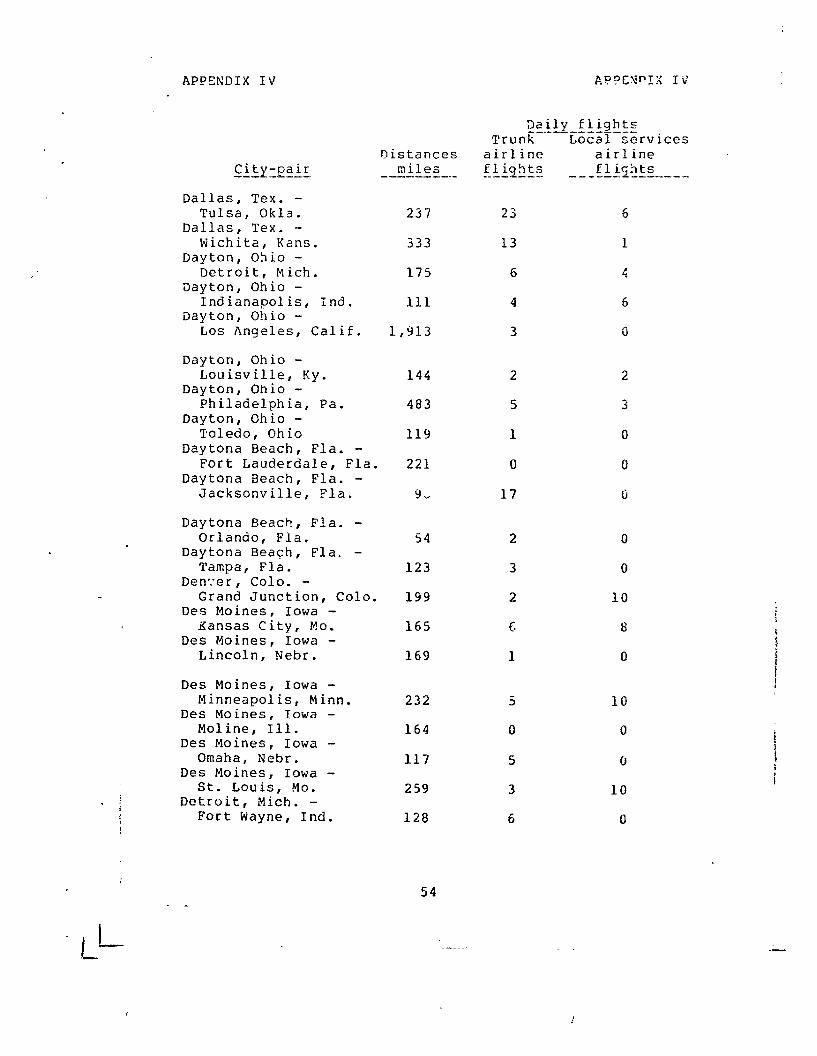
APPENDIX IV AP?CN~IX I c
City-pair --_ ----
Dallas, Tex. - Tulsa, Okla.
Dallas, Tex. - Wichita, Kans.
Dayton, Ohio - Detroit, Bich.
Dayton, Ohio - Indianapolis, Ind.
Dayton, Ohio - Los Angeles, Calif.
Dayton, Ohio - Louisville, Ky.
Dayton, Onio - Philadelphia, Pa.
Dayton, Ohio - Toledo, Ohio
Daytona Beach, Fla. - Fort Lauderdale, Fla
Daytona Beach, Fla. - Jacksonville, Fia.
Daytona Beach, Fla. - Orlando, Fla.
Daytona Beach, Fla. - Tampa, Fla.
Den'.-er, Colo. - Grand Junction, Co10
Des Moines, Iowa - itansas City, Wo.
Des Moines, Iowa - Lincoln, Nebr.
Des Moines, Iowa - Minneapolis, Minn.
Des Moines, Iowa - Moline, Ill.
Des Moines, Iowa - Omaha, Nebr.
Des Moines, Iowa - St. Louis, MO,
Detroit, Mich. - Fort Wayne, Ind.
Distances miles --------.-
237
333
175
111
1,913
144
483
119
221
9"
54
123
199
165
169
232
164
117
259
128
Daily flights ------------ Trunk Local services
airline flights -------
23
13
6
4
3
2
5
1
0
17
2
3
2
c;
1
5
0
5
3
6
airline flirits ------AL------
6
1
4
6
0
2
3
0
0
0
0
0
10
8
0
10
0
0
10
0
54

APPENDIX IV APPENDIX IV
I
Dailv flicrhts Trunk
---y--i---- Local services
Distances airline airline City-pair miles flights flights --- -A--- -------- - _-___ _----i---e-
Detroit, Mich. - Indianapolis, Ind. 241 23 U
Detroit, Nich. - Milwaukee, k is. 244 10 23
Detroit, Bich. - New Orleans, La. 936 6 5
Detroit, Rich. - Toledo, Ohio 4Y 4 4
Elko, Nev. - Ely, Nev. 116 2 0
Elko, Nev. - Reno Nev . 23~ 2 0
Cl Paso, Tex. - Houston, Tex. 669 15 1
El Paso, Tex. - Midfand, Tex. 247 8 2
El Paso, Tex. - San Francisco, Calif. 992 2 0
Cl Paso, Tex. - Tucson, 4ri.z. 268 10 0
Fly, Nev. - Salt Lake City, Utah 184 2 0
Eugene, Oreg. - Medforci, Oreg. 122 2 0
Eugene, Dreg. - Portland, Oreg. 106 4 2
Evansville, Inci. - In.*ianepolis, Ind. 135 6 6
Evansville, Ind. - Lexington, Ky. 160 0 0
Evansville, Ind. - Louisville, Ky. 98 4 0
Evansv.ille, Ind. - Memphis, Tenn. 247 4 0
Evansville, Ind. -- Pacucah, Ky. 96 2 0
Evansville, Ind. - St Lduis, Ma. 161 -4 0
Fargo, ?3. Dak. - Grand Forks, N. Oak. 74 2 4
. L

APPENDIX IV APPENDIX IV
City-Pair -- . - Distances
miles -------
Fargo, N. Dak. - Minneapolis, Minn.
Flint, Rich. - Lansing, Hich.
Flint, fiich. - Saginaw, Mich.
Fort Lauderdale, Ffa. - Miami, Fla.
Fort Lauderdale, Fla. - Qrlande,, Fla.
Fort Lautierdale, Fla. - West Palm Peach, Fla.
Fort Meyers, Fla. - Miami, Fla
Fort Meyers, Fla. - Orlando, Fla.
Fort Meyers, Fla. - Sarasota, Fla.
Fort Meyers, Fla. - Tampa, Fla.
Fort Smith, Ark. - Little Rock, Ark.
Fort Smith, Ark. - Shreveport, La.
Fort Smith, Ark. - Tulsa, Gkla.
Fort Wayne, Ind. - Indianaps: is, Ind.
Fort Wayne, Ind. - New York, N.Y.
Fort Wayne, Ind. - South Bend, Ind.
Fort Wayne, Ind. - Toledo, Ohio
Fresno, Calif. - Los Angeles, Calif.
Fresno, Calif, - San Francisco, Calif.
Gainesville, Fla. - Titusville, Fla,
223 10 0
45 2 1
43 2 4
21 24 0
178 1 1,
42 6 0
112 3 0
131 5 0
70 3 0
104 10 0
128 2 5
202 2 0
104 4 5
104 8 0
592 4 G
77
84
209
15e
121
0 0
4 0
10 0
11 2
0 0
Daily flights __---- -L--e Trunk Local services
airline airline flights ---flQ&s _ --
56
. I- I-
/

4PPENDIX 17
Citct3air --- --- Cistances
miles _--------
Grana Forks, N. Dak.- Minneapolis, Minn.
Grana Rapids, MiCh. - Saginaw, Yich.
Great Falls, Mont. - Helena, kont.
Great Falls, Mont. - Spokane, kash.
Greensboro, N.C. - Raleigh, N.C.
Sreensooro, &.C. - Richmond, Va.
Greensboro, N.C. - Roanoke, Va.
fiartford, Conn. - New York, N.Y.
tiartfora, Conn. - ProJicience, R.I.
Helena, Mont. - Missoula, Mont
Houston, Tex. - Kansas City, MO.
Houston, Tex. - San Antonio, Tex.
Puntsville, Ala. - Nashville. Term.
Idaho Falls, Idaho - Pocatello, Idaho
Idaho Falls, Idaho - Salt Lake CiLy, Utah
Indianapolis, Ind. - Lexington, Ky.
Indianapolis, Ind. - Louisville, Ky.
Indianapolis, Ind. - St. Louis, MO.
Jackson, Miss. - Meridian, Miss.
Jackson, Miss. - Monroe, La.
DaiQ f 1 iqhts m-e __------ Trunk Local services
airline airline flights flights * ------- ____-_-----mm
284
36
67
289
67
175 0 3
8s 2 4
197 16 Y
66 1 21
lti2 1 0
643
192
1’02
49
1PS
15
29
2
5 4
8 0
148
111
229
78
116
1 0
12 12
9 9
2 0
5 0
57

APL'EKDIX IV APPEXEIX 1-g
City-Eair ----- --- Jacksonp Miss. -
New Orleans, La. Jacksonville, Fla. -
Melbourne, Fla. Jacksonville, Fla. -
Orlando, Fls. Jacksonville, Fla. -
Sarascta, Fla. Jacksonville, Fla. -
Savannah, Ga.
Jacksonville, Fla. - Tallahassee, Fla.
Jacksonville, Fla. - Tampa, Fla.
Jamestown, N. Dak. - Minneapolis, ?!inn.
Kansas City, MO. - Oklahoma City, Okla.
Kansas City, MO. - Omaha, Nebr.
Kansas City, MO. - st. Louis, MO.
Kansas City, MO. - Springfield, MO.
Kansas City, MO. - Ttiscon, Ariz.
Kansas City, MO. - Tulsa, Gkla.
Kanst; Ci::y, MO. - Wichita, Kans.
Keene, N.H. - Lebanon, N.H.
Keene, H.H. - Manchester, N.H.
Keene, N-H. - New York, N.Y.
Knoxville, Tenn. - Lexington, k;y.
Knoxv.'lle, Tel,?. - Nashville, Te.?n.
Qistances miles ---_---
160
177
144
220
116
airlice airline flights fliqhts ----I --------------
3 2
0 0
10 0
3 0
5 0
159 4 0
176 8 0
292 2 0
306 12 2
165 9 8
229 26 11
159 2 7
1,035 2 1
223 11 0.
185 18 4
50 0 6
42 0 0
168 0 6
157 4 0
152 1 4
Daily fliahts ---------A- _ Trunk Locel services
58

APPENDIX Iv 4iJPCNDIY IV
I
City-nair ----iv--
Las Vegas, idev. - Los Angeles, Calif.
Las Vegas, Nev. - San Diego, Calif.
Las Vegas, Nev. - Tampa, Fla.
Lawton, Ckla. - Oklahoma City, Ckla.
Lawton, Okla. - Wichita Falls, Tex.
Lebanon, V.H. - New York, N.Y.
Lexington, Yy. - Louisville, Ky.
Lincoln, Kebr. - Omaha, Nebr.
Little Rock, Ark. - Hemphis, Term.
Little Rock, Ark. - Springfield, MO.
Los Angeles, Calif. -+ Palm Springs, CaJrf.
Los Angeles, Calif. - San Diego, Calif.
Los Angeles, Calif. - Santa Barbara, Calif.
Los Angeles, Calif. - Visalia, Calif.
Louisville, Ky. - Nashville, Tenn.
Lubbock, Tex. - Midland, Tex.
Lubbock, TEX. - Wichita Falls, Tex.
Madison, Wis. - Milwaukee, Wis.
Madison, Wis. - Minneapolis, Minn.
Madison, Wis. - Rochester, Minn.
Gaily fliqhts --------7--- Trunk Local services Tlistances airline airline
miles fliqhts --A---- _--i--- fliqhts - _- __--i-- ----
227 41 23
238 6 4
1,991 4 0
73 2 3
43 2 0
212 0
63 u
55 5
130 17
185 2
110 2
lU1 56
$9 6
173 2
151 2
121 7
193 2
74 9
228 6
167 6
2
0
15
9
0
c
L -... . . _.~ ---. - -

APPENDIX IV
CiQzzair -- --- Distances
miles _---_----
Manchester, N.H. - New York, !J.Y.
Manchester, N.V. - Portland, Maine
Manchester, [U.Y. - Worcester, Mass.
Melbourne, Fla. - Miami, Fla.
Melbourne, Fla. - Orlanao, Fla.
195
75
51
160
48
Melbourne, Fla. - Tamoa, Fla.
Memphis, Tenn. - Paducah, Ky.
Merced, Calif. - Modesto, Calif.
Merced, Calif. - Visalia, Calif.
Miami, Fla. - Orlando, Fla.
117
154
34
9i
193
Miami, Fla. - Sarasota, Fla. 173
Miami, Fla. - West Palm Beach, Fla. 62
Milwaukee, Wis. - Rochester, Minn. 241
Milwaukee, Wis. - San Francisco, Calif. 1,844
Minneapolis, Minn. - Rochester, Minn. 76
Minneapolis, Minn. - Sioux Falls, S. Dak. 197
Minneapolis, Minn. - San Diego, Calif. 1,532
Missoula, Mont. - Spokane, Wash. 169
Mobile, Ala. - New O:leans, La. 129
Mobile, Ala. - Pensacola, Fla. 64
Daily fliohts _---A-------- Trunk Local services
airline airline fiiahts fliclhts -e-i-_- .--------------
7 0
2 0
2 0
2 0
17 15
7 s
17 0
6 0
3 ii
8 5
10 8
10 0
5 0
7 9
7 0
60
J

4PPEhiDIX I\I 4wwDIx IV
Citv-oair -A--__
Modesto, Calif. - San Francisco, Calif.
Moaesto, Calif - Stockton, Calif.
Moline, Ili. - Olnaha, Kebr.
Monroe, La. - Shreveport, La.
Monterey, Calif, - San Francisco, Calif.
Nashville, Tenn. - st. Louis, MO.
New Bedford, Mass. - New York, N.Y.
New Orleans, La. - Oklahoma City, Okla.
Newport News, Va. - Norfolk, Va.
Newport News, Va. - hashington, 9-C.
New York, N.Y. - Omaha, Nebr.
New York, N.Y. - Providence, R.I.
New York, W.Y. - Philadelphia, Pa.
New York, N.Y. - Tulsa, Okla.
New York, N.Y. - Worcester, Mass.
Norfolk, Va. - Washington, D.Z.
Oklahoma City, Okla. - Tulsa, Okla.
Oklahoma City, Okla. - Wichita, Kans.
Omaha, Nebr. - Portland, Oreg.
OrlanCio, Lla. - Tampa, Fla.
Distances airli,le miles --m-s--- - fliqhts -------
78 6
24 ;
280 2
105 5
77 8
airline flights --------------
0
3
0
0
6
271 3 6
164 0 8
567 2 0
23 3 4
122 7 0
1,143 4 0
143 15 2
. 84 26 11
1,231 17 0
150 6 0
149 12 6
Ill 27 5
156 10 2
1,368 4 0
80 21 0
Daily flights ------m-i-- Trunk Local services
61
-;
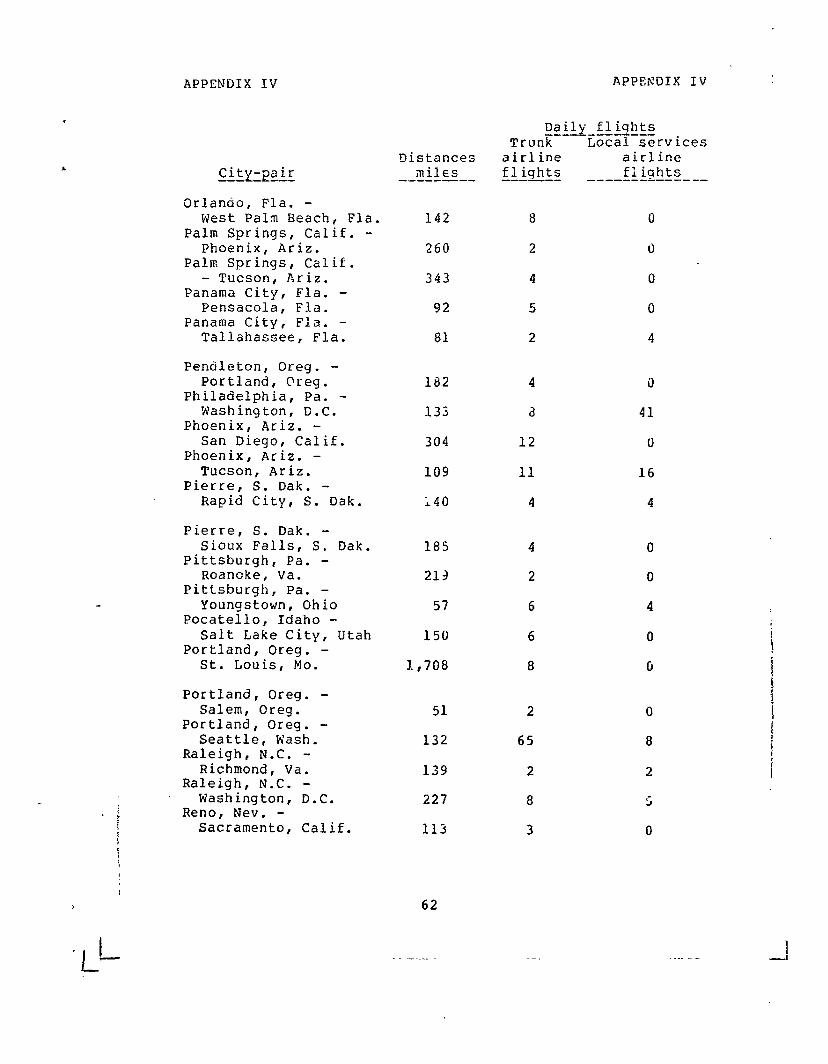
APPENDIX IV APPEITDIX IV
City-pair
Daily flights ----A-- Trunk Local services
Distances airline airline miles flights fligh-ts ------ --- ---_-- -------i----w-
Orlando, Fla. - West Palm Beach, Fla. 142 8 0
Palm Springs, Calif. - Phoenix, Ariz, 260 2 0
Palm Springs, Calif. - Tucson, Ariz. 343 4 0
Panama City, Fla. - Pensacola, Fla. 92 5 0
Panama City, Fla. - Tallahassee, Fla. 81 2 4
Pendleton, Oreg. - Portland, Oreg. 182 4 0
Philadelphia, Pa. - Washington, D.C. 133 a 41
Phoenix, Ariz. - San Diego, Calif. 304 12 0
Phoenix, Ariz. - Tucson, Ariz. 109 11 16
Pierre, S. Dak. - Rapid City, S. Dak. ;40 4 4
Pierre, S. Dak. - Sioux Falls, S. Dak. 185 4 0
Pittsburgh, Pa. - Roanoke, Va. 213 2 0
Pittsburgh, Pa. - Youngstown, Ohio 57 6 4
Pocatello, Idaho - Salt Lake City, Utah 150 6 0
Portland, Oreg. - St. Louis, MO. 1,708 8 G
Portland, Oreg. - Salem, Oreg. 51 2 G
Portland, Oreg. - Seattle, Wash. 132 65 8
Raleigh, N.C. - Richmond, Va. 139 2 2
Raleigh, N.C. - Washington, D.C. 227 8 5
Reno, Nev. - Sacramento, Calif. 113 3 0
62
._ ._ -!

I I
. I I I t I
I
APPENDIX IV APPEh’DIX IV
Distances City-pair miles ----- ------e-e
&no, Xev. - San Francisco, Calif. 192
Fichmond, Va. - hashington, D.C. 94
Rochester, FJ.Y. - Syracuse, Y.Y. 7Y
Sacramento, Calif. - San Francisco, Calif. 85
San Diego, Calif. - San Francisco, Calif. 456
San Diego, Calif. - Tucson, 9riz.
San Francisco, Calif. - Santa Barbara, Calif.
San Francisco, Calif. - Stockton, Calif.
Sarasota, Fla. - Tampa, Fla.
Seattle, h-ash. - Spokane, Wash.
367
262
65
40
223
Seattle, Wash. - Washington, G.C. 2,307
Shreveport, La. - Tulsa. Okla. 284
Tallahassee, Fla. - West Palm Beach, Fla. 364
Tampa, Fla. - West Palm Beach, Fla. 174
Tulsa, Okla. - Wichita, Kans. 132
Washington, D.C. - Wilkes-Barre, Pa. 185
Washington, D.C. - Wilmington, Del. 96
Dai5 flishts --- ----A--- Trunk Local services
alrl ine airi ine fliahts f 1 iahts -v-L--- --- e---c---- --
15 2
6 9
2 14 _*' :
7 12 -- -
.. __*
5
4 0
6 2
6 2
16 0
14 6
8 0
3 0
0 0
13 0
8 0
4 0
0 0
63 ‘
L _- _-_-^- _I- . ..-..