CECS - University of California, Irvineaicps.eng.uci.edu/papers/digital-twin.pdfSujit Rokka Chhetri...
19
UNIVERSITY OF CALIFORNIA, IRVINE CECS CENTER FOR EMBEDDED & CYBER-PHYSICAL SYSTEMS Digital Twin of Manufacturing Systems Sujit Rokka Chhetri Sina Faezi Mohammad Abdullah Al Faruque Center for Embedded and Cyber-Physical Systems University of California, Irvine Irvine, CA 92697-2620, USA {schhetri, sfaezi, alfaruqu}@uci.edu CECS Technical Report CECS TR#17-07 November 27, 2017
Transcript of CECS - University of California, Irvineaicps.eng.uci.edu/papers/digital-twin.pdfSujit Rokka Chhetri...
UNIVERSITY OF CALIFORNIA, IRVINE
CECS CENTER FOR EMBEDDED & CYBER-PHYSICAL SYSTEMS
Digital Twin of
Manufacturing Systems
Sujit Rokka Chhetri Sina Faezi
Mohammad Abdullah Al Faruque
Center for Embedded and Cyber-Physical Systems
University of California, Irvine
Irvine, CA 92697-2620, USA
{schhetri, sfaezi, alfaruqu}@uci.edu
CECS Technical Report CECS TR#17-07
November 27, 2017
2 TECHNICAL REPORT ON DIGITAL TWIN PROJECT
CONTENTS
I Introduction 4
II Digital Twin of Additive Manufacturing CPS 5II-A Digital Twin Model . . . . . . . . . . . . . . . . . . . . . . . . . . . . . . . . . . . . . . . . . . . . . . 5II-B Key Performance Indicators (KPIs) . . . . . . . . . . . . . . . . . . . . . . . . . . . . . . . . . . . . . . 5
II-B.1 Surface Texture (K1) . . . . . . . . . . . . . . . . . . . . . . . . . . . . . . . . . . . . . . . 5II-B.2 Dimension (K2) . . . . . . . . . . . . . . . . . . . . . . . . . . . . . . . . . . . . . . . . . . 7
III Keeping Digital Twin Updated 7
IV Building Digital Twin 7IV-A Sensor/ Emission Modality Selection . . . . . . . . . . . . . . . . . . . . . . . . . . . . . . . . . . . . . 7IV-B Feature Engineering . . . . . . . . . . . . . . . . . . . . . . . . . . . . . . . . . . . . . . . . . . . . . . 8
IV-B.1 Time Domain . . . . . . . . . . . . . . . . . . . . . . . . . . . . . . . . . . . . . . . . . . . 8IV-B.2 Frequency Domain . . . . . . . . . . . . . . . . . . . . . . . . . . . . . . . . . . . . . . . . 8
IV-C Sensor Positioning . . . . . . . . . . . . . . . . . . . . . . . . . . . . . . . . . . . . . . . . . . . . . . . 8IV-D Data-Driven Models . . . . . . . . . . . . . . . . . . . . . . . . . . . . . . . . . . . . . . . . . . . . . . 9
V Experimental Setup 9V-A The Test-bed . . . . . . . . . . . . . . . . . . . . . . . . . . . . . . . . . . . . . . . . . . . . . . . . . . 9
V-A.1 Sensors . . . . . . . . . . . . . . . . . . . . . . . . . . . . . . . . . . . . . . . . . . . . . . . 9V-A.2 Data Acquisition . . . . . . . . . . . . . . . . . . . . . . . . . . . . . . . . . . . . . . . . . . 10V-A.3 Data Synchronization . . . . . . . . . . . . . . . . . . . . . . . . . . . . . . . . . . . . . . . 10
V-B Test 3D Objects . . . . . . . . . . . . . . . . . . . . . . . . . . . . . . . . . . . . . . . . . . . . . . . . 11V-C Data Collection . . . . . . . . . . . . . . . . . . . . . . . . . . . . . . . . . . . . . . . . . . . . . . . . 11V-D Data Segmentation . . . . . . . . . . . . . . . . . . . . . . . . . . . . . . . . . . . . . . . . . . . . . . . 12
VI Simulation and Results for Digital Twin Models 13VI-A Digital Twin Models . . . . . . . . . . . . . . . . . . . . . . . . . . . . . . . . . . . . . . . . . . . . . 13VI-B Aliveness . . . . . . . . . . . . . . . . . . . . . . . . . . . . . . . . . . . . . . . . . . . . . . . . . . . . 13
VII Conclusion 17
References 17
SUJIT ROKKA CHHETRI et al.: TECHNICAL REPORT ON DIGITAL TWIN PROJECT (OCTOBER 2017) 3
LIST OF FIGURES
1 Digital Twin of an Additive Manufacturing System. . . . . . . . . . . . . . . . . . . . . . . . . . . . . . . . . . 52 Constant lighting environment for measuring the quality of surface texture (K1). . . . . . . . . . . . . . . . . . . 63 Last three steps (left to right) for measuring the quality of surface texture K1. . . . . . . . . . . . . . . . . . . . 64 Dynamic Data-Driven Application Systems Enabled Digital Twin of Additive Manufacturing Cyber-Physical System. 75 Classification Scores for various Sensor Position . . . . . . . . . . . . . . . . . . . . . . . . . . . . . . . . . . . 86 Experimental Setup for the Digital Twin. . . . . . . . . . . . . . . . . . . . . . . . . . . . . . . . . . . . . . . . 97 Data acquisition setup for the experimental analysis of Digital Twin models. . . . . . . . . . . . . . . . . . . . . 98 A sample snapshot of the data collected from the sensors. . . . . . . . . . . . . . . . . . . . . . . . . . . . . . . 109 Test 3D object for Digital Twin Experiment. . . . . . . . . . . . . . . . . . . . . . . . . . . . . . . . . . . . . . 1110 Segmentation of Test 3D object for Digital Twin Experiment. . . . . . . . . . . . . . . . . . . . . . . . . . . . . 1211 Printed Test Objects. . . . . . . . . . . . . . . . . . . . . . . . . . . . . . . . . . . . . . . . . . . . . . . . . . . 1312 Various test objects printed with varying flow-rates. . . . . . . . . . . . . . . . . . . . . . . . . . . . . . . . . . . 1313 Aliveness test result for Digital Twin model predicting thickness KPI for the floor and the wall. . . . . . . . . . 1414 Feature Re-ranking results for Digital Twin predicting Floor and Wall Thickness . . . . . . . . . . . . . . . . . . 1515 Aliveness test result for Digital Twin model predicting Surface KPI for the top and bottom surface of floor and
front and back surface of wall. . . . . . . . . . . . . . . . . . . . . . . . . . . . . . . . . . . . . . . . . . . . . . 1516 Surface textures (for segment number 2) with flow rate variation and the case of unaccounted trench. . . . . . . 1617 Feature Re-ranking results for Digital Twin predicting Texture for Top and Bottom Surface of the Floor . . . . . 1618 Feature Re-ranking results for Digital Twin predicting Texture for Front and Back Surface of the Wall . . . . . . 17
LIST OF TABLES
I List of sensors used for monitoring the 3D printer and its surrounding environment. . . . . . . . . . . . . . . . . 9II Summary of Environmental and Aging Degradation Parameters . . . . . . . . . . . . . . . . . . . . . . . . . . . 11
4 TECHNICAL REPORT ON DIGITAL TWIN PROJECT
Abstract
The digitization of manufacturing systems is at the crux of the next industrial revolutions. The digital representationof the “Physical Twin,” also known as the “Digital Twin,” will help in maintaining the process quality effectively by allowingeasy visualization and incorporation of cognitive capability in the system. In this technical report, we tackle two issuesregarding the Digital Twin: (1) modeling the Digital Twin by extracting information from the side-channel emissions, and(2) making sure that the Digital Twin is up-to-date (or “alive”). We will first analyze various analog emissions to figure outif they behave as side-channels, informing about the various states of both cyber and physical domains. Then, we willpresent a dynamic data-driven application system enabled Digital Twin, which is able to check if it is the most up-to-dateversion of the Physical Twin.
Index Terms
Digital Twin, Cyber-Physical Systems, Digitization, Additive Manufacturing, Machine Learning, Sensor Fusion, Dy-namic Data-Driven Application Systems
I. INTRODUCTION
Cyber-physical manufacturing systems have various cyber processes interacting with the physical domain components througha communication network [1]. The processes in the cyber domain can be monitored for each clock cyle of the computing andthe communicating component. This allows us to accurately predict the behavior of the cyber domain components. However,in the physical domain the same is not true. Monitoring physical domain components, and predicting the physical systembehavior are faced with a myriad of challenges [2], [3]. One of the major challenges arises due to the fact that the physicaldomain continuously interacts with environment, humans, etc., which changes the states of the physical components [1], [4]–[9]. Predicting these interaction and the effects of environment has been one the major research topics in the manufacturingindustry [10]–[13]. This is because these may affect the quality of the products being produced.
To overcome the problem of process control, among many others, digitization of the physical domain can be one of thesolutions [2], [14]–[16]. This real-time digital representation of the physical domain, also known as ”The Digital Twin” [3],[17], [18], will make it is easier for manufacturers to accurately predict the future system performance and plan accordinglyas well [2], [19], [20]. The future trend will be in using the capability of Internet of Things in producing massive amount ofdata to create a Digital Twin that interacts with the cyber domain [21], [22]. In fact, Gartner predicts the digitazation will bethe top trend in coming years, and the Digital Twin has been placed in the innovation trigger phase of emerging technologiesin the Hype Cycle [23]. The concept of Digital Twin was first used by NASA, whereby they wanted a Digital Twin replica ofthe physical system used for the space exploration [24]. Since then, various works have been done to create the Digital Twinof the Physical Twin [17], [25]. Authors in [26] have created Digital Twin, an ultrahigh fidelity model of individual aircraft,to predict the structural integrity and the life of the aircraft structure. Company like IBM are providing sensor systems forcreating the Digital Twin of buildings [27]. In fact, technology solutions are hitting the market for enabling creation of DigitalTwin. Ansys [28], released their technology solution for building the twin, with an example for creating the Digital Twin forpumps. Honeywell has recently presented a connected plant concept with a solution to bring all process domain knowledge tocreate a digital twin in the cloud [29]. Digital Twin technology is also being used for lifecycle engineering asset managementin [30], [31]. Authors in [32], [33] provide analysis for research needs and current status for the building blocks of the firstgeneration of the Digital Twin for additive manufacturing (or a 3D printer) system. In summary, the benefits of building andupdating a Digital Twin of a physical system has recently been acknowledge both by researchers and industries. However, theDigital Twin technology is still in its infancy, and it faces various research challenges such as:
• Understanding what variables in the physical domain can be extracted.• Knowing how to select the number and position of sensors either during design time or during the usage time (for legacy
systems).• Understanding how a Digital Twin model can be developed given the constraints of resources (such as sensors).• Figuring out when to update the Digital Twins (as lightweight as possible to meet the resource constraints), to make sure
that they can accurately predict the system performance.In order to solve these research challenges, in this research project, we provide following various solutions:• Present analysis of physical domain signals that can be extracted from cyber-physical manufacturing systems (SectionV-
A.1).• Perform feature engineering on signals, and data driven modeling for creating the Digital Twin (Section IV-B).• Use dynamic data-driven application systems for keeping the digital twin up-to-date and lightweight (by re-ranking and
selecting the most prominent features for building the Digital Twin) (Section IV).The first major contribution is the analysis of the analog emissions to extract information from the physical domain. These
analog emissions may behave as side-channels by leaking information [34]. Side-channels have been used to extract informationabout the cyber domain (such as secrets keys), without using brute force or weakness of the cryptographic algorithm, butrather using the physical implementation system [35]. Researchers have recently demonstrated that side-channel analysis can
SUJIT ROKKA CHHETRI et al.: TECHNICAL REPORT ON DIGITAL TWIN PROJECT (OCTOBER 2017) 5
be performed at a system level to extract valuable information about the cyber domain [36]–[43]. Since the cyber domaininformation is manifested in the physical domain, these side-channels also carry information about the cyber domain. Hence,this information can be used to build an effective Digital Twin of the system. The second contribution is providing a methodologyfor keeping the Digital Twin alive. This methodology is based on Dynamic Data-Driven Application Systems (DDDAS) [44]concepts. The DDDAS concept is used in influencing the data-driven models (in our case the Digital Twins), by providing adynamic feedback in updating the models based on the real-time data from the physical domain.
The goal of this project is to demonstrate a cognitive capability of manufacturing systems using the Digital Twin. The keytechnical challenge of modeling and updating a living Digital Twin of a Physical Twin is solved with the use of dynamicallysteered sensor data processing (selection and fusion), which uses concepts of DDDAS. This project aims to provide scientificcontribution in closing the loop between the Physical Twin and its Digital Twin for maintaining the most up-to-date virtualrepresentation of the cyber-physical manufacturing system.
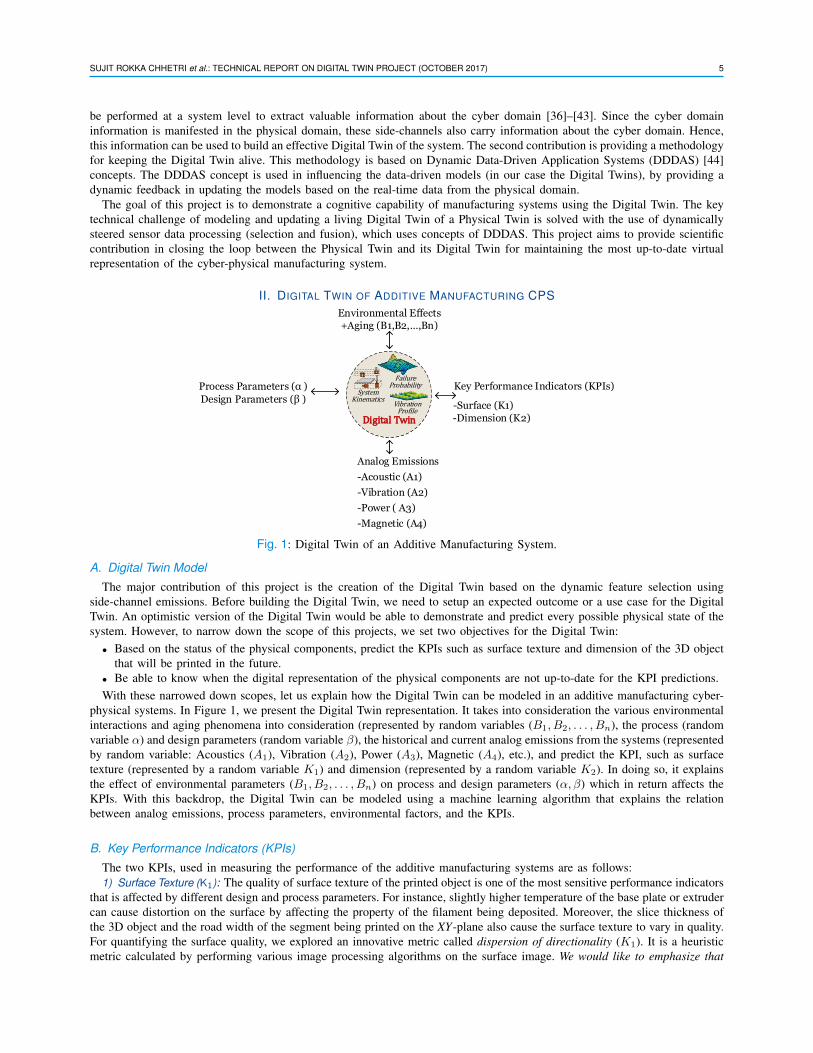
II. DIGITAL TWIN OF ADDITIVE MANUFACTURING CPS
Digital Twin
System Kinematics
Failure Probability
Vibration Profile
Digital Twin
System Kinematics
Failure Probability
Vibration Profile
Process Parameters (α )Design Parameters (β )
Environmental Effects +Aging (B1,B2, Bn)
Key Performance Indicators (KPIs)
-Surface (K1)-Dimension (K2)
Analog Emissions-Acoustic (A1)-Vibration (A2)-Power ( A3)-Magnetic (A4)
Fig. 1: Digital Twin of an Additive Manufacturing System.
A. Digital Twin Model
The major contribution of this project is the creation of the Digital Twin based on the dynamic feature selection usingside-channel emissions. Before building the Digital Twin, we need to setup an expected outcome or a use case for the DigitalTwin. An optimistic version of the Digital Twin would be able to demonstrate and predict every possible physical state of thesystem. However, to narrow down the scope of this projects, we set two objectives for the Digital Twin:
• Based on the status of the physical components, predict the KPIs such as surface texture and dimension of the 3D objectthat will be printed in the future.
• Be able to know when the digital representation of the physical components are not up-to-date for the KPI predictions.With these narrowed down scopes, let us explain how the Digital Twin can be modeled in an additive manufacturing cyber-
physical systems. In Figure 1, we present the Digital Twin representation. It takes into consideration the various environmentalinteractions and aging phenomena into consideration (represented by random variables (B1, B2, . . . , Bn), the process (randomvariable ↵) and design parameters (random variable �), the historical and current analog emissions from the systems (representedby random variable: Acoustics (A1), Vibration (A2), Power (A3), Magnetic (A4), etc.), and predict the KPI, such as surfacetexture (represented by a random variable K1) and dimension (represented by a random variable K2). In doing so, it explainsthe effect of environmental parameters (B1, B2, . . . , Bn) on process and design parameters (↵,�) which in return affects theKPIs. With this backdrop, the Digital Twin can be modeled using a machine learning algorithm that explains the relationbetween analog emissions, process parameters, environmental factors, and the KPIs.
B. Key Performance Indicators (KPIs)
The two KPIs, used in measuring the performance of the additive manufacturing systems are as follows:1) Surface Texture (K1): The quality of surface texture of the printed object is one of the most sensitive performance indicators
that is affected by different design and process parameters. For instance, slightly higher temperature of the base plate or extrudercan cause distortion on the surface by affecting the property of the filament being deposited. Moreover, the slice thickness ofthe 3D object and the road width of the segment being printed on the XY-plane also cause the surface texture to vary in quality.For quantifying the surface quality, we explored an innovative metric called dispersion of directionality (K1). It is a heuristicmetric calculated by performing various image processing algorithms on the surface image. We would like to emphasize that
6 TECHNICAL REPORT ON DIGITAL TWIN PROJECT
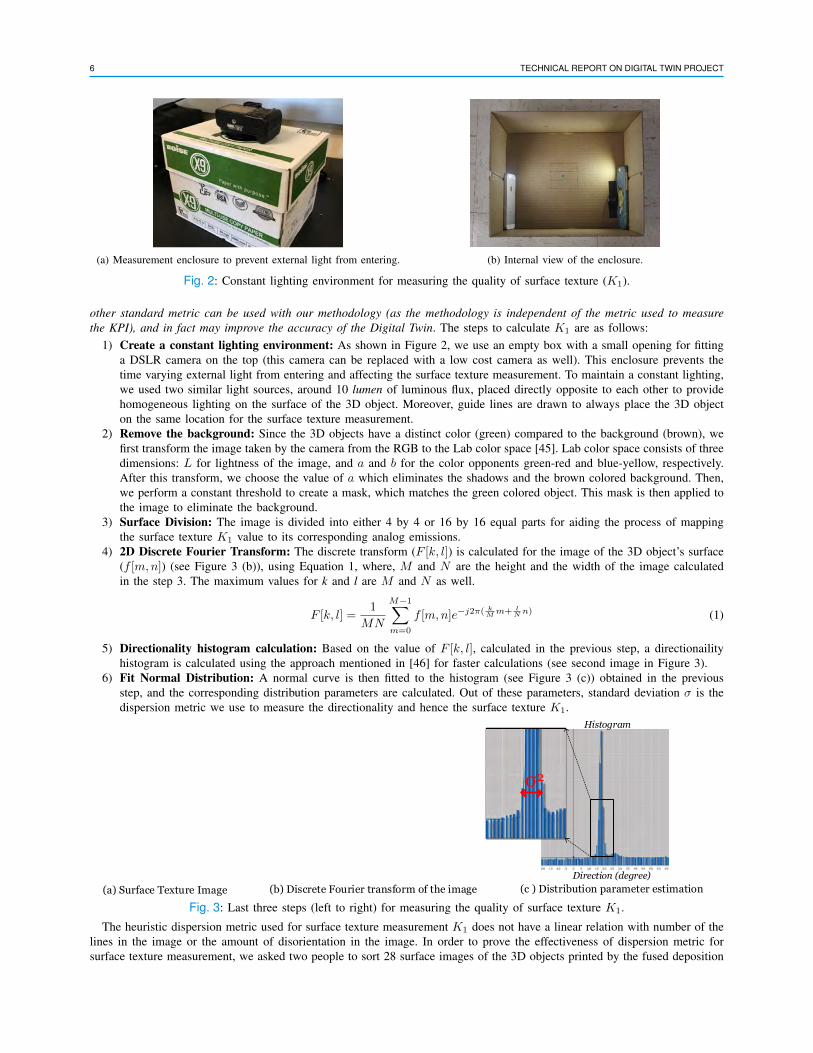
(a) Measurement enclosure to prevent external light from entering. (b) Internal view of the enclosure.
Fig. 2: Constant lighting environment for measuring the quality of surface texture (K1).
other standard metric can be used with our methodology (as the methodology is independent of the metric used to measurethe KPI), and in fact may improve the accuracy of the Digital Twin. The steps to calculate K1 are as follows:
1) Create a constant lighting environment: As shown in Figure 2, we use an empty box with a small opening for fittinga DSLR camera on the top (this camera can be replaced with a low cost camera as well). This enclosure prevents thetime varying external light from entering and affecting the surface texture measurement. To maintain a constant lighting,we used two similar light sources, around 10 lumen of luminous flux, placed directly opposite to each other to providehomogeneous lighting on the surface of the 3D object. Moreover, guide lines are drawn to always place the 3D objecton the same location for the surface texture measurement.
2) Remove the background: Since the 3D objects have a distinct color (green) compared to the background (brown), wefirst transform the image taken by the camera from the RGB to the Lab color space [45]. Lab color space consists of threedimensions: L for lightness of the image, and a and b for the color opponents green-red and blue-yellow, respectively.After this transform, we choose the value of a which eliminates the shadows and the brown colored background. Then,we perform a constant threshold to create a mask, which matches the green colored object. This mask is then applied tothe image to eliminate the background.
3) Surface Division: The image is divided into either 4 by 4 or 16 by 16 equal parts for aiding the process of mappingthe surface texture K1 value to its corresponding analog emissions.
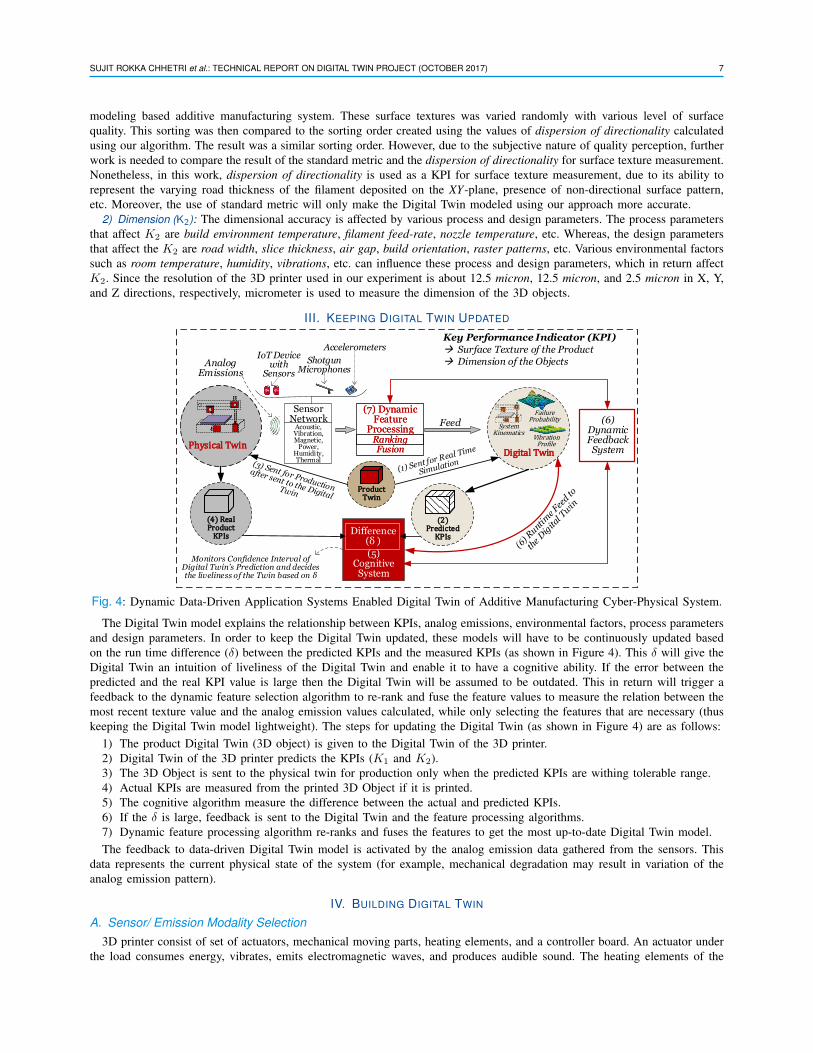
4) 2D Discrete Fourier Transform: The discrete transform (F [k, l]) is calculated for the image of the 3D object’s surface(f [m,n]) (see Figure 3 (b)), using Equation 1, where, M and N are the height and the width of the image calculatedin the step 3. The maximum values for k and l are M and N as well.
F [k, l] =1
MN
M�1X
m=0
f [m,n]e�j2⇡( kM m+ l
N n) (1)
5) Directionality histogram calculation: Based on the value of F [k, l], calculated in the previous step, a directionailityhistogram is calculated using the approach mentioned in [46] for faster calculations (see second image in Figure 3).
6) Fit Normal Distribution: A normal curve is then fitted to the histogram (see Figure 3 (c)) obtained in the previousstep, and the corresponding distribution parameters are calculated. Out of these parameters, standard deviation � is thedispersion metric we use to measure the directionality and hence the surface texture K1.
(a) Surface Texture Image (c ) Distribution parameter estimation
σ2
(b) Discrete Fourier transform of the image
Histogram
Direction (degree)
Fig. 3: Last three steps (left to right) for measuring the quality of surface texture K1.The heuristic dispersion metric used for surface texture measurement K1 does not have a linear relation with number of the
lines in the image or the amount of disorientation in the image. In order to prove the effectiveness of dispersion metric forsurface texture measurement, we asked two people to sort 28 surface images of the 3D objects printed by the fused deposition
SUJIT ROKKA CHHETRI et al.: TECHNICAL REPORT ON DIGITAL TWIN PROJECT (OCTOBER 2017) 7
modeling based additive manufacturing system. These surface textures was varied randomly with various level of surfacequality. This sorting was then compared to the sorting order created using the values of dispersion of directionality calculatedusing our algorithm. The result was a similar sorting order. However, due to the subjective nature of quality perception, furtherwork is needed to compare the result of the standard metric and the dispersion of directionality for surface texture measurement.Nonetheless, in this work, dispersion of directionality is used as a KPI for surface texture measurement, due to its ability torepresent the varying road thickness of the filament deposited on the XY-plane, presence of non-directional surface pattern,etc. Moreover, the use of standard metric will only make the Digital Twin modeled using our approach more accurate.
2) Dimension (K2): The dimensional accuracy is affected by various process and design parameters. The process parametersthat affect K2 are build environment temperature, filament feed-rate, nozzle temperature, etc. Whereas, the design parametersthat affect the K2 are road width, slice thickness, air gap, build orientation, raster patterns, etc. Various environmental factorssuch as room temperature, humidity, vibrations, etc. can influence these process and design parameters, which in return affectK2. Since the resolution of the 3D printer used in our experiment is about 12.5 micron, 12.5 micron, and 2.5 micron in X, Y,and Z directions, respectively, micrometer is used to measure the dimension of the 3D objects.
III. KEEPING DIGITAL TWIN UPDATED
Difference(δ )(5)
Cognitive System
Physical TwinPhysical TwinDigital Twin
System Kinematics
Failure Probability
Vibration Profile
Digital Twin
System Kinematics
Failure Probability
Vibration Profile
Analog Emissions
Feed (6) Dynamic Feedback
SystemRankingFusion
(7) Dynamic Feature
ProcessingRankingFusion
(7) Dynamic Feature
Processing
Sensor Network
IoT Device with
SensorsShotgun
Microphones
AccelerometersKey Performance Indicator (KPI)Æ Surface Texture of the ProductÆ Dimension of the Objects
(2) Predicted
KPIs
(2) Predicted
KPIs
(4) Real Product
KPIs
(4) Real Product
KPIs
Product Twin
Product Twin
Monitors Confidence Interval of Digital Twin s Prediction and decides the liveliness of the Twin based on δ
Acoustic, Vibration, Magnetic,
Power, Humidity, Thermal
Fig. 4: Dynamic Data-Driven Application Systems Enabled Digital Twin of Additive Manufacturing Cyber-Physical System.
The Digital Twin model explains the relationship between KPIs, analog emissions, environmental factors, process parametersand design parameters. In order to keep the Digital Twin updated, these models will have to be continuously updated basedon the run time difference (�) between the predicted KPIs and the measured KPIs (as shown in Figure 4). This � will give theDigital Twin an intuition of liveliness of the Digital Twin and enable it to have a cognitive ability. If the error between thepredicted and the real KPI value is large then the Digital Twin will be assumed to be outdated. This in return will trigger afeedback to the dynamic feature selection algorithm to re-rank and fuse the feature values to measure the relation between themost recent texture value and the analog emission values calculated, while only selecting the features that are necessary (thuskeeping the Digital Twin model lightweight). The steps for updating the Digital Twin (as shown in Figure 4) are as follows:
1) The product Digital Twin (3D object) is given to the Digital Twin of the 3D printer.2) Digital Twin of the 3D printer predicts the KPIs (K1 and K2).3) The 3D Object is sent to the physical twin for production only when the predicted KPIs are withing tolerable range.4) Actual KPIs are measured from the printed 3D Object if it is printed.5) The cognitive algorithm measure the difference between the actual and predicted KPIs.6) If the � is large, feedback is sent to the Digital Twin and the feature processing algorithms.7) Dynamic feature processing algorithm re-ranks and fuses the features to get the most up-to-date Digital Twin model.The feedback to data-driven Digital Twin model is activated by the analog emission data gathered from the sensors. This
data represents the current physical state of the system (for example, mechanical degradation may result in variation of theanalog emission pattern).
IV. BUILDING DIGITAL TWIN
A. Sensor/ Emission Modality Selection
3D printer consist of set of actuators, mechanical moving parts, heating elements, and a controller board. An actuator underthe load consumes energy, vibrates, emits electromagnetic waves, and produces audible sound. The heating elements of the
8 TECHNICAL REPORT ON DIGITAL TWIN PROJECT
3D printer, which are embedded inside the nozzle(s) and the base plate, consume electrical energy and convert it into thermalenergy. Based on these facts, we decided to monitor the physical domain by acquiring acoustic, electromagnetic, vibration,power, humidity, and temperature data, and analyzed them for amount of information revealed about the cyber domain andphysical domain states of the 3D printer. The validation for the analog emission modality selection is experimentally validatedthrough the accuracy of the Digital Twin models.
B. Feature Engineering
After selecting the emissions to be monitored in the physical domain, various features have to be extracted to reduce thesize of the raw data collected, and to improve the performance of the machine learning models (or the data-driven models)used to create the Digital Twin. In this section we will briefly describe the various features extracted in various domains.
1) Time Domain: The various features extracted in time domain are Energy, Energy Entropy, Mean Amplitude, MaximumAmplitude, Minimum Amplitude, Median Amplitude, Mode of Amplitude, Peak to Peak features (highest peaks, peak widths,peak prominence, etc.), Root Mean Square values, Skewness, Standard Deviation, Zero Crossing Rate, Kurtosis, etc (Total 114).These are extracted for each emission. Each of these features capture various properties of the signal, explaining each one ofthem is out of scope of this report, and will be left for the future work.
2) Frequency Domain: Various analog emissions are monitored in the physical domain. Each of them have different frequencyrange and characteristics. To capture all of the characteristics for all the signal, various frequency domain signals are analyzed.
• Frequency Characteristics and Short Term Fourier Transform (STFT): The frequency characteristics analyzed arebased on the short term windows and various characteristics of the frequency domain such as: Mean Frequency, MedianFrequency, Signal to Noise Ratio, Power Bandwidth, Spectral Centroid, Spectral Entropy, Spectral Flux, Spectral RollOff, etc (82 in Total).
• Frequency Characteristics and Continuous Wavelet Transform (CWT): The challenge with short term FourierTransform based features is that the trade off between time and frequency. The window frame (in time domain) andthe resolution of frequency domain features are highly dependent, and one has to be compromised for the other. Insteadof compromising these we have also analyzed continuous wavelet transform in frequency domain, and analyzed variouscharacteristics of the transform (in Total 58). Based on the result of the Digital Twin prediction and feature ranking, infuture, the continuous wavelet transform will be used to calculate the discrete wavelet transform with specific approximationand detailed coefficients.
C. Sensor Positioning
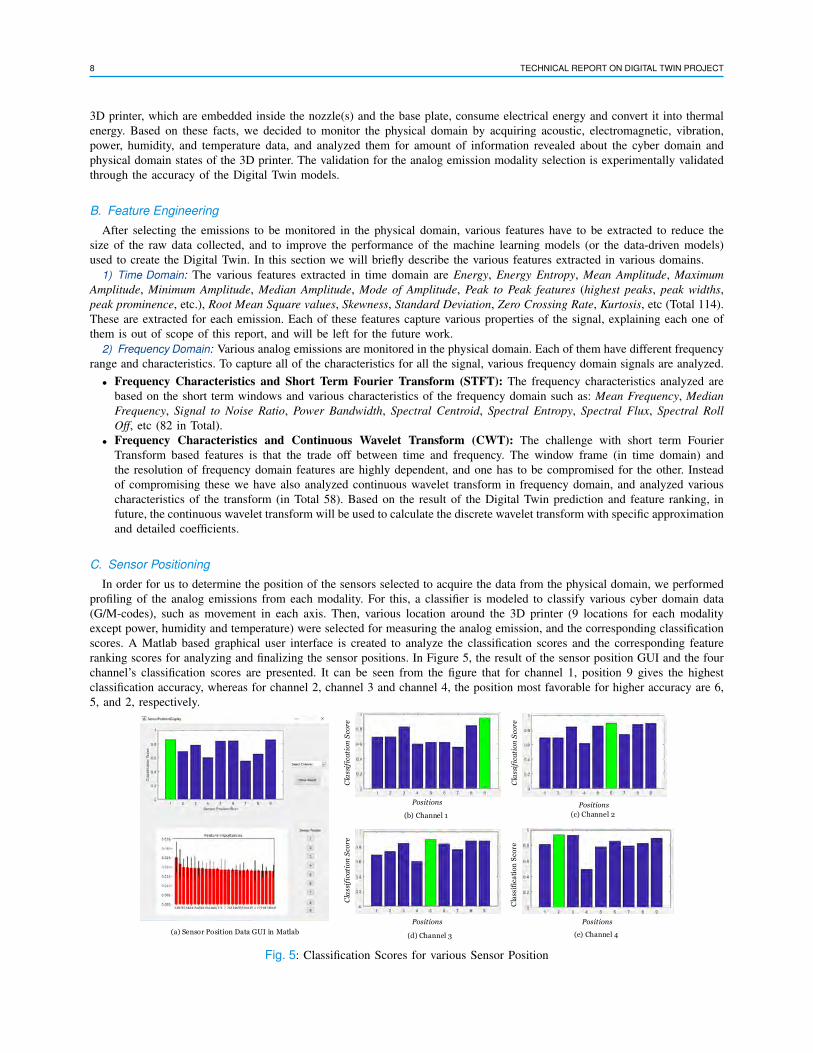
In order for us to determine the position of the sensors selected to acquire the data from the physical domain, we performedprofiling of the analog emissions from each modality. For this, a classifier is modeled to classify various cyber domain data(G/M-codes), such as movement in each axis. Then, various location around the 3D printer (9 locations for each modalityexcept power, humidity and temperature) were selected for measuring the analog emission, and the corresponding classificationscores. A Matlab based graphical user interface is created to analyze the classification scores and the corresponding featureranking scores for analyzing and finalizing the sensor positions. In Figure 5, the result of the sensor position GUI and the fourchannel’s classification scores are presented. It can be seen from the figure that for channel 1, position 9 gives the highestclassification accuracy, whereas for channel 2, channel 3 and channel 4, the position most favorable for higher accuracy are 6,5, and 2, respectively.
Cla
ssif
icat
ion
Scor
e
Cla
ssif
icat
ion
Scor
e
Cla
ssif
icat
ion
Scor
e
Cla
ssifi
catio
n Sc
ore
Positions Positions
Positions Positions
(b) Channel 1 (c) Channel 2
(d) Channel 3 (e) Channel 4(a) Sensor Position Data GUI in Matlab
Fig. 5: Classification Scores for various Sensor Position
SUJIT ROKKA CHHETRI et al.: TECHNICAL REPORT ON DIGITAL TWIN PROJECT (OCTOBER 2017) 9
D. Data-Driven Models
For creating the data-driven models of the Digital Twin, we explored various machine learning algorithms such as GradientBoosted Regressor [47], Decision Tree regressor [48], K nearest Neighbor Regressor [49], AdaBoost Regressor [50], etc. Thesemodels were used to model the relationship between the design and process parameters and the analog emissions, and theKPIs.
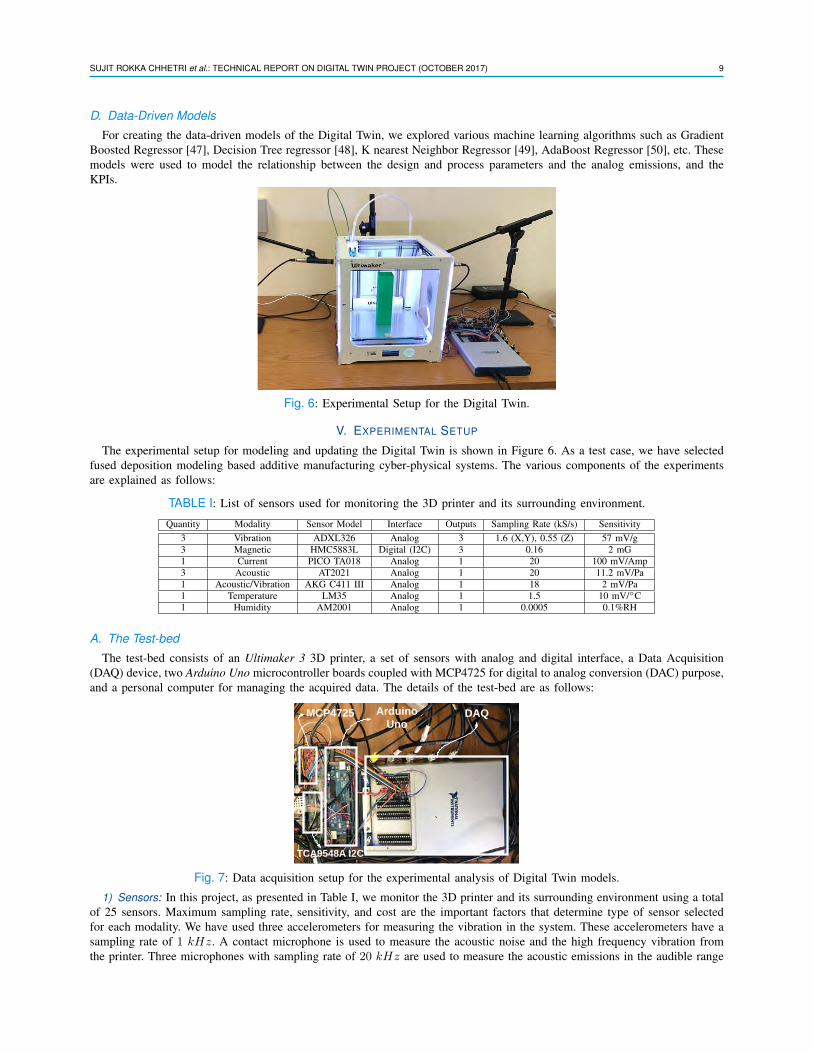
Fig. 6: Experimental Setup for the Digital Twin.
V. EXPERIMENTAL SETUP
The experimental setup for modeling and updating the Digital Twin is shown in Figure 6. As a test case, we have selectedfused deposition modeling based additive manufacturing cyber-physical systems. The various components of the experimentsare explained as follows:
TABLE I: List of sensors used for monitoring the 3D printer and its surrounding environment.
Quantity Modality Sensor Model Interface Outputs Sampling Rate (kS/s) Sensitivity3 Vibration ADXL326 Analog 3 1.6 (X,Y), 0.55 (Z) 57 mV/g3 Magnetic HMC5883L Digital (I2C) 3 0.16 2 mG1 Current PICO TA018 Analog 1 20 100 mV/Amp3 Acoustic AT2021 Analog 1 20 11.2 mV/Pa1 Acoustic/Vibration AKG C411 III Analog 1 18 2 mV/Pa1 Temperature LM35 Analog 1 1.5 10 mV/�C1 Humidity AM2001 Analog 1 0.0005 0.1%RH
A. The Test-bed
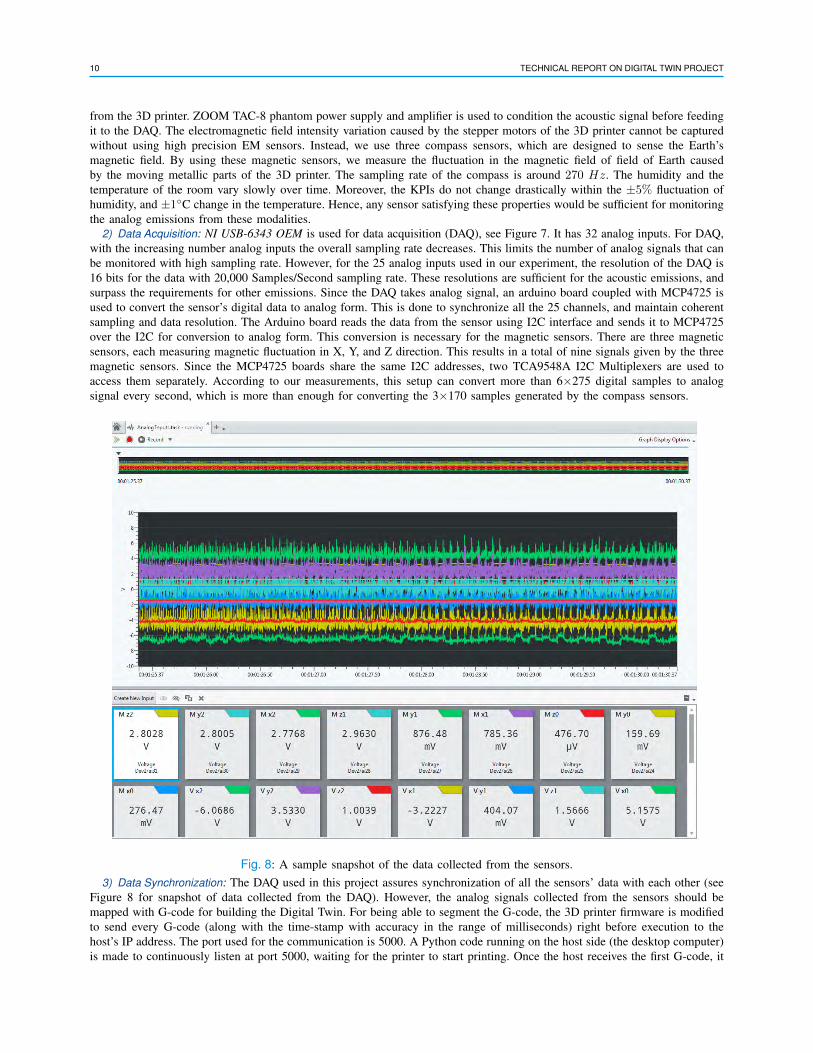
The test-bed consists of an Ultimaker 3 3D printer, a set of sensors with analog and digital interface, a Data Acquisition(DAQ) device, two Arduino Uno microcontroller boards coupled with MCP4725 for digital to analog conversion (DAC) purpose,and a personal computer for managing the acquired data. The details of the test-bed are as follows:
DAQArduino Uno
TCA9548A I2C
MCP4725
Fig. 7: Data acquisition setup for the experimental analysis of Digital Twin models.
1) Sensors: In this project, as presented in Table I, we monitor the 3D printer and its surrounding environment using a totalof 25 sensors. Maximum sampling rate, sensitivity, and cost are the important factors that determine type of sensor selectedfor each modality. We have used three accelerometers for measuring the vibration in the system. These accelerometers have asampling rate of 1 kHz. A contact microphone is used to measure the acoustic noise and the high frequency vibration fromthe printer. Three microphones with sampling rate of 20 kHz are used to measure the acoustic emissions in the audible range
10 TECHNICAL REPORT ON DIGITAL TWIN PROJECT
from the 3D printer. ZOOM TAC-8 phantom power supply and amplifier is used to condition the acoustic signal before feedingit to the DAQ. The electromagnetic field intensity variation caused by the stepper motors of the 3D printer cannot be capturedwithout using high precision EM sensors. Instead, we use three compass sensors, which are designed to sense the Earth’smagnetic field. By using these magnetic sensors, we measure the fluctuation in the magnetic field of field of Earth causedby the moving metallic parts of the 3D printer. The sampling rate of the compass is around 270 Hz. The humidity and thetemperature of the room vary slowly over time. Moreover, the KPIs do not change drastically within the ±5% fluctuation ofhumidity, and ±1�C change in the temperature. Hence, any sensor satisfying these properties would be sufficient for monitoringthe analog emissions from these modalities.
2) Data Acquisition: NI USB-6343 OEM is used for data acquisition (DAQ), see Figure 7. It has 32 analog inputs. For DAQ,with the increasing number analog inputs the overall sampling rate decreases. This limits the number of analog signals that canbe monitored with high sampling rate. However, for the 25 analog inputs used in our experiment, the resolution of the DAQ is16 bits for the data with 20,000 Samples/Second sampling rate. These resolutions are sufficient for the acoustic emissions, andsurpass the requirements for other emissions. Since the DAQ takes analog signal, an arduino board coupled with MCP4725 isused to convert the sensor’s digital data to analog form. This is done to synchronize all the 25 channels, and maintain coherentsampling and data resolution. The Arduino board reads the data from the sensor using I2C interface and sends it to MCP4725over the I2C for conversion to analog form. This conversion is necessary for the magnetic sensors. There are three magneticsensors, each measuring magnetic fluctuation in X, Y, and Z direction. This results in a total of nine signals given by the threemagnetic sensors. Since the MCP4725 boards share the same I2C addresses, two TCA9548A I2C Multiplexers are used toaccess them separately. According to our measurements, this setup can convert more than 6⇥275 digital samples to analogsignal every second, which is more than enough for converting the 3⇥170 samples generated by the compass sensors.
Fig. 8: A sample snapshot of the data collected from the sensors.3) Data Synchronization: The DAQ used in this project assures synchronization of all the sensors’ data with each other (see
Figure 8 for snapshot of data collected from the DAQ). However, the analog signals collected from the sensors should bemapped with G-code for building the Digital Twin. For being able to segment the G-code, the 3D printer firmware is modifiedto send every G-code (along with the time-stamp with accuracy in the range of milliseconds) right before execution to thehost’s IP address. The port used for the communication is 5000. A Python code running on the host side (the desktop computer)is made to continuously listen at port 5000, waiting for the printer to start printing. Once the host receives the first G-code, it

SUJIT ROKKA CHHETRI et al.: TECHNICAL REPORT ON DIGITAL TWIN PROJECT (OCTOBER 2017) 11
first saves the 3D printer’s clock data (which allows us to synchronize the G-code with the DAQ data). It then starts savingthe sensors data (in .tdms format) sent from the DAQ in chunks of ⇠ 55 MB.
Y
Z
X
Floor_Top
Wall_Front0.4 mm
Fig. 9: Test 3D object for Digital Twin Experiment.
B. Test 3D Objects
For modeling and testing the aliveness of the Digital Twin, we have customized a benchmark model (see Figure 9). Using thisbenchmark model, we measure the surface texture (K1) and dimension variation (K2), map these KPIs with the correspondinganalog emissions from the side-channels, and build the Digital Twin model. Our benchmark model has four surfaces: top andbottom for floor, and front and back for the wall. Hence, we measure the surface texture of all four surfaces. For dimension,we measure the width and the breadth of the floor, the width and the height of the wall, and the thickness of both the floorand the wall (see Figure 9).
TABLE II: Summary of Environmental and Aging Degradation Parameters
Degradation Parameter Corresponding ↵ and � Environmental+Aging Effects effectsB1 Nozzle Temperature (↵) (1) Sensor Malfunction, (2) Ex-
treme environmental temperature,(3) Heating element malfunctiondegradation
K1,K2
B2 Filament Feedrate (↵) (1) Slippage, (2) Worn out rollersdue to mechanical degradation, (3)Variation of filament thickness
K1,K2
B3 Acceleration of Stepper Mo-tors (↵)
(1) Rust, (2)Vibration due to loosecomponents, (3) Vibration due tomechanical degradation
K1,K2
B4 Power Outage (↵) (1) Short circuit of electronic com-ponents, (2) PCB failure, (3) Powersupply failure
K1,K2
B5 Printer Alignment (↵) (1) Shockwave, (2) Earthquake K1,K2B6 Humidity (↵) (1) Faulty HVAC K1,K2B7 Slicing Thickness (�) (1) Faulty Z-motor, (2) Erosion of
translation screwK1,K2
C. Data Collection
The main objective of the Digital Twin is to be able to predict the KPIs based on the environmental effects and aging.Collecting analog emissions, within a short period of time, that encompass the interaction between the system and theenvironment is a challenging task. Moreover, collecting the variation in the analog emissions due to aging requires collectingdata for a long period of time. In order to carry out the experiment within a short period of time, we have performed thefollowing tasks:
• First of all, a summary of environmental and aging effects and their corresponding impacts on the design and processparameters is listed (presented in Table II).
• Analysis of how each design and process parameter gets affected is performed.• Then design and process parameters are varied to reflect the impact of environmental and aging effects• The KPIs, corresponding to the design and process parameter variation are measured.From Table II, we were able to analyze which design and process parameters get affected by which environmental factors
and aging degradation. For the purpose of the experiment, where we want to validate the DDDAS enabled Digital Twin, weselected the degradation parameter (B2) which can be reflected in terms of varying filament flow rate. The flow rate of the
12 TECHNICAL REPORT ON DIGITAL TWIN PROJECT
system is changed to reflect the effects of environment and aging. To do this, the flow rate is changed from 20% to 200% ofthe optimal flow rate of the 3D printer with the step-size of 10%. In 3D printer, the optimal range for the flow rate lies in therange of 80% to 120%,. The flow rate is the process parameter which is calculated using the equation:
W ⇤H = A =Q
vfeed(2)
Where W is the width and H is the height of the line-segment being printed on the XY-plane, Q is the constant volumetricflow rate of the material. Q is estimated based on die swelling ration, pressure drop value and buckling pressure of the filament.vfeed is the feed velocity of the filament and is calculated as:
vfeed = !r ⇤Rr (3)
Where, !r is the angular velocity of the pinch rollers, and Rr is the radius of the pinch rollers. Based on these values, thepressure drop is calculated as follows:
Pmotor =1
24 P ⇤Q (4)
Where, Pmotor is the pressure applied by the stepper motors, 4P is the pressure drop. Hence, pressure applied by the motorneeds to be maintained for the constant volumetric flow rate. However, this pressure needs to be less than buckling pressurecalculated as follows:
Pcr =⇡2 ⇤ E ⇤ d2f16 ⇤ L2
f
(5)
Where E is the elastic modulus of the filament, df is the diameter of the filament, and Lf is the length of the filament fromthe roller to the entrance of the liquifier present in the nozzle. It is evident from these equations that maintaining a constantflow rate depends on various parameters, and environmental or aging factors affecting any of these parameters will change theflow rate, causing changes in the KPIs.
While creating a Digital Twin in a manufacturing plant, this analysis need not be performed, and data from various analogemissions that have the likelihood of behaving as side-channels can be collected. This data can then be mapped to the KPIs tobe able to model a Digital Twin that predicts the KPIs based on the varying process parameters. The variation in the processparameters are due to the environmental effects and the degradation due to aging.
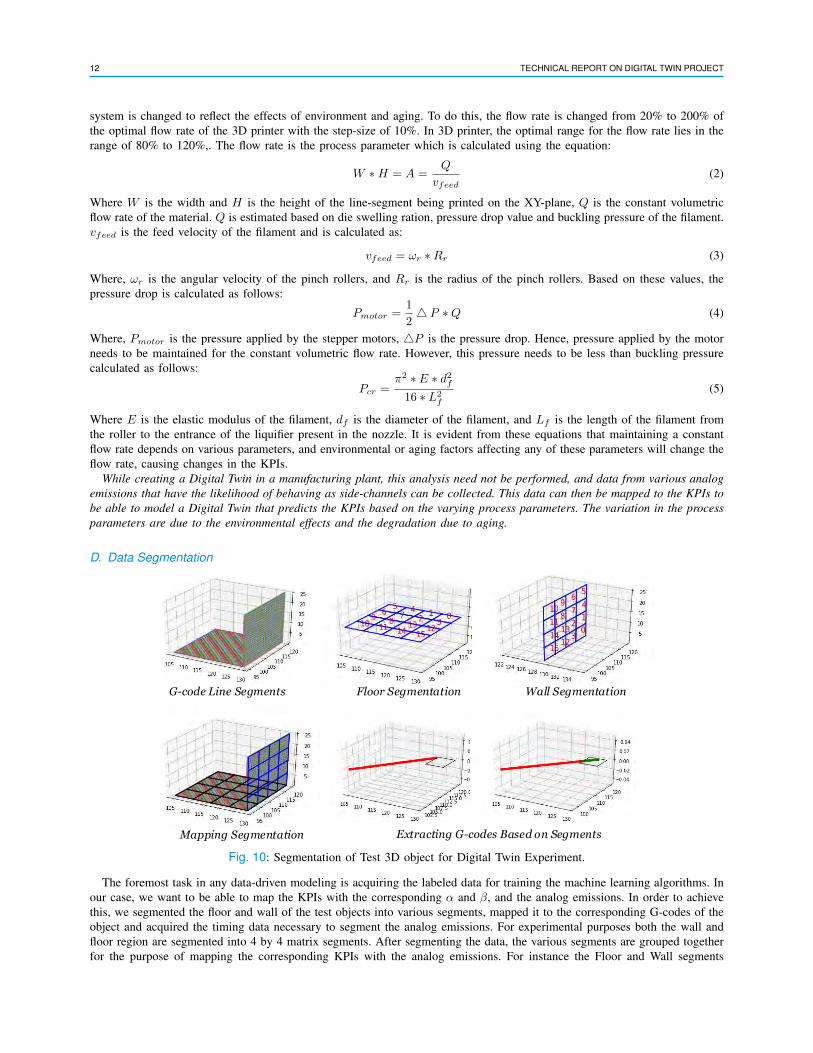
D. Data Segmentation
Floor Segmentation Wall Segmentation
Mapping Segmentation Extracting G-codes Based on Segments
G-code Line Segments
Fig. 10: Segmentation of Test 3D object for Digital Twin Experiment.
The foremost task in any data-driven modeling is acquiring the labeled data for training the machine learning algorithms. Inour case, we want to be able to map the KPIs with the corresponding ↵ and �, and the analog emissions. In order to achievethis, we segmented the floor and wall of the test objects into various segments, mapped it to the corresponding G-codes of theobject and acquired the timing data necessary to segment the analog emissions. For experimental purposes both the wall andfloor region are segmented into 4 by 4 matrix segments. After segmenting the data, the various segments are grouped togetherfor the purpose of mapping the corresponding KPIs with the analog emissions. For instance the Floor and Wall segments
SUJIT ROKKA CHHETRI et al.: TECHNICAL REPORT ON DIGITAL TWIN PROJECT (OCTOBER 2017) 13
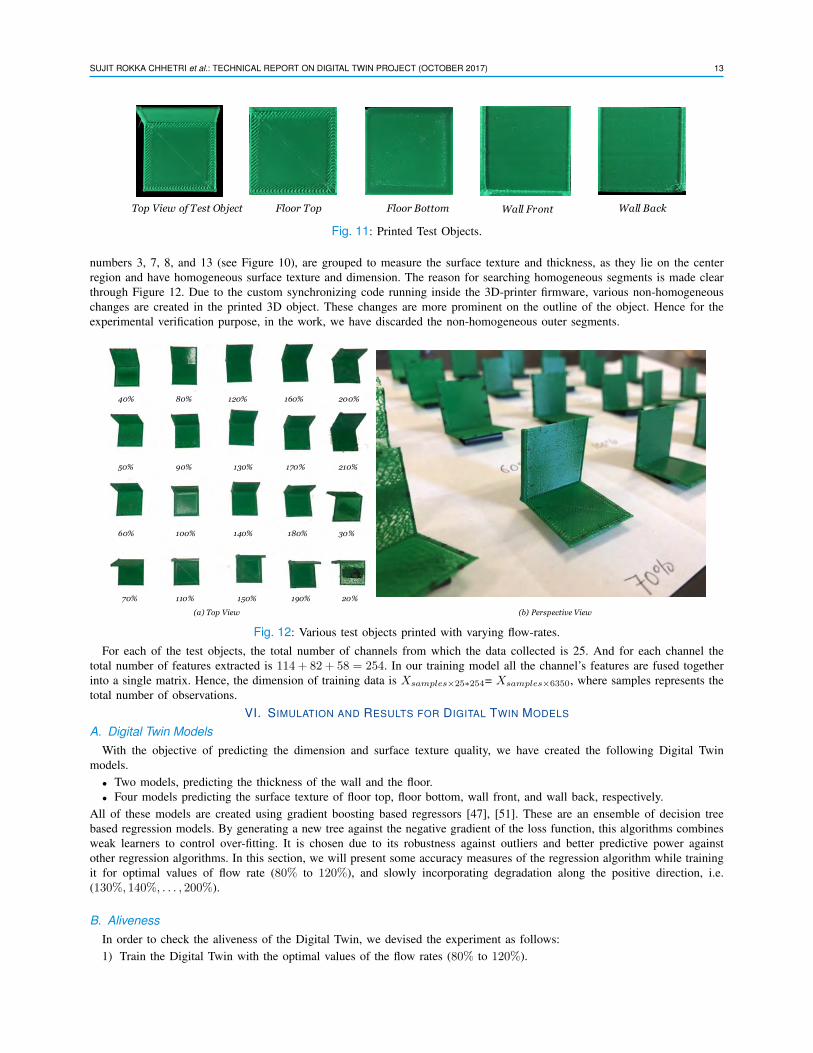
Floor BottomFloor TopTop View of Test Object Wall Front Wall Back
Fig. 11: Printed Test Objects.
numbers 3, 7, 8, and 13 (see Figure 10), are grouped to measure the surface texture and thickness, as they lie on the centerregion and have homogeneous surface texture and dimension. The reason for searching homogeneous segments is made clearthrough Figure 12. Due to the custom synchronizing code running inside the 3D-printer firmware, various non-homogeneouschanges are created in the printed 3D object. These changes are more prominent on the outline of the object. Hence for theexperimental verification purpose, in the work, we have discarded the non-homogeneous outer segments.
20%
30%
40%
50%
60%
70%
80%
90%
100%
110%
120%
130%
140%
150%
160%
170%
180%
190%
200%
210%
(b) Perspective View(a) Top View
Fig. 12: Various test objects printed with varying flow-rates.For each of the test objects, the total number of channels from which the data collected is 25. And for each channel the
total number of features extracted is 114 + 82 + 58 = 254. In our training model all the channel’s features are fused togetherinto a single matrix. Hence, the dimension of training data is Xsamples⇥25⇤254= Xsamples⇥6350, where samples represents thetotal number of observations.
VI. SIMULATION AND RESULTS FOR DIGITAL TWIN MODELS
A. Digital Twin Models
With the objective of predicting the dimension and surface texture quality, we have created the following Digital Twinmodels.
• Two models, predicting the thickness of the wall and the floor.• Four models predicting the surface texture of floor top, floor bottom, wall front, and wall back, respectively.
All of these models are created using gradient boosting based regressors [47], [51]. These are an ensemble of decision treebased regression models. By generating a new tree against the negative gradient of the loss function, this algorithms combinesweak learners to control over-fitting. It is chosen due to its robustness against outliers and better predictive power againstother regression algorithms. In this section, we will present some accuracy measures of the regression algorithm while trainingit for optimal values of flow rate (80% to 120%), and slowly incorporating degradation along the positive direction, i.e.(130%, 140%, . . . , 200%).
B. Aliveness
In order to check the aliveness of the Digital Twin, we devised the experiment as follows:1) Train the Digital Twin with the optimal values of the flow rates (80% to 120%).
14 TECHNICAL REPORT ON DIGITAL TWIN PROJECT
2) Assume an environmental degradation has caused the flow rate to vary to 200%. Predict the KPIs, with the Digital Twintrained with optimal flow rates.
3) Gradually incorporate the flow rates degradation from 130%, 140%, etc., all the way to 190%. This incorporationdemonstrates a gradual update of the Digital Twin along the run-time performance of the 3D printer.
Through this experiment we will be able to measure two things: (1) the predicting capability of the Digital Twin modeledfrom side-channel emissions, and (2) cognitive capability enabled for DDDAS by checking the aliveness of the Digital Twin.The prediction capability is demonstrated in terms of accuracy of each of the models. By gradually adding the analog emissionsin modeling the Digital Twin, we assume that we are adding the emissions that represent the physical status of the systemthat is closer to the current state. By doing so, we expect to see improvement in the prediction capability of the Digital Twinand lower � value. The lower value of � will signify that it is possible to monitor the � and infer about the aliveness of theDigital Twin model.
Since we have used the gradient boosted trees, the feature re-ranking is performed based on the relative importance of eachof the features. It is calculated as follows [47]:
I2j (T ) =
J�1X
t=1
i2j1(vt = j) (6)
Where, we first define a J-terminal node tree T , and sum the result over the non-terminal nodes t. vt is defined as the splittingvariable, and it is associated with each of the node t. The indicator function 1(.) has value 1 if its argument is true, and zerootherwise. And i
2j is defined as the estimated empirical improvement in squared error in prediction as a result of split using
the particular feature, and it is calculated as:
i2(R1, R2) =
wlwr
wl + wr(yl + yr)
2 (7)
Where, yl, yr correspond to the left and right daughter response means for the node respectively, and wl, wr are the correspond-ing sums of the weights. For collection of decision trees {Tm}M1 obtained through boosting, Equation 6 can be generalizedwith an average over all the trees as follows:
I2j =
1
M
MX
m=1
I2j (Tm) (8)
Hence, using Equation 8, the feature importance is calculated for the boosted trees, and this is used as a metric for re-rankingthe features for virtual sensor placement using dynamic data-driven application systems.
Flowrate added to nominal range (80% to 120%) for training
80-120% 80-130% 80-140% 80-150% 80-170% 80-180% 80-190% 80-200%
Mean Absolute Error (MAE) Mean Absolute Error (MAE)
Flowrate added to nominal range (80% to 120%) for training
80-120% 80-130% 80-140% 80-150% 80-170% 80-180% 80-190% 80-200%
(a) Digital Twin Model for Predicting Thickness of the Floor (b) Digital Twin Model for Predicting Thickness of the Wall
Threshold for δ can be set here!Threshold for δ can be set here!
Mea
n A
bsol
ute
Err
or (m
m)
Mea
n A
bsol
ute
Err
or (m
m)
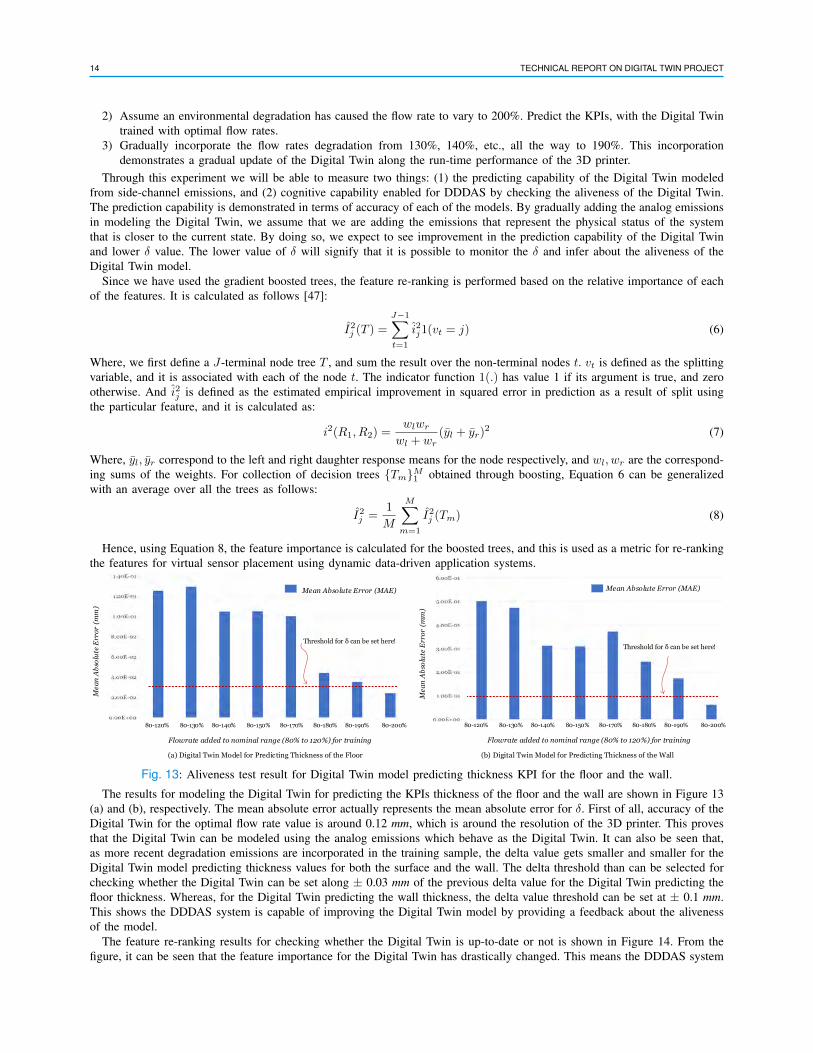
Fig. 13: Aliveness test result for Digital Twin model predicting thickness KPI for the floor and the wall.The results for modeling the Digital Twin for predicting the KPIs thickness of the floor and the wall are shown in Figure 13
(a) and (b), respectively. The mean absolute error actually represents the mean absolute error for �. First of all, accuracy of theDigital Twin for the optimal flow rate value is around 0.12 mm, which is around the resolution of the 3D printer. This provesthat the Digital Twin can be modeled using the analog emissions which behave as the Digital Twin. It can also be seen that,as more recent degradation emissions are incorporated in the training sample, the delta value gets smaller and smaller for theDigital Twin model predicting thickness values for both the surface and the wall. The delta threshold than can be selected forchecking whether the Digital Twin can be set along ± 0.03 mm of the previous delta value for the Digital Twin predicting thefloor thickness. Whereas, for the Digital Twin predicting the wall thickness, the delta value threshold can be set at ± 0.1 mm.This shows the DDDAS system is capable of improving the Digital Twin model by providing a feedback about the alivenessof the model.
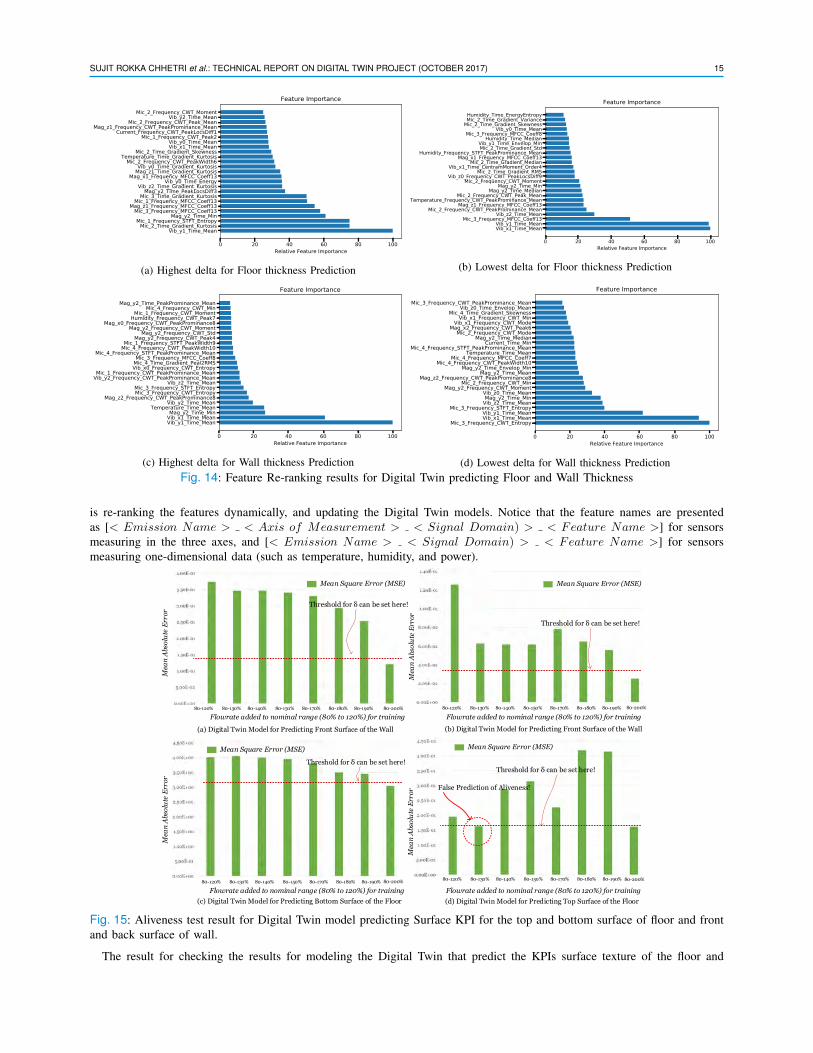
The feature re-ranking results for checking whether the Digital Twin is up-to-date or not is shown in Figure 14. From thefigure, it can be seen that the feature importance for the Digital Twin has drastically changed. This means the DDDAS system
SUJIT ROKKA CHHETRI et al.: TECHNICAL REPORT ON DIGITAL TWIN PROJECT (OCTOBER 2017) 15
(a) Highest delta for Floor thickness Prediction (b) Lowest delta for Floor thickness Prediction
(c) Highest delta for Wall thickness Prediction (d) Lowest delta for Wall thickness PredictionFig. 14: Feature Re-ranking results for Digital Twin predicting Floor and Wall Thickness
is re-ranking the features dynamically, and updating the Digital Twin models. Notice that the feature names are presentedas [< Emission Name > < Axis of Measurement > < Signal Domain) > < Feature Name >] for sensorsmeasuring in the three axes, and [< Emission Name > < Signal Domain) > < Feature Name >] for sensorsmeasuring one-dimensional data (such as temperature, humidity, and power).
Flowrate added to nominal range (80% to 120%) for training80-120% 80-130% 80-140% 80-150% 80-170% 80-180% 80-190% 80-200%
(a) Digital Twin Model for Predicting Front Surface of the Wall
Threshold for δ can be set here!
Mea
n Ab
solu
te E
rror
Mean Square Error (MSE)
Mea
n Ab
solu
te E
rror
Flowrate added to nominal range (80% to 120%) for training
80-120% 80-130% 80-140% 80-150% 80-170% 80-180% 80-190%
Mean Square Error (MSE)
(d) Digital Twin Model for Predicting Top Surface of the FloorFlowrate added to nominal range (80% to 120%) for training
80-120% 80-130% 80-140% 80-150% 80-170% 80-180% 80-190%
(c) Digital Twin Model for Predicting Bottom Surface of the Floor
80-200%80-200%
Threshold for δ can be set here!Threshold for δ can be set here!
False Prediction of Aliveness!
Mean Square Error (MSE)
Mea
n Ab
solu
te E
rror
Flowrate added to nominal range (80% to 120%) for training80-120% 80-130% 80-140% 80-150% 80-170% 80-180% 80-190%
(b) Digital Twin Model for Predicting Front Surface of the Wall
Threshold for δ can be set here!
Mean Square Error (MSE)
Mea
n A
bsol
ute
Erro
r
80-200%
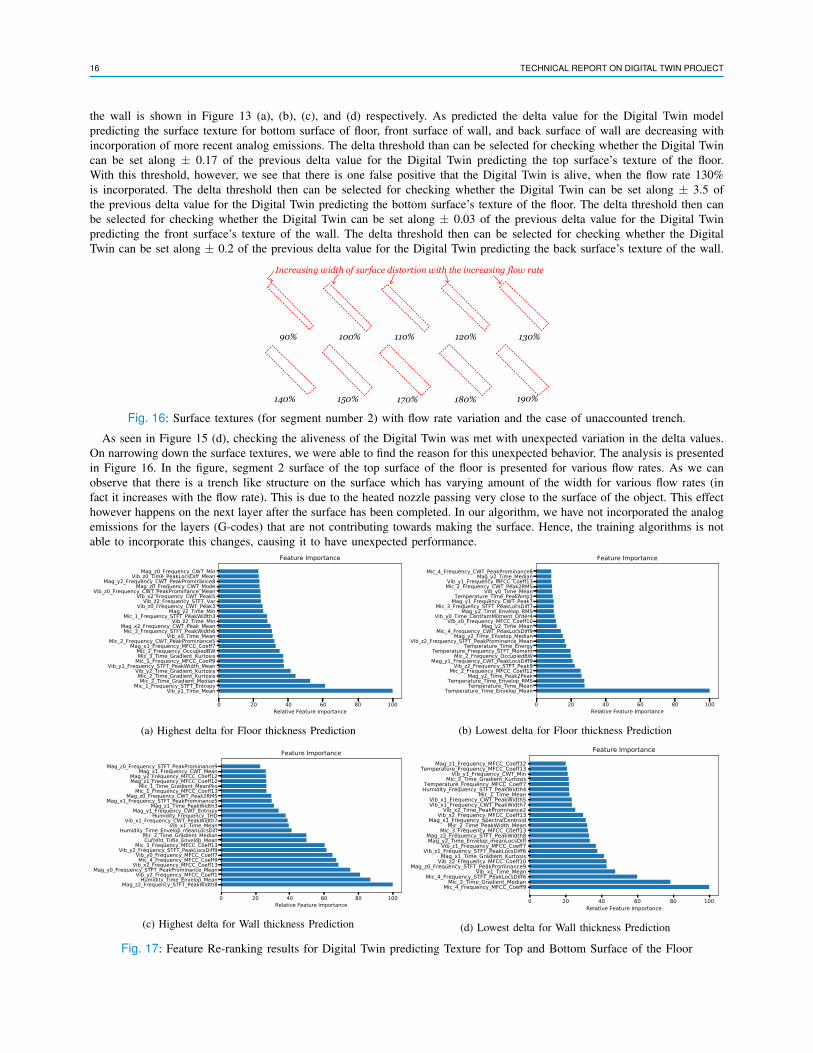
Fig. 15: Aliveness test result for Digital Twin model predicting Surface KPI for the top and bottom surface of floor and frontand back surface of wall.
The result for checking the results for modeling the Digital Twin that predict the KPIs surface texture of the floor and
16 TECHNICAL REPORT ON DIGITAL TWIN PROJECT
the wall is shown in Figure 13 (a), (b), (c), and (d) respectively. As predicted the delta value for the Digital Twin modelpredicting the surface texture for bottom surface of floor, front surface of wall, and back surface of wall are decreasing withincorporation of more recent analog emissions. The delta threshold than can be selected for checking whether the Digital Twincan be set along ± 0.17 of the previous delta value for the Digital Twin predicting the top surface’s texture of the floor.With this threshold, however, we see that there is one false positive that the Digital Twin is alive, when the flow rate 130%is incorporated. The delta threshold then can be selected for checking whether the Digital Twin can be set along ± 3.5 ofthe previous delta value for the Digital Twin predicting the bottom surface’s texture of the floor. The delta threshold then canbe selected for checking whether the Digital Twin can be set along ± 0.03 of the previous delta value for the Digital Twinpredicting the front surface’s texture of the wall. The delta threshold then can be selected for checking whether the DigitalTwin can be set along ± 0.2 of the previous delta value for the Digital Twin predicting the back surface’s texture of the wall.
90% 100% 110% 120% 130%
140% 150% 170% 180% 190%
Increasing width of surface distortion with the increasing flow rate
Fig. 16: Surface textures (for segment number 2) with flow rate variation and the case of unaccounted trench.
As seen in Figure 15 (d), checking the aliveness of the Digital Twin was met with unexpected variation in the delta values.On narrowing down the surface textures, we were able to find the reason for this unexpected behavior. The analysis is presentedin Figure 16. In the figure, segment 2 surface of the top surface of the floor is presented for various flow rates. As we canobserve that there is a trench like structure on the surface which has varying amount of the width for various flow rates (infact it increases with the flow rate). This is due to the heated nozzle passing very close to the surface of the object. This effecthowever happens on the next layer after the surface has been completed. In our algorithm, we have not incorporated the analogemissions for the layers (G-codes) that are not contributing towards making the surface. Hence, the training algorithms is notable to incorporate this changes, causing it to have unexpected performance.
(a) Highest delta for Floor thickness Prediction (b) Lowest delta for Floor thickness Prediction
(c) Highest delta for Wall thickness Prediction (d) Lowest delta for Wall thickness Prediction
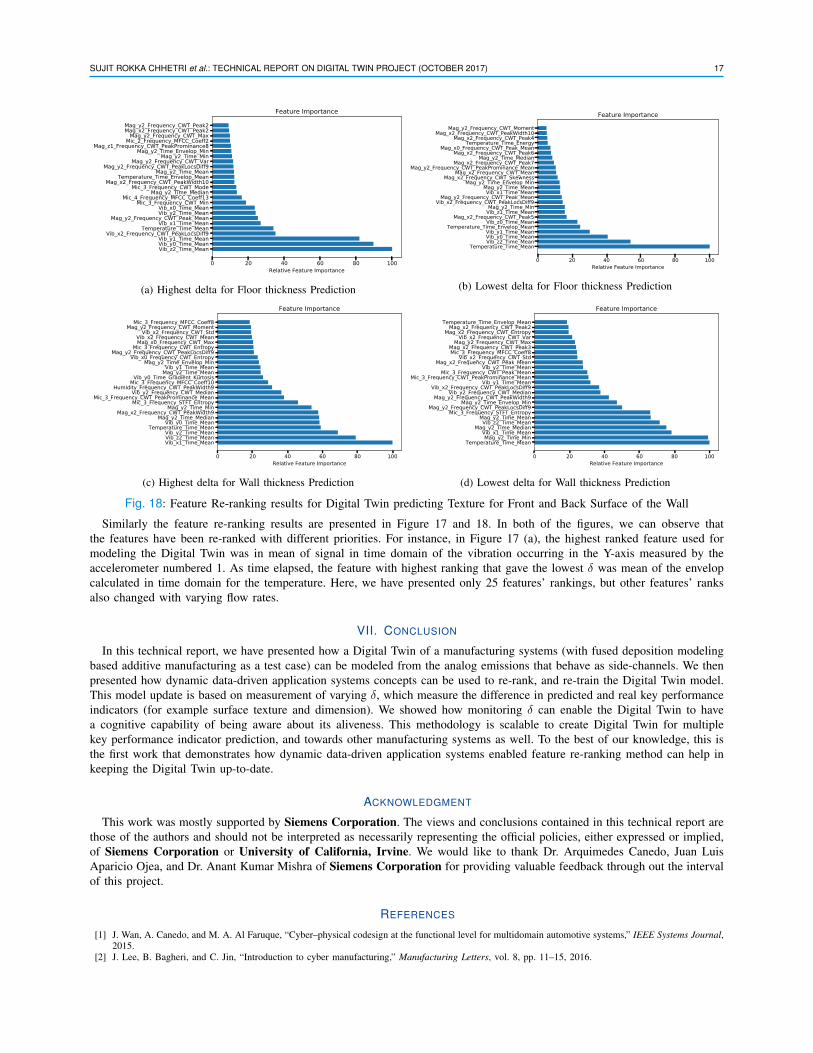
Fig. 17: Feature Re-ranking results for Digital Twin predicting Texture for Top and Bottom Surface of the Floor
SUJIT ROKKA CHHETRI et al.: TECHNICAL REPORT ON DIGITAL TWIN PROJECT (OCTOBER 2017) 17
(a) Highest delta for Floor thickness Prediction (b) Lowest delta for Floor thickness Prediction
(c) Highest delta for Wall thickness Prediction (d) Lowest delta for Wall thickness Prediction
Fig. 18: Feature Re-ranking results for Digital Twin predicting Texture for Front and Back Surface of the Wall
Similarly the feature re-ranking results are presented in Figure 17 and 18. In both of the figures, we can observe thatthe features have been re-ranked with different priorities. For instance, in Figure 17 (a), the highest ranked feature used formodeling the Digital Twin was in mean of signal in time domain of the vibration occurring in the Y-axis measured by theaccelerometer numbered 1. As time elapsed, the feature with highest ranking that gave the lowest � was mean of the envelopcalculated in time domain for the temperature. Here, we have presented only 25 features’ rankings, but other features’ ranksalso changed with varying flow rates.
VII. CONCLUSION
In this technical report, we have presented how a Digital Twin of a manufacturing systems (with fused deposition modelingbased additive manufacturing as a test case) can be modeled from the analog emissions that behave as side-channels. We thenpresented how dynamic data-driven application systems concepts can be used to re-rank, and re-train the Digital Twin model.This model update is based on measurement of varying �, which measure the difference in predicted and real key performanceindicators (for example surface texture and dimension). We showed how monitoring � can enable the Digital Twin to havea cognitive capability of being aware about its aliveness. This methodology is scalable to create Digital Twin for multiplekey performance indicator prediction, and towards other manufacturing systems as well. To the best of our knowledge, this isthe first work that demonstrates how dynamic data-driven application systems enabled feature re-ranking method can help inkeeping the Digital Twin up-to-date.
ACKNOWLEDGMENT
This work was mostly supported by Siemens Corporation. The views and conclusions contained in this technical report arethose of the authors and should not be interpreted as necessarily representing the official policies, either expressed or implied,of Siemens Corporation or University of California, Irvine. We would like to thank Dr. Arquimedes Canedo, Juan LuisAparicio Ojea, and Dr. Anant Kumar Mishra of Siemens Corporation for providing valuable feedback through out the intervalof this project.
REFERENCES
[1] J. Wan, A. Canedo, and M. A. Al Faruque, “Cyber–physical codesign at the functional level for multidomain automotive systems,” IEEE Systems Journal,2015.
[2] J. Lee, B. Bagheri, and C. Jin, “Introduction to cyber manufacturing,” Manufacturing Letters, vol. 8, pp. 11–15, 2016.
18 TECHNICAL REPORT ON DIGITAL TWIN PROJECT
[3] E. H. Glaessgen and D. Stargel, “The digital twin paradigm for future nasa and us air force vehicles,” in 53rd Struct. Dyn. Mater. Conf. Special Session:Digital Twin, Honolulu, HI, US, pp. 1–14, 2012.
[4] J. Lee, B. Bagheri, and H.-A. Kao, “A cyber-physical systems architecture for industry 4.0-based manufacturing systems,” Manufacturing Letters, vol. 3,pp. 18–23, 2015.
[5] M. A. Al Faruque and F. Ahourai, “A model-based design of cyber-physical energy systems,” in Design Automation Conference (ASP-DAC), 2014 19thAsia and South Pacific, pp. 97–104, IEEE, 2014.
[6] J. Wan, A. Canedo, and M. A. Al Faruque, “Functional model-based design methodology for automotive cyber-physical systems,” IEEE Systems Journal,2015.
[7] A. Canedo, M. A. Al Faruque, and J. H. Richter, “Multi-disciplinary integrated design automation tool for automotive cyber-physical systems,” in Design,Automation and Test in Europe Conference and Exhibition (DATE), 2014, pp. 1–2, IEEE, 2014.
[8] B. Balaji, A. Faruque, M. Abdullah, N. Dutt, R. Gupta, and Y. Agarwal, “Models, abstractions, and architectures: the missing links in cyber-physicalsystems,” in Proceedings of the 52nd Annual Design Automation Conference, p. 82, ACM, 2015.
[9] A. Canedo, J. Wan, and M. A. Al Faruque, “Functional modeling compiler for system-level design of automotive cyber-physical systems,” in Computer-Aided Design (ICCAD), 2014 IEEE/ACM International Conference on, pp. 39–46, IEEE, 2014.
[10] Y. Peng and M. Dong, “A prognosis method using age-dependent hidden semi-markov model for equipment health prediction,” Mechanical Systems andSignal Processing, vol. 25, no. 1, pp. 237–252, 2011.
[11] R. Kothamasu, S. H. Huang, and W. H. VerDuin, “System health monitoring and prognosticsa review of current paradigms and practices,” The InternationalJournal of Advanced Manufacturing Technology, vol. 28, no. 9-10, pp. 1012–1024, 2006.
[12] R. Parasuraman, T. B. Sheridan, and C. D. Wickens, “A model for types and levels of human interaction with automation,” IEEE Transactions on systems,man, and cybernetics-Part A: Systems and Humans, vol. 30, no. 3, pp. 286–297, 2000.
[13] S. R. Chhetri, N. Rashid, S. Faezi, and M. A. Al Faruque, “Security trends and advances in manufacturing systems in the era of industry 4.0,” 2017.[14] S. F. T. Group, “Smart factory applications in discrete manufacturing.” https://www.iiconsortium.org/pdf/Smart_Factory_
Applications_in_Discrete_Mfg_white_paper_20170222.pdf, 2017.[15] R. Rosen, G. von Wichert, G. Lo, and K. D. Bettenhausen, “About the importance of autonomy and digital twins for the future of manufacturing,”
IFAC-PapersOnLine, vol. 48, no. 3, pp. 567–572, 2015.[16] J. Lee, E. Lapira, B. Bagheri, and H.-a. Kao, “Recent advances and trends in predictive manufacturing systems in big data environment,” Manufacturing
Letters, vol. 1, no. 1, pp. 38–41, 2013.[17] Siemens, “On track for the future - the siemens digital twin show.” https://www.youtube.com/watch?v=GzPWBHT1Hl4, 2015.[18] IBM, “Introduction to digital twin: Simple, but detailed.” https://www.youtube.com/watch?v=RaOejcczPas, 2017.[19] M. Grieves, “Digital twin: Manufacturing excellence through virtual factory replication,” White paper, 2014.[20] M. Bacidore, “Digital twin to enable asset optimization.” https://www.smartindustry.com/articles/2015/
digital-twin-to-enable-asset-optimization/, 2015.[21] R. Kucera, M. Aanenson, and M. Benson, “The augmented digital twin.” http://info.exosite.com/augmented-digital-twin?utm_
referrer=https%3A%2F%2Fexosite.com%2Fblog%2Fmodeling-digital-twin%2F, 2017.[22] C. Parris, B. Laflen, M. Grabb, and D. Kalitan, “The future for industrial services: The digital twin.” https://www.infosys.com/insights/
services-being-digital/Documents/future-industrial-digital.pdf, 2017.[23] K. Panetta, “Top trends in the gartner hype cycle for emerging technologies, 2017.” https://www.gartner.com/smarterwithgartner/
top-trends-in-the-gartner-hype-cycle-for-emerging-technologies-2017/, 2017.[24] B. Marr, “What is digital twin technology-and why is it so important?.” https://www.forbes.com/sites/bernardmarr/2017/03/06/
what-is-digital-twin-technology-and-why-is-it-so-important/#454a5c2a2e2a, 2017.[25] N. I. C. for Intelligent Maintenance Systems (IMS), “Digital twin for machine monitoring - cyber-physical interface for manufacturing, ims center.”
https://www.youtube.com/watch?v=6sh4U44AndQ, 2014.[26] E. J. Tuegel, A. R. Ingraffea, T. G. Eason, and S. M. Spottswood, “Reengineering aircraft structural life prediction using a digital twin,” International
Journal of Aerospace Engineering, vol. 2011, 2011.[27] IBM, “Creating a building’s ’digital twin’.” https://www.ibm.com/internet-of-things/iot-zones/iot-buildings/
sensors-in-intelligent-buildings/, 2017.[28] ANSYS, “Excellence in engineering solutions, advantave: Spotlight on the digital twin.” http://www.ansys.com/-/media/Ansys/
corporate/resourcelibrary/article/ansys-advantage-digital-twin-aa-v11-i1.pdf, 2017.[29] M. Bacidore, “The connected plant enables the digital twin.” https://www.controlglobal.com/industrynews/2017/hug-7/, 2017.[30] TWI, “Twi embarks on lifecycle engineering asset management through digital twin technology.” http://www.twi-global.com/news-events/
news/2017-03-twi-embarks-on-lifecycle-engineering-asset-management-through-digital-twin-technology/,2017.
[31] S. R. chhetri, S. Faezi, N. Rashid, and M. Al Faruque, “Manufacturing supply chain and product lifecycle security in the era of industry 4.0,” 2017.[32] T. DebRoy, W. Zhang, J. Turner, and S. Babu, “Building digital twins of 3d printing machines,” Scripta Materialia, vol. 135, pp. 119–124, 2017.[33] G. Knapp, T. Mukherjee, J. Zuback, H. Wei, T. Palmer, A. De, and T. DebRoy, “Building blocks for a digital twin of additive manufacturing,” Acta
Materialia, vol. 135, pp. 390–399, 2017.[34] S. R. Chhetri and M. A. Al Faruque, “Side-channels of cyber-physical systems: Case study in additive manufacturing,” IEEE Design & Test, 2017.[35] F.-X. Standaert, T. Malkin, and M. Yung, “A unified framework for the analysis of side-channel key recovery attacks.,” in Eurocrypt, vol. 5479,
pp. 443–461, Springer, 2009.[36] A. Faruque, M. Abdullah, S. R. Chhetri, A. Canedo, and J. Wan, “Acoustic side-channel attacks on additive manufacturing systems,” in Proceedings of
the 7th International Conference on Cyber-Physical Systems, p. 19, IEEE Press, 2016.[37] A. Hojjati, A. Adhikari, K. Struckmann, E. Chou, T. N. Tho Nguyen, K. Madan, M. S. Winslett, C. A. Gunter, and W. P. King, “Leave your phone
at the door: Side channels that reveal factory floor secrets,” in Proceedings of the 2016 ACM SIGSAC Conference on Computer and CommunicationsSecurity, pp. 883–894, ACM, 2016.
[38] S. R. Chhetri, A. Canedo, and M. A. Al Faruque, “Kcad: kinetic cyber-attack detection method for cyber-physical additive manufacturing systems,” inComputer-Aided Design (ICCAD), 2016 IEEE/ACM International Conference on, pp. 1–8, IEEE, 2016.
[39] S. R. Chhetri, S. Faezi, and M. A. Al Faruque, “Fix the leak! an information leakage aware secured cyber-physical manufacturing system,” in 2017Design, Automation & Test in Europe Conference & Exhibition (DATE), pp. 1408–1413, IEEE, 2017.
[40] S. R. Chhetri, S. Faezi, A. Canedo, and M. A. Al Faruque, “Thermal side-channel forensics in additive manufacturing systems,” in Proceedings of the7th International Conference on Cyber-Physical Systems, p. 22, IEEE Press, 2016.
[41] S. R. Chhetri, “Novel side-channel attack model for cyber-physical additive manufacturing systems.” http://escholarship.org/uc/item/6c52g94w, 2016.
[42] S. R. chhetri, A. Canedo, and M. Al Faruque, “Confidentiality breach through acoustic side-channel in cyber-physical additive manufacturing systems,”2016.
[43] S. R. Chhetri, J. Wan, and M. A. Al Faruque, “Cross-domain security of cyber-physical systems,” in Design Automation Conference (ASP-DAC), 201722nd Asia and South Pacific, pp. 200–205, IEEE, 2017.

SUJIT ROKKA CHHETRI et al.: TECHNICAL REPORT ON DIGITAL TWIN PROJECT (OCTOBER 2017) 19
[44] F. Darema, “Dynamic data driven applications systems: A new paradigm for application simulations and measurements,” Computational Science-ICCS2004, pp. 662–669, 2004.
[45] R. S. Hunter, “Photoelectric color difference meter,” Josa, vol. 48, no. 12, pp. 985–995, 1958.[46] Z.-Q. Liu, “Scale space approach to directional analysis of images,” Applied optics, vol. 30, no. 11, pp. 1369–1373, 1991.[47] J. H. Friedman, “Greedy function approximation: a gradient boosting machine,” Annals of statistics, pp. 1189–1232, 2001.[48] A. Dobra and J. Gehrke, “Secret: a scalable linear regression tree algorithm,” in Proceedings of the eighth ACM SIGKDD international conference on
Knowledge discovery and data mining, pp. 481–487, ACM, 2002.[49] M. Maltamo and A. Kangas, “Methods based on k-nearest neighbor regression in the prediction of basal area diameter distribution,” Canadian Journal
of Forest Research, vol. 28, no. 8, pp. 1107–1115, 1998.[50] M. Collins, R. E. Schapire, and Y. Singer, “Logistic regression, adaboost and bregman distances,” Machine Learning, vol. 48, no. 1, pp. 253–285, 2002.[51] F. Pedregosa, G. Varoquaux, A. Gramfort, V. Michel, B. Thirion, O. Grisel, M. Blondel, P. Prettenhofer, R. Weiss, V. Dubourg, et al., “Scikit-learn:
Machine learning in python,” Journal of Machine Learning Research, vol. 12, no. Oct, pp. 2825–2830, 2011.


![Rokka No Yuusha Volume 3 [English]](https://static.fdocuments.us/doc/165x107/55cf8563550346484b8d7264/rokka-no-yuusha-volume-3-english.jpg)