CECL: Data, Scenarios and Cash Flow Thoughts - AFS …€¦ · · 2016-11-17CECL: Data, Scenarios...
23
CECL: Data, Scenarios and Cash Flow Thoughts H. Walter Young September 22, 2016 2016 AICPA National Conference on Banks & Savings Washington D C Washington, D.C.
Transcript of CECL: Data, Scenarios and Cash Flow Thoughts - AFS …€¦ · · 2016-11-17CECL: Data, Scenarios...

CECL: Data, Scenarios and Cash Flow Thoughts
H. Walter YoungSeptember 22, 20162016 AICPA National Conference on Banks & SavingsWashington D CWashington, D.C.

Table of Contents
I. Data…………………… II ScenariosII. Scenarios…………………………...
III. Cash Flow Generation
IV. CECL Accounting Entries and Disclosures
2

Five Main Moving Parts/Impact of CECL
Data Data Easily observable history, current conditions, and projections
Scenarios Significant Fed data documented and published since 1976 for Stress Testing
Cash Flow Generators Informed by ALM models for decades Link in new CCAR Loss Models
CECL Accounting Magic Financial assets measured at amortized cost: Finance receivables, HTM and AFS securities, Accounts
Receivable, Reinsurance Receivables, Repurchase Agreements, Leases, Off-Balance Sheet Loan Commitments, Standby LOCs
Developing an Estimate of Credit Losses
I t C it l (P ibl L CET1 Y t Si il C it l ALLL R )
3
Impact on Capital (Possible Lower CET1; Yet Similar Capital + ALLL Reserves)

In Goes:Loan DataData
SEC
Banker Accountant
4

Sample CECL Loan Data (All Loan and Security Types)
Macro-economic data (historical, current, future) Supportable allowance for loan and lease loss forecasts Actual full and partial losses (given default) by risk type Actual full and partial losses (given default) by risk type Risk Drivers: Loan type, vintage, grades, days past due, current principal balance, collateral
type, valuations, accounting classifications (troubled debt restructuring, impaired), modification date modification amounts amortization type loan number history fee historymodification date, modification amounts, amortization type, loan number history, fee history, location
Accounting Information: Is a loan charged off? Is it partially charged off? Cash Flow Characteristics: Present value and future cash flows (to get fair value) lifetime Cash Flow Characteristics: Present value and future cash flows (to get fair value), lifetime
expected cash flows and durations (by loan and security) at time of origination, sorted by similar risk types and performance characteristics (PD, LGD)
Cash Flow Modeling/ALM Data: Origination date, maturity date, renewal date, repricing date,
5
Cash Flow Modeling/ALM Data: Origination date, maturity date, renewal date, repricing date, pricing spreads, fixed/variable, prepayment behavior

Sample Commercial Loan ALLL Inputs Compared to FR Y-14Qs
6
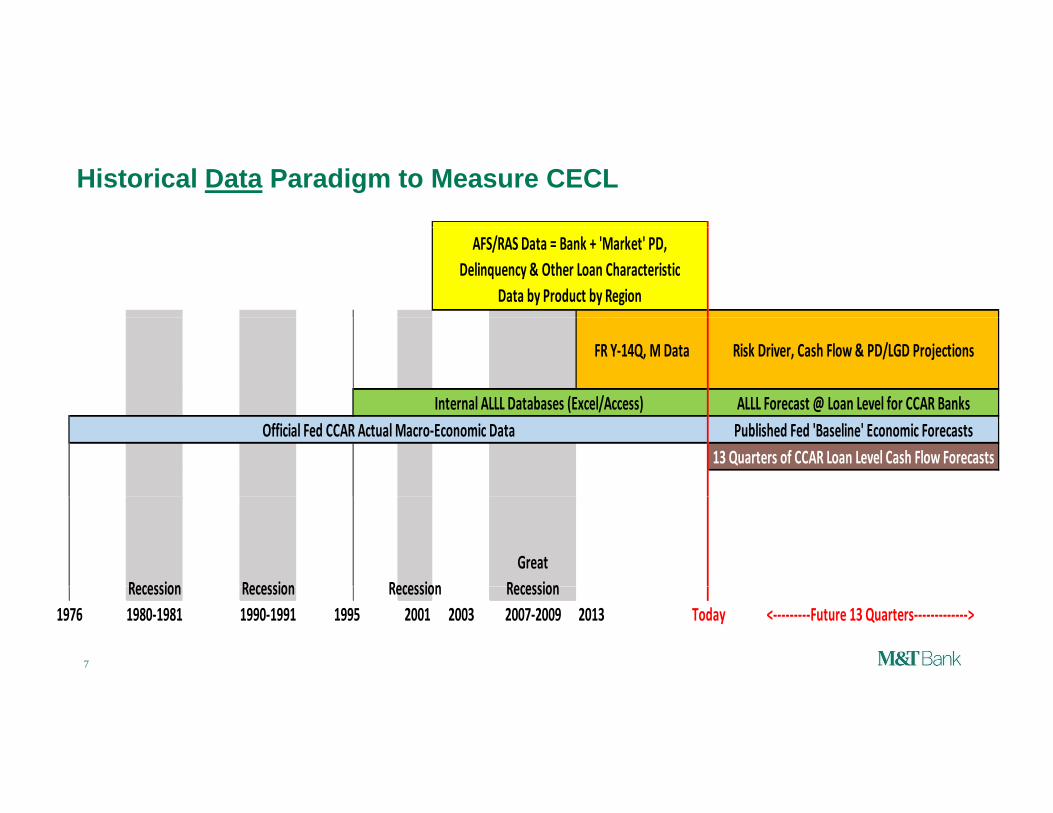
Historical Data Paradigm to Measure CECL
AFS/RAS Data = Bank + 'Market' PD, Delinquency & Other Loan Characteristic
Data by Product by Region
Internal ALLL Databases (Excel/Access) ALLL Forecast @ Loan Level for CCAR Banks
FR Y‐14Q, M Data Risk Driver, Cash Flow & PD/LGD Projections
Internal ALLL Databases (Excel/Access) ALLL Forecast @ Loan Level for CCAR Banks
13 Quarters of CCAR Loan Level Cash Flow ForecastsOfficial Fed CCAR Actual Macro‐Economic Data Published Fed 'Baseline' Economic Forecasts
GreatRecession Recession Recession Recession
7
Recession Recession Recession Recession1980‐1981 1990‐1991 2001 2003 2007‐2009 2013 <‐‐‐‐‐‐‐‐‐Future 13 Quarters‐‐‐‐‐‐‐‐‐‐‐‐‐>1995 Today1976

The RMA/AFS Weighted Average Expected Loss is Plotted (1-Year Lag) Showing Variance Between Expected and Actual Net Charge-Offs
IndustryIndustry Underestimating Losses
Industry yOverestimating Losses
8
Source: RMA/AFS Risk Analysis Service (RAS)

Examining C&I Loan Correlations, With and Without Owner-Occupied CRE
Under estimating LossesUnder‐estimating Losses
Over‐estimating Losses
9Source: RMA/AFS Risk Analysis Service (RAS)

There is a High (70%) Correlation Between Nonaccruals in RAS and the FDIC Charge-Off Rate RAS Nonaccruals are a ~Proxy for Losses
10
Source: RMA/AFS Risk Analysis Service (RAS)

Losses by NAICS Industry, Size of Bubble ~ Sector’s Contribution to the Total RAS Database (Exposure…One of Many Views)
11
Source: RMA/AFS Risk Analysis Service (RAS)

Select Mortgage ALLL Inputs Compared to FR Y-14Ms
12

Add In: ‘Expected’ Scenario
SEC
Banker Accountant
13

Relevant Macro-Economic Information
Relevant Information about past macro-economic events, evaluations of current conditions, and reasonable, documentable, and supportable forecasts are to be used in the estimation process.
Qualitative and quantitative factors that relate to the current environment in which the company is currently operating that can be applied to the specific borrower are to be considered.
This will have to be documented for history, current conditions and based on some reliable future forecast.
It is suggested some measure of reasonable forecast should be used in the estimation process, to be able to estimate a measure of expected risk of credit losses even if that risk is remote: (Why not use the CCAR Fed Base?)
14
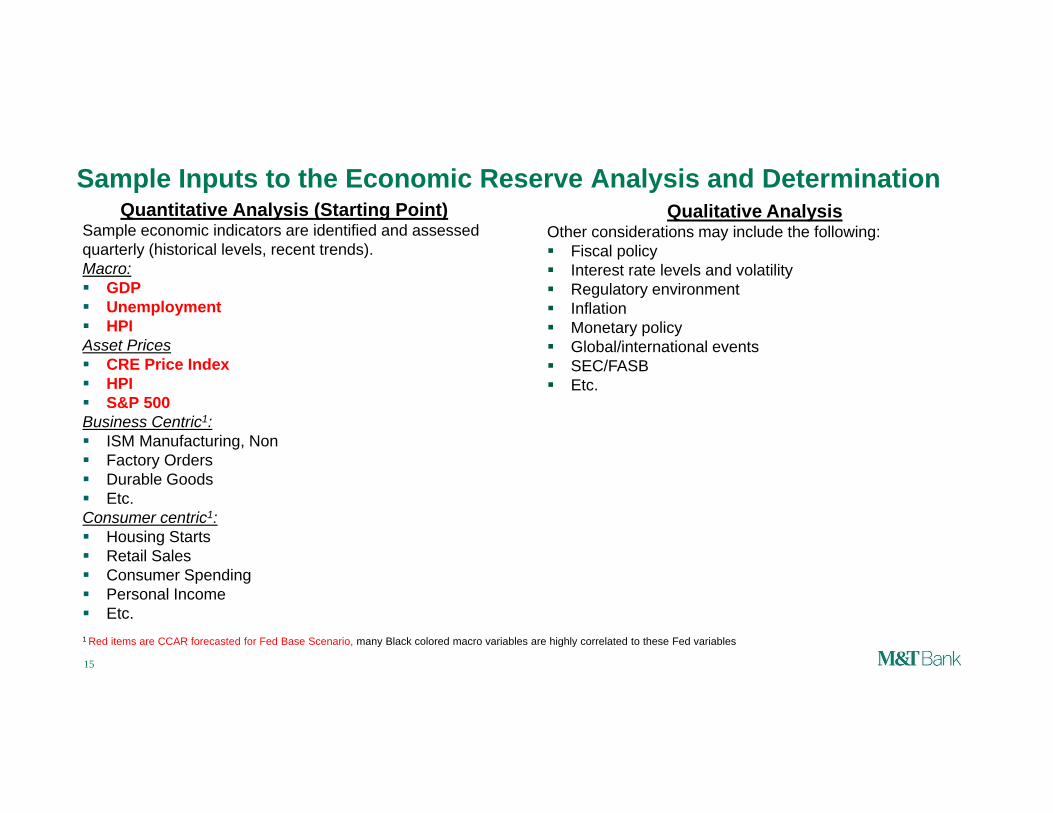
Sample Inputs to the Economic Reserve Analysis and DeterminationQuantitative Analysis (Starting Point)
Sample economic indicators are identified and assessedQualitative Analysis
Oth id ti i l d th f ll iSample economic indicators are identified and assessed quarterly (historical levels, recent trends). Macro: GDP Unemployment
Other considerations may include the following: Fiscal policy Interest rate levels and volatility Regulatory environment Inflation
HPIAsset Prices CRE Price Index HPI S&P 500
Monetary policy Global/international events SEC/FASB Etc.
S&P 500Business Centric1: ISM Manufacturing, Non Factory Orders Durable Goods Etc Etc.Consumer centric1: Housing Starts Retail Sales Consumer Spending
15
Personal Income Etc.1 Red items are CCAR forecasted for Fed Base Scenario, many Black colored macro variables are highly correlated to these Fed variables

M&T’s Scenario Probability Tool (SPT) 1
SPT 1 evaluates macro economic trends and adds a ‘likelihood’ to scenarios SPT evaluates macro economic trends and adds a likelihood to scenarios Knowing a scenario’s likelihood helps understand if a scenario is reasonable Scenario ‘likelihoods’ can be validated and documented The SPT tool was built for M&T’s CCAR and Resolution Planning
SPT Tool OutputsSeverity Index, i.e., Likelihood of the Scenario
e.g., 50%, 99.95% Likely
SPT Tool InputsAll 16 Fed Macro Variables
e.g., 50%, 99.95% LikelyScenario Probability Conditions
will be Better ThanSample SPT/BAU Use
Fed Base (2016 CCAR) 54.3% Economic Capital (EC), Budgeting, Concentration Limits, CECL (ALLL)
Blue Chip Forecast (Dec. ‘15) 51.8% CECL (ALLL), Budgeting
Blue Chip Forecast (January ‘16) 55.0% CECL (ALLL), Budgeting
Fed Severe Adverse (‘16 CCAR) 96 2% CCAR EC Concentration Limits
16
Fed Severe Adverse ( 16 CCAR) 96.2% CCAR, EC, Concentration Limits
Resolution Plans (2015) >99.99% Resolution Planning Analytics
1 © M&T

Scenario Development Probability Tool 1 Severity Index*SPT is an Effective Challenge Benchmark for CCAR Scenarios, & a KRI or an Early Warning Indicator
80%
100%
ity
Severity Distribution
Expansion Moderate Recession RecessionStable
SPT is an Effective Challenge Benchmark for CCAR Scenarios, & a KRI or an Early Warning Indicator
0%
20%
40%
60%
80%
‐0.05 ‐0.03 ‐0.01 0.01 0.03 0.05 0.07
Perce
ntile
of Se
ver
0.14‐ ‐ ‐Severity Index
Resolution Plan Scenario
Stable 2012Moody's S2Stable 2005
Moody's S1Expansion1992
Expansion2003 Moody's S4Moody's S3
Recession1990
Recession2008
Recession2001***
**
Fed Sev Adv2015CCAR95.25%
Fed Adv2015CCAR90.68%
Fed Base2015CCAR44.62%
Blue Chip Jan201654.96%
Blue Chip Dec201551.83%
Fed Base2016CCAR54.28%
Fed Adv2016CCAR91.01%
Fed Sev Adv2016CCAR96.22%
Resolution Planning ScenarioActual/historical scenario CCAR Scenario Blue Chip Scenario Moody’s Scenario
17
*Severity Index = A score indicating the severity of a scenario**Underlined scenarios are actual/historical scenarios***Moody’s S1, S2, SD3, S4 scenarios come from Moody’s Economy.com S1= Stronger Near-Term Rebound Scenario, S2=Slower Near-Term Recovery Scenario, S3=Moderate Recession Scenario, S4=Protracted Slump Scenario
1 © M&T

Run Cash Flows
SEC
Banker Accountant
18

Some Granular ALM Models Can Do Lifetime Cash Flows by Loan
ALM disclosures already in Annual Reports, some 10Qs
Subject to Sox-like controls
Covers full loan, securities; All ‘on’ and ‘off-balance sheet’ assets
Should be loan/transaction level to link into CCAR models
19

CECL ALLL #s for CCAR + Disclosures for Financials
SEC
Banker Accountant
20

ALLL vs. Scorecard vs. CCAR vs. ALM CECL Evaluation Points
21

CECL Needs
1 Historical E pected Forecasts (Bl e Chip Fed?)1. Historical Expected Forecasts (Blue Chip, Fed?)2. Historical Data, Current Data, Projected Data3. Reliable Macro-Economic Forecasts4. Granular Cash Flow Model5. Linkage to CCAR Loss Models for ‘Expected Scenario’6. Governance on Steroids Use CCARs ICAAP Process & SOX Guidance
7. Component Models will Need Validations Risk Management Department validations demand SR 11 7 reviews since results impact Risk Management Department validations demand SR 11-7 reviews since results impact
both CCAR and SEC Reporting
22

Thanks
Q&A
H. Walter YounggMarket Risk Officer, Regulatory Affairs and Capital Adequacy (RACA)M&T Bankhyoung@mtb com
23
[email protected](716)-842-5039