CEA Mpstudy
480
Report of for Eleventh Plan (2007-12) The Working Group on Power Volume - II Main Report Government of India Ministry of Power New Delhi February 2007 lR;eso t;rs lR;eso t;rs
Transcript of CEA Mpstudy
Report of
for Eleventh Plan (2007-12)
The Working Group on Power
Volume - IIMain Report
Government of India
Ministry of Power
New DelhiFebruary 2007
lR;eso t;rslR;eso t;rs
Working Group on Power
for Eleventh Plan (2007-12)
Volume – II Main Report
Contents Working Group on Power for 11th Plan
Page 1 of Contents
CONTENTS
CHAPTER DESCRIPTION PAGE NO. PREFACE INTRODUCTION EXECUTIVE SUMMARY 1 - 69
Chapter 1 DEMAND FOR POWER AND GENERATION PLANNING
1 - 93
1.1 10th Plan Review 1.2 Target Capacity Addition during Tenth Plan
1.3 Actual Capacity Addition and Power Supply Position during 10th Plan (Till date)
1.4 Actual/ Likely Capacity Addition during Tenth Plan
1.5 Likely Installed Capacity at the end of 10th Plan i.e. as on 31.03.2007
1.6 Demand for Power 1.7 Approach to Selection of Projects for 11th Plan 1.8 Generation Planning Norms 1.9 Generation Expansion Planning 1.10 Twelfth Plan Perspective (2012-2017) 1.11 Medium Term Plan: 11th Plan (2007-12) 1.12 Long Term Plan: 12th Plan (2012-17) 1.13 New Initiatives 1.14 Captive Power Plants
1.15 Maximising Generation from Existing Plants and AGS&P
1.16 Energy Efficiency Improvement through Energy Audit
1.17 Accelerated Generation & Supply Programme (AGS&P) Scheme
1.18 Non Conventional Energy Sources
1.19 Issues to be Addressed and Strategy to be adopted for 11th Plan
1.20 Recommendation of the Group
Appendix-1.1: Summary of Capacity Addition Target of 41,110 MW during 10th Plan (Region Wise, Sector Wise and Status Wise)
Appendix-1.2 List of Projects Commissioned during 10th Plan upto 31.12.2006
Appendix-1.3 List of Units dropped from 10th Plan (41110 MW)
Appendix-1.4 List of the Thermal Projects slipping from 10th Plan (41,110 MW) and included in 11th Plan (As per 30,641 MW)

Contents Working Group on Power for 11th Plan
Page 2 of Contents
CHAPTER DESCRIPTION PAGE NO.
Appendix-1.5 List of the Hydro Projects slipping from 10th Plan (41,110 MW) and included in 11th Plan (As per 30,641 MW)
Appendix-1.6 Details of Best Effort Projects
Appendix-1.7 List of Projects Likely to slip to 11th Plan
Appendix-1.8 Capacity Addition programme for 11th Plan
Appendix-1.9 Year wise coal requirement for 11th Plan
Appendix-1.10 Shelf of 12th Plan projects
Appendix 1.11 Comparative Performance of Partnership in Excellence (PIE) Stations with NTPC as PIE Partner
Appendix 1.12 State Wise List of Hydro RM&U Projects Completed in the 10th Plan
Appendix 1.13 State Wise List of ongoing Hydro RM&U Projects Programmed For Completion In the 10th Plan
Appendix 1.14 State Wise List of ongoing Hydro RM&U Projects Programmed for Completion in the 11th Plan
Appendix 1.15 State Wise List of Hydro RM&U Projects Programmed for Completion in the 11th Plan but works of which are yet to be taken up for Implementation
Chapter 2 TRANSMISSION PLANNING AND NATIONAL GRID
1 - 66
2.1 Review of Transmission System during 10th Plan
2.2 National Grid 2.3 Eleventh Plan Programme 2.4 Technology Development
2.5 Transmission Requirements for Open Access and Trading
2.6 Power Exchange with Neighbouring Countries 2.7 Reliability Issues and Grid Operation
2.8 Fund Requirement during 11th Plan for
Transmission System Development and Related Schemes
Appendix-2.1: HVDC Transmission Bipole, Back-to-back and Monopole lines and terminal station – Existing at the end of 9th Plan and programme for 10th Plan 2002-07
Appendix-2.2: Transmission lines and sub-station at 765kV – Existing at the end of 9th Plan and programme for 10th Plan 2002-07

Contents Working Group on Power for 11th Plan
Page 3 of Contents
CHAPTER DESCRIPTION PAGE NO.
Appendix 2.3 List of major transmission schemes completed and programmed under the development plan of the Regional Grids and National Grid during the 10th Plan-Northern Region
Appendix 2.4 List of major transmission schemes completed and programmed under the development plan of the Regional Grids and National Grid during the 10th Plan-Western Region
Appendix 2.5 List of major transmission schemes completed and programmed under the development plan of the Regional Grids and National Grid during the 10th Plan-Southern Region
Appendix 2.6 List of major transmission schemes completed and programmed under the development plan of the Regional Grids and National Grid during the 10th Plan-Eastern Region
Appendix 2.7 List of major transmission schemes completed and programmed under the development plan of the Regional Grids and National Grid during the 10th Plan-Inter-Regional
Appendix-2.8: Inter-State Transmission Schemes For The 11th Plan
Appendix- 2.9: States’ Transmission Schemes for the 11th Plan Evacuation System for Generation Projects
Appendix-2.10 State-Wise Details of Normative Assessment
Chapter 3 DISTRIBUTION INCLUDING VILLAGE AND HOUSHOLD ELECTRIFICATION
1 - 57
3.0 Overview 3.1 Key Issues in Electricity Distribution Sector 3.2 Distribution Reforms 3.3 New Legal and Policy Framework 3.4 Policy Initiatives 3.5 Distribution of Power in Urban Areas 3.6 Achievements Under APDRP
3.7 Distribution of Power in Rural Areas - Initiatives in 10th Plan
3.8 Development of Revenue Sustainability - Franchisees
3.9 Role of Panchayati Raj in Franchisee Development
3.10 Power Distribution in Rural Areas Through DDG
3.11 Short Term Strategies for DDG Schemes 3.12 Medium Term and Long Term Strategies 3.13 Cost to Serve/ Delivered Cost

Contents Working Group on Power for 11th Plan
Page 4 of Contents
CHAPTER DESCRIPTION PAGE NO. 3.14 Role of Stakeholders 3.15 Role of REC 3.16 Institutional and Financial Models 3.17 Special Focus Areas for 11th Plan 3.18 New Programmes/Schemes for 11th Plan
3.19 Agriculture Sector - Subsidies and Cross Subsidies
3.20 Water Energy Nexus 3.21 Open Access in Distribution 3.22 Multi-Year Tariff 3.23 Public Private Partnership
3.24 Impact of Power Sector Reforms – Success Stories
3.25 Best Practices 3.26 Requirement of Funds 3.27 Recommendations
Chapter 4 DEMAND SIDE MANAGEMENT AND ENERGY EFFICIENCY
1 - 14
4.0 Introduction 4.1 The Energy Conservation Act
4.2 Energy Saving –Target and Achievement of 10th Plan
4.3 Energy Conservation Strategy in the 11th Five-Year Plan
4.4 Policy Research for Accelerating Adoption of Energy Efficiency and DSM Programs
4.5 Budget Outlay for the 11th Plan 4.6 Recommendations Chapter 5 RESEARCH & DEVELOPMENT 1 - 21 5.0 Introduction 5.1 Overview of R&D 5.2 Technology Development in Power Sector
5.3 Identified Projects for 11th Plan by Central Utilities
5.4 R&D Project Provisions and Test Facilities for CPRI
5.5 Major Project Proposals for 11th Five Year Plan
5.6 Short Listed Short Term & Long Term Projects
5.7 R&D Funding 5.8 Intellectual Property Rights
5.9 Human Resource Development and Technical Competence Building
Chapter 6 DEVELOPMENT OF POWER SECTOR IN NORTH-EASTERN REGION
1 - 11
6.0 Introduction
Contents Working Group on Power for 11th Plan
Page 5 of Contents
CHAPTER DESCRIPTION PAGE NO. 6.1 Status at the beginning of 10th Plan
6.2 Review of Generation Capacity Addition Programme during 10th Plan
6.3 Reasons for Slow Pace of Project Execution
6.4 Power Demand & Supply Analysis of the Region
6.5 Generating Capacity Addition Programme in
North Eastern Region/ Sikkim during 11th Plan
6.6 Development of Transmission System in North Eastern Region
6.7 Evacuation of Power from Major Generation Projects in the North-Eastern Region along with Power from Projects coming up in Sikkim and Bhutan during the 11th Plan and early 12th Plan Period
6.8 Special Attention for Distribution in NE Region
6.9 Fund Requirement 6.10 Policy Initiatives and Recommendations Chapter 7 HUMAN RESOURCE DEVELOPMENT 1 - 25 7.0 Back Ground 7.1 Elements of HRD Planning 7.2 Assessment of Manpower 7.3 Training 7.4 Funding & Capital Outlay
Appendix 7.1: Training Load during 11th Plan for Technical Manpower (Includes Infrastructure) in Thousand-Man-Months (TMM)
Appendix 7.2: Training Load during 11th Plan for Non-Technical Manpower (Includes Infrastructure) in Thousand-Man-Months
Appendix 7.3: Training Load (Induction) during 12th Plan for Technical Manpower (Includes Infrastructure) in Thousand-Man-Months
Appendix 7.4: Training Load (Induction) during 12th Plan for Non-Technical Manpower (Includes Infrastructure) in Thousand-man-months
Chapter 8 LEGISLATIVE AND POLICY ISSUES 1 - 41 8.0 Back Ground
8.1 Implementation of Provisions of Act and Policies
8.2 Status of Implementation and Deviations of Integrated Energy Policy
8.3 National Electricity Policy - Deviations and Status of Implementation
8.4 Major Issues and Recommendations

Contents Working Group on Power for 11th Plan
Page 6 of Contents
CHAPTER DESCRIPTION PAGE NO. 8.5 Summary of Recommendations
Appendix 8.1: Fund Requirement for Training of Electricity Regulators and Staff
Appendix 8.2: Comments of Prayas Energy Group Appendix 8.3: Comments of IIT Kanpur Chapter 9 KEY INPUTS 1 - 49 9.1 Introduction 9.2 Coal & Lignite 9.3 Transportation of Coal: Available Infrastructure 9.4 Natural Gas 9.5 Key Input Materials 9.6 Generation Expansion Plan 9.7 Material Requirements for Generating Stations
9.8 Material Requirement for Power Transmission System Network
9.9 Material Requirement for Distribution System Network
9.10 Material Requirement for Power and Distribution Transformers
9.11 Other Materials for 11th & 12th Plan Projects
9.12 Total Requirement of Various Materials for
Capacity Addition Planned during 11th & 12th Plans
9.13 Availability / Supply of Key Materials 9.14 Constraints / Policy Support Required 9.15 Availability / Capability of Manufacturers 9.16 Construction Capability
9.17 Availability/Capability of Construction Agencies
9.18 Availability of Construction Equipment 9.19 Special Measures for Thermal Projects 9.20 Recommendations
Appendix 9.1: Port wise Projected Traffic and Capacity Estimation (2013-14)
Appendix 9.2: List of Construction Equipments to be Augmented for Hydro Projects
Appendix 9.3: Construction Equipment Availability vis a vis Augmentation required for adding 14000 MW / per yr.
Chapter 10 FINANCIAL ISSUES AND POWER SECTOR FINANCING
1 - 46
10.1 Financial Performance of Power Sector during 10th Plan
10.2 Fund Requirement for 11th Plan
10.3 Renovation and Modernization of Power Plants
10.4 Transmission Network

Contents Working Group on Power for 11th Plan
Page 7 of Contents
CHAPTER DESCRIPTION PAGE NO. 10.5 Distribution and Rural Electrification 10.6 Human Resource Development 10.7 Research and Technology Development 10.8 Demand Side Management 10.9 11th Plan Estimated Fund Requirement 10.10 Year Wise Fund Requirement 10.11 Sources of Funds 10.12 Estimated Funds Mobilization 10.13 Lenders’ Issues 10.14 Developers’ Concerns
10.15 Recommendations & Implementation Strategy
10.16 Implementation Mechanisms
Appendix 10.1: Detailed Outlay and Achievement for Funding 10th Plan - State Sector
Appendix 10.2: Approved Tenth Plan Outlay Internal and Extra Budgetary Resources Gross Budgetary Support
Appendix 10.3: Assumptions for Estimation of Cost of Generation Projects
Appendix 10.4: Projects Under Construction Appendix 10.5: Committed Projects
Appendix 10.6: Projects to be taken up in 11th Plan for Likely Benefit in 12th Plan
ACRONYMS

INTRODUCTION
The Working Group on Power was constituted by the Planning Commission vide its Office Order No.I-15/1/2005-P&E dated 20th April 2006 (copy enclosed at Appendix-A) to formulate the power programme for 11th Plan. Secretary (Power) was the Chairman of the Working Group and Member (Planning), CEA was the Member Secretary of the Working Group. The Composition and Terms of Reference of the Working Group for Eleventh Plan are given in Appendix-A. The first meeting of the Working Group was held on 19th May 2006 under the Chairmanship of Secretary (Power). It was decided to constitute 8 specialized Sub-Groups to go into the specific areas to cover comprehensively all the Terms of Reference of the Working Group. Subsequently, review meetings of the Working Group were held in MoP on a regular basis to assess the progress of the Sub-Groups from time to time. During the discussions, it emerged that it was essential to have a separate Sub-Group on “Human Resource Development” and accordingly Sub Group 9 was constituted. Details of the various Sub Groups are enclosed in Appendix- B The Sub-Groups discussed various issues regarding Demand, Generation, Transmission & Distribution Expansion Planning, Households & Rural Electrification, Demand Side Management & Energy Efficiency Issues, Research & Development, Manpower Planning & Training and Fund Requirement. A separate chapter has also been included on development of North Eastern Region as well as Policy Issues. A review of and measures for implementation of National Electricity Policy and Integrated Energy Policy have also been included in the Report. The report is based on 10th Plan likely capacity addition of 30,641 MW corresponding to which the 11th Plan capacity addition is 68,869 MW and 12th Plan capacity addition is 82,000 MW. Subsequent to the finalization of the Report, CEA had reviewed the likely capacity addition during the 10th Plan. This is now expected to be around 23,250 MW. The balance 10th Plan capacity would slip to 11th Plan in addition to 68,869 MW planned for 11th Plan. These changes have, however not been effected in the body of the Report. Various Sub-Groups submitted their Reports to the main Working Group. Based on the recommendations of these Sub-Groups the Report of the Working Group for 11th Plan has been formulated. It is in 2 Volumes- Volume I containing the Executive Summary of the Report and Volume II containing the main Chapters of the Report. The Executive Summary has also been made part of Volume II for the sake of completeness & ease of reference.
New Delhi (V. S. VERMA) 15th Feb. 2007 Member (Planning) CEA and Member Secretary of the Working Group on Power

Appendix-A No.I-15/1/2005-P&E
GOVERNMENT OF INDIA PLANNING COMMISSION
(POWER & ENERGY DIVISION) ******
Yojana Bhawan Sansad Marg
New Delhi— 110001.
Dated: 20th April, 2006
ORDER
Subject: Constitution of a Working Group on Power for formulation of Eleventh Five Year Plan (2007-2012.
It has been decided to constitute a Working Group on Power in the context of preparation
of Eleventh Five Year Plan (2007-2012). The Composition and Terms of Reference of the Group will be as follows: A. Composition
Secretary, Ministry of Power - Chairman Members
1. Adviser (Energy), Planning Commission 2. Chairperson, Central Electricity Authority 3. Representative of Ministry of Non-Conventional Energy Sources 4. Representative of Department of Atomic Energy 5. Representative of Ministry of Coal 6. Representative of Ministry of Petroleum & Natural Gas 7. Representative of Ministry of Environment & Forests 8. Representative of Department of Science & Technology 9. Member (Planning), Central Electricity Authority— Member Secretary
PSUs 1. CMDs, NTPC/NHPC/PGCIL/PFC/REC 2. Chairmen, GRIDCO/APTRANSCO/MSEB/MPEB/TNEB/PSEB
Private Sector Representatives 1. Representative of Reliance Energy Company 2. Representative of Tata Electric Company 3. Representative of Torrent Electric Company

OTHERS 1. Shri Girish Sant, PRAYAS 2. Shri Navroj Dubash, NIPFP 3. Prof. Anoop Singh, lIT Kanpur
B. Terms of Reference
i) To review the Integrated Energy Policy Report and suggest measures to operationalise its recommendations during the Eleventh Plan Period.
ii) To review the status of various policies notified under the provisions of Electricity Act, 2003 and identify steps needed to realize the objectives of the Electricity Act, 2003.
iii) To recommend an industry structure that would enhance the number of players, promote competition, provide a consistent & transparent pricing regime and raise conversion, transmission, distribution & end use efficiency.
iv) To review the likely achievement during the Tenth Plan period in meeting targets set for Generation, Transmission, Distribution and Renovation & Modernisation R&M). An analysis of the reasons for shortfalls, if any, may be highlighted. v) To review the current status of captive generation in the country, highlight issues
facing this sub sector and make recommendations for enhancing/reducing captive generation during the Eleventh Plan period.
vi) To review the effectiveness of Eleventh Plan Schemes such as Accelerated Generation & Supply Programme (AG&SP), Accelerated Power Development & Reforms Programme (APDRP) and Rajiv Gandhi Grameen Vidyutikaran Yojana (RGGVY). To suggest modifications and/or give recommendations for scrapping these schemes or replacing them with alternative schemes to better address the desired objectives.
vii) To assess the State-wise/region-wise demand for power in terms of both peak and energy requirements.
viii) To recommend the optimal mix of additional generating capacity to be created during the Eleventh Plan period in terms of hydro, thermal (coal, gas, lignite and liquid fuel) and nuclear generation on the basis of relative economics of different fuels at different locations. The executing agency of the project i.e. State Sector, Central Sector or Private Sector should also be identified. A possible listing of the projects and their phasing for benefits during Eleventh Plan must be prepared. Advance action to be taken in the Eleventh Plan period for the Twelfth Plan projects may also be identified.
ix) To assess the potential for improving availability of power from existing power stations through Renovation & Modernisation/life extension.
x) To maximise benefit from the existing plants by improving their operational efficiency and capacity utilization, improvement and augmentation of Transmission and Distribution network and dealing effectively with the problem of Aggregate Technical & Commercial (AT&C) losses and theft of power.
xi) To review the on-going reform process undertaken by States in the power sector. xii) To assess if privatisation is an answer to address the ills of the Power Sector. xiii) To suggest energy conservation measures through Demand Side Management
(DSM) such as staggering of load, time of the day metering and pricing, reduction in the energy intensity of the large consumers etc.
xiv) To recommend the operational norms for thermal including Gas, Liquid fuel and nuclear generations.

xv) To develop a work plan to tackle problems in ash disposal, pollution and other environmental issues.
xvi) To make recommendations regarding S&T programme to be implemented in the Eleventh Plan period and the institutional arrangements necessary therefore.
xvii) To explore avenues for purchase of power from neighbouring countries through joint venture schemes.
xviii) To assess the investment requirement for the Eleventh Plan in the Power Sector. xix) To assess the infra-structural support such as transportation, port facilities, construction and manufacturing capabilities, roads etc. that would be required for implementation of the Eleventh and Twelfth five year Plans.
2. In order to assist the Working Group in its task, separate Sub-Groups on specific aspects
may be formed by the Working Group. These Sub-Groups will furnish their reports to the Working Group
3. The Chairman of the Working Group may co-opt experts as may be considered necessary.
4. The Working Group will submit its report to the Planning Commission latest by 30th September, 2006
5. Non-official members shall be entitled to payment of TA/DA by the Planning Commission as per SR 190(a). Official members will be entitled to payment of TAJDA by their respective Departments/Organizations, as per the rules of entitlement applicable to them.
6. The name(s) of the Representative(s) of various organizations, as per the above composition may be communicated to the Member-Secretary of the Working Group under intimation to Shri Surya P. Sethi, Adviser (Energy), Planning Commission.
7. Shri R.K. Kaul, Joint Adviser, Planning Commission, Room No.503, Yojana Bhavan, New Delhi-i 10 001 (Telephone No. 2309 6718), shall be the Nodal Officer for this Working Group and for any further query/correspondence may be made with him.
(K.K. Chhabra)
Under Secretary to the Government of India Chairman and Members (including Member-Secretary) of the Working Group. Copy for information to:
1. PSs to Deputy Chainman/ MOS(Planning)/ Members/ Member-Secretary, Planning Commission.
2. All Principal Advisers/ Advisers/JS(SP&Admn.) 3. Prime Minister’s Office, South Block, New Delhi. 4. Information Officer, Yojana Bhavan. 5. For general information in Yojana Bhavan through e-mail.
(K.K. Chhabra)
Under Secretary to the Government of India

Appendix-B
WORKING GROUP ON POWER FOR 11TH FIVE YEAR PLAN (2007-2012) – Details of Sub-Groups
SUB-GROUP 1- DEMAND PROJECTION AND GENERATION PLANNING. Shri Rakesh Nath-Chairperson, CEA- Chairman of Sub-Group Shri A.S. Bakshi-Chief Engineer (IRP) CEA - Member Secretary of Sub-Group SUB-GROUP 2- TRANSMISSION PLANNING INCLUDING NATIONAL GRID Shri V. Ramakrishna - Member (PS) CEA - Chairman of Sub-Group Shri A.K. Asthana, Chief Engineer (SP&PA), CEA - Member Secretary of Sub-Group Shri Jiwesh Nandan,Director (PTC & Trans), Ministry of Power - Member Secretary of Sub-Group SUB-GROUP 3- DISTRIBUTION INCLUDING VILLAGE & HOUSEHOLD ELECTRIFICATION Shri Anil Kr. Lakhina - Chairman , REC - Chairman of Sub-Group Ms Dharitri Panda, Director (RE), Min. of Power , Member Secretary of Sub-Group SUB-GROUP 4 - LEGISLATIVE AND POLICY ISSUES – FORMULATION, IMPLEMENTATION & FEEDBACK Shri Ajay Shankar Additional Secretary, Ministry of Power - Chairman of Sub-Group Shri Alok Kumar, Director (R&R), Ministry of Power - Member Secretary of Sub-Group SUB-GROUP 5 - DEMAND SIDE MANAGEMENT, ENERGY EFFICIENCY & ENERGY CONSERVATION Dr. Ajay Mathur- Director General, BEE - Chairman of Sub-Group Shri K.K.Chakarvarti Energy Economist BEE - Member Secretary of Sub-Group SUB-GROUP 6 - TECHNOLOGICAL ADVANCEMENT AND RESEARCH & DEVELOPMENT Shri A.K.Tripathi - Director General CPRI - Chairman of Sub-Group Dr. R.R. Sonde, Executive Director (R&D) NTPC- Member Secretary of Sub-Group
SUB-GROUP 7 - ISSUES CONCERNING KEY INPUTS
Shri T. Sankarlingam - CMD NTPC - Chairman of Sub-Group Shri S.Sheshadri-Chief Engineer (TPIA)CEA - Member Secretary of Sub-Group

SUB-GROUP 8 - FINANCIAL ISSUES Dr. V.K.Garg - CMD, PFC - Chairman of Sub-Group Sh. Mukul Modi,Asstt Vice President,SBI Capital Markets Limited- Member Secretary of Sub-Group SUB-GROUP 9 - HUMAN RESOURCE DEVELOPMENT AND CAPACITY BUILDING Shri U.N. Panjiar, Additional Secretary, Ministry of Power - Chairman of Sub-Group, Shri C.S.Malik , Principal Director, NPTI - Member Secretary of Sub-Group Chief Coordinator from MoP – Shri Sudhakar Shukla, Director, MoP

Executive Summary Working Group on Power-11th Plan (2007-12)
1
EXECUTIVE SUMMARY
1.0 DEMAND PROJECTION AND GENERATION PLANNING 1.1 TENTH PLAN REVIEW The capacity addition target of 41,110 MW comprising 14,393 MW hydro, 25,417 MW thermal and 1,300 MW nuclear was fixed for the 10th Plan. The sector wise, type wise summary of this capacity addition target is given in Table below.
10TH PLAN CAPACITY ADDITION TARGET-SECTOR WISE
(Figures in MW) SECTOR Hydro Thermal Nuclear Total (%)
CENTRAL 8,742 12,790 1,300 22,832 (55.5%) STATE 4,481 6,676 0 11,157 (27.2%) PRIVATE 1,170 5,951 0 7,121 (17.3%) TOTAL 14,393 25,417 1,300 41,110 (100%)
A moderate target was set for state and private sectors keeping in view the preparedness of various state power utilities and IPPs. 1.1.2 Actual Capacity Addition (till 31.12.2006) A capacity addition of 17,995 MW has been achieved during 10th Plan till 31/12/06. The total installed capacity as on 31/12/2006 was 1,27,753 MW comprising 33,642 MW hydro, 84,020 MW thermal including gas & diesel, 3,900 MW nuclear power plants and 6,191 MW from renewable energy sources including wind. (The sector– wise details of installed capacity are given in Table 1.4 in Chapter-1.) 1.1.3 Power supply position in 10th plan The year-wise actual power supply position during 2002-03, 2003-04, 2004-05 ,2005-06 and 2006-07(till Dec-06) of 10th plan is given in Table below

Executive Summary Working Group on Power-11th Plan (2007-12)
2
ACTUAL POWER SUPPLY POSITION (ALL INDIA BASIS)
Year Peak Energy Requir
ement (MW)
Availability (MW)
Shortage MW (%)
Requirement (MU)
Availability (MU)
Shortage MU (%)
2002-03 81492 71547 9945 (12.2%) 545983 497690 48093 (8.8%) 2003-04 84574 75066 9508 (11.2%) 559264 519398 39866 (7.1%) 2004-05 87906 77652 10254 (11.7%) 591373 548115 43258 (7.3%) 2005-06 93255 81792 11463 (12.3%) 631757 578819 52938 (8.4%) 2006-07 (upto Dec,06)
100466 86425 14041 (14.0%) 510223 465149 45074 (8.8%)
The likely achievement of capacity addition during the 10th Plan is expected to be 30,641 MW which includes 2,578 MW capacity of projects which have been included on best effort basis. Any slippage of these best efforts projects from 10th plan would be reckoned as additional capacity in 11th plan over and above being proposed in this document. In 8th & 9th plan, capacity addition of 16,423 MW and 19,119 MW respectively was achieved. Even though the capacity addition target of 10th plan could not be achieved, the actual capacity addition is expected to be much higher than the earlier five year plans. The reasons for the slippages during the 10th plan have been analysed to learn lessons for capacity addition planning for future plans. During the first year of 10th plan itself it became clear that a number of projects totalling to 3,009 MW in public and private sectors could not be taken up due to various reasons which included non availability of escrow cover by State Government to IPP projects and fund constraints. There was also delay in super critical technology tie-up by BHEL for six units of 660 MW to be taken up by NTPC which resulted in delay in tendering. Additional projects totalling to 5,008 MW capacity were identified for execution during 10th plan to make up for the projects which could not take off. However, a total capacity of 12,516 MW (excluding 3,009 MW projects which could not be taken up) is expected to slip to 11th Plan due to reasons mentioned against each, in the following table:

Executive Summary Working Group on Power-11th Plan (2007-12)
3
Capacity slipped (MW) Sl. No Major Reasons of slippage Thermal Hydro
1. Delay in super critical technology tie up by BHEL
3960 -
2. Geological Surprises - 510 3. Natural Calamities 450 4. Delay in award of works 998 823 5. Delay in MoE&F clearance - 400 6. Investment decision/ Funds tie up
constraints/ delay in financial closure 1500 1400
7. Delay in Preparation of DPR & signing of MOU with state govt.
- 400
8. ESCROW cover (Private Sector) 500 - 9. R&R issues - 400 10. Court Cases - 675 11. Law & Order problem 500
Total 7458 5058 (The details are given in Para 1.5 of Main Working Group Report)
It is pertinent to point out that a number of projects of 10th plan ordered on BHEL were delayed due to delayed and non-sequential supply of equipment and materials and inadequate manpower in commissioning teams. Some of the projects expected to be commissioned during the last quarter of 2006-07 are also running behind schedule due to the above reasons. 1.2 GROWTH IN ENERGY GENERATION 1.2.1 Growth in Generation During 10th Plan The growth in generation has been 3.2%, 5.1%, 5.2% and 5.2% during 2002-03, 03-04, 04-05 and 05-06 respectively. In the year 2006-07(upto Dec-2006) a growth rate of 7.5 % has been recorded. The Compounded Annual Growth Rate(CAGR)of generation during the 10th Plan period is expected to be about 5.1%. However, higher growth could have been achieved if adequate gas would have been available for the existing and new gas based plants commissioned during 10th plan. 1.2.2 Growth in Generation during 11th Plan As per the Integrated Energy Policy (IEP), issued by the Planning Commission, GDP growth rates of 8%-9% have been projected during the 11th Plan. Assuming a higher growth rate of 9% and assuming the higher elasticity projected by the IEP of around 1.0, electrical energy generation would be required to grow at 9% p.a. during the 11th plan period. Also generation has to be collectively met by utilities, captive plants and Non-conventional energy sources. No reliable plans

Executive Summary Working Group on Power-11th Plan (2007-12)
4
about captive power capacity expansion are available but based on indications available from the manufacturers for addition in captive capacity and present utilization of available capacity, the generation from captive plants is expected to increase from 78 BU to 131 BU per annum. Since the load factor of non-conventional energy sources is very low (about 20% on an average), even though the capacity projected by MNRE from these sources is about 23,500 MW by the end of 11th Plan, the expected generation would be only around 41 BU. The generation from these renewables however has not been taken into account for planning purposes. Based on these assumptions following scenario emerges:
(i) Likely energy Generation by utilities in 2006-07 663 BU (ii) Likely Energy Generation by captive plants in 2006-07 78 BU (iii) Total Likely Generation in 2006-07 741 BU (iv) Compounded Annual Growth Rate 9% (v) Required Energy Generation by 2011-12 @ 9% growth rate over 741 BU 1140 BU (vi) Less Estimated Energy Generation by captive plants in 2011-12 131 BU (vii) Total Estimated Generation Requirement from Utilities by 2011-12 1008 BU
However to meet the objectives of NEP to increase the per capita consumption to 1000 units by the year 2011-12, the requirement of generation works out to 1210 BU, assuming a population of 121 crores in 2011-12 as per projections of Census 2001. After excluding the generation from captive plants (131 BU) and that from renewables (41 BU), the requirement of generation from utilities works out to 1038 BU. This would require a generation growth rate of 9.5% p.a (CAGR)for utilities.
1.2.3 Growth in generation During 12th Plan During the 12th Plan period, assuming a GDP growth rate of 9% per annum and elasticity 0.8 as compared to 1.0 during 11th plan mainly due to adoption of energy efficient technologies & other Energy Conservation and Demand Side Management measures being taken up during 11th Plan, electricity demand is likely to grow @ 7.2% p.a. Keeping this in view, the energy generation should increase to a level of 1470 BU by 2016-17 from a level of 1038 BU in 2011-12. However sensitivity analysis have been carried out assuming 8,9 & 10 % GDP growth rates & GDP-electricity elasticity of 0.9 & 0.8 respectively and the same is given in table below:

Executive Summary Working Group on Power-11th Plan (2007-12)
5
Generation Requirement for 2016-17
( As Per 8,9,10 % GDP Growth)
GDP Growth
GDP/ Electricity Elasticity
Electricity Generation Required
(BU) 0.8 1415 8 % 0.9 1470 0.8 1470 9 % 0.9 1532 0.8 1525 10 % 0.9 1597
1.3 APPROACH TO SELECTION OF PROJECTS FOR 11TH PLAN Keeping in view the lessons learnt from 10th plan while planning for capacity addition during 11th Plan, cautious approach have been adopted while choosing projects for commissioning in the 11th plan. It has been the endeavour to include only such projects as have high degree of certainty of implementation during 11th Plan. The approach adopted for selection of Hydro, Thermal and Nuclear projects have been as follows:
1.3.1 Hydro India is duly concerned about climate change and efforts are on to promote benign sources of energy. Hydro Power is one such source and is to be accorded priority also from the consideration of energy security. Irrespective of size and nature of hydro projects, whether ROR or Storage projects, these are all renewable technologies. However, execution of hydro projects requires thorough Survey and Investigation, preparation of DPR, development of infrastructure, EIA and other preparatory works, which are time consuming and require two to three years for their preparation. It would take about 5 years to execute a hydro project after the work is awarded for construction. Thus in order to achieve completion of a hydro project during 11th plan, the project should either be already under construction or execution should start at the beginning of the plan. The broad criteria adopted for selection of hydro projects for 11th plan are as under:
• Those hydro projects whose concurrence has been issued by CEA and
order for main civil works is likely to be placed by March 2007.

Executive Summary Working Group on Power-11th Plan (2007-12)
6
• Apart from the above, a few hydro projects of smaller capacity which are ROR type having surface power houses and where gestation period is expected to be less than 5 years have also been included. These projects would need to be rigorously followed up for completion during the 11th Plan.
Keeping in view the preparedness of various hydro projects, a capacity addition of 15, 585 MW is envisaged for 11th Plan. (The details of projects are given in Appendix 1.8- in Chapter-1 of main Working Group Report.) 1.3.2 Nuclear
Nuclear is environmentally benign source of energy and over a period of time, its proportion in total capacity should increase. Keeping in view the availability of fuel, a moderate capacity addition of 3,160 MW nuclear plants has been programmed during the 11th Plan by the Nuclear Power Corporation. All projects are presently under construction. However, in view of the recent developments in the Nuclear Sector, capacity addition in nuclear plants during 12th Plan is expected to be much higher.
(The details of projects are given in Appendix 1.8- in Chapter-1 of main Working Group Report.)
1.3.3 Thermal Gas
Although gas is relatively a clean fuel, at present there is uncertainty about the availability, period of availability and price of gas. Only 2,114 MW gas based capacity has been planned for 11th Plan where gas supply has already been tied up. This does not include NTPC’s gas based projects at Kawas and Gandhar, totalling to 2,600 MW, for which NTPC says that it has the gas supply contract but the matter is sub-judice. However more gas based projects could be taken up for construction as and when there is more clarity about availability and price of gas.
(The details of projects are given in Appendix 1.8- in Chapter-1 of main Working Group Report.)
Coal & Lignite based Thermal plants
Coal is expected to be main stay of power generation in the years to come. The following criteria have been adopted for identifying the coal and lignite based projects for inclusion in the 11th plan. • Such projects as have already been taken up for execution in the 10th
Plan period itself and are due for commissioning in the 11th Plan period. • Those thermal projects whose LOA has already been placed by the State
and Central Public Sector Corporations, other inputs also being in place.

Executive Summary Working Group on Power-11th Plan (2007-12)
7
• Those thermal projects whose LOA has already been placed and the financial closure achieved by private developers.
• Those thermal projects whose LOA is expected to be placed by 30th Sept, 2008 and commissioning is expected during the 11th Plan keeping in view the normal gestation period, the size of the plant & the type(green field/expansion).
After discussion with the various State Government and Central Generating Companies, thermal projects with total capacity of 46,635 MW of coal based and 1375 MW lignite based capacity have been identified for capacity addition during 11th plan. (The details of projects are given in Appendix 1.8- in Chapter-1 of main Working Group Report.) 1.4 CAPACITY ADDITION DURING 11TH PLAN (2007-12) Based on the preparedness of the projects, it was envisaged that a capacity of about 68,869 MW is feasible for addition during 11th plan period. The sector wise break-up of feasible capacity addition during 11th plan is given in Table below:
THERMAL BREAKUP SECTOR HYDRO TOTAL THERMAL
COAL LIGNITE GAS/LNG
NUCLEAR TOTAL (%)
CENTRAL 9685 23810 22060 1000 750 3160 36655 (53.2%)
STATE 2637 20352 19365 375 612 - 22989 (33.4%)
PRIVATE 3263 5962 5210 0 752 - 9225 (13.4%)
ALL-INDIA 15585 50124 46635 1375 2114 3160 68869 (100%)
In addition to above, thermal projects totalling to 11,545 MW have been identified as best effort projects. These projects would normally be commissioned in the beginning of 12th Plan but in case of any constraints in taking up of any of the projects included in 11th plan, some of these projects would be tried for commissioning during 11th Plan. Further, a capacity of 13,500 MW has been planned under renewable as per information given by MNRE. As can be seen from the above profile of capacity addition plan, central sector will play a lead role with capacity addition of more than half of the capacity addition target. There has been a good response from states on the need for

Executive Summary Working Group on Power-11th Plan (2007-12)
8
capacity addition to meet their growing demand and the states with IPPs, have been given target for achieving the balance capacity. The State owned capacity projected for the 11th Plan is 33.4 % of the total plan as compared to 27% likely during 10th Plan. Out of feasible capacity addition of 68,869 MW, projects totalling to 31,345 MW are already under construction and the balance projects totalling to 37,524 MW have been committed for implementation by the concerned generating companies during the 11th Plan. Details are furnished in the Table below:
THERMAL BREAKUP SECTOR HYDRO TOTAL
THERMAL COAL LIGNITE GAS/LNG
NUCLEAR TOTAL
Projects Under Construction 11931 16254 14115 1125 1014 3160 31345
Committed Projects 3654 33870 32520 250 1100 - 37524 *
Total 15585 50124 46635 1375 2114 3160 68869 (The details of projects are given in Appendix 1.8- in Chapter-1 of main Working Group Report.) * Note: Out of the projects totalling to 37,524 MW under committed category as given above, orders for Dadri Unit-6 (490 MW) & Mezia Ph-II (1000 MW) has been recently placed. The thermal capacity addition comprises of1 unit of 800 MW, 11 units of 660 MW, 53 units of 500/600 MW class, 49 units of 210/250/300 MW class, 7 units of 110/125 MW class. With the above capacity addition it would be possible to meet the projected energy requirement of 1038 BU (considering peak demand of 1,51,500 MW) for meeting per capita consumption of 1000 units at the end of 11th plan. With this capacity addition it would be feasible to achieve a generation growth rate of 9.5% p.a. (CAGR) 1.5 FUEL REQUIREMENT The requirement of various fuels for the thermal plants during the terminal year of the 11th Plan (2011-12) at normative generation parameters (PLFs and specific fuel consumption is summarised in the table below. This is based on a thermal capacity addition of 20,387MW and 50,124MW during the 10th and 11th Plan respectively.

Executive Summary Working Group on Power-11th Plan (2007-12)
9
Fuel Requirement (Tentative) during 2011-12
Fuel Requirement (2011-12) Coal* 545 MT
Lignite 33 MT
Gas/LNG** 89 MMSCMD
(The details of projects are given in Appendix 1.9- in Chapter-1 of main Working Group Report.)
* From domestic sources, total coal availability is expected to be 482 MT per annum by 2011-12. Accordingly, imported coal of the order of 40MT, equivalent to 63 MT of Indian coal, may have to be organised. This quantity may reduce provided production of domestic coal is increased. ** 89 MMSCMD of gas requirement at 90% PLF has been projected in 2011-12. At present, the availability of gas is of the order of 40 MMSCMD and therefore not sufficient to meet the requirement of even existing plants.
1.6 INITIATIVES DURING 11TH PLAN 1.6.1 High Hydro Development 50,000 MW Hydro Initiative was launched in 2003 and Preliminary Feasibility Report (PFRS) of 162 projects totalling to 48,000 MW were prepared. Out of this 77 projects with total capacity of about 37000 MW for which first year tariff is expected to be less than Rs.2.50/unit were selected for execution. Hydro projects have longer gestation period and therefore there is a need to formulate a 10 year plan for hydro projects. In 11th plan a capacity addition of over 15,500 MW has been targeted keeping in view the present preparedness of these projects. Projects totalling to a capacity of 30,000 MW have been identified for 12th Plan on which necessary preparations have to be made from now onwards to ensure their commissioning during 12th Plan. Thus the effect of 50,000 MW initiative would be visible in 12th Plan period. Preparation of DPR and various clearances and approval etc for these projects are to be obtained during the first two years of 11th Plan. It is recommended that CEA should closely monitor the progress of preparedness of DPR of these projects and their further execution. 1.6.2 Initiatives in Thermal Power Development: Efforts were made to bring in highly efficient super critical technology in the country for thermal power plants and execution of six super critical units of 660 MW capacity each was taken up during the 10th Plan period. The first unit of 660 MW based on super critical technology is likely to be commissioned during the

Executive Summary Working Group on Power-11th Plan (2007-12)
10
first year of 11th Plan i.e. 2007-08. The 11th Plan feasible capacity addition of coal based plants includes 12 units based on super critical technology with a capacity of 8060 MW which is about 18% of total coal capacity planned for 11th Plan. More and more power projects based on super critical technology are under planning stage and they would yield benefit during the 12th Plan period. It is envisaged that more than 50-60% of capacity addition of thermal plants during 12th plan period would be based on super critical units. This would also help in reducing the Carbon dioxide emission from new coal fired capacity. 1.6.3 Ultra Mega Power Projects (UMPP): Ministry of Power in the year 2006 has launched an initiative of development of coal based ultra mega projects with a capacity of 4,000 MW each on tariff based competitive bidding. Ultra Mega Power projects are either pit head based projects having captive mine block or coastal projects based on imported coal. Sasan UMPP, a pithead plant in Chattisgarh based on domestic fuel and Mundra UMPP in Gujrat based on imported coal have already been awarded for execution to the respective developers. According to the bids submitted by these developers only one unit of 660 MW is expected to be commissioned during the 11th Plan and the remaining unit during 12th Plan. Other projects where considerable progress has been made are coastal projects in Andhra Pradesh and Tamil Nadu and a pit head based project in Jharkhand. Further the projects under consideration include pit head projects in Orissa and Chatisgarh and coastal projects in Maharashtra and Karnataka. 1.6.4 Nuclear Power Development: 11th Plan power programme includes 3160 MW of nuclear power plants all of which are under construction. Recently, agreement has been signed with USA in respect of nuclear co-operation which is expected to improve the supply of nuclear fuel for nuclear power plants. It is also expected that execution of nuclear projects will also be opened up to enable participation by other PSUs and private sector. The effect of this is likely to be visible in 12th Plan period. Nuclear Power Corporation of India has indicated a capacity addition of about 11,000 MW during 12th plan. In addition, NTPC have also expressed their intention to enter into the nuclear power arena and have proposed an addition of 2,000 MW during 12th plan period. 1.6.5 Merchant Power Plants: A merchant power plant does not have long term PPA for sale of its power and is generally developed on the balance sheet of developers. Government of India has reserved coal block with reserves of 3.2 Billion Tons of coal for allotment by Screening Committee of Ministry of coal for merchant and captive plants. About 10,000 MW capacity is expected to be developed through this initiative. This capacity has not been taken into account while working out the capacity required

Executive Summary Working Group on Power-11th Plan (2007-12)
11
in the 9.5% growth in generation scenario. Capacity addition through this route would further contribute to better economic growth, better reliability of power, more spinning reserve and above all would promote creation of competition in the electricity market. 1.6.6 Decentralised Distributed Generation (DDG): In some of the remote areas, it is not techno-economically feasible to extend the grid supply. For meeting the demand of such remote areas, it is proposed to set up some power plants based on local energy sources available. These are small hydro and non-conventional sources such as Bio-Mass, Wind, DG sets etc wherein other sources are not available. During the XI plan period a capacity addition of about 5,000 MW of capacity under DDG is envisaged. (Refer Para 3.1 of the Report)
1.7 CAPTIVE POWER PLANTS
The generation from captive power plants at the end of X plan (2006-07) is likely to be about 78 billion units. It is envisaged that during the XI plan period about 12,000 MW capacity power plants would be added to the system which will take care of the demand of the industry and also supply surplus power to the grid under Open Access arrangements which has been allowed as per the Electricity Supply Act, 2003.
It is envisaged that the generation from non utility captive power plants by the year 2011-12 may be of the order of 131 billion units which results into a CAGR of 10.5% p.a in captive generation. 1.8 12TH PLAN SCENARIO The requirement of installed capacity and capacity addition to meet the generation requirement during the 12th Plan period as discussed in Para 1.2.2 of this Report are given in Table below:
Capacity addition required during 12th plan (2012-17)
GDP
Growth GDP
/Electricity Elasticity
Electricity Generation
Required (BU)
Peak Demand
(MW)
Installed Capacity
(MW)
Capacity Addition Required During 12th
PLAN (MW) 0.8 1415 215700 280300 70800 8 % 0.9 1470 224600 291700 82200 0.8 1470 224600 291700 82200 9 % 0.9 1532 233300 303800 94300 0.8 1525 232300 302300 92800 10 % 0.9 1597 244000 317000 107500

Executive Summary Working Group on Power-11th Plan (2007-12)
12
It would be seen from the above table that under various growth scenarios, the capacity addition required during 12th plan would be in the range of 71,000 - 1,07,500 MW, based on normative parameters. The Working Group recommends a capacity addition of 82,200 MW for the 12th Plan based on Scenario of 9% GDP growth rate and an elasticity of 0.8%. During 12th plan about 30,000 MW capacity addition is likely to be based on hydro and about 11,000-13,000 MW will be nuclear based. The balance capacity addition of about 50,000 MW will be from thermal projects. A shelf of projects totalling over 1,50,000 MW has been identified & listed in main report.
1.9 RENOVATION & MODERNIZATION, LIFE EXTENSION AND PIE PROGRAMME
A Renovation and Modernisation (R&M) Programme for Thermal Power Stations was launched by the Government of India all over the country way back in September 1984 for completion during the Seventh Plan Period. This programme was successfully completed and intended benefits were achieved. In the subsequent 8th and 9th Plans, Renovation and Modernisation and Life Extension (LE) works were carried out on a number of older generating units which resulted in improvement in their performance and extension of their useful life. In the 10th plan life extension of 106 Nos of thermal units totalling to 10,413 MW was envisaged. However progress was not satisfactory due to high execution time & cost involved in LE works. The cost of LE was also not economically feasible considering the age of plants and there was reluctance from power plants to shut down their units for longer periods due to prevailing power shortages. In view of above a new initiatives called Partnership of Excellence was taken up. Under this programme generating companies who were performing well provide assistance in improving performance of non-performing units by following measures;
Phase-I: Toning up of O&M Practices Phase-II: Comprehensive Overhaul Phase-III: LE for those units were found techno-economically feasible.
Towards this initiative, CEA identified 22 power stations of 11 utilities, with a capacity of 7930.5 MW across the country. Out of these, 17 stations with an operating capacity of 5050 MW were entrusted to NTPC and one stations (280 MW) to TATA power. On remaining 4 stations the respective utilities are taking their own course of action. The plants entrusted to NTPC recorded an additional generation of power-3690 MUs- corresponding to an equivalent capacity addition

Executive Summary Working Group on Power-11th Plan (2007-12)
13
of 720 MW, considering national average PLF. Capacity addition of this order requires an investment of around Rs.3,000 crore at a Greenfield project. The phase-II of the programme, therefore, needs to be continued. Some additional units have also been identified for R&M and life extension. The decision for investment for R&M/LE will be based on cost benefit analysis. If not economically viable installation of new plants at existing sites, may be considered. (The details of R&M, LE & PIE programme and their status are given in Chapter-1,Para 1.15 of main Working Group Report) 1.10 NEW AND RENEWABLE ENERGY SOURCES The Ministry of New and Renewable Energy Sources (MNRE) have chalked out plan of adding 13,500 MW of renewable power in the country during 11th Plan period. This would make total installed capacity of these plants at 23,500 MW by the year 2011-12 which is detailed as below: Wind - 17000 MW Bio Mass - 3200 MW Small Hydro- 3300 MW Although installed capacity of the plants is high but on an average plant load factor of wind turbine plants is only of the order of 15-20% and as such this capacity can generate about 41 billion units at the maximum. 1.11 RECOMMENDATIONS
1. The Working Group recommends generation planning based on growth of
energy generation requirement of 9.5%. Keeping in view the above objectives and preparedness of various projects the Working Group recommends capacity addition of 68,869 MW during 11th Plan as per details given below:
THERMAL BREAKUP SECTOR HYDRO TOTAL
THERMAL COAL LIGNITE GAS/LNG
NUCLEAR TOTAL (%)
CENTRAL 9685 23810 22060 1000 750 3160 36655 (53.2%)
STATE 2637 20352 19365 375 612 - 22989 (33.4%)
PRIVATE 3263 5962 5210 0 752 - 9225 (13.4%)
ALL-INDIA 15585 50124 46635 1375 2114 3160 68869 (100%)
(Detail list is in Appendix-1.8 of main Working Group Report)

Executive Summary Working Group on Power-11th Plan (2007-12)
14
2. States are required to take an active role in the capacity addition programme by their own agencies & by private sector participation through tariff based competitive bidding route on the lines of developments of Ultra Mega Power Project. In the 11th plan addition of less than 50% of total capacity is targeted in states and private sector. It is recommended that in 12th Plan more than 50% capacity should come through initiative of the states.
3. Some of the states do not have resources for capacity addition in their states. Such states should tie up long term PPAs with surplus states/generation companies.
4. Manufacturing capacity of BHEL needs to be enhanced to meet the capacity addition programme envisaged in 11th & 12th Plans.
5. A 10 year plan for hydro development is to be pursued in view of higher gestation period. A hydro capacity of 30,000 MW has been identified for commissioning during 12th Plan. The survey and investigation, preparation of DPR, statutory clearances should be vigorously followed up right from now to enable their commission during 12th Plan. The CEA should closely monitor progress on these projects. .
6. The Working Group recommends continuation of PIE programme during 11th Plan also.
7. In addition to capacity addition programme, concerted efforts to continue in regard to:
- Development of captive power plants. - Maximising Generation from existing plants. - Energy Efficiency improvement through Energy Audit. - Better O & M practices. - RM&U/Partnership in Excellence (PIE) Programme. - Development of Non-Conventional Energy Sources.
8. Major recommendations for facilitating open access in distribution and
harnessing surplus captive generation in the country are as under:
Reasonable cross subsidy surcharge and other charges to provide some economic incentive to the generators to avail open access.
The SERCs should allow recovery of some portion of fixed cost in addition to the variable cost of captive generation. The captive generators may offer their surplus power on the basis of a firm schedule. Infirm power from CPP should also be considered for purchase.
There should be no penalty for reduction of contract demand by any industry having captive plant.

Executive Summary Working Group on Power-11th Plan (2007-12)
15
2.0 TRANSMISSION PLANNING INCLUDING NATIONAL GRID The transmission system facilities had earlier been planned on regional basis with provision of inter-regional link to transfer regional surplus power arising out of diversity in demand. The generation resources in the country are unevenly located, the hydro in the northern and north-eastern states and coal being mainly in the eastern part of the country. Development of strong National Grid has become necessity to ensure reliable supply of power to all. The planning & operation of the transmission system has thus shifted from regional to national level. Formation of a strong National Power Grid has been recognized as a flagship endeavour to steer the development of Power System on planned path leading to cost effective fulfilment of the objective of ‘Electricity to All’ at affordable prices. A strong All India Grid would enable exploitation of unevenly distributed generation resources in the country to their optimum potential by providing enhanced margins in inter-regional transmission system. These margins, together with open access in transmission, would facilitate increased trading in electricity leading to market determined generation dispatches thereby resulting in supply at reduced prices to the distribution utilities and ultimately to consumers benefit. 2.1 PROGRAMME OF DEVELOPMENT OF NATIONAL GRID As on today, the inter-regional transmission capacity of 11,450 MW is existing and inter-regional energy exchanges of more than 12 billion kWh in a year are taking place contributing to optimum utilization of generation capacity. The program is to achieve inter-regional capacity of 15750 MW by the end of 10th Plan and about 37,150 MW by the end of 11th Plan. Transmission systems within the regions to support the above inter-regional transmission capacity has been also planned. The plan for National Power Grid and the schemes have been identified. (Ref 2.2 of Main Working group Report) 2.2 North Eastern region, Sikkim and Bhutan have vast untapped hydro potential which is planned for development during 11th plan and beyond. A major component of this power will be utilised by deficit states in the northern and western region and for which reliable evacuation system is planned to be developed. The requirement of transmission system for evacuation of NER hydro power has been estimated corresponding to the capacity of hydro projects which may be feasible to develop say in the next about 20 years. This generation is estimated to be about 35000 MW in NER, about 8000 MW in Sikkim and about 15000 MW in Bhutan. Taking local development at accelerated pace resulting in demand within the NER, Sikkim and Bhutan to be in the range of 10000 – 12000 MW (presently it is about 1500 MW), the transmission requirement through the chicken neck works out to be of the order of 45000 MW. The total requirement including additional circuits for meeting the contingencies and reliability needs,

Executive Summary Working Group on Power-11th Plan (2007-12)
16
would work out to 7 or 8 numbers of 800 KV HVDC bi-pole lines and 4 or 5 numbers of 400kV double circuit lines – a total of 12 numbers of high capacity transmission corridors passing through the chicken neck. For this, RoW requirement would be about 1.5 Km in width considering minimum distance between adjacent towers to be such that fall of any tower does not affect the adjoining line. The first 800kV HVDC bi-pole line has been planned from a pooling substation at Biswanath Chariyali in North-eastern Region to Agra in Northern region. This is being programmed for commissioning matching with Subansiri Lower HEP in 2011-12. 2.3 ASSESSMENT OF TRANSMISSION CAPACITY REQUIREMENT The focus of transmission system development programme for the XI Plan is to provide adequate inter-regional and intra-regional transmission capacity so as to consolidate and strengthen the National Grid network towards a strong All India Grid. The inter-regional power exchange requirement has been assessed from possible scenarios of regional surpluses and deficit for the peak and off-peak conditions of winter, summer and monsoon months. Projections of deficit/surplus based on which transmission requirement has been assessed are given in Chapter-8 of this report. The projection based on programme of generation and anticipated demand aims at estimating the transmission requirement at the inter-regional level. Grid expansion plan evolved based on this projection would be able to cater to the needs of various feasible operating scenarios and also provide required margins to support market oriented power exchanges. (Ref Para 2.3 of main Working Group Report) 2.4 TRANSMISSION CAPACITY FOR TRADING The above method adopted for evolving the transmission system expansion plan provides sufficient transmission capacities which would have inherent margins for trading transactions. Transmission system implemented on the basis of the expansion plan evolved in this manner would enable trading across the regional boundaries towards optimal utilization of generation resources in the country for ultimate benefit of the consumer. As the system is evolved based on extreme dispatches, it would facilitate trading most of the time without congestion. Currently, trading is taking place through short-term bilateral contracts. With introduction of Power Exchange at National level, which is being envisaged to be in place in near future, trading would also take place through Power Exchange which would be day ahead contracts. All the short term as well as Power exchange transaction would need transmission capacity which would come out of the spare capacity inbuilt in the transmission system. The reliability and operational margins in the planned and implemented transmission system corresponding to the committed long-term transmission needs would provide the transmission capacity for trading of power. (Ref Para 2.5 of main Working Group Report)

Executive Summary Working Group on Power-11th Plan (2007-12)
17
2.5 TRANSMISSION CAPACITY MARGINS Transmission capacity through creation of additional transmission system could be provided based on long-term commitment for the transmission charges. It has been estimated that reliability and operation margins would be generally of the order of 25-30% of the transmission capacities required for meeting the firm transmission needs of the long-term open access. This level of redundancy would generally provided sufficient margins for trading needs. However, it should be noted that short-term open access (STOA) transactions operating on these margins, even if curtailable, cause reduction in the security level. Therefore, unless margins are increased by design, the system operator would have tendency to keep cushions by underestimating the operational margins. As such, and as the system security is of paramount importance, creation of increased margins by design becomes essential for accommodating STOA. (Ref para 2.5 of main Working Group Report) 2.6 TRANSMISSION PLANNING CRITERIA The network expansion has been planned to provide a reliable power system with sufficient redundancies for secure operation maintaining adequate margins at all times to maintain system parameters with in such limits that contingencies do not lead to loss of system integrity. The contingency criteria is based on ‘N-1’ in general and ‘N-2’ for large generating complexes and multi-line corridors. 2.7 TRANSMISSION SYSTEM FOR MERCHANT PLANTS Merchant plants would sell their power to customers who are not predetermined through Power exchange contracts. However, they are long term-user of the transmission system. The transmission system for the connectivity of the merchant plant as well as for meeting their transmission needs is required to be planned and built matching with the implementation of the merchant generation plant. Also, some of the generation plants have only a part of their generation capacity tied-up in long-term bi-lateral PPAs. When such plants seek long-term open access only for a part of their full generation capacity, they inherently also seek connectivity for the remaining capacity which would be available with them as a merchant plant capacity. As the transmission system in both the cases would be required to be planned and implemented corresponding to the full requirement, they are long-term beneficiary of the transmission system. For proper planning and implementation of transmission system, the merchant generators need to inform about region(s) in which they would generally sell their power, so that transmission system requirement for evacuation of their power and transmitting it to identified load centres could be assessed and any additional capacity required could be planned. As building the identified transmission schemes including obtaining necessary approvals by the identified transmission

Executive Summary Working Group on Power-11th Plan (2007-12)
18
company /companies would generally require almost same time as that for implementation generation projects, firming up of sellers and assessment of transmission requirement should be started at the earliest. (Ref para 2.5 of main Working Group Report) 2.8 TRANSMISSION SYSTEM UNDER STATE SECTOR A well planned and reliable transmission system at the National and Regional level would need to be complemented with development of matching transmission system at 220kV and 132kV and also the sub-transmission and distribution system so as to cater to the load growth and ensure proper utilisation of development in generation and transmission facilities for the ultimate goal of delivery of the services up to the end consumers in the country. Inadequate development of sub-transmission and distribution system facilities in the States of NER has been adversely affecting the reliability of power supply to the consumers and also hampering the load growth in the region. The transmission, sub-transmission and distribution systems of states require major strengthening/up-gradation. Transmission lines that are under outage require speedy restoration for bringing them into operation so that the states could avail their central sector shares as well as utilize their own generation without any constraint. Inadequacies in the transmission and distribution system had been on account of slow implementation of schemes due to various factors such as time consumed in E&F clearances, land acquisition, RoW constraints, fund limitation, organizational difficulties of state utilities, lack of vendor response due to locational factors, law and order, terrain specific difficulties, etc. Due to limited funding capabilities of state utilities, most of the required transmission projects are generally funded by NEC or by NLCPR under DONER and investment/funding approval of scheme so funded also takes additional time. All these issues need to be addressed to achieve the accelerated demand growth in NER. 2.9 ELEVENTH PLAN PROGRAMME 2.9.1 Evolving the Perspective Transmission System for XI Plan In transmission system development in the country, the focus of XI Plan programme is formation of the National Power Grid. A strong All India Grid would enable exploitation of unevenly distributed generation resources in the country to their optimum potential. The transmission capacity together with the margins provided for required redundancies as per planning criteria would provide a reliable transmission system. This would meet the firm transmission needs and with open access in transmission, would facilitate increased real time trading in electricity leading to market determined generation dispatches thereby resulting

Executive Summary Working Group on Power-11th Plan (2007-12)
19
in supply at reduced prices to the distribution utilities and ultimately to the consumers. Development of National Grid has been necessitated by the large thermal generation potential in eastern part of the country and equally large hydro generation potential in north-eastern part. It has also been spurred by the opportunity provided by open access, variation in hydrology / hydro potential and diversity of load across the country. It is envisaged to add during the XI plan period new inter-regional capacities of 20700 MW at 220kV and above. This would increase the total inter-regional transmission capacity of National Power Grid at 220kV and above from 16450 MW of XI Plan beginning to 37150 MW by 2011-12. (Ref Para 2.3 of main Working Group Report) 2.9.2 Fund Requirement for Transmission System Development and
Related Schemes Total Fund requirement for transmission system development and related schemes has been estimated as following: Rs Crores
Inter State system 75000 Intra State system 65000 TOTAL 140000
(For details please refer to Para 2.8 of main Working Group Report) 2.10 TECHNOLOGY DEVELOPMENT
2.10.1 Adopting New Technologies In Transmission System New technologies would need to be adopted and implemented in a proactive manner to achieve the objective of optimum utilization of the available transmission assets as well as conservation of Right-of-Way, reducing transmission costs, reduction of losses etc. Some of the new technologies adopted/being adopted in its transmission system include:
• High capacity 6000MW +800kV HVDC system • 765kV AC Transmission System • Ultra High Voltage AC Transmission System(1000kV) • Application of Series Compensation • Flexible AC Transmission System (FACTS) • Upgradation/Uprating of transmission line • High temperature endurance conductor • Tall/Multi-circuit & Compact tower • High Surge Impedance Loading Line (HSIL)

Executive Summary Working Group on Power-11th Plan (2007-12)
20
• Remote operation of substation, substation automation and Gas Insulated substation (GIS)
• All Aluminum Alloy Conductors (AAAC) and Polymer/Composite Insulators.
• Development of disc insulators of 320kN & 420kN indigenously for both AC & HVDC applications, as import substitution.
• Indigenous development of semi-conducting glazed insulators (Offering better pollution performance)
• Introduced source/process inspection of equipment to ensure zero defect • Airborne Laser Terrain Mapping (ALTM) for detailed route survey • Thermo-vision scanning of the lines and sub-stations • Conditional monitoring of equipment • Preventive maintenance of Transformers using State-of-art Oil testing
laboratories set up by the company • Emergency Restoration System (ERS)
For modernization of transmission system through latest technology integration, two pronged strategies have been envisaged as under:
• Enhance capacity and reliability of existing systems. • Suitable technology for new systems keeping in view the long term
perspective
3.0 DISTRIBUTION INCLUDING VILLAGE & HOUSEHOLD
ELECTRIFICATION 3.1 OVERVIEW OF DISTRIBUTION SECTOR The electricity distribution section is the most daunting sector due to its interface with the public at large with different needs and expectations and varying degrees of capacity to pay. The distribution sector is the cutting edge and as the need to improve this sector was realized, in the 10th plan the emphasis was on steps to reduce the huge aggregate technical and commercial losses, control the theft & pilferage and rationalise the tariff structures. Investment was also made in the distribution sector and across the states reforms were taken up. Major schemes like Accelerated Power Development & Reform Program for urban areas and the Rajiv Gandhi Grameen Vidyutikaran Yojana was also initiated in the 10th plan which aimed at bringing in investment in urban areas and creating an electricity infrastructure in rural areas. There is however a pressing need to continue these efforts in the 11th plan so as to reduce the AT&C losses and to continue with the reforms in the distribution sector to provide an affordable, good quality and reliable power supply to the citizen of India, be it in urban or rural areas.

Executive Summary Working Group on Power-11th Plan (2007-12)
21
The distribution of power can be studied in two distinct components viz. ,
(i) Distribution of power in urban areas, and (ii) Distribution of power in rural areas.
(Refer Para 3.0 of main Working Group Report) 3.2 QUALITATIVE APPROACH 3.2.1 Distribution of power in urban areas The Accelerated Power Development & Reform Program (ARDRP) was aimed at bringing about improvement in the urban distribution sector by funding investment in the distribution network, and by incentivising the states who performed well in reducing losses. The Ministry of Power constituted a task force in 2006 under Shri P. Abraham which has recommended that APDRP may be continued with investment and incentive component beyond the 10th plan. However the conditions may be made more stringent and reform oriented. While broadly agreeing with recommendations of the Abraham Committee report, it is felt that APDRP needs to be continued in 11th plan with revised terms and conditions. The focus of the programme should be on establishment of base line data, which shall enable reduction of AT&C losses in major towns of the country through strengthening , upgradation of sub-transmission and distribution network and adoption of Information Technology in the areas of energy accounting & auditing and improvement in consumer services through establishment of Bijlee Sewa Kendras. The programme may focus on the town and cities covering all district headquarters and town with population of more than 50,000 and town with lesser population in special category sates . The investment and incentive components may be merged and funding may be in form of loan assistance with the provision of conversion of loan to incentives to the distribution companies on achieving specified milestones with regard of reforms and reduction of AT&C losses. There also needs to be a provision of incentive to the employees of the utilities. The loan assistance may be converted to grant (50 % for general category states and 90 % for special category states) and the loan should be from Central Sector with a moratorium of three years on interest and on repayment. The rate of interest may be as determined by Ministry of Finance from time to time. ADDRP assistance should be also available to private distribution companies as the ultimate beneficiary was the consumer. The loan / grant needs to be funded under Central sector through REC / PFC. 3.2.2 Distribution of power to rural areas RGGVY (Rajiv Gandhi Grameen Vidyutikaran Yojna) aims to achieve power for all by 2009 and in the long run accelerate rural development, adequate employment and eliminate poverty through irrigation, development of small scale industries, provision of health care and promotion of education and information

Executive Summary Working Group on Power-11th Plan (2007-12)
22
technology. RGGVY also aims at bridging the urban rural gap and provide reliable quality power supplies to rural areas. However, in order to bring about access to electricity to all rural households, there would be need to widen the electricity coverage to hamlets / habitations of the country. In case the funding of RGGVY becomes a constraint it is proposed that in the first phase all un-electrified villages and hamlets with more than 300 population are covered. Those hamlets with less then 300 populations may be excluded except those in hilly, forest, desert and tribal areas. The total cost of phase 1 is estimated at Rs. 24,000 crore. Phase 1 would be completed by 2009 and would reach electricity to all the un-electrified villages and about 3 lakh hamlets. The second phase would start from 2009 onwards and would reach electricity to the balance un-electrified hamlets and complete the task of providing access to all rural households by 2012 . Second phase is estimated around Rs. 16,000 crores. The two phases is estimated around at Rs. 40,000 crores . (Refer Para 3.7 of main Working Group Report) 3.2.3 Prioritization of RGGVY Maximum number of un-electrified villages exist in the under developed States. RGGVY programme should give top priority in the allocation of funds for these States. Second priority should be given for intensive electrification of such States where the household electrification is below the national average. Third priority should be on the intensive electrification for the remaining States. (Refer Para 3.7.2 of main Working Group Report) 3.2.4 Public Private Partnership through rural franchisees Management of rural infrastructure has to be based upon all inclusive growth model that involves rural set ups and provides the local Panchayat Raj institutions a supervisory function to ensure the durability and sustainability of electricity infrastructure. Franchisee system for management of rural distribution has been made mandatory under RGGVY to make the revenue model sustainable. RGGVY allows enterprising individuals, NGOs, private entrepreneurs, co-operatives, Panchayat Raj institutions to become franchisees. The franchisees system needs major push in 11th plan with initiatives for capacity building and financial support. (Refer Para 3.23 of main Working Group Report)

Executive Summary Working Group on Power-11th Plan (2007-12)
23
3.2.5 Financial support to Franchisees Not many people are coming forward for franchiseeship especially from remote rural areas where loads are small and sustainability difficult. As franchisees will be mainly rural entrepreneurs, they will have difficulties in raising small funds for their micro level projects to guarantee their performance or meet working capital requirements. No funds have been allocated under RGGVY for development of franchisees. It is necessary to develop institutions that extend micro credit to meet the franchise level financing needs. 3.2.6 Distribution of power in Rural Areas through Decentralized
Distributed Generation (DDG) Electricity Act, 2003 provides the requisite framework for accelerating electrification in rural areas with necessary empowerment. It permits operation of stand alone systems independent of the regulatory regime. Integrated Energy Policy 2006 has estimated the requirement of power at 8,00,000 MW by 2031. It implies that India must add 25000 MW or more every year for a quarter century. It is a colossal task and would require exploitation of all renewable and fossil resources. Secondly, the creation of huge rural village and block level electricity infrastructure will require immediate supply of power. Village level energy resources like biomass, hydro and solar energy will help to reduce the dependence on grid based thermal, gas nuclear and hydro power. India has a potential to generate 10-15000 MW of power from the available biomass. DDG based on this resource will meet the critical needs of parched villages asking for timely power. Cost of electricity should be based on cost to serve basis and DDG to be taken up on a mission mode. Viability gap funding may be adopted in case of grid interconnected schemes. Bio mass cultivation may be encouraged to support DDG and bio-fuel cultivation to be funded by Financial Institutions (FIs) / Banks. However, multifuel technologies may be encouraged. (Refer Para 3.10 of main Working Group Report) 3.2.7 Pilot Programmes on DDG The problem of providing power to rural areas would be critical when the infrastructure under RGGVY becomes ready but remains without the supply of power. To attract the entrepreneurs, REC may be encouraged to put up pilot projects in the selective rural areas to have a demonstrative effect. Such projects could be linked to the neighboring substations and incorporated as the long-term lease infrastructure under RGGVY on cheaper finance. DDG will go a long way to ameliorate the shortages of power in rural areas. Nationwide survey of available resources in each villages to be undertaken in fixed time frame through a nodal agency like REC. (Refer Para 3.10 of main Working Group Report)

Executive Summary Working Group on Power-11th Plan (2007-12)
24
3.2.8 One Megawatt Power Plants in Rural Areas To meet the power supply requirements of rural areas stand alone / grid connected power plants of optimum one megawatt capacity power plants should be encouraged. REC should act as nodal agency for providing technical and financial support under the scheme. (Refer Para 3.18 of main Working Group Report) 3.2.9 Akshay Prakash Yojana Maharashtra has launched a new programme called Akshay Prakash Yojana aimed at demand side management. This programme has shown good results in ensuring quality and reliable supply of power to the villages. Both consumers and utilities are benefiting under this programme. It is recommended that this programme should be popularized among other utilities. 3.2.10 Centres for Excellence for Distribution of Power The Electricity Act has opened new avenues for variety of players to take up distribution of power. In the changed environment and to seize the new opportunities REC should set up centres of excellence for distribution of power in all the states to take up rural distribution by setting up a subsidiary company. (Refer Para 3.18 of main Working Group Report) 3.2.11 Non Discriminatory Supply Option RGGVY scheme provides for making adequate arrangements for supply of electricity and there should be no discrimination in the hours of supply between rural and urban areas. To achieve this, there should be a clear allocation of Power Supply for the rural areas. 3.2.12 Agricultural Sector Agricultural consumption comprises of approx 20% to 40% of the total consumption of the utility in the states. There is a fear with regard to depletion of water table due to unrestricted exploitation of the ground water. The adoption of flat rate pricing for agricultural power is cause for this perverse state of affairs. Under this system, a farmer pays a fixed price per horsepower per month for electricity. Therefore, the marginal cost of pumping water is zero. This leads to energy wastage, over-pumping and inefficient selection of crops. Flat rate pumping also masks the true cost of power to farmers. Agriculture consumption is mostly un-metered and this allows manipulation of the loss by the utilities in the name of Agriculture Consumption therefore, during the 11th plan all agriculture connections need to be compulsorily metered

Executive Summary Working Group on Power-11th Plan (2007-12)
25
3.2.13 Energization of Pumpsets in Eastern Region
Eastern sectors’ irrigation potential should be fully exploited during 11th Plan by launching a special scheme for energization of pumpsets. It is estimated that Eastern region has only 10% agricultural consumers. A targeted programme will not only provide livelihood to the poor farmers but also provide food security to the nation. Out of 35 lakh pumpsets energisation targeted for 11th Plan, 20 lakh should be taken up in the Eastern region and other states where huge potential exists 3.2.14 North-East and Backward Regions
In all the backward and north-eastern States the programme of electricity distribution projects need to be supported with low cost funds along with substantial portion of subsidy or grants. Rural Infrastructure Development Funds (RIDF) available with NABARD should be utilized for the development of electricity distribution in the North-eastern and other backward regions of the country. For the System Improvement Schemes in these regions RIDF funds may be allowed to be utilized for making available cheaper credit for an accelerated development of these regions.
3.2.15 Tariffs Performance based regulation through Multi Year Tariff (MYT) framework, is an important incentive to minimize risks for utilities and consumers, promote efficiency and rapid reduction of system losses. It would also bring greater predictability to consumer tariffs by restricting tariff adjustments to known indicators. Benchmarking should be properly adopted after adequate studies to establish the desired performance standards. Regular review of the performance levels also need to be suitably undertaken. As regards Agricultural tariff it should be in consonance with the sustainable water management requirements. A higher level of subsidies could be considered to support poorer farmers of the region where adverse ground water table condition requires larger quantity of electricity for irrigation purposes but restricted suitably for maintaining ground water levels for a sustainable usage. Even a combined tariff in such cases for electricity and water may be an option to consider. Differential tariffs for usage during different time of the day i.e. distribution based on peaking or off peak hours etc. needs to be introduced expeditiously by introducing Time of the day Metering to flatten the demand curve to more manageable levels
Executive Summary Working Group on Power-11th Plan (2007-12)
26
3.2.16 Open Access Access to transmission and distribution network is one of the most important elements of Electricity Act 2003 and National Electricity Policy 2005. At the retail level the consumers with a minimum requirement of 1 MW are to be granted the right to avail open access by 2009 in a phased manner. A consumer allowed open access under the regulations is therefore free to choose any electricity supplier other than the distribution licensee of its area. The major issue in making open access operational is the level of cross-subsidy and other charges applicable to open access consumers. Most states have released open access regulations with the open access phasing plan time frame. The incumbent licensee may not like migration of creamy customers and put barriers to prevent it. The open access customers may also fear discrimination on availing supply from alternative source to the current retail supplies. In this context the regulators have an important role to play in encouraging open access. The 11th plan should focus on creating awareness, providing communication, customer protection and promoting open access to the consumers as envisaged in the Electricity Act 2003. Open access in distribution should be in place including phasing out of cross subsidy surcharge by end of 11th plan. 3.2.17 Other issues • Newly created distribution companies (consequent to reorganization of SEBs)
need to be given full autonomy. This should be a condition for release of central assistance to the states.
• Huge investment is required for distribution network up gradation. The central govt. should provide resources to the State Utilities with the condition that large part would be treated as grant if targeted reduction in T&D losses is achieved. There is a need to popularize TOD tariff.
• Separate distribution companies could be carved out for rural areas so that subsidy could be targeted to only needy and poor consumers. Forum of Regulators should come out with a model agreement for distribution of electricity by distribution licensees through a franchisee in urban area.
• The licensee should have discretion to give rebate to a category of consumers in the tariff determined by ERCs, if he considers it necessary, for effectively facing the competition caused by open access in distribution.
• Where applicable , carbon credits should be obtained. • A business model including simplified tariff determination for generation- cum-
distribution projects in rural areas should be developed to facilitate these projects.

Executive Summary Working Group on Power-11th Plan (2007-12)
27
3.3 QUANTITATIVE ASSESSMENT OF 11TH PLAN PROGRAMME
The expected outcomes from the 11th plan programme is given at Para 3.25 of the report. 3.4 ISSUES OF INSTITUTIONAL NATURE LIKE CENTRAL , STATE &
PRIVATE SECTOR 3.4.1 Enlarging Role of central Government Central Government should consider enlarging its role in the area of rural distribution and generating station to give power to consumers in the vicinity. Financial Institutions should support bio-diesel plantations, consultancy, R&D, DPR preparation etc. The priority sector status available to REC for the energisation of Agricultural pumpsets etc was recently withdrawn which should be restored in order to enhance the pumpset energisation programme during the 11th plan to at least 35 lakh pumpsets. REC/PFC may finance the power equipment manufacturers in their modernization and expansion plans. REC/PFC may float Venture Capital Funds to encourage manufacture of critical quality components used for power infrastructure and promote ready market for such products at competitive rates. 3.4.2 State All concessions extended by States for Industrial development may be given for DDG projects. A separate Rural Electricity Agency (REA) may be considered for each state to look into needs of rural areas. The State Govts., State Utilities/ Discoms and Local administration should create proper enabling atmosphere to encourage DDG projects. 3.4.3 District Committees/ Local Management The District Committees should be suitably strengthened, made fully functional and active during the 11th Plan. This should cover all the districts in the country. Specific funds should be allotted to the District Committees. Local institutions like

Executive Summary Working Group on Power-11th Plan (2007-12)
28
Panchayat, cooperatives, NGOs, SHGs should be encouraged to take up local management. 3.4.4 Private The APDRP assistance, both investment and incentive component, may be extended to the Private Distribution Utilities also. The incentive for loss reduction by the private utilities may be given to the State instead of the utility. 3.5 TECHNOLOGY ASSESSMENT AND NEEDS 3.5.1 Pre-paid Meters Pre-paid meters, should be promoted in the 11th Plan. This will enable efficient use of power for agricultural use and will also eliminate adverse impact on water table due to excessive exploitation of ground water. Though it involves huge capital cost the gains from the system would offset such costs in the long run. It is also expected that large scale use would bring down the cost of the technologies.
3.5.2 HVDS System
The advantages of HVDS system are well known particularly in containing theft of electricity. Besides, it improves the quality of power significantly and thereby customer satisfaction. HVDS system needs to be given a special focus in the 11th Plan to get immediate results in loss reduction. Efforts should be made to bring down HT/LT ratio during the 11th Plan.
(Refer Para 3.17 of main Working Group Report) 3.5.3 Priority to IT applications
It is well established that IT application can play a major role in AT&C loss reduction and provide management of distribution utilities. The IT task force clearly laid out a plan for introduction of IT on a large scale in the power distribution sector. The task force recommendation should be implemented. It is also suggested that the incentive fund under APDRP should be re-deployed for promoting cost effective IT in the entire distribution sector.
3.5.4 Customer Indexing & GIS based Database
Customer indexing is absent in most of the utilities. This is a major impediment for any reform in the sector. Consumer indexing has been done by some utilities but incomplete. Consumer indexing based on GIS application needs to be given priority in the 11th Plan. 3.5.5 Load Management

Executive Summary Working Group on Power-11th Plan (2007-12)
29
In the scenario of energy and peak shortages, load management plays a very important role for efficient use of energy. Feeder separation programme needs to be given a major push in those states where agricultural consumption is more than 20%. In addition SCADA/DA should be introduced in all the million plus towns by the end of 11th Plan.
3.5.6 Demand Side Management & Energy Efficiency Using of energy efficient devices should be incentivised. The focus should be on use of efficient pumpsets in the agricultural sector. Use of CFL lighting etc. should be encouraged. An awareness campaign should be launched to educate stakeholders at all levels and quantifiable targets should be fixed to improve energy efficiency gains. 3.5.7 Reliability Monitoring of Power Distribution System
Present reliability of power is carried out by CEA in terms of outages of 11 kV feeders on monthly basis in respect of State capitals and major urban conglomeration. There are number of reliability indices which are in practice internationally. The international practices should be adopted for proper monitoring of reliability. The reliability monitoring is to be gradually brought in line with the world practice i.e. to measure the outage in terms of consumer hours and number of consumer interruptions. The reliability monitoring will become more fruitful once “Consumer Indexing” i.e. linking of every consumer to the feeder is completed by all the Discoms /SEBs and will provide a direct index for customer satisfaction.
3.5.8 Distribution Network Planning
Inadequate network planning is one of the reasons for hap-hazard and un-scientific development of the distribution system. The utility should move to proper distribution network planning both for demand forecasting on medium and long term basis and for determining need for system expansion and improvement to meet the load growth. Utility should prepare perspective network plan for 10 year period and this should become part of the conditionalities for sanction of grants under various programmes. 3.5.9 Energy Accounting & Auditing Energy Accounting & Auditing is done in many utilities but not comprehensive. In absence of complete energy accounting and auditing, the system losses can not be measured accurately and also identification of areas of losses becomes difficult. 11th Plan should make efforts to standardize energy accounting and auditing practices and incentivize utilities undertakings complete accounting and auditing exercise.

Executive Summary Working Group on Power-11th Plan (2007-12)
30
3.6 ASSESSMENT OF FINANCIAL REQUIREMENTS
The detailed table of quantities and financial requirements for 11th plan are given at Para 3.25 of report. However, the final summary of the estimated cost is given below:
1. Sub Transmission & Distribution for Urban & Rural areas: Rs. 1, 97,000 crore RGGVY Rs. 40,000 crore Rs. 2, 37,000 crore 2. APDRP & Other Schemes (pumpsets etc.) Rs. 40,000 crore 3. Decentralised Distributed Generation Rs. 20, 000 crore 4. Others Rs. 10,000 crore TOTAL Rs. 3,07,000 crore
3.7 RECOMMENDATIONS
1. ARPDP to be continued in 11th plan with focus on auditing and accounting and reducing AT&C losses in major town and cities It interventions,technological upgradation, control of theft and pilferage, GIS and consumer indexing and establishment of Bijlee Sewa Kendra.
2. RGGVY needs to be continued with more focus and with regular flow of
funds so that the envisaged benefits reach the rural masses. 3. Franchisees need to be developed in both urban and rural areas. A
scheme of public private partnership for franchisees development may be encouraged .and adequate financial support through liberal micro credit schemes needs to be given for encouraging franchisee development.
4. Decentralised distributed generation needs to be taken up in a mission
mode. Pilot projects needs to be set up initially to gain experience. DDG proposals may be offered capital subsidies under the public private partnership scheme for viability gap funding nation wide survey may be undertaken to analyse resources for DDG.
5. One megawatt power plants in rural areas to be encouraged.
6. Centre for excellence in distribution to be set up.
7. Capacity building programmes of franchisees to be vigorously followed.
8. Special programme of energisation of pump sets in eastern region to be
implemented.

Executive Summary Working Group on Power-11th Plan (2007-12)
31
9. Open access in distribution section to be encouraged.
10. Multi year tariffs and rationalization of tariff to be implemented.
11. IT applications to be given priority.
12. Prepaid meters, HVDC systems, consumer indexing, GIS based database, reliability indexing, energy efficiency, demand side management and energy accounting and auditing to be implemented.
4.0 DEMAND SIDE MANAGEMENT, ENERGY EFFICIENCY &
ENERGY CONSERVATION
4.1 THE ENERGY CONSERVATION ACT AND INTEGRATED ENERGY POLICY
The 10thplan period (2002-07) marked the enactment of the Energy Conservation Act, 2001 and setting up of the Bureau of Energy Efficiency (BEE) at the national level. The Act has given the mandate to BEE to implement the provisions of the Act, and spearhead the improvement in energy efficiency of the economy through various regulatory and promotional measures. The Planning Commission in its recent report on an Integrated Energy Policy (IEP) laid out a vision of providing energy security to all citizens. IEP emphasizes energy efficiency & demand side management as essential components of the natural energy strategy. The Sub-Group report focuses on operationalizing and implementing the recommendations of the integrated energy policy. (Refer Para 4.2 of main Working Group Report) 4.2 ENERGY CONSERVATION STRATEGY IN THE 11TH FIVE-YEAR PLAN The basic aim of the energy conservation strategy in the 11th Five Year Plan is to create and strengthen institutions at the centre and in the states to carry out the provisions of the EC Act 2001, in line with the recommendations of the Integrated Energy Policy. The strategy will strengthen the existing institutional linkages, pursue the task of consolidating energy conservation information, trends and achievements, and create a market for energy conservation and for energy efficient goods and services. (Refer Para 4.3 of main Working Group Report)

Executive Summary Working Group on Power-11th Plan (2007-12)
32
4.2.1 Strengthening of BEE and SDAs In the 11th Five Year Plan, BEE will be strengthened as a nodal organization at the national level, and will be empowered to provide direction to the energy conservation programmes in the States. An ‘Energy Conservation Information Centre’ (ECIC) will be set up within BEE to collate energy use data, and analyze energy consumption trends and monitor energy conservation achievements in the country. Supporting organizational set-up will also be strengthened in the state designated agencies (SDAs) in various States and Union Territories (UTs). For this, a matching grant support from Central Government restricted to the contribution made by the respective States/UTs Governments will be extended to establish State Energy Conservation Fund as mandated under EC Act. (Refer Para 4.3.2 of main Working Group Report) 4.2.2. Energy Conservation Programmes in the Targeted Sectors In the 11th Five Year Plan, BEE will focus energy conservation programmes in the following targeted sectors: Targeted sectors (i) Industrial Sector (Energy Intensive Industries). BEE will develop 15 industry specific energy efficiency manuals/guides for the following sectors: Aluminium, Fertilizers, Iron &Steel, Cement, Pulp & Paper, Chlor Alkali, sugar, textile, chemicals, Railways, Port trust, Transport Sector (industries and services), Petrochemical &Petroleum Refineries, Thermal Power Stations & Hydel power stations , electricity transmission companies & distribution companies. The manuals will cover Specific energy consumption norms as required to be established under the EC Act, energy efficient processes and technologies, best practices, case studies etc. Follow up activities will be undertaken in the States by SDAs and manuals will be disseminated to all the concerned units in the industries. (Refer Para 4.3.5 of main Working Group Report) (ii) Small and Medium Enterprises (SMEs) SDAs in consultation with BEE will initiate diagnostic studies in 25 number of SMEs clusters in the country, including 4-5 priority clusters in North East Region, and develop cluster specific energy efficiency manuals/booklets, and other documents to enhance energy conservation in SMEs. (Refer Para 4.3.5 of main Working Group Report)

Executive Summary Working Group on Power-11th Plan (2007-12)
33
(iii) Commercial Buildings and Establishments BEE will prepare building specific energy efficiency manuals covering Specific energy consumption norms, energy efficient technologies, best practices etc. As a follow up, SDAs would initiate energy audits and their implementation in 10 Government buildings in each state and 1-2 buildings at UT level. BEE will also assist SDAs in the establishment and promulgation of energy conservation building codes (ECBC) in the States, and facilitate SDAs to adapt ECBC. (Refer Para 4.3.5 of main Working Group Report) (iv) Residential/Domestic sector BEE will enhance its on-going energy labeling programme to include 10 other -appliances - Air conditioners , Ceiling Fans , Agricultural pump-sets , Electric motors ( general purpose) , CFLs, FTL – 61cm, Television sets , Microwave ovens, Set top boxes , DVD players and Desk top monitors. To facilitate this consumer awareness will also be enhanced nation wide. (Refer Para 4.3.5 of main report) (v) Street Lighting & Municipal Water Pumping To promote energy efficiency in municipal areas in various states, SDAs in association with State utilities will initiate pilot energy conservation projects in selected municipal water pumping systems and street lighting to provide basis for designing state level programmes. (Refer Para 4.3.5 of main Working Group Report) (vi) Agriculture Sector In the 11th Plan, SDAs will collect document and disseminate information on successful projects implemented in some states, launch awareness campaigns in all regional languages in print and electronic media, and initiate development of state level programmes along with utilities. (Refer Para 4.3.5 of main Working Group Report) (vii) Transport Sector SDAs with assistance of concerned institutions/agencies will conduct diagnostic studies to establish the status of energy consumption and conservation in the sector. BEE will also set up labeling and/or norms for specific fuel consumption for a few automobile and Transport categories (Services/ Public transport). (Refer Para 4.3.5 of main Working Group Report)

Executive Summary Working Group on Power-11th Plan (2007-12)
34
4.2.3 Demand Side Management Programmes BEE in association with SDAs will facilitate State Utilities to pursue DSM options by focusing on orientation workshops for awareness building, setting up of DSM cells in utilities to conceive and implement DSM programs, support load research and studies to rationalize the tariff structures, and initiation of DSM programmes, especially in the residential, agricultural pumping and municipal water works & street lighting sectors (Refer Para 4.3.6 of main Working Group Report) 4.2.4 Human Resource Development Programmes There is a vast potential for energy savings through human intervention. BEE and SDAs have a major responsibility for stimulating a major change in the energy efficiency ethos and practices (energy modesty) by directing the national energy conservation campaign as a mass movement and seeking wide support. In the 11th Plan, BEE will continue with their campaigns. The initiatives like capacity building of energy professionals, establishment of Demonstration centers in 2 industrial estates, and Nationwide campaigns through media and other modes will be undertaken. (Refer Para 4.3.7 of main Working Group Report) 4.3. POLICY RESEARCH FOR ACCELERATING ADOPTION OF ENERGY
EFFICIENCY AND DSM PROGRAMS Policy research on legislative amendments, policy interventions including fiscal and non- fiscal measures are planned to be undertaken in 11th Plan. (Refer Para 4.4 of main Working Group Report) 4.4 RECOMMENDATIONS The target of additional electricity savings which may accrue to the national economy at the end of 11th Five year plan as a consequence of intensive energy conservation and DSM drive is expected to be about 5% of the anticipated energy consumption level in the beginning of 11th Plan. BEE will device a suitable mechanism for assessing these savings. The outlay for various strategies and programs as proposed is Rs. 652 Crores. Out of this proposed allocation, Rs 350.5 crs is the estimated requirement for BEE at the centre and the balance Rs. 301.6 crs as the assistance for strengthening the institutional structure at the State level for effective implementation of EC Act. These initiatives will also seek funding support from state governments, other complementary programs, user industry, financial institutions, and other donor agencies besides innovative financing options.

Executive Summary Working Group on Power-11th Plan (2007-12)
35
5.0 TECHNOLOGY ADVANCEMENT AND R&D
There is a need to introduce advanced technology in generation, transmission and distribution and encourage Research & Development to meet the ambitious plan of power sector growth during the 11th Plan. A review of utilization of R&D fund during the 10th Plan period by major players in the power sector shows that it was less than RS.150 crores against a provision of Rs.500 crores. This is considered unsatisfactory and needs to be substantially improved in the 11th plan. Considering International technology trend and India’s power sector requirement following broad areas were identified for selecting R&D projects during the 11th Plan.
a) Introduction of larger size energy efficient thermal generation for Indian coal with a good mix of fossil and renewable source of energy.
b) Efficient operation of a large grid with 800 kV AC &DC transmission with
high reliability, flexibility and open access in transmission
c) Technology development and demonstration of distributed generation covering bio mass, bio diesel, solar, wind and focus on microgrids.
d) Reduction of distribution system losses, energy conservation methods and
introduction of large scale automation in distribution sector.
e) Clean technology development 5.1 OVERVIEW OF R&D IN THE PAST In the generation sector commendable work has been done by NTPC and BHEL in the areas of stabilization of 210 and 500 MW units, development of pulverized coal fired boiler for coal with high ash content, efficiency improvement of Thermal Power Plants, control, instrumentation and loss minimization. Similarly in the hydro generation, BHEL, NHPC and other hydro utilities have contributed in uprating of old units, improving turbine design etc. In transmission, Powergrid and BHEL have introduced many new technologies like Series Compensation, Thyristor Controlled Series Capacitor, Controlled Shunt Reactor, etc. Powergrid have contributed to the development of high temperature conductors, development of insulators, introduction of 800kV AC and planning for ± 800 kV DC first time in the country. Many of the development by Powergrid and NTPC have come through project route in the county and although their R&D units have not shown substantial expenditure on R&D, the organizations have encouraged new technology.

Executive Summary Working Group on Power-11th Plan (2007-12)
36
It is felt that where as some of the available technology abroad are being introduced in the country, commensurate R&D efforts to get it improved and sustained through available inhouse resources, has not been pursued. Further, an institutional mechanism to conduct and monitor National Level R&D Projects has not been in place to make the indigenous R&D encouraged and its impact assessed. As a result, there is no technology breakthrough that has actually taken place in power sector through indigenous route. 5.2 TECHNOLOGY DEVELOPMENT IN POWER SECTOR Major utilities like NTPC, NHPC and PGCIL have their inhouse R&D setup which addresses introduction and absorption of new technology primarily through project routes. Major manufacturers like BHEL, Crompton Greaves have their own R&D set up, focusing on product development. Central Power Research Institute (CPRI) is provided with capital funds from the Ministry of Power for inhouse research as well as disbursement of research funds to utilities, industries and academic institution. Central Electricity Authority has a role in identification of appropriate new technology for the country. Recently a few projects under National Perspective Plan on R&D have been taken up by CPRI which are collaborative research projects involving more than one organisation. The R&D policy of the Government recommends R&D projects that help the nation to become self reliant in technology. 5.3 IDENTIFIED PROJECTS FOR 11TH PLAN BY CENTRAL UTILITIES NTPC has identified a few good projects for inhouse research where they would involve other research institutes like BARC, CPRI, CSIR and other consulting houses. The list of projects identified by NTPC is as follows:
1. Flue gas heat recovery system for a 200 MW Unit. 2. IGCC technology demonstration project. 3. Automated boiler tube inspection system (robotics application). 4. On line condition monitoring of power transformers. 5. Modeling & design of natural draft cooling tower assisted flue gas
dispersion. 6. Technology demonstration for suitable capacity solar (Thermal). 7. 10 KW sterling engine based TDP suitable for distributed generation.
Powergrid has similarly identified a number of inhouse projects a list of which is as follows:
1. Technology Development for +/- 800 kV HVDC system for transfer of 6000 MW power from NER to NR
2. Aerial route survey using Air borne laser terrain (ALTM) along with National Remote Sensing Agency (NRSAR)

Executive Summary Working Group on Power-11th Plan (2007-12)
37
3. Development of High surge impedance loading line (HSIL) – 400 kV Purnea – Biharshariff D/C
4. Fault current limiter at 400 kV level 5. Indigenization of polymer insulator 6. Specification of suitable oil for transformer 7. Indigenized development of MOV
R&D in infrastructure development 8. Intelligent grid 9. Converter transformer design 10. Converter transformer less HVDC system 11. 1000 / 1200 kV EHVAC development 12. Residual life assessment of transmission system 13. Indigenous development of GIS 14. Real time digital simulator and studies 15. Indigenous development of high strength insulators like 320 / 420 kN
AC & HVDC 16. 400 kV compact line 17. Lightning mapping
BHEL has identified a few broad based projects in generation, transmission and distribution which are given as under:
1. Clean coal technologies. 2. Super critical boilers. 3. Ultra High Voltage Equipment. 4. IGBT based drives and controls.
The laboratories of CSIR who also carry out basic and applied research have following inhouse research programmes identified for the 11th plan:
1. R&D on Photovoltaics and other solar energy applications (NPL, New Delhi)
2. Energy for cleaner and greener environment (CECRI, Karaikudi). 3. Bio energy technology: Strategy designing of Jatropha curcas for bio
diesel (NBRI). 4. Development of gas to liquid (GTL) processes for DNE & Fischer –
Tropsch fuels (NCL). 5. Hydrogen economy initiative (NCL, Pune). 6. Development of coal to liquid (CTL) technology for synthesis of liquid
from hydrocarbons (CFRI, Dhanabad). 7. Development of a composite approach suitable for clean coal initiatives
(CMRI, Dhanabad). 8. Development of Underground coal gasification and IGCC Technology
in India (CMRI, Dhanabad).

Executive Summary Working Group on Power-11th Plan (2007-12)
38
CPRI has identified few areas of research and investment in infrastructure building which are given below:
a) Development of new ceramic and polymer composites for power sector application particularly for power capacitors.
b) Research on new material development for turbine blades for hydro
stations and new coating material along with other CSIR Laboratories and NHPC.
c) Study of thermal mapping of power stations and heat rate improvements.
d) Diagnostic techniques and mulit criteria approach for RLA of EHV
substations.
e) Simulator studies for large AC/DC grids. Other than the projects listed, a few projects of National interest which are necessary to be taken up were identified for the following reasons:
a) They are collaborative research projects where more than one agency have to be involved.
b) Some of them are demonstration projects involving best practices that
would help further research
c) Some of them are new application areas of available technology A list of projects have been proposed for Generation, Transmission, Distribution & Environment areas. Details of the same are furnished in Para 5.6 of Working Group Report. Estimated cost of R&D projects recommended for 11th plan by the Working group have been discussed with the PSUs of MOP, BHEL and also shared with CSIR. Details of the funds are as follows: Total for Generation : Rs.333.50 crores Total for Transmission : Rs. 70.00 crores Total for Distribution : Rs. 25.00 crores New Projects : Rs. 24.00 crores (Project wise details of funds are furnished in Para 5.6 of the main Report)

Executive Summary Working Group on Power-11th Plan (2007-12)
39
5.4 CPRI’S ROLE AND A NEED FOR RESTRUCTURING CPRI was established to work as a nodal agency for power sector research but had a larger role assigned to work as a neutral testing laboratory. Although the organisation has contributed to encourage R&D in utilities, academic institutions and in its own laboratories, it has not been able to build up resources to work as a driver of R&D in the power sector. It is recommended that a restructuring of CPRI is necessary if it has to play a proactive role in collaborative research in the country. For this the following are suggested:
a) Testing and Research have to be separate functions within CPRI. b) Testing has to sustain on its own and as far as possible government grant
should not be utilized for meeting test facility requirements. The beneficiaries of test facility, i.e., the manufacturing units and utilities should largely bear this burden.
c) CPRI should be corporatised to reduce its dependence on Government
funding and have better operational flexibility. This would help CPRI to be competitive and self reliant. The major utilities like NTPC, PGCIL, NHPC and PFC should come forward to make it happen.
d) CPRI is to develop its ability to enhance industrial & system related
consultancy work and get more sponsored projects for improving its financial health.
5.4.1 Assessment of CPRI’s requirements of fund CPRI gets planned funds for expenditure of capital nature on replacement of old test facility, addition of new test facility and for research under three heads, viz. (a) for its own internal research projects, (b) for research projects on Power (RSOP) to encourage research at utility centers and (c) National Perspective Plan projects. The 10th Plan utilization of fund by CPRI is Rs.67.0 crores. For the 11th plan period, CPRI has asked for a major investment under the following heads For Test facility - Rs.638.00 crores For research projects & facilities - Rs.123.0 crores (Details are furnished in Para 5.4 of the main Working Group Report.)

Executive Summary Working Group on Power-11th Plan (2007-12)
40
5.5 FUNDING OF R&D R&D expenditure of a few world class utilities and industries are given below:
Company 2003 2004 2005
R & D Exp Net sales
% of R&D Exp
R & D Exp Net sales % of R&D Exp R & D Exp Net sales % of R&D
Exp GE (billion Dollar) 2.7 149.7 1.80 3.091 154.481 2.00 3.425 122.886 2.79
Siemens (Billion Euro) 4.73 69.77 6.78 4.65 70.23 6.62 5.155 75.455 6.83
Company 2003-04 2004-05 2005-2006
R & D Exp Net sales % of R&D Exp R & D Exp Net sales % of R&D
Exp R & D Exp Net sales % of R&D Exp
Alstom (million Euro) 473 16688 2.834 405 12920 3.13 365 13413 2.72
Hitachi ( billion Yen) 371.8 8632.4 4.307 388.6 9027 4.305 405 9464.8 4.279
Mitsubishi Electric (million Yen) 136518 3309651 4.125 130548 3410685 3.828 130629 3604185 3.624
BHEL (million Rupee) 1041 103364 1.007 1252 103364 1.211 1517 145255 1.044
It may be observed that most of the organizations spend between 1.8 to 6% on R&D depending on the nature of their business. Technology advancements and research & development have so far not been properly addressed. Major organizations like NTPC, NHPC, POWERGRID, on the generation side and BHEL, ABB, SIEMENS on the manufacturing side must enhance substantially their budget allocations for research and development. The utilities should aim at least about 1% of their profit to be utilized for research and development activities and the manufacturing organizations should consider 3-4% to be provided for technology development. Networking of R&D resources and expertise would be an important strategy aimed at getting effective results. CPRI, apart from testing, must reorient its strategy and activities towards research. 5.6 RECOMMENDATIONS AND POLICY ISSUES. 1. Technology advancements and research & development have so far not
been properly addressed. Major organizations like NTPC, NHPC, POWERGRID, on the generation side and BHEL , ABB, SIEMENS on the manufacturing side must enhance substantially their budget allocations for

Executive Summary Working Group on Power-11th Plan (2007-12)
41
research and development. The utilities should aim at least about 1% of their profit to be utilized for research and development activities and the manufacturing organizations should consider 3-4% to be provided for technology development.
2. Networking of R&D resources and expertise would be an important strategy aimed at getting effective results. CPRI, apart from testing, must reorient its strategy and activities towards research.
3. Ultra Super Critical boiler technology, IGCC technology and oxy-fuel
technology are well researched abroad but have to be developed for Indian coal. NTPC, the major Indian Central Sector utility should have its R&D centre strengthened to expedite the work started during 10th plan on IGCC. It is recommended that this project may be given top priority and completed with the help of BHEL or with a private party if necessary.
4. There is a need to work with specialized S&T laboratories under CSIR &
other space and nuclear establishments to develop material technology for advanced boilers, fuel cells, solar power, battery & super conducting material application in power sector.
5. For the projects of National interest to be taken upon collaborative
research route the estimated R&D expenditure of 452 crores is recommended. It is also recommended that in future capital fund support for R&D should be reduced and utilities and industries should collaborate to fund R&D projects.
6. An institutional change in handling R&D is required. A suggestion is to
have generation, transmission & distribution R&D units to be established as separate entities in the central sector undertakings or to set up a corporate technology centre for R&D activities in various areas of power sector
7. R&D import should be exempted from custom duty to encourage
indigenous R&D 8. Power sector should seriously consider attracting young talents by offering
them challenging opportunities. This will be possible by encouraging R&D and offering a good package, like many MNCs are offering at present.
9. A High Power Committee in R&D should monitor R&D projects and
regulate funds. This will avoid duplication & ensure competitive R&D. 10. Organisations like CPRI and NPTI should be spared from manpower
optimization rules where vacant positions are surrendered. This is in view of the depleting cadre of scientists and specialists in these organizations.

Executive Summary Working Group on Power-11th Plan (2007-12)
42
6.0 NORTH-EASTERN DEVELOPMENT
The details of Development of Power Sector in North-Eastern Region have been covered in the respective areas.
7.0 HUMAN RESOURCE DEVELOPMENT AND CAPACITY
BUIDING’
7.1 MANPOWER
The manpower at the end of the 10th Plan will be of the order of 9.50 lakhs, out of which the technical manpower is 7.16 lakhs and non-technical 2.34 lakhs.
The total manpower by the end of 11th Plan shall be of the order of 11.76 lakhs, out of which 8.89 lakhs will be technical and 2.86 lakhs, non-technical.
The total manpower by the end of 12th Plan shall be 13.22 lakhs, out of which 10.04 lakhs will be technical and 3.18 lakhs will be non-technical.
(Ref Tables 1 to 22- of Chapter 7 of the main Working Group Report)
7.2 TRAINING LOAD Overall training load expected during the 11th Plan is 4.65 lakh man-months per year against the available training infrastructure of only 0.77 lakh man-months per year.
For the 12th Plan, the expected training load is 4.78 lakh man-months per year.
(Ref Para 7.3.2 of the main Working Group Report)
7.3 MAN-MW RATIO
The Man-MW ratio is expected to gradually decline from 9.42 per MW in the 9th Plan to about 7 in the 10th Plan and subsequently to 5.82 and 4.93 in the 11th and 12th plans respectively.
(Ref Table 23 of Chapter 7 of the main Working Group Report)
7.4 MAJOR OBSERVATIONS / RECOMMENDATIONS
7.4.1 Training for All Every employee should be provided refresher training of minimum one-week per year as mandated in the National Training Policy. Provisions for Refresher training for O & M personnel has been made in the Indian Electricity Rules.

Executive Summary Working Group on Power-11th Plan (2007-12)
43
However provisions for Refresher training for all power sector personnel as per their requirements may be included. 7.4.2 Induction Level Training Induction level training should be made compulsory for personnel getting inducted in all areas viz., Thermal, Hydro, Transmission and Distribution etc. Statutory provisions for Induction level Distribution Training in the Indian Electricity Rules is under active consideration and would be notified shortly. Simulator training should also be necessarily included as one of the modules for the O & M personnel.
The Induction level training for Thermal, Hydro and Transmission is presently a Statutory obligation as per the I.E. Rules. This may be made mandatory and in particular enforced for the personnel working in the State Utilities and Boards. Formal Induction level training should also be imparted to all non-technical personnel in power sector. The duration could be three (3) months for executives and one (1) month for non-executives. 7.4.3 Reporting Training activities to CEA As many as 51 Training Institutes are recognized by CEA and it is recommended that all training activities including expenditure incurred on training and personnel trained should be reported to CEA. Every Utility/Organisation should display the manpower and the training infrastructure available category-wise on their web-site. 7.4.4 Strengthening of Existing Training Institutes Capacity of existing Institutes to be strengthened. Provisions should be made in the plan budgets for augmenting Training Centres from time to time. Upgradation of the Training Institute’s Lab facilities may also be reviewed on a regular basis and funds should be accordingly allocated. 7.4.5 New Training Institutes All Power Utilities should set up Training facilities encompassing training infrastructure for Induction level, Linemen and for Distribution Franchisees where the Govt. of India could provide part funding. A National Level Training Institute for Transmission with necessary infrastructure with Central support at HLTC, Bangalore and Power Grid may be created. A National level training centre for Distribution should be created with Central Support at PSTI, Bangalore and CIRE, Hyderabad.

Executive Summary Working Group on Power-11th Plan (2007-12)
44
Emphasis should be given to Linemen Training. It should be ensured that the Linemen recruited should be at least 8th class pass with an ITI qualification. New Linemen Training Centres should be established within the proposed institutes in the Utilities in line with the recommended requirements of Distribution training. Need for training on Hotline LT Distribution lines may also be actively considered for interruption free maintenance to the consumers. 7.4.6 Capacity Building in Training for Franchisees (RGGVY)
A national program for training and capacity building to be initiated targeting at enhancing the skill of franchisees and trainers so as to enable them to play the desired role in improving rural electricity access. Every major state should have one (1) Training institute for Franchisee training. Commercial and Legal issues should also be necessarily included in these training programs. Training Centres should also be set up in the districts, which are covered under Rajiv Gandhi Grameen Vidyutikaran Yojna along with Linemen Training Centres Capacity Building in Training for Franchisees may also be taken up by the Institutes conducting DRUM training. 7.4.7 Networking The Sub Group also stressed on Networking and tie-ups with the Training/Academic institutions like NPTI, IIMs, ASCI, PMI etc., and other reputed institutions for providing training to power sector personnel and other stakeholders. 7.4.8 Training for Contract Labour Adequate training should be made a pre-requisite for the contractor’s labour to qualify for supply of Labour in power plants. Contract documents should accordingly be modified. 7.4.9 Training on Attitudinal Changes/ Behavioral Sciences Apart from the stress put on acquisition of knowledge and upgradation of skill emphasis should be given on attitudinal changes/behavioural sciences, in order to develop a sense of belongingness amongst the employees.
Executive Summary Working Group on Power-11th Plan (2007-12)
45
7.4.10 Areas of Concern Inspite of lack of availability of required infrastructure, the available infrastructure of various Training Institutes remain under utilized Statutory Induction Level Training is not being taken seriously by the Power Utilities Inadequacy of Trainers and insufficient Career Development Opportunities ITIs and other vocational training institutions have to be substantially expanded in terms of the number of persons they train and in the number of different skills and trades they teach. The quality and range of their training will have to keep pace with the changing needs of the economy and opportunities. 7.4.11 Recurring Investment on Training As recommended in the National Training Policy, Organizations should allocate some portion of their salary budget towards training and development. All the Organizations, which are provided with Grants either from Central or State Sector, should separately allocate Funds in particular for Training, which should not be spent for other purposes. 7.5 FUNDING The Total Plan period outlay is about Rs. 462 Crores. This does not include the plan fund outlay proposed by other Sub-Groups, which includes setting up of new training institutes, infrastructure upgradation, provision of incentives for sponsoring organizations, Technology upgradation, procurement of Simulators and GIS based training packages etc. (Ref. Para 7.4 of the main Working Group Report)
8.0 LEGISLATIVE AND POLICY ISSUES – FORMULATION,
IMPLEMENTATION & FEEDBACK
1. Situation is not ripe for procurement through Case-I route since both coal and gas are not yet freely available in the market. All efforts should be made to develop new capacity under Case-II procurement.
2. SPV is necessary to develop new generation capacities quickly. 3. There is need to streamline and standardize the procedure to shorten time
cycle for obtaining environmental/forest clearance with greater emphasis on compliance with laid down standards and conditions.

Executive Summary Working Group on Power-11th Plan (2007-12)
46
4. Exploration capacity of CMPDIL may be augmented and also it may be given more autonomy so that it can discharge its responsibility in fair and neutral manner. Number of agencies having authorization to undertake exploration of coal blocks should be increased.
5. Coal blocks to be used for captive coal mining by power projects should be explored fully at the earliest and GRs should be readily made available to power project developers on actual cost basis.
6. Appropriate cut-off of gross station heat rate, say 3000 kilo calorie per unit, can be considered for identifying inefficient old power plants of more than 25 years age and the sites could be released for setting-up plants of more efficient and large sized units depending on the scope of expansion available and with due cost benefit analysis. Coal linkages of the old power plants should be transferred to new generating units.
7. Till the long-term coal supply contracts emerge in international coal markets, the option of competitive bids for net heat rate may be explored for imported coal based stations.
8. In the interests of larger competition aimed at consumer benefits, procurement from non-conventional energy sources should not be restricted to within the State but suppliers from outside State should also be allowed to compete.
9. Procurement from non conventional sources should, unless there are compelling reasons, be done through competitive bidding process as this would add to transparency and lower procurement costs.
10. After assessing the stage of development of various non conventional energy technologies, definite timeframe should be laid down for doing away with preferential tariff for power generated from such sources.
11. Tariff Policy advises States to rationalize taxes and duties on captive power consumption. This may be reviewed periodically with States and made a condition for Central assistance to State power sector.
12. In competitive procurement of power, bidding by CPSUs should be ensured in initial few projects to encourage competition.
13. CERC could set up benchmarks for capital expenditure to facilitate accelerated R&M of old power plants.
14. To make available adequate power for open access consumers, there is need for enabling policy framework for merchant power plants. Size of MPPs could be up to 1000 MW which may be appropriate considering greater possibility of financial closure without long-term PPAs for comparatively smaller sized projects and also of making available

Executive Summary Working Group on Power-11th Plan (2007-12)
47
transmission corridors for such MPPs. We could target MPP capacity of about 10,000 to 12,000 MW by end of 11th Plan. Such merchant capacity would be without the basis of long term PPAs.
15. Coal linkages should be freely available for power project developers who come forward to set up such MPPs. In case captive coal blocks are given to MPPs, there should be a mandatory condition that such the project developer would not compete in competitive bidding for long-term PPA based power procurement in order to avoid unequal competition since only few developers would have such coal blocks. For allocation of linkage or coal blocks for MPPs, an additional condition should be that captive mining must begin within a period of 3 to 4 years failing which the allocation should be cancelled.
16. For providing transmission corridors for such MPPs, adequate redundancy should be built at the stage of transmission planning. Presently, also there is a redundancy of about 20-25% in the transmission planning. There is need to identify the major load centres who would draw power from such MPP. These load centres would be most likely situated in northern and western region where many States are deficit in power supply. Therefore, the required redundancies could be planned from the likely location of the MPP (which would be in eastern region) to such load centres. The cost of providing such redundancy should be absorbed in the transmission tariff by the concerned beneficiaries. This would be in the long-term interests of consumers who will gain from efficiency arising out of competition among the generators.
17. Tariff Policy envisages a National Transmission Tariff Framework sensitive to distance and direction and related to quantum of power offered. CERC is in the process of developing such a Framework which needs to be done expedited. This would be a necessary pre-requisite for promoting open access and power trading.
18. There is urgent need for regulations for providing grid connectivity to MPPs. The National Electricity Policy already provides that prior agreements would not be a pre-condition for network expansion and the transmission utilities should undertake network expansion after identifying the requirements in consonance with the National Electricity Plan and in consultation with the stakeholder, and taking up the execution after due regulatory approvals.
19. The reduction in cost of production of coal on account of higher efficiency in captive coal mining should be passed on to the consumers through reduced cost of bulk power. The coal blocks should be offered on the basis of competitive bidding as part of the integrated coal mine-cum-power project to achieve this objective. Any other method of allocating

Executive Summary Working Group on Power-11th Plan (2007-12)
48
coal blocks for power projects is not likely to pass on the efficiencies of captive coal mining to the consumers.
20. As long as there is shortage of natural gas and the two major users of gas fertilizer and power work in a regulated cost plus environment, price of domestic gas and its allocation should be independently regulated on cost plus basis including reasonable returns.
21. Like crude oil and coal, natural gas and LNG may also be included in the category of declared goods so that central sales tax of 4% is levied on them and exemption from any state sales tax is extended.
22. Import duty on coal has been lowered to 5%. This position needs to be continued as we would be depending on imported coal for generation.
23. Exemption of import duties available to generation projects under Mega Policy should be available to all important transmission projects where imported components form large part of the project cost.
24. Nuclear power stations are likely to be segregated from other strategic nuclear installations in future. In that case, tariff determination from nuclear power stations should be done through regulatory mechanism in a transparent manner adopting two part tariff structure and efficient operating norms.
25. There is a need to levy cess on the basis of consumptive use of water. This would encourage closed cooling system which is the need of the hour considering decreasing availability of water at project sites.
26. Service conditions of staff of the Regulatory Commissions and BEE should be made attractive. Such staff should be eligible for housing accommodation, medical facilities etc. on the lines of Government employees.
27. State Governments should be asked to establish the Regulatory Commission Funds at the earliest. This could be one of the follow up points while releasing central assistance to the States.
28. There is a need to put in place a mechanism for periodical training/ reorientation for staff of the Commissions and for newly appointed regulators. A corpus could be made available to the Forum of Regulators (FOR) for this purpose income from which could be used for the training programmes. The training programme and the training institutions should be settled by FOR after taking into account guidelines issued by the Central Government in this regard.
29. FOR has been entrusted with number of responsibilities in the Tariff Policy with a view to ensure consistency in the regulatory approach. For

Executive Summary Working Group on Power-11th Plan (2007-12)
49
discharging this role, the FOR would require consultancy for availing relevant expertise including international experience on various matters. Central Government should provide funds for this purpose.
30. FOR should also compile periodically various progressive orders of the SERCs for sharing the best practices. The compilation may also include important judgments of the Appellate Tribunal for Electricity.
31. To bring in appropriate accountability of the regulatory process, proposed regulations of the Regulatory Commissions should be examined indepth at draft stage itself. Further, there is a need for scrutinizing the regulations for ensuring consistency with the letter and spirit of the law before they are laid in the Parliament/ State Assembly. This is important since regulations, once published in the gazette, become sub-ordinate legislation.
32. FOR should also undertake periodical review of implementation of the National Electricity Policy and Tariff Policy since the law requires the Commissions to be guided by these policies.
33. High loss making feeders may be franchised by distribution companies. Towns having ATC losses higher than 35% may be franchised on input energy basis immediately. Towns having losses between 25-30% should be observed for improvement for 6 months and if there is no improvement, these towns should also be franchised.
34. Through appropriate metering and energy audit, feeders incurring high level of losses (may be more than 20% for urban feeders and more than 35% for rural feeders, this would depend on the stage in which distribution reforms are in a particular state) should be identified. Performance of the staff should be then assessed on the basis of Key Performance Indicators(KPI) which would be primarily loss reduction. ATC loss reduction of 3% every year in next five years should be targeted. The Tariff Policy emphasizes on the need of putting in place local area based incentive/disincentive scheme for the staff linked to distribution losses. This should be immediately implemented by the SERCs.
35. The robust legal framework contained in the Act for control of theft is being further strengthened. Annual conferences of power utilities should be organized at national level for highlighting success stories and achievement made in different States in controlling theft.
36. To enlist public support for rapid reduction of commercial losses, the list of high losses feeders should be publicized periodically.
37. To realize the objective of Tariff Policy of supplying uninterruptible electricity to those consumers who are ready to pay efficient cost, the distribution tariff should move to distribution margin model which is also provided in the Tariff Policy. Such distribution margin could be based on

Executive Summary Working Group on Power-11th Plan (2007-12)
50
loss reduction trajectory in a MYT framework and the actual power purchase costs should be paid by the consumers over and above the distribution margin. Consumers of a particular area should be given option to collectively choose either uninterruptible supply or otherwise and the tariff could be determined accordingly.
38. Setting up of peaking power stations should be encouraged to overcome peaking shortages as the additional power costs of supply from such a station could be then passed on to the consumers who opt for uninterruptible supply.
39. Use of electronic meters and spot billing should be expanded rapidly and State should be emphasized upon to do so.
40. FOR should develop a model agreement for distribution of electricity by distribution licensee through a franchisee in urban areas outlining the responsibilities and duties of various parties clearly.
41. There have been some experimental efforts, with good success, for outsourcing distribution of electricity for an identified feeder by the licensee to a private entrepreneur selected competitively. This model needs to be supported fully and replicated in high loss areas.
42. Necessary financial assistance may be provided to consumer groups having proven track record for facilitating effective representation before the Regulatory Commission. In addition, Central Government should also arrange orientation programmes to educate these groups about various provisions of the law and rules. Such scheme(s) should be administered by the Department of Consumer Affairs.
43. The Rural Policy provides that standalone systems of upto one MW would have automatic approval for
a. Land use change for area as per norms
b. Pollution clearance if technology is proven within laid down norms and
c. Safety clearance on the basis of self certification.
These policy measures need to be implemented by the concerned authorities at the earliest.
44. Schemes for separation of agricultural feeders in rural areas need to be promoted. Agricultural consumers could be supplied electricity as per seasonal demand for agricultural purpose and the tariff could be fixed taking into view off-peak pricing and uninterruptible supply.

Executive Summary Working Group on Power-11th Plan (2007-12)
51
45. Schemes for transferring subsidies directly to consumers may be encouraged.
46. State Government should set up a dedicated planning cell for developing electricity plan at the State level including specific projects which could be posed for investment to the power sector. Such a plan could be on the lines of National Electricity Plan.
47. With the objective of promoting more efficient use of electricity and also to provide another payment option to the consumers, use of pre-paid meters needs to be promoted.
48. In order to assess the progress made in achieving higher energy efficiency, suitable mechanism should be put in place indicating the clear cut methodology for computing various parameters in this regard.
49. Statutory rules may provide for periodical refresher training for all the O&M personnel in different segments i.e. generation, transmission and distribution. In addition, refresher training may also be provided to all other personnel in power sector as per the requirement of their work areas.
50. A national programme needs to be launched for training and capacity building for upgrading and enhancing the skills of franchisee who are proposed to be deployed on a large scale for rural as well as urban areas.
9.0 ISSUES CONCERNING KEY INPUTS 9.1 FUEL
9.1.1 Coal Requirement / Availability for 11th Plan
Coal Demand – Supply Projection for Power Sector (11th Plan Period)
(As Projected By CEA) DESCRIPTION 2006-07 2007-08 2008-09 2009-10 2010-11 2011-12 Installed Capacity 63490 72440 75870 81095 90675 101597.5 Additions 8950 3430 5225 9580 11450 16950 Retirements 0 0 0 0 527.5 259 Total Installed Capacity (MW) 72440 75870 81095 90675 101597.5 118816 Normative Coal Reqmnt (Linkage) (MT) @
362.20 379.35 405.48 453.38 507.98 594.08
(Details are given in Table 9.7 of main Working Group Report)

Executive Summary Working Group on Power-11th Plan (2007-12)
52
@ For calculation of linked coal requirement for the above installed capacity, average 5 MTPA per 1000 MW of capacity, has been considered. This coal requirement projection does not include coal requirement for captive power plants (CPPs). However, all the units envisaged for capacity addition, as shown above – year-wise, may not be in full commercial operation for the whole periods of those particular years, in which these units shall be commissioned. So, considering that aspect, the following generation level – year-wise has been targeted by CEA and corresponding coal requirement are worked out as under.
DESCRIPTION 2007-08 2008-09 2009-10 2010-11 2011-12Total Generation (BU) (^) 499.5 536.0 587.9 660.8 764.5 Total Coal Requirement (MT) including Transit Loss @1%
354.9 380.4 417.6 470.0 544.5
Coal Availability - From CIL (MT) # 287.27 311.55 343.80 376.74 405.79 - From SCCL (MT) $ 27.01 27.19 27.69 28.40 28.97 - From Captive Mines 9.75 23.60 36.47 41.50 47.30 Total Availability (MT) 324.03 362.34 407.96 446.64 482.06 Gap between Supply & Demand (MT)
-30.87 -18.06 -9.64 -23.36 -62.44
(^) Generation is projected (as projected by CEA), assuming PLF of 76% in 2006-07 & 2007-08 and 77% in subsequent years existing units and 85% for new capacity additions, with due consideration of initial commissioning period for new units.
# CIL’s projection of Coal Production including their emergency production plan, considered here, is provided by Working Gr. member from CIL. Distribution of around 72% of CIL coal to Power Sector (except CPPs) considered here based on historical supply figures and as considered by CEA for their computation & analysis purpose.
$ SCCL’s projection of Coal Production, considered here, is provided by SCCL. Distribution of around 71% of SCCL coal to Power Sector (except CPPs) considered here based on historical supply figures and as considered by CEA for their computation & analysis purpose.
(X) Coal Production from Captive Mines in the terminal year of 11th. Plan, as projected by CEA. However, as per projections made in the Draft Report by the Working Group on Coal & Lignite, under the Chairmanship of Secretary (Coal), out of 127 captive blocks allotted so far, about 60 have already submitted mine plan to Coal Controller’s organization, indicating production projection of about 104 MT by 2011-12. Remaining block-holders are also expected to submit mine plan shortly. Out of 104 MT of coal production, as projected, around 65.95 MT will be available for Power Sector (Utilities) in 2011-12. However, achievement of this production level or even enhanced level from Captive Mining are possible subject to expeditious approval of Mining Plan, various notifications for Land Acquisitions, Environment Clearances & other clearances / approvals, as elaborated in this report, later on.

Executive Summary Working Group on Power-11th Plan (2007-12)
53
9.1.2 Capacity Addition in 11th Plan vis-à-vis Coal Tie-Up (As projected by CEA)
Description Capacity
(MW) Normative
Requirement (MT)
Coal Linkage Available 32455 162.28 Block Allocated 5830 29.15 Imported Coal tied up 0 0 TOTAL AVAILABLE 38285 191.43 Linkage required to be accorded 4500 22.50 Block required to be Allocated $ 2500 12.50 Imported Coal to be tied up 1350 4.05 TOTAL TO BE TIED UP 8350 39.05 TOTAL COAL BASED CAPACITY ADDITION (MW) IN 11th PLAN
46635 230.475
$ Projects totaling to 1750 MW have applied / applying for coal blocks, however, during 11th. Plan it would require tapering coal linkages. 9.1.3 Gas scenario At present 2114 MW Gas Based Power Project have been included in the 11th Plan against the target of 50124 MW by thermal capacity. The additional power could be planned / generated based on the following factors which would however largely influence the ultimate gas demand in the power sector.
• Assured supply of gas and its time frame • Price of gas and stability for 15 years • Expanding the scope of regulator for regulating the price of gas.
9.2 TRANSPORT 9.2.1 Railways: Present Scenario Important modes of transport of coal in India are Railways, Road, Merry-go-Round Systems, Conveyor Belts and the Rail-cum-Sea Route. Railways constitute the major system of coal transportation in India and coal is the largest single commodity transported by the Railways. The dispatch of coal by rail is governed by the Preferential Traffic Schedule of the Indian Railways, under which the program of movement is to be sponsored by the various sponsoring authorities and accepted by the coal companies. In case of deregulated coal, Railways have allowed coal companies to sponsor the movement of coal. Coal requirement of some consumers in Southern India, which include power stations and cement plants, are met by moving coal by Rail-cum-Sea Route. This

Executive Summary Working Group on Power-11th Plan (2007-12)
54
is done in view of the difficulties experienced in moving coal via all Rail Routes from Bengal-Bihar and Main Line-Talcher Coalfields. The requirement of power stations of Tamil Nadu Electricity Board (TNEB) is met by Rail-cum-Sea Route. Haldia, Paradip and Vizag Ports handle the shipments.
Some load center projects have been identified for expeditious implementation to meet the increased power requirements for the forthcoming Commonwealth Games-2010 to be held in Delhi. Such projects of NTPC are Badarpur Expansion (1000 MW), Dadri (Coal) Expansion (980 MW) and Jhajjar JV Project (1500 MW).
At present 26 rake per day are being moved through over crowded
Railways section between Mughalsarai & Delhi which caters to existing plants at Badarpur and Dadri (Coal). The number of rakes will increase to 34 rake / day when both of the expansion projects at Dadri and Badarpur are commissioned. Railways need to gear up to tackle this increased movement of coal in this section.
In the case of proposed Jhajjar project to be implemented by NTPC in
Joint Venture with Delhi and Haryana, Problem exists in transportation of coal beyond Mathura up to the plant i.e. the section from Mathura to Jharli (station nearest to Jhajjar: Total distance is 240 Kms.) is single-lined. Power project at Hissar in Haryana is also being implemented during the same time frame which will also be using the same Railways line. Considering the above and also considering the proposed requirements of the power stations in the adjoining region this section needs to be made double-lined.
9.3 PORT FACILITIES 9.3.1 Ports: Present Scenario Ports form a critical part of transportation infrastructure of our country. India has about 6000 km. of natural peninsular coastline. There are 12 major and 185 minor ports in India. Major ports handle about 75% of the country’s port traffic. Present capacity for coal in Indian Ports account for about 65 Million Tonnes (as on 31.03.2005) and it will be enhanced to about 142.87 Million Tonnes by 2013-14, as projected by National Maritime Policy on Port & Shipping Sector.

Executive Summary Working Group on Power-11th Plan (2007-12)
55
9.3.1.1 Present & Proposed Capacity Additions by Indian Ports (Commodity-wise)
(In Million Tonnes)
Commodity
Existing Capacity as on
31-3-2005
Capacity requirement by 2013-14
Additional Capacity Estimated by 2013-14
POL 157.35 248.56 91.21 Iron Ore 51.00 126.75 75.75 Coal (including coking coal)
65.00 142.87 77.87
Container Tonnage Container TEUs
49.55
4.13
235.56
19.63
186.01
15.50 General Cargo 77.10 163.85 86.75 TOTAL:
400.00
917.59
517.59
9.4 CONSTRUCTION AND MANUFACTURING CAPABILITIES 9.4.1 Manpower requirement for Hydro Projects (Supervisory Staff)
9.4.1.1 Manpower requirement for Hydro Projects (Workers) Sl No Type of Worker Estimated
requirement Available Augmentation
required 01 Skilled 33000 20000 13000 02 Un skilled 50000 30000 20000 Total 83000 50000 33000
Category Estimated requirement
Available Augmentation required
Senior level Executives 550 330 220 Middle level Executives 2000 1200 800 Junior level Executives 4300 2600 1700
Non executives 1700 1000 700 Total 8550 5130 3420

Executive Summary Working Group on Power-11th Plan (2007-12)
56
9.4.2 Manpower requirement for Thermal Projects (Supervisory Staff) Category Estimated
requirement Available Augmentation
Required Senior Level Executive 1014 660 354Middle Level Executive 3702 2400 1302Junior Level Executive 7308 5040 2268Supervisors/ Non-executive
12780 8280 4500
Total 24804 16380 8424 9.4.2.1 Manpower requirement for Thermal Projects (Workers) Category Estimated
requirement Available Augmentation
Required Mechanics 1770 1200 570 Electricians 1062 720 342 Crane operators 3540 2400 1140 Drivers 8820 5760 3060 LP welders 7080 4800 2280 HP welders 1062 720 342 Aluminium welders 177 120 57 Fitters 10620 7200 3420 Riggers 9570 6020 3550 Insulation applicators
354 240 114
Cable jointers 885 600 285 Carpenters 3312 2196 1116 Masons 7080 4800 2280 Bar benders 2478 1680 798 Total 55090 37736 17354 9.4.3 Requirement of construction equipment 9.4.3.1 Hydro Projects (Main Equipments) Main Equipment required to be procured during 11th plan could be summarized as below:

Executive Summary Working Group on Power-11th Plan (2007-12)
57
Sl. No
Particulars of equipment
Estimated Requirement
Available Augmentation Required
1 Hydraulic Drill Jumbos (1 to 3 boom)
210 85 125
2 Hydraulic Excavators (0.2 to 5.2 cum)
520 210 310
3 Loaders 540 220 320 4 Dozers 420 165 255 5 Dumpers (12T to 35 T) 730 290 440 6 Road Rollers 55 20 35 7 Raise Borer/Climber 45 20 25 8 Concrete Batching plant
(30 to 360 cum/hr) 210 85 125
9 Aggregate Processing Plant (50 to 600 TPH)
110 40 70
10 Tower Crane (6.5 to 10 T)
120 45 75
11 Shutter with travellers 470 190 280 12 Dry Shotcrete machines 440 180 260 13 Wet Shotcrete machines 130 50 80 14 Cranes (5 T to 60T) 405 160 245 15 EOT/ Gantry Cranes (10T
to 20T) 175 70 105
9.4.3.2 Thermal Projects (Main Equipments) The major equipment required to be deployed for simultaneous construction of 24 projects of less than 500 MW and 21 projects of more than 500MW is summarized below. S.No. Particular of equipment Estimated
Requirement Available Augmentation
required 1) 325 T Fm Crane Or Equivalent 47 12 30 2) Sumitomo crane or equivalent 150 t 177 120 57 3) Crawler mounted crane 100 t 90 72 18 4) Crawler mounted crane 75 t 444 312 132 5) Mobile crane - 20 mt / 8 mt 1206 732 474 6) Mobile crane – 40 mt 156 98 58 7) Heavy duty trailer 20-50 mt 1206 732 474 8) Dumpers 3540 3540 -- 9) Dozers ( heavy duty d-6 & d-8)
(hydraulic) 132 68 64
10) Vibro compactors 444 312 132 11) Concrete pump 444 312 132 12) Truck mounted concrete pumps 177 100 77

Executive Summary Working Group on Power-11th Plan (2007-12)
58
S.No. Particular of equipment Estimated Requirement
Available Augmentation required
with placing boom 13) Transit mixer (min. 5 cum.
Capacity) 884 528 356
14) Batching plant (more than 30 cum. / hr. Capacity)
288 166 122
15) Rotaritory hydraulic piling rig 177 100 77 16) Compressors 177 100 77 17) DG sets 354 200 154 18) Boring equipment for trench less
construction 45 31 14
19) Welding machines 12060 12060 --- 20) Slip form equipment 45 31 14 21) Strand and jack arrangement for
boiler 21 1 20
22) ETDA cleaning arrangement for boiler
21 1 20
23) Passenger cum goods lifts for boiler 156 98 58 24) Induction heating machines 156 98 58 25) Gantry Crane 156 98 58 26) Pock lain 444 312 132 27) Tipper 3120 1960 1160 9.5 REQUIREMENT OF KEY INPUT MATERIALS Total requirement of various materials for Capacity Addition planned during 11th & 12th Plans
Lakh Tonnes
11th Plan 12th Plan Material 68,869 MW 82,200MW
Cement 306.3 470.0 Structural Steel 80.4 94.4 Reinforcement Steel 51.3 70.1 CRGO Steel 10.7 13.5 Castings 0.4 0.5 Forgings for TG sets 0.4 0.5 Special Steel for Sub-Stations 3.3 3.3 Steel for Conductors in Transmission system Lines
2.7 2.7
Steel for Conductors in distribution system Lines
4.5 5.7
Aluminium 16.0 18.6

Executive Summary Working Group on Power-11th Plan (2007-12)
59
11th Plan 12th Plan Material 68,869 MW 82,200MW
Copper 8.1 8.1 Zinc 1.45 1.51 Thermal Insulation 2.5 3.1 Static Meters with downloading facility (Nos.)
12.44Crores 4.96Crores
9.6 RECOMMENDATIONS 9.6.1 Coal and Lignite Domestic coal would continue to be the main stay for thermal power generation in India. In order to make available the coal and lignite for power generation following are recommended: 9.6.1.1 Coal Mining
1. Coal Sector may be given “Infrastructure Status” with ‘Tax Holiday’ & Duty exemptions as at present the total duty incidence on mining equipment/spares is about 50-55 % after including the countervailing and other additional duties.
2. Alternatively, the concept of Mega Project may be introduced in the coal sector also by according Mega Status to Coal Mines of production level of 5 MTPA or above and providing benefits of tax / duty concessions.
3. Deployment of state-of-the-art technology in the Indian mines for
enhancing the productivity and exploitable quantity of coal needs to be encouraged by liberalization of import policy.
4. All coal blocks with firm Geological Report (GR) may be earmarked with no reservation / blocking.
5. Mobilization of the investment in coal mining requires inducting and encouraging more players from both public and private sectors.
6. Reputed International Coal Companies may be encouraged to come to India which will facilitate introduction of latest mining technologies and mine safety measures.
7. There is an urgent need to encourage more exploratory agencies and for relaxation of mandatory supervision by CMPDIL alone.
8. The pace of regional surveys and drilling needs to be accelerated to complete the comprehensive coal resource assessment exercise at the earliest.
9. The list of agencies authorized to supervise may be expanded and the Govt. agencies which are otherwise permitted to under take exploration without seeking project specific exploration license could also be authorized to supervise the exploration by other players. Further, new Public Sector agencies including their joint venture such as JV of NTPC &

Executive Summary Working Group on Power-11th Plan (2007-12)
60
SCCL may also be entrusted with the task of new exploration and accorded exemption from obtaining exploration license.
10. Expeditious environmental clearance needs to be accorded by MOEF on priority for 11th Plan coal mining projects.
11. Formulation of unified R&R policy and simplification of issuance of notification and clearances shall help in expeditious development of coal mining projects.
12. In case of more than one nearby coal mine projects, centralized/ combined forestation at a suitable location needs to be accepted.
9.6.1.2Lignite
1. At present only a small percentage of the total reserves of lignite have
been exploited. This needs to be enhanced to make use of this proven source of energy. Allocation of Lignite blocks to interested developers could facilitate faster growth of Lignite Production. If generation target is enhanced to around 80% PLF, there will likely be shortfall in tune of 2 MTPA.
9.6.2 Railways
1. Railways need to expedite sectoral studies, development of suitable plans
and ensure adequate rail network for coal movement. Dedicated trunk-routes for coal transport to the power project need to be developed. Interim measures to be taken if dedicated freight corridor does not come up in 11th Plan period.
2. Development of new rail links is required to be expedited along with the Railways connectivity with Ports.
3. Timely establishment of rail links with allotted coal mining blocks. 4. Rail freight rates for coal transport may be rationalized. 5. The Railways, Coal and Power Ministry may work together to draw up a
well conceived model of Fuel Supply & Transport Agreement (FSTA).
9.6.3 Ports
1. Port capacity needs to be augmented to meet the increased infrastructure requirement.
2. To expeditiously complete the existing projects like captive coal jetty at New Mangalore Port, Coal Berth at Ennore port, Deepening Channel at Paradeep port.
3. The major ports of the country may be developed as mega ports with satellite ports dedicated to cargo like coal.
4. Port connectivity through seamless hinterland road and rail development needs to be enhanced to meet the requirement of imported coal.

Executive Summary Working Group on Power-11th Plan (2007-12)
61
9.6.4 Natural Gas Natural gas is the fastest growing primary energy source amongst fossil fuel. Gas supply to the existing gas based power stations has been inadequate and the plants have been operating at around 58-60% PLF. The gas based stations comparatively have shorter gestation period and are easier to operate. Following are recommended in this regard:
1. The Government Quota of Gas from fields allotted / to be allotted under NELP as per the respective Production Sharing Agreement should first be utilized to meet the shortfall in supply from the linkage of existing customers before allocation to others
2. There is need to ensure that assets like Gas Based Power Plants which have been set up with substantial investment are not stranded / idle or inadequately utilized on account of constraints of Gas / Infrastructure availability and should get priority over new units . Therefore, while granting Open Access for transportation of gas to sectoral players, preference should be given to existing customers of gas.
3. Planning Commission, Govt. of India should facilitate the allocation of gas to new gas based projects as well as in setting the reasonable pricing of gas for power generation.
9.6.5 Key Input Materials With a view to help industries to plan/ allocate build up their capacities over a longer time frame, assessment of material requirement for 11th and for 12th Plan period on a broad basis have been made and on prima facie considerations, availability of various materials required for capacity addition planned for 11th & 12th Plan may not be a constraint unless requirements get bunched up in any particular year. Following are recommended in this regard:
1. CRGO being the critical input for transformers and imported item, needs to be exempt from Customs Duty to bring down the cost of transformers. This is particularly important in view of the massive distribution system augmentation planned in the 11th plan.
2. Simultaneously. Domestic producers may be encouraged for production of CRGO as in the past non-availability of CRGO has led to delay in project implementation.
3. Detailed analysis of the key materials availability for power sector needs to be done by Planning Commission considering requirement of other sectors of the economy.
4. The number of static meters required for 11th Plan is of the order of 12.44 crores. The manufacturers of static meters need to be geared up to meet such huge requirements.

Executive Summary Working Group on Power-11th Plan (2007-12)
62
9.6.6 Capability for manufacture of main plant equipment by indigenous manufacturers, m/s BHEL for coal based power plants
1. M/s BHEL is the only major manufacturer of main power plant equipment
for thermal and hydro power projects in India. In the 10th Plan , the main plant equipments for 65% of the thermal capacity addition, are being supplied by BHEL. In the year 2003-04 BHEL received major orders totalling to 5125 MW to be commissioned by 2006-07. Some of the units out of this capacity are found to be slipping from 10th Plan target . This matter was taken up with BHEL and a study was carried out by CEA for the reasons leading to the delay. It has been found that it was mainly due to inadequate manufacturing capacities of its various manufacturing units , delay in finalization of orders for Balance of Plant (BoP) for EPC contracts and shortage of construction /commissioning machinery, and manpower. With the present capacity existing in BHEL manufacturing plants, BHEL can deliver equipment only up to 3000 MW per year for coal based projects . This was taken up with BHEL and they are proposing to increase this capacity to 4675 MW by Dec. 2007 and further to 6475 MW by the year 2010-11 for coal based power projects. Similarly the manufacturing capacity for Hydro projects would also need augmentation to cater to the increased requirements for 11th & 12th plan.
2. Based on the capacity additions planned for coal fired thermal power
projects, the following position emerges:
Sl No.
Year of Commissioning/ Details
2007-08 2008-09 2009-10 2010-11 2011-12 Grand Total
i) BHEL’s Capabilities (MW)
3000 4675 4675 6475 6475 25300
ii) (a) Orders received by BHEL/ likely orders (MW)
2170 2945 5730 6475 (likely)*
6475 (likely)
23795
(b) Orders by other manufacturer (MW)
1260 2280 3850 4975 10475 22840
Total (MW) 3430 5225 9580 11450 16950 46635 * assuming that the full capacity of BHEL would be utilised
1. From the above it is evident that BHEL would be finding it difficult to meet the commissioning targets for the year 2009-10. Further, for the years 2010-11 and 2011-12, equipment for huge capacity has to be supplied by other manufacturers to meet the capacity addition targets.
2. Accordingly, it is informed that the country needs to develop additional manufacturers of main plant equipment to meet the projected capacity addition targets and also to induce competition

Executive Summary Working Group on Power-11th Plan (2007-12)
63
in the market for achieving a lower price/tariff. This has also been emphasised by the Honble Minister of Power in the past, while finalising the capacity addition programs. BHEL needs a substantial expansion in the manufacturing capacity for thermal and Hydro plants.
9.6.7 Construction Capability Capability of construction agencies, availability of construction equipment, appropriate construction technology and manpower are vital for implementation of the capacity addition programme. Construction industry in India has grown significantly and has acquired adequate experience in the field of construction and infrastructure projects. Following are recommended in this regard:
1. Construction agencies are available in India (Domestic as well as International) for taking up hydro as well as thermal power projects in 11th Five Year Plan. Augmentation of manpower and construction equipment would be required by the construction agencies to meet the targets.
2. Serious efforts need to be made by the major power companies to develop vendors for supply and erection of equipment and for taking up civil construction.
3. Power Projects should be granted infrastructure status for qualifying for exemption of taxes and duties.
4. Government should consider taking up construction of approach road to feasible project sites through a common fund to be recovered from the developers subsequently.
5. Single window clearance should be encouraged with time frame for all the statutory clearances required by the developers.
6. Immediate action need to be taken to create at least 10 Accredited Training Institutions at different geographical locations for skill building in specific areas like HP Welder, Aluminum Welders, Crane Operators, Cable Jointer etc. vocational training wing of Ministry of Education, NICMAR and CIDC could play the part of nodal agencies for such institutions.
7. Cooperation of State Govt. must be ensured to facilitate smooth land acquisition and implementation of R&R Plan.
8. New technologies like RCC Dam, jet grouting and use of Geotextile/ geosynthetics in place of filter materials should be adopted in Hydro Projects.
9. Use of latest construction equipment like Tunnel Boring Machine (TBM), Road Headers, Raise Borers, Forepoling machines, Jet grouting Equipment, Hydro fraise equipment etc should be encouraged to achieve fast progress.
10. Low bed wagons for transportation of transformers/generators/stator/boiler drum need to be augmented at least by 14 Nos.

Executive Summary Working Group on Power-11th Plan (2007-12)
64
9.6.8 Integrated Energy Policy Integrated Energy Policy – Report of the Expert Group under the Chairmanship of Shri Kirit S. Parikh, Member, Planning Commission, Govt. of India has addressed wide ranging issues and has suggested policy initiatives to provide energy availability and security for sustainable economic development. A few of the important issues delineated in the policy and impacting the power sector needs to be implemented. Following are recommended in this regard:
1. Standardization of Main Plant equipment in bands of different unit sizes is desirable particularly from the point of view of faster capacity addition; however there is a need for an Empowered Committee for centralized procurement and to bench mark the price for different unit sizes.
2. The rate of return on the investment in power sector has to be adequate to attract investment and to compete with the opportunities of investment in other sectors.
3. To ensure capacity addition through tariff based completive bidding there is a need to create an enabling framework by both State and Central governments in the areas of allocation of site, water & fuel linkage, environmental clearance, R&R etc.
4. Coal price for supply of coal under long term agreement should not be linked with e-auction coal price as it will only push up the coal price. Further, linking of coal price with the imported coal price would also not be appropriate. There is an urgent need of Regulator in Coal Sector.
5. The captive coal mining blocks should be fully explored with ready Geological Report (GR), so as start the production from captive coal blocks in a timely manner.
6. Opening up of coal sector to promote competition. 7. Allocation of coal mining blocks for generation sector based on least cost
generation. 8. Open access to the Gas network should be ensured to promote
competition in gas sourcing. Role of Regulator in Oil & Gas sector needs to be expanded to include gas pricing.

Executive Summary Working Group on Power-11th Plan (2007-12)
65
10.0 FINANCIAL ISSUES AND POWER SECTOR FINANCING 10.1 During 11th Plan period, the overall generation capacity addition of 68,869
MW is envisaged. (Refer Para 10.2.3 of main Working Group Report) (MW)
SECTOR HYDRO THERMAL NUCLEAR TOTAL
Projects Under Construction 11,931 16,254 3,160 31,345 Committed Projects 3,654 33,870 0 37,524 Total capacity 15,585 50,124 3,160 68,869 10.2 The overall requirement of funds in 11th Plan has been estimated as Rs.
1,031,600 crore with details as follows: (Refer Para 10.9 main Working Group Report)
( Rs. Crore) Particulars State Central Private Total Generation including Nuclear 1,23,792 2,02,067 85,037 4,10,896 DDG 20,000 20,000 R & M 15,875 15,875 Transmission 65,000 75,000 1,40,000 Distribution including Rural electrification 2,87,000 2,87,000 HRD 462 462 R&D Outlay 1,214 1,214 DSM 653 653
Total Power Sector 4,91,667 2,99,396 85,037 8,76,100 NCES and Captive 22,500 93,000 1,15,500 Merchant Plants 40,000 40,000
Total Funds Requirement 5,14,167 2,99,396 2,18,037 10,31,600
Year wise Funding Requirement for 11th Plan
(Rs. Crore) 2007-08 2008-09 2009-10 2010-11 2011-12 Total
1,32,264 1,74,003 2,24,754 2,52,707 2,47,872 10,31,600
10.3 The details of major sources and estimated mobilization, funding gap and possible sources of bridging the gap is given below in following Tables (Refer Para 10.11 of main Working Group Report)

Executive Summary Working Group on Power-11th Plan (2007-12)
66
(Rs. Crore) Description State Central Private Total Funds required 5,14,167 2,99,396 2,18,037 10,31,600
A) Equity Required (D/E - 70:30) 1,54,250 89,819 65,411 3,09,480
B) Equity Available
1 -Promoters including FDI for IPPs 0 0 25,511 25,511
-Promoters including FDI for NCES & Captive 0 0 27,900 27,900
-Merchant Power Plant 12,000 12,000
2 Internal Resources 0 62,922 0 62,922
3 Govt. Support
3.1 State Govt. 0 0 0 0
3.2 Central Govt. 0 0 0 0
C) Total Equity Available 0 62,922 65,411 1,28,333
D) Additional Equity to be arranged (A-C) 1,54,250 26,897 0 1,81,147
E) Debt Required (D/E - 70:30) 3,59,917 2,09,577 1,52,626 7,22,120
F) Debt Available
1.1 Direct Market Borrowing 10,000 15,000 0 25,000
1.2 Banks and AIFIs 37,173 58,415 10,621 106,210
1.3 PFC 64,960 8,120 8,120 81,200
1.4 REC 47,320 5,915 5,915 59,150
1.5 IIFCL 0 6,000 9,000 15,000
2.1 Multilateral/Bilateral Credits 5,520 19,320 2,760 27,600 2.2 ECA/ECB/Syndicated Loan etc. 0 46,000 11,500 57,500
G) Total Debt Available 1,64,973 1,58,770 47,916 3,71,660
H) Additional Debt to be arranged (E-G) 1,94,943 50,807 1,04,710 3,50,460
I) Additional Equity & Debt required (D+H) 3,49,193 77,704 1,04,710 5,31,607
J) Total Availablity of Debt and Equity 1,64,973 2,21,692 1,13,327 4,99,993
K) Funding by Special Schemes
1 APDRP 40,000 0 0 40,000
2 RGGVY 40,000 0 0 40,000
L) Total shortfall to be arranged (I-K) 2,69,193 77,704 1,04,710 4,51,607

Executive Summary Working Group on Power-11th Plan (2007-12)
67
Summary of Funds Requirement and Mobilization for Different Debt: Equity Scenario
( Rs. Crore) Description D/E
70:30 D/E
80:20 Funds required 10,31,600 10,31,600Equity Required 3,09,480 2,06,320Total Equity Available 1,28,333 1,28,333Additional Equity to be arranged 1,81,147 77,987Debt Required 7,22,120 8,25,280Total Debt Available 3,71,660 3,71,660Additional Debt to be arranged 3,50,460 4,53,620Additional Equity & Debt required 5,31,607 5,31,607Less: Funding by Special Schemes 80,000 80,000Total shortfall to be arranged 4,51,607 4,51,607Equity required after funding from special schemes 1,21,147 17,987Debt required after funding from special Schemes 3,30,460 4,33,620
10.4 PROPOSED MEASURES FOR REDUCING FUNDING GAP
1. Modification of ECBs guidelines permitting infrastructure borrowers including intermediaries PFC, REC, IDFC etc to borrow funds from overseas market under automatic approval route and Debt Servicing to be eligible for exemption under Section 10 (15) (iv) of Income Tax Act. (Refer Para 10.16.1.1 of main Working Group Report)
2. Introduce Power Bonds or Vidyut Vikas Patra, as transferable bearer
instrument for wider retail participation (Refer Para 10.16.1.2 of main Working Group Report)
3. Additional investment limit of Rs. 50,000 per year for infrastructure bonds
under Section 80C of the Income Tax Act, 1961 over and above existing limit of Rs. 1,00,000 with a lock in period of at least 5 years. Expected mobilization over 5 years is estimated at Rs. 1,50,000 crore. (Refer Para 10.16.1.3 of main Working Group Report)
4. Long term Capital Gains Bonds: Allow Section 54EC benefit under Income
Tax Act for bond issuances by PFC & IIFCL in line with REC & NHAI. (Refer Para 10.16.1.4 of main Working Group Report)
5. Possible Sources of Bridging the Gap
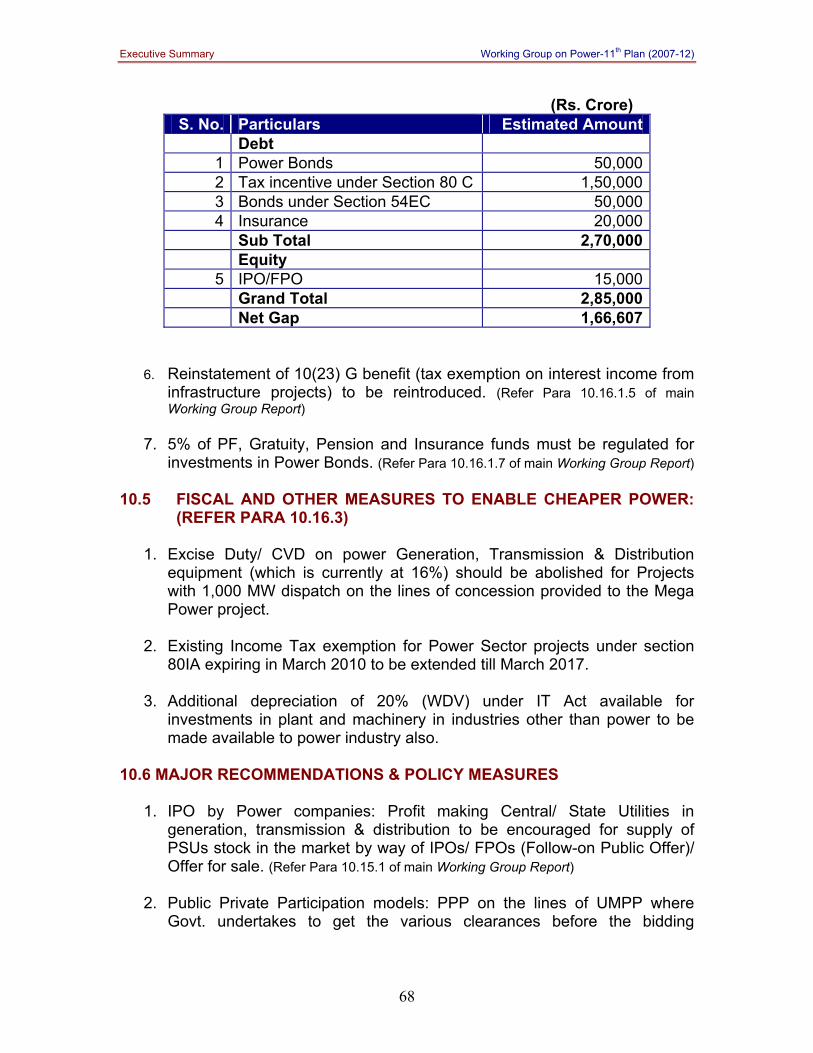
Executive Summary Working Group on Power-11th Plan (2007-12)
68
(Rs. Crore) S. No. Particulars Estimated Amount
Debt 1 Power Bonds 50,000 2 Tax incentive under Section 80 C 1,50,000 3 Bonds under Section 54EC 50,000 4 Insurance 20,000 Sub Total 2,70,000 Equity
5 IPO/FPO 15,000 Grand Total 2,85,000 Net Gap 1,66,607
6. Reinstatement of 10(23) G benefit (tax exemption on interest income from infrastructure projects) to be reintroduced. (Refer Para 10.16.1.5 of main Working Group Report)
7. 5% of PF, Gratuity, Pension and Insurance funds must be regulated for
investments in Power Bonds. (Refer Para 10.16.1.7 of main Working Group Report) 10.5 FISCAL AND OTHER MEASURES TO ENABLE CHEAPER POWER:
(REFER PARA 10.16.3)
1. Excise Duty/ CVD on power Generation, Transmission & Distribution equipment (which is currently at 16%) should be abolished for Projects with 1,000 MW dispatch on the lines of concession provided to the Mega Power project.
2. Existing Income Tax exemption for Power Sector projects under section
80IA expiring in March 2010 to be extended till March 2017.
3. Additional depreciation of 20% (WDV) under IT Act available for investments in plant and machinery in industries other than power to be made available to power industry also.
10.6 MAJOR RECOMMENDATIONS & POLICY MEASURES
1. IPO by Power companies: Profit making Central/ State Utilities in
generation, transmission & distribution to be encouraged for supply of PSUs stock in the market by way of IPOs/ FPOs (Follow-on Public Offer)/ Offer for sale. (Refer Para 10.15.1 of main Working Group Report)
2. Public Private Participation models: PPP on the lines of UMPP where
Govt. undertakes to get the various clearances before the bidding

Executive Summary Working Group on Power-11th Plan (2007-12)
69
facilitates quicker financial closure. (Refer Para 10.15.2 of main Working Group Report)
3. Relaxation in Companies (Issue of Share Capital with Differential Voting
Rights) Rules, 2001, for issuing Equity Shares with Differential Voting Rights: Waive requirement of having distributable profit for three financial years. (Refer Para 10.15.3 of main Working Group Report)
4. Equity support by State Governments through Budget Allocation: State
Government should allocate funds through its budget for providing equity support to State Utilities in Power Sector (Refer Para 10.15.4 of main Working Group Report)
5. Specialized debt funds for infrastructure financing (Refer Para 10.15.5.2 of
main Working Group Report) 6. Development of a Venture Capital / PE fund to invest in equity of power
projects. (Refer Para 10.15.6 of main Working Group Report) 7. Development of Primary Markets for Bonds and Corporate Debt by
enhancing issuer base and investor base (Refer Para 10.15.7 of main Working Group Report)
8. Development of Hydro Power Viability Fund which finances the deferred
component of the power tariff of the first five years and recovers its money during 11th to 15th year of the operation. (Refer Para 10.15.8 of main Working Group Report)
9. Viability Gap Fund (for Remote areas) which finances the deferred
component of the power tariff of the first five years and recovers its money during 11th to 15th year of the operation. (Refer Para 10.15.9 of main Working Group Report)
**********

Demand for Power and Generation Planning Working Group on Power for 11th Plan
Page 1 of Chapter 1
Chapter 1
DEMAND FOR POWER AND GENERATION PLANNING 1.0 TENTH PLAN REVIEW The total installed capacity at the beginning of the 10th Plan i.e. 1.4.2002 was 1,05,046 MW comprising 26,269 MW hydro, 74,429 MW thermal (including gas and diesel), 2,720 MW nuclear and 1,628 MW wind-based power plants. The region-wise details of installed capacity as on 1.4.2002 are given in Table 1.1
Table 1.1
Summary of Installed Capacity at the Beginning of 10th Plan (1.4.2002) (Figures in MW)
Thermal Sector Hydro Coal Gas Diesel Total Nuclear
Renewable Energy
Sources Total
State 22,639 36,722 2,662 558 39,941 0 61 62,642 Private 581 3,991 4,082 577 8,651 0 1,567 10,799 Central 3,049 21,418 4,419 0 25,837 2,720 0 31,605 ALL INDIA 26,269 62,131 11,163 1,135 74,429 2,720 1,628 1,05,046
At the beginning of 10th Plan the country was facing peak shortages of 12.6% and energy shortage of 7.5%, with lowest of 3.7% in Eastern Region and highest at 16.9% in Western Region in terms of peak and 1% to 10.4% in terms of Energy. 1.1 TARGET CAPACITY ADDITION DURING TENTH PLAN Taking into account the preparedness of the projects and resources available, a feasible capacity addition target of 41,110 MW comprising 14,393 MW hydro, 25,417 MW thermal and 1,300 MW nuclear was fixed for the 10th Plan as detailed below.
Table 1.2
10th Plan Capacity Addition Target-Sector Wise (Figures in MW)
SECTOR Hydro Thermal Nuclear Total CENTRAL 8,742 12,790 1,300 22,832 STATE 4,481 6,676 0 11,157 PRIVATE 1,170 5,951 0 7,121 TOTAL 14,393 25,417 1,300 41,110

Demand for Power and Generation Planning Working Group on Power for 11th Plan
Page 2 of Chapter1
10th PLAN CAPACITY ADDITION TARGET (41,110 MW) - BY SECTORS
CENTRAL SECTOR
56%
STATE SECTOR27%
PRIVATE SCTOR
17%
11,157 MW
7,121 MW
22,832 MW
Region wise/ Status wise Summary of this capacity addition target is furnished in Appendix 1.1. 1.2 STRATEGY FOR ACHIEVING 10TH PLAN TARGET The capacity addition achieved during the 9th Five Year Plan was below 20,000 MW and the best performance during any plan in the past was 21,400 MW added during the 7th plan period. The goal of capacity addition of 41,110 MW during 10th Plan was a great challenge to the central, state and private sector generating companies. MOP and CEA formulated a strategy for achieving the planned target of capacity addition during the 10th Plan by carrying out rigorous monitoring of the progress of construction of the projects. The efforts of CEA and MOP have yielded good results. Critical projects not making satisfactory progress have been identified and focused efforts have been made to remove constraints in their implementation. However, in spite of best efforts by project authorities, CEA and MOP, a few projects in hydro and thermal are still likely to slip from the 10th Plan. At the same time, action has also been taken to add new additional capacity which was initially not included in the target for the 10th plan. This was done to supplement the effort as some of the plants included in the target were likely to slip. 1.3 ACTUAL CAPACITY ADDITION AND POWER SUPPLY POSITION DURING 10TH
PLAN (TILL DATE) 1.3.1 Actual Capacity Addition A capacity addition of 17,995 MW has been achieved during 10th Plan till 31-12-06.Yearwise details of the target and actual capacity addition during 10th Plan up to 31.12.06 is given in Table 1.3

Demand for Power and Generation Planning Working Group on Power for 11th Plan
Page 3 of Chapter 1
Table 1.3
Year wise Capacity Addition During 10th Plan up to 31.12.2006 ( All India)
(Figures in MW)
Year (MW) Type Target Actual Achievements
Hydro 607 649*** Thermal 3502 2,223
Coal 710 1210 Lignite 795 460
Gas 1977 515 Oil 20 38
Nuclear 0 0
2002-03
Total 4,109 2,872 Hydro 3,765 2,590 Thermal 1,437 1,362
Coal 735 945 Lignite 420 210
Gas 259 207 Oil 23 0
Nuclear 0 50*
2003-04
Total 5,202 4002 Hydro 2,585 1,015 Thermal 2,661 2,934
Coal 2000 2710 Lignite 460 125
Gas 173 70 Oil 28 29
Nuclear 0 0
2004-05
Total 5,246 3,949 Hydro 2886 1340 Thermal 3436 1589
Coal 1790 830 Lignite 250 125
Gas 1396 634 Diesel 0 0
Nuclear 590 590**
2005-06
Total 6912 3519 Hydro 3884 1316 Thermal (Coal, Lig, Gas & Diesel)
13123 1811
Nuclear 760 540
2006-07 Up to 31st
December, 2006
Total 17767 3667 Grand Total
(Up to 31st December 2006)17995
* and **Additional capacity 50 MW each due to uprating of MAPS-1 &2 (Nuclear) ***- Includes projects of 12 MW capacity not included in the target viz. Potteru (6 MW) & Likimiro (8 MW).

Demand for Power and Generation Planning Working Group on Power for 11th Plan
Page 4 of Chapter1
The Year-wise details of projects already commissioned during 10th Plan are given in Appendix 1.2 1.3.2 Installed Capacity as on 31.12.2006 The total Installed Capacity as on 31.12.2006 was 1,27,753 MW comprising 33,642 MW hydro, 84,020 MW thermal including gas & diesel, 3,900 MW nuclear based power plants and 6,190 MW from renewable energy sources including wind. The sector– wise details of installed capacity is given in Table 1.4
Table 1.4
Summary of Installed Capacity as on 31.12.2006 (Figures in MW)
Thermal Sector Hydro Coal Lig Gas$ Oil© Total
Nucl. R.E.S.@ Total
CENTRAL 6,672 24,020 2,490 5,899 0 32,409 3,900 0 42,981 STATE 25,664 37,386 465 3,500 1,239 42,589 0 2,568 70,821 PRIVATE 1,306 2,831 500 4,183 1,507 9,022 0 3,523 13,951 TOTAL 33,642* 64,237** 3,455 13,582 2,746 84,020 3,900 6,191 1,27,753
Source: DMLF Division, CEA @ R.E.S. = Renewable Energy Sources includes Small Hydro Project(SHP), Biomass Gas (BG), Biomass Power (BP) Urban and Industrial waste power (U&I) & Wind Energy * Includes ROR- 15,143 MW, PSS- 664 MW, Storage- 17,835 MW ** 21,759 MW Pithead & 42,478 MW Load Center/ Non Pit Head $ Includes Liquid Fuel based Kayamkulam Project-350 MW © 1544 MW Dual firing stations included in oil. 1.3.3 Power supply position in 10th plan The year-wise actual power supply position during 2002-03, 2003-04, 2004-05 ,2005-06 and 2006-07(till Dec-06) of 10th plan is given in Table 1.5
Table 1.5
Actual Power Supply Position ( All India Basis ) Year Peak Energy Require-
ment (MW)
Availabi-lity (MW)
Surplus (+)/Short-age (-) (MW)
Shortage/Surplus %
Requirement (MU)
Availability (MU)
Surplus (+)/Shortage (-) (MU)
Shortage /Surplus %
2002-03 81,492 71,547 - 9,945 -12.2 5,45,983 4,97,690 -48,093 -8.8 2003-04 84,574 75,066 -9,508 -11.2 5,59,264 5,19,398 -39,866 -7.1 2004-05 87,906 77,652 -10,254 -11.7 5,91,373 5,48,115 -43,258 -7.3 2005-06 93,255 81,792 -11,463 -12.3 6,31,757 5,78,819 -52,938 -8.4 April–Dec 2006 1,00,466 86,425 -14,041 -14.0 5,10,223 4,65,149 -45,074 -8.8

Demand for Power and Generation Planning Working Group on Power for 11th Plan
Page 5 of Chapter 1
1.4 ACTUAL/ LIKELY CAPACITY ADDITION DURING TENTH PLAN A capacity of 17,995 MW has been commissioned till date(31.12.2006) during the 10th Plan and a capacity of 12,646 MW is expected to be commissioned during the balance period (Jan.07-March07) of 10th Plan. Year wise capacity addition is given in Table 1.6.
Table 1.6 Year wise Capacity Addition During 10th Plan (All India Basis)
(Figures in MW) Type 2002-03* 2003-04* 2004-05* 2005-06* 2006-07@ TotalHydro 635 2,590 1,015 1,340 3,274 8,854Thermal 2,223 1,362 2,934 1,588 12,280 20,387Nuclear 0 50 0 590 760 1,400Total 2,858 4,002 3,949 3,518 16,314 30,641
*Actual, @ likely, (Excluding wind & Res.) The target set for capacity addition during the 10th Plan was 41,110 MW. Even though stringent monitoring of projects has been done, the likely capacity addition during 10th Plan has been assessed to be about 30,641 MW out of which about 17,995MW has already been commissioned as on 31-12-06. The details of projects included in original 10th plan target and their present status are given in Appendix 1.3 As per latest indication, out of 30,641 MW a capacity of 5,727 MW may further slip to 11th Plan because of various reasons including delay in supply and execution by BHEL. Any slippage of the projects from 10th plan would be reckoned as additional capacity in 11th plan over and above being proposed in this document. The details of 5,727 MW capacity expected to slip to 11th Plan is given in Appendix 1.4. During the first year of 10th plan itself it became clear that a number of projects totalling to 3,009 MW in public and private sectors could not be taken up due to various reasons which included non availability of escrow cover by State Government to IPP projects and fund constraints. Certain projects totalling to a capacity of 12,516 MW comprising 7,458 MW thermal and 5,058 MW hydro as included in the 10th Plan target of 41,110 MW are slipping to 11th Plan. Further 5,056 MW capacity additional projects comprising of 4,956 MW thermal and 100 MW nuclear (uprating) originally not included in the 10th Plan target have been additionally identified for benefits during 10th Plan by expediting the process of project implementation and compression of the construction schedule to make up for the projects which could not take off. This has been possible through extraordinary efforts made by CEA & Ministry of Power in pursuing the developers and other Stake holders A summary of the slippages and additional projects identified is given in Table 1.7.

Demand for Power and Generation Planning Working Group on Power for 11th Plan
Page 6 of Chapter1
Table 1.7 Summary of Likely Capacity Addition during 10th Plan
(Figures in MW)
**This includes a capacity of 2578 MW which were the best efforts projects. This also includes a further capacity of 2445 MW which would need extra ordinary efforts for completion during 10th plan mainly due to constraints on the side of BHEL. 1.5 LIKELY INSTALLED CAPACITY AT THE END OF 10TH PLAN I.E. AS ON
31.03.2007 The likely Installed Capacity at the end of 10th Plan i.e. as on 31.03.2007 is 1,40,571 MW comprising 35,600 MW hydro, 94,660 MW thermal including gas & diesel, 4,121 MW nuclear based power plants and 6,191 MW from renewable energy sources including wind. The sector– wise details of this is given in Table 1.8.
Table 1.8 Summary of Likely Installed Capacity as on 31.03.2007
(Figures in MW)
Sector Hydro Thermal Nucl. Wind/RES Total Coal Lignite Gas Oil Total CENTRAL 75,62 27,728 2,490 4,419 0.0 34,637 4,120 0.0 46,319 STATE 26,745 41,631 665 3,760 1,239 47,294 0 2,568 76,607 PRIVATE 1,293 3,081 500 7,641 1,507 12,730 0 3,623 17,645 TOTAL 35,600 72,440 3,655 15,820 2,746 94,660 4,120 6,191 1,40,571
1.5.1 Analysis of reasons for 10th plan slippages The causes for slippages and delays in implementation of 10th plan power projects is discussed below: It has emerged that out of 41,110 MW capacity addition target during 10th plan over 12,500 MW was not feasible within 10th Plan because of inadequate preparedness. Some of the major groups in this category are as follows: (a) About 3960 MW (660 MW unit size ) projects of NTPC based on super critical
technology were not found feasible to be commissioned during 10th plan as originally, NTPC was of the view that indigenous manufacturer BHEL would tie up collaboration agreement and participate in tender for development of these projects, which BHEL had not done even till middle of 2003.
Thermal Hydro Nuclear Total Original programme 25,417 14,393 1,300 41,110Dropped 2,528 481 0 (-)3,009Capacity slipping to 11th plan 7,458 5,058 0 (-)1,25,16 Back up capacity likely to be added
4,956 - 100 5,056
Total 20,387 8,854 1,400 30,641**
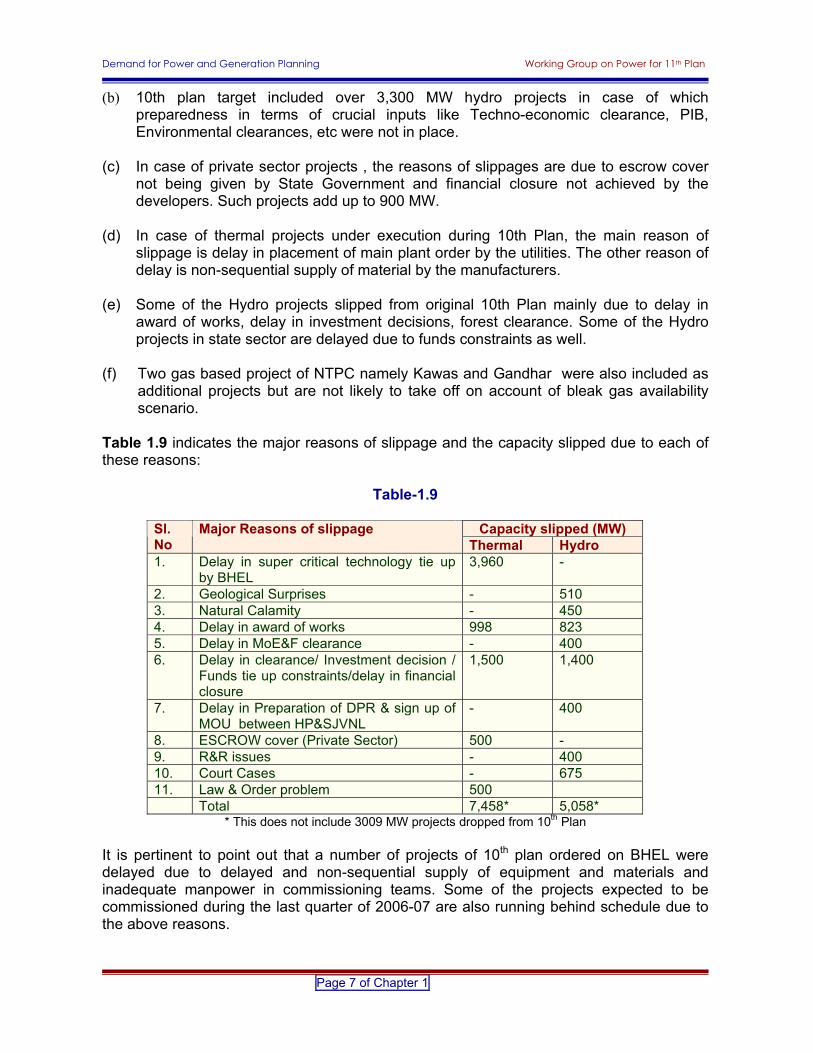
Demand for Power and Generation Planning Working Group on Power for 11th Plan
Page 7 of Chapter 1
(b) 10th plan target included over 3,300 MW hydro projects in case of which preparedness in terms of crucial inputs like Techno-economic clearance, PIB, Environmental clearances, etc were not in place.
(c) In case of private sector projects , the reasons of slippages are due to escrow cover
not being given by State Government and financial closure not achieved by the developers. Such projects add up to 900 MW.
(d) In case of thermal projects under execution during 10th Plan, the main reason of
slippage is delay in placement of main plant order by the utilities. The other reason of delay is non-sequential supply of material by the manufacturers.
(e) Some of the Hydro projects slipped from original 10th Plan mainly due to delay in
award of works, delay in investment decisions, forest clearance. Some of the Hydro projects in state sector are delayed due to funds constraints as well.
(f) Two gas based project of NTPC namely Kawas and Gandhar were also included as
additional projects but are not likely to take off on account of bleak gas availability scenario.
Table 1.9 indicates the major reasons of slippage and the capacity slipped due to each of these reasons:
Table-1.9
Capacity slipped (MW) Sl.
No Major Reasons of slippage
Thermal Hydro 1. Delay in super critical technology tie up
by BHEL 3,960 -
2. Geological Surprises - 510 3. Natural Calamity - 450 4. Delay in award of works 998 823 5. Delay in MoE&F clearance - 400 6. Delay in clearance/ Investment decision /
Funds tie up constraints/delay in financial closure
1,500 1,400
7. Delay in Preparation of DPR & sign up of MOU between HP&SJVNL
- 400
8. ESCROW cover (Private Sector) 500 - 9. R&R issues - 400 10. Court Cases - 675 11. Law & Order problem 500 Total 7,458* 5,058*
* This does not include 3009 MW projects dropped from 10th Plan It is pertinent to point out that a number of projects of 10th plan ordered on BHEL were delayed due to delayed and non-sequential supply of equipment and materials and inadequate manpower in commissioning teams. Some of the projects expected to be commissioned during the last quarter of 2006-07 are also running behind schedule due to the above reasons.

Demand for Power and Generation Planning Working Group on Power for 11th Plan
Page 8 of Chapter1
An analysis was carried out of the projects slipping from 10th Plan. Detail of the thermal and hydro projects which are expected to slip from the original target are given in the following Appendices: Appendix-1.5 List of projects dropped from original 10th Plan target (41,110 MW). Appendix -1.6 List of the thermal projects slipping from 10th plan target (41,110 mw) Appendix -1.7 List of the hydro projects slipping from 10th plan target (41110 mw) 1.6 DEMAND FOR POWER
1.6.1 Growth in Generation During 10th Plan The growth in generation has been 3.2%, 5.1%, 5.2% and 5.2% during 2002-03, 03-04, 04-05 and 05-06 respectively. In the year 2006-07(upto Dec-2006) a growth rate of 7.5 % has been recorded. The Compounded Annual Growth Rate(CAGR)of generation during the 10th Plan period is expected to be about 5.1%. However, higher growth could have been achieved if adequate gas would have been available for the existing and new gas based plants commissioned during 10th plan. 1.6.2 Growth in Generation During 11th Plan Assessment of generation requirement during the 11th Plan is important to work out the generation capacity requirement to be planned for the 11th Plan. Demand projections of various utilities are done by the Electric Power Survey (EPS) Committee. The last power demand projections were made by 16th EPS in 2000 and the 17th EPS Report is under finalization by the Committee. Besides the EPS, Integrated Energy Policy stipulates generation to grow at 9% p.a. during 11th Plan. Also, as per National Electricity Policy (NEP), the per capita electricity consumption is to increase to 1000 units by the year 2011-12. The Working Group has assessed the generation requirement according to the above Committee Report/ Policies. Since the requirement worked out to meet the objectives of National Electricity Policy is higher, the same has been adopted for planning purposes. Details of the above three assessments are given below:-
(i) 16th EPS Report
The energy requirement by Utilities in 2011-12 is 975 BU at the busbar. Considering about 6.5% - 7% auxiliary consumption, the gross energy requirement is about 1040 BU.
(ii) Integrated Energy Policy (IEP)
As per the Integrated Energy Policy (IEP), issued by the Planning Commission, GDP growth rates of 8%-9% have been projected during the 11th Plan. Assuming a higher growth rate of 9% and assuming the higher elasticity projected by the IEP of around 1.0, electrical energy generation would be required to grow at 9% p.a. during the 11th plan period. Also generation has to be collectively met by utilities, captive plants and Non-conventional energy sources. No reliable plans about captive power capacity expansion are available but based on indications available from the manufacturers for addition in

Demand for Power and Generation Planning Working Group on Power for 11th Plan
Page 9 of Chapter 1
captive capacity and present utilization of available capacity, the generation from captive plants is expected to increase from 78 BU to 131 BU per annum. Since the load factor of non-conventional energy sources is very low (about 20% on an average), even though the capacity projected by MNRE from these sources is about 23,500 MW by the end of 11th Plan, the expected generation would be only around 41 BU. The generation from these renewables however has not been taken into account for planning purposes. Based on these assumptions following scenario emerges:
(i) Likely energy Generation by utilities in 2006-07 663 BU(ii) Likely Energy Generation by captive plants in 2006-07 78 BU(iii) Total Likely Generation in 2006-07 741 BU(iv) Compounded Annual Growth Rate 9%(v) Required Energy Generation by 2011-12 @ 9% growth rate
over 741 BU 1140 BU
(vi) Less Estimated Energy Generation by captive plants in 2011-12 131 BU(vii) Total Estimated Generation Requirement from Utilities by 2011-
12 1008 BU
(iii) National Electricity Policy (NEP)
(i) Likely Population by 2011-12 (Census 2001) 121 Crores(ii) Generation Required if Per Capita Consumption is to be
1000 kwh/yr 1210 BU
(iii) Likely Generation from Captive Plants in 2011-12 131 BU(iv) Likely Generation from Renewable Plants in 2011-12 41 BU(v) Requirement of Generation from Utilities (ii-iii-iv) 1038 BU
Requirement of Generation from Utilities by 2011-12 from various methods has been summarized as below:-
16th EPS Report About 1040 BUIntegrated Energy Policy Report 1008 BUNational Electricity Policy 1038 BU
The requirement of generation as per 16th EPS & National Electricity Policy(NEP) are more or less same and greater than the requirement as per Integrated Energy Policy. Since the NEP is the guiding document for the power sector, requirement of generation (from utilities) for planning purpose adopted is 1038 BU. This would require a generation growth rate of 9.5 % p.a. (CAGR) for utilities. The 16th EPS report stipulates peak demand of 1,57,000 MW by 2011-12 and 1,51,000 MW considering interregional diversity. This has been considered while assessing the 11th Plan capacity addition. 1.6.3 Growth in generation During 12th Plan During the 12th Plan period, assuming a GDP growth rate of 9% per annum and elasticity 0.8 as compared to 1.0 during 11th Plan mainly due to adoption of energy efficient technologies & other Energy Conservation and Demand Side Management measures being taken up during 11th Plan, electricity demand is likely to grow @ 7.2% p.a. Keeping

Demand for Power and Generation Planning Working Group on Power for 11th Plan
Page 10 of Chapter1
this in view, the energy generation should increase to a level of 1470 BU by 2016-17 from a level of 1038 BU in 2011-12. However sensitivity analysis have been carried out assuming 8,9 & 10 % GDP growth rates & GDP-electricity elasticity of 0.9 & 0.8 respectively and the same is given in table below:
Table 1.10
Generation Requirement for 2016-17
( As Per 8,9,10 % GDP Growth)
GDP Growth
GDP/ Electricity Elasticity
Electricity Generation Required
(BU) 0.8 1415 8 % 0.9 1470 0.8 1470 9 % 0.9 1532 0.8 1525 10 % 0.9 1597
1.7 APPROACH TO SELECTION OF PROJECTS FOR 11TH PLAN: An analysis of the reasons for slippages of projects from the 10th Plan target has been carried out above. In order to avoid such slippages while planning for capacity addition during 11th Plan, efforts have been made to set 11th Plan targets realistically. The approach adopted for selection of Hydro, Thermal and Nuclear projects have been as follows:-
1.7.1 Hydro India is duly concerned about climate change and efforts are on to promote benign sources of energy. Hydro Power is one such source and is to be accorded priority also from the consideration of energy security. Irrespective of size and nature of hydro projects, whether ROR or Storage projects, these are all renewable technologies. However, execution of hydro projects requires thorough Survey and Investigation, preparation of DPR, development of infrastructure, EIA and other preparatory works, which are time consuming and require two to three years for their preparation. It would take about 5 years to execute a hydro project after the work is awarded for construction. Thus in order to achieve completion of a hydro project during 11th plan, the project should either be already under construction or execution should start at the beginning of the plan. The broad criteria adopted for selection of hydro projects for 11th plan are as under:
• Those hydro projects whose concurrence has been issued by CEA and order for
main civil works is likely to be placed by March 2007. • Apart from the above, a few hydro projects of smaller capacity which are ROR type
having surface power houses and where gestation period is expected to be less

Demand for Power and Generation Planning Working Group on Power for 11th Plan
Page 11 of Chapter 1
than 5 years have also been included. These projects would need to be rigorously followed up for completion during the 11th Plan.
Keeping in view the preparedness of various hydro projects, a capacity addition of 15, 585 MW is envisaged for 11th Plan. 1.7.2 Nuclear
Nuclear is environmentally benign source of energy and over a period of time, its proportion in total capacity should increase. Keeping in view the availability of fuel, a moderate capacity addition of 3,160 MW nuclear plants has been programmed during the 11th Plan by the Nuclear Power Corporation. All projects are presently under construction. However, in view of the recent developments in the Nuclear Sector, capacity addition in nuclear plants during 12th Plan is expected to be much higher.
1.7.3 Thermal Gas
Although gas is relatively a clean fuel, at present there is uncertainty about the availability, period of availability and price of gas. Only 2,114 MW gas based capacity has been planned for 11th Plan where gas supply has already been tied up. This does not include NTPC’s gas based projects at Kawas and Gandhar, totalling to 2,600 MW, for which NTPC says that it has the gas supply contract but the matter is sub-judice. However more gas based projects could be taken up for construction as and when there is more clarity about availability and price of gas.
Coal & Lignite based Thermal plants
Coal is expected to be main stay of power generation in the years to come. The following criteria have been adopted for identifying the coal and lignite based projects for inclusion in the 11th plan. • Such projects as have already been taken up for execution in the 10th Plan period
itself and are due for commissioning in the 11th Plan period. • Those thermal projects whose LOA has already been placed by the State and
Central Public Sector Corporations, other inputs also being in place. • Those thermal projects whose LOA has already been placed and the financial
closure achieved by private developers. • Those thermal projects whose LOA is expected to be placed by 30th Sept, 2008 and
commissioning is expected during the 11th Plan keeping in view the normal gestation period, the size of the plant & the type(green field/expansion).
After discussion with the various State Government and Central Generating Companies, thermal projects with total capacity of 46,635 MW of coal based and 1375 MW lignite based capacity have been identified for capacity addition during 11th plan.
Demand for Power and Generation Planning Working Group on Power for 11th Plan
Page 12 of Chapter1
1.8 GENERATION PLANNING NORMS
The Indian Power Sector comprises of units of different type of power plants i.e. hydro, coal, lignite, gas based, DG Sets and nuclear power plants. The unit size of coal based plants has also been steadily increasing over the years from 30 to 50 to 67.5 MW during the 70’s to 500 MW at present. During the 11th & 12th Plan periods supercritical units of 660 MW and 800 MW have also been planned. In respect of nuclear plants, 200-220 MW unit size plants are in operation and 540 MWe reactors have recently been put in operation during the 10th Plan. 1000 MW units are also under construction by the Nuclear Power Corporation. In this Chapter Planning Norms have been evolved for different type of plants with varying unit sizes. 1.8.1 Objective of evolving Norms In the Planning exercise, generation norms are used as representative performance parameters of various types of generation sources to estimate the availability of peaking power and energy from each generating unit. These norms are then used to assess the availability of energy from each source of generation and thus assess generation capacity addition required to meet the stipulated demand. The planning studies require accurate performance parameters of various type of generating units to assess their availability and energy generation capabilities. Availability and generation capacity are important parameters for meeting the projected demand in the country and also in various regions. Availability and PLF are key performance factors required for the planning studies. Other features used for planning studies are the Auxiliary Power Consumption and Heat Rate of the generating units, etc. Different types of generating units have varied operational performance and accordingly different norms have been used for thermal (coal), gas, hydro and Nuclear projects to make a fare assessment of the generation capacity requirement. The impact of size, age and design of plant has been considered while arriving at the norms. The actual operating data for past 5 years has been collected for all individual units operating in the country and their average performance worked out. The norms have been arrived at only after very detailed exercise and analysis of a large data on performance of various units. 1.8.2 Parameters covered by Norms Norms for thermal, hydro and nuclear stations have been evolved as all India average figures. The parameters covered under Norms are as follows:
(a) Availability (b) Auxiliary Power Consumption (c) Unit Heat Rate (d) Plant Load Factor
(a) Availability
The Availability (gross) of the various types of generating units is given in Table 1.11

Demand for Power and Generation Planning Working Group on Power for 11th Plan
Page 13 of Chapter 1
Table 1.11 Availability
Availability (%) Unit Size Existing Units Future Units
Thermal (Coal/ lignite)
800/660 MW - 85
500/250/210/200 MW 85 85 Below 200 MW 75 85 Below 200 MW operating
below 20 % PLF at present
50 -
Gas Based OCGT all sizes 90 90 CCGT all sizes 88 88 DG Sets All sizes 75 75 Nuclear All sizes 85 85 Hydro All sizes 87.5 87.5
(b) Auxiliary Power Consumption (APC) After deliberations, it was concluded that the auxiliary power consumption for 800 MW and 660 MW supercritical units is expected to be in the same range as for other coal based units of 200 MW class and above. These would be different for units adopting turbine driven feed pump, motor driven feed pump and for units with or without cooling towers. The values indicated in the Table 1.12 for coal based units are for units with Turbine driven Boiler Feed Pumps (BFPs) and using cooling tower for Cooling Water system. Values will be lower by 0.5% for units without cooling tower. However, values will be higher by 1.5% for units with Motor driven BFPsThe auxiliary consumption of the various types of generating units considered is given in Table 1.12
Table 1.12
Auxilliary Power Consumption
Type Unit size A.P.C (%) 800/660 MW supercritical 7.5% Coal-based power
stations: 500/ 200/210/250 MW 7.5% Less than 200 MW 12% Gas-based power stations
Combined Cycle GT Stations
3%
Open Cycle GT Stations 1% Hydro Stations 0.5%
c) Unit Heat Rate The Unit heat rates (Gross) used for planning studies for thermal units of various capacities as arrived at by the past average data are given in Table 1.13

Demand for Power and Generation Planning Working Group on Power for 11th Plan
Page 14 of Chapter1
Table 1.13 Unit Heat Rates
Unit Size (MW) Heat Rate kcal/kwh
Coal based plants 800(247 kg/cm2, 565C /592 C)
2325
800(247 kg/cm2,535 C/565 C)
2400
660 2400 500 2425 200/210/250 (KWU) 2460 200/210 (LMZ) 2500 100 MW class 2750 50 MW class 3000 30 MW class 3300 Lignite 200 MW class 2750 Gas Turbine Units Combined Cycle 2000 Open Cycle 2900
(d) Plant Load Factor The Plant Load Factor (PLF) to be adopted for thermal units of various capacities are furnished in Table 1.14
Table 1.14 Plant Load Factor
Type Units PLF (%) Remarks
800/660 MW 80 Future Units 500/250/210/200 MW 80 Existing and Future UnitsCoal Based Below 100/110 MW 60 80% for future units
40 Units in ER and NER operating Below 20% PLF.
Lignite Based 125/ 200/250 MW 75
CCGT 80 Gas Based OCGT 33
Nuclear Units All units 68.5 Normative capacity factor
For hydro units it was agreed that the energy generation shall be taken as the designed energy generation in a 90 % dependable year.

Demand for Power and Generation Planning Working Group on Power for 11th Plan
Page 15 of Chapter 1
1.9 GENERATION EXPANSION PLANNING 1.9.1 Eleventh Plan Programme (2007-2012) To meet the energy requirement of 1038 BU and a peak load of 1, 51,648 MW with diversity & 5% spinning reserve, a capacity addition of about 72,000 MW is required. However, based on the preparedness of the projects, it was envisaged that a capacity of about 68,869 MW is feasible for addition during 11th plan period. These projects have been categorized as Projects under construction and Committed Projects and summarized in Table 1. 15 . Details are given at Appendix -1.8
Table 1.15
THERMAL BREAKUP SECTOR HYDRO TOTAL
THERMALCOAL LIGNITE GAS/
LNG
NUCLEAR TOTAL
Projects Under Construction 11,931 16,254 14,115 1,125 1,014 3,160 31,345
Committed Projects 3,654 33,870 32,520 250 1,100 - 37,524
Total 15,585 50,124 46,635 1,375 2,114 3,160 68,869
(The above does not include Merchant Power Plants which may additionally come during 11th plan period.) * Note: Out of the projects totalling to 37,524 MW under committed category as given above, orders for Dadri Unit-6 (490 MW) & Mezia Ph-II (1000 MW) has been recently placed.
The sector wise break-up of feasible capacity addition during 11th plan is given in Table 1.16.
Table 1.16
THERMAL BREAKUP SECTOR HYDRO TOTAL THERMAL
COAL LIGNITE GAS/LNG
NUCLEAR TOTAL (%)
CENTRAL 9,685 23,810 22,060 1,000 750 3,160 36,655 (53.2%)
STATE 2,637 20,352 19,365 375 612 - 22,989 (33.4%)
PRIVATE 3,263 5,962 5,210 0 752 - 9,225 (13.4%)
ALL-INDIA 15,585 50,124 46,635 1,375 2,114 3,160 68,869 (100%)
In addition to above, thermal projects totalling to 11,545 MW have been identified as best effort projects. These projects would normally be commissioned in the beginning of 12th Plan but in case of any constraints in taking up of any of the projects included in 11th plan, some of these projects would be tried for commissioning during 11th Plan itself.

Demand for Power and Generation Planning Working Group on Power for 11th Plan
Page 16 of Chapter1
A capacity of 13,500 MW has been planned under renewable as per information obtained from MNRE. It can be seen from the above profile of capacity addition plan that central sector will play a lead role with capacity addition of more than half of the capacity addition target. There has been a good response from states on the need for capacity addition to meet their growing demand and the states with IPPs, have been earmarked the balance capacity for execution.. The State owned capacity projected for the 11th Plan is 33.4 % of the total plan as compared to 27% likely during 10th Plan. The thermal capacity addition comprises 1 unit of 800 MW, 11 units of 660 MW, 53 units of 500 MW class, 49 units of 210/250/300 MW class, 7 units of 110/125 MW class. 1.9.2 Projects under Construction: Projects totalling to 31,345 MW are already under construction for likely benefits during 11th plan. The type wise, sector wise details are given in Table 1.17
Table 1.17 Projects under Construction as on 01.01 2007
THERMAL BREAKUP SECTOR HYDRO TOTAL
THERMAL COAL LIGNITE GAS/LNG NUCLEAR TOTAL
CENTRAL 7,633 7,200 6,450 750 0 3,160 17,993 STATE 2,107 5,852 5,215 375 262 - 7,959 PRIVATE 2,191 3,202 2,450 0 752 - 5,393 ALL-INDIA 11,931 16,254 14,115 1,125 1,014 3,160 31,345
The details are given in Appendix-1.8 1.9.3 Committed Projects: In addition to projects under construction, a number of projects are under various stages of development for which necessary inputs are being arranged by the implementing agencies. Various clearances required for setting up these projects are being obtained which include environment and forest clearance, cooling water availability, land acquisition, DPR preparation, concurrence of CEA/ State Government (wherever required), financial tie ups/ CCEA clearance from government, fuel linkages etc. Important milestones towards obtaining these clearances are being closely monitored and therefore there is reasonable certainty of these projects materializing during 11th plan. There is commitment from the Power Companies/ states to implement the projects during 11th Plan. Based on present status, it emerges that a total capacity of 37,524 MW could be considered as committed capacity for benefits during 11th plan comprising of 3,654 MW hydro and 33,870 MW thermal. The details are given in Table 1.18

Demand for Power and Generation Planning Working Group on Power for 11th Plan
Page 17 of Chapter 1
Table 1.18 Committed Capacity
(Orders yet to be placed)
THERMAL BREAKUP SECTOR HYDRO TOTAL
THERMAL COAL LIGNITE GAS/LNG
NUCLEAR TOTAL
CENTRAL 2,052 16,610 15,610 250 750 0 18,662 STATE 530 14,500 14,150 0 350 - 15,030 PRIVATE 1,072 2,760 2,760 0 0 - 3,832
ALL-INDIA 3,654 33,870 32,520 250 1,100 0 37,524 ** Order for 1490 MW namely Mezia Ph-II (1000 MW) & Dadri U-6 (490 MW) have recently been placed. The details are given in Appendix-1.8 All the hydro projects included under Committed category have been accorded concurrence by CEA/State Government except four number projects totalling to 485 MW viz. Vyasi, 120 MW in Uttaranchal (HRT fully excavated, Power House and Dam area partially excavated), UBDC III, 75 MW in Punjab (DPR prepared earlier being revised, alloted to Malana Power Company on BOO basis, Tendring in Process), Lower Jurala, 240 MW in Andhra Pradesh (Tendering in process, commissioning period around 4 years, DPR ready) and Tangu Romai HEP, 50 MW in Himachal Pradesh. Taking into account the uncertainty in the availability of Gas and prevailing high price of petroleum products, the thermal capacity addition is predominantly coal based. If gas becomes available at reasonable price more gas based projects may materialize during later half of 11th plan. 1.9.4 Projects with Additional Efforts: In addition to 68,869 MW capacity addition feasible during 11th plan, a capacity of 11,545 MW Thermal can come up during 11th plan with additional efforts. The details are given in Table 1.19. These projects also form part of shelf of 12th plan projects.
Table1.19
Thermal Projects with Additional Efforts
THERMAL BREAKUP SECTOR TOTAL
THERMAL COAL LIGNITE GAS/LNG
NUCLEAR TOTAL
CENTRAL 4,190 4,190 0 0 0 4,190 STATE 3,300 2,300 1,000 0 - 3,300 PRIVATE 4,055 4,055 0 0 - 4,055
ALL-INDIA 11,545 10,545 1,000 0 0 11,545

Demand for Power and Generation Planning Working Group on Power for 11th Plan
Page 18 of Chapter1
1.9.5 Decentralised Distributed Generation (DDG) In some of the areas, it is not possible to extend the grid connected supply of electricity for meeting the demand of such remote areas, it is proposed to set up some power plants based on local energy sources available which may be small hydro, non-conventional sources such as Bio-Mass, Wind, etc and DG sets wherein other sources are not available. During the XI plan period, it is proposed to add about 5,000 MW of capacity under DDG. 1.9.6 Fuel Requirement Fuel Requirement during terminal year of 11th Plan (2011-12), considering 68,869 MW capacity addition during 11th plan and normative PLFs is summarized in Table 1.20. This is based on a thermal capacity addition of 20,387MW and 50,124MW during the 10th and 11th Plan respectively. Details regarding coal requirement calculation are given in Appendix-1.9 The actual gas supplied to power sector at present is of the order of 40 MMSCMD as against requirement of 61 MMSCMD during current year (2006-07). The requirement of Gas at 90% PLF would worke out to about 89 MMSCMD.
Table 1.20
Fuel Requirement Estimated during 2011-12
Fuel Requirement (2011-12) Domestic Coal* 545 MT
Lignite 33 MT
Gas/LNG ** 89 MMSCMD
* The total coal availability from domestic sources is expected to be 482 MT per annum by 2011-12. Accordingly, imported coal of the order of 40MT, equivalent to 63 MT of Indian coal, may have to be organised. This quantity may reduce provided production of domestic coal is increased. ** 89 MMSCMD of gas requirement at 90% PLF has been projected in 2011-12. At present, the availability of gas is of the order of 40 MMSCMD and therefore not sufficient to meet the requirement of even existing plants.
1.9.7 Thermal Projects The capacity of thermal power projects totalling to 50,124 MW (projects under construction and committed) in terms of their location i.e. pithead, load centre and coastal and also in terms of unit sizes regionwise is given in Table 1.21 and 1.22.

Demand for Power and Generation Planning Working Group on Power for 11th Plan
Page 19 of Chapter 1
Table 1.21 Details of Thermal Power Projects-By Type
PIT HEAD * COAL
LOAD CENTRE
COAL
COASTAL COAL
TOTAL COAL
LIGNITE GAS /LNG
TOTAL
NORTHERN 2,500 9,105 11,605 625 110 12,340 WESTERN 6,430 6,620 500 13,550 250 1,102 14,902 SOUTHERN 500 3,850 3,800 8,150 500 92 8,742 EASTERN 10,870 1,710 12,580 12,580 NORTH EASTERN 750 750 810 1,560 ALL-INDIA 20,300 22,035 4,300 46,635 1,375 2,114 50,124
* Pit Head stations are those plants having their own dedicated coal transportation system (MGR/Rope way) and are not dependent upon Railways for coal movement.
Table 1.22
Details of Thermal Power Projects-By Unit Size
800/660 MW UNITS
500 MW UNITS
210/250 300 MW UNITS
110/125 MW UNITS
TOTAL GAS/LNG MODULE
TOTAL
NORTHERN 16 14 5 35 1 36 WESTERN 4 13 17 2 36 3 39 SOUTHERN 1 13 5 19 1 20 EASTERN 7 11 10 28 28 NORTH EASTERN 3 3 4 7 ALL-INDIA (NOS.) 12 53 49 7 121 9 130 ALL-INDIA (MW) 8060 26460 12615 875 48010 2114 50124
1.9.8 Status of Fuel Linkage Coal Out of the total likely coal based capacity addition of 46,635 MW,
32,455 MW have been allocated linkage; 5,830 MW have been allocated captive coal blocks ; 4,500 MW linkages are yet to be allocated and 2,500 MW Coal Blocks to be
allocated 1350 MW are likely to be on imported coal for which formal fuel supply
arrangements are yet to be made. 20,300 MW capacity is pithead based ;

Demand for Power and Generation Planning Working Group on Power for 11th Plan
Page 20 of Chapter1
22,035 MW is load centre based and 4,300 MW coastal power plants.
In the present day scenario, the transmission of electricity from pithead power plants to load centre works out to be a cheaper option compared to load centre power plant for a distance of 300 kms onwards at current price level of coal and railway transportation tariffs. However, following considerations warrant setting up of load centre thermal power plants as well.
System stability/Security Security of state grid and emergency supplies to various critical systems in the
state e.g. Railway, Hospital, Airports etc. To take care of emergencies in case of transmission systems failure Dispersion of environmental degradation Problems of right-of-way in case of construction of new transmission lines
Consequently, in the 11th Plan about 42 % coal based capacity is likely to be set up at load centres. 1.9.9 Gas Scenario: Due to uncertainty in availability of gas and its high price only about 2,114 MW gas based projects have been included for benefits during 11th Plan. These projects have already tied up the gas supply. At present domestic production of natural gas is around 32-33 BCM. On rough indications in 2007-08, the target of natural gas production by public sector companies of ONGC and OIL limited will be 25.23 BCM which might increase to 26.12 BCM in 2011-12. The likely natural gas production in private sector and through joint ventures is estimated at around 8.60 BCM in 2007-08 which might increase to 23 BCM in 2011-12, if the newly discovered fields get into commercial production on schedule. Therefore, in the terminal year of the 11th Plan in the Base-Case Scenario in the indigenous production of gas would be of the order of 49 BCM per annum. The India Hydro Carbon forum 2025 estimated that by 2011-12 demand for gas would be 313 MMSCMD (equivalent to 114 BCM p.a). Therefore, it is reasonable to expect that sizeable quantity of Natural Gas would need to be imported to meet the demand in future, either as LNG or through Trans-national pipelines. Going by the progress of present negotiations with the natural gas suppliers (Qatar, Iran, Australia), it is expected that about 54 MMSCMD of natural gas (about 19 BCM p.a.) could become available by 2011-12. However, the investment plans for improvement of LNG infrastructure in future include: Dahej : 7.5 MMTPA Dabhol : 5.0 MMPTA Cochin : 2.5 MMPTA Hajira : 2.5 MMPTA and additional 2.5 MMPTA capacity each for Dahej, Cochin and Hazira.

Demand for Power and Generation Planning Working Group on Power for 11th Plan
Page 21 of Chapter 1
Pricing of Gas 1) Gas Pricing in the APM: Due to dominance of National Oil Companies, namely,
ONGC and OIL, the pricing in India has been administered on cost plus basis. The gas price payable to ONGC and OIL for its nomination fields is much below the market price. There will be no further gas available under APM mechanism.
2) Pre NELP Contract: The prices were negotiated between sellers and buyers and
generally linked to fuel oil prices. 3) Gas Pricing in NELP: Contractors including ONGC and Oil have the freedom to sell
the gas at market rated prices. Government approval is required in the gas prices formally to be used for evaluation of gas for calculating the various non tax dues to the Government.
4) Pricing of LNG: Pricing of LNG is done at market rates. In future also, the same
principle will be made applicable. 5) Status of development of gas discoveries: The normal process after a discovery
decision on commerciability and submission and approval of development plan of the commercial discovery. The commercialization of discovery is monitored by DGH (Director General, Hydrocarbons) and Ministry of Petroleum and Natural Gas with respect to time frame stipulated in respective PSCs (Production Sharing Contracts).
(i) Reliance (RIL) Fields: The initial development plan of Dhirubhai 1 and 3
discoveries has been approved by the management committee. The DGH approved original gas in place (OGIP) at 5.5 TCF. The envisaged rate of production is 40 MMSCMD for a 10 year period. The date of availability of indigenous gas has been indicated as June, 2008 and no delay has been reported by DGH based on current work progress.
(ii) Gujarat State Petroleum Corporation (GSPC) field: The block is located in
Krishna Godavari shallow water offshore. The contractor is yet to submit the appraisal programme for the discovery. No reserve or production can be realistically estimated until the completion of appraisal of discovery.
(iii) ONGC:ONGC is currently developing G1 and G15 discoveries in Central Gujarat
basin. The production of gas is expected in March, 2007 and the estimated gas production from the above two fields is about 2.1 MMSCMD for the period of 7 years.
1.9.10 Hydro Projects: Out of the total hydro capacity of 15,585 MW included in the 11th Plan,
11,931 MW are under construction. 3,169 MW have been accorded concurrence by CEA/State Government and
are awaiting investment decision/work award. 485 MW the DPR is ready and concurrence of CEA/State Government is
awaited.

Demand for Power and Generation Planning Working Group on Power for 11th Plan
Page 22 of Chapter1
The details of hydro projects in terms of storage/run-of-river (ROR)/pumped storage (PSS) is given in Table 1.23.
Table 1.23
Details of Hydro Power Projects
ROR STORAGE PSS TOTAL NORTHERN 6,145 1,320 1,000 8,465 WESTERN 520 400 0 920 SOUTHERN 653 525 0 1,178 EASTERN 1,623 0 675 2,298 NORTH EASTERN 40 2,684 0 2,724 ALL-INDIA 8,981 4,929 1,675 15,585
1.10 TWELFTH PLAN PERSPECTIVE (2012-2017) The requirement of installed capacity and capacity addition to meet the generation requirement during the 12th Plan period as discussed in Para 1.6.3 of this Report are given in Table below:
Table 1.24
Capacity addition required during 12th plan (2012-17)
GDP Growth
GDP /Electricity Elasticity
Electricity Generation
Required (BU)
Peak Demand
(MW)
Installed Capacity
(MW)
Capacity Addition Required
During 12th PLAN (MW)
0.8 1,415 2,15,700 2,80,300 70,800 8 % 0.9 1,470 2,24,600 2,917,00 82,200 0.8 1,470 2,24,600 2,917,00 82,200 9 % 0.9 1,532 2,33,300 3,03,800 94,300 0.8 1,525 2,32,300 3,02,300 92,800 10 % 0.9 1,597 2,44,000 3,17,000 1,07,500
It would be seen from the above table that under various growth scenarios, the capacity addition required during 12th plan would be in the range of 70,000 - 1,07,500 MW, based on normative parameters. The Working Group recommends a capacity addition of 82,200 MW for the 12th Plan based on Scenario of 9% GDP growth rate and an elasticity of 0.8%. This is very close to the projection of draft 17th EPS report based on requirement of about 86,000 MW during 12th Plan. During 12th plan about 30,000 MW capacity addition is likely to be based on hydro and about 11,000-13,000 MW will be nuclear based. The balance capacity addition of about

Demand for Power and Generation Planning Working Group on Power for 11th Plan
Page 23 of Chapter 1
50,000 MW will be from thermal projects. Shelf of projects identified for likely benefits during 12th plan is given at Appendix 1.10. The projects indicated in Appendix 1.8 as projects with best efforts will also form part of 12th plan shelf of projects. Shelf of projects for likely benefits during 12th plan is summarized in Table 1.25.
Table 1.25 Shelf of Projects for 12th Plan
TYPE MW Capacity likely in 11th
plan with best efforts (MW)
Hydro 40,658 0 Thermal 1,14,018 11,545
Coal 94,185 10,545 Lignite 4,250 1,000
Gas/LNG 15,583 - Nuclear 12,800 - Total 1,67,476 11,545
The Working Group recommends the following for 11th and 12th plan capacity additions. 1.11 MEDIUM TERM PLAN: 11TH PLAN (2007-12) It has been estimated that depending upon the preparedness of various projects about 68,869 MW capacity addition is feasible during 11th plan (15,585 MW hydro, 50,124 MW thermal and 3,160 MW nuclear). This comprises 46,635 MW coal based plants, 2,114 MW gas/LNG based plants and 1,375 MW lignite based plants. In addition renewable energy sources (MNRE has projected a grid connected renewable capacity addition of 13,500 MW during 11th plan) would also contribute towards augmenting the power generation. Demand side management and energy efficiency measures would also help in this direction. Efforts shall also be made to realize benefits from 12th plan projects which can be brought with additional efforts during 11th plan (Projects indicated as Best Efforts in Appendix 1.8). Efforts are also underway to tap surplus power from new captive power plants of about 12000 MW into the grid. A 5% spinning reserve would give a comfortable margin since normally during an emergency situation, capacity equivalent to the highest size unit and the next highest size unit in the system would suffice as reserve. Total coal requirement during 2011-12 would be about 545 million tones per annum. 1.12 LONG TERM PLAN: 12TH PLAN (2012-17) Under various growth scenarios, the capacity addition required during 12th plan would be in the range of 71,000 - 1,07,500 MW, based on normative parameters. The Working Group recommends a capacity addition of 82,200 MW for the 12th Plan based on Scenario of 9% GDP growth rate and an elasticity of 0.8%. During 12th plan about 30,000 MW capacity addition is likely to be based on hydro and about 11,000-13,000 MW will be nuclear based. The balance capacity addition of about

Demand for Power and Generation Planning Working Group on Power for 11th Plan
Page 24 of Chapter1
50,000 MW will be from thermal projects. A shelf of projects totalling over 1,50,000 MW has been identified and given in Appendix 1.10 All necessary inputs for projects need to be tied up well in advance, which may pose very big challenge for power sector as a whole. 1.13 NEW INITIATIVES 1.13.1 Initiatives in Thermal Power Development Efforts were made to bring in highly efficient super critical technology in the country for thermal power plants and execution of six super critical units of 660 MW capacity each was taken up during the 10th Plan period. The first unit of 660 MW based on super critical technology is likely to be commissioned during the first year of 11th Plan i.e. 2007-08. The 11th Plan feasible capacity addition of coal based plants includes 12 units based on super critical technology with a capacity of 8060 MW which is about 18% of total coal capacity planned for 11th Plan. More and more power projects based on super critical technology are under planning stage and they would yield benefit during the 12th Plan period. It is envisaged that more than 50-60% of capacity addition of thermal plants during 12th plan period would be based on super critical units. This would also help in reducing the Carbon dioxide emission from new coal fired capacity. 1.13.2 Ultra Mega Power Projects Ministry of Power in the year 2006 has launched an initiative of development of coal based ultra mega projects with a capacity of 4,000 MW each on tariff based competitive bidding. Ultra Mega Power projects are either pit head based projects having captive mine block or coastal projects based on imported coal. Sasan UMPP, a pithead plant in Chattisgarh based on domestic fuel and Mundra UMPP in Gujrat based on imported coal have already been awarded for execution to the respective developers. According to the bids submitted by these developers only one unit of 660 MW is expected to be commissioned during the XIth plan and the remaining unit during 12th Plan. Other projects where considerable progress has been made are coastal projects in Andhra Pradesh and Tamil Nadu and a pit head based project in Jharkhand. Further the projects under consideration include pit head projects in Orissa and Chatisgarh and coastal projects in Maharashtra and Karnataka. To facilitate tie-ups of inputs and clearances project specific Shell companies are set up/to be set up as wholly owned subsidiaries of the Power Finance Corporation Ltd. These companies will undertake preliminary studies and obtain necessary clearances including water, land, fuel, power selling tie-up etc. prior to award of the Project to the successful bidder. Initially five sites were identified by CEA in different states for the proposed Ultra Mega Power Projects. These include two pithead sites one each in Madhya Pradesh and Chhattisgarh and three coastal sites in Gujarat, Karnataka & Maharashtra. On the request of the State Govts of Orissa & Andhra Pradesh, two more locations have been identified for Ultra Mega Projects consisting of a pithead location in Ib-Valley coalfield in Orissa and a coastal site at Krishnapatnam in Andhra Pradesh. It is proposed to set up pithead projects

Demand for Power and Generation Planning Working Group on Power for 11th Plan
Page 25 of Chapter 1
as integrated proposals with corresponding captive coal mines. For the coastal projects imported coal shall be used. The projects are to be developed with a view to result in minimum cost of power to the consumers. Because of bigger capacity, the cost of the project would be lower due to economy of scale, these projects would be environmental friendly as supercritical technology is proposed to be adopted to reduce emissions. Further, a time bound action plan for preparation of project report, tie-up of various inputs/clearances, appointment of consultants, preparation of RFQ/RFP is being followed. Once the developer is selected, the ownership of the Shell companies shall be transferred to the successful bidder. Following six shell companies as 100% subsidiaries of Power Finance Corporation have already been formed:
a) Sasan Power Limited (Madhya Pradesh)- Pithead b) Coastal Gujarat Power Limited (Gujarat) c) Coastal Maharashtra Mega Power Limited (Maharashtra) d) Coastal Karnataka Power Limited (Karnataka) e) Akaltatra Power Limited (Chhattisgarh)-Pithead specific. f) Coastal Andhra Power Ltd.
The name of seven ultra mega power projects proposed in various states is as follows:
i) Sasan Ultra Mega Project (Madhya Pradesh) ii) Mundra Ultra Mega Project (Gujarat) iii) Akaltara Ultra Mega Project (Chhattisgarh)- iv) Tadri Ultra mega project (Karnataka) v) Girye Ultra Mega project (Maharashtra) vi) Krishnapatnam Ultra Mega Power Project (Andhra Pradesh) vii) Orissa Ultra Mega Power Project (Orissa)
The inputs of above projects are tied up by Shell companies. As soon as developers/ bidders are selected, the ownership shall be transferred to them. The likely commissioning period Ultra Mega projects is 69 months from the signing of agreement, which is expected in February, 2007. 1.13.3 High Hydro Development 50,000 MW Hydro Initiative was launched in 2003 and Preliminary Feasibility Report (PFRS) of 162 projects totalling to 48,000 MW were prepared. Out of this 77 projects with total capacity of about 37000 MW for which first year tariff is expected to be less than Rs.2.50/unit were selected for execution. Hydro projects have longer gestation period and therefore there is a need to formulate a 10 year plan for hydro projects. In 11th plan a capacity addition of over 15,500 MW has been earmarked keeping in view the present preparedness of these projects. Projects totalling to a capacity of 30,000 MW have been identified for 12th Plan on which necessary preparations have to be made from now onwards to ensure their commissioning during 12th Plan. Thus the effect of 50,000 MW initiative would be visible in 12th Plan period. Preparation of DPR and various clearances and approval etc for these projects are to be obtained during the first two years of 11th

Demand for Power and Generation Planning Working Group on Power for 11th Plan
Page 26 of Chapter1
Plan. It is recommended that CEA should closely monitor the progress of preparedness of DPR of these projects and their further execution. 1.13.4 Decentralised Distributed Generation (DDG) In some of the remote areas, it is not techno-economically feasible to extend the grid supply. For meeting the demand of such remote areas, it is proposed to set up some power plants based on local energy sources available. These are small hydro and non-conventional sources such as Bio-Mass, Wind, DG sets etc wherein other sources are not available. During the XI plan period a capacity addition of about 5,000 MW of capacity under DDG is envisaged. 1.13.5 Merchant Power Plants A merchant power plant does not have long term PPA for sale of its power and is generally developed on the balance sheet of developers. Government of India has reserved coal block with reserves of 3.2 Billion Tons of coal for allotment by Screening Committee of Ministry of coal for merchant and captive plants. About 10,000 -12000 MW capacity is expected to be developed through this initiative. This capacity has not been taken into account while working out the capacity required in the 9.5% growth in generation scenario. Capacity addition through this route would further contribute to better economic growth, better reliability of power, more spinning reserve and above all would promote creation of competition in the electricity market. 1.13.6 Coal Bed Methane The Directorate General of Hydrocarbons has estimated the country’s resource base or Coal Bed Methane (CBM) to be between 1400 BCM (1260 Mtoe) and 2500 BCM (2340 Million Tonnes Oil Equivalent). To give impetus to exploration and production, the government has formulated the CBM policy. Based on two rounds of bidding under this policy, contracts have been signed with PSUs/private companies for the exploration and production of CBM in 13 blocks. An additional three blocks have been taken up for development on the basis of nomination. The estimated investment in these blocks is about Rs.560 crore and the likely CBM resources generated is estimated as 850 BCM (765 Mt). ONGC maintains that commercial production of CBM from some of these blocks will start in 2007. Thus at the very low current rate of production, the proven gas and CBM reserves, together, can last for some 50 years. 1.13.7 Coal Gasification In-situ coal gasification can significantly increase the extractable energy from India’s vast in-place coal reserves. This is so because in-situ coal gasification can tap energy from coal reserves that cannot be extracted economically based on available open cast/underground extraction technologies. However, in-situ gasification has not yet been deployed commercially anywhere in the world. ONGC is engaged in trials to establish the feasibility and economics of this technology for Indian coal and lignite in collaboration with Russia. Neyveli Lignite Corporation has tied up with an Australian group to pursue in-situ gasification of lignite. In-situ gasification has many environmental advantages. The problems of overburden removal and ash disposal faced by conventional coal mining and use are eliminated. Gasification is the first step towards a clean coal technology since

Demand for Power and Generation Planning Working Group on Power for 11th Plan
Page 27 of Chapter 1
carbon can be captured from the syn-gas produced and sequestered in the mine or pumped back in oil or gas fields to enhance oil or gas recovery. In-situ coal gasification, with or without carbon sequestration could be eligible for carbon credits. Finally, using this process at abandoned coalmines might provide an economically attractive option for full extraction of energy from in-place reserves. Clearly, the potential for domestic energy supply based on in-situ coal gasification can be large but it has not yet been assessed. 1.14 CAPTIVE POWER PLANTS
Large number of captive plants including co-generation power plants of varied type and sizes exist in the country which are either utilized in process industry or used for in-house power consumption. A number of industries have set up their own captive plants so as to get reliable and quality power. Some Captive plants are also installed as stand-by units for operation only during emergencies when the grid supply is not available. The installed capacity of CPPs has increased from 588 MW in 1950 to 19,103 MW in March 2005. Captive plants including co-generation power plants could, therefore, play a supplementary role in meeting the country’s power demand. After the enactment of Electricity Act 2003, there is a renewed interest in captive generation. Surplus power, if any, from captive power plants could be fed into the grid as the new act (Electricity Act 2003) provides for open access, in non-discriminatory way. It is envisaged that the generation from non utility captive power plants by the year 2011-12 may be of the order of 131 billion units which results into a CAGR of 10.5% p.a in captive generation. 1.14.1 Provisions of Electricity Act and National Electricity Policy Electricity Act, 2003 defines “Captive Generating Plant” as a power plant set up by any person to generate electricity primarily for his own use and includes a power plant set up by any co-operative society or association of persons for generating electricity primarily for use of members of such co-operative society or association. The captive power plant can be set up as stipulated under Section 9 of the Act. Provision of which are as below:
(1) Notwithstanding anything contained in this Act, a person may construct, maintain or operate a captive generating plant and dedicated transmission lines:
Provided that the supply of electricity from the captive generating plant through the grid shall be regulated in the same manner as the generating station of a generating company.
(2) Every person, who has constructed a captive generating plant and maintains and operates such plant, shall have the right to open access for the purposes of carrying electricity from his captive generating plant to the destination of his use:
Provided that such open access shall be subject to availability of adequate transmission facility and such availability of transmission facility shall be determined by the Central Transmission Utility or the State Transmission Utility, as the case may be:

Demand for Power and Generation Planning Working Group on Power for 11th Plan
Page 28 of Chapter1
Provided further that any dispute regarding the availability of transmission facility shall be adjudicated upon by the Appropriate Commission. The Electricity Rules issued by MoP notification dated 8.6.2005 prescribes that No power plant shall qualify as a 'captive generating plant' under Section 9 read with clause (8) of section 2 of the Act unless: a. In case of power plant –
(i) not less than twenty six percent of the ownership is held by the captive user(s), and
(ii) not less than fifty one percent of the aggregate electricity generated in such
plant, determined on an annual basis, is consumed for the captive use:
Provided that in case of power plant set up by registered cooperative society, the conditions mentioned under paragraphs at (i) and (ii) above shall be satisfied collectively by the members of the co-operative society; Provided further that in case of association of persons, the captive user(s) shall hold not less than twenty six percent of the ownership of the plant in aggregate and such captive user(s) shall consume not less than fifty one percent of the electricity generated, determined on annual basis, in proportion to their shares in ownership of the power plant within a variation not exceeding ten percent;
b. In case of a generating station owned by a company formed as special purpose vehicle for such generating station, a unit or units of such generating station identified for captive use and not the entire generating station satisfy(s) the conditions contained in paragraphs (i) and (ii) of sub-clause (a) above including -
Explanation:-
1. The electricity required to be consumed by captive users shall be determined with reference to such generating unit or units in aggregate identified for captive use and not with reference to generating station as a whole; and
2. The equity shares to be held by the captive user(s) in the generating station shall not be less than twenty six per cent of the proportionate of the equity of the company related to the generating unit or units identified as the captive generating plant.
3. It shall be the obligation of the captive users to ensure that the consumption by the captive users at the percentages mentioned in sub-clauses (a) and (b) of sub-rule (1) above is maintained and in case the minimum percentage of captive use is not complied with in any year, the entire electricity generated shall be treated as if it is a supply of electricity by a generating company.
On the captive power generation the National Electricity Policy stipulates as under:-
Para 5.2.24: The liberal provision in the Electricity Act, 2003 with respect to setting up of captive power plant has been made with a view to not only securing reliable, quality and cost effective power but also to facilitate creation of employment opportunities through speedy and efficient growth of industry.

Demand for Power and Generation Planning Working Group on Power for 11th Plan
Page 29 of Chapter 1
Para 5.2.25: The provision relating to captive power plants to be set up by group of consumers is primarily aimed at enabling small and medium industries or other consumers that may not individually be in a position to set up plant of optimal size in a cost effective manner. It needs to be noted that efficient expansion of small and medium industries across the country would lead to creation of enormous employment opportunities. Para 5.2.26: A large number of captive and standby generating stations in India have surplus capacity that could be supplied to the grid continuously or during certain time periods. These plants offer a sizeable and potentially competitive capacity that could be harnessed for meeting demand for power. Under the Act, captive generators have access to licensees and would get access to consumers who are, allowed open access. Grid inter-connections for captive generators shall be facilitated as per section 30 of the Act. This should be done on priority basis to enable captive generation to become available as distributed generation along the grid. Towards this end, non-conventional energy sources including co-generation could also play a role. Appropriate commercial arrangements would need to be instituted between licensees and the captive generators for harnessing of spare capacity energy from captive power plants. The appropriate Regulatory Commission shall exercise regulatory oversight on such commercial arrangements between captive generators and licensees and determine tariffs when a licensee is the off-taker of power from captive plant.
1.14.2 Captive Generation At present, the Installed Capacity of Captive Power Plants (1MW and above) is about 19,000 MW. The energy generation from captive power plants (1MW and above) during the year 2004-05 has been about 72 billion units. The growth of captive plant capacity during the period 2001-02 to 2004-05 and the growth of energy generation from captive plants during this period has been 3.67% and 5.01% respectively. During the year 2004-05 surplus power of 4.2 BU from captive was fed into the grid. Further, a capacity addition of about 12,000 MW from Captive plants is expected during the 11th Plan based on information/details received from captive power plant manufacturers and about 20% of 12,000 MW is expected to be surplus and available to be fed into the grid. However, to harness surplus capacity from captive power plants it is essential that various bottlenecks being faced are addressed and technical and commercial issues are resolved to make the export arrangements attractive and commercially viable. It is envisaged that the generation from non utility captive power plants by the year 2011-12 may be of the order of 131 billion units which results into a CAGR of 10.5% p.a. 1.14.3 Discussions with Forum of Regulator (FOR) The issue of various charges levied by SERCs was taken up by Ministry of Power with Forum of regulators (FOR). During the meeting of FOR, it was decided to constitute a Sub-group consisting of CERC, State Regulators of Gujarat, Karnataka, Chhattisgarh, Andhra Pradesh, Delhi, Orissa, Rajasthan, Haryana, MoP and CEA. A meeting of the Sub-group was held on 16th-17th November, 2005 and these issues were discussed and various measures were recommended for facilitating open access in distribution and harnessing

Demand for Power and Generation Planning Working Group on Power for 11th Plan
Page 30 of Chapter1
surplus captive generation in the country. Major recommendations of the Sub-group are as under:
Reasonable cross subsidy surcharge and other charges to provide some economic incentive to the consumers to avail open access.
The procedure for grant of open access should be simple enough to encourage the consumer to exercise his choice.
All future Captive generation capacity need not be fully locked in long term PPAs. 15-20% of the future capacity could be kept out of long term PPAs so that it is available to open access consumers or in the market.
The SERCs should allow recovery of some portion of fixed cost in addition to the variable cost of captive generation. The captive generators may offer their surplus power on the basis of a firm schedule. Infirm power from CPP should also be considered for purchase.
Benchmark tariff for generators using different fuels may be indicated by the Appropriate Commission for purchase of power from CPP of up to 15 MW plant size.
There should be no penalty for reduction of contract demand by any captive plant
For computation of wheeling charges and losses, the Sub-Group recommended the following methodology:
The transmission charges should be specified on the basis of voltage level of
transmission. Only technical losses should be taken into account while specifying
transmission losses Losses should be applied in kind, i.e., the drawal schedule of the Open
Access Consumer shall be the injection schedule adjusted for losses.
The Group felt that reactive energy charges from the open access consumers or captive power plant owners may be levied by the licensee of the area at par with other users.
1.14.4 Status of Various issues Identified Various Regulatory/Technical/Commercial issues raised during regional level meetings as well as meetings in CEA held with CPPs/Industry Associations etc. along with the status of action taken is given as under.

Demand for Power and Generation Planning Working Group on Power for 11th Plan
Page 31 of Chapter 1
Sl. No.
Issues Action/Status
1. Open Access, which is the key provision to attract investment in new generation/ transmission/distribution projects, should be made effective as per the provisions of Electricity Act, 2003 and National Electricity Policy,
Most of the SERCs have already issued regulations.
2. Surcharge/ Cross Subsidy Surcharge in some States is very high Tariff policy notified by GoI on 6th January, 2006
3. Very high, discriminate electricity duty imposed on captive power generation and imposition of cess on captive power generation by some State Govts.
Sub group recommends that electricity duty should not be imposed on generation of power from captive power plant. This may be considered by State Govts.
4. Reduction in contract demand by CPP not allowed by state DISCOM resulting in higher demand charges
Recommended by Sub group
5. Demand charges levied on connected load irrespective of actual drawal from DISCOM.
Recommended by Sub group
6. Exorbitant wheeling charges for intra-state transmission system for transfer of surplus power from captive plant.
Recommended by Sub group
7. Other charges levied on CPPs by Regulatory Commissions. – Additional surcharge – Parallel operation charge – Contract Demand Charge/ Annual Minimum Guarantee Charge – Transmission Charge – Fixed Charge for electricity connection – SLDC charge – Reactive energy charge – Banking charge
Recommended by Sub group
1.14.5 Recommendations for The Working Group discussed various recommendations of the Regional level meetings held with CPPs/ Industry Associations etc. and workshop held by MoP & CEA and feels that Captive/group captive generation should be encouraged as envisaged in the National Electricity Policy and Integrated Energy Policy. To further address the problems faced by the captive generators and harnessing surplus power from the CPPs, following recommendations are made by the Sub-group. (A) General- Captive & Renewable/ Cogeneration Plants
i) To initiate action through Energy Departments of all the States to identify the surplus capacity available from the captive power plants and approach State Utilities/Discoms to buy the surplus power available from the captive power plants.
ii) As one of the option, CPP may be given tariff at frequency based UI rates under
ABT mechanism.
At present the UI rates are as under: Frequency UI Rate (Rs.) 49.0 Hz 5.70 49.5 Hz 3.45 50.0 Hz 1.50 50.5 Hz. 0.00

Demand for Power and Generation Planning Working Group on Power for 11th Plan
Page 32 of Chapter1
iii) Single Window at State level to handle all issues relating to installation of Captive plants i.e. environment clearance, open access etc):
(As per amended Electricity Act CPPs have been freed from licensing. However, permission needs to be obtained in respect of environmental clearance as well as third party sale of power (Open Access). The single window to handle all such issues will greatly facilitate in obtaining the required clearance within a stipulated period).
iv) Electricity duty plus cess to be reduced as it is high in certain States i.e. AP–
25p/unit; Chattisgarh- 10p/unit; West Bengal- 20p/unit. v) Electricity duty to be imposed on consumption and not on generation vi) Custom duty on import of all fuels (coal, gas and Furnace oil) to be fixed at
reasonable rates. vii) Open access to be allowed in phases by SECRs who have issued regulations
Connected demand 10 MW and above – June 2005/April 2006 Connected demand 1 MW and above – April 2007/ December 2008
viii) Monitoring of capacity addition and generation from captive/co-generation plants is
required to be strengthened. In this exercise a methodology is required to be worked out in association with Ministry of Non-Conventional Energy Sources as there is an apprehension that the co-generation plants and renewable energy sources plants which are captive also are included in the Installed Capacity of Utility as well as in Captive Plants Capacity.
(B) Renewable/Co-generation Plants
i) SERCs to encourage and specify minimum percentage for purchase of power from renewable and co-generation plants.
ii) Mandating the distribution utilities in the State to purchase renewable energy to
reach at least a target of 5% of total energy consumption in the area of each DISCOM/licensee by the year 2012.
iii) Co-generation power is to be given “Must Run” status. Co-generation power should
be treated at par with non-conventional energy sources such as wind energy. Therefore, no backing down of the co-generation power be resorted to by the off taking distribution utilities except in events of force majeure.
iv) Provision of banking facility may be considered and withdrawal of banked energy
may not be linked with grid frequency and time of day in respect of renewable energy sources captive/co-generation plants.
iv) There should be no cross-subsidy surcharge on surplus power to be supplied by a
renewable source based captive/Co-generation plant.
Demand for Power and Generation Planning Working Group on Power for 11th Plan
Page 33 of Chapter 1
1.15 MAXMISING GENERATIOM FROM EXISTING PLANTS AND AGS&P Optimization of generation from the existing generation capacity is of utmost importance in the resource crunch environment. The installation of new power projects involves large investment and long gestation period. Among various options considered by the Working-Group, following options are recommended:
1. Renovation & Modernization and Life Extension of Power Plants 2. Energy Audits 3. Better O & M practices
1.15.1 Renovation & Modernization and Life Extension of Power Plants The main objective of Renovation & Modernization (R & M) of power generating units is to make the old operating units well equipped/ modified/ augmented with a view to improve their performance in terms of efficiency, output, reliability, safety and availability as compared to the original values. It involves replacement and modification of various systems/equipment and overcoming design deficiencies, if any, & obsolescence. It also involves activities relating to viable technological up gradation. 1.15.2 R&M and LE of Thermal Power Plants A Renovation and Modernisation (R&M) Programme for Thermal Power Stations was launched by the Government of India all over the country way back in September 1984 for completion during the Seventh Plan Period. This programme was successfully completed and intended benefits were achieved. In the subsequent 8th and 9th Plans, Renovation and Modernisation and Life Extension (LE) works were carried out on a number of older generating units which resulted in improvement in their performance and extension of their useful life by about 15 to 20 years. This is evident from the fact that the average plant load factor (PLF) of these thermal power stations increased from 53.9% in the year 1990-91 to 74% during the year 2006-07 (upto Nov. ). At the beginning of the 10th plan, 106 old thermal units aggregated to a capacity of about 10413 MW were identified for Life Extension works at an estimated cost of Rs.9200 crores for completion during 10th Plan. However progress was not satisfactory due to high execution time & cost involved in LE works. The cost of LE was also not economically feasible considering the age of plants and there was reluctance from power plants to shut down their units for longer periods due to prevailing power shortages. In view of above a new initiatives called Partnership of Excellence was taken up the details of which is given in following paragraphs. 1.15.3 PARTNERSHIP IN EXCELLANCE (PIE) PROGRAMME
Under this programme generating companies who were performing well provide assistance in improving performance of non-performing companies. Towards this initiative, CEA identified 22 power stations of 11 utilities, with a capacity of 7930.5 MW across the country. Out of these, 17 stations with an operating capacity of 5050 MW were entrusted to NTPC and one stations (280 MW) to TATA power. On remaining 4 stations the respective utilities

Demand for Power and Generation Planning Working Group on Power for 11th Plan
Page 34 of Chapter1
are taking their own course of action. The plants entrusted to NTPC recorded an additional generation of power-3690 MUs corresponding to an equivalent capacity addition of 720 MW, considering national average PLF. Capacity addition of this order requires an investment of around Rs.3,000 crore at a Greenfield project. Some additional units have also been identified for R&M and life extension. The decision for investment for R&M/LE will be based on cost benefit analysis. If not economically viable installation of new plants at existing sites, may be considered. Steps involved in implementation of PIE Programme ‘PIE’ programme is envisaged to be implemented in 3 phases as under: Phase-I : Toning up of O&M practices and training of operating personnel Phase-II: Procuring essential spares from Original Equipment Manufacturers (OEM),
carrying out comprehensive Capital Overhauling and doing essential R&M works to improve PLF above 60 % .
Phase-III : Residual Life Assessment ( RLA) studies and major Renovation &
Modernisation / Life Extension ( R&M / LE ) works based on techno-economic viability.
Present status of progress The following steps have been taken / are being taken on identified stations:
• Agreements with concerned power utilities have been signed by better performing Partners viz. NTPC and Tata Power between October 2005 to December 2005.
• NTPC has already deputed 136 executives at 13 stations and has also set up head office at Patna for implementation and monitoring of ‘PIE’ programme. On remaining 2 PIE stations of NTPC namely Bandel and Santaldih, PIE activities could not be undertaken due to lack of interest from WBPDCL as reported by NTPC. As informed by NTPC, WBPDCL has planned to phase out Bandel TPS (unit 1 to 4) due to ageing of these units. Santaldih TPS has been operating at low PLF due to inadequate capacity of Coal Hahdling Plant.
• Tata Power has deputed its executives at Dhuvran station (units-1 & 2) of GSECL for effective implementation and monitoring of ‘PIE’ programme.
• Phase-I activities of improved O&M practices and minimum overhauling have been mostly completed on 13 PIE stations by NTPC and 1(one) PIE station by Tata Power.
• Implementation of management practices as per NTPC’s O&M system Manual is in progress.
• Phase-II activity of Comprehensive overhauling has been initiated on 13 PIE stations by NTPC. In order to accelerate the pace of supply of spares and obviate the need for signing of MOUs with the concerned power utilities, a system of placement of Open Order on BHEL by power utilities has been introduced. Most of

Demand for Power and Generation Planning Working Group on Power for 11th Plan
Page 35 of Chapter 1
the power utilities have placed open order for supply of spares on BHEL in Oct- Nov 2006.
• The details of PLF and Generation in December 2006 and during April to December 2006 on various stations covered under PIE programme as well as same during the corresponding period last year are given in Annexure-1.11 . It can be seen that 10 stations under PIE programme with partnership with NTPC and Tata Power have shown marked improvement in Generation and PLF during the period April to December 2006 as compared to corresponding period last year.
Achievements The programme has started showing results in the form of improvement in PLF. In December 2006, 8 (eight) stations achieved PLF above 65% as shown below:
Sl no.
Utility Power Station
Capacity under PIE (MW)
Plant Load Factor ( % ) during
Dec, 05 Dec, 06 1. JSEB Patratu units
1 & 2 80 MW 38.00 83.15
2. DVC Durgapur units-3 &4
350 MW 42.23 81.29
3. IPGCL Rajghat units-1 &2
135 MW 84.31 81.17
4. DVC Chandrapura units-1,2 &3
390MW 70.98 78.04
5. TNEB Ennore units 2,3 &5
280 MW 21.37 73.49
6. TVNL Tenughat TPS units-1&2
420 MW 45.73 72.33
7. UPRVUNL Parichha Units-1,2 of
220 MW 26.49 71.28
8. DVC Bokaro ‘B’ units-1,2 &3
630MW 65.03 68.58
Most of other stations also showed improvement in their PLF. This improvement in performance has been achieved through implementation of phase-I activities of PIE programme. Further, improvement in PLF is expected on completion of phase-II activities. The phase-II of the programme, therefore, needs to be continued and new stations which are perpetually running at PLF below 60% and have sufficient remaining lifetime (Details given in table 1.26) can be considered for inclusion under PIE programme.

Demand for Power and Generation Planning Working Group on Power for 11th Plan
Page 36 of Chapter1
Table 1.26 Stations running at PLF lower that 60% to be considered for
Inclusion under PIE
PLF( %) up to Dec
Name of the Station
Cap. (MW)
05-06 06-07 Faridabad Extn. (HPGC)
3x60 =180 50.3 40.9
Chandrapur (MSEB)
4x210+3x500=2340 68.4 58.0
Neyveli Lig. St. II ( NLC )
7x210 = 1470 74.7 58.3
1.15.4 R&M and Uprating of Hydro Plants: The normal life expectancy of a hydroelectric power plant is 30 to 35 years after which it needs life extension. Many of the existing hydro power stations could be modernized to generate reliable and higher yield by minor modifications. By adopting modern equipment like static excitation, micro-processor based controls, electronic-micro processor based governors, high speed static/Numerical relays, data logger, optical instruments for monitoring vibrations, air gaps, silt content in water etc. availability of hydro power stations could be improved and outages minimized. In situations like run-of-the river schemes in Himalayan and Sub-Himalayan region, excessive silt contained in the inflows causes enormous damage to the under water parts of turbines, requiring rehabilitation almost every year. Upgrading of hydro plants calls for a systematic approach in view of a number of influencing parameters pertaining to the prime mover besides its repercussions on the total hydro electric development which itself may be a sub system of an integrated power development. A number of hydraulic, mechanical, electrical and above all economic factors play a vital role in deciding the course of action and the modalities of an upgrading / uprating programme. Uprating of hydro power plant cannot thus be considered in isolation. It has to be strategically planned, may be in certain steps, keeping in view all the techno-economic considerations. (a) Review of 10th Plan Programme of R&M and LE – Hydro The Group reviewed the Hydro R&M & Uprating Programme as well as the achievements during the 10th Plan. A Summary of the projects planned, completed and on which work is ongoing in the 10th Plan is as furnished in Table 1.27

Demand for Power and Generation Planning Working Group on Power for 11th Plan
Page 37 of Chapter 1
Table 1.27 Summary of R&M and Life Extension Programme and Achievements for 10th Plan –
Hydro
Description R&M LE No. of Projects Covered 37 16 Capacity (MW) 5257.85 642.25 Estimated Cost (Rs. Crores) 1116.11 Expenditure incurred (Rs. Crores) till 5/06 1032.83
Targeted Benefits (MW ) 137.83 636.25 Actual Benefits achieved 114.4 498.75
Project-wise details of projects completed during 10th Plan is furnished at Appendix 1.12 and of ongoing projects programmed for completion during 10th are furnished in Appendix 1.13. (b) Programme for 11th Plan – Hydro The Group deliberated on the 11th Plan programme for hydro R&M & Uprating Schemes and a Summary of 11th Plan programme as well as ongoing projects and those projects on which work is yet to commence is furnished in Table 1.28.
Table 1.28 Summary of R&M and Life Extension Programme and Achievements for 11th Plan -
Hydro
Description R&M LE No. of projects Covered 60 41 Capacity (MW) 11278.15 4025.2 Estimated Cost (Rs. Crores) 3478.5.5 Expenditure incurred (Rs. Crores) till 5/06 232.827
Targeted Benefits (MW) 302.25 4025.21 Actual Benefits achieved
Project-wise details of ongoing hydro RM&U projects for completion in 11th Plan are furnished in Appendix 1.14. Project-wise details of hydro RM&U projects for completion in 11th Plan but works on which are yet to be taken up for implementation are furnished in Appendix 1.15.
1.15.5 R&M and Plant Life Extension of Nuclear Plants During the course of the operating life of a Nuclear Power Plant, it goes through a series of routine and several safety reviews, based on which periodic improvement/safety upgrades are implemented. The coolant channel of older units (which commenced commercial operation in 1993) Pressurized Heavy Water Reactors need replacement. After about 10 years of operation at full power, these coolant channels are replaced during a long shut down. Advantage of this shut down is taken for safety upgrades and plant life extension, as required.

Demand for Power and Generation Planning Working Group on Power for 11th Plan
Page 38 of Chapter1
Such R&M activities have been completed for Rajasthan Atomic Power Station Unit-2 and Madras Atomic Power Station Unit-1&2. R&M activities as above have been taken up on NAPS-1 and are expected to be completed during 2006-07. Similar work is planned for NAPS-2 and KAPS-1 in the 11th Plan. Details of financial outlay in respect of these projects are given in Table 1.28.
Table 1.28
Summary of R&M and Life Extension Programme and Achievements for 11th Plan – Nuclear
(Figs in Rs cr.) Name of project
Estd. Completion cost
Anticipated exp. by 10th Plan end
2007-08 2008-09 2009-10 2010-11 2011-12 Total 11th Plan
NAPS -1&2
247 171 105 105
KAPS-1 133 5 66 54 119 1.16 ENERGY EFFICIENCY IMPROVEMENT THROUGH ENERGY AUDIT As per Energy Conservation Act 2001, Energy audit means the verification, monitoring and analysis of use of energy including submission of technical report containing recommendations for improving energy efficiency with cost benefit analysis and an action plan to reduce energy consumption. Also under the provision of Energy Conservation Act 2001, all designated consumers declared by the Government would have to undertake mandatory Energy Audit studies by accredited Energy Auditors. Energy Audit studies aim at determining the present level of performance of main power plant equipment and selected sub-systems and comparing them with design figures. Reasons for deterioration are analysed. The studies may also involve review of design of various equipment to see if these are over-designed. Techno-economic viability of introducing new efficient technologies is also included in the energy audit studies. In fact the basic objective is to reduce the consumption of various inputs (coal, oil, power, water) per unit of power generation. Areas normally covered in a power plant are:
Boiler efficiency Air heater performance Mills performance Furnace radiation losses Turbine heat rate Regenerative system performance HP/IP cylinder efficiency Condenser performance Auxiliary power consumption Lighting systems DM water consumption

Demand for Power and Generation Planning Working Group on Power for 11th Plan
Page 39 of Chapter 1
Secondary fuel oil consumption Any other sub-system i.e. air compressor, air conditioning etc.
In view of the foregoing, it is suggested that “Energy Efficiency Cell” shall be created at all thermal power stations. This cell shall be responsible for the following:
Internal Energy Audit groups shall be set up in each power plant. Capacity building of the efficiency group must be done to enable them to carry out Energy Audit tests on their own.
Regular audits shall also be got conducted from accredited Energy Auditors.
All recommendations that emerge from these audits must be implemented if
these are techno-economically feasible. Short term measures can be made part of the annual plan/annual overhaul of the unit whereas long term measures can be taken up under the R&M schemes of these stations.
Energy Efficiency Awareness campaign shall be taken up among staff of the
power plant. Better O&M practices Better O&M practice is also an effective tool to improve the performance of existing plants major ones being as follows:
1. Run the machines at parameters near to design parameters. 2. Keep proper fuel/air mixture to reduce high carbon loss in ash . 3. Replacement of air heater seal to avoid air ingress in Air preheaters. 4. Maintain the recommended fineness of Pulverized coal. 5. Reduce the excessive R/H spray & enforce burner tilt mechanism to control
reheat temperature. 6. Instrumentation needs to be checked and calibrated regularly. Wide variation
in readings may be observed and corrected. 7. Control CW flow to check under cooling of condensate. 8. Attend air ingress into condenser. 9. Keep the condenser tubes clean.
1.17 ACCELERATED GENERATION & SUPPLY PROGRAMME (AGS&P) SCHEME Under the AGS&P Scheme, MOP is providing interest subsidy through financial institution (PFC & REC) with an objective to reduce the rate of interest on the term loans for R&M of State Sector thermal power grants. 1.17.1 Scope of the scheme The Scope of the AGS&P Scheme is as follows:
• The Scheme covers all States/UTs. • The financial support, to be provided for the renovation/modernization and uprating
works undertaken by the Utilities in Government /Public Sector.

Demand for Power and Generation Planning Working Group on Power for 11th Plan
Page 40 of Chapter1
• The Scheme is applicable to thermal power stations of station capacity Note: Release of AG & SP funds under new loans sanctioned at Stage II and Stage III shall take place only after appointed consultant/ partner confirms that the O&M practices have reached satisfactory level. 1.17.2 Salient features of the scheme The salient features of the scheme extension of Accelerated Generation & Supply Programme to Tenth Five Year Plan period and Govt. directions/Guidelines thereto are as under:- a) The assistance under the AG&SP scheme shall be limited to only state sector R&M
generation projects including those based on non-conventional energy sources. Interest subsidy under AG&SP schemes will be admissible for D.V.C.’s R&M projects also.
b) Only those States, which perform satisfactorily with respect to the agreed milestones
of the reform MoUs entered into with the Ministry of Power and of the Action Plans to achieve commercial viability in accordance with the Reform programme, would be eligible for funding under AG&SP. The better performing states would be given preference. The milestones of Action Plans would be stringent and will aim at progressively reducing the gap between the cost per unit and the revenue collected per unit of electricity.
c) The total assistance under the Scheme will be limited to the budget provision in the
Tenth Five Year Plan. d) Interest subsidy under the scheme has been reduced from 4% in Ninth Plan to 3%
in Tenth Plan i.e. 1.4.2002 to 31.3.2007. The subsidy for projects in North-Eastern Region would be 4%. Interest Subsidy would be restricted to difference of lending rate and benchmark rate subject to a maximum of 3% and 4% respectively.. The benchmark rate would be rate of interest on 12 years’ Government security for that financial year.
e) Grants under the AG&SP scheme will be provided to State Electricity Boards
(SEBs), State Generating Corporations (SGCs) and state Power Departments (SPDs) for carrying out studies which help to achieve policy objectives of the Government relating to Power sector. These include Power sector Reform and Restructuring Studies, System Studies, Renovation & Modernisation (R&M) Studies, Life Extension (LE) Studies, retainer consultancy for R&M and Environment/social studies. Distribution studies which are covered under the proposed APDRP Scheme will not be eligible for grant of assistance under AG&SP Scheme. some minimum expenses relating to overall power sector reforms and restructuring studies on a need based approach would be considered for funding under the AG&SP Programme. To this extent guidelines issued in OM No. 32024/23/2001-PFC dated 24.12.2002 and 7th March, 2003 and supplemented for the sanction of appropriate level of funds within the overall allocation of the 10th Plan as budgeted from year to year.

Demand for Power and Generation Planning Working Group on Power for 11th Plan
Page 41 of Chapter 1
f) Interest subsidy in respect of generation project covered under AG&SP will be reduced in proportion to the delay in commissioning of the project in following manner:
Reduction %Delay(D/X) Reduction 0% - 10% Nil >55% - 70% 2%
>10%-25% 0.5% >70% - 85% 2.5% > 25% - 40% 1.0% >40% - 55% 1,5% Above 85% 3.0%
D is delay (in days) = Actual Commissioning date- agreed Commissioning Date X (in days) = Agreed Commissioning Date – Date of sanction of loan.
The reduction in interest subsidy will be applicable from the actual date of
commissioning or the date of 85% delay, whichever event occurs earlier. Wherever the interest subsidy is less than 3%, the same would be spread over seven slabs proportionately as per formula laid down above and the concerned lending institution will account for it to the Ministry of Power as interest subsidy is front ended.
(g) All generation projects which are estimated to be commissioned in Tenth Plan
period would be eligible for assistance under AG&SP 1.17.3 Eligibility criteria for the scheme (a) The project authority are to ensure that there has been annual overhaul of the plant
on regular basis. In case, this has not been done so, the same have to be done by the project authority In case, if it is found that improvement can be affected by making a change in the management of the plant, that should be resorted to by the project authority without any delay.
(b) Emphasis will be on the rehabilitation of core and essential equipments of the plant.
However, while accepting replacement of major items, clear evidence of failure or frequent operational trouble will form the main criteria.
(c) The replacement of minor items which could otherwise be covered under the routine
and preventive maintenance of power stations, shall not be covered under this scheme.
(d) The R&M Report should contain brief history of the project, technical details, unit-
wise annual generation data since commissioning, details of forced outages, modifications/replacement works undertaken earlier, problem now encountered and the reasons for poor performance. The report should also indicate the nature & scope of the R&M works involved, cost estimates and the cost benefits analysis etc,
(e) The proposals shall be considered subject to their merits, techno-economic viability
and availability of funds 1.17.4 Procedure for availing interest subsidy

Demand for Power and Generation Planning Working Group on Power for 11th Plan
Page 42 of Chapter1
i) If the project is found suitable for renovation/modernization work, leading to optimum generation of power. The State Government/ SEBs will then be firm up the cost estimates of the identified works so as to fix the financial requirements for the R&M activities to be undertaken. A firm time schedule will be worked out to complete the work. The project authority/State 0Government must furnish a certificate that loans for R&M absolutely necessary .
ii) The PFC and R.E.C. shall have to include a clause in their Term Loan Agreement
with the Project authorities to recover the subsidy amount along with the penal interest of 3% more alongwith the recovery of Term Loan for cases of default where the interest subsidy is cancelled by MOP for violation of terms of conditions of this circular. Loan can be recalled by the FIs before project completion or where project is not completed for whatever reason. They shall create a ‘pari-passu’ charge for the recoveries to be made by them for refund of subsidy amount to MOP. The un -disbursed amount of interest subsidy released by MOP to the FIs along with the penal interest as above will, be returned immediately in all such cases.
iii) MOP will examine the proposal received from the financial institution and approve
interest subsidy on the basis of overall viability of the proposal, fulfilment of general terms and conditions, availability of funds and general policies of MOP.
iv) All expenses towards the cost of the project, over and above the Ministry’s support
agreed to, including escalations in the cost, if any, will have to be met by the Executing Agencies.
It is recommended that R&M schemes shall be continued during 11th and 12th Plan also. However it must be ensured that routine maintenance activities are not included in these schemes. Only activities which aim at increasing the efficiency of the unit or improve the availability or are required to meet environmental norms or are aimed at renovating obsolete equipment- Controls and Instrumentation are included in R & M schemes. Further for Life Extension schemes, a cost benefit analysis should be carried out vis-à-vis installation of new unit at the same site. The Group recommends that the AGS&P Scheme shall continue. 1.18 NON CONVENTIONAL ENERGY SOURCES Our country has significant potential for generation of power from Non Conventional Energy Sources such as Wind, Small Hydro, Bio mass and Solar Energy. Limited availability of fossil fuel like coal and gas has further highlighted the importance of power from these sources. In addition, these sources provide a particularly attractive solution for meeting requirement of power at remote locations, in case of which it is not feasible to extend the grid. All efforts are therefore being made to tap these resources for generation of power to supplement power from Conventional Sources. 1.18.1 Development of Non-Conventional Energy Resources The total estimated medium-term potential (2032) for power generation from renewable energy sources such as wind, small hydro, solar, waste to energy and biomass in the country is about 1,83,000 MW. The grid interactive installed capacity from renewable is

Demand for Power and Generation Planning Working Group on Power for 11th Plan
Page 43 of Chapter 1
likely to increase from about 3,500 MW at end of 9th Plan to 23,500 MW at the end of 11th Plan. The grid interactive Installed Capacity as on 30.09.2006 is 8996 MW. Source wise details of Potential and Installed Capacity as on 30.09.2006 are furnished in Table 1.29
Table 1.29
Potential and Installed Capacity of Renewable Power (AS ON 30.09.06)
(Figures in MW) Sources / Systems Estimated mid-
Term (2032) Potential
Cumulative Installed Capacity (As on 30.09.2006)
Wind Power 45,000 6070.20Bio- Power(Agro residues & Plantations)
61,000 466.50
Co-generation Baggasse 5,000 571.83Small Hydro (up to 25 MW) 15,000 1849.78Waste to Energy 7,000 34.95Solar Photovoltaic 50,000 2.74
TOTAL 1,83,000 8996.00 Source MNRE Sector-wise details of renewable energy sources are as follows: 1.18.2 Tenth Plan – Target and Achievement A target of 3075 MW was set for the 10th Plan in respect of grid interactive renewable power against which an achievement of 4635 MW has been made during the 1st four years of the 10th Plan and a target of 1888 MW has been set for 2006-07 i.e. last year of the 10th Plan. Source wise details are furnished in Table 1.30.
Table-1.30
10th Plan Targets and Achievements for Grid Interactive Renewable Power (Figures in MW)
Sources / Systems Target
Achievement (2002-03 to 2005-
06) As on 31.03.2006
Target 2006-07
Wind Power 1500 3665 1515Biomass Power Baggasse Co-generation Biomass Gasifiers
700 532 228
Small Hydro (up to 25 MW) 600 388 132Waste to Energy -MSW -Industrial Waste
80 28 13
Solar Power 145 0.73 0.00TOTAL 3075 4614 1888
Source MNRE

Demand for Power and Generation Planning Working Group on Power for 11th Plan
Page 44 of Chapter1
11th Plan Target Details of 11th Plan target of Grid Interactive renewable power are furnished in Table 1.31.
Table 1.31 11th Plan Tentative Targets for Grid Interactive Renewable Power
(Figures in MW)
Sources / Systems Target for 11th plan
Wind Power 10,000
Biomass Power Baggasse Co-generation Biomass Gasifiers
2,100
Small Hydro (up to 25 MW)
1,400
TOTAL 13,500
Source MNES The above target of 13,500 MW for grid interactive renewable power does not include 1000 MW from Distributed Renewable Power System (DRPS). The programme is based on the draft report of the Working group on Non- Conventional Energy Sources for 11th Plan 1.18.3 Summary of Installed Capacity Considering the 10th Plan and tentative 11th Plan capacity addition as detailed above, Summary of Installed Capacity is furnished below: Installed capacity by the end of 9th Plan (As on 31.3.2002) 3,475 MW Installed capacity by the end of 2005-06 (As on 31.3.2006) 8,088 MW Programme for 2006-07 1,888 MW 11th Plan programme for 2007-12 13,500 MW Total Installed Capacity by the end of 11th plan 23,476 MW Say 23,500 MW Reliable figures for generation from these projects are not available but assuming average PLF of 20%, this will generate about 131 BU by 2011-12. 1.19 ISSUES TO BE ADDRESSED AND STRATEGY TO BE ADOPTED FOR 11th
PLAN Transition of the Indian Power Sector from the era of SEBs to separate generation, transmission and distribution utilities, independent regulatory bodies and entry of private and foreign players is expected to fundamentally transform the power scenario. However, since this restructuring is still under the process of evolution, a number of crucial issues
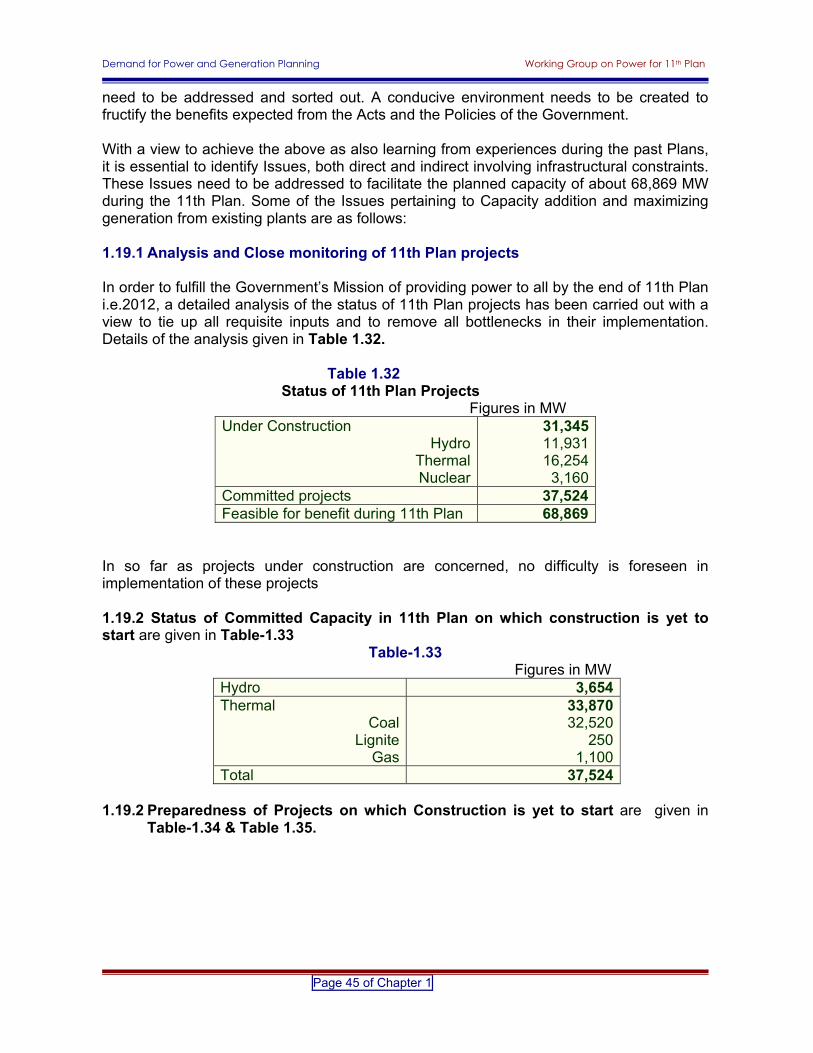
Demand for Power and Generation Planning Working Group on Power for 11th Plan
Page 45 of Chapter 1
need to be addressed and sorted out. A conducive environment needs to be created to fructify the benefits expected from the Acts and the Policies of the Government. With a view to achieve the above as also learning from experiences during the past Plans, it is essential to identify Issues, both direct and indirect involving infrastructural constraints. These Issues need to be addressed to facilitate the planned capacity of about 68,869 MW during the 11th Plan. Some of the Issues pertaining to Capacity addition and maximizing generation from existing plants are as follows: 1.19.1 Analysis and Close monitoring of 11th Plan projects In order to fulfill the Government’s Mission of providing power to all by the end of 11th Plan i.e.2012, a detailed analysis of the status of 11th Plan projects has been carried out with a view to tie up all requisite inputs and to remove all bottlenecks in their implementation. Details of the analysis given in Table 1.32.
Table 1.32 Status of 11th Plan Projects
Figures in MW Under Construction
Hydro Thermal Nuclear
31,345 11,931 16,254 3,160
Committed projects 37,524 Feasible for benefit during 11th Plan 68,869
In so far as projects under construction are concerned, no difficulty is foreseen in implementation of these projects
1.19.2 Status of Committed Capacity in 11th Plan on which construction is yet to start are given in Table-1.33
Table-1.33 Figures in MW
Hydro 3,654 Thermal
CoalLignite
Gas
33,870 32,520
250 1,100
Total 37,524 1.19.2 Preparedness of Projects on which Construction is yet to start are given in
Table-1.34 & Table 1.35.

Demand for Power and Generation Planning Working Group on Power for 11th Plan
Page 46 of Chapter1
Table-1.34 Hydro
Status MW Projects awaiting investment decisions/work award
3,169
Concurrence to be accorded by CEA/State Government
485
Total 3,654
Table-1.35 Thermal
Status MW Coal blocks/linkages yet to be allocated
7,000
Total 7,000 In case of above projects, for each project a milestone time-schedule has been created which would ensure timely completion of each activity. This should be adhered to avoid bunching of projects in the last two year of 11th plan and to ensure that plan targets are met. 1.19.3 Augmentation of Infrastructural facilities Implementation of this large capacity would call for augmentation of manufacturing capabilities in the various input sectors namely,
Main Plant and equipments - BHEL has drawn up a Plan for capacity augmentation from 6,000 MW to 10,000 MW with an investment of Rs 1600 crs. This programme is in an advanced stage of implementation and is expected to be completed by 2007. BHEL plans to further enhance its capacity as deemed necessary, on receipt of sustained capacity addition programme along with the mix in the 11th & 12th Plan periods.
Key inputs - This would call for augmentation in manufacturing capacities of steel,
cement, aluminum and also in the manufacturing capabilities of various associated equipment like, large motors, coal handling plants, water treatment plant, ash handling and ash utilizing facilities, etc.
Construction agencies – This area also needs large augmentation as at present
there is lack of qualified contractors for taking up construction of large hydro and thermal power plants.
1.19.4 Arrangement for fuel requirement Coal based capacity of about 46,635 MW has been identified for commissioning during 11th Plan period and the requirement of coal during 2011-12 has been assessed as 545 Million tons per annum. Details of total requirement of coal viz-a-viz indigenous production plans are given in Table 1.36 & Appendix 1.9

Demand for Power and Generation Planning Working Group on Power for 11th Plan
Page 47 of Chapter 1
Table 1.36 Fuel Requirement (Tentative) during 2011-12
Fuel Requirement (2011-12) Coal* 545 MT
Lignite 33 MT
Gas/LNG** 89 MMSCMD
* From domestic sources, total coal availability is expected to be 482 MT per annum by 2011-12. Accordingly, imported coal of the order of 40MT, equivalent to 63 MT of Indian coal, may have to be organised. This quantity may reduce provided production of domestic coal is increased. ** 89 MMSCMD of gas requirement at 90% PLF has been projected in 2011-12. At present, the availability of gas is of the order of 40 MMSCMD and therefore not sufficient to meet the requirement of even existing plants.
On an average, power sector is being supplied 70-75% of the coal produced by Coal
India Ltd. The above requirement of coal also includes the coal produced by individual organizations from captive blocks allotted to them.
Tie up of coal requirement as per the above schedule shall be ensured
As regarding requirement of gas 2114 MW gas based projects have been planned during 11th Plan and these projects have firm tie up of gas. 1.19.5 Summary of Fund Requirement for Generation Projects
The details of the overall capacity addition programme of 68,869 MW during 11th Plan and fund requirement of Rs 4,10,897 crore including start-up projects for capacity addition in 12th Plan are tabulated in Table 1.37.
Table 1.37
11th Plan Capacity addition & Fund Requirement (including advance action funds for 12th plan projects)
Sector Fuel Type Likely capacity addition (MW)
Fund Requirement (Rs. crore)
Central Hydro 9,685 27,231 Thermal 22,310 74,782 Nuclear 3,160 8,970 Total 35,155 1,10,982
State Hydro 2,637 4,349 Thermal 21,852 75,278 Total 24,489 79,627
Private Hydro 3,263 13,234

Demand for Power and Generation Planning Working Group on Power for 11th Plan
Page 48 of Chapter1
Sector Fuel Type Likely capacity addition (MW)
Fund Requirement (Rs. crore)
Thermal 5,962 17,858 Total 9,225 31,092
All India Hydro 15,585 44,814 Thermal 50,124 1,67,918 Nuclear 3,160 8,970
Funds for projects benefiting in 11th Plan Total 68,869 2,21701
Hydro 31,734 86,291Thermal 47,225 81,877
Funds for projects benefiting in 12th Plan Nuclear 12,800 21,208
Total 91,759 1,89,195Grand Total 1,52,963 4,10,896
The overall requirement of funds in 11th Plan has been estimated as Rs. 10,31,600 crore including NCES, Captive and Merchant Power Plants. The details along-with sources of funds are given in Chapter 10 of the report. 1.19.6 Manpower Requirement In order to facilitate a capacity addition of 68,869 MW during the 11th Plan, trained and qualified manpower is the most essential requirement. Recruitment of proper personnel and necessary training facilities and programmes need to be made available. However quantification of the same is given in Chapter-7 on Manpower Requirement.
1.20 RECOMMENDATION OF THE GROUP
1. The Working Group recommends generation planning based on growth of energy
generation requirement of 9.5%. Keeping in view the above objectives and preparedness of various projects the Working Group recommends capacity addition of 68,869 MW during 11th Plan as per details given below:
Table 1.38
THERMAL BREAKUP SECTOR HYDRO TOTAL
THERMAL COAL LIGNITE GAS/LNGNUCLEAR TOTAL
(%)
CENTRAL 9685 23810 22060 1000 750 3160 36655 (53.2%)
STATE 2637 20352 19365 375 612 - 22989 (33.4%)
PRIVATE 3263 5962 5210 0 752 - 9225 (13.4%)
ALL-INDIA 15585 50124 46635 1375 2114 3160 68869 (100%)

Demand for Power and Generation Planning Working Group on Power for 11th Plan
Page 49 of Chapter 1
2. States are required to take an active role in the capacity addition programme by their own agencies & by private sector participation through tariff based competitive bidding route on the lines of developments of Ultra Mega Power Project. In the 11th plan addition of less than 50% of total capacity is targeted in states and private sector. It is recommended that in 12th Plan more than 50% capacity should come through initiative of the states.
3. Some of the states do not have resources for capacity addition in their states. Such states should tie up long term PPAs with surplus states/generation companies.
4. Manufacturing capacity of BHEL needs to be enhanced to meet the capacity addition programme envisaged in 11th & 12th Plans.
5. A 10 year plan for hydro development is to be pursued in view of higher gestation period. A hydro capacity of 30,000 MW has been identified for commissioning during 12th Plan. The survey and investigation, preparation of DPR, statutory clearances should be vigorously followed up right from now to enable their commission during 12th Plan. The CEA should closely monitor progress on these projects. .
6. The Working Group recommends continuation of PIE programme during 11th Plan also.
7. In addition to capacity addition programme, concerted efforts to continue in regard to:
- Development of captive power plants. - Maximising Generation from existing plants. - Energy Efficiency improvement through Energy Audit. - Better O & M practices. - RM&U/Partnership in Excellence (PIE) Programme. - Development of Non-Conventional Energy Sources.
8. Major recommendations for facilitating open access in distribution and harnessing
surplus captive generation in the country are as under:
Reasonable cross subsidy surcharge and other charges to provide some economic incentive to the generators to avail open access.
The SERCs should allow recovery of some portion of fixed cost in addition to the variable cost of captive generation. The captive generators may offer their surplus power on the basis of a firm schedule. Infirm power from CPP should also be considered for purchase.
There should be no penalty for reduction of contract demand by any industry having captive plant.
********

Demand for Power and Generation Planning Working Group on Power for 11th Plan
Page 50 of Chapter1
Appendix –1.1
SUMMARY OF CAPACITY ADDITION TARGET OF 41,110 MW DURING 10th PLAN (REGION WISE, SECTOR WISE AND STATUS WISE)
(Figures in MW)
HYDRO THERMAL NUCLEAR TOTAL A SECTOR WISE CENTRAL 8,742 12,790 1,300 22,832 STATE 4,481 6,676 0 11,157 PRIVATE 1,170 5,951 0 7,121 TOTAL 14,393 25,417 1,300 41,110B REGION WISE NORTHERN 7,274 5,046 0 12,320 WESTERN 3,752 6,604 1,080 11,436 SOUTHERN 1,158 5,998 220 7,376 EASTERN 1,860 7,075 0 8,935 NORTH EASTERN 349 669 0 1,018 A & N Islands 0 25 0 25 TOTAL 14,393 25,417 1,300 41,110 C STATUS WISE
SANCTIONED ON GOING 8088 7,634 1,300 17,022
CEA CLEARED 3504 9,327 0 12,831 STATE CLEARED 130 648 0 778 NEW SCHEMES 2671 7,808 0 10,479 TOTAL 14393 25,417 1,300 41,110

Demand for Power and Generation Planning Working Group on Power for 11th Plan
Page 51 of Chapter 1
Appendix 1.2
LIST OF PROJECTS COMMISSIONED DURING 10TH PLAN UPTO 31.12.2006
(2002-03)
Name of the Project Sector/State Type Capacity (MW)
THERMAL Pragati CCPP S.S/Delhi Gas 121.2 Pragati CCPP S.S/Delhi Gas 104.6 Ramgarh CCGT-2 S.S/Rajasthan Gas 75.3 Simhadri TPS C.S./A P Coal 500 Neyveli FST Ext. C.S/Tamilnadu Lignite 210 Peddapuram CCGT P.S/ A P Gas 78 Raichur U-7&8 SS/Karnataka Coal 210 NLC-II Ext U-0 PS/ Tamilnadu Lignite 250 Valuthur CCGT SS/ Tamilnadu Gas 94 Talcher-II CS/Orissa Coal 500 Rokhia II U- SS/Tripura Gas 21 Baramura GT Ext. SS/ Tripura Gas 21 Likakhong DG SS/Manipur Diesel 18 Bamboo flat DG PS/A&N Diesel 20 Sub-Total (Thermal) 2223.1 HYDRO Baspa-II PS/HP Hydro 200 Sardar Sarovar SS/Guaratj Hydro 100 Bansagar Tons-III SS/MP Hydro 20 Bansagar Tons-II SS/MP Hydro 15 Srisailam LBPH SS/AP Hydro 300 Sub-Total (Hydro) 635 Total (Thermal + Hydro) (2002-03) 2858.1 (2003-04) Thermal Kota TPS St-IV SS/Rajasthan Coal 195Suratgarh III SS/ Rajasthan Coal 250Dhuvaran CCGT SS/Gujarat Gas 106.6Neyveli FST Ext. CS/Tamilnadu Lignite 210Kutralam CCPP SS/Tamilnadu Gas 100Talcher – II CS/Orissa Coal 500Sub-total (Thermal) 1361.6Hydro Nathpa Jhakri CS/HP Hydro 1500Chamera-II CS/HP Hydro 300Baspa-II PS/HP Hydro 100Indira Sagar JV CS/MP Hydro 500Srisailam LBPH SS/AP Hydro 150Almattti Dam SS/Karnataka Hydro 15

Demand for Power and Generation Planning Working Group on Power for 11th Plan
Page 52 of Chapter1
Kopili ST-II CS/Assam Hydro 25Sub-Total (Hydro) 2590 NUCLEAR MAPS-2 Uprating CS/Tamilnadu Nuclear 50Sub-Total (Nuclear) 50 Total(Thermal + Hydro+Nucl.) (2003-04) 4001.6
(2004-05) Thermal Rihand-II CS/UP Coal 500Panipat U-7&8 SS/Haryana Coal 500Akrimota TPP SS/Gujarat Coal 125Ramagundam CS/AP Coal 500Karuppur CCPP PS/Tamilnadu Gas 70Mezia U-4 CS/DVC Coal 210Talcher-II CS/Orissa Coal 1000Bairabi HFO SS/Mizoram Diesel 22.9Rangat Bay SS/A&N Diesel 6.0Sub-Total (Thermal) 2933.9 HYDRO Indira Sagar JV CS/MP Hydro 500Sardar Sarovar SS/Gujarat Hydro 350Almatti Dam PH SS/Karnataka Hydro 165Sub Total (Hydro) 1015.0Grand Total (T+H) 2004-05
3948.9
(2005-06) Thermal Rihand-II CS/UP Coal 500Akrimota TPP SS/Gujarat Coal 125Karuppur CCPP PS/Tamilnadu Gas 49.8Jojobera PS/Jharkhand Coal 120Valentharvi PS/Tamilnadu. Gas 38Jagrupadu CCPP PS/AP Gas 220Paricha Extn. SS/UP Coal 210Dhuvaran SS/Gujarat Gas 72Vemagiri-I PS/AP Gas 233Rokhia GT SS/Tripura Gas 21Sub-Total (Thermal) 1588.8 NUCLEAR TAPP Unit 3&4 CS/Maharashtra Nuclear 540MAPS-1 Uprating CS/TN Nuclear 50Sub-Total (Nuclear) 590

Demand for Power and Generation Planning Working Group on Power for 11th Plan
Page 53 of Chapter 1
HYDRO Dhauliganga SS/Uttranchal Hydro 280Sardar Sarovar Ss/Gujarat Hydro 800Almatti Dam PH SS/Karnataka Hydro 110Pykara Ultimate ST SS/Tamilnadu Hydro 150Sub-total (Hydro) 1340 Grand Total (T+N+H) 2005-06
3518.8
2006-07 Upto 31.12.06 Thermal Valentharvi PS/Tam Gas 14.8Vemagiri-I CCGT PS/AP Gas 137Ratnagiri Gas (JV) JV/Maha Gas 740Vindhyachal NTPC Thermal 500Unchahar III NTPC Thermal 210Paricha Extn. SS/UP Coal 210Sub-Total (Thermal) 1811.8Nuclear Tarapur 3 & 4 CS/Maha Nuclear 540Sub-Total (Nuclear) 540Hydro Vishnuprayag PS/Uttranchal Hydro 400Tehri I THDC Hydro 500Larji SS/HP Hydro 126Bhawani Kathalai Tam Hydro 30Sardar Sarovar SS/Guj. Hydro 200Bansagar-IV MP/SS Hydro 20Marikheda MP/SS Hydro 40Sub-Total (Hydro) 1316Grand Total (T+N+H) 3667.8
ALL INDIA -10TH PLAN CAPACITY ADDITION TILL DATE
Thermal (Coal+Gas+Diesel) 9919 (Hydro) 6896 (Nuclear) 1180 GRAND TOTAL MW UP TO 31.12.06 17995

Demand for Power and Generation Planning Working Group on Power for 11th Plan
Page 54 of Chapter1
Appendix-1.3
LIST OF POWER PROJECTS FOR BENEFITS DURING 10TH PLAN (Central, State & Private Sector)
SUMMARY
Plant Name ORIGINAL TARGET PRESENT STATUS
HYDRO 14393 8854
CENTRE 8742 4495 STATE 4481 3659
PRIVATE 1170 700
THERMAL 25417 20387
CENTRE 12790 10284 STATE 6676 7348
PRIVATE 5951 2755
NUCLEAR 1300 1400
TOTAL-ALL-INDIA 41110 30641
CENTRE 22832 16179 STATE 11157 11007
PRIVATE 7121 3455 NOTE:
1. PROJECTS AND FIGURES IN RED COLOR ARE THOSE SLIPPING FROM ORIGINAL TARGET OF 41,110 MW
2. PROJECTS AND FIGURES IN GREEN CLOUR ARE ADDITIONAL PROJECTS AND BENEFITS AS
PER MID TERM REVIEW
3. FIGURES IN BLUE ARE AS PER PRESENT STATUS IN NOVEMBER 2005
SOG-Sanctioned on Going C-Central Sector CEA- Cleared by CEA S-State Sector SC-State Cleared P-Private Sector NEW- Yet to be cleared JV-Joint Venture

Demand for Power and Generation Planning Working Group on Power for 11th Plan
Page 55 of Chapter 1
LIST OF POWER PROJECTS FOR BENEFITS DURING 10TH PLAN
(Central, State & Private Sector)
Plant Name Fuel Type Sector Capacity MW ORIGINAL TARGET
PRESENT STATUS
Likely date of commissioning
NORTHERN REGION CENTRAL SECTOR NHPC CHAMERA II HYDRO C 300 300 300 Commissioned DULHASTI HYDRO C 390 390 390 U 2-Feb 07,
U 1&3-Mar 07 DHAULI GANGA HYDRO C 280 280 280 Commissioned SEWA II HYDRO C 120 120 SUB-TOTAL (NHPC) 1090 1090 970 NJPC NATHPA JHAKRI HYDRO C 1500 1500 1500 Commissioned RAMPUR HYDRO C 400 400 SUB-TOTAL (NJPC) 1900 1900 1500 NTPC RIHAND II COAL C 1000 1000 1000 Commissioned UNCHAHAR III COAL C 210 210 210 Commissioned DADRI II COAL C 490 490 SUB-TOTAL (NTPC) 1700 1700 1210 NPC RAPP U-5 NUCLEAR C 220 0 SUB-TOTAL (NPC) 220 0 0 THDC TEHRI I HYDRO C 1000 1000 1000 U 2,3&4-
Commissioned U 1 -Mar 07
KOTESHWAR HYDRO C 400 400 0 TEHRI PSS PSTOR C 1000 1000 0 SUB-TOTAL (THDC) 2400 2400 1000 NLC BARSINGSAR LIGNITE C 500 250 TOTAL NR (CENTRAL SECTOR)
7590 7340 4680
STATE SECTOR DELHI PRAGATI (GT2 +ST) GAS S 225.78 225.78 225.78 Commissioned SUB TOTAL (DELHI) 225.78 225.78 225.78 HARYANA YAMUNANAGAR COAL S 600 0 PANIPAT U 7&8 COAL S 500 500 500 Commissioned SUB TOTAL (HARYANA) 1100 500 500

Demand for Power and Generation Planning Working Group on Power for 11th Plan
Page 56 of Chapter1
HP LARGI HYDRO S 126 126 126 Commissioned KASHANG -I HYDRO S 66 66 SUB TOTAL (HP) 192 192 126 J&K BAGHALIHAR HYDRO S 450 450 0 SUB TOTAL (J & K) 450 450 0 PUNJAB GHTPP-II COAL S 500 500 500 U 1-Mar 07
U 2- May 07* SHAHPURKANDI HYDRO S 168 168 SUB TOTAL (PUNJAB) 668 668 500 RAJASTHAN RAMGARH-2 GAS S 75.32 75.32 75.32 Commissioned DHOLPUR CCGT GAS S 330 220 GT 1&2-Mar 07
ST - Aug 07* GIRAL LIG U-1 LIGNITE S 125 125 February-07 MATAHANIA CCPP LNG S 140 140 KOTA TPS ST IV COAL S 195 195 195 Commissioned SURATGARH III COAL S 250 250 250 Commissioned SUB TOTAL (RAJASTHAN) 1115.3 660.32 865.32 UP PARICHHA EXTN COAL S 420 210 420 Commissioned ANPARA C COAL S 1000 500 0 SUB TOTAL (UP) 1420 710 420 UTTARANCHAL MANERIBHALI II HYDRO S 304 304 304 U 1 - Sep 07*
U 2 - Oct 07* U 3 - Nov 07* U 4 - Dec 07*
SUB TOTAL(UTTARANCHAL) 304 304 304 TOTAL NR (STATE SECTOR) 5475.1 3710.1 2941.1 PRIVATE SECTOR PUNJAB GOINDWAL SAHIB COAL P 500 500 0 SUB TOTAL (PUNJAB) 500 500 0 HP BASPA HYDRO P 300 300 300 Commissioned DHAMVARI SUNDA HYDRO P 70 70 SUB TOTAL (HP) P 370 370 300 UTTARANCHAL VISHNU PRAYAG HYDRO P 400 400 400 Commissioned SUB TOTAL (UTTARANCHAL) P 400 400 400 TOTAL NR PRIVATE SECTOR 1270 1270 700 TOTAL (NORTHERN REGION) 14335 12320.1 8321.1 * On best efforts being included in X Plan Capacity Addition

Demand for Power and Generation Planning Working Group on Power for 11th Plan
Page 57 of Chapter 1
WESTERN REGION CENTRAL SECTOR NPC TARAPUR U3&4 NUCLEAR C 1080 1080 1080 Commissioned NTPC SIPAT I COAL C 1980 1320 0 SIPAT II COAL C 660 660 0 SIPAT ST II U-4,5 COAL C 660 . 1000 U 4 - Mar 07
U 5 - May 07 VINDHYACHAL III COAL C 1000 500 1000 U 9 - Comm.
U 10 - Feb 07 GANDHAR CCGT GAS C 1300 March-07 KAWAS CCGT GAS C 1300 RATNAGIRI GAS (JV) LNG C 1444 1444 1444 740 MW-Comm.
704 MW-Mar 07 SUB TOTAL (NTPC) 4300 2480 3444 NHPC BAV-II HYDRO C 37 37 0 SUB TOTAL (NHPC) 37 37 0 NHDC OMKARESHWAR HYDRO JV 520 520 0 INDIRA SAGAR HYDRO JV 1000 1000 1000 Commissioned SUB TOTAL (NHDC) 1520 1520 1000 SUB TOTAL WR (CENTRAL SECTOR) 6937 5117 5524 STATE SECTOR GUJARAT SAR.SAROVAR-2 HYDRO S 1450 1450 1450 Commissioned AKRIMOTA LIGNITE S 250 250 250 Commissioned KLTPS EXTN(Panan) LIGNITE S 75 75 75 U 4 - July 07* DHUVRAN GAS S 112 112 GT-Comm.
ST- Feb 07 DHUVRAN GAS S 106.62 106.62 106.62 Commissioned SUB TOTAL (GUJARAT) 1993.6 1881.62 1993.62 MAHARASTRA GHATGHAR PSTOR S 250 250 250 U 1-May 07
U2-July 07* PARAS TPS EXT. U-I COAL S 250 250 PARLI TPP EX. ST-I COAL S 250 250 250 March-07 SUB TOTAL (MAHARASHTRA) 750 500 750 * On best efforts being included in X Plan Capacity Addition MP BIRSINGPUR EXT COAL S 500 500 500 U 5 - Feb 07 AMARKANTAK U-5 COAL S 210 0 BANSAGAR II HYDRO S 30 15 15 Commissioned BANSAGAR III HYDRO S 20 20 20 Commissioned MARIKHEDA HYDRO S 40 40 40 Commissioned
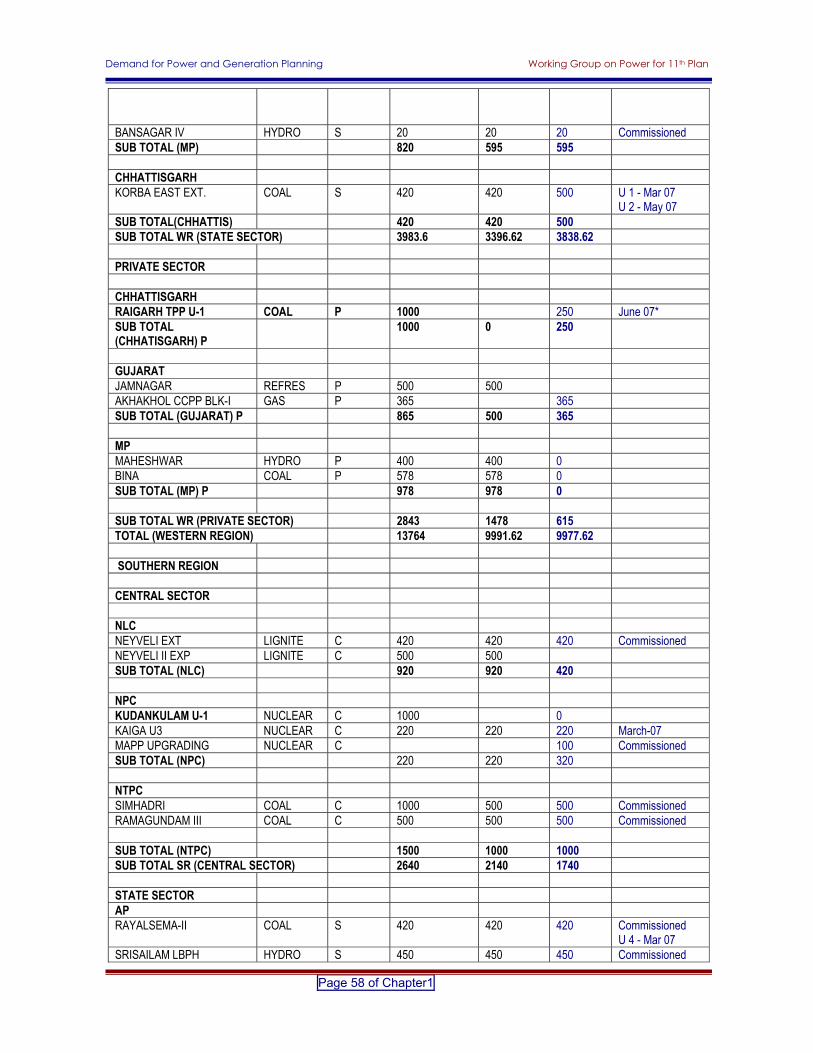
Demand for Power and Generation Planning Working Group on Power for 11th Plan
Page 58 of Chapter1
BANSAGAR IV HYDRO S 20 20 20 Commissioned SUB TOTAL (MP) 820 595 595 CHHATTISGARH KORBA EAST EXT. COAL S 420 420 500 U 1 - Mar 07
U 2 - May 07 SUB TOTAL(CHHATTIS) 420 420 500 SUB TOTAL WR (STATE SECTOR) 3983.6 3396.62 3838.62 PRIVATE SECTOR CHHATTISGARH RAIGARH TPP U-1 COAL P 1000 250 June 07* SUB TOTAL (CHHATISGARH) P
1000 0 250
GUJARAT JAMNAGAR REFRES P 500 500 AKHAKHOL CCPP BLK-I GAS P 365 365 SUB TOTAL (GUJARAT) P 865 500 365 MP MAHESHWAR HYDRO P 400 400 0 BINA COAL P 578 578 0 SUB TOTAL (MP) P 978 978 0 SUB TOTAL WR (PRIVATE SECTOR) 2843 1478 615 TOTAL (WESTERN REGION) 13764 9991.62 9977.62 SOUTHERN REGION CENTRAL SECTOR NLC NEYVELI EXT LIGNITE C 420 420 420 Commissioned NEYVELI II EXP LIGNITE C 500 500 SUB TOTAL (NLC) 920 920 420 NPC KUDANKULAM U-1 NUCLEAR C 1000 0 KAIGA U3 NUCLEAR C 220 220 220 March-07 MAPP UPGRADING NUCLEAR C 100 Commissioned SUB TOTAL (NPC) 220 220 320 NTPC SIMHADRI COAL C 1000 500 500 Commissioned RAMAGUNDAM III COAL C 500 500 500 Commissioned SUB TOTAL (NTPC) 1500 1000 1000 SUB TOTAL SR (CENTRAL SECTOR) 2640 2140 1740 STATE SECTOR AP RAYALSEMA-II COAL S 420 420 420 Commissioned
U 4 - Mar 07 SRISAILAM LBPH HYDRO S 450 450 450 Commissioned

Demand for Power and Generation Planning Working Group on Power for 11th Plan
Page 59 of Chapter 1
JURALA PRIYA HYDRO S 235 78.2 39 June 07* SUB TOTAL (AP) 1105 948.2 909 KARNATAKA RAICHUR U7 COAL S 210 210 210 Commissioned ALMATI DAM HYDRO S 290 290 290 Commissioned BELLARY COAL S 500 500 500 March-07 SUB TOTAL (KARNATAKA) 1000 1000 1000 KERALA KUTTIYADI AUG. HYDRO S 100 100 0 SUB TOTAL (KERALA) 100 100 0 TAMILNADU PYKARA ULTIMATE HYDRO S 150 150 150 Commissioned PERUNGULAM (VALUTHUR)
GAS S 94 94 94 Commissioned
BHAWANI KATHALAI 1&2 HYDRO S 90 90 30 KUTRALAM GAS GAS S 100 100 100 Commissioned SUB TOTAL (TAMILNADU) 434 434 374 * On best efforts being included in X Plan Capacity Addition PONDICHERRY KARAIKAL CCGT GAS S 100 100 SUB TOTAL SR (STATE SECTOR)
2739 2582.2 2283
PRIVATE SECTOR AP PEDDAPURAM CCGT GAS P 220 78 78 Commissioned VEMAGIRI-I GAS P 370 370 370 Commissioned GAUTAMI GAS P 464 464 464 GTs- Feb 07
ST - Mar 07 RAMGUNDAM BPL COAL P 520 520 JEGRUPADU-EXT 1 GAS P 230 230 220 Commissioned KONASEEMA GAS P 445 445 445 GT 1&2- Feb 07
ST - Mar 07 SUB TOTAL (AP) P 2249 2107 1577 KARNATAKA HASSAN LNG P 189 189 0 KANIMINKE CCPP NAPHTHA P 108 108 0 SUB TOTAL (KARNATAKA) P 297 297 0 TAMILNADU KURUPPUR GAS P 119.8 119.8 Commissioned VALENTHARAVAI GAS P 52.8 52.8 Commissioned NEYVELI ZERO LIGNITE P 250 250 250 Commissioned SUB TOTAL (TAMILNADU) P 422.6 250 422.6 SUB TOTAL SR (PRIVATE SECTOR) 2968.6 2654 1999.6 TOTAL (SOUTHERN REGION) 8347.6 7376.2 6022.6

Demand for Power and Generation Planning Working Group on Power for 11th Plan
Page 60 of Chapter1
EASTERN REGION CENTRAL SECTOR DVC MEZIA-U4 COAL C 210 210 210 Commissioned MEZIA-U5 COAL C 250 250 250 March-07 MEZIA-U6 COAL C 250 250 May 07* MAITHON-RBC COAL JV 1000 1000 CHANDRAPURA U7&8 COAL C 500 500 0 SUB TOTAL (DVC) 2210 1960 710 NHPC TEESTA V HYDRO C 510 510 0 PURLIA PSS PSTOR JV 900 900 225 March-07 TEESTA LOW DAM III HYDRO C 132 132 TEESTA LOW DAM IV HYDRO C 168 168 SUB TOTAL (NHPC) 1710 1710 225 NTPC TALCHER-II COAL C 2000 2000 2000 Commissioned NORTH K PURA COAL C 1980 660 KAHALGAON U-5,6&7 COAL C 1500 1500 U5 - Feb 07
U6 - Mar 07 U7 - Jun 07*
KAHALGAON II COAL C 1320 660 BARH COAL C 1980 660 SUB TOTAL (NTPC) 8780 3980 3500 SUB TOTAL ER (CENTRAL SECTOR) 12700 7650 4435 STATE SECTOR JHARKHAND TENUGHAT EXT COAL S 630 210 0 SUB TOTAL (JHAR) 630 210 0 ORISSA BALIMELA II HYDRO S 150 150 150 March-07 SUB TOTAL (ORISSA) 150 150 150 WEST BENGAL SAGARDIGHI-I COAL S 500 250 600 U 1 - Mar 07
U 2 - Apr 07 DPL EXTENSION COAL S 300 300 U 7 - Mar 07 SANTALDIH COAL S 250 250 June 07* BAKRESHWAR 4,5 COAL S 420 420 210 U 4 - Jul 07 SUB TOTAL (WB) 1470 670 1360 SUB TOTAL ER (STATE SECTOR) 2250 1030 1510 * On best efforts being included in X Plan Capacity Addition

Demand for Power and Generation Planning Working Group on Power for 11th Plan
Page 61 of Chapter 1
PRIVATE SECTOR BIHAR BIHTA TPS COAL P 135 135 0 SUB TOTAL (BIHAR) P 135 135 0 JHARKHAND JOJOBERA COAL P 120 120 120 Commissioned SUB TOTAL (JHAR) P 120 120 120 SUB TOTAL ER (PRIVATE SECTOR) 255 255 120 TOTAL (EASTERN REGION) 15205 8935 6065 NORTH EASTERN REGION NEEPCO TUIRIAL HYDRO C 60 60 KOPILI II HYDRO C 25 25 25 Commissioned TRIPURA GAS GAS C 500 500 0 SUB TOTAL (NEEPCO) 585 585 25 SUB TOTAL NER (CENTRAL SECTOR) 585 585 25 STATE SECTOR ASSAM KARBI LANGPI HYDRO S 100 100 100 Commissioned U2
- Feb 07 LAKWA WH GAS S 38 38 SUB TOTAL (ASSAM) 138 138 100 MEGHALAYA MYNTDU(LISKA) HYDRO S 84 84 BYRNIHAT HFO S 24 24 MENDIPATHAR HFO S 24 24 SUB TOTAL (MEGHALAYA) 132 132 0 MIZORAM BAIRABI (THERMAL) HFO S 22.92 22.92 22.92 Commissioned BAIRABI HYDRO HYDRO S 80 80 SUB TOTAL (MIZORAM) 102.92 102.92 22.92 NAGALAND DIMAPUR DGPP HFO S 22.9 0 SUB TOTAL (NAGALAND) 22.9 0 0 TRIPURA BARMURA GT GAS S 21 21 21 Commissioned ROKHIAU7 GAS S 21 21 42 Commissioned SUB TOTAL(TRIPURA) 42 42 63 MANIPUR MANIPUR DG DIESEL S 18 18 18 Commissioned SUB TOTAL NER (STATE SECTOR) 432.92 432.92 203.92 TOTAL (NORTH EASTERN REGION) 1017.9 1017.92 228.92

Demand for Power and Generation Planning Working Group on Power for 11th Plan
Page 62 of Chapter1
A&N ISLAND BAMBOO FLAT DIESEL P 20 20 20 Commissioned RANGIT BAY DIESEL S 5 5 6 Commissioned SUB TOTAL(A&N) 25 25 26 TOTAL (ALL INDIA) 52694 39665.84 30641.24

Demand for Power and Generation Planning Working Group on Power for 11th Plan
Page 63 of Chapter 1
Appendix-1.4
LIST OF PROJECTS LIKELY TO SLIP TO 11th (Due to constrains on BHEL side)
Project Name Total
Capacity Likely during
10th
Slipping to 11th
Likely date of Commissioning
Hydro Maneri Bhal-II 304 0 304 Sept.07-Dec.07 Ghatghar PSS 250 125 125 July-07 Jurala Priya 39 0 39 June 07 Balimela 150 0 150 May-07 Sub-total (Hy) 618 Thermal GHTPP-II 500 250 250 May ,07 Sipat II 1000 500 500 May-07 Kahalgaon-II 1500 500 500 June-07 Korba East Ext. 500 250 250 May-07 Raigarh 250 0 250 May-07 Bakreshwer U 4&5 210 0 210 July-07 Mejia U-5&6 500 250 250 May2007 Rayalseema 420 210 210 May2007 Bellary 500 0 500 April2007 Sagardighi 600 300 300 April2007 Santaldih 250 0 250 June2007 Kutch Lignite TPS 75 0 75 July 2007 Dholpur 220 110 110 August2007 GH TPP –II 250 0 250 May 2007 Kahalgaon 1500 500 500 June 2007 Dabhol-II 704 704 704 June 2007 Sub-total (Th) 5109 Total (Hy+Th.) 5727

Demand for Power and Generation Planning Working Group on Power for 11th Plan
Page 64 of Chapter1
Appendix 1.5
LIST OF UNITS DROPPED FROM 10th PLAN (41,110 MW) THERMAL PROJECTS Name of the Agency Name of the Project MW Rajasthan (RRECL) Mathania ISCC GTs+ST 140 Jharkand Tenughat TPP II Unit 3 210
Pondicherry Karaikal CCPP GT+ST 100
Meghalaya Byrnihat DGPP 24 Meghalaya Mendipathar DGPP 24
Bihar Bihta TPPU-1 135
Gujarat Jamnagar TPP U-!&2 2x250 500 Karnataka Hassan CCPP GT+ST 189 Karnataka Kaniminike CCPP GT+ST 107.6 M.P Bina TPP U-!&2 2x289 578 A.P Ramagundam TPP BPL U-!&2 520
SUB TOTAL THERMAL 2527.6 HYDRO PROJECTS
Name of the Agency NAME OF THE PROJECT MW
NHPC Bav II Maharashtra 37 NEEPCO Tuirial Mizoram 60 PIW/PSEB Shahpurkandi,Punjab 168 HPSEB Kashang – I 66 Dhamwari Power Dhamwari Sunda HEP 70 P&E Dept. Mizoram Bairabi Dam, Mizoram 80
SUB TOTAL HYDRO 481.0
GRAND TOTAL 3008.6

Demand for Power and Generation Planning Working Group on Power for 11th Plan
Page 65 of Chapter 1
Appendix 1.6
LIST OF THE THERMAL PROJECTS SLIPPING FROM 10th PLAN (41,110 MW) AND INCLUDED IN 11TH PLAN (As per 30,641 MW)
THERMAL PROJECTS:- Name of the Agency
Name of the Project IC (MW)
NTPC Barh STPP 660 Kahalgaon STPS Stage II Ph-I U-5 160
North Karanpura TPP U-1 660
Sipat STPP-I 2x660 U-1&2 1320
Dadri TPS 1x490 490
Sipat STPS II U-4 160
NLC Neyveli TPS II Exp 2*500 U-1&2 500
NLC Barsingsar lignite TPP U-1 250
DVC Maithon RBC TPP 4x250 U-1 to 4 1000
DVC Chandrapura TPS Extn. U-7&8 500
NEEPCO Monarchak CCPP GT+ST 500
UP. Anpara ( c ) TPS U-1 500
Assam ( ASEB)
Lakwa WH ST 38
West Bengal Bakreshwer TPS-II U-5 210
Punjab Goindwal TPP U-I&2 500 A.P. Jegurupadu CCPP EXT. GT 10 TOTAL 7458

Demand for Power and Generation Planning Working Group on Power for 11th Plan
Page 66 of Chapter1
Appendix 1.7
LIST OF HYDRO PROJECTS SLIPPING FROM 10th PLAN (41,110 MW)
AND INCLUDED IN 11TH PLAN (As per 30,641 MW)
Name of the Agency NAME OF THE PROJECT IC(MW)
NHPC Sewa –II J&K 120 NJPC Rampur (J.V.) 400 THDC Tehri St-.II (PSS) 1000
NHPC WB Teesta Low Dam -IV 168 *
NHPC/ WBPDCL Purlia PSS 675 NHDC Omkaresswer MP 390 Meghalaya Myntdu (Leiska) – I 84
SMHPC Maheshwar 400 A.P. Jurala Priya 39 Tamil Nadu Bhawani Kathalai 60 THDC Koteshwer THDC 400 TVL Teesta Low Dam III (IPP) 132 J&K Baglihar 450 Kerala Kuutiyadi Aug. 100 Sikkim Teesta -V 510 NHDC Omkareshwar 130 TOTAL HYDRO 5058
* capacity changed to 160 MW

Demand for Power and Generation Planning Working Group on Power for 11th Plan
COAL LIGNITE GAS
A. PROJECTS UNDER CONSTRUCTIONCENTRAL SECTOR 7633 7200 6450 750 0 3160 17993STATE SECTOR 2107 5852 5215 375 262 0 7959PRIVATE SECTOR 2191 3202 2450 0 752 0 5393ALL-INDIA 11931 16254 14115 1125 1014 3160 31345B. PROJECTS WHERE LOA IS YET TO BE PLACED (COMMITTED PROJECTS)CENTRAL SECTOR 2052 16610 15610 250 750 0 18662STATE SECTOR 530 14500 14150 0 350 0 15030PRIVATE SECTOR 1072 2760 2760 0 0 0 3832ALL-INDIA 3654 33870 32520 250 1100 0 37524
CENTRAL SECTOR 9685 23810 22060 1000 750 3160 36655STATE SECTOR 2637 20352 19365 375 612 0 22989PRIVATE SECTOR 3263 5962 5210 0 752 0 9225ALL-INDIA 15585 50124 46635 1375 2114 3160 68869
CENTRAL SECTOR 0 4190 4190 0 0 0 4190STATE SECTOR 0 3300 2300 1000 0 0 3300PRIVATE SECTOR 0 4055 4055 0 0 0 4055ALL-INDIA 0 11545 10545 1000 0 0 11545
CENTRAL SECTOR 9685 28000 26250 1000 750 3160 40845STATE SECTOR 2637 23652 21665 1375 612 0 26289PRIVATE SECTOR 3263 10017 9265 0 752 0 13280ALL-INDIA 15585 61669 57180 2375 2114 3160 80414
NUCLEAR TOTALHYDRO TOTAL THERMAL
THERMAL BREAKUP
Appendix 1.8
TOTAL SHELF OF PROJECTS
C. PROJECTS WITH BEST EFFORTS
TOTAL FEASIBLE AT PRESENT
SUMMARY OF CAPACITY ADDITION PROPOSED DURING 11TH PLAN
Page 67 of Chapter 1

Sl.No. PLANT NAME STATE AGENCY SECTOR
ULTIMATE
CAPACITY (MW)
TYPE BENEFITS
IN 11TH PLAN
2007-08
2008-09
2009-10
2010-11
2011-12 LOA DATE
EQUIPMENT ORDER
AGENCY
1 PARBATI - II HP NHPC C 800 ROR 800 400 400 SEPT,02 DEC,02 BHEL2 CHAMERA-III HP NHPC C 231 ROR 231 231 SEP, 05 JAN,07 ALSTOM3 PARBATI - III HP NHPC C 520 ROR 520 520 SEP,05 DEC,06 BHEL4 SEWA-II J&K NHPC C 120 ROR 120 120 SEPT, 03 JUNE,06 BHEL5 URI-II J&K NHPC C 240 ROR 240 240 SEPT,05 DEC,06 ALSTOM6 OMKARESHWAR MP NHDC C 520 ROR 520 520 JUNE, 03 JUNE,03 SIEMENS7 TEESTA V SIK NHPC C 510 ROR 510 510 DONE NOV,01 MITSUI 8 TEESTA LOW DAM-III WB NHPC C 132 ROR 132 132 OCT,03 JULY,04 VA TECH 9 TEESTA LOW DAM-IV WB NHPC C 160 ROR 160 160 DEC 05. MAR, 07
10 SUBANSIRI LOWER AR.PR. NHPC C 2000 STO 2000 2000 DEC,03 FEB,05 ALSTOM11 KOTESHWAR UKND THDC C 400 STO 400 400 AUG,02 MAR,03 BHEL12 KAMENG AR.PR. NEEPCO C 600 STO 600 600 DEC,04 DEC,04 BHEL13 KOL DAM HP NTPC C 800 STO 800 600 200 JUNE, 03 JULY,04 BHEL14 LOHARI NAGPALA UKND NTPC C 600 ROR 600 600 JULY,06 SEP.0715 UHL - III HP HPJVVNL S 100 ROR 100 100 SEPT.05 FEB,0716 BAGLIHAR-I J&K JKPDC S 450 ROR 450 450 DONE JULY,99 SIEMENS17 JURALA PRIYADARSHNI AP APGENCO S 234 STO 195 195 April, 04 MAR,04 CEMC, CHINA18 NAGARJUNA SAGAR TR AP APGENCO S 50 STO 50 50 MAY, 05 MAY,06 BHEL19 VARAHI EXTN. KAR KPCL S 230 ROR 230 230 NOV, 05 MAY,06 VA TECH 20 ATHIRAPALLI KERL KSEB S 163 ROR 163 163 MAY,05/ DEC,06 MAY,05 BHEL21 KUTAYADI EXT. KERL KSEB S 100 ROR 100 100 AWARDED OCT,03 BHEL22 BHAWANI BARRAGE II & III TN TNEB S 60 ROR 60 60 AWARDED NOV,0623 PURLIA PSS WB WBSEB S 900 PSS 675 675 JUNE, 01 JULY,2000 MITSUI 24 MYNTDU St-I MEGH MeSEB S 84 STO 84 84 MAR,04 NOV,05 VA TECH 25 BUDHIL HP LANCO IPP P 70 ROR 70 70 AWARDED JULY,06 DONGFANF ELC.
26 ALLAIN DUHANGAN HP RSWML P 192 ROR 192 192 NOV, 05 NOV,05 BHEL27 MALANA II HP EVREST PC P 100 ROR 100 100 JAN, 06 MAR,0728 KARCHAM WANGTOO HP JPKHCL P 1000 ROR 1000 1000 AWARDED MAR,0729 SRINAGAR UKND GVK P 330 ROR 330 330 MAR, 07 2007-0830 MAHESHWAR MP IPP P 400 STO 400 400 AWARDED 2007-0831 CHUJACHEN SIKKIM GATI P 99 ROR 99 99 AWARDED DEC,06 ALSTOM
12195 11931 2450 2328 1909 3314 1930
Appendix 1.8 (contd.)
SUB-TOTAL ( UNDER CONSTRUCTION)C: Central Sector; S: State Sector; P: Private Sector; ROR : Run of River; STO: Storage; PSS: Pumped Storage
LIST OF PROJECTS PROPOSED FOR LIKELY BENEFITS DURING 11TH PLAN --HYDRO
PROJECTS UNDER CONSTRUCTION
Page 68 of Chapter 1

Sl.No. PLANT NAME STATE AGENCY SECTOR
ULTIMATE
CAPACITY (MW)
TYPE BENEFITS
IN 11TH PLAN
2007-08
2008-09
2009-10
2010-11
2011-12 LOA DATE
EQUIPMENT ORDER
AGENCY
Appendix 1.8 (contd.)LIST OF PROJECTS PROPOSED FOR LIKELY BENEFITS DURING 11TH PLAN --HYDRO
1 RAMPUR HP SJVNL C 412 ROR 412 412 FEB, 072 TEHRI PSS UKND THDC C 1000 PSS 1000 500 500 JULY, 07 AUG,073 TAPOVAN VISHNUGARH UKND NTPC C 520 ROR 520 520 DEC,06 2007-084 VYASI UKND NHPC C 120 STO 120 120 JUNE,07 2008-095 SAWARA KUDDU HP PVC S 110 ROR 110 110 JUNE, 07 2007-086 PALLIVASAL KERL KSEB S 60 ROR 60 60 MAR, 07 2007-087 MANKULAM KERL KSEB S 40 STO 40 40 MAR, 07 2007-088 THOTTIAR KERL KSEB S 40 ROR 40 40 MAR, 07 2007-089 LOWER JURALA AP APGENCO S 240 STO 240 240 MAY, 07 2008-09
10 NEW UMTRU MEGH MeSEB S 40 ROR 40 40 MAR,07 2007-0811 LAMBADUG HP IPP P 25 ROR 25 25 MAR, 07 2008-0912 SORANG HP SORAND PC P 100 ROR 100 100 MAR, 07 2008-0913 TIDONG-I HP PCP/IPP P 100 ROR 100 100 JULY, 07 2007-0814 TANGU ROMAI HP PCP/IPP P 50 ROR 50 50 JULY, 07 2008-0915 UBDC- III PUN MALANA POWER P 75 ROR 75 75 JUNE,07 2007-0816 SADAMANDER SIK GATI P 71 ROR 71 71 JUNE, 07 2007-0817 BHASMEY SIK GATI P 51 ROR 51 51 SEP, 07 2007-0818 TEESTA III SIK TEESTA URJA P 1200 ROR 600 600 MAR, 07 FEB,07
4254 3654 0 0 146 1016 2492TOTAL FEASIBLE HYDRO PROJECTS 16449 15585 2450 2328 2055 4330 4422
Note: Orders in respect of Rampur HEP, 412 MW & Tapovan Vishnugarh HEP, 520 MW has been recently placed 11931 2450 2328 1909 3314 1930
3654 0 0 146 1016 249215585 2450 2328 2055 4330 4422
8981 1580 1244 1205 1390 35624929 195 1084 850 2440 3601675 675 0 0 500 500
15585 2450 2328 2055 4330 4422
SUMMARY
STATUS WISE DETAILS
TYPE WISE DETAILS
SUB-TOTAL ( COMMITTED)
C: Central Sector; S: State Sector; P: Private Sector; ROR : Run of River; STO: Storage; PSS: Pumped Storage
PROJECTS WHERE LOA IS YET TO BE PLACED
Page 69 of Chapter 1

Sl.No PLANT NAME STATE AGENCY SECTOR
ULTIMATE CAPACITY
(MW)TYPE
BENEFITS IN 11TH PLAN
2007-08 2008-09 2009-10 2010-11 2011-12COAL
LINKAGE STATUS
COAL COMPA
NY
LOA DATE (E&M
EQPT.)AGENCY
1 DADRI EXT(U-5) UP NTPC C 490 LC 490 490 LINKAGE CCL JUL,06 BHEL2 SIPAT I CHG NTPC C 1980 PH 1980 660 1320 LINKAGE SECL APR,04 KOREA+ RUSSIA
3 BHILAI JV CHG NTPC C 500 PH 500 500 LINKAGE SECL MAR, 05 BHEL4 KORBA III CHG NTPC C 500 PH 500 500 BLOCK MAR, 06 BHEL5 BARH-I BIH NTPC C 1980 PH 1980 660 660 660 LINKAGE CCL MAR, 05 RUSSIA6 FARAKKA STAGE-III WB NTPC C 500 PH 500 500 LINKAGE ECL OCT,06 BHEL7 CHANDRAPUR JHAR DVC C 500 PH 500 500 LINKAGE BCCL JUN,06 BHEL8 BARSINGSAR LIG RAJ NLC C 250 PH-LIG 250 250 LIGNITE DEC,05 BHEL9 NEYVELI - II LIG TN NLC C 500 PH-LIG 500 500 LIGNITE AUG,05 BHEL
10 YAMUNA NAGAR HAR HPGCL S 600 LC 600 600 LINKAGE CCL AUG,05 CHINA11 GIRAL U-2 RAJ RRVUNL S 125 PH-LIG 125 125 LIGNITE NOV,05 BHEL12 CHABRA TPS RAJ RRVUNL S 500 LC 500 500 LINKAGE SECL MAR,06 BHEL13 KOTA U7 RAJ RRVUNL S 195 LC 195 195 LINKAGE SECL JUN, 06 BHEL14 SURATGARH EXT RAJ RRVUNL S 250 LC 250 250 LINKAGE SECL AUG,06 BHEL15 DHOLPUR RAJ RRVUNL S 330 GAS/LNG 110 110 JUN,04 BHEL16 PARICHHA EXT UP UPRVUNL S 500 LC 500 500 LINKAGE BCCL JUN,06 BHEL17 HARDUAGANJ UP UPRVUNL S 500 LC 500 500 LINKAGE CCL JUN,06 BHEL18 SURAT LIGNITE EXT GUJ GIPCL S 250 PH-LIG 250 250 LIGNITE MAR,06 BHEL19 AMARKANTAK MP MPGENCO S 210 LC 210 210 LINKAGE SECL JUN, 04 BHEL20 PARLI EXT U-2 MAH MAHA GEN S 250 LC 250 250 LINKAGE MCL AUG, 06 BHEL21 PARAS EXT U-2 MAH MAHA GEN S 250 LC 250 250 LINKAGE MCL AUG, 06 BHEL22 KAKTIYA AP APGENCO S 500 LC 500 500 LINKAGE SECL JUL, 05 BHEL23 VIJAYWADA TPP AP APGENCO S 500 LC 500 500 LINKAGE MCL JUL, 05 BHEL24 BELLARY TPS U-2 KAR KPCL S 500 LC 500 500 LINKAGE REQUIRED AUG, 06 BHEL25 RAICHUR U 8 KAR KPCL S 250 LC 250 250 LINKAGE MCL SEP, 06 BHEL26 VALUTHUR EXT TN TNEB S 92 GAS/LNG 92 92.2 MAY, 06 GEA ENERGY
27 BAKRESHWAR U-5 WB WBPDCL S 210 LC 210 210 LINKAGE ECL NOV.04 BHEL+JAPAN28 LAKWA WH ASM ASGENCO S 37.2 GAS/LNG 37.2 37.2 MAR, 06 BHEL29 DIMAPUR DG NAG ELECT.DEPT. S 23 GAS/LNG 23 23 JUL, 03 BHEL30 RAIGARH PH II CHG JIN. POWER P 750 PH 750 750 BLOCK JUN, 04 BHEL31 PATHADI (LANCO) U1 CHG LANCO-IPP P 300 PH 300 300 LINKAGE SECL JUL, 05 CHINA32 PATHADI (LANCO) U2 CHG LANCO-IPP P 300 PH 300 300 LINKAGE SECL JUL, 05 CHINA33 SUGEN TORRENT GUJ TORRENT P 1128 GAS/LNG 752 752 JUN, 05 SIEMENS34 TROMBAY TPS MAH TATAPOWER P 250 LC 250 250 IMPORTED COAL JUL, 06 BHEL35 TORANGALLU KAR JINDAL P 600 LC 600 300 300 IMPORTED COAL JUN,06 CHINA36 BUDGE-BUDGE EXT WB CESC P 250 LC 250 250 BLOCK REQUIREDSEP, 06 BHEL
16850 16254 4407 6387 4500 960 0
Appendix 1.8 (contd)LIST OF PROJECTS PROPOSED FOR LIKELY BENEFITS DURING 11TH PLAN --THERMAL
C: Central Sector; S: State Sector; P: Private Sector; LC: Load Center; PH: Pit Head; PH-LIG: Lignite basedSUB-TOTAL ( UNDER CONSTRUCTION)
PROJECTS UNDER CONSTRUCTION
Page 70 of Chapter 1

Sl.No PLANT NAME STATE AGENCY SECTOR
ULTIMATE CAPACITY
(MW)TYPE
BENEFITS IN 11TH PLAN
2007-08 2008-09 2009-10 2010-11 2011-12COAL
LINKAGE STATUS
COAL COMPA
NY
LOA DATE (E&M
EQPT.)AGENCY
Appendix 1.8 (contd)LIST OF PROJECTS PROPOSED FOR LIKELY BENEFITS DURING 11TH PLAN --THERMAL
1 BADARPUR-X DELHI NTPC C 980 LC 980 490 490 LINKAGE MCL FEB,072 DADRI EXT(U-6) UP NTPC C 490 LC 490 490 LINKAGE CCL DEC, 06 BHEL3 TPS for DELHI/JHAJJAR HAR NTPC C 1500 LC 1500 500 1000 LINKAGE MCL FEB,074 MAUDA MAH NTPC C 1000 PH 1000 1000 LINKAGE MCL NOV,075 SIMHADRI-EXT AP NTPC C 1000 COASTAL 1000 500 500 LINKAGE MCL JUN,076 ENNORE-JV TN NTPC C 1000 COASTAL 1000 500 500 LINKAGE MCL JUN,077 BARH II BIH NTPC C 1320 PH 1320 1320 BLOCK MAY,078 NABINAGAR BIH NTPC C 1000 PH 750 250 500 LINKAGE CCL JAN,089 NORTH K PURA JHAR NTPC C 1320 PH 1320 1320 LINKAGE CCL OCT,07
10 BONGAIGAON ASM NTPC C 750 LC 750 500 250 LINKAGE NEC/ECL AUG,0711 MEJIA PH II (DELHI) WB DVC C 1000 PH 1000 500 500 BLOCK DEC, 06. BHEL
12 BOKARO REPLACEMENT (DELHI) JHAR DVC C 500 PH 500 500 LINKAGE CCL FEB,07
13 KODERMA U1&2 (DELHI) JHAR DVC C 1000 PH 1000 1000 LINKAGE MCL FEB,0714 DURGAPUR STEEL WB DVC C 1000 PH 1000 500 500 LINKAGE ECL AUG,0715 MAITHAN RBC JHAR DVC C 1000 PH 1000 500 500 LINKAGE BCCL FEB,0716 BARSINGSAR EXT RAJ NLC C 250 PH-LIG 250 250 LIGNITE JUL,0817 TUTICORIN JV TN NLC C 1000 COASTAL 1000 500 500 LINKAGE MCL DEC,0718 TRIPURA GAS ILFS TRI ONGC C 750 GAS/LNG 750 750 JUN,0719 HISSAR TPS I HAR HPGCL S 500 LC 500 250 250 LINKAGE MCL MAR,0720 HISSAR TPS II HAR HPGCL S 500 LC 500 500 LINKAGE MCL JUN,0821 TALWANDI SABO PUN PSEB S 1500 LC 500 500 LINKAGE REQUIRED JAN,0822 KALISINDH TPS RAJ RRVUNL S 1000 LC 500 500 BLOCK REQUIRED JAN,0823 ANPARA-D UP UPRVUNL S 1000 PH 1000 1000 LINKAGE REQUIRED JAN,0824 OBRA REP UP UPRVUNL S 1000 PH 500 500 LINKAGE REQUIRED JAN,0825 KORBA WEST EXT CHG CSEB S 600 PH 600 600 LINKAGE SECL FEB,0726 UTRAN GUJ GSECL S 350 GAS/LNG 350 350 FEB,0727 SIKKA EXT GUJ GSECL S 500 COASTAL 500 500 IMPORTED COAL OCT,0728 UKAI EXT GUJ GSECL S 500 LC 500 500 LINKAGE REQUIRED JAN,0829 KHAPER KHEDA EX MAH MAHA GEN S 500 LC 500 500 LINKAGE MCL FEB,0730 BHUSAWAL MAH MAHA GEN S 1000 LC 1000 1000 LINKAGE MCL JUN,0731 KORADI REP& OTHERS MAH MAHA GEN S 585 LC 500 500 LINKAGE JUN,0732 KORADI EXT MAH MAHA GEN S 1000 LC 1000 1000 LINKAGE REQUIRED JAN,0833 CHANDRAPUR MAH MAHA GEN S 500 PH 500 500 BLOCK FEB,0734 MALWA MP MPGENCO S 1000 LC 1000 1000 LINKAGE SECL JUN,0735 SATPURA EXT MP MPGENCO S 500 LC 500 500 LINKAGE REQUIRED JAN,0836 KOTHAGUDEM ST-V AP APGENCO S 500 PH 500 500 LINKAGE MCL FEB,07
PROJECTS WHERE LOA IS YET TO BE PLACED
Page 71 of Chapter 1

Sl.No PLANT NAME STATE AGENCY SECTOR
ULTIMATE CAPACITY
(MW)TYPE
BENEFITS IN 11TH PLAN
2007-08 2008-09 2009-10 2010-11 2011-12COAL
LINKAGE STATUS
COAL COMPA
NY
LOA DATE (E&M
EQPT.)AGENCY
Appendix 1.8 (contd)LIST OF PROJECTS PROPOSED FOR LIKELY BENEFITS DURING 11TH PLAN --THERMAL
37 KRISHNAPATNAM AP APGENCO S 1600 COASTAL 800 800 LINKAGE MCL DEC,0738 KAKATIYA EXT AP APGENCO S 500 LC 500 500 BLOCK JAN,0839 NORTH CHENNAI EXT TN TNEB S 500 LC 500 500 LINKAGE MCL AUG,0740 METTUR EXT TN TNEB S 500 LC 500 500 LINKAGE MCL MAR,0741 SAGARDIGHI EXT WB WBPDCL S 1000 LC 1000 500 500 BLOCK REQUIRED DEC,0742 SANTHALDIH EXT (U 6) WB WBPDCL S 250 LC 250 250 BLOCK REQUIRED FEB,0743 GOINDWAL SAHIB PUN GVK P 600 LC 600 600 BLOCK JAN,0844 ANPARA-C UP LANCO P 1000 PH 1000 500 500 LINKAGE NCL NOV,0745 BARA UP IPP P 1000 LC 500 500 BLOCK REQUIRED JAN,0846 ULTRA MEGA SASAN MP LANCO P 3960 LC 660 660 BLOCK JAN,08
40805 33870 0 350 5830 10740 1695057655 50124 4407 6737 10330 11700 16950
16254 4407 6387 4500 960 0
33870 0 350 5830 10740 16950
50124 4407 6737 10330 11700 169508060 660 1980 660 660 4100
26460 0 1000 5470 8990 110003000 600 300 1200 300 6009615 2170 2445 2250 1500 1250
875 0 625 0 250 02114 977 387 750 0 0
50124 4407 6737 10330 11700 1695020300 2410 2280 4560 4410 664022035 1020 2945 5020 5040 8010
4300 0 0 0 2000 2300
46635 3430 5225 9580 11450 16950
32455 2680 4975 7280 9150 8370
4500 0 0 500 0 4000
5830 750 0 1000 1000 3080
2500 0 0 500 500 1500
1350 0 250 300 800 0
46635 3430 5225 9580 11450 16950
PH
300210/250110/125
Gas
LINKAGE AVAILABLE
LINKAGE REQUIRED
BLOCK ALLOTED
BLOCK REQUIRED
IMPORTED COAL
TOTAL COAL
SUMMARY OF THERMAL CAPACITY ADDITION
UNDER CONSTRUCTION
LOA TO BE PLACED
TOTAL FEASIBLE
TOTAL FEASIBLE
TOTAL FEASIBLE THERMAL PROJECTS C: Central Sector; S: State Sector; P: Private Sector; LC: Load Center; PH: Pit Head; PH-LIG: Lignite based; COASTAL : Coastal Stations
SUB-TOTAL ( COMMITTED)
Note: Orders in respect of Dadri Ext (U 6), Mezia PH II ,Bhusawal,Khaperkheda Ext,Kothagudem and Hissar has been recently placed
500
UNIT SIZE GROUP WISE DETAILS
STATUS WISE DETAILS
660/800
TYPE WISE DETAILS OF COAL
PLANTS
STATUS OF COAL AVAILABILITY
LCCOASTAL
TOTAL COAL
Page 72 of Chapter 1

Sl.No PLANT NAME STATE AGENCY SECTOR
ULTIMATE CAPACITY
(MW)TYPE
BENEFITS IN 11TH PLAN
2007-08 2008-09 2009-10 2010-11 2011-12COAL
LINKAGE STATUS
COAL COMPA
NY
LOA DATE (E&M
EQPT.)AGENCY
Appendix 1.8 (contd)LIST OF PROJECTS PROPOSED FOR LIKELY BENEFITS DURING 11TH PLAN --THERMAL
1 RIHAND-X UP NTPC C 500 PH 500 500 LINKAGE REQUIRED DEC,072 NORTH K PURA JHAR NTPC C 660 PH 660 660 LINKAGE CCL AUG,07
3 INTEGRATED PROJECT DARIPALI ORS NTPC C 3200 PH 800 800 BLOCK SEP,07
4 NABINAGAR BIH NTPC C 1000 PH 250 250 LINKAGE CCL JAN,085 BOKARO STEEL JHAR DVC C 500 PH 500 500 LINKAGE REQUIRED JUN,076 RAGHUNATH PUR WB DVC C 1000 PH 1000 1000 BLOCK REQUIREDDEC,077 MARGHERITA ASSAM NEEPCO C 480 PH 480 480 LINKAGE REQUIRED JAN, 088 CHHABRA II RAJ RRVUNL S 500 LC 500 500 BLOCK REQUIREDJAN, 089 GUJARAT LIGNITE GUJARAT NLC JV S 1000 PH-LIG 1000 1000 LIGNITE JAN, 08
10 DPL TPS U7A WB WBPDCL S 300 LC 300 300 BLOCK REQUIREDAUG,0711 DPL TPS U8 WB WBPDCL S 500 LC 500 500 BLOCK REQUIREDOCT,0712 BAKRESHWAR EXT WB WBPDCL S 500 LC 500 500 BLOCK REQUIREDJAN,0913 MUZAFFARPUR EXT BIHAR SHALI POW S 500 LC 500 500 LINKAGE REQUIRED JAN, 0814 ROSA UP OSA POWE P 600 PH 600 600 LINKAGE REQUIRED JAN, 0815 BHAIYATHAN CHG IPP P 1600 PH 800 800 BLOCK JUN,0716 LANCO NAGARJUNA KAR NPCL-IPP P 1015 COASTAL 1015 1015 IMPORTED COAL FEB, 0717 HALDIA PH I WB CESC P 600 LC 600 600 LINKAGE REQUIRED SEP, 0818 MALAXMI ORISSA NAVABH
ARAT P 1040 PH 1040 1040 JAN,0815495 11545 0 0 0 0 11545
1 Yamuna Nagar EXT HAR S 300 300 Linkage Required JUN,072 Jhajjar TPS (Case 2) HAR P 1200 1200 Linkage Required3 Shankargarh U P P 1000 1000 Block Required4 Dopaha U P P 1000 1000 Block Required5 Chhabra III RAJ P 500 500 Block Required6 Kawai RAJ P 1000 1000 Block Required7 Dopawe MAH P 1600 1600 Imported Coal8 Marwa TPS CHG S 1500 1500 Block Available SEP,079 Korba South CHG S 1000 1000 Linkage Required
10 Godhna CHG S 2000 2000 Linkage Required11 Ennore EXP TN S 500 500 Linkage Required12 Tuticorin Ext TN S 1000 1000 Linkage Required DEC,0713 Cuddalore TN P 2000 1000 Imported Coal14 Kudgi KAR S 1000 1000 Block Requitred DEC,0715 Barauni TPS BIH S 500 500 Linkage Required
16100 15100 0 0 0 0 0C: Central Sector; S: State Sector; P: Private Sector; LC: Load Center; PH: Pit Head; PH-LIG: Lignite based; COASTAL : Coastal Stations
SUB-TOTAL ( ADDITIONAL IDENTIFIED)
SUB-TOTAL ( BEST EFFORTS)ADDITIONAL PROJECT IDENTIFIED BY STATES
PROJECTS UNDER BEST EFFORTS
LINKAGE (2.404 MT);
Page 73 of Chapter 1

Sl.No. PLANT NAME STATE AGENCY SECTOR NO.OF UNITS
UNIT SIZE
ULTIMATE CAPACITY
(MW)TYPE
BENEFITS IN 11th PLAN (2007-12)
2007-08 2008-09 2009-10 2010-11 2011-12
1 RAPP U5&6 RAJ NPC C 2 220 440 PHWR 440 220 2202 KUDANKULAM U 1,2 TN NPC C 2 1000 2000 LWR 2000 1000 10003 PFBR(Kalapakkam) TN NPC C 1 500 500 FBR 500 5004 KAIGA U-4 KAR NPC C 2 220 440 PHWR 220 220
TOTAL NUCLEAR(UNDER CONSTRUCTION) 7 3380 3160 1440 1220 0 500 0
11931 2450 2328 1909 3314 1930
3654 0 0 146 1016 2492
15585 2450 2328 2055 4330 4422
16254 4407 6387 4500 960 0
33870 0 350 5830 10740 1695050124 4407 6737 10330 11700 16950
3160 1440 1220 0 500 0
31345 8297 9935 6409 4774 1930
37524 0 350 5976 11756 19442
68869 8297 10285 12385 16530 21372
Appendix 1.8 (contd.)
TYPE WISE STATUS WISE SUMMARY
C: Central Sector
LOA TO BE PLACED
FEASIBLE
PROJECTS UNDER CONSTRUCTION
LIST OF PROJECTS PROPOSED FOR LIKELY BENEFITS DURING 11TH PLAN -NUCLEAR
UNDER CONSTRUCTION
UNDER CONSTRUCTION
FEASIBLE
HYDRO LOA TO BE PLACED
THERMAL
UNDER CONSTRUCTION
UNDER CONSTRUCTION
TOTAL
NUCLEAR
LOA TO BE PLACED
TOTAL FEASIBLE
Page 74 of Chapter 1

2006-07
Programme 2007-08 2008-09 2009-10 2010-11 2011-12 2012-13
63490 63490 63490 63490 63490 63490 63490
PLF(%) 76.0 76.0 77.0 77.0 77.0 77.0 77.0
GENERATION 422.7 422.7 428.3 428.3 428.3 428.3 428.3
8950 3430 5225 9580 11450 16950 0
0 0 0 0 527.5 259
PLF(%) 85 85 85 85 85 85 85
GENERATION 26.7 76.9 107.7 159.6 232.6 336.2 413.9
72440 75870 81095 90675 101597.5 118816 118816
449.3 499.5 536.0 587.9 660.8 764.5 842.1
319.0 349.7 375.2 411.5 462.6 535.1 589.5
3.2 3.5 3.8 4.1 4.6 5.4 5.9
17.7 19.4 20.8 22.8 25.6 29.6 32.6
7.2 1.7 1.4 2.0 2.8 4.0 3.0
329.4 354.9 380.4 417.6 470.0 544.5 598.4
1.Total installed capacity of coal fired stations at the end of 2011-12 = 1,18,816 MW
2. Requirement of coal in the year 2011-12 for the coal fired capacity indicated above = 545 MT
3.The above assumes only 40% generation from the new capacity addition during the year .
4.The requirement of coal for the total installed capacity of 1,18,816 MW at the end of 11th plan ,in the year first year of 12th plan i.e.2012-13 would be about 600 MT
Note:
5. Any new capacity addition during the year 2012-13 shall need additional coal
YEAR-WISE COAL REQUIREMENT FOR 11th PLAN (tentative)-Utilities
ADDITIONS
RETIREMENTS
TOTAL INSTALLED CAPACITY
TOTAL GENERATION(BU)
COAL REQUIREMENT (Million Tons)
INSTALLED CAPACITY(MW)
Appendix 1.9
ADDITIONAL STOCK
CUMULATIVE STOCK
TOTAL COAL REQUIREMENT
11th Plan details
TRANSIT LOSS @ 1%
EXISTING CAPACITY
Page 75 of Chapter 1

Appendix 1.10
TypeBest Effort Projects of 11th plan
12th Plan Projects
(MW)
Total Shelf of Projects (MW)
Hydro 0 40658 40658Thermal 11545 102473 114018
Coal 10545 83640 94185Lignite 1000 3250 4250
Gas/LNG 15583 15583Nuclear 12800 12800Total 11545 155931 167476
Shelf of Projects for Likely benefits during 12th plan
Page 76 of Chapter 1

Appendix 1.10 (contd)
Sl. No Name of scheme State Agency Sector Type IC (MW)
Likely Benefit in 12th Plan
(MW)1 Bharmour H P IPP P ROR 45 452 Bajoli Holi H P IPP P ROR 180 1803 Chirgaon (Majhgaon) H P HPSEB S ROR 46 464 Dhaula Sidh H P IPP P ROR 40 405 Dhamvari Sunda H P HPSEB S ROR 70 706 Harsar H P IPP P ROR 60 607 Jhangi Thopan H P IPP P ROR 480 4808 Kutehr H P IPP P ROR 260 2609 Kashang-II H P HPSEB S ROR 60 60
10 Luhri H P SJVNL C ROR 770 77011 Pudital Lassa H P IPP P STO 36 3612 Renuka Dam H P HPSEB S STO 40 4013 Sainj H P HPSEB S ROR 100 10014 Tidong-II H P IPP P ROR 70 7015 Thopan Powari H P IPP P ROR 480 48016 Kashang - I & III H P HPJVVNL S ROR 195 19517 Shongtong Karcham H P HPSEB S ROR 402 40218 Nimoo Bazgo J & K NHPC C ROR 45 4519 Chutak J & K NHPC C ROR 44 4420 Baglihar-II J & K PDC S ROR 450 45021 Kiru J & K To be decided To be decided ROR 600 60022 Kishan Ganga J & K NHPC C STO 330 33023 Kawar J & K To be decided To be decided ROR 320 32024 Parnai J & K PDC S ROR 37.5 37.525 Pakhal Dul J & K NHPC C STO 1000 100026 Ratle J & K To be decided To be decided ROR 560 56027 Sawalkot J & K PDC S ROR 1200 120028 Kotli Bhel I A UKND NHPC C ROR 195 19529 Kotli Bhel I B UKND NHPC C ROR 320 32030 Kotli Bhel II UKND NHPC C ROR 530 53031 Lata Tapovan UKND NTPC C ROR 171 17132 Vishnugad Pipalkoti UKND THDC C ROR 444 44433 Arkot Tiuni UKND UJVNL S ROR 70 7034 Alaknanda (Badrinath) UKND IPP P ROR 140 14035 Bogadiyar Sirkari Bhyal UKND IPP P ROR 170 17036 Mapang Bogudiyar UKND IPP P ROR 200 20037 Bowala Nand Prayag UKND UJVNL S ROR 132 13238 Devsari Dam UKND SJVNL C STO 690 69039 Hanol Tiuni UKND IPP P ROR 42 4240 Jakhol Sankari UKND SJVNL C ROR 33 3341 Jelam Tamak UKND THDC C ROR 60 6042 Lakhwar UKND NHPC C STO 300 30043 Maleri Jhelam UKND THDC C ROR 55 5544 Mori Hanol UKND IPP P ROR 60 6045 Nand Prayag Lingasu UKND UJVNL S ROR 141 14146 Naitwar Mori (Dewra Mori) UKND SJVNL C ROR 33 3347 Pala Maneri UKND UJVNL S ROR 480 48048 Rupsiyabagar Khasiyabara UKND NTPC C ROR 260 26049 Sirkari Bhyal Rupsiabagar UKND UJVNL S ROR 210 21050 Singoli Bhatwari UKND IPP P ROR 60 60
SHELF OF HYDRO PROJECTS FOR LIKELY BENEFITS DURING 12 th PLAN
Page 77 of Chapter 1

Appendix 1.10 (contd)
Sl. No Name of scheme State Agency Sector Type IC (MW)
Likely Benefit in 12th Plan
(MW)
SHELF OF HYDRO PROJECTS FOR LIKELY BENEFITS DURING 12 th PLAN
51 Tamak Lata UKND UJVNL S ROR 280 28052 Taluka Sankri UKND UJVNL S ROR 140 14053 Tuini Plasu UKND UJVNL S ROR 42 4254 Dhauli Ganga Intermediate UKND NHPC C ROR 210 21055 Gauri Ganga St III-A UKND NHPC C ROR 120 12056 Shahpur Kandi PUN PSEB S STO 168 16857 Hoshangabad MP NHDC C ROR 60 6058 Handia MP NHDC C ROR 51 5159 Borus MP NHDC C ROR 55 5560 Matnar CHG CSEB S ROR 60 6061 Dummugudem A P APID S STO 320 32062 Pollavaram MPP A P APID S STO 960 96063 Chinnar KERL KSEB S ROR 28 2864 Achenkovil KERL KSEB S STO 30 3065 Kundah PSS T N TNEB S PSS 500 50066 Gundia KAR KPCL S ROR 400 40067 Ramam St-III W B NTPC C ROR 120 12068 Ramam St-I W B WBSEB S ROR 36 3669 Panan SIK IPP P ROR 280 28070 Dikchu SIK IPP P ROR 96 9671 Rolep SIK IPP P ROR 60 6072 Rangit-II SIK IPP P ROR 60 6073 Rangit-IV SIK IPP P ROR 120 12074 Lachen SIK NHPC C ROR 210 21075 Rangyong SIK IPP P ROR 80 8076 Rukel SIK IPP P ROR 33 3377 Rongnichu SIK IPP P STO 96 9678 Teesta St.-I SIK IPP P ROR 280 28079 Teesta St.-II SIK IPP P ROR 480 48080 Teesta St.-IV SIK NHPC C ROR 495 49581 Teesta-VI SIK IPP P ROR 500 50082 Teesta-III SIK Teesta Urja P ROR 1200 60083 Pare Ar Pr NEEPCO C STO 110 11084 Siang Middle (Siyom) Ar Pr IPP P STO 1000 100085 Dibbin Ar Pr To be decided To be decided ROR 100 10086 Badao Ar Pr To be decided To be decided ROR 60 6087 Kapak Leyak Ar Pr To be decided To be decided ROR 160 16088 Talong Ar Pr To be decided To be decided STO 160 16089 Etalin Ar Pr NTPC C STO 4000 400090 Attunli Ar Pr NTPC C ROR 500 50091 Siang Lower Ar Pr IPP P STO 1600 160092 Nyamjunchhu St-I Ar Pr IPP P ROR 98 9893 Nyamjunchhu St-II Ar Pr IPP P ROR 97 9794 Nyamjunchhu St-III Ar Pr IPP P ROR 95 9595 Dibang (Joint venture) Ar Pr NHPC C STO 3000 300096 Tawang-II Ar Pr NHPC C STO 750 75097 Tawang-I Ar Pr NHPC C STO 750 75098 Lohit Ar Pr To be decided To be decided STO 3000 300099 Subansiri Upper Ar Pr NHPC C STO 2000 2000100 Subansiri Middle Ar Pr NHPC C STO 1600 1600
Page 78 of Chapter 1

Appendix 1.10 (contd)
Sl. No Name of scheme State Agency Sector Type IC (MW)
Likely Benefit in 12th Plan
(MW)
SHELF OF HYDRO PROJECTS FOR LIKELY BENEFITS DURING 12 th PLAN
101 Lower Kopili ASM AGENCO S ROR 150 150102 Upper Borpani ASM AGENCO S ROR 60 60103 Tipaimukh MANI NEEPCO C STO 1500 1500104 Umiam Umtru-V MEGH MeSEB S ROR 36 36105 Ganol MEGH MeSEB S ROR 25 25106 Mawhu MEGH NEEPCO C ROR 120 120
TOTAL 40657.50Note: C: Central Sector; S: State Sector; P: Private Sector; ROR: Run of River; STO: Storage
Page 79 of Chapter 1

S.NO NAME STATE AGENCYULTIMATE CAPACITY
(MW)
LIKELY BENEFITS IN 12th PLAN (MW)
1 YAMUNANAGAR EXT HAR HRVUNL 300 3002 JHAJJAR HAR IPP 1200 12003 TALWANDI SABO PUN PSEB 1500 10004 NABHA PUN PSEB 1000 10005 LEHRA GHAGGAR PUN PSEB 1000 10006 CHHABRA II @ RAJ RRVUNL 500 5007 CHHABRA III RAJ IPP 500 5008 KALISINDH TPS RAJ RRVUNL 1000 5009 KAWAI RAJ IPP 1000 1000
10 JALIPA/ KAPURDI- LIGNITE RAJ IPP 1000 100011 RIHAND EXT@ U P NTPC 500 50012 MAYURPUR (SONEBHADRA) U P UPRVUNL 2000 200013 ROSA @ U P ROSA P.C. 600 60014 BARA TPS U P UPRVUNL 1000 50015 OBRA REPLACEMENT U P UPRVUNL 1000 50016 SHANKARGARH U P IPP 1000 100017 DOPAHA U P IPP 1000 100018 ULTRA MEGA AKALTARA CHG IPP 4000 400019 INTEGRATED PROJECT LARA CHG NTPC 4000 400020 BHAIYATHAN @ CHG IPP 1600 160021 MARWA CHG CSEB 1500 150022 KORBA SOUTH CHG CSEB 1000 100023 GODHANA CHG CSEB 2000 200024 ULTRA MEGA MUNDRA GUJ IPP 4000 400025 BHAVNAGAR LIGNITE GUJ NIRMA 250 25026 GUJARAT LIGNITE @ GUJ NLC 1000 100027 PIPAVAV POWER PROJECT GUJ GPCL JV 900 90028 ULTRA MEGA GIRYE MAH IPP 4000 400029 DOPAWE MAH IPP 1600 160030 ULTRA MEGA SASAN MP LANCO 3960 330031 SHAHPUR BHITONI MP MPGEN 1000 100032 ULTRA MEGA KRISHNAPATNAMA P IPP 4000 400033 KRISHNAPATNAM A P APGENCO 1600 80034 LANCO NAGARJUNA @ KAR IPP 1015 101535 ULTRA MEGA TADRI KAR IPP 4000 4000
SHELF OF COAL AND LIGNITE BASED PROJECTS FOR LIKELY BENEFITS DURING 12th PLAN
Appendix 1.10 (contd)
Page 80 of Chapter 1

S.NO NAME STATE AGENCYULTIMATE CAPACITY
(MW)
LIKELY BENEFITS IN 12th PLAN (MW)
SHELF OF COAL AND LIGNITE BASED PROJECTS FOR LIKELY BENEFITS DURING 12th PLAN
Appendix 1.10 (contd)
36 RAICHUR NEW KAR KPCL 1000 100037 KOWSHIKA TPP KAR KPCL 1000 100038 KUDGI TPP KAR KPCL 1000 100039 NANDUR TPP KAR KPCL 1000 100040 NEYVELI III LIGNITE T N NLC 1000 100041 JAYANKONDAM LIGNITE T N NLC 1000 100042 ENNORE EXT T N TNEB 500 50043 TUTICORIN EXT T N TNEB 1000 100044 CUDDALORE T N IPP 2000 200045 ULTRA MEGA CHEYYUR T N IPP 4000 400046 NABINAGAR JV @ BIHAR NTPC 1000 25047 MUZAFFARPUR EXT JV @ BIHAR VAISHALI POWER 500 50048 BARAUNI EXT BIHAR BSEB 500 50049 KATIHAR BIHAR BSEB 1000 100050 NABINAGAR BIHAR BSEB 2000 200051 PIRPIANTI BIHAR BSEB 2000 200052 ULTRA MEGA JHARKHAND BIHAR IPP 4000 400053 NORTH KARAN PURA @ JHAR NTPC 1980 66054 BOKARO STEEL @ JHAR DVC 500 50055 TENUGHAT EXT JHAR TVNL 630 63056 COAL BASED TPP PHASE I JHAR CESC 500 50057 COAL BASED TPP PHASE II JHAR CESC 500 50058 ULTRA MEGA ORISSA ORI IPP 4000 4000
59 INTEGRATED PROJECT DARIPALLI @ ORI NTPC 3200 3200
60 NUELPOI ORI CESC 1320 132061 RENGALI ORI NLC 1000 100062 OPGCL JV ORI OPGCL 1200 120063 MALAXMI @ ORI NAVBHARAT 1040 104064 HALDIA I @ WB CESC 600 60065 KATWA WB WBPDCL 1200 120066 RAGHUNATH PUR @ WB DVC 1000 100067 DPL U7A @ WB WBPDCL 300 30068 DPL U8 @ WB WBPDCL 500 50069 BAKRESHWAR EXT @ WB WBPDCL 500 500
Page 81 of Chapter 1

S.NO NAME STATE AGENCYULTIMATE CAPACITY
(MW)
LIKELY BENEFITS IN 12th PLAN (MW)
SHELF OF COAL AND LIGNITE BASED PROJECTS FOR LIKELY BENEFITS DURING 12th PLAN
Appendix 1.10 (contd)
70 BARGOLOI TPS ASM ASEB 250 25071 BADARPUR JV ASM ASEB 180 18072 CHANDRAPUR JV ASM ASEB 100 10073 MARGHERITA TPP @ ASM NEEPCO 480 48074 GARO HILL MEGH NEEPCO 720 72075 WEST KHASI HILLS TPP MEGH NEEPCO 240 240
TOTAL 98435@ BEST EFFORT PROJECTS DURING 11TH PLANNOTE: THE LIST INCLUDES 11545 MW PROJECTS INCLUDED AS PROJECTS WITH BEST EFFORTS IN 11TH PLAN
Page 82 of Chapter 1

1 KAYAMKULAM KERL NTPC C 1950 1950
2 KAWAS II GUJ NTPC C 1300 1300
3 GANDHAR II GUJ NTPC C 1300 1300
4 PRAGATI II DELHI PRAGATI POWER S 330 330
5 PRAGATI III (BAWANA) DELHI PRAGATI POWER S 1000 1000
6 URAN MAH MAHAGENCO S 1040 1040
7 RELIANCE-DADRI UP RELIANCE ENERGY P 5600 5600
8 PYGUTHAN GUJ GPECL P 1050 1050
9 ESSAR HAZIRA GUJ ESSAR POWER P 1500 1500
10 KANNUR KERL KANNUR POWER PVT LTD P 513 513
TOTAL 15583
Appendix 1.10 (contd)
Note: If Gas/LNG becomes available at reasonable price, some of the above mentioned gas based projects may yield benefits during 11th plan
IDENTIFIED GAS BASED PROJECTS FOR LIKELY BENEFITS DURING 12th PLAN
ULTIMATE CAPACITY
(MW)
LIKELY BENEFITS IN
12th PLAN (MW)AGENCY SECTO
RSl.No. PLANT NAME STATE
Page 83 of Chapter 1

S.NO. NAME STATE AGENCY
LIKELY BENEFITS IN
12th PLAN (MW)
1 KUDANKULAM U3,4 T N NPC 20002 KUDANKULAM U5,6 T N NPC 20003 JAITAPUR 1,2 GUJ NPC 20004 RAPP EXT RAJ NPC 14005 KAPP 3&4 KAR NPC 14006 LWR 3,4 NPC 2000
Sub total (NPCIL) 108007 NEW NUCLEAR NTPC 2000
Sub total (NTPC)TOTAL 12800
SHELF OF NUCLEAR PROJECTS FOR LIKELY BENEFITS DURING 12th PLAN
Appendix 1.10 (contd)
Page 84 of Chapter 1

Demand for Power and Generation Planning Working Group on Power for 11th Plan
Page 85 of Chapter 1
Appendix 1.11 COMPARATIVE PERFORMANCE OF PARTERNERSHIP IN EXCELLENCE (PIE) STATIONS NTPC AS PIE PARTNER
Dec'05 Dec'06 Apr-Dec'05 Apr-Dec'06 Change in 'Apr-Dec' period
Generation change PLF change
Sl No.
Station Unit No. Capacity under PIE MW
Generating Cap. (MW)
Act Gen Act PLF Act Gen Act PLF Act Gen Act PLF Act Gen Act PLF MU % Net %
1 Tenughat 1,2 420 420 142.89 45.73 226.01 72.33 960.61 34.65 1957.52 70.62 996.91 103.78 35.96 103.78 2 Ennore 2,3,5 280 280 44.51 21.37 153.10 73.49 485.93 26.29 1059.71 57.34 573.78 118.08 31.05 118.08 3 Bokaro 'B' 1,2,3 630 630 304.79 65.03 321.43 68.58 1987.44 47.80 2470.6 59.42 483.16 24.31 11.62 24.31 4 Parichha 1,2 220 220 43.36 26.49 116.67 71.28 557.91 38.42 874.53 60.23 316.62 56.75 21.81 56.75
5 Durgapur DVC 3,4 350 350 109.96 42.23 211.67 81.29 1256.54 54.40 1536.91 66.53 280.37 22.31 12.14 22.31
6 Harduaganj 3,7 (4)* 215 160 34.76 21.73 64.06 53.81 335.39 23.64 573.82 54.34 238.43 71.09 30.70 129.90
7 RPH 1,2 135 135 84.68 84.31 81.53 81.17 386.63 43.39 564.44 63.35 177.81 45.99 19.96 45.99
8 Chandrapura 1,2,3 390 380 205.95 70.98 220.64 78.04 1464.83 56.91 1487.5 59.31 22.67 1.55 2.40 4.22 9 IP 2,3,4,5 247.5 247.5 94.94 51.56 80.55 43.74 716.10 43.84 671.27 41.09 -44.83 -6.26 -2.74 -6.26 10 Panki 3,4 210 210 77.29 49.47 66.52 42.58 738.39 53.27 664.92 47.97 -73.47 -9.95 -5.30 -9.95 11 Obra 7 to 13 1188 1188 506.43 57.30 423.72 47.94 3990.37 50.89 3926.18 50.07 -64.19 -1.61 -0.82 -1.61 12 Patratu 1,2 (9,10)* 350 80 22.62 38.00 49.49 83.15 182.59 34.58 254.38 48.18 71.79 39.32 13.60 39.32 13 Durgapur DPL 1 to 6 390 390 204.00 70.31 117.00 40.32 1609.05 62.51 1408.89 54.74 -200.16 -12.44 -7.78 -12.44 Total 5026 4690.5 1876.18 50.18 2132.39 61.10 14671.78 44.23 17450.67 56.37 2778.89 18.94 12.14 27.44
* Units are under long shut down.

Demand for Power and Generation Planning Working Group on Power for 11th Plan
Page 86 of Chapter 1
Appendix-1.12
(Page 1 of 2) STATE WISE LIST OF HYDRO RM&U PROJECTS COMPLETED IN THE 10TH PLAN
(PHASE I PROJECTS* & PHASE II PROJECTS) As on 31.7.2006
Cost (Rs. in Crs.) S.
No Project, Agency
Inst. Cap. (MW)
Estima-ted
Actual
Benefits (MW)
Category Year of completion
Himachal Pradesh 1. Pong, BBMB 6x60 17.70 17.79 36.00
(U) RM&U 2003-04
Punjab 2. Shanan Ph.A,
PSEB 4x15+ 1x50 11.35 10.93 - R&M 2003-04
Karnataka 3. Nagjhari, U-
1&3, KPCL 2x135 26.12 22.29 30.00
(U) RM&U 2002-03
4. Supa PH, KPCL
2x50 2.64 2.47 - R&M 2002-03
5. Mahatma Gandhi*, VVNL
4x12+4x18 44.66 43.13 19.20 (U) + 120.00 (LE)
RMU&LE 2002-03
6. Munirabad, VVNL
2x9+1x10.3 3.64 3.53 28.30 (LE)
RM&LE 2002-03
7. Mani Dam, KPCL
2x4.5 1.00 1.00 - R&M 2002-03
8. Shivasamudram, VVNL
6x3+4x6 68.38 73.17 42.00 (LE)
RM&LE 2004-05
9. Bhadra, Ph.II, KPCL
1x2 3.30 1.96 2.00 (LE) RM&LE 2005-06
Kerala 10. Pallivasal,
KSEB 3x5+3x7.5 94.00 37.50
(LE) RM&LE 2002-03
11. Sengulam, KSEB
4x12 114.00 48.00 (LE)
RM&LE 2002-03
12. Panniar, KSEB
2x15 62.00
371.71
30.00 (LE)
RM&LE 2002-03
Tamilnadu 13. Pykara*,
TNEB 3x6.65+1x11+2x14
26.06 20.147 58.95 (LE)
RM&LE 2004-05
14. Papanasam*, TNEB
4x7 27.05 22.55 4.00 (U) + 28.00 (LE)
RMU&LE 2005-06

Demand for Power and Generation Planning Working Group on Power for 11th Plan
Page 87 of Chapter 1
Appendix-1.12 (Page 2 of 2)
Cost (Rs. in Crs.) S. No
Project, Agency
Inst. Cap. (MW)
Estima-ted
Actual
Benefits (MW)
Category Year of completion
Orissa 15. Hirakud-I, U-
3&4*, OHPC 2x24 126.13 111.18
16.00(U)+ 48.00(LE)
RMU&LE 2005-06
West Bengal 16. Maithon, U-
2*, DVC 1x20 42.08 35.9828 20.00(LE)
+3.20(U) RMU& LE
2004-05
Maharashtra 17. Bhira Tail
Race, MSPGCL
2x40 1.60 0.70 - R&M 2003-04
18. Tillari, MSPGCL
1x60 4.50 4.24 6.0 (U) RM&U 2004-05
19. Koyna Gen. Complex, MSPGCL
4x70+4x80+ 4x80
12.00 11.50 - R&M 2004-05
Meghalaya 20. Umium St.I*
MeSEB 4x9 81.88 84.21 36.00(LE) RM&LE 2002-03
21. Khandong, NEEPCO
2x25 4.00 3.3499 - R&M 2003-04
Total 2457.75 774.09 841.8397 613.15 [114.40 (U) + 498.75 (LE)]
Abbreviations: R&M – Renovation & Modernisation;
RM&U – Renovation, Modernisation & Uprating, RM&LE – Renovation, Modernisation & Life Extension
RMU&LE – Renovation, Modernisation, Uprating & Life Extension; R&M+Res.-Renovation & Modernisation + Restoration; RM&LE+Res.- Renovation, Modernisation & Life Extension + Restoration; RM&U+Res. – Renovation, Modernisation & Uprating + Restoration. MW – Mega Watt; Res – Restoration; U – Uprating; LE – Life Extension
Phase I Projects started in 1987; Phase II Projects started in 1998

Demand for Power and Generation Planning Working Group on Power for 11th Plan
Page 88 of Chapter 1
Appendix-1.13 (Page 1 of 2)
STATE WISE LIST OF ONGOING HYDRO RM&U PROJECTS PROGRAMMED FOR COMPLETION IN
THE 10TH PLAN (PHASE I PROJECTS* & PHASE II PROJECTS) As on 31.7.2006
Cost (Rs. in Crs.) S. No
Project, Agency
Inst. Cap. (MW)
Estima-ted cost
Expend. Incurred
Benefits (MW)
Category Completion Schedule
Jammu & Kashmir 1. Sumbal
Sindh*, J&KPDC
2x11.3 22.32 0.654 (as on
30.4.06)
- R&M 2006-07
Punjab 2. Ganguwal,U-
1, BBMB 1x29.25 51.28
(incl. IDC 6.28)
25.89 (LE) +2.10 (Res)
RM&LE+Res.
2006-07
3. Kotla, U-1, BBMB
1x29.25 51.28 (incl. IDC 6.28)
58.98 (as on
30.6.06) 26.61 (LE) +2.33 (Res)
RM&LE+Res.
2006-07
4. Anandpur Sahib, PSEB
4x33.5 3.68 0.1157 (as on
30.6.06)
- R&M 2006-07
Rajasthan 5. Jawahar
Sagar, RRVUNL
3x33 16.55 N.A - R&M 2006-07
6. Rana Pratap Sagar, RRVUNL
4x43 20.70 N.A - R&M 2006-07
Uttaranchal 7. Chibro,
UJVNL 4x60 12.00 9.09
(as on 30.6.06)
- R&M 2006-07
8. Khodri, UJVNL
4x30 8.00 2.845 (as on 30.6.06)
- R&M 2006-07
9. Chilla, UJVNL
4x36 25.00 18.196 (as on 30.6.06)
- R&M 2006-07
Andhra Pradesh 10. Lower Sileru,
APGENCO 4x115 8.75 N.A - R&M 2006-07
Karnataka 11. Varahi,
KPCL 2x115 2.57 3.62 (as
on 12.7.06)
- R&M 2006-07

Demand for Power and Generation Planning Working Group on Power for 11th Plan
Page 89 of Chapter 1
Appendix-1.13 (Page 2 of 2)
Cost (Rs. in Crs.) S.
No Project, Agency
Inst. Cap. (MW)
Estima-ted
Expend. Incurred
Benefits (MW)
Category Completion Schedule
12. Sharavathy, Ph.A, KPCL
10x103.5 5.22 3.24 (31-5-05)
- R&M 2006-07
Kerala 13. Neriamanga-
lam* KSEB 3x15 58.00 49.96
(as on 30.3.06)
45.00 (LE) +9.00 (U)
RMU&LE 2006-07
Tamil Nadu 14. Mettur Dam*,
TNEB 4x10 30.17 24.16 (as
on 31.5.06)
10.00(U)+ 40.00(LE)
RMU& LE
2006-07
Orissa 15. Hirakud-I
(Sw.yard)*, OHPC
- 9.85 15.88 (as on 24.5.06
- R&M 2006-07
Maharashtra 16. Koyna St.III,
MSPGCL 4x80@ 16.65
(tentative)
4.25 (as on 31.3.06)
- R&M 2006-07
Total 2800.10@ 342.02 190.9907 160.93 [19.00(U) + 137.5(LE) + 4.43 (Res.)]
@- Installed Capacity Koyna St. III at Sl. No. 16 not included in the total, as the same has already been accounted for at Sl. No. 19 of Appendix 6.4 under Koyna Gen. Complex.

Demand for Power and Generation Planning Working Group on Power for 11th Plan
Page 90 of Chapter 1
Appendix-1.14 (Page 1 of 2)
State wise List of Ongoing Hydro RM&U Projects programmed for completion in the 11th Plan (Phase I Projects* & Phase II Projects)
As on 31.7.2006 Cost (Rs. in Crs.) S.
No Project, Agency
Inst. Cap. (MW)
Estima-ted
Expend. Incurred
Benefits (MW)
Category Completion Schedule
Himachal Pradesh 1. Bhakra LB,
BBMB 5x10⁸ 488.00 - 540.00
(LE) + 90.00 (U)
RMU&LE 2011-12
2. Bassi, HPSEB 4x15 28.60 Nil 6.0(U)+ 60 (LE)
RMU&LE 2008-09
Jammu & Kashmir 3. Lower
Jhelum*, J&KPDC
3x35 101.3 12.57 (as on 30.4.06
15.00 (Res.)
R&M+ Res.
2008-09
4. Chenani, J&KPDC
5x4.66 34.90 - 23.30 (LE)
RM&LE 2009-10
5. Salal Ph. II, NHPC
3x115 + 3x115
91.46 - - R&M 2009-10
Punjab 6. Shanan, Ph.B,
PSEB 4x15 + 1x50
35.95 10.867 (as on 30.6.06)
60.00 (LE)
RM&LE (LE for 15 MW units + R&M for 50 MW unit )
2007-08
7. UBDC I&II, PSEB
3x15 + 3x15.45
7.89 0.87 (as on 30.6.06)
45.00 (LE)
RM&LE (LE for 3x15 MW & R&M for 3x15.45 MW
2007-08
8. Mukerian St.I, PSEB
3x15 6.04 4.29 (as on 30.6.06)
- R&M XIth Plan
Uttar Pradesh 9. Matatila,
UPJVNL 3x10.2 92.35 1.00
(as on 30.4. 06)
15(U) + 30.6 (LE)
RMU&LE 2008-09
10. Obra, UPJVNL 3x33 14.50 4.56 99.00 (LE)
RM&LE 2008-09
11. Rihand, UPJVNL
6x50 136.27 11.58 300.00 (LE)
RM&LE 2009-10

Demand for Power and Generation Planning Working Group on Power for 11th Plan
Page 91 of Chapter 1
Appendix-1.14 (Page 2 of 2)
Cost (Rs. in Crs.) S. No
Project, Agency Inst. Cap. (MW)
Estima-ted Expend. Incurred (Till date)
Benefits (MW)
Category Completion Schedule
Andhra Pradesh 12. Nagarjuna Sagar,
(Ph.I) APGENCO 1x110+ 7x100.8 #
33.35 - - R&M & Refurbishm-ent of Units 1, 2, 4 & 5
2007-08
13. Upper Sileru, APGENCO 4x60 4.20 - - R&M XIth Plan 14. Srisailam RB,
APGENCO 7x110 16.70 - - R&M 2007-08
Karnataka 15. Nagjhari,
U-4to6, KPCL 3x135 $ 41.16 5.96 45.00
(U) RM&U 2008-09
16. Sharavathy Ph.B, KPCL
10x103.5 15.73 - - R&M
2009-10
17. Supa, KPCL 2x50 1.55 3.73 - R&M 2009-10 18. Nagjhari, U1 to 6, KPCL 3x150 +
3x135 $ 17.23 1.15
(as on 12.7.06)
- R&M 2008-09
19. Lingnamakki, KPCL 2X27.5 5.26 0.14 (as on 12.7.06)
- R&M 2008-09
Kerala 20. Sabirigiri*, KSEB 6x50 98.56 57.00
(as on 31.3.06) 300.00 (LE) + 35.00 (U)
RMU&LE 2008-09
Tamil Nadu 21. Sholayar-I, TNEB 2x35 40.68 - 14.00(U)
+70.00 (LE)
RMU&LE 2008-09
Orissa 22. Hirakud-II*, OHPC 3x24 125.52 54.46
(as on 24.5.06) 72.00 (LE) RM&LE 2008-09
West Bengal 23. Jaldhaka St.I*, WBSEB 3x9 52.17 4.31
(as on 6/2006) 27.00(LE) RM&LE 2008-09
Maharashtra 24. Koyna St.I & II, MSPGCL - 75.50
(Incl. 12.50 for Sw. Yd.)
60.34(for P.H.) & 0.34 (for Sw. yd.) (as on 31.3.06)
- R&M 2007-08
Manipur 25. Loktak*, NHPC 3x35 19.755 - 15.00
(Res) R&M + Res. 2008-09
Total 7138.85 $
584.625 232.827 1861.90 [205.0 (U) + 1626.9 (LE) +30.0(Res.)]
$ - Installed Capacity of Nagjhari (U-4 to 6) at Sl. No. 15 not included in the total, as the same has already been accounted for at Sl. No. 18.

Demand for Power and Generation Planning Working Group on Power for 11th Plan
Page 92 of Chapter 1
Appendix-1.15
(Page 1 of 2) State wise List of Hydro RM&U Projects programmed for completion in the 11th Plan
but works of which are yet to be taken up for implementation (Phase I Projects* & Phase II Projects)
As on 31.7.2006 S.No. Project,
Agency Inst. Cap. (MW)
Estimated Cost (Rs. in Crs)
Benefits (MW)
Category Completion Schedule
Himachal Pradesh 1. Dehar,(Ph-A)
BBMB 6x165 11.00 - R&M 2008-09
2. Giri, HPSEB 2x33 8.28 66.00 (LE) RM&LE XI th Plan Jammu & Kashmir 3. Ganderbal,
J&KPDC 2x3+2x4.5 34.20 15.00 (LE) RM&LE 2008-09
Uttaranchal 4. Dhakrani,
UJVNL 3x11.25 55.00 33.75 (LE) RM&LE 2010-11
5. Dhalipur, UJVNL
3x17 80.00 51.00 (LE) RM&LE 2010-11
6. Tiloth, UJVNL 3x30 130.00 90 (LE) RM&LE 2010-11 7. Khatima,
UJVNL 3x13.8 100.00 41.40 (LE) RM&LE 2009-10
8. Pathri, UJVNL 3x6.8 60.00 20.40 (LE) RM&LE 2009-10 9. Kulhal, UJVNL 3x10 30.00 30(LE) RM&LE 2010-11 10. Ramganga,
UJVNL 3x66 40.00 18.00(Res) R&M+Res. 2009-10
Andhra Pradesh 11. Hampi,
APGENCO 2x9(St.I) & 2x9(St.II)
25.00 36.00 (LE) RM&LE XI th Plan
12. Machkund *, APGENCO
3x17(St.I) & 3x21.25 (St.II)
124.45 15.25(U) +114.75(LE)
RMU&LE XI th Plan
13. Tungabhadra, APGENCO
4x9 25.00 36(LE) RM&LE XI th Plan
14. Nagarjuna Sagar, Ph.II APGENCO
1x110 + 7x100.8 #
15.00 - R&M & Refurbishm-ent of Units 3,6,7 & 8
XI th Plan
15. Upper Sileru, Ph.II APGENCO
4x60 10.00 - R&M XI th Plan
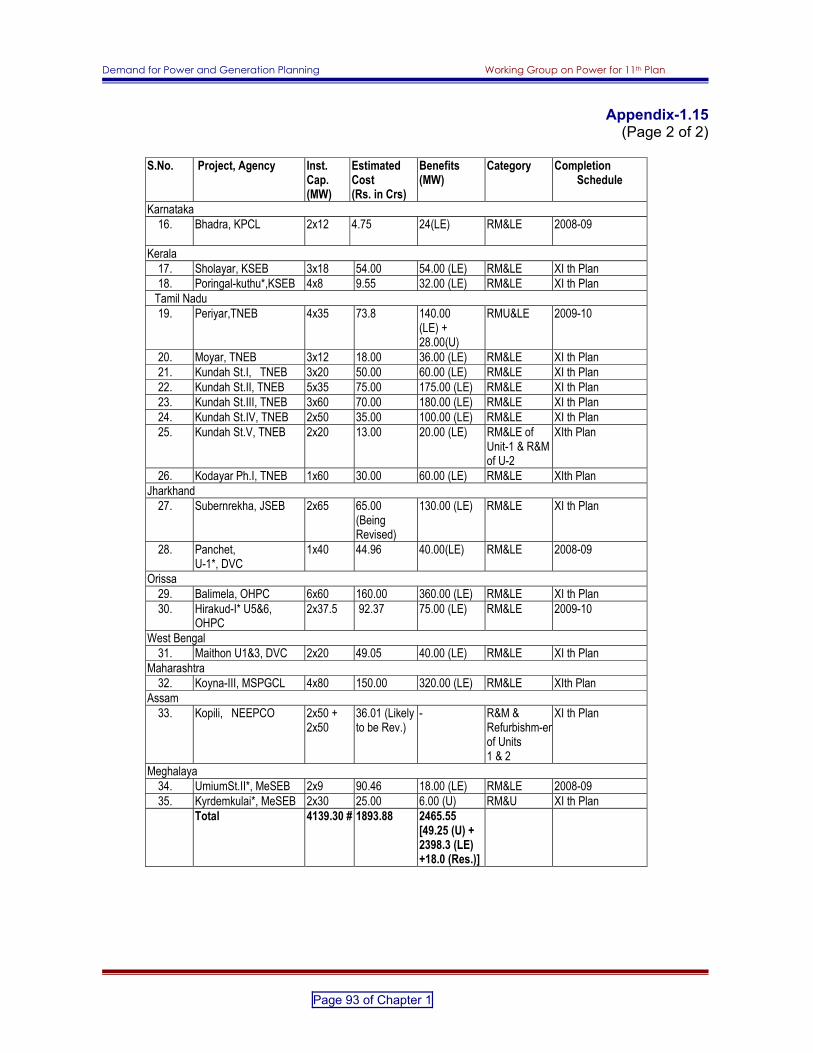
Demand for Power and Generation Planning Working Group on Power for 11th Plan
Page 93 of Chapter 1
Appendix-1.15
(Page 2 of 2)
S.No. Project, Agency Inst. Cap. (MW)
Estimated Cost (Rs. in Crs)
Benefits (MW)
Category Completion Schedule
Karnataka 16. Bhadra, KPCL 2x12 4.75 24(LE)
RM&LE 2008-09
Kerala 17. Sholayar, KSEB 3x18 54.00 54.00 (LE) RM&LE XI th Plan 18. Poringal-kuthu*,KSEB 4x8 9.55 32.00 (LE) RM&LE XI th Plan
Tamil Nadu 19. Periyar,TNEB 4x35 73.8 140.00
(LE) + 28.00(U)
RMU&LE 2009-10
20. Moyar, TNEB 3x12 18.00 36.00 (LE) RM&LE XI th Plan 21. Kundah St.I, TNEB 3x20 50.00 60.00 (LE) RM&LE XI th Plan 22. Kundah St.II, TNEB 5x35 75.00 175.00 (LE) RM&LE XI th Plan 23. Kundah St.III, TNEB 3x60 70.00 180.00 (LE) RM&LE XI th Plan 24. Kundah St.IV, TNEB 2x50 35.00 100.00 (LE) RM&LE XI th Plan 25. Kundah St.V, TNEB 2x20 13.00 20.00 (LE) RM&LE of
Unit-1 & R&M of U-2
XIth Plan
26. Kodayar Ph.I, TNEB 1x60 30.00 60.00 (LE) RM&LE XIth Plan Jharkhand
27. Subernrekha, JSEB 2x65 65.00 (Being Revised)
130.00 (LE) RM&LE XI th Plan
28. Panchet, U-1*, DVC
1x40 44.96 40.00(LE) RM&LE 2008-09
Orissa 29. Balimela, OHPC 6x60 160.00 360.00 (LE) RM&LE XI th Plan 30. Hirakud-I* U5&6,
OHPC 2x37.5 92.37 75.00 (LE) RM&LE 2009-10
West Bengal 31. Maithon U1&3, DVC 2x20 49.05 40.00 (LE) RM&LE XI th Plan
Maharashtra 32. Koyna-III, MSPGCL 4x80 150.00 320.00 (LE) RM&LE XIth Plan
Assam 33. Kopili, NEEPCO 2x50 +
2x50 36.01 (Likely to be Rev.)
- R&M & Refurbishm-enof Units 1 & 2
XI th Plan
Meghalaya 34. UmiumSt.II*, MeSEB 2x9 90.46 18.00 (LE) RM&LE 2008-09 35. Kyrdemkulai*, MeSEB 2x30 25.00 6.00 (U) RM&U XI th Plan
Total 4139.30 #
1893.88 2465.55 [49.25 (U) + 2398.3 (LE) +18.0 (Res.)]

Transmission Planning & National Grid Working Group on Power for 11th Plan
Page 1 of Chapter 2
Chapter-2
TRANSMISSION PLANNING AND NATIONAL GRID
2.0 INTRODUCTION The transmission system facilities had earlier been planned on regional basis with provision of inter-regional link to transfer regional surplus power arising out of diversity in demand. The generation resources in the country are unevenly located, the hydro in the northern and north-eastern states and coal being mainly in the eastern part of the country. Development of strong National Grid has become necessity to ensure reliable supply of power to all. The planning & operation of the transmission system has thus shifted from regional to national level. Formation of a strong National Power Grid has been recognized as a flagship endeavour to steer the development of Power System on planned path leading to cost effective fulfilment of the objective of ‘Electricity to All’ at affordable prices. A strong All India Grid would enable exploitation of unevenly distributed generation resources in the country to their optimum potential by providing enhanced margins in inter-regional transmission system. These margins, together with open access in transmission, would facilitate increased trading in electricity leading to market determined generation dispatches thereby resulting in supply at reduced prices to the distribution utilities and ultimately to consumers benefit.
2.1 REVIEW OF TRANSMISSION SYSTEM DURING 10TH PLAN The development of transmission system requirement during the 10th Plan was taken up along with the development of the generation programme for 10th Plan. The transmission system required for evacuation of power from each of the generation project, as per the planning criteria adopted, had been identified as well as the system required for strengthening of the network for delivery of power to the load centres had also been identified. The identified transmission programme has been reviewed from time to time to take into account any revision in the generation programme and variations in development of load at various load centres in the State systems. Generally, there had been no constraint in intra-regional transmission systems. However, need of more capacities in the inter-regional systems was increasingly felt. Transmission schemes for providing more inter-regional capacities had already been initiated in the 9th Plan and the programme was accelerated during 10th Plan. This has resulted in consolidating the National Grid. The inter-regional transmission capacity at 200kV and above increased from 5050 MW at the beginning of 10th Plan i.e. by March 2002, to 11,450 MW by August 2006, and against revised target of 16,450MW it is likely to reach 15,450 MW by the end of 10th Plan (i.e. by March 2007). Based on the list of generation projects corresponding to the programme of 41,110 k transmission requirements at 132 kV level and above including the power evacuation system as well as network strengthening were identified. This transmission programme became the basis for taking up detailed planning exercise and finalizing

Transmission Planning & National Grid Working Group on Power for 11th Plan
Page 2 of Chapter 2
of their transmission development programme by the Central Transmission Utility and the State Transmission Utilities corresponding to the actual pace of 10th Plan development happening in generation and the actual area-wise load growths. Accordingly, the 10th Plan transmission programme had to be reviewed and targets reworked to match the generation programme. Apart from changes in associated transmission system corresponding to deferred/slipped/changed generation, transmission strengthening in power delivery networks had also to be reviewed to take care of variation in projected demand growth and the actual/updated projections of demand growth. Accordingly, the transmission programme taken-up for execution was revised as per the actual needs matching with generation projects. 2.1.1 Achievements in Transmission during First Four Years of 10th Plan At the end of 9th five year Plan, corresponding to the total installed generation capacity of 105 GW as on 31st March 2002 and peak demand of 73 GW, the transmission system in the country at 765/HVDC/400/230/220/132/110 kV stood at 257 thousand circuit kilometres (Tckm) of transmission lines and 292 GVA of substation capacity. The corresponding sub-transmission system and distribution system stood at 302 Tckm and 115 GVA at 66/33/22kV, 1758 Tckm at 15/11/6.6/3.3/2.2kV, 176 GVA of distribution transformers and 3680 Tckm of LT lines. [Ref: General Review 2002, CEA] Summary of updated 10th Plan transmission programme targeted based on actual progress during the first four years and the updated targets for the remaining year, is tabulated below:
Table 2.1
Transmission System Type / Voltage Class Unit
As at the end of 9th Plan i.e. March
2002 *
Added during
2002-06 (four years)
Achieved as at the
end of 2005-06 i.e. March 2006
To be added during
2006-07
Target for the End of
10th Plan i.e.
March 2007 TRANSMISSION LINES (a) 765 kV ckm 971 186 1157 996 2153 (b) HVDC ± 500kV ckm 3138 2738 5876 0 5876 (c) 400 kV ckm 49378 13773 63151 14403 77554 (d) 230/220kV ckm 96994 10593 107587 12017 119604 (e) HVDC 200kV ckm 162 0 162 0 162 Total of (a), (b), (c),(d) & (e) ckm 150643 27290 177933 27416 205349
SUBSTATIONS (a) 765 kV MVA 0 0 0 3000 3000 (b) 400 kV MVA 60380 20540 80920 12120 93040 (c) 230/220 kV MVA 116363 28758 145121 12348 157469 Total of (a), (b) & (c) 176743 49298 226041 27468 253509
HVDC (a) Bi-pole link capacity MW 3000 2000 5000 500 5500 (b) Back-to back capacity MW 2000 1000 3000 0 3000 (c) Mono-pole link capacity MW 200 0 200 0 200 Total of (a), (b) & (c) MW 5200 3000 8200 500 8700
[* General Review 2002, CEA]

Transmission Planning & National Grid Working Group on Power for 11th Plan
Page 3 of Chapter 2
2.1.2 Programme of Inter-Regional Transmission Capacity in 10th Plan At the end of the 9th Plan, the inter-regional transmission capacity at 200kV and above was 5050 MW. The original programme corresponding to X Plan generation programme of 41,000 MW was to add 18600 MW during 10th Plan. The revised target programme for 10th plan is to add 11400 MW out of which 4400 MW has been added during the first four years that is 2002-06 MW and 7000 MW is the target for 2006-07 so as to achieve 16450 MW in the end of 10th plan. Out of this target of 7000 MW, Muzaffarpur-Gorakhpur 400kV D/C quad line with TCSC of 2000 MW was added in August 2006. However, as per the progress, likely achievement is expected to be 1000 MW less due to slipping of Ranchi-Sipat 400kV D/C line. With this, the inter-regional transmission capacity by the end of 10th Plan is anticipated to increase to 15450 MW by 2006-07. The Inter-Regional transmission capacities programmed for the 10th Plan are:
HVDC Back to-back stations at Gazuwaka (500 MW), HVDC Back to-back station at Sasaram (500MW), Talcher-Kolar HVDC Bipole (2000 MW), and Rourkela-Raipur 400kV D/C line with TCSC (1400 MW) Muzaffarpur-Gorakhpur 400kV D/C quad line with TCSC (2000 MW)
(* This line was charged on 26-08-2006, thereby establishing synchronous connections between NER-ER-WR-NR.)
Biharshariff-Balia 400kV quad line (1200 MW), Patna-Balia 400kV quad line (1200 MW), Agra-Gwalior 765kV line operated at 400kV, and Ranchi-Sipat 400kV D/C line with 40% series compensation (1000 MW)
2.1.3 Development of HVDC Systems during 10th Plan: Talcher – Kolar HVDC + 500kV Bipole of 2000 MW capacity, Sasaram HVDC back-to-back of 500 MW capacity and Gazuwaka HVDC back-to-back second module of 500 MW capacity were added during the X Plan. A summary of development of HVDC systems in India during first four years and also programme for the last year i.e. 2006-07 is given at Appendix-2.1 2.1.4 Development of 765kV Systems during 10th Plan: Currently all of the 765 kV systems in the country are operated at 400kV, the transmission system for Sipat that would be completed in 2006-07, would be operated at 765kV, thus setting a new milestone in development of transmission system in the country. A summary of development of 765kV transmission system in India during first four years and also programme for the last year i.e. 2006-07 of 10th Plan is given at Appendix --2.2 2.1.5 Development of Regional Grids during 10th Plan List of major transmission schemes completed and programmed under the development plan of the Regional Grids and National Grid during the 10th Plan are given at Appendix --2.3 to Appendix --2.7.

Transmission Planning & National Grid Working Group on Power for 11th Plan
Page 4 of Chapter 2
2.1.6 Fund Requirement and Utilization during 10th Plan Initially, based on the 41 GW generation addition programme for 10th Plan, a total of Rs 74400 crore was estimated for transmission schemes in 10th Plan. Out of this, a sum of about Rs 40300 crore was to be spent for development of Regional grids and Nation grid by Powergrid on its own and also through joint venture schemes. However, because of slippage/deferment of generation programme over the span of 10th plan and consequent reduction in the transmission programme, only about Rs 20780 Crore (Rs 19168 crore by PGCIL alone and Rs 1912 crore through joint venture) would be spent during X plan. Under state sector, the estimate was to spend Rs 34100 crore for 66kV and above schemes (this estimate does not include the schemes in J&K, Sikkim, Goa, Mizoram and Uttaranchal). Based on current estimate, about Rs 28900 crore would be spent by the state utilities. (These estimates are for 220kV above schemes and do not include states of J&K and Sikkim). Thus with the updated generation addition estimate of about 31 GW in five years of X Plan, an amount of Rs 49680 crore would be spent. 2.1.7 Difficulties and constraints in implementation of Transmission Schemes It may mentioned that due to sustained efforts by Central PSUs and States, and close coordination by Ministry of Power/CEA with CPSUs and States the transmission Schemes meant for evacuation of power from Generating stations, strengthening schemes and sub-transmission schemes etc for absorption of power from Generating Stations by the states had been commissioned well in time. Hence by and large there was no bottling up, as such, of power from Generating stations and the States were capable of absorbing the additional power capacity added during these years. Not withstanding the above, transmission utilities faced some difficulties in implementation and completion of their schemes. A case-wise analysis of difficulties and constraints experienced by them is detailed in following paragraphs. The CPSUs and States had experienced difficulties during construction of transmission schemes. Noticeably, in case of Dhauliganga- Bareilly 400 kV D/C line, Dadri- Panipat, 400kV S/C line, LILO of 400 kV Dadri-Ballabgarh D/C line at Noida, Tehri –Meerut 765kV S/C line, Pykara-Arasur 230 kV D/C line some difficulties were experienced.
In case of Dhauliganga(NHPC)- Bareilly (initially to be charged at 220 kV), progress in Ascot wild life area adversely affected since October, 2003 due to refusal of permission for working in Ascot Wild Life Sanctuary.
In case of Dadri-Panipat 400 kV S/C line, there were severe Right of Way
constraints and law & order problems. The problems were resolved through the intervention of Senior Govt. Officials of Uttar Pradesh and the line was commissioned in March 06.
In case of LILO of 400 kV Dadri-Ballabgarh at Noida, work was held as
clearance was not received from NOIDA Authority in NOIDA. Matter pursued

Transmission Planning & National Grid Working Group on Power for 11th Plan
Page 5 of Chapter 2
with NOIDA Authority /State Administrator to resolve the issue. Line is being re-routed and work has re-commenced..
Tehri-Meerut 765kV Ckt.-I was completed in August 2004 ahead of generation
project i.e. Tehri Stage-I HEP(4x250 MW). But, the Tehri-Meerut 765kV S/C Ckt.-II, was completed in March 2006. Work in Rajaji National Park was not allowed by forest authorities until clarification was received from Hon’ble Supreme Court,
In case of Pykara-Arasur 230 kV D/C, the proposal for transmission line falling
in forest area the clearance from Hon’ble Supreme Court received on 30th Jan. 2004. There was further delay due to large scale tree cutting under the direct supervision of Regional Conservator of Forests.
2.2 NATIONAL GRID 2.2.1 Introduction Formation of a strong National Power Grid has been recognized as a flagship endeavour to steer the development of Power System on planned path leading to cost effective fulfilment of the objective of ‘Electricity to All’ at affordable prices. A strong All India Grid would enable exploitation of unevenly distributed generation resources in the country to their optimum potential by providing enhanced margins in inter-regional transmission system. These margins, together with open access in transmission, would facilitate increased real time trading in electricity leading to market determined generation dispatches thereby resulting in supply at reduced prices to the distribution utilities and ultimately to consumers benefit. 2.2.2 Emergence of Inter-Regional Systems During the 1980s, the regional grids developed with construction of power evacuation lines planned and implemented as associated transmission system of central sector generation schemes for benefits within the regions. The initial set of inter-regional links developed under the Centrally sponsored programme for building inter-state infrastructure of State utilities, was utilized to facilitate exchange of operational surpluses among the various Regions in a limited manner because the Regional Grids operated independently and had different operational frequencies and the power exchanges on these inter-regional links could take place only in radial mode. In 1989, transmission wings of Central generating companies were separated to set up Power Grid Corporation of India (POWERGRID) to give thrust to implementation of transmission system associated with Central generating stations and inter-Regional transmission programme based on perspective planning done by CEA. Considering the prevailing operational regime at that time, it was decided to establish initially asynchronous connection between the Regional Grids to enable exchange of regulated quantum of power and asynchronous HVDC back-to-back links of 500MW between the Northern Region and the Western Region at Vindhyachal, 1000MW between Western Region and Southern Region at Bhardawati, 1000MW between

Transmission Planning & National Grid Working Group on Power for 11th Plan
Page 6 of Chapter 2
Eastern Region and Southern Region and 500MW between Eastern Region and Northern Region at Sasaram were provided during 90s and early 2000s. 2.2.3 Formation of National Grid The Eastern Region and the North-Eastern Region have been operating in parallel since 1992 being connected by a 220 kV double circuit transmission line and more recently by a 400 kV D/C transmission line. Western Region was interconnected to ER-NER system synchronously through 400kV Rourkela-Raipur D/C line in 2003, operationalising the Central India system consisting of ER-NER-WR. With installation of TCSC, the transmission capacity of Rourkela-Raipur 400kV D/C line was increased to 1400MW. The Northern region, which till August 2006 had asynchronous radial mode and HVDC back-to-back inter-regional transmission connectivity of 600 MW with the Eastern region, and 1000 MW with the Western region, was also synchronously integrated with the ER/NER/WR system with commissioning of the 400kV Muzaffarpur-Gorakhpur line on 26th August 2006. The Muzaffarpur – Gorakhpur 400kV D/C quad line with fixed series capacitor and TCSC has added 2000 MW to the ER-NR inter-regional transmission capacity. Towards the Southern region, asynchronous interconnections of 1700 MW between SR and WR and 600 MW between SR and ER providing a total of 2300 MW of inter-regional transmission capacity was existing at the beginning of the X plan. With 2000 MW Talcher-Kolar HVDC Bipole line, and second 500 MW HVDC back-to back module at Gazuwaka, both between SR and ER, the total inter-regional capacity connecting to SR has increased to 4800 MW. As of now all inter-regional transmission links of the Southern region are either asynchronous radial mode lines or HVDC inter-connections. Synchronous integration of the Southern region with rest of Indian grid would be firmed up after having experience of synchronous operation of NR+ER+NER+WR system. One point AC interconnection through Parli – Raichur 400kv link supplemented with HVDC links has been proposed for this. The target is to firm up this scheme in the first year of 11th Plan so that synchronous interconnection of All India system could be realized with in the 11th Plan period. 2.2.4 Programme of Development of National Grid As on today, the inter-regional transmission capacity of 11,450 MW is existing and inter-regional energy exchanges of more than 12 billion kWh in a year thus contributing to greater utilization of generation capacity. The program is to achieve inter-regional capacity of 15750 MW by the end of 10th Plan and about 37,150 MW by the end of 11th Plan. Additional 3000 MW through creation of Siliguri HVDC terminal on Bishwanath Chariyali – Agra 800kV HVDC bi-pole line is also being considered during 11th Plan itself. This would increase the target of inter-regional capacity by 2011-12 from 37150 MW to 40150 MW. The table given below gives the programme of Inter-regional Transmission Capacity up to 2011-12.

Transmission Planning & National Grid Working Group on Power for 11th Plan
Page 7 of Chapter 2
Details of inter-regional transmission – Existing, under construction and Planned:
Table 2.2
Power Transfer Capacity (MW)
Name of system At the end of 9th Plan i.e. end of
2001-02
Additions during
10th Plan 2002-07
At the end of 10th
Plan i.e. end of
2006-07
Additions during
11th Plan 2007-12
At the end of
11th Plan i.e.
end of 2011-12
ER – SR : Gazuwaka HVDC back to back
500 500 1000 1000
Balimela-Upper Sileru 220kV S/C
100 100 100
Talcher-Kolar HVDC Bipole 2000 2000 2000 Upgradation of Talcher–Kolar HVDC bipole
500 500
ER-SR total
600 2500 3100 500 3600
ER –NR : Muzaffarpur - Gorakhpur 400kV D/C (Quad Moose) with series comp
2000 2000 2000
Dehri-Sahupuri 220kV S/C 100 100 100 Sasaram HVDC back to back
500 500 500
Biharshariff-Balia 400kV D/C quad increased loadability with series capacitor in associated lines in NR sys
1600 1600 1600
Patna-Balia 400kV D/C quad increased loadability with series capacitor in associated lines in NR system
1600 1600 1600
Barh-Balia 400kV D/C quad increased loadability with series capacitor in associated lines in NR system
1600 1600
Sasaram–Fatehpur 765kV S/C (40% SC)
2300 2300

Transmission Planning & National Grid Working Group on Power for 11th Plan
Page 8 of Chapter 2
Name of system At the end of 9th Plan i.e. end of
2001-02
Additions during
10th Plan 2002-07
At the end of 10th
Plan i.e. end of
2006-07
Additions during
11th Plan 2007-12
At the end of
11th Plan i.e.
end of 2011-12
Sasaram-Balia 400kV D/C quad increased loadability with series capacitor in associated lines in NR sys
1600 1600
ER-NR total 100 5700 5800 6700 11300 ER - WR : Rourkela-Raipur 400kV D/C (without SC)
1000 1000 1000
TCSC on Rourkla-Raipur 400kV DC
400 400 400
Budhipara-Korba220kV D/C+S/C
400 400 400
Ranchi-Sipat 400kV D/C (40% SC)
1000 1000
Ranchi-Rourkela-Raipur 400kV D/C
1400 1400
North Karanpura-Sipat 765kV S/C
2300
ER-WR total
400 1400 1800 4700 6500
ER - NER : Birpara-Salakati 220kV D/C 250 250 250 Malda-Bongaigaon 400kV D/C
1000 1000 1000
Bongaigaon-Siliguri 400kV D/C Quad
1000 1200
ER-NER total
1250 1250 1000 2250
NR - WR : Vindhychal HVDC back to back
500 500 500
Auria-Malanpur 220kV D/C 250 250 250 Kota-Ujjain 220kV D/C 250 250 250 Agra-Gwalior 765kV S/C line-1 400kV op.
1100 1100 1100
Agra-Gwalior 765kV line-1 765kV op
1200 1200
Agra-Gwalior 765kV line-2 2300 2300 Kankroli-Zerda 400kV D/C 1000 1000 RAPP-Nagda 400kV D/C 1000 1000 NR-WR total
1000 1100 2100 5500 7600

Transmission Planning & National Grid Working Group on Power for 11th Plan
Page 9 of Chapter 2
Name of system At the end of 9th Plan i.e. end of
2001-02
Additions during
10th Plan 2002-07
At the end of 10th
Plan i.e. end of
2006-07
Additions during
11th Plan 2007-12
At the end of
11th Plan i.e.
end of 2011-12
WR-SR : Chandrapur HVDC back to back
1000 1000 1000
Barsur–L.Sileru 200kV HVDC mono pole
200 200 200
Kolhapur-Belgaum 220kV D/C
250 250 250
Ponda – Nagajhari 220kV D/C
250 250 250
Parli-Raichur 400kV D/C 1000 1000 WR-SR total 1700 1700 1000 2700 NER-NR/WR : Bishwanath Chariyali–Agra HVDC bi-pole � 800kV
3000 3000
NER-NR/WR total 3000 3000 TOTAL ALL INDIA 5050 10700 15750 21400 37150
Additional 3000 MW through creation of Siliguri HVDC terminal on NER-NR/WR inter-connector, which would increase the target of inter-regional capacity by 2011-12 from 37150 MW to 40150 MW. 2.2.5 Transmission System for Evacuation of Power from Hydro Projects in
NER, Sikkim & Bhutan North Eastern Region, Sikkim and Bhutan have vast untapped hydro potential which is planned for development during 11th plan and beyond. A major component of this power will be utilised by deficit states in the northern and western region and for which reliable evacuation system is planned to be developed. The requirement of transmission system for evacuation of NER hydro power has been estimated corresponding to the capacity of hydro projects which may be feasible to develop say in the next about 20 years. This generation is estimated to be about 35000 MW in NER, about 8000 MW in Sikkim and about 15000 MW in Bhutan. Taking local development at accelerated pace resulting in demand within the NER, Sikkim and Bhutan to be in the range of 10000 – 12000 MW (presently it is about 1500 MW), the transmission requirement through the chicken neck works out to be of the order of 45000 MW. The total requirement including additional circuits for meeting the contingencies and reliability needs, would work out to 7 or 8 numbers of 800 kV HVDC bi-pole lines and 4 or 5 numbers of 400kV double circuit lines – a total of 12 numbers of high capacity transmission corridors passing through the chicken neck. For this, RoW requirement would be about 1.5 Km in width considering minimum distance between adjacent towers to be such that fall of any tower does not affect the adjoining line. The first 800kV HVDC bi-pole line has been planned from a pooling substation at Biswanath Chariyali in North-eastern Region to Agra in Northern region.

Transmission Planning & National Grid Working Group on Power for 11th Plan
Page 10 of Chapter 2
This is being programmed for commissioning matching with Subansiri Lower HEP in 2011-12. 2.2.6 Regional system matching with inter-regional transmission system Transmission systems within the regions to support the above inter-regional transmission capacity is also planned. For example, together with Muzaffarpur-Gorakhpur 400kV D/C line, Siliguri-Purnia-Muzaffarpur 400kV D/C in the Eastern region and Gorakhpur-Lucknow 400kV D/C and Bareilly-Mandola 400kV D/C lines in Northern region have also been provided. Similarly, together with inter-regional transmission lines that would bring power from Kahalgaon and Barh in Eastern region to Balia in Northern region, transmission system from Balia onwards towards western part of Northern region has been planned. In the Western region, major system strengthening scheme has been programmed for onwards transmission of power to be received through ER-WR inter-regional links. Similarly, transmission system has also been planned on both sides of inter-regional links between NR and WR and between ER and SR. 2.2.7 Implementation of National Power Grid – Financing and Tariff Issues The plan for National Power Grid and the schemes have been identified. Implementation of these schemes would require, apart from investment decisions and arranging finances, urgent needs for addressing transmission tariff related issues. The total transmission charges payable to the Central Transmission Utility are worked out on cost plus basis. In case of transmission system through private participation on competitive basis, this would be as per bid-based tariff. The present method of apportionment of the total transmission charges among the beneficiaries is to allocate the regional pooled transmission charges in proportion to their shares in Central Sector generation. This mechanism was evolved during the late seventies when major Central initiatives were taken in generation and associated regional transmission system. The formula has, by and large, worked satisfactorily. With each addition in generation resources and associated transmission system in Central Sector, the States had been getting their shares in more or less same ratio as the allocations that existed prior to the incremental additions. However, with shift towards market determined allocations, new dimensions have been added on account of - (a) surpluses in Eastern region, (b) higher deficit in Northern region and Western region; and (c) coming up of generation projects for cross-regional benefit and (d) merchant generation plants without long-term power allocations or PPAs and intending to sell on short-term basis to different customers utilizing open access in transmission. Consequently, allocation of Central sector generation is no more taking place as per earlier practice/formula. In this changed scenario, the existing methodology of apportionment of Central Transmission Charges among the beneficiaries on regional pool basis is causing distortion. As the cost of incremental facilities is generally substantially higher than that of existing facilities, beneficiaries seeking lower or no allocation from new Central generation see this transmission charge pooling and apportionment arrangement to be disadvantageous to them, while the beneficiaries seeking higher shares in new generation capacities find it advantageous to them. Consequently, the States getting lower share in new Central generation are reluctant to commit transmission charges for the incremental transmission system. This difficulty is severe for those elements of transmission network which go towards

Transmission Planning & National Grid Working Group on Power for 11th Plan
Page 11 of Chapter 2
improved system reliability and margins for open access and for supporting non-committed transaction such as utilization of operational surpluses and incremental cost merit based dispatch optimization. This gets further complicated in case of projects with cross-regional or multi-regional benefits. It is also important that the finances for the Transmission Schemes of the National Grid are arranged at low cost. With focus on system reliability and building margins for open access in the transmission system, the per unit investment in transmission system at Regional and National level is set to increase considerably. This would further increase on account of harnessing remotely located Hydro resources in the Northern Region and North-Eastern Region. The impact of harnessing North-Eastern Region Hydro resources would be much more as the power would have to be transmitted across the North-Eastern and Eastern Regions to bring it to Northern/Western/Southern Regions where it can be actually absorbed. As such, the transmission charges may go up considerably. 2.2.8 Synchronous Inter-Connection of Southern Region with rest of Indian
Grid Integration of the Southern region with rest of Indian grid was considered to be programmed during 11th Plan period. The proposal is to connect SR and WR synchronously through one 400kV D/C quad line between Parli and Raichur. Fixed Series Capacitor as well as TCSC would also be provided on this link. The link would have transmission capacity of the order of 2000 MW per quad D/C line under system contingency with normal transmission capacity limited to 1000 MW, due to this being only synchronous inter-connection between Southern region and rest of Indian grid. The balance inter-regional transmission capacity for SR would come from existing and future HVDC links. POWERGRID is of opinion that further 11th Plan links to Southern Region should be through HVDC and synchronous interconnection of Southern Region with rest of the Indian grid should be considered after having a few years of experience of operating the NR-WR-ER-NER system synchronously. Synchronous inter-connection of Southern region with rest of Indian grid would be of advantage to all as it would enable widening of real time power market allowing optimization of generation resources on all India level. For realizing this at the earliest, the proposal is being discussed so as to firm-up the scheme and achieve synchronous interconnection of Southern grid within 11th Plan. 2.3 ELEVENTH PLAN PROGRAMME 2.3.1 Assessment of Transmission Capacity Requirement The focus of transmission system development programme for the XI Plan is to provide adequate inter-regional and intra-regional transmission capacity so as to consolidate and strengthen the National Grid network towards a strong All India Grid. The inter-regional power exchange requirement has been assessed from possible scenarios of regional surpluses and deficits for the peak and off-peak conditions of winter, summer and monsoon months. The surplus/deficit projections based on

Transmission Planning & National Grid Working Group on Power for 11th Plan
Page 12 of Chapter 2
programme of generation and anticipated demand aims at estimating the transmission requirement at the inter-regional level. Grid expansion plan evolved based on this projection would be able to cater to the needs of various feasible operating scenarios and also provide required margins to support market oriented power exchanges. Transmission system programme for 11th Plan have been worked out based on this methodology. 2.3.2 Transmission System Programmes for 11th Plan For the development of transmission system in the country, the following programmes have been identified to be taken-up during the 11th Plan: Central Sector Schemes:
➢ Transmission schemes for inter-state transmission system ➢ Load dispatch schemes for National and Regional dispatch centres ➢ National level Power Exchange ➢ Comprehensive upgrading of protection system for total integrated system for security of National and Regional grids ➢ Evolving perspective transmission plan for the 12th Plan period ➢ Augmentation of test facilities
State Sector Schemes:
➢ Transmission schemes for intra-state transmission system ➢ Load dispatch schemes for State and Area dispatch centres ➢ Schemes for upgrading of protection systems for security of State grids
2.3.3 Evolving the Perspective Transmission System for 11th Plan In transmission system development in the country, the focus of 11th plan programme is formation of the national power grid. A strong all India grid would enable exploitation of unevenly distributed generation resources in the country to their optimum potential. The transmission capacity together with the margins provided for required redundancies as per planning criteria would provide a reliable transmission system. this would meet the firm transmission needs and with open access in transmission, would facilitate increased real time trading in electricity leading to market determined generation dispatches thereby resulting in supply at reduced prices to the distribution utilities and ultimately to the consumers. Development of national grid has been necessitated by the large thermal generation potential in eastern part of the country and equally large hydro generation potential in north-eastern part. It has also been spurred by the opportunity provided by open access, variation in hydrology / hydro potential and diversity of load across the country. 2.3.4 Assessment of National and Regional Transmission Requirements For assessing the inter-regional power exchange requirements, possible scenarios of regional surpluses and deficit corresponding to each year upto the end of 11th plan (i.e. Each year upto 2011-12) has been projected for the peak and off-peak conditions of winter, summer and monsoon months. The projection based on

Transmission Planning & National Grid Working Group on Power for 11th Plan
Page 13 of Chapter 2
programme of generation and anticipated demand aims at estimating the transmission requirement at the inter-regional level. The national grid system evolved on this projection would be able to cater to the needs of various feasible operating scenarios and also provide required margins to support market oriented power exchanges. Region-wise assessment of import(-)/export(+) need based on projection of availability and demand corresponding to various seasonal scenarios of 2011-12, which forms the basis for assessing the transmission requirement and evolving of the national grid network is summarized in the following table:
Table 2.3 Assessment of Regional Exchange of Power
(All Figures in MW)
Winter Winter Off Peak Winter Peak
Regions
Availability Demand Surplus(+)
Deficit (-) Availability
Demand Surplus(+) Deficit (-)
Northern 30336 34468 -4132 39555 49240 -9685 Western 39368 36624 2744 42993 52320 -9327 Southern 28091 26922 1169 33493 38460 -4967 Eastern 30576 11844 18732 32675 16920 15755
North-Eastern 2638 1862 776 4218 2660 1558 Total 131010 111720 19290 152935 159600 -6665
Monsoon
Monsoon Off Peak Monsoon Peak Regions Availability
Demand Surplus(+) Deficit (-)
Availability Demand Surplus(+)
Deficit (-) Northern 45477 34468 11009 47782 44316 3466 Western 39665 36624 3041 41277 47088 -5811 Southern 31530 26922 4608 33931 34614 -683 Eastern 30189 11844 18345 31239 15228 16011
North-Eastern 5658 1862 3796 6053 2394 3659 Total 152519 111720 40799 160281 143640 16641
Summer
Summer Off Peak Summer Peak Regions Availability
Demand Surplus(+) Deficit (-)
Availability Demand Surplus(+)
Deficit (-) Northern 41364 44316 -2952 44821 49240 -4419 Western 39516 36624 2892 41934 52320 -10387 Southern 30111 26922 3189 33712 38460 -4748 Eastern 30383 11844 18539 31957 16920 15037
North-Eastern 4613 1862 2751 5403 2660 2743 Total 145987 121568 24419 157827 159600 -1773

Transmission Planning & National Grid Working Group on Power for 11th Plan
Page 14 of Chapter 2
2.3.5 Identification of Transmission Systems for 11th Plan Identification of transmission expansion plan was done based on power system studies corresponding to the scenario at the end of 11th plan. The implementation programme was subsequently worked out matching the evacuation and strengthening schemes with associated generation and load growth. Most of the 11th plan schemes have been discussed and firmed-up in the regional standing committees on transmission planning. Investment approvals for some of the schemes have also been obtained and construction started. Some of the schemes are in investment approval stage. Some of the schemes are under final stages of firming-up. 2.3.6 Inter-Regional System It is envisaged to add during the XI Plan period new inter-regional capacities of 20700 MW at 220kV and above. This would increase the total inter-regional transmission capacity of national power grid at 220kV and above from 16450 MW of XI Plan beginning to 37150 MW by 2011-12. Additional inter-regional transmission capacity of 1200 MW by enhancing transmission capacity of each of the Barh-Balia, Patna-Balia and Biharsharif-Balia 400kV quad D/C lines from 1200MW to 1600MW by provision of series compensation and SVC in Northern region and Eastern regional system has also been planned. 2.3.7 765kV Transmission System Existing 765kv transmission system at the beginning of 11th plan would be:
Table 2.4
765kV Transmission Lines
Anpara-Unnao (UPPCL) S/C ckm 409
Kishenpur-Moga L-1(W) S/C ckm 275
Kishenpur-Moga L-2(E) S/C ckm 287
Tehri-Meerut Line-1 S/C ckm 186
Tehri-Meerut Line-2 S/C ckm 184
Sipat-Seoni Line-1 S/C ckm 336
Sipat-Seoni Line-2 S/C ckm 336
Agra-Gwalior Line-1 S/C ckm 140
TOTAL ckm 2153 765kV Sub-stations 765/400kV
Sipat Generation 2x1000 MVA 2000
Seoni 2x1500 MVA 3000
TOTAL MVA 5000

Transmission Planning & National Grid Working Group on Power for 11th Plan
Page 15 of Chapter 2
765kV transmission line and substation programme for the 11th Plan period is:
Table 2.5
765kV Transmission Lines ckm / MVA Sasaram-Fatehpur S/C ckm 400 Fatehpur-Agra S/C ckm 330 Agra-Gwalior Line-2 S/C ckm 140 SipatPP-Seoni Line-3 S/C ckm 340 SipatPP-Sipat S/C ckm 30 Seoni-Bina S/C ckm 330 Seoni-Wardha Line-1 S/C ckm 210 Seoni-Wardha Line-2 S/C ckm 210 Gwalior-Bina Line-1 S/C ckm 300 Gwalior-Bina Line-2 S/C ckm 300 Sasaram-North K. Pura S/C ckm 180 North K. Pura-SipatPP S/C ckm 350
TOTAL 5273 765kV Sub-stations 765/400kV Unnao (UPPCL) MVA 2000 Agra MVA 3000 Meerut MVA 3500 Fatehpur MVA 3000 Gwalior MVA 3000 Bina MVA 2000 Seoni 3rd transformer MVA 1500 Wardha MVA 4500 Sasaram MVA 2000 TOTAL 24500
* In State Sector (UPPCL) 2.3.8 HVDC Transmission System HVDC Bi-Pole, Mono-Pole and Back-to-Back transmission at the beginning of 11th Plan:
Table 2.6
HVDC Bi-pole System ckm (2xroute
km) MW
Capacity Chandrapur-Padghe(MSTCL) ± 500kV 1504 1500 Rihand-Dadri ± 500kV 1634 1500 Talcher-Kolar ± 500kV 2738 2500 TOTAL HVDC bi-pole 5876 5500 HVDC Monopole Barsur-Lower Sileru 200kV 162 200 HVDC Back-to-back Vindhachal 500

Transmission Planning & National Grid Working Group on Power for 11th Plan
Page 16 of Chapter 2
Chandrapur 1000 Gazuwaka 1000 Sasaram 500 TOTAL back-to-back 3000
HVDC transmission system programme for the 11th Plan period is:
11th Plan Programme
HVDC Bi-pole System ckm (2xroute
km) MW
Capacity Balia-Bhiwadi ± 500kV 1800 2500 Biswanath-Siliguri-Agra ± 800kV 3600 6000 TOTAL 5400 8500
2.3.9 Inter-State Transmission Schemes – Status All of the 11th plan inter-state transmission schemes to be commissioned by 2009 have already been firmed-up and are under execution. Most of schemes required by 2009-11 have also been evolved, discussed in the regional standing committees on power system planning, firmed-up and are to be taken-up for execution so as to complete and commission as per the target. However, a few transmission schemes, particularly those required for evacuation system and regional system strengthening schemes corresponding to those newly identified/uncertain generation projects where execution/beneficiaries are yet be firmed-up are yet to be firmed-up. Process to firm-up these remaining 11th plan transmission schemes which may be required for completion towards the last years of the 11th plan is under way. List of 11th Plan Inter-State Transmission Scheme is given at Appendix-2.8 2.3.10 Other Related Important Schemes in the Central Sector
Load dispatch schemes for National and Regional dispatch centres With integrated operation of all-India system, state of art load dispatch system at the national level would need to be established. The regional level load dispatch would also require up-gradation, both qualitative as well as quantitative, to meet the requirement of growing size of the system and emerging complexities of power system operation.
Comprehensive upgrading of protection system for total integrated
system for security of National and Regional grids A unified scheme covering comprehensive upgrading of protection system for total integrated system is proposed under the 11th Plan programme. This scheme to be taken-up in the Central sector for implementation by Power Grid Corporation of India would provide for overhaul and upgrading of protection system and equipment covering all the system elements including those in the States' system, which have direct bearing on the security of the National and Regional grids.

Transmission Planning & National Grid Working Group on Power for 11th Plan
Page 17 of Chapter 2
National Power Exchange System
For facilitation trading through double-sided bidding on a national platform towards optimum utilization of generation resources, establishment of a Power Exchange at National level is envisaged to be implemented during the early years of 11th Plan.
Evolving perspective transmission plan for the 12th Plan
With freer market system and number of merchant generation plants increasing, transmission planning for the 12th Plan period would pose new challenges. Transmission system would have to be evolved with much higher uncertainty in projected generation-demand match-up scenario. Towards meeting this challenge, it is proposed to take-up the transmission planning for 12th Plan as a planned scheme in which the system evolved by the in-house expertise with in the country would be discussed with utilities of other developed and fast developing countries and international experts before firming-up the development program. In this scheme, software for Power System Planning would also be upgraded to the state of art software.
Augmentation of test facilities
Augmentation of facilities for testing of transmission equipment within the country is needed for enabling timely procurement of reliable equipment in transmission based on improved and tested designs.
2.3.11 Transmission System under State Sector A well planned and reliable transmission system at the National and Regional level would need to be complemented with development of matching transmission system at 220kV and 132kV and also the sub-transmission and distribution system so as to cater to the load growth and ensure proper utilisation of development in generation and transmission facilities for the ultimate goal of delivery of the services up to the end consumers in the country. Inadequate development of sub-transmission and distribution system facilities in the States of NER has been adversely affecting the reliability of power supply to the consumers and also hampering the load growth in the region. The transmission, sub-transmission and distribution systems of states require major strengthening/up-gradation. Transmission lines that are under outage require speedy restoration for bringing them into operation so that the states could avail their central sector shares as well as utilize their own generation without any constraint. Inadequacies in the transmission and distribution system had been on account of slow implementation of schemes due to various factors such as time consumed in E&F clearances, land acquisition, RoW constraints, fund limitation, organizational difficulties of state utilities, lack of vendor response due to locational factors, law and order, terrain specific difficulties, etc. Due to limited funding capabilities of state utilities, most of the required transmission projects are generally funded by NEC or by NLCPR under DONER and investment/funding approval of scheme so funded also takes additional time. All these issues need to be addressed to achieve the accelerated demand growth in NER.

Transmission Planning & National Grid Working Group on Power for 11th Plan
Page 18 of Chapter 2
Transmission schemes for intra-state transmission system, load dispatch schemes for state and area dispatch centres and schemes for upgrading of protection systems for security of state grids are also required to be firmed-up by the state transmission utilities. Intra-state transmission schemes for evacuation of power from generation schemes in the state sector are given at Appendix 2.9. 2.4 TECHNOLOGY DEVELOPMENT
2.4.1 Needs for Technology Development Indian Power System is growing at a rapid pace with the mission to achieve “Power to all by 2012”. For transfer of power from the generation resources to unevenly distributed major load centres, Regional grids have been developed and integration of all the five (5) Regional Grids to form a strong National Grid is also going on with increasing pace. Today, National Grid of 11,500 MW inter-regional capacity is under operation, which shall be enhanced to about 37150 MW by end of XI Plan i.e. 2011-12. Except Southern Region, all the other four regions are now connected synchronously, thus forming a 88 GW synchronous grid. To ensure secure and reliable operation of the large integrated grid on a real time basis use of latest technology and search and development of new technologies to inevitable. Five regional load dispatch centres equipped with modern State-of-the-Art technology along with dedicated communication facilities are in operation and work on a National Load Dispatch centre is in progress. Establishment and real time operation of large T&D infrastructure of present day technology poses challenges for conservation of eco-sensitive Right of Way, environment & forest, implementation time, automation of substation, project cost and grid management. Therefore, it is necessary to modernize the power transmission network by integrating latest technologies suitably into the development plan to ensure maximum utilization of existing transmission infrastructure, provision of open access, phase-wise generation development and implementation in a time bound and cost effective manner. 2.4.2 Adopting New Technologies in Transmission System New technologies should be adopted and implemented in a proactive manner to achieve the objective of optimum utilization of the available transmission assets as well as conservation of Right-of-Way, reducing transmission costs, reduction of losses etc. Some of the new technologies adopted/being adopted in its transmission system include:
• High capacity 6000MW +800kV HVDC system • 765kV AC Transmission System • Ultra High Voltage AC Transmission System(1000kV) • Application of Series Compensation • Flexible AC Transmission System (FACTS) • Upgradation/Uprating of transmission line

Transmission Planning & National Grid Working Group on Power for 11th Plan
Page 19 of Chapter 2
• High temperature endurance conductor • Tall/Multi-circuit & Compact tower • High Surge Impedance Loading Line (HSIL) • Remote operation of substation, substation automation and Gas Insulated
substation (GIS) • All Aluminium Alloy Conductors (AAAC) and Polymer/Composite Insulators. • Development of disc insulators of 320kN & 420kN indigenously for both AC &
HVDC applications, as import substitution. • Indigenous development of semi-conducting glazed insulators (Offering better
pollution performance) • Introduced source/process inspection of equipment to ensure zero defect • Airborne Laser Terrain Mapping (ALTM) for detailed route survey • Thermo-vision scanning of the lines and sub-stations • Conditional monitoring of equipment • Preventive maintenance of Transformers using State-of-art Oil testing
laboratories set up by the company • Emergency Restoration System (ERS)
For modernization of transmission system through latest technology integration, two pronged strategies have been envisaged as under:
Enhance capacity and reliability of existing systems through: Suitable technology for new systems keeping the long term perspective
2.4.3 Modernisation of Existing Transmission Infrastructure To ensure maximum utilization of existing infrastructure, a number of technologies have been implemented.
Series compensation and facts Upgradation of lower voltage to higher voltage line Re-conductoring of transmission line Technology adoption for new transmission system Enhancement of conductor maximum temperature limits High capacity 400kV multi-conductor and 765kV system Compact towers High capacity HVDC system Ultra high voltage (1000kV) AC transmission system Modern line route survey technique Substation compaction, GIS, automation and remote operation High surge impedance loading line(HSIL) Fault current limiting reactor Grid operation and management Intelligent Grid Wide Area Monitoring System(WAMS)

Transmission Planning & National Grid Working Group on Power for 11th Plan
Page 20 of Chapter 2
2.4.4 Search for New Technologies New technologies are also needed to find solution to some the problems being faced in the transmission system. Currently important issues are stability enhancement, engineering and design for the next higher voltage, and reduction of right of way requirement for transmission lines. FACTS and PSS tunings should be considered in this context. The failure of extra high voltage transformers is also a matter of concern. Power transformers and converter transformers have failed in large numbers in the country and through appropriate research and development input, this is required to be corrected. 2.4.5 Open Access It is also important that the finances for the Transmission Schemes of the National Grid are arranged at low cost so that required reliability and margins for open access could be provided in the transmission system with in acceptable costs. The evolved transmission system expansion plan provides sufficient transmission capacities with inherent margins for trading transactions. This also meets the intra-regional transmission needs. Taking-up the execution of the transmission schemes for timely completion would depend on timely tie-up of pre-construction activities and thereafter construction being ensured within specified time period. Agreement on the proposal together with commercial tie-up for payment of transmission charges based on long-term open access application becomes a critical issue in this context. As the Merchant plants would basically be long term-user of the transmission system, the transmission system for their connectivity and meeting their primary transmission needs can be planned and taken-up for construction based on commitment for the transmission charges by the developers of the Merchant plants. The process for long-term open access application and tying-up the transmission schemes should be done at the earliest as building the transmission system including obtaining necessary approvals, pre-construction and construction/commissioning activities for the transmission schemes require almost same time, if not more, as that for implementation generation projects. 2.5 TRANSMISSION REQUIREMENTS FOR OPEN ACCESS AND TRADING 2.5.1 Assessment of Transmission Capacity Requirement The focus of transmission system development programme for the XI Plan is to provide adequate inter-regional and intra-regional transmission capacity so as to consolidate and strengthen the National Grid network towards a strong All India Grid. The inter-regional power exchange requirement has been assessed from possible scenarios of regional surpluses and deficits for the peak and off-peak conditions of winter, summer and monsoon months, and projections assessed. The projection based on programme of generation and anticipated demand aims at estimating the transmission requirement at the inter-regional level. Grid expansion plan evolved based on this projection would be able to cater to the needs of various feasible

Transmission Planning & National Grid Working Group on Power for 11th Plan
Page 21 of Chapter 2
operating scenarios and also provide required margins to support market oriented power exchanges. 2.5.2 Transmission Capacity for Trading The above method adopted for evolving the transmission system expansion plan provides sufficient transmission capacities which would have inherent margins for trading transactions. Transmission system implemented on the basis of the expansion plan evolved in this manner would enable trading across the regional boundaries towards optimal utilization of generation resources in the country for ultimate benefit of the consumer. As the system is evolved based on extreme dispatches, it would facilitate trading most of the time without congestion, and occasionally, under outage contingencies or severe loading condition with some degree of congestion which should be acceptable. Currently, trading is taking place through short-term bilateral contracts. With introduction of Power Exchange at National level, which is being envisaged to be in place in near future, trading would also take place through Power Exchange which would be day ahead contracts. All the short term as well as Power exchange transaction would need transmission capacity which would come out of the spare capacity inbuilt in the transmission system. The reliability and operational margins in the planned and implemented transmission system corresponding to the committed long-term transmission needs would provide the transmission capacity for trading of power. 2.5.3 Pre-construction tie-ups are Critical The comprehensive transmission system evolved on national basis and also meeting the intra-regional transmission needs, has been assigned under various schemes – power evacuation schemes matching with generational capacity addition programme and system strengthening schemes matching with anticipated growth in demand in the various areas. Agreement on the proposal together with commercial tie-up for payment of transmission charges based on long-term open access application becomes a critical issue in this context. Generation capacity used for trading transactions should have commitment for long-term transmission charges The short-term or Power exchange transactions may take place out of generation capacities for which transmission system have been provided based on commitment of long-term transmission charges to be paid either by the generator or by the identified beneficiary having long-term PPAs from such generation. The short-term or Power exchange transactions may also take place out of generation capacities for which there is no commitment of long-term transmission charges. The transactions of the second kind would reduce the reliability margins of the transmission system provided based on long-term commitments. Inter-regional trading transactions out of generation capacities for which transmission system is provided only in the region where the generation is located and not in the region where the transacted power is sold are also akin to the second kind for the importing region as well for the inter-regional transmission. In a developing system, depletion or reduction of reliability of the transmission system by generators intending to sell through short-term trading without tying-up and committing for the transmission charges corresponding to their

Transmission Planning & National Grid Working Group on Power for 11th Plan
Page 22 of Chapter 2
full requirement would be harmful. As such, it would be necessary that all generation capacities intended to be utilization through trading transactions should provide commitment for long-term transmission charges. 2.5.4 Transmission Charges for Short-Term Open Access Levy of open access transmission charges at reduced rates would be justified for short-term or Power exchange transactions of the first kind that is those taking place out of such generation capacity for which long-term transmission charges have also to be paid. However, levy of open access transmission charges at reduced rates may not be justified for short-term or Power exchange transactions of the second kind, that is those taking place out of such generation capacity which are created without commitment for long-term transmission charges. 2.5.5 Transmission Capacity Margins Transmission capacity through creation of additional transmission system could be provided based on long-term commitment for the transmission charges. It has been estimated that reliability and operation margins would be generally of the order of 25-30% of the transmission capacities required for meeting the firm transmission needs of the long-term committees. This level of redundancy would generally provide sufficient margins for trading needs. However, it should be noted that short-term open access (STOA) transactions operating on these margins, even if curtailable, cause reduction in the security level. Therefore, unless margins are increased by design, the system operator would have tendency to keep cushions by underestimating the operational margins. As the system security is of paramount importance, creation of increased margins by design becomes essential for accommodating STOA. This involves costs which are in addition to the cost of incremental losses caused by STOA. Both these costs should be recovered from STOA customers. Lesser charges for STOA would dissuade long-term commitments for transmission charges leading to retarded growth in transmission system. 2.5.6 Transmission System for Merchant Plants Merchant plants would sell their power to customers who are not predetermined through Power exchange contracts. However, they are long term-user of the transmission system. The transmission system for the connectivity of the merchant plant as well as for meeting their transmission needs is required to be planned and built matching with the implementation of the merchant generation plant. Also, some of the generation plants have only a part of their generation capacity tied-up in long-term bi-lateral PPAs. When such plants seek long-term open access only for a part of their full generation capacity, they inherently also seek connectivity for the remaining capacity which would be available with them as a merchant plant capacity. As the transmission system in both the cases would be required to be planned and implemented corresponding to the full requirement, they are long-term beneficiary of the transmission system. For proper planning and implementation of transmission system, the merchant generators need to inform about region(s) in which they would generally sell their power, so that transmission system requirement for evacuation of their power and transmitting it to identified load centres could be assessed and any additional capacity required could be planned. As building the identified transmission
Transmission Planning & National Grid Working Group on Power for 11th Plan
Page 23 of Chapter 2
schemes including obtaining necessary approvals by the identified transmission company /companies would generally require almost same time as that for implementation generation projects, firming up of sellers and assessment of transmission requirement should be started at the earliest. 2.5.7 Need for Revising Transmission Tariff Design As, the merchant plants would not have long-term commitments for selling of their power, a transmission tariff design is needed in which such generators could share the transmission charges proportionate to their generation capacity. Also, there is an urgent need for National concept in transmission tariff so as to address the issue of high transmission charges in the North-eastern region as well enabling expeditious development of long-haul inter-regional transmission corridors. However, National pooled transmission tariff should not be on flat postage stamp method. We know that the flat postage stamp method applied in the regional pooled transmission tariff puts the load centric generation at a disadvantage, but is acceptable in the regional system on account of its simplicity and generation resources within the region being fairly dispersed and thus moderating the effect of distortion. However, application of flat postage stamp method in National pool tariff would totally distort the economics of load centric generation as the physical disposition of generation resources in the country is quite uneven and the transmission distances quite large. Also, the techno-economic considerations highlight the need of directional sensitivity in transmission tariff design. A pragmatic change in the transmission tariff design is needed so as to capture the sensitivity of locating and dispatching the generation resources and give proper tariff signals towards optimizing the choices. Zonal Matrix Transmission Tariff design suggested by CEA should be considered in this context. Regulations for connectivity of merchant generation capacity, transmission capacity of Power exchange and need for new transmission tariff design are all related issues which seek a comprehensive solution towards facilitation trading coupled with optimal choices in locating and dispatching generation and also attracting investments in strengthening transmission network that would be needed to top-up the system reliability effected by market determined transactions. 2.6 POWER EXCHANGE WITH NEIGHBORING COUNTRIES India has bilateral cooperation for power exchange with Nepal and Bhutan. The terms of co-operations with Bhutan also includes development of hydro power projects and power system in Bhutan which has fructified in accelerated development of the projects in Bhutan. With other South Asian Nations, namely Bangladesh, Pakistan, Myanmar, Thailand and Sri Lanka, discussions have been held from time to time on possible road map for co-operation between the South Asian Nations in the forum of SAARC and BIMSTEC initiatives. The discussions have covered many areas including power. However, as yet, there is no agreed co-operation for exchange of power with any other Nation except Bhutan and Nepal.

Transmission Planning & National Grid Working Group on Power for 11th Plan
Page 24 of Chapter 2
2.6.1 India-Bhutan India and Bhutan have terms of cooperation for development of hydro generation and power system in Bhutan and power supply to India for mutual benefit of both the countries. Hydro Projects at Chukha (336 MW), Kurichu (60 MW) and Tala (1020MW) in Bhutan have been implemented with technical and financial assistance of India. Transmission system for export from Bhutan to India has also been developed with these hydro generation projects. The transmission system developed with these projects is: 220 kV Chukha (Bhutan)-Birpara (India) (3 circuits) and 132 kV Kurichu-Gelphu (Bhutan) – Bongaigaon/Salakati (India) (single circuit) lines. Tala HEP (6x170 = 1020 MW) is also being implemented with Indian technical and financial assistance. As the internal demand in Bhutan is much less as compared to capacity of the generation projects, most of power from Tala HEP would also be exported to India. Two nos. of 400 kV double circuit lines from Tala HEP (Bhutan) to Siliguri (India) have been provided along with the generation project. The first unit of 170 MW at Tala HEP has been commissioned on 29.7.2006 and the other units are being commissioned progressively and it is expected that all units at Tala HEP will be commissioned by the end of this year. Phunatsanchhu-I (1000MW), Phunatsanchhu-II (1000MW) and Mangdechhu (600MW) hydro electric projects in Bhutan have also been envisaged to be developed with Indian cooperation and investigation/DPR activities have been taken-up. Comprehensive transmission system for power evacuation from these projects have been tentatively evolved and would be firmed-up and developed in a phased manner matching with phased development of the generation projects. Commissioning of these projects is being tentatively programmed during 2011-14. Power imported from these projects would be pooled at Siliguri and further transmission to the stated of Northern region and Western region is planned through HVDC system. India also exports power to Bhutan during winter period when there is reduced hydro generation in Bhutan. Power import from Bhutan in the last 3-years is as under:
Year Total power import by India from Bhutan (MU)
2003 1748 2004 1735 2005 1764
Following transmission lines are existing between India and Bhutan:
• 400kV 2xD/C Tala(Bhutan) – Siliguri(West Bengal, India) • 220 kV,1xD/C, Chukha(Bhutan)-Birpara ( West Bengal, India) • 220 kV,1xS/C, Chukha(Bhutan) -Birpara( West Bengal, India) • 132 kV,1xS/C, Kurichu(Bhutan) -Gelephu(Bhutan)-Salakati
(Assam,India)

Transmission Planning & National Grid Working Group on Power for 11th Plan
Page 25 of Chapter 2
• 33kV(operated at 11kV),1xS/C,Tamulpur(Bhutan)-Rangia(Assam, India) • 11 kV, 1xS/C,Udalguri(Bhutan) -Daifam(Assam, India) • 11 kV, 1xS/C,Banarhat(Bhutan) -Samtse(West Bengal, India) • 11 kV, 1xS/C,Jaldhaka(Bhutan) - Sibsoo(West Bengal,India)
2.6.2 India-Nepal India has terms of co-operation for exchange of power with Nepal. The inter-border exchange of power between India and Nepal has been taking place for mutual assistance in supplying to border areas of the two countries. Bilateral exchange of power between India and Nepal is taking place since 1971, between contiguous areas on the border of India and Nepal. These bilateral exchanges between India and Nepal take place through various interconnecting lines at 11 kV, 33 kV and 132 kV between Nepal and the bordering States of India viz. Bihar, Uttaranchal and U.P. The exchange of power between the two countries is taking place between Nepal Electricity Authority (NEA) and U.P. Power Corporation Ltd (UPPCL), Uttaranchal Power Corporation Ltd (UPCL), Bihar State Electricity Board (BSEB). Only Bihar has bi-directional exchanges with Nepal. While UP and Uttaranchal only export power to Nepal. Quantum of power exchange between the bordering States of India and Nepal during the last three years is the following:-
BSEB (Bihar)-NEA (Nepal)
Year Import from Nepal (MU)
Export to Nepal (MU)
2003 166 82 2004 102 131 2005 114 204
UPPCL (Uttar Pradesh, India NEA (Nepal)
Transmission lines between Nepal and Bordering States of India
BSEB(Bihar)- Nepal: 132kV Gandak- Ramnagar 132kV Bhantabri – Duhabi 132kV Gandak east – Gandak 33kV Bhadrapur – Thakurganj 33kV Birganj – Raxaul 33kV Kataiya – Biratnagar
Year Export to Nepal (MU)
2002 15.5 2003 13.3 2004 6.1

Transmission Planning & National Grid Working Group on Power for 11th Plan
Page 26 of Chapter 2
33kV Kataiya – Rajbiraj 33kV Sitamarhi – Jaleshwer 11kV Biratnagar – Jogbani 11kV Jainagar – Siraha 11kV Birgania – Gaur UPPCL(UP)- Nepal: 33kV Pallia-Dhangarhi 33kV Itwa-Krishnanagar 33kV Anandnagar-Bhairwan 33kV Nanpara-Nepalganj 11kV Tulsipur-Koilabasa UPCL(Uttaranchal)- Nepal: 33kV Lohiahead – Mahendranagar 11kV Pithoragarh – Baitadi 11kV Dharchula – Jaljibe 11kV Dharchula – Pipale
2.6.3 India-Pakistan No transmission link is existing between India and Pakistan. During 1998-1999, Government of India considered a proposal from Pakistan for export of power from Pakistan to India. However, no progress was made as the talks got bogged down on issues relating to tariff for power to be purchased from Pakistan. 2.6.4 India-Bangladesh No transmission link is existing between India and Bangladesh. During 1997-98 proposal for exchange of power between India and Bangladesh was considered under the aegis of ADB. Though couple of meetings was held in the past between the two governments no progress/agreement has since then taken place. 2.6.5 India-Sri Lanka No proposals have been formally discussed between the two countries. A study on viability of inter-connection with Sri Lanka was carried out in 2002 by M/s Nexant under USAID, SARI/E program. Recently, Nuclear Power Corporation of India Limited has mooted a proposal for supply 400 MW to Sri Lanka for which HVDC inter-connection has been proposed. However, there has been no discussion with Sri Lanka on these proposals. 2.6.6 India-Myanmar Talk of co-operation had been in reference to Tamanthi HEP (tentative 1200 MW) in Myanmar from which power was also proposed to come to India.

Transmission Planning & National Grid Working Group on Power for 11th Plan
Page 27 of Chapter 2
2.6.7 Formation of SAARC Grid SAARC has number of technical committees to implement, coordinate and monitor the programmes in their respective areas of co-operation. There is a technical committee for co-operation on energy. First meeting of SAARC technical committee was held in Dhaka on 17-18 Nov. 2002 in which various issues including possibility of creation of regional power grid between India, Bhutan, Nepal and Bangladesh was discussed. The Indian position in this regard was that creation and growth of cross border transmission links depended on identification of commercially viable electricity flows from generating stations to load centres. The flows through the Indian grid could take place through displacement. The meeting recommended that the matter might be discussed further between the countries of India, Nepal, Bhutan and Bangladesh with a view to evolving suitable arrangements in that regard. No progress/agreement has since then taken place. 2.6.8 BIMSTEC BIMSTEC (Bay of Bengal Initiative for multi-sectoral technical & economic co-operation) has members from Bangladesh, Bhutan, Nepal, Myanmar, India, Sri Lanka, and Thailand. The first BIMSTEC Energy Ministers Conference was held in New Delhi on 4th October 2005. Subsequently, a workshop on BIMSTEC Energy Centre was held in New Delhi on 25-27 January, 2006 as per the agreed Plan of Action for energy co-operation in BIMSTEC. The concept note on BIMSTEC Energy Centre is under consideration. It is proposed that the India would be the host country for the BIMSTEC Energy Centre. Draft MoU for the BIMSTEC grid interconnection circulated during the task force meeting for BIMSTEC Power Exchange and development Project held on 28-29th March’06 in Bangkok inter-alia included principles and objectives, institutional arrangements which would form a framework for the member countries to cooperate works towards the implementation of grid interconnection for the trade in electricity in the BIMSTEC region. The next (second) BIMSTEC Summit is likely to be held in February 2008. 2.7 RELIABILITY ISSUES AND GRID OPERATION 2.7.1 Planning for a Reliable Power System
The key to a reliable power system is made up of the following levers: ➢ Adequacy of the provisions with planned level of redundancies sufficient to
deliver the desired reliability ➢ Secured operation maintaining sufficient margins at all times so as to
maintain system loading within such limits that contingencies do not lead to loss of system integrity
➢ Best practices in maintenance – both preventive as well as restorative
To facilitate orderly growth and development of the power sector and also for secure and reliable operation of the grid, adequate margins in transmission system should be created. A Reliable power system can be planned through centralised planning of Regional and National grid systems coupled with matching development in the State grid systems. This would require adequate

Transmission Planning & National Grid Working Group on Power for 11th Plan
Page 28 of Chapter 2
and timely investments with coordinated action for implementing the schemes. The needs are: • Augmenting transmission capacity matching with generation additions • Adequate redundancies as per specified criteria to provide the desired
reliability margins • Development of transmission system for power evacuation as well as
system strengthening
11th Plan transmission plan/programme has been evolved meeting the above requirement. Transmission capacities have been planned to cater to the specified redundancy levels as per the planning criteria adopted in line with international standards and practices.
The major highlights of transmission planning criteria in are:
➢ The transmission system planned in an integrated manner optimizing the total network including that under the CTU as well as that for the STU(s).
➢ Criteria for mesh/loop network: • 'N-1' adopted in general. 'N-2' adopted for transmission system from
large generating complex (3000 MW or above) and multi line corridors (3 D/C lines or more), on case to case basis.
• In 'N-1' system adequacy without necessitating load shedding or rescheduling of generation during steady state operation.
• In 'N-2' system adequacy without necessitating load shedding but could be with rescheduling of generation during steady state operation.
• 'N-1' withstand without necessitating load shedding or rescheduling of generation during steady state operation –
• Outage of a 132kV D/C line, or • Outage of a 220kV D/C line, or • Outage of a 400kV S/C line, or • Outage of single Interconnecting Transformer, or • Outage of one pole of HVDC Bipole line, or • Outage of a 765kV S/C line without series compensation.
• 'N-2' withstand without necessitating load shedding but could be with rescheduling of generation during steady state operation -
• Outage of a 400kV S/C line with TCSC, or • Outage of a 400kV D/C line, or • Outage of both poles of HVDC Bipole line, or • Outage of a 765kV S/C line.
• The above contingencies considered with a pre-contingency system depletion (Planned Outage) of another 220kV D/C line or 400kV S/C line in another corridor and not emanating from the same substation. Operation of all the Generating Units within their reactive capability curves and the network voltage profile within voltage limits specified.
➢ For requirement of reliability, planning criteria for evacuation system for Nuclear power station is to consider outage of one circuit assuming pre-contingency depletion of another circuit from the same station. This is effectively N-2 without rescheduling but with no other pre-contingency.
➢ 'N-2' also for large cities with a power demand of 2000 MW or above

Transmission Planning & National Grid Working Group on Power for 11th Plan
Page 29 of Chapter 2
➢ Inter-regional transmission capacity based on requirement arising on account of regional variation in surpluses and deficits during the peak and off-peak hours of different seasons viz.: Summer Peak Load; Summer Off-peak Load; Winter Peak Load; Winter Off-peak Load; Monsoon Peak Load; Monsoon Off-peak Load; Dispatch scenarios for maximizing transfer in specific inter-regional corridors considered to determine the adequacy of transmission system to take care of requirement of regional diversity in inter-regional export / import. Sensitivity in respect of generation dispatch or load demand causing increased burden on transmission system considered.
2.7.2 Growth Objectives
A well planned and reliable transmission system will ensure not only optimal utilization of transmission capacities but also of generation facilities and would facilitate achieving ultimate objective of cost effective delivery of power. Development of the transmission system thus planned would meet the following objectives:
Similar level of development of transmission system across the country Transmission system for optimally utilizing the hydro-thermal mix of generation resources taking into account the concentration of coal in the eastern part of the country and hydro power sources in the north - eastern and northern parts of the country.
Obtaining the advantages of diversity based exchanges of power; that is, exchanges on account of regional variations in generation and demand pattern arising due to geographical, seasonal, time of day and operational diversities.
Formation of National Power Grid that would enable exploitation of unevenly distributed generation resources in the country to their optimum potential. For the full utilization of the generating capacity in the eastern part of the country, an adequate transmission system has been planned linking the North-eastern and Eastern part of the country with the Northern, Western Southern regions aiming that no generating capacity is rendered idle due to transmission constraints.
Continued development of Regional Grids so as to meet the transmission needs within each of the regions catering to the power evacuation from generation capacity additions and strengthening in the regional grids addressing requirements of specific areas.
Transmission system strengthening schemes to overcome the deficiencies and provide a reliable transmission grid that has margins for open access and also provides to cater to changes in the pattern of power flows for inter-state transmission arising on account of capacity additions for intra-state benefits.
2.7.3 Development Needed in State sector A well planned and reliable transmission system at the National and Regional level would need to be complemented with development of matching transmission system at 220kV and 132kV and also the sub-transmission and distribution system so as to cater to the load growth and ensure proper utilisation of development in generation and transmission facilities for the

Transmission Planning & National Grid Working Group on Power for 11th Plan
Page 30 of Chapter 2
ultimate goal of delivery of the services up to the end consumers in the country.
2.7.4 Timely Implementation to Ensure Delivery of a Reliable Power System to the System Operators If the desired reliability is to be achieved, all the utilities, both in the Central sector as well as State sector would need to ensure timely implementation of the schemes. A task force under the chairmanship of Member (Power Systems), CEA constituted by Ministry of Power, in its report of August 2005 has recommended the following:
(1) Parallel Processing of Activities A transmission project involves various activities from concept to
commissioning. The Task Force observed that major reduction in project implementation schedule is possible by undertaking various preparatory activities (viz. surveys, design & testing, processing for forest & other statutory clearances, tendering activities etc.) in advance/parallel to project appraisal & approval phase and go ahead with construction activities once Transmission Line Project sanction/approval is received.
(2) Packaging Concept Total transmission project should be broken down to clearly defined
packages such that the packages could be procured & implemented requiring least co-ordination & interfacing and at same time it attracts competition facilitating cost effective procurement. The size & scope of the different packages will therefore depend on magnitude & location of project. However, the packages should be few and supply-cum-erection type contracts should be preferred to avoid co-ordination problems. The Task Force suggested typical packages for procurement / construction of Transmission system.
(3) Standardization of Designs To avoid repetitive work and uncertainties during testing, the tower
designs should be standardized. It is desirable that the designs are standardized and development by Utilities prior to floating of tenders for tower fabrication and construction so that 6-12 months or more time can be saved in project execution. Standardization of designs/drawings for other transmission line materials & substation structures, equipments, control room building etc. also should be standardized to the extent possible.
(4) Qualifying requirements for Vendors/Bidders In order to select contractors of appropriate capability & capacity it is
required that Qualifying requirements in respect of technical resources, financial capability, production capacity, tools & plants etc are stipulated in bidding documents and contractors are selected accordingly.
(5) Bidding Document & Bidding Philosophy The bidding documents should furnish all information necessary for a
prospective bidder to prepare a bid for the goods and works/services to

Transmission Planning & National Grid Working Group on Power for 11th Plan
Page 31 of Chapter 2
be provided. The technical specifications and conditions of contract need to be unambiguous. Considering volatility of the input cost, it is desirable that contracts are invited with suitable price variation provisions such that contract price is adjusted based on published indices of raw materials & labour. Single stage bidding may be practiced for transmission line & substation works with appropriate packaging and qualification requirement.
(6) Route Alignment, Detailed Survey & Soil Investigations It is desirable that the project is defined to finer details to the extent
possible at the FR / Notice Inviting Tender (NIT) stage for effective planning and scheduling of project(s) besides optimization of resources. New technology/ techniques such as use of satellite imagery, GPS, total stations, computer-aided tower spotting etc. for getting realistic information/details leading to selection of optimum route alignment and facilitating realistic estimation of bill of quantities have been suggested. To avoid large quantity variations during execution stage, which can be a cause of dispute/delay, it would be desirable to carryout detailed survey before NIT.
(7) Mechanization in Construction, Quality Management System etc. Thrust is to be given towards use of new technologies & mechanized
means for construction of transmission projects to reduce time. Besides implementation of standardized Manufacturing & Field Quality Plans, utilities should also adopt prompt and transparent Inspection Management System for smooth implementation of the project.
(8) Environment, Forest Clearance and Rehabilitation & Resettlement
(R&R) Advance action should be taken for processing forest clearances. With
adoption of modern survey t9chniques, it is possible to minimize the infringement with forest as various alternatives can be analyzed. It is also helpful in convincing the concerned Authorities for expediting clearances, as better evaluation of forest involvement is possible. It is also desirable that Environment & Social Policy & Procedures (ESPP) are required to be framed by utilities through consultative process. Such initiatives would assist in settlement of R&R and environmental issues expeditiously and avoid delays on this account.
(9) Vendor Development A large number of projects would be taken up by many utilities
concurrently for construction due to the large transmission programme to be implemented in limited time frame. It is, therefore, recommended that active vendor development initiatives are to be taken by all utilities so that indigenous capabilities are effectively developed and adequate supplier/ vendor base is created to have competitive prices and timely completion of projects.

Transmission Planning & National Grid Working Group on Power for 11th Plan
Page 32 of Chapter 2
(10) Project Monitoring A master network for the entire project from concept to commissioning
need to be prepared and monitored regularly with reference to the target and required actions are taken. Similar detailed network is also to be prepared for each package for monitoring activities at micro level. Regular reviews should be done at Project Manager level and quarterly review at Chief Executive level also is recommended.
(11) Various aspects as brought out above were deliberated in depth by the
Task Force, however, project authorities need to review and adopt depending upon the size nature, location and complexities of the project on case-to-case basis. A reasonable time schedule for a specific project is required to be tailor-made for each project element like transmission line, substations, HVDC terminals etc. depending on its size, nature & complexity. Further, in case of large projects where many such project elements are involved, suitable time periods need to be provided for each element and the overall project completion schedule is to be accordingly decided.
2.7.5 Load Dispatch and Communication Facilities
The availability of adequate load dispatch and communication facilities is necessary for the smooth interconnected operation of the power system. The would require a full fledged National Load Dispatch Center apart from upgrading the existing Regional Load Dispatch Centers and State Load Dispatch Centers. For enabling him to operate the system in a secured and reliable manner, the load dispatcher should be provided with state of art tools equipped with required telemetry, communication, computerized real-time data acquisition systems and necessary supervisory control facilities for efficient operation of the power system. At the National level, practically all the system starting from the functional specification, is to be developed picking the telemetry from Regional systems and building all the application functions needed for the National Load Dispatch Center. At the regional level though considerable data acquisition and communication facilities have been created, these are not yet sufficient for implementation of state of art functions such as state-estimation/data validation, contingency evaluation, optimal load flow, security margin estimation, etc. For improving the operational reliability while utilising the system to its fullest potential, it is necessary to upgrade the Regional load dispatch system to the state of art. At the state level there are deficiencies in many cases which require to be quickly removed so as to facilitate smooth integrated operation of the power system. System reliability also depends on quick restoration following any contingencies. In case there is partial or total system collapse, re-energisation and restoration of the system would be possible in a short time only if adequate load dispatch and communication facilities were available. As there would be a large number of organizations whose power systems would be connected in parallel efficient voice communication facilities would also be needed between the load dispatch centers and the control rooms of the various utilities. When Power exchange is put in place, necessary

Transmission Planning & National Grid Working Group on Power for 11th Plan
Page 33 of Chapter 2
communication facilities linking the Power exchange and the National Load Dispatch Center as well as Regional Load dispatch centers would also be needed.
2.7.6 Protection System
Power systems operating in synchronism should be provided with adequate defence measures such as islanding schemes and automatic load shedding schemes, so that following major incidents in the system, the system could continue to operate without cascade failure leading to black out in large areas. The protection schemes for the transmission lines, transformers, bus bars, generators and other important power equipments should be of the highest quality and should be properly coordinated. In order to cater to contingencies of loss of generation, under - frequency relays for load shedding (both flat frequency relays and rate of change of frequency relays) should be provided for shedding load automatically. Inter-regional flows should also be used for triggering appropriate protective action. This would prevent distress in the system from spreading. In case a part of the power system is under acute distress, it should be isolated out automatically from the remaining healthy part of the system in such a way that as much a part of the system as possible continued to operate. With such schemes, procedures for reconnecting the power systems in actual operation would also have to be devised. In this regard, the international experience of operating vast power systems in synchronism should also be drawn upon. It has been noted that there would be heavy power flow from the north - eastern and eastern parts of the country and the hydro-electric projects in the northern part of the country to other parts of the country. With integration of systems in synchronous mode creating combined system of large power number, the parameters determining level of grid security have changed. The variation in grid frequency has reduced and therefore, in integrated NR/ER/NER/WR system the frequency of 49.5 is like the frequency of 49.0 of the NR or WR system. Therefore under-frequency relays need to be reset at higher frequency cut-offs and the system should be considered in Alert state at those frequencies which were not so critical in earlier regional system operation. Also, the inter-regional and inter-area tie-line flows have become critical parameters for monitoring the security of the grid and the grid security is now to be judged more by the power flows rather than frequency. The system operators should therefore realign their strategies accordingly. The synchronous interconnection has also thrown open a vast horizon of operational opportunities for dispatch optimization utilizing inter-regional diversities. There is paradigm shift in system operation requiring a new set of practices and procedures for operational planning, scheduling, monitoring and grid security etc. which have to evolve with consolidation of experience of operating the large synchronously interconnected system.
2.7.7 Grid Operation and Management In view the growing complexities and change in market mechanism, it is necessary to continuously upgrade and modernize the Grid operation & control and communication facilities to operate large grid on real-time basis
Transmission Planning & National Grid Working Group on Power for 11th Plan
Page 34 of Chapter 2
dynamically with safety, security and reliability. Towards this, it is envisaged to develop Intelligent Grid with State-of-the-art features like wide area measurement, adoptive islanding, probabilistic assessment, Dynamic Stability Assessment (DSA) & Voltage Stability Assessment (VSA) technique, self healing grids etc. on a pilot scale.
2. 7.8 Best practices in Maintenance
The transmission utilities should maintain a high level of system availability and at the base level of system availability by adopting best practices. Emphasis should be given on both preventive as well as restorative maintenance. Emphasis should also be give to R&M programme, Residual Life Assessment and restoration efficiencies in Transmission.
2.8 FUND REQUIREMENT DURING 11TH PLAN FOR TRANSMISSION SYSTEM
DEVELOPMENT AND RELATED SCHEMES 2.8.1 Total Fund requirement for transmission system development and related
schemes has been estimated as following:
Rs Crore
Central Sector (Inter State Transmission System) 75000 State Sector (State Transmission System) 65000
TOTAL 140000
2.8.2 Fund Requirement during 11th Plan – Central sector schemes
Development of National and Regional grids and related systems would require the following types of schemes:
XI Plan Transmission Schemes for power evacuation and system
strengthening for Central sector generation capacity requiring inter-state transmission
Transmission schemes for IPP Generation Capacity seeking open access from CTU for inter-state transmission
Spill over expenditure of X Plan transmission schemes and advance action for XII Plan transmission schemes
Other related important schemes in Central sector
Fund requirement for above types of schemes during XI plan is estimated to be as following:

Transmission Planning & National Grid Working Group on Power for 11th Plan
Page 35 of Chapter 2
Rs Crores
Estimated RequirementXI Plan Transmission Schemes for 44000 MW of Central sector generation capacity requiring inter-state transmission
59200
Transmission schemes for IPP Generation Capacity of 6000MW seeking open access from CTU for inter-state transmission
8000
Spill over expenditure of X Plan transmission scheme And advance action for XII Plan transmission schemes
7000
Total Central Sector Transmission Schemes 74200 Other related important schemes in the Central Sector
Load dispatch schemes for National and Regional dispatch centres 500 Comprehensive upgrading of protection system for total integrated 200
system for security of National and Regional grids National Power Exchange System 50 Evolving perspective transmission plan for the 12th Plan 10 Augmentation of test facilities 40 Total other related important schemes in Central Sector 800
Total Central Sector 75000
2.8.3 Fund Requirement during XI Plan – State Sector Schemes Development of State grids and related systems would require the following types of schemes:
XI Plan Transmission Schemes of STUs for evacuation of state sector generation including intra-state open access to IPP Generation in state sector
STUs transmission schemes at 220kV, 132kV and 66kV to meet the transmission needs of growth in demand
Spill over expenditure of X Plan transmission scheme and advance action for XII Plan transmission schemes
Other related important schemes in the State sector for Renovation and modernization of aging transmission system, State/Area load dispatch system, Protection system up-gradation, and Software for planning and management information system.
Fund requirement for above types of schemes during XI plan is estimated to be as following:

Transmission Planning & National Grid Working Group on Power for 11th Plan
Page 36 of Chapter 2
Rs Crore Estimated Requirement XI Plan Transmission Schemes for 16000 MW of State sector and IPP generation capacity requiring intra-state transmission.
14400
STU transmission schemes at 220kV, 132kV and 66kV to meet the transmission needs of growth in demand. (State-wise details of normative assessment is given at Appendix 2.10)
28800
Transmission schemes for 220kV, 132kV and 66kV system in states of Assam, Nagaland, Bihar, Jharkhand, Goa and Uttar Pradesh for strengthening of transmission system in these states so that these states may cater to a demand level of at least 50% of National average. (Details of this assessment is also given in Appendix 2.10)
6000
Spill over expenditure of X Plan transmission scheme and advance expenditure on XII Plan transmission scheme
7800
Other related important schemes in the State sector for Renovation and modernization of aging transmission system, State/Area load dispatch system, Protection system up-gradation, and Software for planning and management information
8000
Total State Sector Transmission Schemes 65000 Total 1,40,000
**********

Transmission Planning & National Grid Working Group on Power for 11th Plan
Page 37 of Chapter 2
Appendix-2.1 HVDC Transmission Bipole, Back-to-back and Monopole lines and terminal station – Existing at the end of 9th Plan and programme for 10th Plan 2002-07
As at the end of 9th Plan i.e. 3/2002
2002-03
2003-04
2004-05
2005-06
2006-07
As at the end of 10th Plan i.e. 3/2007
HVDC Bipole Line Chnadrapur-Padghe ± 500kV MSEB ckm 1504 1504
Rihand-Dadri ± 500kV PGCIL ckm 1634 1634Talcher-Kolar ± 500kV PGCIL ckm 2738 2738
TOTAL 3138 2738 0 0 0 0 5876 HVDC Bi-pole Transmission Capacity
Chnadrapur-Padghe bipole MSEB MW 1500 1500Rihand-Dadri bipole PGCIL MW 1500 1500Talcher-Kolar bipole PGCIL MW 1000 1000 500 2500
TOTAL 3000 1000 1000 0 0 500 5500 HVDC Back-to-back Transmission Capacity
Vindhachal b-t-b PGCIL MW 500 500Chandrapur b-t-b PGCIL MW 1000 1000
Gazuwaka b-t-b PGCIL MW 500 500 1000Sasaram b-t-b PGCIL MW 500 500
TOTAL 2000 500 0 500 0 0 3000 HVDC Monopole Line
Barsur-Lower Sileru 200kV
CSEB/ APTRANSCO ckm 162 162
TOTAL 162 0 0 0 0 0 162 HVDC Mono-pole Transmission Capacity
Barsur-Lower Sileru Mono- pole
CSEB/ APTRANSCO MW 200 200
TOTAL 200 0 0 0 0 0 200

Transmission Planning & National Grid Working Group on Power for 11th Plan
Page 38 of Chapter 2
Appendix-2.2
Transmission lines and sub-station at 765kV – Existing at the end of 9th Plan and programme for 10th Plan 2002-07
As at the
end of 9th Plan
i.e. 3/2002
2002-03
2003-04
2004-05
2005-06
2006-07
As at the end of
10th Plan i.e.
3/2007 765kV Transmission Lines
Anpara-Unnao S/C UPPCL ckm 409 409 Kishenpur-Moga L-1(W) S/C PGCIL ckm 275 275 Kishenpur-Moga L-2(E) S/C PGCIL ckm 287 287
Tehri-Meerut Line-1 S/C PGCIL ckm 186 186 Tehri-Meerut Line-2 S/C PGCIL ckm 184 184 Agra-Gwalior Line-1 S/C PGCIL ckm 140 140
Sipat-Seoni Line-1 S/C PGCIL ckm 336 336 Sipat-Seoni Line-2 S/C PGCIL ckm 336 336 TOTAL 971 0 0 0 186 996 2153
765kV Sub-stations (765/400kV)
Seoni PGCIL MVA 3000 3000 Sipat PGCIL MVA 2000 2000
TOTAL 5000 5000

Transmission Planning & National Grid Working Group on Power for 11th Plan
Page 39 of Chapter 2
Appendix-2.3 Northern Region In Northern Region following inter-state transmission schemes have been planned and are under execution for benefit during X plan.
S. N.
Name of Scheme Scheme Description
1. Series Comp + TCSC on Kanpur-Ballabhgarh 400kV S/C
In this scheme 40 % fixed series compensation and 15 % variable compensation is proposed on Kanpur-Ballabhgarh 400 kV S/C line. This would increase the power transfer capability from Eastern to Western part of Northern Grid and improve stability of Northern Grid.
2. System Strengthening in Singrauli-Vindhyachal corridor
a) Opening of existing 400 kV line between Vindhyachal-Kanpur at Vindhyachal end and connecting it to Singrauli end so as to form Singrauli-Kanpur 400 kV S/C (3rd ckt)
b) Singrauli-Vindhyachal 400 kV S/C (2nd ckt) to utilize the vacant bay as created above
3. Transmission system associated with Dhauli Ganga
a) Dhauli Ganga- Bareilly 400 kV D/C (initially operated at 220 kV)
4. Northern Region System strengthening scheme-I
a) Kanpur-Auraiya 400 D/C b) Bareilly Switching station of PG, 400kV c) LILO of Lucknow-Moradabad 400 kV S/C at Bareilly
(PG) d) LILO of Bareilly-Mandola 400kV D/C at Bareilly (PG)
2xD/C e) Bareilly (PG)-Moradabad 400kV S/C f) LILO of Sultanpur-Lucknow 400kV S/C at Lucknow
PG 5. Northern Region System
strengthening scheme-II a) Fixed series compensation of 40% on Allahabad-
Mainpuri 400 kV D/C line designed for 95oC b) Agra-Jaipur 400 kV DC c) Wagoora 400/220 kV, 3rd transformer
6. Transmission system associated with Dulhasti
a) Dulhasti-Kishenpur 400 kV S/C b) Kishenpur-Wagoora 400 kV D/C c) Kishenpur 315 MVA 400/220 kV S/S

Transmission Planning & National Grid Working Group on Power for 11th Plan
Page 40 of Chapter 2
S. N.
Name of Scheme Scheme Description
7. Transmission system associated with Rihand-II
a) Rihand-Allahabad 400 kV D/C b) Dadri - Panipat 400 kV S/C - 2nd ckt c) Patiala- Malerkotla 400 kV S/C d) LILO of 400 kV Nalagarh -Hissar one Ckt at Kaithal
S/S e) LILO of 400 kV Nalagarh -Hissar one Ckt at Patiala
S/S f) Rihand- Mainpuri-Ballabgarh 400 kV D/C g) Kaithal 630 MVA 400/220 kV S/S h) Patiala 630 MVA 400/220 kV S/S i) Mainpuri 315 MVA 400/220 kV S/S (Aug.) j) Abdullapur 315 MVA 400/220 kV S/S 3rd ICT (Aug.)
8. Northern Region System strengthening scheme-III
a) Malerkotla – Ludhiana-Jullundhar 400kV S/C b) LILO of one ckt Moga-Hissar 400kV D/C c) Ludhiana 400/220kV S/, 2x315 MVA d) Fatehabad 400/220kV S/, 2x315 MVA
9. Transmission system associated with Sewa-II
a) Sewa -Hiranagar 132 kV D/C b) Sewa - Khatua 132 kV via Mahanpur
10. Transmission system associated with Parbati-II
a) Parbati-Nalagarh 400 kV 2xS/C (Quad)
11. Transmission system associated with Koteshwar
a) Koteshwar-Tehri PoolingPoint 400 kV D/C line b) LILO of Tehri-Meerut at Tehri PP c) Series comp. of 50% on TehriPP-Meerut 2xS/C d) Tehri GIS Pooling Station
12. Northern Region System strengthening scheme-IV
a) Provision of SVC support in NR system. (Total quantum of compensation, their size and location would be identified after further studies.)
13. Transmission system associated with RAPP-5&6
a) RAPP-Kankroli 400 kV D/C b) RAPP-Kota 400 kV S/C c) Kota 400/220 kV 3x250 MVA S/S d) Kankroli 400/220 kV 3x315 MVA S/S
14. Northern Region System strengthening scheme-V
a) LILO of 400 kV Hissar-Jaipur at Bhiwadi b) Bhiwadi-Agra 400kV D/C c) Bhiwadi-Moga 400kV D/C
15. System strengthening in Roorkee
a) Establishment of Roorkee 1x315 MVA 400/220 kV S/S by LILO of Rishikesh- Muzaffarpur S/C line at Roorkee S/S
16. Additional transformers at Moga and Amritsar
a) Moga 400/220 kV 1x250 MVA (Aug) 3rd transformer b) Amritsar 400/220 kV 1x315 MVA (Aug) 3rd
transformer

Transmission Planning & National Grid Working Group on Power for 11th Plan
Page 41 of Chapter 2
S. N.
Name of Scheme Scheme Description
17. Tala Transmission System for NR
a) Gorakhpur-Lucknow (new) 400 kV D/C b) Lucknow (New)-Unnao 400 kV D/C c) Bareilly- Mandola 400 kV D/C d) LILO of 400 kV Dadri-Samaypur D/C line at Maharani
Bagh-2xD/C e) Gorakhpur (new)-Gorakhpur (UP) interconnection
400 kV D/C f) Gorakhpur 1x315 MVA 400/220 kV S/S (new) with
2x63 MVAR L/R g) New Lucknow 1x315 MVA 400/220 kV S/S(new) h) Maharani Bagh 2x315 MVA 400/220 kV S/S (new)
18. Tala Supplementary Transmission System in NR
a) Jullandhar-Amritsar 400kV S/C line and 400/220kV 1x315 MVA s/s at Amritsar
b) Bahadurgarh 400/220kV 1x315 MVA s/s by LILO of Bawana-Bhiwani 400kV line
c) 2nd 315 MVA 400/220kV transfrmr at Gorakhpur 19. Supplementary Transmission
system associated with RAPP-5&6
a) Kota-Merta 400 kV D/C b) Kankroli-Jodhpur 400 kV S/C
20. Associated Tr. System of Kahalgaon-II Phase-I(2x500 MW) and Phase-II (1x500 MW) in NR
a) Balia-Mau 400 kV D/C b) Balia-Lucknow (PG) 400 kV D/C with ser cap c) Lucknow (PG)-Bareilly (PG) 400 kV D/C.

Transmission Planning & National Grid Working Group on Power for 11th Plan
Page 42 of Chapter 2
Appendix-2.4 Western Region In Western Region following inter-state transmission schemes have been planned and are under execution for benefit during X plan.
S. N. Name of Scheme Description 1. Associated Transmission
System of TAPP 3&4 a) Tarapur-Boisar 400kV D/C b) TAPP(Extn.)-Boisar 220kV S/C (For start up power) c) Tarapur-Padghe 400kV D/C d) LILO of Gandhar-Padghe 400 kV S/C at Vapi (PG) e) LILO of Gandhar-Padghe 400 kV S/C at Boisar (PG) f) Vapi (PG) 2x315 MVA 400/220 kV S/S g) Boisar (PG) 2x315 MVA 400/220 kV S/S
2. Raipur-Bhadrawati 400kV D/C a) Raipur-Bhadrawati 400 kV D/C 3. Bhadrawati-Chandrapur 400kV
D/C a) Bhadrawati-Chandrapur 400kV D/C
4. Associated Tr. System of Vindhyachal-III (2x500 MW)
a) Vindhyachal-Satna-Bina 400 kV D/C b) LILO of both ckts of Rourkela-Raipur 400 kV D/C line
at Raigarh c) LILO of both ckts of Satna-Bina (MPSEB) 400 kV
D/C line at Bina (PG) d) Raigarh 2x315 MVA 400/220 kV S/S e) Bina (PG) 400/220kV Switching sub-station
5. Vindhyachal-Korba 400 kV S/C line (2nd ckt.)
a) Vindhyachal-Korba 400 kV S/C line (2nd ckt.)
6. Bina-Nagda 400 kV D/C line a) Bina-Nagda 400 kV D/C line 7. Associated Tr. System of Sipat-I
(3x660 MW) a) Sipat-Seoni 765 kV 2X S/C b) Seoni-Khandwa 400 kV D/C (Quad AAAC) c) Nagda-Dehgam 400 kV D/C d) LILO of Korba-Raipur at Sipat 400 kV D/C e) LILO of Satpura-Bhilai at Seoni 400 kV D/C f) LILO of both ckts of S. Sarover-Nagda 400 kV D/C
line at Rajgarh g) Seoni 7x500 MVA 765/400 kV and 2x315 MVA
400/220 kV S/S h) Rajgarh 2x315 MVA 400/220 kV S/S
8. Associated Tr. System of Sipat-II (2x500 MW)
a) Khandwa-Rajgarh 400 kV D/C b) Bina-Gwalior 765 kV S/C (initially op. at 400 kV) c) Seoni 765/400 kV 3x500 MVA (Aug.) d) LILO of 400 kV Korba-Raipur 400 kV line at
Bhatapara. e) Bhatapara 2x315 MVA 400/220 kV S/S
9. Sipat-Raipur 400 kV D/C line a) Sipat-Raipur 400 kV D/C

Transmission Planning & National Grid Working Group on Power for 11th Plan
Page 43 of Chapter 2
S. N. Name of Scheme Description 10. Transmission System
associated with Gandhar-II (1350 MW)
a) Gandhar (NTPC)-Rajkot (GEB) 400 kV D/C b) Gandhar (NTPC)-Kawas 400 kV D/C c) LILO of both circuits of Bina-Nagda 400 kV D/C line
at Shujalpur d) Establishment of 2x315 MVA 400/220 kV substation
at Shujalpur 11. Transmission System
associated with Kawas-II (1350 MW)
a) Kawas-II-Vapi (PG) 400 kV D/C Quad b) Vapi (PG)- Navi Mumbai 400 kV D/C c) LILO of Lonikhand – Kalwa 400 kV S/C line at Navi
Mumbai, d) Vapi (PG)-Khadoli (DNH) 220 kV D/C e) Establishment of 400/220 kV 2x315 MVA S/S at Navi
Mumbai (GIS in case adequate land is not available). f) LILO of Apta-Kalwa and Kharghar-Kandalgaon 220
kV D/C lines at Navi Mumbai. (LILO works under preview of MSEB, 220 kV bay provision at Navi Mumbai by PGCIL)
g) Installation of 400/220 kV 1x315 MVA 3rd transformer at Vapi
12. To provide direct linkage to DNH and Daman & Diu from regional Vapi 400/220 kV s/s.
Construction of multi circuit 2xD/C line between Vapi (PG) and line alignment of the 220 kV lines from Bhilad-Kharadpada & Bhilad-Magarwada thereby creating Vapi (PG)–Magarwada 220 kV D/C and Vapi (PG)–Kharadpada 220 kV D/C line by bypassing both the lines at Bhilad.
13. Sipat-II Supplementary Transmission Scheme
a) Seoni-Wardha, 765kV S/C line (initially op. at 400kV) b) Wardha-Akola, 400kV D/C line c) Akola-Aurangabad, 400kV D/C

Transmission Planning & National Grid Working Group on Power for 11th Plan
Page 44 of Chapter 2
Appendix-2.5 Southern Region In Southern Region following inter-state transmission schemes have been planned and are under execution during X plan.
S. N. Name of Scheme Description 1. Talcher-II evacuation System in
SR that is 40okV System for power dispersal from Kolar
a) Kolar-Hoody 400kV D/C b) Kolar-Chennai(SPBudur) 400kV S/C c) Kolar-Hosur-Salem 400kV S/C d) Salem-Udumalpet 400kV S/C e) LILO of Cuddapah-Somanhalli at Kolar f) 400kV s/s at Hosur 2x315 MVA g) 400kV Kolar s/s 2x315MVA
2. Series Comp on Nagarjuna Sagar-Cuddapah and Gooty-Neelnamangla 400 kV lines
a) 50% series compensation on both the circuits of Gooty-Bangalore 400 kV 2xS/C and Nagarjuna Sagar-Cuddapah 400 kV D/C
3. Kaiga-Narendra 400 kV D/C a) Kaiga-Narendra 400 kV D/C 4. Establishment of Narendra
400/220 kV S/S a) Establishment of 2x315 MVA 400/220 kV S/S at
Narendra 5. Southern Region System
strengthening scheme-IV a) LILO of Nagarjunasagar-Raichur 400 kV S/C line at
Mehboobnagar b) LILO of both the circuits of Nellore-Sriprumbudur 400
kV D/C line at Alamatti 400kV S/S 6. Neelamangla-Mysore
transmission system a) Neelamangala-Mysore 400 kV D/C line b) Mysore 2x315MVA 400/220 kV S/S
7. Madurai-Thiruvananthapuram a) Madurai-Thiruvananthapuram 400 kV D/C line b) Thiruvananthapuram 400/220kV 2x315MVA
substation 8. Transmission system
associated with Ramagundam-III
a) Ramagundam-Hyderabad 400kV D/C line b) Hyderabad-Kurnool-Gooty 400kV S/C line c) Khammam-Nagarjunasagar 400kV S/C line d) Gooty-Neelamangala 400kV S/C line
9. Southern Region System strengthening scheme-V
a) Augmentation of Transformer capacity by 1x315 MVA at Munirabad, Cuddapah, Gooty, Khammam, Gazuwaka and 3x167 MVA at Kolar 400 kV Substations
b) 1x80 MVAR Bus reactor at Nellore 400kV S/S 10. Southern Region System
strengthening scheme-III a) Raichur-Gooty 400 kV D/C (Quad) line b) Neelamangala- Somanahaly 400 kV D/C
11. Southern Region System strengthening scheme-VI
a) LILO of both the circuits of Gazuwaka-Vijayawada 400kV D/C line at Vemagiri 400 kV S/S
b) 2nd 1x315 MVA 400/220kV Transformer at Vijayawada

Transmission Planning & National Grid Working Group on Power for 11th Plan
Page 45 of Chapter 2
Appendix-2.6 Eastern Region In Eastern Region following inter-state transmission schemes have been planned and are under execution during X plan.
S. N. Name of Scheme Description 1. LILO of Silliguri-Gangtok 132 kV
line at Melli a) LILO of one ckt of Silliguri-Gangtok 132 kV D/C line at
Melli 2. Installation of 2nd ICT at
Indravati OHPC a) Indravati 1x315 MVA 400/220 kV 2nd Trf. (Aug.)
3. LILO of Rangit-Silliguri at Gangtok
a) LILO of one ckt of 132 kV Rangit-Silliguri at Gangtok
4. Tala Transmission System (ER) a) Bhutan border to Siliguri 400kV 2xD/C b) Siliguri-Purnia 400kV quad D/C c) Purnia-Muzzafpur 400kV quad D/C d) Muzaffarpur 400kV s/s with inter-connection to 220kV
s/s 5. Transmission system associated
with Teesta-V e) Teesta-Silliguri 400 kV D/C
6. Tala Supplementary Scheme for ER
a) Biharsharif – Muzaffarpur 400kV D/C-129km b) 2x315 MVA, 400/220kV S/S at Subhasgram c) 2nd 315 MVA, 400/220kV ICT at Siliguri
7. Associated Tr. System of Kahalgaon-II Phase-I(2x500 MW) and Phase-II (1x500 MW) in ER
a) Kahalgaon-Patna 400 kV D/C quad b) Maithon (PG)-Ranchi 400 kV D/C c) 2x315 MVA 400/220 kV Patna s/s d) 2x315 MVA 400/220 kV Ranchi s/s

Transmission Planning & National Grid Working Group on Power for 11th Plan
Page 46 of Chapter 2
Appendix-2.7 Inter-Regional Schemes The following inter-regional transmission schemes have been planned and have been commissioned and/or are under execution during X plan.
S. N.
Name of Scheme Description Status
1. ER-WR interconnection
a) Rourkela-Raipur 400kV D/C b) TCSC on Rourkela-Raipur 400kV D/C
completed
2. ER-NR interconnection
a) Sasaram HVDC back-to back 500MW b) Biharsharif-Sasaram 400kV D/C c) Sasaram-Allahabad 400kV D/C
completed
3. Talcher-II evacuation System
a) Talcher-Kolar 2000 MW HVDC bi-pole line b) Increasing capacity of Talcher-Kolar HVDc bi-
pole line from 2000MW to 2500MW
completed
4. ER-SR link strengthening
a) Second 500MW HVDC back-to back at Gazuwaka
b) b) Series Capacitors on 400kV lines in ER for increasing transmission capacity to Gazuwaka
completed
5. ER-NR inter-connector with Tala Transmission System
a) Muzaffarpur-Gorakhpur 400kV quad D/C with TCSC
completed
6. Associated Tr. System of Kahalgaon-II Phase-I(2x500 MW) and Phase-II (1x500 MW)
a) Patna-Balia 400kV D/C quad b) Biharsharif-Balia 400kV D/C quad c) Ranchi-Sipat 400 kV D/C with 40 % series
compensation d) Agra-Gwalior 765 kV S/C (initially op. at 400
kV)
Under construction

Transmission Planning & National Grid Working Group on Power for 11th Plan
Page 47 of Chapter 2
Appendix-2.8
INTER-STATE TRANSMISSION SCHEMES FOR THE XI PLAN
Region Scheme/ scheme group Transmission system NR EVACUATION SYSTEM FOR
KOLDAM (800 MW), PARBATI-II (800 MW) AND PARBATI-III
(520 MW)
TRANSMISSION SYSTEM FOR KOLDAM 1. Koldam-Nalagarh 400 kV D/C Quad. 2. Koldam-Ludhiana 400 kV D/C line
TRANSMISSION SYSTEM FOR PARBATI II 1. Parbati II - Koldam 400 kV S/C (quad) 1st ckt 2. Parbati II to Koldam 400 kV S/C (quad) 2nd ckt 3. Opening of one ckt Koldam-Nalagarh 400 kV D/C
line at Koldam and joining with Parbati II-Koldam 2nd ckt so as to form i) Parbati II-Nalagarh 400 kV S/C line ii) Parbati II-Koldam 400 kV S/C line
TRANSMISSION SYSTEM FOR PARBATI III
1. LILO of Parbati II-Koldam 400 kV S/C line at Parbati III
2. Establishment of switching station at Panarsa by LILO of Parbati II – Nalagarh 400 kV line and by LILO of Parbati III-Koldam 400 kV S/C line at Panarsa
3. Panarsa-Amritsar 400 kV D/C line NR Evacuation System for
Chamera- III (231 MW)
1. CREATION OF 400/220 KV POOLING STATION NEAR HAMIRPUR
2. Chamera III-Chamera Pooling Station 220 kV D/C line
3. Chamera Pooling Station-Jullundur 400 kV D/C line NR Evacuation System for Uri-II
HEP (240 MW) 1. URI-I- URI-II 400 KV S/C 2. Uri-II-Wagoora 400 kV S/C line
NR Evacuation System for Rampur HEP (434 MW)
1. LILO of Nathpa Jhakri - Nalagarh 400 kV D/C at Rampur HEP
2. Ludhiana - Patiala 400 kV D/C 3. LILO of Patiala -Hissar 400 kV line at Kaithal 4. LILO of Nalagarh - Kaithal 400 kV line at Patiiala

Transmission Planning & National Grid Working Group on Power for 11th Plan
Page 48 of Chapter 2
NR Evacuation System for Tehri PSS (1000 MW) & Koteshwar (400 MW), Lohari Nagpala HEP (600 MW)
With Koteshwar 1. Establishment of 400kV GIS Tehri Pooling Station 2. LILO of Tehri – Meerut 765kV at Tehri Pooling Point 3. Koteshwar – Tehri Pooling Point , 400kV D/C line 4. Series Compensation 50 % on the Tehri – Meerut
765kV 2xS/C lines (charged at 400kV)
WITH TEHRI PSS 1. TEHRI – TEHRI POOLING STATION, 400KV S/C
(QUAD) LINE 2. LILO OF BAREILLY – MANDAULA 400KV D/C LINE
AT 400KV MEERUT S/S 3. Charging Tehri Pooling Stn – Meerut line at 765kV 4. Tehri Pooliong Station (GIS) 765/400kV ,
3x1500MVA 5. Meerut S/S (GIS) 765/400kV, 3x1500MVA 6. Modification of Series capacitors on the Tehri-Meerut
lines for 765kV operation With Lohari Nagpala 1. Lohari Nagpala HEP – Tehri/Koteshwar Pooling Point
400kV D/C line (triple moose) 2. Meerut – Agra 765kV S/C line 3. Second 765/400kV transformer at Agra 765kV S/S
NR Evacuation System for Tapovan Vishnugad HEP (520 MW)
1. Tapovan Vishnugad – Roorkee 400kv D/C line (the line to be routed via Kuwari Pass where a 400/132kV
pooling station is proposed) NR Evacuation System for RAPP U
5&6 APP (440 MW)
1. Rapp – kankroli 400kv d/c line 2. Rapp – kota 400kv s/c line 3. Kota 400/220kv s/s 2x315 mva 4. Kankroli 400/220kv s/s, 3x315 mva Supplementary regional schemes to match with RAPP 5&6 1. Kota – Merta 400kV D/C line 2. Kankroli – Jodhpur 400kV S/C line
NR Evacuation System for Sewa-II (120 MW)
1. Sewa-Hira Nagar 132 kV D/C 2. Sewa-Khatua 132 kV D/C one ckt via Mahanpur
NR Evacuation System for Nimboo Bazgo (45 MW)
1. Nimboo Bazgo-Leh 33 KV 2XD/C
NR Evacuation System for Chutak (44 MW)
1. Chutak-Kargil 33 KV 2XD/C
NR Evacuation System for Lakhwar Vyasi (420 MW)
1. Lakhwar Vyasi-Dehradun 220 KV D/C

Transmission Planning & National Grid Working Group on Power for 11th Plan
Page 49 of Chapter 2
NR Evacuation System for Kotlibhel st-IA (195 MW), Kotlibhel st-IB (320 MW), Kotlibhel st-II (440 MW),
With Kotlibhel ST-IA 1. LILO Kotlibhel-ST1B-Roorkee 1st CKT at Kotlibhel-ST1A 400 KV D/C With Kotlibhel ST-IB 1. Kotlibhel-ST1B-Roorkee 400 KV D/C With Kotlibhel ST-II 1. LILO Kotlibhel-st1B-Roorkee 2nd ckt at Kotlibhel-st II 400 kV D/C
NR Evacuation System for Vishnugarh Pipalkoti (400 MW)
1. LILO one ckt Kuwari Pass-Pithoragarh line at Vishnugarh Pipalkoti 400 kV D/C
NR Evacuation System for Lata
Tapovan (162 MW) 1. LILO of one ckt of Vishnuprayag-Muzzaffar Nagar
D/C line at Kunwari Pass 400 kV D/C 2. Lata Tapovan-Kunwari Pass 220 kV D/C
NR Evacuation System for Barsinghsar (250 MW) & Barsinghsar Extn. 250 MW
1. Barsingsar-Nagaur 220 kV 2xS/C 2. Barsingsar-Phalodi 220 kV S/C 3. Barsingsar-Bikaner 220 kV S/C
NR Northern Region System Strengthening -VI
1. Establishment of 400/220 kV 2x315 MVA GIS at Gurgaon by LILO of Samaypur-Bhiwadi 400 kV S/C line
NR Northern Region System Strengthening -VII
1. Augmentation of Ludhiana S/S by 3rd 315 MVA transformer
2. Augmentation of Wagoora S/S by 4th 315 MVA transformer
NR Northern Region System Strengthening -VIII
1. Establishment of 400/220 kV 2x315 MVA S/S at Bhinmal by LILO of both ckts of Kankorli-Zerdai 400 kV D/C line
2. Augmentation of Hissar S/S by 3rd 315 MVA transformer
NR Northern Region System Strengthening -IX
1. Establishment of 400/220 kV S/S at Roorkee by LILO of Rishikesh-Muradnagar 400 kV S/C
2. Opening of Roorkee-Muzzaffarnagar portion of Roorkee-Muradnagar line from location near Muzzaffarnagar and extending it to Meerut so as to form Roorkee-Meerut 400 kV S/C line and Meerut-Muzzaffarnagar S/C line (under Tehri stage-I)
NR Northern Region System Strengthening -X
1. Kankroli-Jodhpur 400 kV S/C 2. Kota-Merta 400 kV D/C
NR Northern Region System Strengthening -XI
1. 400/220 kV 315 MVA 3rd Trf. at Amritsar (Aug.) 2. 400/220 kV 315 MVA 3rd Trf. at Moga (Aug.)
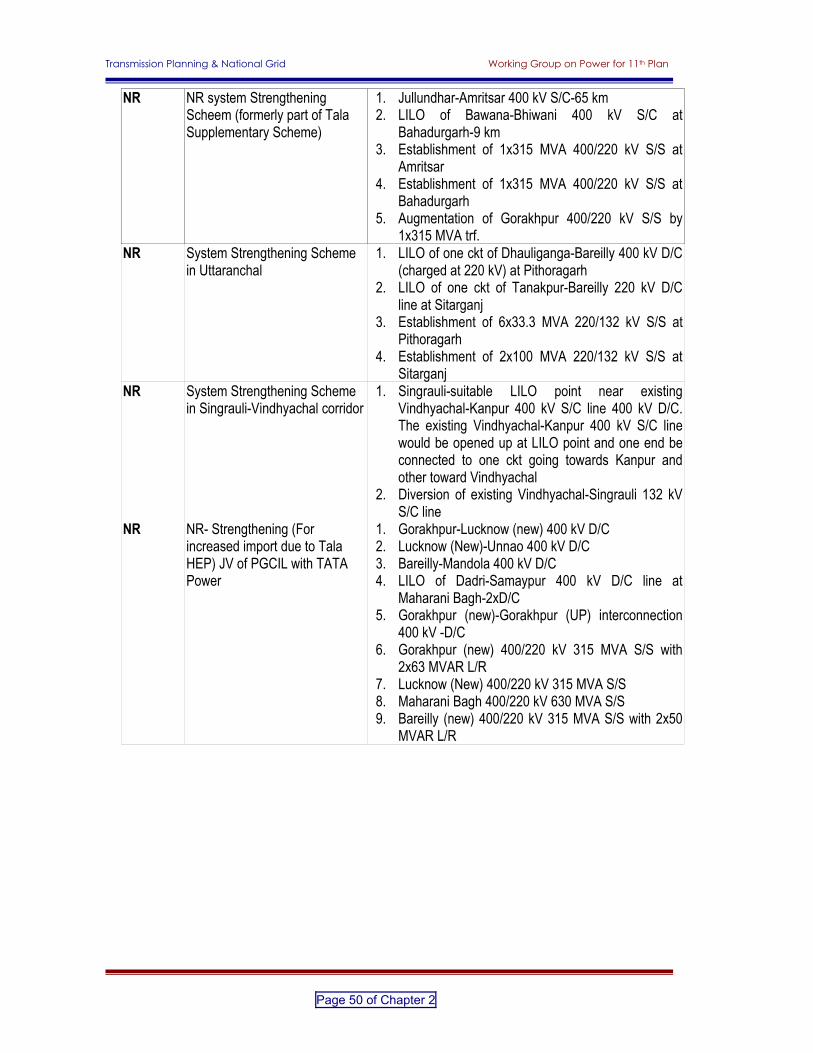
Transmission Planning & National Grid Working Group on Power for 11th Plan
Page 50 of Chapter 2
NR NR system Strengthening Scheem (formerly part of Tala Supplementary Scheme)
1. Jullundhar-Amritsar 400 kV S/C-65 km 2. LILO of Bawana-Bhiwani 400 kV S/C at
Bahadurgarh-9 km 3. Establishment of 1x315 MVA 400/220 kV S/S at
Amritsar 4. Establishment of 1x315 MVA 400/220 kV S/S at
Bahadurgarh 5. Augmentation of Gorakhpur 400/220 kV S/S by
1x315 MVA trf. NR System Strengthening Scheme
in Uttaranchal 1. LILO of one ckt of Dhauliganga-Bareilly 400 kV D/C
(charged at 220 kV) at Pithoragarh 2. LILO of one ckt of Tanakpur-Bareilly 220 kV D/C
line at Sitarganj 3. Establishment of 6x33.3 MVA 220/132 kV S/S at
Pithoragarh 4. Establishment of 2x100 MVA 220/132 kV S/S at
Sitarganj NR System Strengthening Scheme
in Singrauli-Vindhyachal corridor 1. Singrauli-suitable LILO point near existing
Vindhyachal-Kanpur 400 kV S/C line 400 kV D/C. The existing Vindhyachal-Kanpur 400 kV S/C line would be opened up at LILO point and one end be connected to one ckt going towards Kanpur and other toward Vindhyachal
2. Diversion of existing Vindhyachal-Singrauli 132 kV S/C line
NR NR- Strengthening (For increased import due to Tala HEP) JV of PGCIL with TATA Power
1. Gorakhpur-Lucknow (new) 400 kV D/C 2. Lucknow (New)-Unnao 400 kV D/C 3. Bareilly-Mandola 400 kV D/C 4. LILO of Dadri-Samaypur 400 kV D/C line at
Maharani Bagh-2xD/C 5. Gorakhpur (new)-Gorakhpur (UP) interconnection
400 kV -D/C 6. Gorakhpur (new) 400/220 kV 315 MVA S/S with
2x63 MVAR L/R 7. Lucknow (New) 400/220 kV 315 MVA S/S 8. Maharani Bagh 400/220 kV 630 MVA S/S 9. Bareilly (new) 400/220 kV 315 MVA S/S with 2x50
MVAR L/R

Transmission Planning & National Grid Working Group on Power for 11th Plan
Page 51 of Chapter 2
Region Scheme/ Scheme Group Transmission System WR Evacuation System for Sipat-
II+I (1000 + 1980 MW)
ATS with Sipat-I (3x660 MW) 1. Sipat-Seoni 765 kV 2X S/C 2. Seoni-Khandwa 400 kV D/C (Quad AAAC) 3. Nagda-Dehgam 400 kV D/C 4. LILO of Korba-Raipur at Sipat 400 kV D/C 5. LILO of Bhilai-Satpura at Seoni 400 kV D/C 6. Seoni 765/400 kV 7x500 MVA and 400/220 kV 2x315
MVA s/s 7. Rajgarh 400/220 kV 2x315 MVA s/s by LILO of
both ckts of Sardar Sarovar-Dhule D/C line ATS with Sipat-II (2x500 MW) 1. Khandwa-Rajgarh 400 kV D/C 2. Bina-Gwalior 765 kV S/C (initially op. at 400 kV) 3. Seoni 765/400 kV 3x500 MVA (Aug.) 4. Bhatapara 400/220 kV 2x315 MVA s/s by LILO of
Korba-Raipur line Sipat-II Supplementary Tr. System 1. Seoni-Wardha 765 kV S/C (initially op. at 400 kV) 2. Wardha-Akola 400 kV D/C 3. Akola-Aurangabad 400 kV D/C 4. Wardha 400/220 kV 2x315 MVA s/s
WR Evacuation System for Kawas-II (725 + 575 MW) and Gandhar-II (725 + 575 MW)
ATS with Gandhar-II 1. Gandhar (NTPC)-Rajkot (GEB) 400 kV D/C 2. Gandhar (NTPC)-Kawas 400 kV D/C 3. LILO of both circuits of Bina -Nagda 400 kV D/C line
at Shujalpur 4. Establishment of 2x315 MVA 400/220 kV substation
at Shujalpur ATS with Kawas-II 1. Kawas-II-Vapi (PG) 400 kV D/C Quad 2. Vapi (PG)- Navi Mumbai 400 kV D/C 3. LILO of Kalwa-Pune (PG) 400 kV S/C line at Navi
Mumbai, 4. Vapi (PG)-Khadoli (DNH) 220 kV D/C 5. Establishment of 400/220 kV 2x315 MVA S/S at Navi
Mumbai (GIS in case adequate land is not available). 6. LILO of Apta-Kalwa and Kharghar-Kandalgaon 220
kV D/C lines at Navi Mumbai. (LILO works under preview of MSEB, 220 kV bay provision at Navi Mumbai by PGCIL)
7. Installation of 400/220 kV 1x315 MVA 3rd transformer at Vapi

Transmission Planning & National Grid Working Group on Power for 11th Plan
Page 52 of Chapter 2
WR Western Region System Strengthening Scheme -II
For absorbing import in eastern and central part of WR grid
1. Seoni-Wardha 765 kV S/C (2nd ckt 400 kV operation).
2. Raipur-Wardha 400 kV D/C with series compensation of 25% fixed.
3. Bhadrawati-Parli (PG) 400 kV D/C 4. Wardha-Parli (PG) 400 kV D/C Quad 5. Parli (PG)-Parli (MSEB) 400 kV D/C. 6. Parli (PG)-Pune (PG) 400 kV D/C 7. LILO of Lonikhand-Kalwa 400 kV line at Pune (PG)
near Chinchwad) 8. Pune (PG)-Aurangabad 400 kV D/C 9. Powergrid 400/220 kV 2x315 MVA substation at
Pune. For regional strengthening in southern Maharashtra 1. LILO of Sholapur-Karad at Sholapur (PG) 400 kV D/C 2. Sholapur (PG) 400/220 kV 2x315 MVA s/s. 3. Parli (PG)- Sholapur (PG) 400 kV D/C 4. Sholapur (PG)-Kolhapur 400 kV D/C For regional strengthening in Gujarat 1. Rajgarh-Karamsad 400 kV D/C line with 25%
fixed series compensation 2. Limbdi-Ranchhodpura-Zerda 400 kV D/C. For regional strengthening in northern Madhya Pradesh 1. Korba-Damoh-Bhopal 400 kV D/C.
WR Western Region System Strengthening Scheme -IV
1. Powergrid 400/220 kV, 2x315 MVA substation at Damoh.
WR Evacuation System for
Omkareshwar (520 MW) 1. LILO of Barwaha-Khandwa D/C at Omkareshwar
220 kV 2xD/C 2. Omkareshwar-Sanawad 220 kV D/C

Transmission Planning & National Grid Working Group on Power for 11th Plan
Page 53 of Chapter 2
Region Scheme/ Scheme Group
Transmission System
SR Evacuation System for Kudankulam U1&2 (2000 MW)
1. Kudankulam (NPC) – Tirunelveli (PG) 400kv 2XD/C line-I & II (quad)
2. tirunelveli (pg) – udumalpet 400kv d/c line 3. Tirunelveli (PG) – Edamon (KSEB) 400kV
D/C line, (multi circuit line) 4. Edamon – Muvattupuzha(PG) 400kV quad
D/C line 5. Muvattupuzha – North Tricur (PG) 400kV
quad D/C line 6. LILO of both circuits of Madurai (PG) –
Trivendram (PG) 400kV D/C line at Tirunelveli
7. 400/220kV S/S at Tirunveli, 2x315 MVA 8. 400/220kV S/S at Muvattupuzha, 2x315
MVA 9. Trivendram 400/220kV S/S Extn. – 3rd
1x315 MVA transformer 10. Udumalpet 400/220kV S/S Extn. – 3rd
1x315 MVA transformer 11. 2x63 MVAR bus reactor at Tirunveli and
1x63 MVAR bus reactor at Muvattupuzha 400 kV S/Ss
12. 1x63 MVAR line reactor at each end of each circuit of Tirnuveli – Muvattupuzha 400kV D/C line
13. 1x63 MVAR switchable line reactor at each end of each circuit of Tirnuveli – Udumalpet 400kV D/C line
SR Evacuation System for Kalpakkam PFBR (500 MW)
1. KPFBR – Kancheepuram 230kV D/C line 2. KPFBR – Arni 230kv D/C line 3. KPFBR – Sirucheri 230kV D/C line 4. KPFBR – MAPS 230kV S/C (with one
spare phase) Cable link

Transmission Planning & National Grid Working Group on Power for 11th Plan
Page 54 of Chapter 2
SR Evacuation system for Kaiga U3&4 (220 + 220 MW)
1. Narendra (PG) – Davanagere (KPTCL) 400kv D/C line
2. Mysore (PG) – Kozhikode (PG) 400kV D/C line
3. Lilo of Kolar – Sriperumbudur (PG) 400kvVs/c at melakottaiyur (PG)
4. Melakottaiyur 400/220kV s/s 2x315 mva 5. Kozhikode 400/220kV S/S 2x315 mva 6. Hiriyur 400/220kv S/S extn- 1x315 mva 7. Narendra 400/220kV S/S bay extn. 8. Mysore 400/220kV S/S bay extn. 9. Davanagere 400/220kV S/S bay extn. 10. 1x50 mvar switchable line reactor at
melakottaiyur end of kolar – sriperumbudur 400kV S/C line to be LILOed at melakottaiyur
SR Evacuation System for
Neyveli TPS II (500 MW)
1. neyveli ts-ii expansion (nlc) – neyveli ts-ii existing (nlc) 400kv 2xs/c line
2. neyveli ts-ii(nlc) – pugalur (pg) 400kv d/c line
3. Pugalur (PG) – Madurai (PG) 400kV D/C line
4. Udumalpet – Arasur (PG) 400kV D/C line 5. LILO of Neyveli – Sriperumbudur 400kV
S/C line 6. LILO of Ramagundam – Khammam 400kV
S/C line at Warangal (PG) 7. Pugalur 400/220kV S/S 2x315 MVA 8. Warangal 400/220kV S/S 2x315 MVA 9. Arasur 400/220kV S/S 2x315 MVA 10. Pondicherry 400/220kV S/S 2x315 MVA 11. Madurai 400/220kV S/S bay Extn. 12. Udumalpet 400/220kV S/S bay Extn. 13. 1x50 MVAR switchable line reactor for
each circuit, at Pugalur end of Neyveli – Pugalur 400kV D/C line.
SR Evacuation System for
Kayamkulam II LNG (1950 MW)
1. LILO of Tirunelveli-Muvathapuzha (Quad) at Kayamkulam 400 kV 2xD/C
2. Kozhikode-Trissur 400 kV D/C 3. Kayamkulam TPS 400/220 kV 2x315 MVA
S/S 4. Kayamkulam TPS-Kayamkulam 220 kV
D/C SR For Talcher-II back-up
in ER TENTATIVE 1. Talcher-II – Rourkela 400 kVD/C 2. Baripada-Berhampur-Gazuwaka 400 kV
D/C

Transmission Planning & National Grid Working Group on Power for 11th Plan
Page 55 of Chapter 2
SR Southern Region System Strengthening Scheme–IV
1. LILO of Nagarjunasagar (AP)-Raichur 400 kV S/C line at Mehboobnagar (AP)
2. LILO of both the circuits of Nellore (AP)-Sriprumbudur (TN) 400kV D/C line at Alamatti 400 kV S/S (TN)
SR Southern Region System Strengthening Scheme–V
1. Augmentation of Transformer capacity by 1x315 MVA at Munirabad, Cuddapah (AP), Gooty(AP), Khammam (AP), Gazuwaka(AP) and 3x167 MVA at Kolar 400 kV Substations
2. 1x80 MVAr Bus reactor at Nellore (AP) 400kV S/S
SR Southern Region System Strengthening Scheme–VI
1. (LILO of both the circuits of Gazuwaka (AP)-Vijayawada (AP) 400 kV D/C line at Vemagiri 400 kV S/S (AP)
2. 2nd 1x315 MVA 400/220kV Transformer at Vijayawada (AP)
SR Southern Region System Strengthening Scheme–VII
1. LILO of one circuit of Talaguppa-Neelamangala 400kV D/C line at Hassan
2. Hassan 400/220 kV 2x315 MVA substation 3. LILO of one circuit of Madurai (TN)-Trichy
(TN) D/C line at Karaikudi (TN) 4. Karaikudi 400/220 kV 2x315 MVA
substation SR Neelamangala-Mysore
Transmission scheme 1. Neelamangala-Mysore 400 kV D/C line 2. 400/220 kV 2x315 MVA S/S at Mysore

Transmission Planning & National Grid Working Group on Power for 11th Plan
Page 56 of Chapter 2
Region Scheme/ Scheme Group
Transmission System
ER Evacuation System for North Karanpura (1980 MW) and Maithon RB (1000 MW)
With North Karanpura: 1. North Karanpura – Sasaram 765kV S/C
line with 2x1500MVA, 765/400kV s/s at Sasaram
2. North Karanpura – Ranchi 400kV D/C line 3. North Karanpura – WR pooling Station
near Sipat 765kV S/C line with 2x1500MVA, 765/400kV s/s at WR pooling station near Sipat
4. WR pooling station near Sipat – Sipat 765kV S/C line
5. WR pooling station near Sipat – Seoni 765kV S/C line
With Maithon RB: 1. Maithon RB-Maithon PG 400kV D/C line 2. Maithon RB – Ranchi 400kV D/C line 3. Biharsharif – Sasaram 400kV D/C line With North Karanpura or Maithon RB for the
Northern Region: 1. Sasaram-Fatehpur 765kV S/C line 2. Fatehpur-Agra 765kV S/C line 3. 765kV Agra s/s, 2x1500 MVA 765/400kV 4. 765kV Fatehpur s/s, 2x1500 MVA
765/400kV & 2x315 MVA 400/220 kV 5. LILOs of Singrauli/Allahabad –
Kanpur/Mainpuri 400kv lines at Fatehpur. 6. Sasaram – Balia 400kV quad D/C
ER Evacuation System for Barh (1980 MW)
1. LILO of Kahalgaon – Patna 400kV D/C quad line at Barh
2. Barh – Balia 400kV D/C quad line 3. Balia – Bhiwadi 2500 MW + 500kV HVDC
Bipole line 4. Seoni – Bina 765kV S/c line (to be initially
operated at 400kV) 5. Balia 400kV S/S extn 6. Bhiwadi 400kV S/S extn 7. Seoni 400kV S/s extn 8. Bina 400kV Sw. Stn. Extn. 9. Balia and Bhiwadi HVDC Converter
Stations

Transmission Planning & National Grid Working Group on Power for 11th Plan
Page 57 of Chapter 2
ER Evacuation System for Teesta Low Dam III &IV (292 MW)
1. Teesta Stage III – New Jalpaiguri, 220kV S/C line with Twin-Moose conductor.
2. Teesta Stage III – Teesta Stage IV S/S, 220kV S/C line with Moose conductor.
3. Teesta Stage IV – New Jalpaiguri, 220kV D/C line. (These lines would be constructed by WBSEB, as the whole of the power would be absorbed by West Bengal.)
ER Evacuation System for Teesta IV (495 MW)
1. LILO of one ckt of Mangan-Melli 400 kV D/C at Teesta IV
ER Evacuation System for Farakka III (500 MW)
1. Existing system adequate
ER System Strengthening-I 1. Higher capacity conductr on Siliguri-Purnia ER System Strengthening-II 1. Purlia-Jamshedpur 400kV D/C
2. Jamshedpur-Baripada 400kV D/C 3. Baripada –Mendhalsal (Bhuwanashwar)
400kV D/C ER For Talcher-II back-up
in ER TENTATIVE 1. Talcher-II – Rourkela 400 kVD/C 2. Baripada-Berhampur-Gazuwaka 400 kV
D/C ER Evacuation System for
Bokaro (500 MW) TENTATIVE 1. Bakaro-North Karanpura 400 kV D/C Quad
ER Evacuation System for Kodarma (500 MW)
TENTATIVE 1. Kodarma-Sasaram D/C 400 kV D/C Quad
ER Evacuation System for Hirma-II (2000 MW)
TENTATIVE 1. Hirma II-Raipur 400 kV 2xD/C (Quad) 2. Hirma-Sipat PP 2xD/C (Quad)

Transmission Planning & National Grid Working Group on Power for 11th Plan
Page 58 of Chapter 2
Region Scheme/ Scheme Group
Transmission System
NER Evacuation System for Kameng HEP (600 MW)
1. LILO Ranganadi-Balipara at Biswanath Chariyali 400 kV 2xD/C
2. Kameng HEP-Biswanath Chariyali 400 kV D/C
3. Biswanath Chariyali -Bongaigaon 400 kV D/C
NER Evacuation System for Ranganadi II (130 MW)
1. Ranganadi HEP I-Ranganadi HEP II 132 kV S/C
2. LILO of Ranganadi HEP I-Ziro at Ranganadi HEP II 132 kV D/C
NER Evacuation System for Dikrong (110 MW)
1. Dikrong-Ranganadi HEP-I 132 kV D/C
NER Evacuation System for Subnasiri Lower HEP (2000 MW)
1. Biswanath Chariyali to be developed as a pooling station in NER
2. Subansiri – Biswanath Chariyali 400kV 2xD/C Quad lines.
3. Biswanath Chariyali – Agra, HVDC Bipole, +/- 600kV, 4000 MW.
NER System Strengthening Sch-I
1. 220kV and 132kV works for Aizwal, Dimapur, Kopili, Khandong

Transmission Planning & National Grid Working Group on Power for 11th Plan
Page 59 of Chapter 2
Appendix- 2.9 STATES’ TRANSMISSION SCHEMES FOR THE XI PLAN EVACUATION SYSTEM
FOR GENERATION PROJECTS
States of Northern Region
Gen. Project State sector generation projects Transmission scheme/proposal
HP UHL-III (100MW)
• UHL-Bassi 132 kV D/C • UHL-Hamirpur D/C
KASHANG I & II (126MW)
• LILO of Bhabha-Kunihar S/C at Kashang 220 kV D/C
SAINJ (100 MW)
• Through Parbati Transmission system
SHONGTONG KARCHAM (402 MW)
• Shongtong Karcham-Karcham Pooling Station 400 kV D/C • Karcham Pooling Station-NR load centers to be decided
after firming up of generation in the complex HARYANA YAMUNA NAGAR U1&2 (500 MW)
• Yamuna Nagar TPS-Yamuna Nagar 220 kV 2xD/C • Yammuna Nagar TPS-Tepla 220 kV D/C • Yammuna Nagar -Ladwa 220 kV D/C • Ladwa-Nissing 220 kV D/C • Ladwa 220/132 kV 100 MVA S/S
UP
ANPARA C (1000 MW)
• Charging of Anpara-Unnao 765 kV S/C line at 765 kV • Anpara 765/400 kV 2x630 MVA S/S • Unnao 765/400 kV 3x630 MVA S/S
ROSA (600 MW)
• Rosa-Shahjahanpur 220 kV 2xS/C • Rosa-Hardoi 220 kV D/C • Rosa-Badaun 220 kV S/C • Hardoi 220/132 kV 2x100 MVA S/S
RAJASTHAN
GIRAL U-1&2 (250 MW)
• Giral-Barmer 220 kV D/C • LILO Barmer-Amar Sagar at Giral 220 kV D/C
CHHBRA TPS (500 MW)
• Chabra TPS-Swaimadhopur 400 kV D/C • Swaimadhopur 400/220 kV 2x315 MVA S/S
KOTA U-7 (195 MW)
• Step up generation voltage at 220 kV • Split existing KTPS bus with U 6&7 on one section and rest
on other section • KTPS 6&7 section-Kota (PG) 220 kV D/C with twin moose
UTTARANCHAL

Transmission Planning & National Grid Working Group on Power for 11th Plan
Page 60 of Chapter 2
TUINIPALASU (42 MW)
• LILO one ckt Arakot Tuni-Mori at Tuinipalasu 220 kV D/C
BAWALA NAND PRAYAG (132MW)
• Bawala Nand Prayag – Karanpryag 132 kV D/C line
PALAMANERI (480 MW)
• LILO one ckt Lohari Nagpala-Tehri Poling Point at Palamaneri 400 kV D/C
Gen. Project Private sector generation projects
Transmission scheme/proposal HP
ALLAN DHUNGAN (192MW)
• ALLAIN DHUANGAN – NALAGARH 220 KV D/C
KARCHAM WANGTOO
(1000MW)
• LILO OF BASPA – NATHPA JHAKRI D/C LINE AT KARCHEM WANGTOO
• KARCHEM WANGTOO – ABDULLAPUR 400 KV D/C • BEYONG ABDULLAPUR TR. SYSTEM HAS TO BE
EVOLVED DHAMVARI
SONDA (70MW)
• DHAMWARI SUNDA - MALIANA 2XS/C+D/C
SAWARA KUDDU
(110 MW)
NOT YET IDENTIFIED
Punjab GOVINDWAL
SAHEB (500 MW)
• GOINDWAL-TATHASAHIB 220 KV D/C • GOINDWAL-TARNTARAN 220 KV D/C • LILO OF JAMSHER-VERPAL D/C AT
GOINDWALSAHIB-220 KV 2XD/C • GOINDWAL 220/132 KV 100 MVA S/S
UTTRANCHAL
VISHNU PRAYAG (400
MW)
NOT YET IDENTIFIED

Transmission Planning & National Grid Working Group on Power for 11th Plan
Page 61 of Chapter 2
States of Western Region
Gen. Project State sector generation projects Transmission scheme/proposal
GUJARAT UTRAN CCGT
(350MW) • UTRAN-KOSAMABA 220 KV 2XD/C
PAGUTHAN (350+700 MW)
• PAGUTHAN-KASOR 400 KV D/C • PAGUTHAN-FEDRA 400 KV D/C • SYSTEM STRENGTHENING BELOW FEDRA 400 KV S/S
YET TO BE IDENTIFIED BY GETCO Sikka Repl. Ext. (500MW)
TRANSMISSION SYSTEM YET TO BE IDENTIFIED
Surat Lignite Ext. (250MW)
TRANSMISSION SYSTEM YET TO BE IDENTIFIED
MP & GUJ. MALWA
(1000 MW) TRANSMISSION SYSTEM YET TO BE IDENTIFIED
MAHARASHTRA
PARLI EXT. STAGE-II (250 MW)
• LILO OF BOTH CKTS OF PARLI-BEED D/C LINE AT PARLI EXTN. 220 KV 2XD/C
• LILO OF NANDED-GIRWALI LINE AT PARLI EXTN. 220 KV D/C
PARAS EXT. U-II
(250 MW)
• LILO OF BOTH CKTS OF AKOLA-CHIKLI D/C LINE AT PARAS EXTN. 220 KV 2XD/C
• PARAS EXTN.-AKOLA 220 KV D/C KHAPER KHEDA
EXT (500MW)
• LILO OF CHANDRAPUR-KORADI S/C LINE AT KHAPERKHEDA 400 KV D/C
• KHAPERKHEDA 400/220 KV 1X315 MVA S/S • KHAPERKHEDA II- KHAPERKHEDA 220 KV D/C
CHHATISGARH
KORBA WEST EXT (600MW)
• KORBA (W)-BHILAI (KHEDAMARA) D/C KORBA (W)-BHILAI (KHEDAMARA) 400 KV D/C
• BHILAI (KHEDAMARA)-RAJNANDGARH 220 KV D/C • BHILAI (KHEDAMARA)-BEMATARA 220 KV D/C • RAJNANDGAON 220/132 KV 1X160 MVA S/S

Transmission Planning & National Grid Working Group on Power for 11th Plan
Page 62 of Chapter 2
MARWA (1000 MW)
• MARWA-RAIPUR (NEW) 400 KV D/C • LILO OF KORBA-KHEDAMARA S/C AT MARWA 400 KV
D/C • MARWA 400/220 KV 1X315 MVA S/S • RAIPUR (NEW) 400/220 KV 1X315 MVA S/S • MAHASAMUND-GURUR 220 KV D/C • RAIPUR (NEW)-DOMA 220 KV D/C • RAIPUR (NEW)-SILTARA 220 KV D/C • RAIPUR (NEW)-URLA 220 KV D/C • RAIPUR (NEW)-MAHASAMUND 220 KV D/C • MARWA-MOPKA 220 KV D/C • DOMA 220/132 KV 1X160 MVA S/S • DOMA (220 KV)-KACHNA 132 KV D/C • DOMA (220 KV)-KURUD 132 KV D/C
MATNAR (60 MW)
• EVACUATION AT 132 KV LEVEL
BODHGHAT (500 MW)
• BODHGHAT (BARSOOR)-KHEDAMARA 400 KV D/C
IGTPP BHAYTHAN
(1320 MW)
• BHAIYATHAN-BILASPUR 400 KV D/C • BILASPUR-RAIPUR 400 KV D/C • BHAIYATHAN-BISHRAMPUR 220 KV D/C • BILASPUR-MOPKA 220 KV D/C • BHAIYATHAN-PENDRAROAD-BAIKUNTHPUR 220 KV
D/C • MOPKA-MUNGELI 220 KV D/C • BHAIYATHAN 400/220 KV 1X315 MVA S/S • BILASPUR 400/220 KV 1X315 MVA S/S • MUNGELI 220/132 KV 1X160 MVA S/S • BAIKUNTHPUR 220/132 KV 1X160 MVA S/S • MUNGELI (220 KV)-MUNGELI 132 KV D/C • BAIKUNTHPUR (220 KV)-BAIKUNTHPUR 132 KV D/C
PRIVATE SECTOR GENERATION PROJECTS GUJARAT
AKHAKHOL- PAGUTHAN
(730MW)
• LILO OF KAWAS-GANDHAR 400 KV D/C AT AKHAKHOL • AKHAKHOL-DEHGAM 400 KV D/C
ESSAR-HAZIRA EXT. (1460MW)
TRANSMISSION SYSTEM YET TO BE IDENTIFIED
BHAVNAGAR (NIRMA JV)
(250 MW)
TRANSMISSION SYSTEM YET TO BE IDENTIFIED
MAHARASHTRA
VILE-TATA (1000 MW)
TRANSMISSION SYSTEM YET TO BE IDENTIFIED

Transmission Planning & National Grid Working Group on Power for 11th Plan
Page 63 of Chapter 2
CHHATISGARH RAIGARH
(750MW) TRANSMISSION SYSTEM YET TO BE IDENTIFIED
PATHDI TPS-LANCO
(1200MW)
TRANSMISSION SYSTEM YET TO BE IDENTIFIED
MP
MAHESHWAR (400MW)
• Maheshwar-Pithampura 220 kV D/C • Maheshwar-Rajgarh 220 kV D/C • Maheshwar-Julwania 220 kV D/C
States of Southern Region
Gen. Project State sector generation projects Transmission scheme/proposal
AP VIJYAWADA
TPP (660MW)
• VTPS - Yeddumailaram 400kV D/C • VTPS - Narasaraopeta 400kV D/C • Tadikonda - Narasaraopeta 400kV S/C • 1x315 MVA, 400/220 kV Transf at VTPS switchyard
JAURALA PRIYA
(195MW)
• Jurala HEP- Mehboobnagar 220kV D/C
N. SAGAR TP DAM (50MW)
• Existing system
KARNATAKA
BIDADI (1400MW)
YET TO BE IDENTIFIED
NAGARJUNA TPP
(1015 MW)
• Nagarjuna TPP-Hassan 400 kV D/C • Hassan-Bidadi 400 kV D/C • LILO 2nd ckt Talaguppa-Neelamangla at Hassan 400 kV
D/C RAICHUR U-8 (210 MW)
• Existing system adequate
BELLARY EXT.
(500 MW)
YET TO BE IDENTIFIED
GUNDIA EXT. (300 MW)
YET TO BE IDENTIFIED
KERALA
ADIRAPALLI (163MW)
YET TO BE IDENTIFIED

Transmission Planning & National Grid Working Group on Power for 11th Plan
Page 64 of Chapter 2
TAMIL NADU
BHAWANI KATHLAI U2
(60MW)
• Existing system adequate
Gen. Project Private sector generation projects
Transmission scheme/proposal AP
BHOPALPALLI (500MW)
YET TO BE IDENTIFIED
States of Eastern Region
Gen. Project State sector generation projects Transmission scheme/proposal
WEST BENGAL
PURULIA PSS (225+675 MW)
• Purulia-Bidhannagar 400 kV D/C • Purulia-Arambag 400 kV D/C
SAGARDIGHI-II (1000MW)
• LILO of Farakka-Jeerat-Subhashgram 400 kV S/C at Sagardighi TPS.
• Sagardighi TPS-Durgapur 400 kV S/C
BAKRESHWAR U5 (210MW)
• Existing 400kV and 220kV transmission system will be adequate.
DPL TPS (500 MW)
• DPL-Durgapur 400 kV D/C
BAKRESHWAR U6
(210MW)
• Bakreshwar-Jagatballavpur 400 kV S/C • Jagatballavpur 400/220 kV 2x315 MVA S/S • Jagatballavpur-Domjur 220 kV D/C
Katwa TPP (1000 MW)
• Katwa-Maithon 400 kV D/C
JHARKHAND
TENUGHAT EXT
(630MW)
• Tenughat TPS-Ranchi 400kV D/C-200ckms. • Existing TenughatTPS-Biharsariff 400kV S/C line will
be charge at 400 kV.

Transmission Planning & National Grid Working Group on Power for 11th Plan
Page 65 of Chapter 2
Gen. Project Private Sector Generation Projects
ORISSA
IB STAGE-II U 5 & 6
(2X250MW)
• IB TPS-Meramundali 400 kV D/C – 400kV operation. (THE LINE IS TO BE INITIALLY OPERATED AT 220KV UNDER STAGE-I. THE LINE IS UNDER CONSTRUCTION)
JORDA NUELPOI, CESC
(500 MW)
• Jorada Nuelpoi-Ib TPS 400 kV D/C
AURANGA TPP, TATA POWER
(1000 MW)
• Auranga TPP-Maithon (PG) 400 kV D/C
WEST BENGAL
BUDGE BUDGE EXTN.
WB+CESC JV (250 MW)
• Existing system adequate
States of North-Eastern Region
Gen. Project State sector generation projects Transmission scheme/proposal
ASSAM LAKWA W. H.
(38 MW) • EXISTING SYSTEM ADEQUATE
MEGHALYA MYNTDU STAGE-I (84MW)
• MYNTDU-KHLIEHRIAT 132KV D/C LINE.
Gen. Project Private Sector Generation Projects TRIPURA
TRIPURA GAS ONGC (1050MW)
• TRIPURA GAS-SILCHAR 400 KV D/C QUAD • SILCHAR-BONGAIGAON 400 KV D/C QUAD • BONGAIGAON-SILLIGURI 400 KV D/C QUAD • PURNEA-BIHARSHARIF 400 KV D/C QUAD • TRIPURA GAS 400/132 KV SWITCHYARD AND 132 KV
LINES TO GRID • SILCHER 400/132 KV S/S AND 132 KV LINES TO GRID
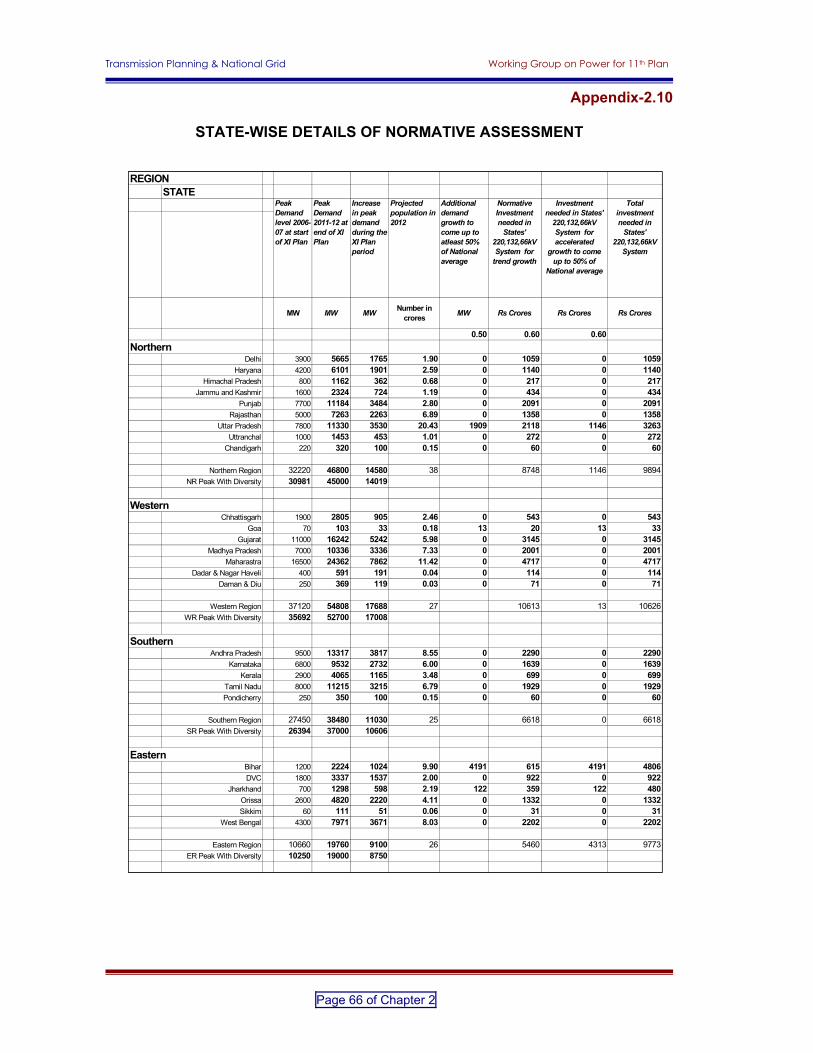
Transmission Planning & National Grid Working Group on Power for 11th Plan
Page 66 of Chapter 2
Appendix-2.10
STATE-WISE DETAILS OF NORMATIVE ASSESSMENT
REGIONSTATE
MW MW MW Number in crores MW Rs Crores Rs Crores Rs Crores
0.50 0.60 0.60Northern
Delhi 3900 5665 1765 1.90 0 1059 0 1059Haryana 4200 6101 1901 2.59 0 1140 0 1140
Himachal Pradesh 800 1162 362 0.68 0 217 0 217Jammu and Kashmir 1600 2324 724 1.19 0 434 0 434
Punjab 7700 11184 3484 2.80 0 2091 0 2091Rajasthan 5000 7263 2263 6.89 0 1358 0 1358
Uttar Pradesh 7800 11330 3530 20.43 1909 2118 1146 3263Uttranchal 1000 1453 453 1.01 0 272 0 272
Chandigarh 220 320 100 0.15 0 60 0 60
Northern Region 32220 46800 14580 38 8748 1146 9894NR Peak With Diversity 30981 45000 14019
WesternChhattisgarh 1900 2805 905 2.46 0 543 0 543
Goa 70 103 33 0.18 13 20 13 33Gujarat 11000 16242 5242 5.98 0 3145 0 3145
Madhya Pradesh 7000 10336 3336 7.33 0 2001 0 2001Maharastra 16500 24362 7862 11.42 0 4717 0 4717
Dadar & Nagar Haveli 400 591 191 0.04 0 114 0 114Daman & Diu 250 369 119 0.03 0 71 0 71
Western Region 37120 54808 17688 27 10613 13 10626WR Peak With Diversity 35692 52700 17008
SouthernAndhra Pradesh 9500 13317 3817 8.55 0 2290 0 2290
Karnataka 6800 9532 2732 6.00 0 1639 0 1639Kerala 2900 4065 1165 3.48 0 699 0 699
Tamil Nadu 8000 11215 3215 6.79 0 1929 0 1929Pondicherry 250 350 100 0.15 0 60 0 60
Southern Region 27450 38480 11030 25 6618 0 6618SR Peak With Diversity 26394 37000 10606
EasternBihar 1200 2224 1024 9.90 4191 615 4191 4806DVC 1800 3337 1537 2.00 0 922 0 922
Jharkhand 700 1298 598 2.19 122 359 122 480Orissa 2600 4820 2220 4.11 0 1332 0 1332Sikkim 60 111 51 0.06 0 31 0 31
West Bengal 4300 7971 3671 8.03 0 2202 0 2202
Eastern Region 10660 19760 9100 26 5460 4313 9773ER Peak With Diversity 10250 19000 8750
Normative Investment needed in
States' 220,132,66kV System for
trend growth
Investment needed in States'
220,132,66kV System for accelerated
growth to come up to 50% of
National average
Total investment needed in
States' 220,132,66kV
System
Additional demand growth to come up to atleast 50% of National average
Projected population in 2012
Peak Demand level 2006-07 at start of XI Plan
Peak Demand 2011-12 at end of XI Plan
Increase in peak demand during the XI Plan period

Distribution Including Village & Household Electrification Working Group on Power for 11th Plan
Page 1 of Chapter 3
Chapter- 3
DISTRIBUTION INCLUDING VILLAGE AND HOUSHOLD ELECTRIFICATION
3.0 OVERVIEW Distribution is the key segment of electricity supply chain. The distribution sector caters to rural and urban areas. Rural distribution segment is characterized by wide dispersal of net work in large areas with long lines, high cost of supply, low paying capacity of the people, large number of subsidized customers, un-metered flat rate supply to farmers, non metering due to high cost and practical difficulties, low load and low rate of load growth. Urban distribution is characterized by high consumer density, and higher rate of growth of load. The consumer mix in urban areas is mostly commercial, residential, and industrial, whereas consumer mix in rural areas is mainly agriculture and residential. Both segments are distinct with different problems and issues. Electricity Act 2003 has recognized Rural Electrification as a separate entity. The biggest challenge of the power sector is the high T&D losses. A combination of technical and non-technical factors is contributing to high Transmission and Distribution losses. Lack of consumer education, political interference, and inefficient use of electricity is further aggravating the problem. As T&D loss figures did not capture the gap between the billing and the collection, the concept of Aggregate Technical & Commercial (AT&C) loss was introduced in 2001-2002 to capture total performance of the utility. The AT&C losses are presently in the range of 18% to 62% in various states. The average AT&C loss in the country is at 34%. There is wide variation of losses among the states and variation among the Discoms within the states. The major portion of losses are due to theft and pilferage, which is estimated at about Rs.20, 000 crore annually. Apart from rampant theft, the distribution sector is beset with poor billing (only 55%) and collection (only 41%) efficiency in almost in all States. More than 75-80% of the total technical loss and almost the entire commercial loss occur at the distribution stage. It is estimated that 1% reduction in T&D losses would generate savings of over Rs.700 to Rs.800 crores. Reduction of T&D loss to around 10% will release energy equivalent to an additional capacity of 10,000-12,000 MW.

Distribution Including Village & Household Electrification Working Group on Power for 11th Plan
Page 2 of Chapter 3
Table 3.1 State-wise AT&C Losses
Less than 20% Between 20-30% Between 30-40% Above 40% Goa Andhra Pradesh Karnataka Delhi Tamil Nadu Gujarat Kerala Uttar Pradesh West Bengal Assam Bihar Himachal Pradesh Rajasthan Jharkhand Maharashtra Haryana Madhya Pradesh Tripura Meghalaya Arunachal Pradesh Punjab Chhattisgarh Manipur Uttaranchal Mizoram Nagaland
The Sub-transmission and Distribution systems have been the thrust areas during 10th Plan. The reduction of AT&C losses with improvement of quality and reliability were given special attention during the 10th Plan. In line with this, Accelerated Power Development and Reform Programme was launched with thrust on AT&C loss reduction through techno-commercial interventions to achieve commercial viability. For rural areas Rajiv Gandhi Grameen Vidyutikaran Yojna has been launched in April 2005 with 90% grant to achieve 100% electrification of villages. 3.1 KEY ISSUES IN ELECTRICITY DISTRIBUTION SECTOR The problems in Distribution sector have accumulated over the years mainly due to lack of investment, commercial orientation, excessive T&D losses, distorted tariff policies etc. Following are the key issues / key factors effecting overall performance of the distribution sector: 3.1.1 State Government related Uncertain commitment of State Governments is key impediment to the ongoing reform process. This includes delay in unbundling and restructuring of State Electricity Boards, minimal/no financial support to unbundled utilities during transition period, inadequate financial support for providing subsidised power to domestic and agricultural consumers, inadequate administrative support in curbing theft of power etc. Frequently changing policies of the State Governments in regard to subsidies/free power to farmers adversely affecting the revenue recovery and cost coverage of utilities. 3.1.2 Regulatory process related issues SERCs are inadequately staffed with poor infrastructure. Due to lack of competency and resources in Discoms, tariff filings are often delayed. In several cases, SERC asks Discoms to revise their filings on account of data gaps or improper information. There is no central repository of data in electronic form which leads to delay in filing petitions and responding to queries from the regulator. The distribution licensees have not been able to fully implement regulations and directives due to various reasons like lack of skilled human resources, resource constraints or inadequate training/awareness.

Distribution Including Village & Household Electrification Working Group on Power for 11th Plan
Page 3 of Chapter 3
3.1.3 Corporate governance and institutional issues Most of the distribution companies formed as a result of unbundling of SEB are still not fully autonomous. In many cases, unbundling is limited to operational and technical segregation. Segregation of accounts, cash flow, human resources is not complete. Successor companies are highly dependent on their parent company (i.e. residual SEB or single buyer/trade co or Transco) for financials/cash flow, human resources, investment decisions and other administrative matters and therefore, the focus on efficiency improvement from respective entities is lacking. Due to in-adequate network expansion commensurate with load growth, many power transformers, distribution transformers, 33kV lines and 11kV feeders are overloaded. Reinforcement of existing network in the form of new transformers, new lines and augmentation of existing transformers and lines is poor. Most of the distribution networks in India are quite old which results in to reduced reliability, increased R&M expenses and poor quality of supply. The system also suffers low HT/LT ratio. The consumer awareness about Demand Side Management (DSM) is limited which results in to higher consumption and increased losses. DSM initiatives such as local reactive power compensation, use of energy efficient devices, Time of Day tariff, use of renewable sources etc. are lacking. 3.1.4 Commercial issues Commercial losses are primarily due to improper energy accounting and billing processes, faulty metering, under-billing, theft and pilferage of energy and lack of accountability within the organization. Commercial losses are estimated at about Rs. 26,000 crore during 2000-01 and theft of electricity is estimated to cost the country at about Rs. 20,000 crore per year (Source: MoP). The chart shows overall T&D losses in India.
Only 87% of the total consumers in India are metered (Source: Mop, 2004-05). Many states have undertaken 100% metering programs, but not yet completed. The chart below indicates consumer metering level in some of the states. This does not include defective meters.
05
10152025303540
FY 92 FY 94 FY 96 FY 98 FY 00 FY 02 FY 04
% L
osse
s
Source: MoP Presentation July 19, 2005
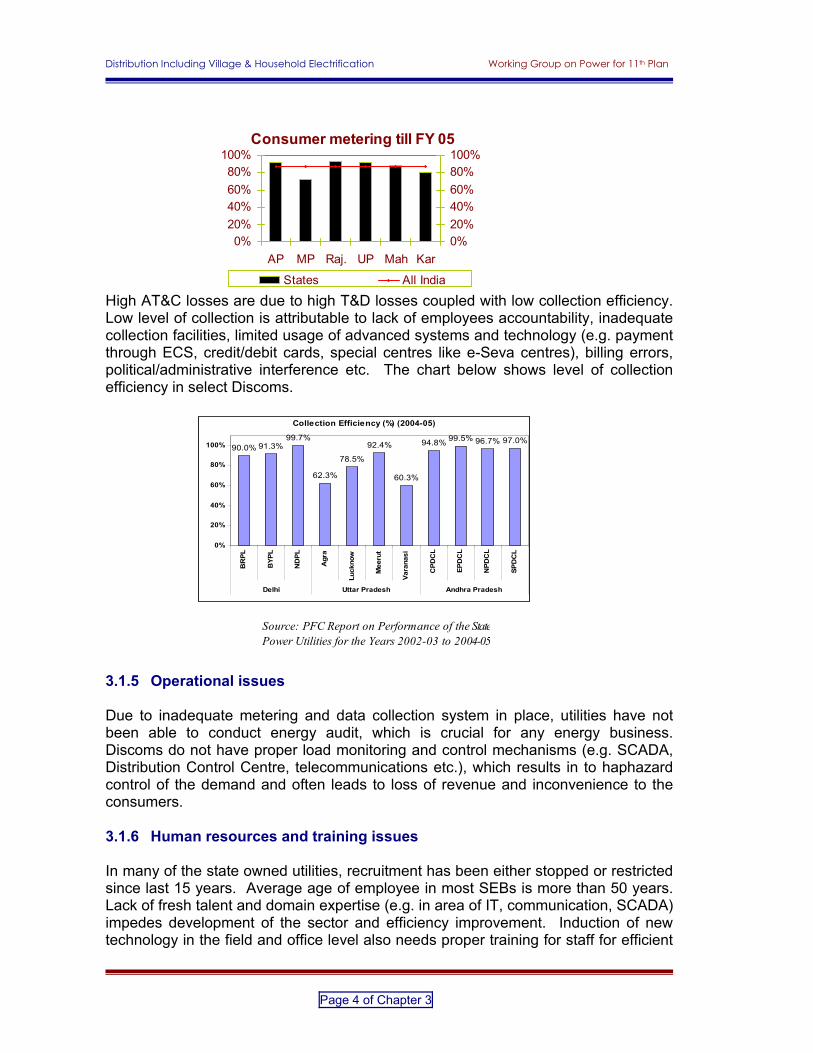
Distribution Including Village & Household Electrification Working Group on Power for 11th Plan
Page 4 of Chapter 3
Source: PFC Report on Performance of the State Power Utilities for the Years 2002-03 to 2004-05
High AT&C losses are due to high T&D losses coupled with low collection efficiency. Low level of collection is attributable to lack of employees accountability, inadequate collection facilities, limited usage of advanced systems and technology (e.g. payment through ECS, credit/debit cards, special centres like e-Seva centres), billing errors, political/administrative interference etc. The chart below shows level of collection efficiency in select Discoms.
3.1.5 Operational issues Due to inadequate metering and data collection system in place, utilities have not been able to conduct energy audit, which is crucial for any energy business. Discoms do not have proper load monitoring and control mechanisms (e.g. SCADA, Distribution Control Centre, telecommunications etc.), which results in to haphazard control of the demand and often leads to loss of revenue and inconvenience to the consumers. 3.1.6 Human resources and training issues In many of the state owned utilities, recruitment has been either stopped or restricted since last 15 years. Average age of employee in most SEBs is more than 50 years. Lack of fresh talent and domain expertise (e.g. in area of IT, communication, SCADA) impedes development of the sector and efficiency improvement. Induction of new technology in the field and office level also needs proper training for staff for efficient
Consumer metering till FY 05
0%20%40%60%80%
100%
AP MP Raj. UP Mah Kar0%20%40%60%80%100%
States All India
Collection Efficiency (%) (2004-05)
90.0% 91.3%99.7%
62.3%
78.5%
92.4%
60.3%
94.8% 99.5% 96.7% 97.0%
0%
20%
40%
60%
80%
100%
BR
PL
BYP
L
ND
PL
Agr
a
Luck
now
Mee
rut
Vara
nasi
CPD
CL
EPD
CL
NPD
CL
SPD
CL
Delhi Uttar Pradesh Andhra Pradesh

Distribution Including Village & Household Electrification Working Group on Power for 11th Plan
Page 5 of Chapter 3
handling. Discoms need to undertake training need analysis and roll out training programmes for employees working in different areas. In a typical SEB, ratio of field staff to support/office staff is 54:46. However, customer facing staff is inadequate. Also, ratio of meter readers to consumers on the other hand ranges from 1:3000 to 1:7000.
Productivity of the employees: The chart below shows some of the key parameters of select entities / state to assess productivity of the employees in distribution sector. (Note: Pink bar indicates private player, blue bar indicates government owned Distribution Company) (Source: Websites/Tariff Orders of respective utilities)
3.1.7 Technological issues Many of the distribution utilities in India are still lacking most basic requirements – consumer database and asset database which can be addressed through IT and communication solutions. Utilities do not have complete record of all consumers, which results in to direct revenue loss. Most utilities maintain manual records of consumers (in the form of register) especially in rural areas. Electromechanical meters, manual reading of meters, manual bill preparation and delivery and inadequate bill collection facilities result in to overall delay in revenue collection and revenue leakage. Conventional complaint handling process results in delayed redressal and increased dissatisfaction among customers.
No. of Distribution Employees per lakh consumers
0
100
200
300
400
AP
UP
Raj
asth
an MP
Oris
sa
Ass
am
Source: Companies Annual Report for FY'05
Private players Versus State owned
0
50
100
150
200
250
300
BS
ESY
amun
a
BS
ES
Raj
dhan
i
ND
PL
AP
UP
MP
Ori
ssa
Thou
sand
sRs
0.000
0.200
0.400
0.600
0.800
1.000
1.200
Rs./Unit and M
U/E
mployee
Expense per employee Expense per unit soldMU sold per employee

Distribution Including Village & Household Electrification Working Group on Power for 11th Plan
Page 6 of Chapter 3
Regular monitoring and testing of critical assets such as 11kV feeders, 11/0.4kV distribution transformers and 415V feeders etc. are very important in ensuring reliable supply. Monitoring of consumer energy metering systems is critical to overall revenue. Asset database is crucial in efficient management of assets and claiming depreciation under annual revenue requirement. Almost all distribution companies do not have real-time monitoring system and typically use phone or radio communication for demand management. Most Discoms do not have distribution control centre which can manage load shedding and instructions from SLDC. Discoms need to plan implementation of SCADA in long term keeping in view capital cost and benefits. 3.2 DISTRIBUTION REFORMS 3.2.1 In the power sector reform process, the significant initiatives during 10th Plan are enactment of Electricity Act 2003, notification of National Electricity Policy, Tariff Policy and Rural Electrification Policy. Distribution segment was identified as the key area for reform for putting the sector on the right track. Distribution Reforms involve System up-gradation, Loss reduction, Theft control, Consumer orientation, Commercialization and adoption of I T. 3.2.2 Six Level Intervention Strategy In order to achieve commercial viability, Ministry of Power has formulated a six level intervention strategy that encompasses initiatives at national level, state level, SEB/ utility level, distribution circle level, feeder level and consumer level as part of distribution reforms. These are: i) National level intervention-Relates to policy, legislation frame work, uniform
standards, energy conservation, accounting etc. ii) State level intervention-Formation of SERCs, issuance of regular tariff order,
providing legislative support, removal of Tariff anomalies, subsidies and budgetary support.
iii) SEB level intervention-Restructuring, accountability, commercial accounting, integrated MIS, benchmarking of parameters, Grid discipline and TOD metering.
iv) Distribution Circle level intervention-in the billing, reducing energy handling cost, circle to function as independent business unit
v) Feeder level intervention-100% metering at 11 kV feeder, total accounting of energy & quality power supply
vi) Consumer level intervention-Mandatory metering including billing, consumer satisfaction & energy conservation.
3.3 NEW LEGAL AND POLICY FRAMEWORK 3.3.1 Electricity Act 2003 Electricity Act-2003 was notified in June 2003 with Competition, Protection of Consumers interests & Power for all Areas, as objectives. The Act provides liberal framework for power development and creates competitive environment to facilitate private investment. It has de-licensed generation and in rural areas, stand alone

Distribution Including Village & Household Electrification Working Group on Power for 11th Plan
Page 7 of Chapter 3
generation and distribution has been de-licensed. It provides for multiple licensing in Distribution and stringent provisions for controlling theft of electricity. It obliges states to restructure Electricity Boards. The Regulatory Commissions will determine tariffs. It provides for open access in Transmission from outset and open access in Distribution to be allowed by State Electricity Regularity Commissions (SERCs) in phases. The cross subsidies will have to be gradually phased out. Trading has become a distinct licensed activity to promote development of electricity market. Electricity Act-2003 provides for notification of National Electricity Plan by Central Electricity Authority for short-term framework of 5 years while also projecting a 15-year perspective. 3.3.2 Energy Conservation Act, 2001
Energy Conservation Act was enacted on October 1, 2001. The Act lays down concrete measures to ensure efficient use of energy and its conservation. The Act came into effect on March 1, 2002. The Bureau of Energy Efficiency (BEE) has been set up to make wide ranging regulations to further the objectives of the Act. The Central and State Governments have been empowered to facilitate and enforce efficient use of energy and its conservation. 3.4 POLICY INITIATIVES In compliance with provisions of the Electricity Act 2003, National Electricity Policy, National Tariff Policy and National Rural Electrification Policy as have been notified by the Ministry of Power. 3.4.1 National Electricity Policy (2005)
The National Electricity Policy aims at laying guidelines for accelerated development of the power sector, providing supply of electricity to all areas and protecting interests of consumers and other stakeholders. The policy envisages multi-year tariff; private sector participation in distribution, open access in distribution, segregation of technical and commercial losses through energy audits, standards for reliability and quality of supply in line with an international practice by year 2012, implementation of modern information technologies system on priority basis with special emphasis on consumer indexing and GIS mapping, promotion of HVDS system, sub-station automation and effective implementation of anti theft provisions of Electricity Act 2003. 3.4.2 The National Tariff Policy (2006)
The National Tariff Policy has been notified in January 2006. As per the policy all future requirement of power needs to be procured competitively by distribution licensees except in cases of expansion of existing projects or where there is a State controlled/owned company developer. It provides framework for performance based cost of service regulation in respect of aspects common to generation, transmission as well as distribution. Multi-year tariff framework is to be adopted for tariff to be determined from April 1, 2006. The policy envisages suitable performance norms of operations with incentives and dis-incentives along with appropriate arrangement for sharing the gains of efficient operations with the consumers. Electricity is to be made available for 24 hours particularly for those consumers who are willing to pay tariff

Distribution Including Village & Household Electrification Working Group on Power for 11th Plan
Page 8 of Chapter 3
which reflects efficient costs. The policy emphasizes giving subsidy in transparent and targeted manner and the cross subsidies for different consumers should be brought within the range of +20% of average of the supply by the end of the year 2010-2011. The tariff fixation should ensure sustainable use of ground water resources. The cross subsidy surcharge to be computed in a way so that open access becomes a reality. 3.4.3 Rural Electrification Policy (2006)
The Rural Electrification Policy envisages provision of access to electricity to all households by the year 2009 and minimum lifeline consumption of 1 unit per household per day as merit good by year 2012, promotion of decentralized distribution generation, rural electrification plan by State Governments to achieve the goal of providing access to all households, setting up of the District Committees, implementation of Franchisee system as mandated by RGGVY for distribution management, If state Government / SERC decides to permit licensee to use assets created with subsidy the benefit of capital subsidy to be passed on to consumers. Government of India to evolve model schemes in consultation with NABARD and RBI to encourage widespread participation by lending community in RE initiatives, Energy efficiency to be promoted as mass campaign in rural areas. Government of India should evolve programmes for encouraging use of economically viable energy efficient farm equipment – irrigation pumpsets and use of IT for supply of electricity should be encouraged.
3.4.4 Integrated Energy Policy (IEP)
Some of the important recommendations relate to the following areas:
• Transparent and targeted subsidies;
• Improved efficiencies.
• On the power sector the key high priority recommendations of the energy policy relate to power sector reforms to focus on controlling aggregate technical and commercial losses of the transmission and distribution utilities. In order to reduce AT&C losses the Committee recommended APDRP to be restructured to ensure energy flow auditing at the distribution transformer level through
• Automated meter reading, Geographical Information System (GIS) mapping of the network & consumers and separation of feeders for agricultural pumps.
• Investment in developing a Management Information System (MIS) that can support a full energy audit for each distribution transformer is essential for reduction in AT&C losses. This will also fix accountability and provide a baseline which is an essential prerequisite to management reform and/or privatization.
• Introduce time-of-day pricing with shift to electronic meters.
• For all loads above say 50 kWh, introduce intelligent meters that permit real time and remote recording of data and allow remote control over the power

Distribution Including Village & Household Electrification Working Group on Power for 11th Plan
Page 9 of Chapter 3
supplied by each meter. This would help effective management of connected load and the reported pilferage by large consumers.
• The improvements listed above and the base line data generated as a result would bring greater transparency in the process of privatization (if pursued) and provide a better estimate of the transition funding needs under outcome driven privatization models that seek to restore the viability of distribution.
• All central assistance to state governments for the power sector must be linked exclusively to loss reduction and improved viability.
• The restructured APDRP can, in the very least, help create an authentic base line. The revised APDRP will provide incentives to State Electricity Boards (SEBs) that are linked to performance outcomes and will also include incentives to staff for reduction in AT&C losses.
• The Committee also recommended that liberal captive and new captive regime foreseen under the Electricity Act 2003 be realized to derive economic benefits from availability of distributed generation. It will also set competitive wheeling charges to supply power group to captive consumers. This will pave the way for open access to distribution networks. To achieve these objectives, the Committee feels that it is essential to separate the cost of pure wire business carriage to energy business content in both transmission and distribution at different voltages. The wires business within the distribution segment is also a natural monopoly and must be regulated.
• The Committee recommended introduction of availability based tariffs (ABT) for intra-state sales and upgradation of state load dispatch centres to the technical level of regional load dispatch centres.
• Committee recommended that gross subsidy surcharge; wheeling charge and back-up charges are set properly to make the utilities viable after high value paying customers migrated to new suppliers due to Open Access. These charges need to be periodically revised and independently regulated.
• Committee recommended that the regulators should set Multi Year Tariff.
• To make RGGVY sustainable the committee recommended that, a business plan with a viable revenue model needs to be elaborated. A clear pricing and subsidy policy and the mission’s target to be announced soon and the franchisees should run the local network.
• The Committee suggested generation of electricity through wood gasifier or by burning surplus bio-gas from the community bio-gas plants. Such distribution generators may be able to take electricity to villages sooner than the grid and tariff should be formulated for such distributed generation for both household and productive uses including agriculture.
• The Committee has emphasized energy efficiency and demand side management. The Committee feels that with an aggressive pursuit of energy efficiency and conservation, it is possible to reduce India’s energy intensity up

Distribution Including Village & Household Electrification Working Group on Power for 11th Plan
Page 10 of Chapter 3
to 25% from the current level. Some of the recommended initiates of the Committee for quick yield returns are as follows:
Regulatory commissions can allow utilities to factor EE/DSM expenditure into the tariff.
Each energy supply company/utility should set up an EE/DSM cell. All utilities should introduce TOD tariffs for large industrial and
commercial consumers to flatten the load curve. Utilities should support load research to understand the nature of different sectoral load profiles and the price elasticities of these loads between different time periods to correctly assess the impact of differential tariffs during the day.
Enforce mandatory purchase of electricity at fixed prices from co generators (at declared avoided costs of the utility) by the grid to encourage cogeneration.
Improving efficiency of industrial, municipal and agricultural water pumping.
Instituting an efficient motors programme. This initiative should focus on manufacturers/rewinding shops and target market transformation, by providing incentives to supply energy efficient motors.
Instituting an efficient boiler programme. Promoting Solar Hot Water Systems. This programme should aim at
both industrial and household needs of hot water. Undertaking efficient lighting initiative. Making energy audits compulsory for all loads above 1 MW
The Group agrees with recommendations of the IEP and some of the implementation strategies are contained in this report. 3.5 DISTRIBUTION OF POWER IN URBAN AREAS 3.5.1 Accelerated Power Development and Reforms Programme (APDRP) Accelerated Power Development Programme (APDP) programme is part of the six level intervention strategies for accelerating distribution reforms. In 2001, the Government of India introduced the Accelerated power development programme (APDP), with the objective of initiating a financial turnaround in the performance of the State owned power sector. The Programme was formulated to finance specific projects for up-gradation of sub-transmission and distribution (ST&D) network and Renovation and Modernization R&M) of power projects (Thermal & Hydro). During the year 2000-01 and 2001-02, the Government has provided budgetary allocation of Rs.1000 crore and Rs.1500 crore respectively to the State Governments as Additional Central Assistance under APDP. In 2000-01 project costing Rs.1456.78 crore were sanctioned and the Government released Rs.786.29 crore in one installment. The utilities have utilized Rs. 1306.57 Crore. In the year 2002-03 the programme was rechristened as Accelerated Power Development and Reforms Programme (APDRP) and the assistance was linked to

Distribution Including Village & Household Electrification Working Group on Power for 11th Plan
Page 11 of Chapter 3
reforms. Initially the programme covered 63 distribution circles including 3 circles in Delhi out of the 400 distribution circles in the country. Later the focus has shifted to densely electrified zones i.e. urban and industrial areas. The programme aims at strengthening and up-gradation of the Sub-transmission and Distribution system in the country with the objective of reducing Aggregate Technical and Commercial (AT&C) losses, improving quality of supply of power, increasing revenue collection and improving consumer satisfaction. The strategy envisages technical, commercial, financial and IT intervention, organization and restructuring measures and incentive mechanism for reducing T&D and cash loss reduction. 3.5.2 The expected benefits from the programme are as follows: i) Reduction of AT&C losses from the existing around 60% to around 15% in five
years to begin with in the urban areas and high density/ consumption areas. ii) Significant improvement in revenue realization by reduction of commercial
losses leading to realization of an additional Rs.20, 000 Crore approximately over a period of 4-5 years.
iii) Reduction of technical losses would result in additional energy equivalent to nearly 6,000 – 7,000 MW to the system, avoiding the need of 9,000 to 11,000 MW of fresh capacity addition besides avoiding investments to the tune of Rs.40,000 to Rs.60,000 Crore;
iv) Quality of supply and reliable, interruption- free power will encourage usage of energy efficient equipments / appliances, which will further lead to improvement in availability of energy.
v) Reduction in cash losses on a permanent basis to the tune of Rs.15, 000 Crore. vi) Distribution reform as envisaged above will help States to avoid heavy
subsidies, which are given to SEBs / State Utilities by State Governments. 3.5.3 Financial Progress The total fund planned under APDRP in the 10th Plan is around Rs. 40,000 crores with investment component estimated to be around Rs 20,000 Crores and incentive for cash loss reduction at Rs.20, 000 crores.. Under investment component 583 projects were sanctioned with cost of Rs.19180.46 Crore against this Rs.6131.70 crores were released. The Counter-Part funds tied up were Rs. 7044.34 Crore and funds drawn were Rs. 4087.04 Crore and Funds utilized were Rs. 9518.13 Crore. Incentive for reduction of cash loss amounting to Rs.1536.64 Crore has been paid to Andhra Pradesh, Gujarat, Haryana, Kerala, Maharashtra, Rajasthan, West Bengal and Punjab for showing cash loss reduction of Rs. 3446.60 crore.

Distribution Including Village & Household Electrification Working Group on Power for 11th Plan
Page 12 of Chapter 3
Table 3.2 Allocation of Funds Under APDP
(Rs. in Crore)
Year BE RE Actual Expenditure Investment – 1755.52 Incentive – 379.28
2002-03 3500.00 1089.00
Total - 2134.80
Investment – 2356.51 Incentive – 503.30
2003-04 3500.00 3300.00
Total – 2859.81 Investment- 1428.73 Incentive – 73.00
2004-05 3500.00 1700.00
Total – 1501.73 Investment – 331.56 Incentive – 515.78
2005-06 1172.00 (Grant only)
-
Total – 847.34 The details of the cash loss reduction and incentives released to various states under APDP are given in Table 3.3 (As on 31st March 2006) :
Table 3.3
Cash Loss Reduction & Incentives REleased (Rs. in Crore)
Sl. No.
State Year Cash loss reduction
Incentive released
2001-02 472.74 236.37 1 Gujarat 2002-03 296.16 148.08
2 Maharashtra 2001-02 275.78 137.89
3 Haryana 2001-02 210.98 105.49 4 Rajasthan 2001-02 275.78 137.71
5 Andhra Pradesh
2002-03 530.22 265.11
2002-03 146 73 6 West Bengal 2003-04 605.52 302.76
7 Kerala 2002-03 129.88 64.94 8 Punjab 2003-04 503.88 65.28
Total 3446.6 1536.64 3.6 ACHIEVEMENTS UNDER APDRP 3.6.1 Reduction in AT&C losses: The AT&C losses which were about 36.81% in the year 2001-02 have reduced to 33.82 % in the year 2004-05. Power Utilities in the states of Andhra Pradesh, Arunachal Pradesh, Delhi, Goa, Haryana, Himachal Pradesh, Karnataka,

Distribution Including Village & Household Electrification Working Group on Power for 11th Plan
Page 13 of Chapter 3
Maharashtra, Mizoram, Nagaland, Orissa, Punjab, Sikkim, Tripura, Uttar Pradesh and West Bengal have shown reduction in their AT&C loss. 313 towns covered under APDRP have shown reduction in the AT&C loss. 212 APDRP towns have brought down AT&C losses below 20 percent. 169 towns have shown loss below 15% and 38 towns have achieved AT&C loss between 15 & 20% (AP-96, TN-36, Karnataka-31, Punjab-11, Gujarat-11, Chattisgarh-2, HP-6, Maharashtra-8, Kerala-4, Rajasthan-3, Goa-1, Tripura-1). The overall commercial loss (without subsidy) of the utilities reduced from Rs. 29,331 Crore during 2001-02 to Rs. 19,722 Crore during 2003-04. However, the same increased to Rs. 22,126 Crore during 2004-05. Cash loss reduction of Rs.3447 crores was achieved by states of AP, Gujarat, Kerala, Maharashtra, Punjab, Rajasthan and West Bengal. The states which are still incurring high losses are Assam, Bihar, Haryana, Jharkhand, J&K, Karnataka, Punjab, Rajasthan, Tamilnadu and Uttar Pradesh. 3.6.2 Progress of Metering (a) 11 kV feeders metering: At national level 96% feeders have been metered as of now, as against 81% metered during 2001-02. 100% feeder metering has been achieved in 18 states namely in Assam, Delhi, Goa, Gujarat, Haryana, Karnataka, Kerala, Madhya Pradesh, Maharashtra, Meghalaya, Punjab, Rajasthan, Sikkim, Tamilnadu, Tripura, Uttar Pradesh, Uttaranchal & West Bengal. Union Territories of Chandigarh, Daman & Diu and Pondicherry have also achieved 100% feeder metering. (b) Distribution Transformer Metering: The distribution transformer metering is a prerequisite for carrying out energy audits and identifies the high loss area in the LT system. The overall DT metering in the country is still low in most of the states. The maximum extent of DTR metering is around 25% for the states of Karnataka and Maharashtra. (c) Consumer metering: During 2001-02 the consumer metering was at 78%. It has now increased to 92% during 2005-06, 100% consumer metering has been achieved in the states of Delhi, Himachal Pradesh and Kerala. Union Territories of Chandigarh and Daman & Diu have also completed 100% consumer metering. Andhra Pradesh, Assam, Goa, Gujarat, Haryana, Mizoram, Rajasthan, Sikkim, Uttar Pradesh, West Bengal and Pondicherry have achieved more than 90%. Majority of the un-metered consumers belong to agriculture and flat rate categories. 3.6.3 Control of theft and pilferage Anti theft provisions were introduced in Electricity Act 2003. 13 states have set up special courts and five states have set up special police stations to deal with theft. AP, Assam, Delhi, Gujarat, HP, Karnataka, MP, Maharashtra, Orissa, Rajasthan, UP, Utrtaranchal, WB have set up special courts. Gujarat, Karnataka, Orissa, Rajasthan,

Distribution Including Village & Household Electrification Working Group on Power for 11th Plan
Page 14 of Chapter 3
WB have set up special police stations. Around 12 lakh cases were detected, and in about 10,000 cases conviction and about Rs.600 crores were realized. 3.6.4 Other initiatives and improvements • 24 states have constituted Electricity Regulatory Commission and 20 have
also issued tariff order (AP, Assam, Chhattisgarh, Delhi, Gujarat, Haryana, HP, Jharkhand, Karnataka, Kerala, MP, Maharashtra, Orissa, Punjab, Rajasthan, TN, Tripura, UP, Uttaranchal, WB).
• 13 states have unbundled, restructured and corporatized SEBs (AP, Assam, Delhi, Gujarat, Haryana, Karnataka, MP, Maharashtra, Orissa, Rajasthan, Tripura, UP, Uttaranchal).
• Computerized billing was introduced in most of the states; Spot billing machines for issuing bill at the time of meter reading were introduced in several states (AP, Assam, Bihar, Delhi, Goa, Gujarat, Haryana, HP, Karnataka, Kerala, Maharashtra, Orissa, Punjab, TN, UP, Uttaranchal).
• Customer information about metering billing and collection on websites introduced in AP, Delhi, Maharashtra, Karnataka, Tamil Nadu.
• Customer care centres opened in several states (AP, Assam, Delhi, Goa, Gujarat, Haryana, HP, Jharkhand, Karnataka, Kerala, Maharashtra, MP, Orissa, Punjab, Rajasthan, TN, Tripura, Uttaranchal, UP, WB).
• A number of Distribution utilities mobile repair vans have been launched in AP and Delhi.
• In number of states headquarters, SCADA has been introduced (Hyderabad in AP, NDPL in Delhi, Vadodara in Gujarat, BEST & REL in Maharashtra, Chennai in TN, Jaipur in Rajasthan, Trivandrum in Kerala).
• Introduction of consumer index linking along with geographical information system has started in some of the states.
• Local communities like self help groups, gram vidyut pratinidhi, franchisees, and local entrepreneurs are involved in distribution of electricity.
3.6.5 Capacity Building Capacity building of utilities personnel at all levels has been taken up to train them in latest technologies and methods of operation and maintenance, project formulation, project management etc. PMI (NTPC) & NPTI have trained more than 1800 personnel from various utilities. Training of around 25,000 utility personnel has been taken up under Distribution Reform Up-grade Management (DRUM) in association with USAID. The training themes include AT&C loss reduction, O&M practices, demand side management, Safety aspects, performance benchmarking, quality management, financial management, project development etc. An MBA course for the distribution managers was introduced under the DRUM training programme at MDI, Gurgaon. 3.6.6 Addition to sub-transmission and distribution network during 10th Plan The extent of Sub transmission and Distribution systems at the beginning of 10th plan on an all India basis was 5769739 km of lines and 176026 MVA of distribution transformer capacity. This has increased to 6570823 Km of 33 kV, 11 kV and LT lines and 236070 MVA of Distribution transformation capacity by 31st March 2005.

Distribution Including Village & Household Electrification Working Group on Power for 11th Plan
Page 15 of Chapter 3
This is an increase of 801084 Km of lines and 60044 MVA Distribution transformer capacities. It will further increase by the end of 10th plan with completion of ongoing schemes. The addition envisaged by the Working Group on 10th Plan was 828863 km of 33 KV, 11 kV and LT lines and 65505MVA of Distribution transformer capacity. 3.6.7 Independent evaluation of APDRP Schemes
The Ministry of Power got the evaluation of APDRP carried out through independent agencies namely TERI (The Energy Resource Institute), SBI Capitals, Tata Consultancy Services, Indian Institute of Management Ahmedabad (IIMA) and ASCI (Administrative Staff College of India), Hyderabad to assess the benefits accrued from APDRP projects vis a vis- expected benefits from the APDRP programme. In the first phase, evaluation has been carried out for 66 projects, where more than 50% work has been completed. The evaluating agencies suggested that information technology should be used effectively to enhance the benefits, funds should be released directly to the Utility / SEB concerned, to cut down approval & disbursement time, funding from the Govt. must be linked to achievement of specific benchmark parameters, rather than based on the incurred expenditure, project plan with time schedule for different activities should be pre-defined at DPR stage only, project implementation should be done on turnkey basis and measures for increasing accountability and measuring performance should be the main focus areas for attaining commercial turnaround. In accordance with the above recommendation emphasis is given to GIS based consumer indexing and distribution transformer based energy auditing for increased accountability, adoption of information technology for efficiency improvement, focused monitoring on key performance parameters, to cover all district headquarters under the programme on priority and establishment of consumer care centers/ Bijlee Seva Kendras. 3.6.8 Task Force on APDRP The ministry of power has constituted a Task Force under the Chairmanship of Shri P. Abraham, Chairman, Maharashtra State Power Generation Co. Ltd comprising of Members from utilities from different zones and other eminent persons with the following terms of reference:
i) To assess the current efforts under APDRP;
ii) Analyze the current reforms initiatives that are being pursued by the states with reference to the objectives of APDRP;
iii) To assess the need for modifications in the light of independent
evaluations and other feed back;
iv) Suggest measures to achieve the objectives of APDRP

Distribution Including Village & Household Electrification Working Group on Power for 11th Plan
Page 16 of Chapter 3
3.6.9 The observations of Task Force The Task Force observed that some of the utilities adopted feeder approach to make field officers accountable and measuring their performance achieved very good results in the form of improvement in all the key performance indicators. The monitoring of achievements has improved expenditure in many utilities. The Task Force observed that increase in commercial loss of utilities has not only been arrested but there is downward trend at the national level. Though reduction in AT&C losses and DT failure rate has been reported in most of the towns where APDRP work has been considerably completed the significant reduction was only in few states. In the feeders where augmentation has been done and the energy accounting has started outages have reduced and significant improvement has been achieved in respect of AT&C losses and DT failure rate. The Task Force observed that AT&C losses of 5.06% was reduced at national level during 3 years i.e. 1.68% reduction per year as against a target of 9% per year and this achievement can not be considered as small, as actual implementation after the programme started quite late. The Task Force observed that improvement in billing and collection efficiency has taken place in most of the utilities. The Task Force felt that APDRP is still at initial stage and the full benefits of the programme can not be expected at this stage. The assessment of benefits from the programme should be made after covering all the district headquarters at least and when sufficient work has been completed.
3.6.10 Summary of Recommendations of the Task Force The recommendations of the Task Force are: a. ARPDP to be continued in XI th plan with focus on auditing and accounting
and reducing AT&C losses in major town and cities It interventions, technological up gradation, control of theft and pilferage, GIS and consumer indexing and establishment of Bijlee Sewa Kendra.
b. The conditions for availing assistance under the programme may be made more stringent with an objective to make States/Utilities to adopt reforms. The primary conditions as mentioned in the report will have to be fulfilled by the states for becoming eligible for the APDRP. The states will also have to commit achievement targets for secondary conditions as approved by the Ministry, which will be based on the present performance level of the Utilities.
c. The APDRP assistance, both investment and incentive component, may be extended to the Private Distribution Utilities also. The incentive for loss reduction by the private utilities may be given to the State instead of the utility.
d. The Task Force recommends following targets for reduction in AT&C losses by the Utilities: i) Utilities having AT&C losses above 40%: Reduction by 4% per year; ii) Utilities having AT&C losses between 30 & 40%: Reduction by 3% per
year; iii) Utilities having AT&C losses between 20 & 30%: Reduction by 2% per
year; iv) Utilities having AT&C losses below 20%: Reduction by 1% per year.
Distribution Including Village & Household Electrification Working Group on Power for 11th Plan
Page 17 of Chapter 3
e. The projects taken up under the programme should be aimed at reducing AT&C losses, improvement in quality and reliability of power and improvement in consumer services.
f. Utilities should prepare a roadmap with priorities for works to be taken up under the investment component and execute the work by adopting best practices.
g. Each Distribution Company may be considered for calculation of incentive against cash loss reduction. Ministry may devise additional methods also for incentivizing Utility and Utility employees for improvement in performance.
h. Under the investment component of the programme, the grant may be increased to 50% of the project cost for the general category states.
i. In order to keep the focus of the states and Utilities towards reforms and the improvement in the sector, Government should commit sufficient non-lapsable fund for the programme.
j. The programme may be converted into a Central scheme for speedy implementation.
k. The assistance under the programme should focus mainly on such activities, which will help in quick reduction of AT&C loss and improvement in customer services,
l. The programme should have a provision of 5% for training the Utility personnel, hiring consultants, undertaking studies, project evaluation etc.
m. The DPRs for the new projects should be made more realistic. The tender documents and specifications should be standardized by the AcCs in consultation with the Utilities. It should contain a quality plan and also provisions for price variations during execution. A variation of plus or minus 10% to 15% may be allowed in quantity or value of items within overall sanctioned cost of the scheme.
n. Execution of all the schemes should be on turnkey system only by adopting standard specifications, except in cases where approval of the Ministry is taken in advance.
o. Utilities, AcCs and Ministry of Power should closely monitor the implementation of APDRP projects and progress of the Utilities towards achievement of the set targets.
3.7 DISTRIBUTION OF POWER IN RURAL AREAS - INITIATIVES IN 10th PLAN During the first four years of the 10th Plan, the PFC has sanctioned financial assistance of Rs. 8383.83 crore to various States under various schemes for rural electrification. A number of initiatives were taken during the X plan period, successively for household and village electrification viz
(i) Kutir Jyoti Yojana, 2002-04, (ii) Pradhan Mantri Gramin Yojana 2002-05, (iii) Minimum Needs Programme 2002-04, (iv) Accelerated Rural Electrification Programme 2003-04,

Distribution Including Village & Household Electrification Working Group on Power for 11th Plan
Page 18 of Chapter 3
(v) Accelerated Electrification of One Lakh Village and One Crore Households 2004-2005.
(vi) Rajiv Gandhi Grameen Vidyutikaran Yojna was launched from April 2005 and all the above mentioned schemes were merged in it.
Definition of Village Electrification At the advent of this scheme, the definition of village electrification was changed. A brief history of these definitions of village electrification is as follows: Prior to October 1997 A village should be classified as electrified if electricity is being used within its revenue area for any purpose whatsoever. In 1997, the definition of village electrification was modified to provide for the use of electricity to village habitations. Accordingly, the new definition said: After October 1997 A village will be deemed to be electrified if the electricity is used in the inhabited locality, within the revenue boundary of the village, for any purpose whatsoever.
In Feb. 2004, the definition was made even more encompassing as also target specific. New Definition (2004-05) A village would be declared as electrified if:
(i) Basic infrastructure such as distribution transformer and distribution lines are provided in the inhabited locality as well as the dalit basti/hamlet where it exists. (For electrification through Non-Conventional Energy Sources a distribution transformer may not be necessary)
(ii) Electricity is provided to public places like schools, panchayat offices, health centres, dispensaries, community centres etc. and
(iii) The number of households electrified should be at least 10% of the total number of households in the village.
With each change of definition, the number of electrified and unelectrified villages was set to change. 3.7.1 Progress of rural electrification during X Plan Out of a total of 593732 inhabited villages as per 2001 Census in the country, 439165 villages have been electrified by February 2006. Similarly, against the potential of 196 Lakhs irrigation electric pumpsets, 148 lakhs pumpsets have been electrified as on 31.03.2006.
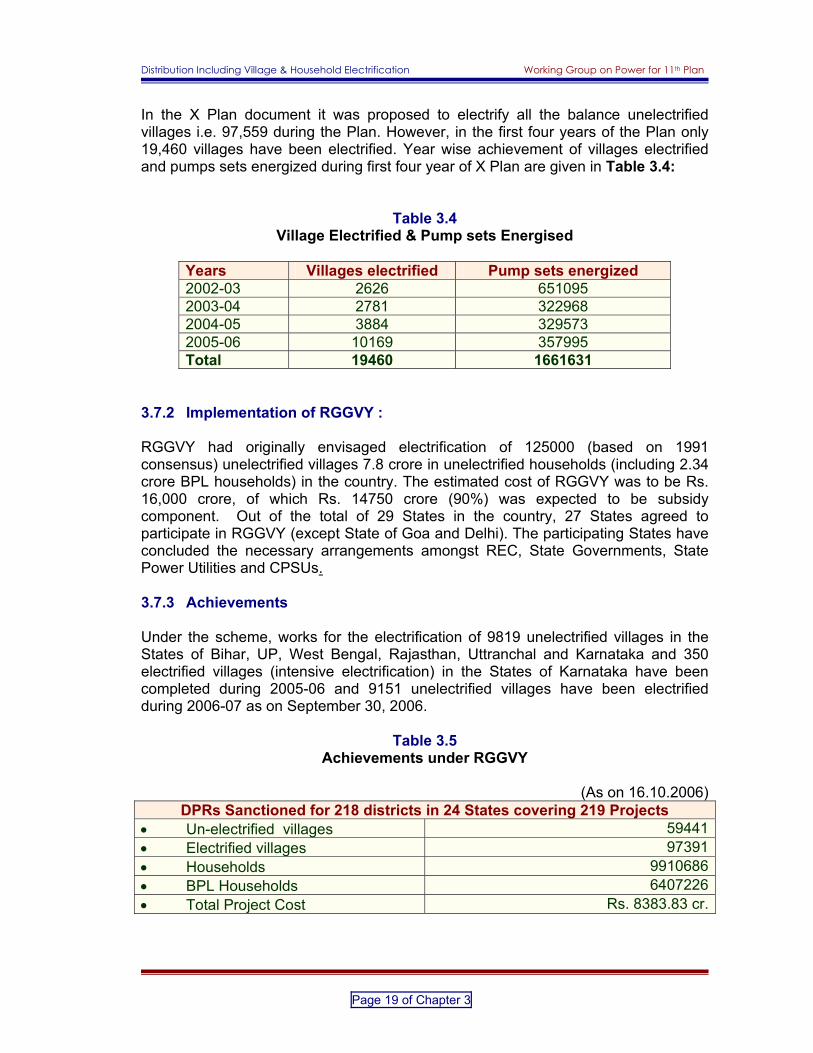
Distribution Including Village & Household Electrification Working Group on Power for 11th Plan
Page 19 of Chapter 3
In the X Plan document it was proposed to electrify all the balance unelectrified villages i.e. 97,559 during the Plan. However, in the first four years of the Plan only 19,460 villages have been electrified. Year wise achievement of villages electrified and pumps sets energized during first four year of X Plan are given in Table 3.4:
Table 3.4 Village Electrified & Pump sets Energised
Years Villages electrified Pump sets energized 2002-03 2626 651095 2003-04 2781 322968 2004-05 3884 329573 2005-06 10169 357995 Total 19460 1661631
3.7.2 Implementation of RGGVY : RGGVY had originally envisaged electrification of 125000 (based on 1991 consensus) unelectrified villages 7.8 crore in unelectrified households (including 2.34 crore BPL households) in the country. The estimated cost of RGGVY was to be Rs. 16,000 crore, of which Rs. 14750 crore (90%) was expected to be subsidy component. Out of the total of 29 States in the country, 27 States agreed to participate in RGGVY (except State of Goa and Delhi). The participating States have concluded the necessary arrangements amongst REC, State Governments, State Power Utilities and CPSUs. 3.7.3 Achievements Under the scheme, works for the electrification of 9819 unelectrified villages in the States of Bihar, UP, West Bengal, Rajasthan, Uttranchal and Karnataka and 350 electrified villages (intensive electrification) in the States of Karnataka have been completed during 2005-06 and 9151 unelectrified villages have been electrified during 2006-07 as on September 30, 2006.
Table 3.5
Achievements under RGGVY
(As on 16.10.2006) DPRs Sanctioned for 218 districts in 24 States covering 219 Projects
• Un-electrified villages 59441• Electrified villages 97391• Households 9910686• BPL Households 6407226• Total Project Cost Rs. 8383.83 cr.

Distribution Including Village & Household Electrification Working Group on Power for 11th Plan
Page 20 of Chapter 3
Quantum of major works covered under sanctioned projects
• New 33/11 kV Sub-stations 352• Aug. of existing 33/11 kV S/Stns. 527• New 33 kV Lines (km) 6171• New 11 kV Lines (km) 209735• New Distribution Transformers 243896• New LT Lines 87725.13• Metered Connections (BPL HH) 6407235
Turnkey contracts awarded
• Un-electrified Villages 50706• Electrified villages 47279• Households 4978683• Total Project Cost Rs. 5248.13 cr.• Total Awarded Cost Rs. 7283.80 cr. 3.7.4 Need for continuation of RGGVY RGGVY has truly become the engine of rural electrification programme in all States of India., DPRs from all States are going to be available by 2007. Works have been started in 153 districts. RGGVY should be continued in the XI plan to achieve the objective of ‘Power to all by 2012 3.8 DEVELOPMENT OF REVENUE SUSTAINABILITY - FRANCHISEES RGGVY scheme envisages management of rural distribution through franchisees who could be NGOs, User Associations, and individual entrepreneurs, cooperatives or Panchayats. As per the Electricity Act, a Franchisee means a person authorized by a distribution licensee to distribute electricity on its behalf in a particular area within its area of supply. Deployment of input based Franchisees is a requirement under RGGVY scheme to receive funds under the scheme. Fifteen State Governments have taken action for deployment of franchisees. About thirty eight thousand villages are covered under franchisee arrangement till October 2006. The majority of these franchisees are in Karnataka, West Bengal, Assam, Uttaranchal, Uttar Pradesh, and Nagaland. Other states including Bihar, Rajasthan, Chhattisgarh, Haryana etc. are at various stages of deployment of Franchisees. Uttar Pradesh has engaged consultants for 6 pilot projects and 15 transaction projects to develop Input Based Franchisees. These franchisees are mostly revenue based where the activities are limited to meter reading, billing, bill distribution, revenue collection, attending to complaints, maintenance of records, minor repairs etc. The states have committed to convert revenue based franchisees to input based franchisee.

Distribution Including Village & Household Electrification Working Group on Power for 11th Plan
Page 21 of Chapter 3
3.8.1 Franchisee Experience in the states
The institutional design and structure of Franchisee models vary from state to state. In Nagaland, the traditional structure of Village Council has been used to form a sub-committee called Village Electricity Management Board (VEMB) to function as a Franchisee. Electricity is billed to VEMB on Single Point Metering (SPM) basis. The objective of SPM is to reduce Technical and Commercial losses and to involve village community to work as business partner with Power Department. The VEMB gets 20% financial benefit on the every unit of energy they sold. The tariff fixed by Govt. for VEMB is Rs. 1.60 per unit and VEMB in turn sell @ Rs. 2.00 per unit to village consumers. To get full financial benefit VEMB has to ensure that whatever is the energy supplied through SPM is billed from consumers in the village, this has resulted in reduction of theft and other commercial losses in the supply area of VEMB. At present VEMBs are in place in 452 villages.
In Karnataka, Gram Panchayats have been involved to identify Grameen Vidyut
Pratinidhi (GVP) to function as Franchisee. The GVP is a local unemployed youth from the same Panchayat. They are working as revenue franchisee and there is a provision of commission on amount realized above baseline targets apart from retainer ship fee for achieving the baseline targets. At present 3425 GVPs are already working in 5605 Panchayats falling under all the five ESCOMs covering 17125 villages.
In Assam, the utility initiated the Single Point Supply Scheme (SPSS) and
appointed input based franchisees and collection franchisees at distribution transformers. The Single Point Power Supply (SPPS) through franchisee was first introduced in Digboi division in upper Assam and looking to the success of the programme it was extended in the entire State. Initially 22 villages with distribution transformers ranging from 16 KVA to 100 KVA were taken-up for the programme where 80% of the connected load is in domestic category, now the programme is in place for 816 villages and efforts are being made to engage franchisees for another 816 villages. The franchisee can be NGO, user’s association, a village body or an individual. The mechanism of payment to franchisee is very simple 10% distribution losses and 15% commission is allowed.
In West Bengal and Uttaranchal, women Self-Help Groups (SHGs) have been
engaged to function as Franchisee. These are at present revenue franchisees. The franchisee and people working with franchisee are mostly resident of the same locality. In Uttaranchal 5321 villages are under franchisee arrangement and in West Bengal this number has reached to 1169 villages.
Deployment of franchisee is in progress in other states like Uttar Pradesh, Bihar,
Haryana, Rajasthan, Madhya Pradesh etc.

Distribution Including Village & Household Electrification Working Group on Power for 11th Plan
Page 22 of Chapter 3
3.8.2 Impact of Franchisees While there is a variation in the institutional design of Franchisees across the states, most of the operational Franchisees at present are either Collection Franchisee or Input Based Franchisees. Since the formation of the Franchisees in the states, no systematic evaluation has been undertaken to assess the impact of these on improvement in management of rural electrification. It is therefore critical to undertake an Independent Verification and Evaluation study. However, there has been to some extent documentation of the experiences and internal review of the Franchisee experience in the state these are summarized below: (i) Improvement in Collection Efficiency – Experience from all the states shows that the collection efficiency in these states where Franchisee either as Collection or as IBF has been implemented has improved. (ii) Improvement in customer services – Customer services in the rural areas have improved since the formation of Franchisees. The improvements pertain to billing and collection and services of minor repair and maintenance. Since the franchisee and the people working with the Franchisee are mostly residents of the same locality, there is saving in time and money for the customer. (iii) Employment Generation – Deployment of Franchisees has also resulted in employment generation in the local areas. The key lessons identified from Franchisee experience which are important for developing future course of replication and up-scaling Franchisee implementation in the states are: (i) Simple Arrangement Works - One of the key reason for rapid expansion in implementation of SPSS scheme in Assam was ease of implementation arrangement, it was easy to understand (the calculation of commission, standardized loss levels) and standardized across franchisees. The simplicity of the arrangement made it easier for the Franchisees to comprehend that irrespective of the distribution transformer they adopt, the allowed loss would be 10% and the commission would be 15%. This helped in quick implementation. (ii) Pre-implementation Financial viability of Franchisee Essential - There is a need for pre-project studies to evaluate the financial viability of the franchisee. Review of the Franchisees in Assam shows that there are disputes on "Permissible Loss Levels" and some of the franchisees have started surrendering their areas. The key reason for the dispute in loss levels is that, initially when they signed the agreement, only a few were involved in any kind of activity related to the electricity business. It is only after taking over of the transformers that the Franchisees realized the actual condition of the distribution system. Also some of the franchisees have reportedly suffered losses due to following reasons:
The franchisees that are not technically sound, find it difficult to identify issues such as meter bypass and unauthorized hooking.

Distribution Including Village & Household Electrification Working Group on Power for 11th Plan
Page 23 of Chapter 3
In few Franchisee areas, Franchisees are not powerful enough to take action against those whom they know are getting unauthorized power. Similar lessons have also been drawn from review of GVPs in Karnataka.
(iii) Franchisee Management Information System (FMIS) is required - Development of a FMIS to track franchisee performance, learn from experience, their adherence to contractual requirements and to take early corrective actions is required. None of the states which have set-up Franchisees have such MIS system. A similar FMIS is also required to be developed for REC to monitor the performance of Franchisees across the country. (iv) Up scaling from Collection Franchisee to Input Based Franchisee (IBF) necessary – Review of Franchisee implementation by most of the states show that they have opted for Collection Franchisee. While the choice of Franchisee model is left open, it has been emphasized that eventually the most effective model would be an IBF model. 3.8.3 Capacity Building of franchisee REC has circulated guidelines for formulating the franchisee system and has prepared a comprehensive document on the possible franchisee models, field experience shows that in the absence of any formal training, existing franchisees are facing technical and managerial problems during actual operation. Apart from the technical aspects of electricity distribution, it is imperative for prospective franchisees to understand the business opportunities in the system, its management and keep it profitable. In order to ensure that the franchisee model is sustainable in the long run, it becomes critical to build capacities of these franchisees. A national programme for training and capacity building targeted at enhancing the skill set of existing and potential franchisees and trainers to enable them to play a proactive role in improving rural electricity access in the country may, therefore, be launched during XI plan period. Capacity building should go in tandem with electrification of villages so that adequate numbers of trained people are available to take up franchisees in the newly electrified and other electrified villages. Capacity building should precede awareness campaign to educate people about franchisee system for management of rural distribution and its potential. 3.9 ROLE OF PANCHAYATI RAJ IN FRANCHISEE DEVELOPMENT The Franchisee Guidelines issued by REC envisage that the Panchayati Raj Institutions (PRIs) would have a supervisory / advisory role in management of rural distribution through franchisees. The state Government could also encourage the Panchayati Raj Institutions to take on responsibility of franchisee as and when such institutions have developed to the extent that they can undertake contractual obligations, raise resources from market and can discharge associated legal responsibilities. PRIs may also be closely associated with the franchisee arrangement as link between the franchisee and the villagers / consumers as well as concerned state authorities. As the PRIs are going to play the key role in development of franchisees for management of rural distribution, participation of Ministry of Panchayati Raj in

Distribution Including Village & Household Electrification Working Group on Power for 11th Plan
Page 24 of Chapter 3
capacity building at all levels is imperative. Keeping this in view, the committee recommends that:
The Ministry of Power in collaboration with Ministry of Panchayati Raj may formulate an integrated capacity building plan including franchisee development with the scope of wide application across the country to meet the national goal consistent with the RGGVY scheme.
The capacity building plan may include all aspects of energy/power sector
covering primary education on electricity / energy, energy efficiency, repair and maintenance of rural electricity infrastructure, metering arrangement, social engineering, legal and regulatory aspects, MIS for effective monitoring & control, commercial operations of utility viz. meter reading, billing, revenue collection, book keeping, disconnections, theft control etc.
For taking up the programme at the country level, establishment of institutions
in each state with regional headquarters and branches at district level may be considered. For 11th Plan, target should for creation of such institutions in at least 20 states in different regions and 115 district centers in collaboration with Ministry of Panchayati Raj and Ministry of Rural Development.
For kick start, established institutions in the area of providing technical
education like ITI, Polytechnic etc. at regional level may also be involved. In association with established institutions, Certificate courses on such subjects may also be formulated so as to provide this education on continual basis.
Appointment of a specialized agency / consultant like TERI, Productivity
Council, CBIP, PWC, E & Y, etc. for preparation of course modules / training capsules on above mentioned aspects with proper documentation of course material may also be considered. Special attention may be paid to the desired operational skills for franchisee. The course material should be more illustrative, inter-active and computer friendly. These materials should be available for use in any part of the country. A comparative analysis of the various franchisees in different states be included in the course module.
Initially, the core groups at state level may be trained as ‘trainers’ through a
specialized agency / consultant which in turn may provide training to trainees in identified institutes in various states / districts.
Association of power utilities should also be encouraged to make this
programme a success and necessary training should also be provided to the field officers/staff of utilities associated with franchisee management for effective implementation of franchisee system.
Once the franchisee is appointed, they may be provided on the job operational
training by the field officers of the utilities

Distribution Including Village & Household Electrification Working Group on Power for 11th Plan
Page 25 of Chapter 3
3.10 POWER DISTRIBUTION IN RURAL AREAS THROUGH DDG 3.10.1 Definition of DDG Decentralized Distributed Generation (DDG) is defined as installation and operation of small modular power generating technologies that can be combined with energy management and storage systems, and used to improve the operations of the electricity delivery systems at or near the end user. These technologies can be utilized for off-grid as well as grid based. DDG programme is relevant for India to cover cent percent village and household electrification in order to meet peak load shortages and to supply quality power at more economical rate on cost to serve basis. For meeting the rural developmental needs various types of DDG schemes are required. Each type of DDG caters to a specific need of an area for which technological solutions may be different and they call for different institutional arrangements and financing policies. 3.10.2 Potential for DDG There is a potential to add 10,000 to 15,000 MW capacity through decentralized distributed generation in 11th and 12th plan. The DDG projects would help both in electrifying the villages and households and also in generating local employment. Approximately 2000 substations can be linked with 2 -5 MW DDG projects, adding a capacity of 4000- 5000 MW during 11th plan. The total cost involved will be Rs. 25000 crore approximately. 3.10.3 Challenges for DDG Projects DDG is yet to be tried on a large scale in rural electrification projects. There are still many barriers—technical, financial, regulatory, and institutional—that need to be addressed adequately. In other words, a clear and well-established framework is required to design, implement, and encourage DDGs as these are expected to be aligned to the following policy/programme guidelines:
- Universal access to electricity in India. - All BPL families to be provided single point free connection. - Revenue sustainability through SEBs /franchisees. - Affordable power to remote areas through cost effective DG projects. - Utilization of locally available, environmentally benign renewable energy - Sources for providing power either to the grid nearer the load or on stand-
alone basis. - Gainful utilization of the infrastructure created under RGGVY. - 24 Hour power supply through reliable quality power. - Facilitate development of rural load at an accelerated pace. - Creation of viable and sustainable franchisee development. - Availability of low cost funds and International acceptance of REC
standards.

Distribution Including Village & Household Electrification Working Group on Power for 11th Plan
Page 26 of Chapter 3
3.11 SHORT TERM STRATEGIES FOR DDG SCHEMES a. Stand Alone
i) These projects to be implemented by MNER/REC through NTPC, IREDA or other agencies by setting up Joint Ventures or by any other agency independently or any other acceptable mode.
ii) The funds available under RGGVY be utilized for the same for village electrification and / or household electrification etc.
iii) All available technologies of bio diesel/ SPV/ biomass/ mini-micro hydel/ micro turbines etc. could be considered to provide affordable power to rural areas.
iv) Involvement of local bodies like panchayat, NGOs, SHG or VECs etc in managing the DDG projects in rural areas.
v) Selection of Rural Electricity Supply providers/ franchisees. vi) Cost of electricity to be based on cost to serve or avoided cost basis and
affordability. vii) Capital Subsidy for DDG projects. viii) Manufacturers of equipment may install and operate the plants for a fixed
duration.
b. Grid Interconnected Central and State level Government Agencies may participate in the equity of the grid-connected projects, along with established Private Agencies to form a Public Private Partnership in setting up various projects in the country. Independent power producers may also set up such projects. The ownership of the DDG Projects will rest with the project promoters/ equity holders. The following method may be adopted for construction: 1. BOT 2. BOOT 3. BOLT At least 100 “Pilot Projects“ in various states of the country should be commissioned during the first 2 years of the 11th plan to give large scale impetus to DDG programme. These “Pilot Projects” should be driven by “Public Private Partnership” programme. DDG project owners should be offered the distribution activity in the vicinity by the leasing of the distribution network to achieve efficiency, cutting losses and adding to project viability All projects be selected from the predetermined areas and offer for PPP on competitive, transparent basis with any or all of attributes:
1. These schemes may range up to 5 MW in order to meet the supplementary power demand in rural and semi- urban areas.
2. Corporate agencies be encouraged to undertake such projects 3. Suitable standardized size packs may be used in order to reduce production
costs.

Distribution Including Village & Household Electrification Working Group on Power for 11th Plan
Page 27 of Chapter 3
4. All available commercialized technologies whether conventional or non-conventional may be utilized.
5. Cost of electricity to be on Cost to Serve/ Delivered Cost or Avoided cost basis for working out viability. Life Cycle Costs Approach can also be considered.
6. Multifuel technologies may be adopted for sustainability. 7. Exemption to be given for income tax, customs and excise duties etc. 8. All concessions extended by states for industrial development also to be
extended for DDG projects. 9. Viability gap funding may be appropriate methodology. 10. Financial Institutions support for energy plantations. Which would meet the
feedstock needs of biomass power/ bio fuels/ bio- diesel plants. For the pilot projects, support also needs to be extended for R&D efforts and preparation of DPRs
3.12 MEDIUM TERM AND LONG TERM STRATEGIES
1. R&D on fuel Cell technology to considerably bring down the costs. 2. R&D on all existing technologies to improve the product quality as well as
efficiency levels of the systems to make them more durable and affordable cost of power.
3. Training of local youth in maintenance of the DDG equipment locally. 4. Improvement in the quality and life of batteries. 5. Biomass cultivation and development of short duration (cycle) high yield
varieties of biomass suitable for bio- methanation / gasification / direct combustion/ bio-fuels production”
3.13 COST TO SERVE/ DELIVERED COST The shortage of electricity leads to larger power cuts in rural areas due to more than double the quantity required to be fed in the grid for a particular delivered quantity and quality of Power in far off rural areas due to heavy transmission, distribution and collection losses. In order to bridge the gap between rural and urban areas, extension of grid through RGGVY is under implementation which only takes care of the infrastructure issues but does not address the issue of quality and quantity of power supply. One of the options in this regard is the supply of electricity through Decentralized Distributed generation method whether off grid or through the grid nearer the load centres. 3.14 ROLE OF STAKEHOLDERS i. State Government • Provide an enabling framework for streamlined implementation and operation of
the DDG scheme. • Publicize and make aware the stakeholders about potential sites/ locations for
implementing the DDG schemes. • Target for and incentivise for taking up the DDG schemes in potential areas
including development of supply providers. Make necessary provisions in the State Budget suitably.
• To provide land on nominal lease.

Distribution Including Village & Household Electrification Working Group on Power for 11th Plan
Page 28 of Chapter 3
• Maintain system of constant checks and controls through local administration with involvement of the beneficiaries for more participative interaction.
ii. State Utility/Discom • Assist the Supply provider during identification and execution of the scheme. • Support the supply provider during the initial operations and ‘stabilization’
period. • Lease/sell the substation infrastructure to DDG operators
iii. Local Administration • Act as trustee of beneficiaries interest w.r.t the investments made, security of
assets, continuity of the system and stakeholders. • Provide for quality of service measures and controls ensuring streamlined
operation of the system without any undue interference. iv. Supply Provider a) Technical • Operation and Maintenance of the main plant and equipment. • Breakdown maintenance and repairs of HT & LT lines. • Maintenance of Transformers and other equipments. • Maintaining the reasonable stock of line and sub-station materials required for
repairs. • Replacement of failed transformers and equipments. • Install meters to all unmetered installations. • Attend to consumer’s complaints and grievances. • Prevent pilferage and thefts of energy • Receive application for new connect ions. • Prepare feasibility report and estimate for new connections. • Sanction estimates for new connections as per norms and approved
policies/procedures. • Prepare estimates and drawings for extension and improvement works to bring
down energy losses to acceptable levels, check theft and energy accounting. • Servicing of new installation with meters. • Execution of improvement works. • Identify inefficient pumpsets and arrange for replacement with efficient
pumpsets by bringing in necessary investments. • Submission of prescribed reports to the Distcom/Government. • Identifying unauthorized installations and take suitable action. • To follow the provisions relating to safety and electricity supply.
b) Revenue • Meter Reading • Billing • Collection

Distribution Including Village & Household Electrification Working Group on Power for 11th Plan
Page 29 of Chapter 3
• Maintenance of records • Submission of monthly accounts and statistics to respective Discom/
Government. • Reply to audit queries. • Use necessary hardware/software for issuing computerized billing and
generating reports. • Collecting government charges/ levies and paying the same to the Government.
c) General • To educate consumers in its jurisdiction on the efficient use of equipments such
as lighting, pump sets etc. for conserving energy.
EDUCATE COMMUNITY ON SAFE USE OF ENERGY 3.15 ROLE OF REC REC may be declared the nodal agency for DDG schemes to provide single window support during project formulation, seeking clearances, appraisal, approval and even ensuring financial closure. It will assist in selection of rural electricity supply provider, training of village youth and vendor development for providing reliable services. Commercially viable projects in DDG sector will be either directly financed by REC or through the route of refinance facility to banks, state Corporations, RRBs, State Cooperative Banks, SIDBI etc REC may also take up nation wide survey of various sources of energy available in the villages & towns in a time bound manner by engaging State/ private agencies in different zones. REC may accordingly select suitable sites, setup pilot projects at its own cost and subsequently transfer them on BOT, BOOT or BOLT basis. REC may also engage itself in Public Private Partnership to setup such projects. REC may suitably engage various consultants and construction agencies 3.16 INSTITUTIONAL AND FINANCIAL MODELS The programme should provide medium and long-term financing to private project developers, non-governmental organizations (NGOs), micro financing institutions (MFIs) and community cooperatives etc. for decentralized distributed electrification schemes. The funds are to be made available to private enterprises, NGOs, MFIs and community cooperatives for projects up to about 5 MW. The different financial models may be based on:
• Capital subsidy/ Viability Gap funding • Revenue subsidy • Bundling of services • Linkages with existing programme
Distribution Including Village & Household Electrification Working Group on Power for 11th Plan
Page 30 of Chapter 3
3.17 SPECIAL FOCUS AREAS FOR 11TH PLAN 3.17.1 Separation of Agriculture Feeders It involves installing a separate feeder to supply to the agricultural load as distinct from the feeder supplying the non-agricultural loads in rural areas. This facilitates proper accounting and removes distortions in loss measurement due to un-metered agricultural loads and load management during peak hours. Andhra Pradesh, Gujarat and Punjab have initiated steps to separate agriculture feeders. The working group recommends that a programme should be launched for separation of feeders in those states where the percentage of agriculture consumption is more than 20% of power. In other states single phasing of rural mixed load feeders may be taken up which involves use of change-over switches at sub-stations. The approach envisages supplying single phase rural lighting load through three nos. of single phase transformers. During the normal operation, the agricultural load continues to be supplied from the three phase transformers. On operation of the changeover switch, there will be no supply to the 3-phase load on the 11 KV distribution network whereas single phase supply is available to the lighting and fan load. On revising changeover switch, normal 3-phase supply shall be restored. Cost and time go in favor of this approach. Integrated energy Policy also recommends bifurcation of agriculture pumping load from the non-pumping load in all rural feeders. It further recommends using of available technological options to limit and measure the amount of agriculture pumping energy provided. There is also an urgent need to improve the efficiency of the pumpsets by way of changing over to high quality BIS certified pumpsets. Farmers have to be educated on the benefits of efficient pumps. They should be provided necessary finance for replacement of pumpsets. 3.17.2 Metering of Agricultural Consumers The system of un-metered supply at flat rates for agricultural consumers is a major stumbling block in the way of accountability and improvement in efficiency of distribution system. This system makes it difficult to have estimates and actual consumption and precise estimate of losses. This effects two sectors, power and water resources. Un-metered supply leads to unrestricted exploitation of the ground water and rapid depletion of the water table. In most of the states it is difficult to segregate rural electricity consumption on the basis of its use in agricultural, commercial, domestic and industrial segment in the absence of appropriate metering system. Although agricultural consumption is the most significant one, reliable data on agricultural consumption is not available. There are 1,44,45,014 pumpsets/tubewells in the country as on 31st March 2005. The average capacity and electricity consumption per pump set was 3.91 KW and 6131 KWh per annum respectively. The electricity consumption during 2004-05 in agriculture sector is third highest being 22.93% of total consumption of electricity in the country. Whatever is not billed in domestic, commercial and industrial categories is often treated as consumption under agriculture. Power theft is hidden under agricultural consumption. Utilities may also deliberately overestimate the un-metered

Distribution Including Village & Household Electrification Working Group on Power for 11th Plan
Page 31 of Chapter 3
agricultural consumption to get higher subsidy from the State Govt. and also project reduction in losses. One study has found that owners of electric tube-wells paying flat rate tariff operated their pumps for 40% – 250% greater hours per year as compared to diesel tube-well owners which proves the fact that flat rate leads to wastage of electricity with adverse impact on the water table. Metering of agricultural consumption allows quantifiable supply to agriculture which is a necessary condition for transparent subsidy mechanism. Though new legal framework provides for compulsory metering of electricity supply, most of the agricultural consumers are supplied un-metered power on flat rate basis (Rupees/HP/Month). Unmetered supply on flat rate basis has adverse implications for accounting and auditing of energy besides inefficient use of power and over exploitation of ground water resources. Section 55 of the Electricity Act provide that “No licensee shall supply electricity, after the expiry of two years from the appointed date, except through installation of a correct meter in accordance with regulations to be made in this behalf by the Authority: Provided further that the State Commission may, by notification extend the said period of two years for a class or classes of persons or for such area as may be specified in that notification.” Despite all these provisions, power supply to agriculture continues to be un-metered on flat rate basis in most of the states. Besides, resistance for installation of meters, the cost and practical difficulties in regular billing and collection are the stated reasons for not providing meters for agricultural consumers. In this context there is a need for alternative approaches for metering agricultural consumers. It also requires full support from the Government/ Political establishments. The working group recommends that power supply for agricultural purposes should be hundred percent metered in phased manner to remove distortion in the data regarding consumption, losses, and subsidies. 3.17.3 Conversion to HVDS System Over the years, large scale expansion of urban system and rural electrification program in the country, has resulted in considerable expansion of Low Tension distribution network. To meet the increasing demand due to load growth, size of the DTR’s has been constantly increasing. As a result the lengthy of LT lines/circuits is also increasing resulting in high load losses in LT lines, excessive voltage drops and frequent faults on LT network and higher rate of failure of distribution transformers. It is estimated that for the same power demand or load , the current in LT system is 28 times in the 11 KV system. Thus, with switchover to 11 KV systems, load losses are scaled down 800 times and voltage drops are reduced to a negligible level. High Voltage Distribution System (HVDS) envisages running 11 KV lines right up to the loads and setting up small sized distribution transformers and extend supply with least LT lines. Many states are introducing HVDS system. The benefits of HVDS system are, theft control, sharp reduction in system losses, effective utilization of transformer capacity as it would free the transformation capacity from feeding the

Distribution Including Village & Household Electrification Working Group on Power for 11th Plan
Page 32 of Chapter 3
power losses in the downstream LT lines, reduction in voltage drops, reduction in failure rate of DTR due to large transformers, long lines and weak load monitoring. Reduction in DTR failure rate results in enormous savings in cost and time for repairs, replacement and outages. Since HVDS caters to 5-6 consumers it gives a sense of ownership to the consumers and the system is well secured. Several studies revealed that distribution losses can be brought down considerably by this system. Though, large scale implementation of HVDS would entail huge investment, the benefits from it are huge, immediate and sustainable and they offset the investment burden given the high level of losses and the potential of HVDS to reduce losses. This system is best suited to meet the problems associated with scattered loads and to effectively deal with theft of energy by hooking directly from LT lines which is very common in rural and urban areas. Already states of AP, Delhi, Gujarat, Maharashtra, UP, WB and Karnataka are implementing HVDS. The 11th plan should focus on switching over to HVDS system through a suitable investment strategy in a phased manner in order to bring down the HT: LT ratio to 1: 1 from the present estimate level of 1:2.5. Attempts should be made to avail CDM benefits from the scheme. 3.17.4 Priority to IT Applications There is a need for widespread application of IT in the power sector with a focus on distribution. Ministry of Power has set up IT Task Force with a view to use IT as a strategy to improve commercial and operational performance of distribution and for its effective implementation. Today, a number of utilities are using IT applications to improve their commercial and operational performance. However, adoption of IT as a tool for automation and efficiency improvement is sporadic and lacks focus. There is a wide variation in the states in application of IT tools. The Task Force recommended creation of comprehensive IT blue print for the Indian power sector that incorporate the global best practices. The task force suggested a 3-5 years IT implementation road map with both short term and long term IT initiatives. In short term, priority should be use of IT in commercial process and in improving the quality of supply in selected areas. The long term area should cover the business process. Asset and work management, outage management and distribution automotive should be implemented in parallel. Material management and support process such as human resource, finance, accounts, should be IT enabled in the phase. The task force also felt that SEBs should also have an effective management information system for decision, support, improved decision making. The committee suggested that implementation should be done by accredited agencies. No concerted effort has been made to implement the recommendations of the Task Force. The Task Force recommendation should be implemented in the 11th Plan. The electricity Act, 2003 ,National Electricity Policy and Tariff policy envisage development of Open Access, ABT and Energy Accounting at the state level. These involve emergence of new market mechanisms having complex commercial arrangements. IT application will facilitate implementation of such complex commercial arrangements. Therefore priority should be given to set up IT infrastructure at various levels in the distribution business in the 11th Plan. The blue print for IT of the utilities should take into account the future market structure, the
Distribution Including Village & Household Electrification Working Group on Power for 11th Plan
Page 33 of Chapter 3
operational requirement and have IT as a key component of business strategies in the long term business plans. There is need for complete mapping of IT usage in the Distribution Segment of the country. The working group recommends that a comprehensive IT blue print should be prepared and the focus should be on integrated approach to get the best results from the IT applications. Under APDRP, utilities should spend the incentive grant on cost effective IT related solutions in the distribution sector. The states/ utilities that have made significant advance in IT applications should move towards complete integration of various sub-systems and for adopting the best international practices. Implementation of IT based billing and collection systems should be introduced to obtain immediate results in commercial loss reduction. A comprehensive Business Process Re-engineering (BPR) of all commercial processes needs to be done to ensure tapping of all revenue leakages and systematic implementation of IT based tools. Many states have employed these tools and gained significant improvements. From customer point of view, customer information is very important which usually includes billing and accounting functions. Priority should be given to improve customer care through IT solutions. Andhra Pradesh has set up 336 customer service centres which handle services such as new service connection, additional loads, name change, category change, line shift, DTR shift, billing complaints, meter problems, broken poles etc. The cost of one CSC to serve 2 lakh customers is 15 lakh one time and Rs.84,000 recurring cost per month. The working group recommends all utilities should set up customer service centres in all the towns on priority. The total urban population of the country as per 2001 census is 28.37 crores. If we assume that household has five persons, there are 5.67 crore urban households. To cover entire urban population with customer service centres on the lines of Andhra Pradesh, the cost would be around Rs. 42 crores. 3.17.5 Consumer Indexing and GIS Based Database Geospatial database developed through GIS based Consumer Indexing and asset codification integrated with business processes of utility provides the utility a wherewithal to reengineer business process for transparent and quick decision making process. It helps in addressing metering and billing issues, new connection release, fuse off call etc. under the aegis of customer care centre. Surveyed and validated Feeder overlaid on satellite imagery with landmarks would enable preparation of correct estimated works and consequently faster implementation without contractual litigations. Many utilities have used GIS for improvement in performance. What is required is integrated solutions. In the 11th Plan integrated GIS mapping and Consumer Indexing should be given priority in all the towns. 3.17.6 Reliability Monitoring of Power Distribution Systems Normally power is generated at a voltage of 10-20 kV AC in a power station and stepped up by power transformer to a transmission voltage of 132/220/400 kV for transmission through transmission lines, to a power sub-station near the load centre.

Distribution Including Village & Household Electrification Working Group on Power for 11th Plan
Page 34 of Chapter 3
In this sub-station, power is then stepped down to 66/33/11 kV level. From this sub-station, 33 kV/11 kV feeders are laid for supplying power to the high voltage consumers or to distribution transformers, which convert it to medium voltage level of 415 V, for providing service connections to consumers at 415 V (3 phase) or to low voltage consumers at 230 V (1 phase) through a combination of 415 V lines up to the pole and then on through service connections to the consumers by underground cables/overhead cables.
3.17.7 Reliability Index
This is defined as the ratio of Customer-hours available over a given period of time to the total number of Customer-hours that should have been available over the same time period. At present CEA carries out reliability monitoring of power distribution systems of Distribution Companies (Discoms)/State Electricity Boards ( SEBs), in terms of outages of 11 kV feeders, on monthly basis, in respect of State Capitals and major urban agglomerations. The reliability monitoring is based on the following two parameters relating to an outage. Outage indicates all ‘No supply conditions’ due to grid constraints, planned shut downs and forced shut downs including momentary shutdowns:
1. Outage duration per outage ( in Hours), which is the ratio of total outage duration of the 11kV feeders to the number of outages of 11 kV feeders and indicates the ‘No Supply Duration of an Outage’. This is analogous to CAIDI.
2. Number of outages per feeder, i.e. total number of outages of feeders divided by
total number of 11 kV feeders, thereby indicating the ‘Average number of Outages of an 11 kV feeder in the system.’ This is analogous to SAIFI.
The reliability monitoring is to be gradually brought in line with the world practice i.e. to measure the outage in terms of consumer hours and number of consumer interruptions. The reliability monitoring will become more fruitful once ‘Consumer Indexing’ i.e. linking of every consumer to the feeder is completed by all the Discoms/ (SEBs) and will provide a direct index for customer satisfaction.
3.17.8 Akshay Prakash Yojana Maharashtra Distribution Company has launched Akshay Prakash Yojana (APY). The programme is based on collective responsibility of the inhabitants of the village and is carried out voluntarily for ensuring better quality of supply and other social benefits. The villages are not pre identified and the adoption of APY entirely depends on the initiative and awareness of the persons staying in villages. Under the scheme, villagers voluntarily restrict the use of any 3 phase load during 5 pm – 11 pm on week days. Only lighting load is utilized. During 5 pm – 11 pm the load is restricted to 20% of full load.

Distribution Including Village & Household Electrification Working Group on Power for 11th Plan
Page 35 of Chapter 3
Load restrictions are supplemented by removal of hooks and unauthorized heavy consumption devices like heaters and hotplates. Apart from this the scheme envisages adoption of energy saving lighting, pumps and use of capacitors. Surveillance committees for monitoring electricity use (Veej Dakshata Committee - VDC) are formed by the villagers. These committees supervise removal of all unauthorized connections. Patrol are organized by villagers to uncover theft and misuse of power. All the consumers voluntarily adopt metered connections. The villages bodies like Gram Sabhas pass resolutions to carry out the activities required for implementation of the scheme. Awareness levels in villages is the most important factor that enables adoption of APY by villages. Communicating effectively to the villagers that electricity is a scarce commodity and stressing on the need for conservation has been crucial for the success of the scheme. The scheme has support of the top management of the utility and the State Government. 3.17.8 Programme on Decentralised Distributed Generation (DDG) DDG for village electrification in remote areas and also for overcoming shortage of power. Supplementary Power supply needs are essential for protecting the already created infrastructure under RGGVY. This programme will cater to all such needs. Pilot projects should be set up initially to gain experience and to instill confidence. Thereafter, a National Programme on DDG be launched under the PPP. REC/PFC may introduce reform to result programmes by extending large value, long term loans as the mutually agreed reform conditionality. DDG be offered capital subsidies or viability gap funding under the PPP programme. REC to set up a wing to lay down the specifications / standards for the equipment suppliers. REC/PFC may finance the power equipment manufacture in their modernization and expansion plans. REC/PFC may float a Venture Capital Funds to encourage manufacture of critical quality components used for power infrastructure and provide ready market for such products at competitive rates 3.17.10 Mobile vans with GSM connectivity This will enable prompt communication and detection of faults and speedier restoration of supply. Five thousand vans can be inducted to start with. More numbers can be added to have a target of atleast 10,000 such vans in the country in the 11th plan to start with. 3.17.11 e- Seva / Bijli Seva Kendra/ Customer Care centre

Distribution Including Village & Household Electrification Working Group on Power for 11th Plan
Page 36 of Chapter 3
These are tools for better customer service and to bridge the digital divide in the rural areas for providing access through Information technology for services to the people living in rural areas. These type of centres can offer different services like payment of bill/ taxes, registration of complaints, providing of information, booking for connections etc. These kinds of centres can solely be managed by women through self help groups. 3.17.12 Energy Accounting and Auditing Measurement of technical and commercial losses is the first step in the direction of reducing T&D losses. Energy accounting is essentially a tool for energy management and helps in breaking down the total energy consumption into all its components. Energy auditing would provide the means to identify the areas of leakage, wastage or inefficient use. This would help in identifying high loss areas and measures suitable for reduction of T&D losses. Preparation of an effective energy account will be possible only if:
• Meters are installed on both sides of each element of the network. • All the consumer installations are installed with accurate energy meters. • Energy meter readings are taken at sending end and at all the consumer
installations. • Similar accuracy class meters are installed both for measuring input to system
and energy sales. • Meters are regularly tested and calibrated. • Electronic trivector meters with data logging facilities are provided on the 11
KV feeders/ secondary side of distribution transformers to record load curve which facilitates assessment of load factors and loss load factors.
The following energy audits will be essential for targeting loss reduction initiatives:
• Sub-Transmission system losses • Voltage level wise losses • Geographical area wise up to smallest Administrative unit loss measurement (/
Zone/ Circle/ Division/ Sub-Division etc. depending on the terminology in use by the utilities)
• 11 KV Feeder wise losses • Distribution Transformer wise losses
For proper measurement of losses, metering is very critical. The biggest constraint today is absence of 100% metering at various stages. Though in the 10th plan there has been significant improvement in metering at consumer level and 11KV level, the metering at Distribution transformer level, which is primary requirement for effective energy auditing metering, is very poor even in progressive states like AP (less than 9%) and Karnataka (24%). Many states have taken various steps for energy audit by providing inter-phase metering but still the proportion of units billed on metering basis as percentage of total energy input is about 50% in most of the states. In Andhra and Maharashtra it is 52 %, in Gujarat and Karnataka it is below 50%, in Rajasthan it is 42% and Punjab it
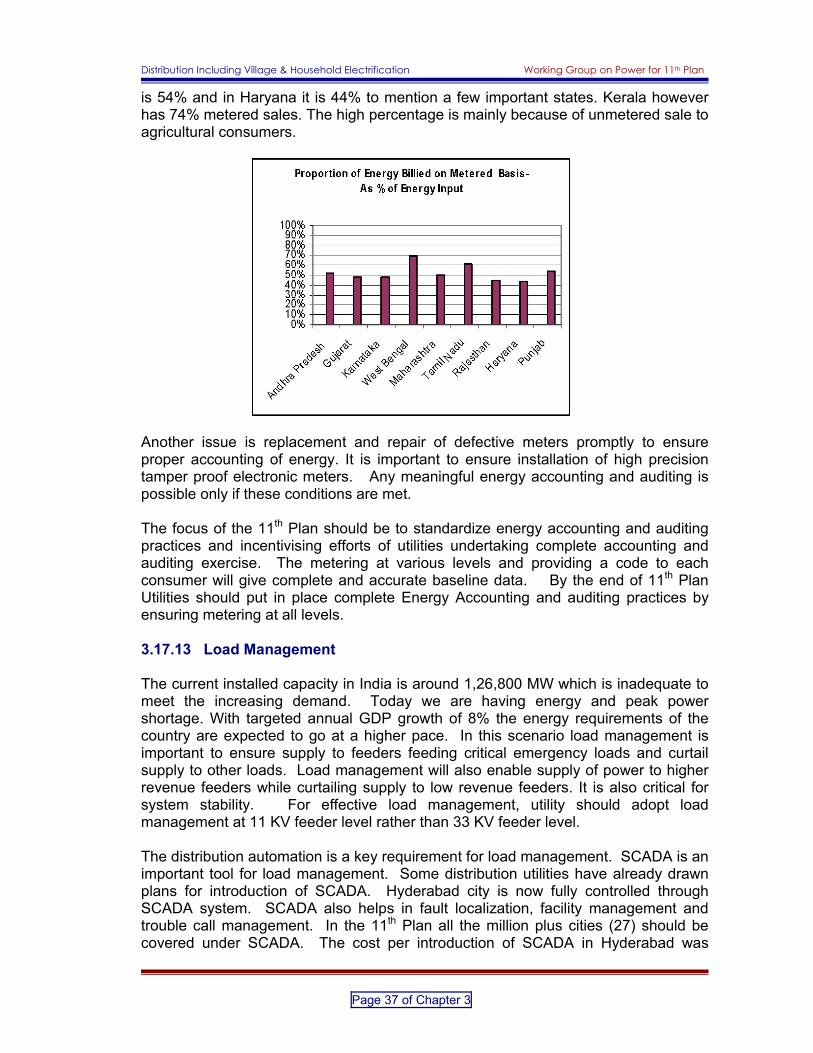
Distribution Including Village & Household Electrification Working Group on Power for 11th Plan
Page 37 of Chapter 3
is 54% and in Haryana it is 44% to mention a few important states. Kerala however has 74% metered sales. The high percentage is mainly because of unmetered sale to agricultural consumers.
Another issue is replacement and repair of defective meters promptly to ensure proper accounting of energy. It is important to ensure installation of high precision tamper proof electronic meters. Any meaningful energy accounting and auditing is possible only if these conditions are met. The focus of the 11th Plan should be to standardize energy accounting and auditing practices and incentivising efforts of utilities undertaking complete accounting and auditing exercise. The metering at various levels and providing a code to each consumer will give complete and accurate baseline data. By the end of 11th Plan Utilities should put in place complete Energy Accounting and auditing practices by ensuring metering at all levels. 3.17.13 Load Management The current installed capacity in India is around 1,26,800 MW which is inadequate to meet the increasing demand. Today we are having energy and peak power shortage. With targeted annual GDP growth of 8% the energy requirements of the country are expected to go at a higher pace. In this scenario load management is important to ensure supply to feeders feeding critical emergency loads and curtail supply to other loads. Load management will also enable supply of power to higher revenue feeders while curtailing supply to low revenue feeders. It is also critical for system stability. For effective load management, utility should adopt load management at 11 KV feeder level rather than 33 KV feeder level. The distribution automation is a key requirement for load management. SCADA is an important tool for load management. Some distribution utilities have already drawn plans for introduction of SCADA. Hyderabad city is now fully controlled through SCADA system. SCADA also helps in fault localization, facility management and trouble call management. In the 11th Plan all the million plus cities (27) should be covered under SCADA. The cost per introduction of SCADA in Hyderabad was

Distribution Including Village & Household Electrification Working Group on Power for 11th Plan
Page 38 of Chapter 3
estimated Rs. 40 crores which has a population of 36.37 lakhs as per 2001 census. If we introduce SCADA in all the million plus towns, the total fund requirement would be around Rs.1000 crores. Other tools for load management such as micro-processor based load limiters to restrict supply to agricultural feeders and Automated Meter devices to monitor feeder, DTR or consumers for consumption curve analysis should be encouraged. 3.18 NEW PROGRAMMES/SCHEMES FOR 11TH PLAN 3.18.1 Special Scheme for Urban Poor In the urban areas people below poverty line live in slums. 2001 census has provided slum demography based on actual count. It is based on areas notified as slums by the state / local Government, recognized as slums by state / local Government and those areas which have at least population of 300 living in congested tenements in poor living conditions. As per the Census 640 cities/towns in 26 states/union territories have reported slum population. Andhra Pradesh has the largest number of towns (77) reporting slums followed by Uttar Pradesh (69), Tamil Nadu (63) and Maharashtra (61). A total of 42.6 million Population live in slums. This constitutes 15 per cent of the total urban population of the country and 22.6 percent of the urban population of the states/union territories reporting slums. 17.7 million Slum population has been reported in the 27 cities with million plus population. Most of the slum dwellers are living below poverty line and can not afford the initial cost of electric connection. There is need for a special scheme to provide assistance to the urban poor. Most of the people in slums are living in unauthorized colonies. There are 4.62 crore slum dwellers. Assuming that the average family size is five the total households will be 92.40 lakhs. If we assume that fifty percent of them do no have electricity in their dwelling units the total targeted households for providing free electric connection will be 46.20 lakh households. At the present rate of Rs 1500 per household connection as per RGGVY norm, the total cost for providing free electric connection along with a meter will be Rs 693 crores. The Working Group recommends that a special scheme should be introduced in the 11th plan to provide 100% subsidy for the urban poor for electric connection. The scheme should cover all those families living in regularized colonies and in the houses provided under Valmiki Ambedkar Awas Yojana (VAMBAY) scheme of ministry of urban employment and poverty alleviation. 3.18.2 One MW Power Plants for Distribution of Electricity in the Rural Area Rural areas have been recognized as distinct entity in the Electricity Act, 2003 for electricity supply. More than 70% of the population lives in rural areas and very large part of the rural population are without access to electricity. There is wide regional variation among the states regarding access to electricity. The Electricity Act mandates the Government to endeavor to supply electricity to all areas including villages and hamlets. The important provisions relating to rural supply are : Section 13 – license exempted for any local authority, Panchayat Institution, users’ association, cooperative societies, non-governmental organizations and franchisees to supply in the rural areas.

Distribution Including Village & Household Electrification Working Group on Power for 11th Plan
Page 39 of Chapter 3
Section 14 - No license required to generate and distribute in a notified rural area. Rural areas to be notified by the State Government. Most of state government have delayed in notifying rural areas. However the redeeming feature is now most of the state governments have notified rural area. Now the efforts have to be made to promote generation and distribution of electricity in the rural areas by private enterprises and other bodies. To start with power plants with optimum one MW capacity should be encouraged in the rural areas. In line with Rural Electrification policy these projects should get automatic approval for land use change pollution clearance, safety clearance on the basis of certification. They should also get priority for grid connectivity if requested. REC should frame schemes for promoting optimum 1 MW power plants for providing necessary technical and financial support. Suitable subsidy has to be built into the scheme to make it attractive and viable. Efforts should be made to align these schemes with Waste Land Development schemes of Rural Development and Forest and Environment Ministries to ensure coordinated approach. 3.18.3 Centres of Excellence for Distribution of Power The Electricity Act has opened new avenues for bringing private participation in the distribution sector. The proviso to Section 14 of the Electricity Act states that: “in a case where a distribution licensee proposes to undertake distribution of electricity for a specified area within his area of supply through another person, that person shall not be required to obtain any separate license from the concerned State Commission and such distribution licensee shall be responsible for distribution of electricity in his area of supply” Accordingly, a person who undertakes the distribution of electricity for a specified area on behalf of the Distribution Licensee will not be required to obtain any separate license from the concerned State Commission. Legal frame-work is in place for variety of actors to participate in electricity distribution business. There is a need for setting up centres of excellence for distribution in various parts of the country. These centres should be provided complete support to emerge as models for other intending players in electricity distribution, particularly in the rural areas. Today, REC is the nodal agency for implementing RGGVY scheme. REC has a long experience in financing and providing other technical support to the state utilities in the rural sector. REC is in a sound financial position with a paid up share capital of Rs.780 crores and net worth of Rs.3779 crores and it figures among the top ten PSUs in the country. The business per employee ratio of REC is 21.98 crores and it has paid highest dividend of 30% during 2004-05. REC’s contribution in village electrification is well known. It has contributed for electrification of more than 5 lakh villages and energisation of 143 lakh pumpsets. Cumulatively, Rs.44, 550 crores disbursed under REC financed schemes up to 31st March 2005. To capture the new opportunities, REC should play a major role in electricity distribution business. The Committee recommends that REC should set up centres of excellence for distribution in all the states to take up

Distribution Including Village & Household Electrification Working Group on Power for 11th Plan
Page 40 of Chapter 3
rural distribution by setting up a subsidiary company. In the 11th Plan 500 such centres should be set up. 3.19 GRICULTURE SECTOR - SUBSIDIES AND CROSS SUBSIDIES Agricultural consumption constitute substantial portion of consumption of electricity. The tariff for agriculture consumers is one of the most contentious issues. In the pre-reform period, State Government determined virtually all tariffs to be levied by the state owned vertically integrated State Electricity Boards even though legally, utilities were empowered to determine their own tariffs. Agricultural tariff is politically sensitive in nature. As a result, most of the State either heavily subsidize agricultural consumption or provide free power. More than 23 percent of total energy sale of the utilities goes to Agricultural consumers. It is estimated that against average cost of supply of Rs. 3.60/KWh for energy made available to the consumers, average price of Electricity to Agriculture consumers is barely 42 Paise/KWh. Cross Subsidy on energy sales has been increasing over the years because of the policy of the some of the states to provide electricity at subsidized rates to agriculture and domestic consumers. While some state governments partly compensate the SEB’s for the subsidized sales of electricity to agricultural and domestic sectors, others do no provide any compensation at all. It is recovered through the cross-subsidy mechanism.
Subsidy to agricultural consumers will continue to be the major issue in the sector as it has political implications. Since subsidies are likely to continue in the near future, the focus should be on efficient administration of subsidies by using prepaid metering technologies including smart cards to provide life line energy to the poor section. The subsidies should be administered by the irrigation or agriculture departments of the states. 3.20 WATER ENERGY NEXUS Efficient use of water in Agriculture could result in considerable saving in energy. The agriculture sector in India uses 85% of the country’s available fresh water. However, irrigation efficiency is only 20-50%. In other words, Indian agriculture

Distribution Including Village & Household Electrification Working Group on Power for 11th Plan
Page 41 of Chapter 3
wastes up to half of the country’s fresh water supply. Although from a basin perspective, much of the wasted water is reused, significant amount of water is wasted primarily due to irrigation inefficiencies. There are inefficiencies on the energy front as well. Agriculture accounts for about 24% of the total electricity consumption in India. The consumption is somewhat higher in the states like Andhra Pradesh, Gujarat, Madhya Pradesh, Uttar Pradesh, Karnataka, and Haryana, where agricultural electricity use is between 35-45%. However, sale of this electricity amounts to no more than 5-10% of the state electricity boards’ revenues. The adoption of flat rate pricing for agricultural power is cause for this perverse state of affairs. Under this system, a farmer pays a fixed price per horsepower per month for electricity. Therefore the marginal cost of pumping water is zero. This leads to energy wastage, over-pumping and inefficient selection of crops. Flat rate pumping also masks the true cost of power to farmers. The tariff structure and the poor combination of technology and management are responsible for water loss, unsustainable exploitation of groundwater and the high energy losses associated with the distribution and end-use of electricity in irrigation water pumping. Significant energy losses are associated with the distribution of electricity and in the poor selection, installation, maintenance and operation of the electrical motor pump system. A vicious cycle operates two sub-systems in tandem: the electrical distribution system and the water pumping system. The performance of the Indian power sector is increasingly dependent on how efficiently irrigation water is used and paid for. Water withdrawal is an energy intensive operation performed throughout the agricultural sector that results in a third of the power consumption in the country being used for the roughly 50% of the national irrigation consumption extracted from groundwater resources. Highly subsidized power supply policies for agriculture have major implications for the overall condition of the power sector and associated water resource. The level of attention paid to water use efficiency is directly proportional to the prices charged for water servicing. Rising prices lead to increasing attention to water use and, in the long run, more efficient use of water. Addressing water and energy use efficiencies in the Indian agricultural sector requires a strategic combination of several interdependent components. There has to be central and state policy dialogue on power and water sector reform to develop an energy and water framework. Commercial practices have to be introduced in rural power distribution in order to expand the domain of power planning beyond the customer side of the electrical meter to encompass the water well, the exploitation and recharge of aquifers and the management of the watershed as a whole. It is also essential to involve the rural consumer in partnership to advance energy and water use efficiency, thereby improving reform prospects.
The approach paper of the planning commission for 11th plan indicates a growth of 4% in Agriculture from 2% at present. This would mean large scale exploitation of irrigation potential. Special efforts are needed for better utilization of ground water potential especially in U.P., Uttaranchal, Jharkhand, Bihar, Orissa and West Bengal.

Distribution Including Village & Household Electrification Working Group on Power for 11th Plan
Page 42 of Chapter 3
In areas where level of ground water exploitation is nearing saturation point or where there is a need for conservation of power and water, a new approach is called for. Fixing the quantum of water required for raising crops in relation to areas cultivated, power needed to draw out ground water from varying depths could help set standards in conservation of water and power. There is a case for levy of a combined charge for water and power to secure water conservation and energy use efficiency.
The priority sector status available to REC for the energisation of Agricultural pumpsets etc was recently withdrawn which should be restored in order to enhance the pumpset energisation programme during the 11th plan to at least 35 lakh pumpsets.
Diesel pumpsets presently being utilized should be substituted by biofuels so that use of diesel is avoided. The bio fuels can be produced locally and a road map may be set up by the States for cultivation of Jatropha or other plants for producing biofuels for substitution which are renewable and environment friendly. CDM benefits could also be claimed.
Feeders for Agriculture should be separated and to counter the inductive loads, capacitor banks may need to be installed. Feeder separation would allow regulation of operation hours of the pumpsets.
The subsidy extended on Agricultural tariff should be fully compensated by the states. Free power if extended by the states should target small and marginal farmers only.
The Agricultural pumpsets should be of international standards with focus on energy efficiency and the benchmark standards of the indigenous equipment should be raised accordingly and use of the same to be made mandatory/ obligatory wherever free power or subsidized power is made available. Relaxation may be permitted only if the consumers are ready to pay a suitable minimum tariff.
In the Agricultural Sector, the pumpsets of high quality and the water delivery system engineered for high efficiency would be promoted Motors and drive systems are the major source of high consumption in Agricultural and Industrial sector.
Stringent check on the pumpset installation, sealing of the units installed and strict penalties may bring discipline in this sector. This would call for utmost political will.
Command area development using drip and sprinkler irrigation for water management should go hand in hand with the pump sets energisation policy of the States.
3.21 OPEN ACCESS IN DISTRIBUTION The two critical areas for private sector investment are open access and multi-year tariff principle to give certainty to tariffs principles. Open access in distribution has not materialized though regulations have been issued by SERCs. Multi-year Tariff which has been provided in the Electricity Act would be an important structural incentive in minimizing risk for utilities and consumers. Access to transmission and distribution network is one of the most important elements of Electricity Act 2003 and National Electricity Policy 2005. At the retail level that consumers with a minimum requirement of 1 MW are to be granted the right to avail open access by 2009 in a phased manner. A consumer allowed open access

Distribution Including Village & Household Electrification Working Group on Power for 11th Plan
Page 43 of Chapter 3
under the regulations is therefore free to choose any electricity supplier other than the distribution licensee of its area. Competition in Generation and Distribution can be successful only through the access to the Transmission and Distribution networks. The provision of open access would allow generating companies to sell directly to multiple distribution and trading licensees and to the consumers. This will enable development of power market with participation from multiple buyers and sellers in competitive environment. Electricity Act 2003 makes open access mandatory. It has also been envisaged that the amount of cross subsidies charged and additional surcharge to be levied from consumers who are permitted open access should not become so onerous that it eliminate competition. It is important for open access that the distribution network is adequate. The current state of distribution system which often operates at low frequencies limits operation of Open Access. The upgradation and augmentation of the grid is therefore necessary. Though distribution licensees have an obligation to provide non-discriminatory open access to the network, there is no obligation on the licensees to expand their network capacity to accommodate demands. Under the Electricity Act, the Regulatory Commission’s role is to develop regulations permitting open access, to determine commercial parameters such as charges for wheeling of power and surcharges applicable to open access customers and to resolve any technical disputes on availability of transmission capacity. In order to meet the rising demand for electricity, especially from industrial consumers, the Act provides incentives for captive and cogeneration plants. Captive power plants are given open access to transmission and distribution lines to carry power from the captive generating plant to the destination of their own use without the payment of surcharge, which is to be paid by other open access users as provided in the Act and used to meet the cost of cross-subsidies. The major issue in making open access operational is the level of cross-subsidy and other charges applicable to open access consumers. If the charges are set at a level which works out expensive than the grid tariff the whole purpose of providing open access will be defeated. Another factor that influence price of power through open access is the rate at which power is available from the generators. Even if various charges are set at higher level, the consumers may be able to get power supply at a competitive price from a cheap source and find it cheaper than the tariff of the licensee. 3.22 MULTI-YEAR TARIFF The system of cost plus approach for tariff determination has not been very effective in providing the utility with adequate incentive to improve its performance. Cost based approach provides a rate of return to SEBs/Utilities based on costs that include inter-alias, fuel and power purchase, investments in the network and energy losses. In this system SERCs found it difficult to arrive at appropriate level of energy losses that could be allowed as part of tariff fixation process which is done annually. The main draw-back of this approach is uncertainty of tariffs. Performance based regulation through Multi Year Tariff (MYT) framework, is an important incentive to minimize risks for utilities and consumers, promote efficiency

Distribution Including Village & Household Electrification Working Group on Power for 11th Plan
Page 44 of Chapter 3
and rapid reduction of system losses. It would also bring greater predictability to consumer tariffs by restricting tariff adjustments to known indicators. Multi-year tariff provides regulatory certainty on cost of tariff which is essential for investor interest in utilities. Electricity Act 2003, National Electricity Policy and National Tariff Policy envisages introduction of Multi-year tariff framework. As per Tariff policy, MYT framework is to be adopted for any tariffs to be determined from April 1, 2006. The MYT framework covers capital investments and an incentive framework to share the benefits of efficiency improvement between the utilities and the beneficiaries. One of the challenges before the regulators is the determination of efficient targets for the utilities as part of performance based tariff setting. Another problem regulator faces is obtaining accurate historic data and information regarding utility operation. The key issues in MYT approach is determination of key parameters to be monitored for programme and the constraints in determining an efficient level of operation for utilities. In the public utilities the question arises as how to motivate the management for improving performance in performance based approach. Another question is how the quality of supply provided to the consumers should be factored into performance based framework for regulation. Benchmarking should be properly adopted after adequate studies to establish the desired performance standards. Regular review of the performance levels also need to be suitably undertaken. Subsidies in the tariff given by the State Governments should be fully compensated upfront instead of cross subsidies. 3.23 PUBLIC PRIVATE PARTNERSHIP Development of power sector requires large investment that can not be met solely by public finance. Electricity Act 2003 has provided a legal frame-work to attract private sector participation in the power sector. However, the present conditions prevailing in the power sector, particularly in the distribution segment are unlikely to attract private investment unless reform pace accelerates. In this context, the distribution sector should focus on public private partnership model for resource mobilization and efficiency gains. The strengths of both public and private sector should be combined to achieve the ambitious goals set in the National Electricity Policy. A private participation could help to bring technical and managerial expertise for improving operating efficiency and customer orientation, besides supplementing the efforts of the Government to invest in the sector. A public private partnership is already emerging in the form of franchisees in rural areas where villages have been electrified under Rajiv Gandhi Grameen Vidyutikaran Yojna (RGGVY). But, on a larger scale, to meet the huge investment and efficiency gaps in the distribution sector, there is a need to create right environment for public private partnership in the 11th Plan. The State Government should provide necessary ground for smooth implementation of public private partnership. For this necessary legal and regulatory frame-work should be designed. Since distribution sector is exclusively within the purview of the State Government, a strong political support is necessary for introducing PPP model in the distribution sector. State Governments support is also required in aspects such as law and order, land acquisition,

Distribution Including Village & Household Electrification Working Group on Power for 11th Plan
Page 45 of Chapter 3
rehabilitation and resettlement, shifting of utilities and forest and environment clearances. In the distribution sector, the availability of information and huge gaps in data is a major challenge for promoting public private partnership. The major issue in promoting PPP model in power distribution sector is the commercial viability due to high subsidies to certain categories of consumers which at present the State Governments are not able to fully compensate to utilities due to their poor finances. Consensus building is also vital to the success of PPP. It is important to mobilize support from all the stakeholders for effective implementation of PPP models. A clear path has to be laid addressing various issues in successful implementation of PPP model in the power distribution. The risks to the private players and the utilities have to be clearly identified and allocation of risks has to be done in a rational and the contractual document should suitably incorporate them. In the 11th Plan efforts should be made to introduce PPP model in major urban areas along with surrounding rural areas in the proximity. The State Government should be encouraged to implement PPP in select towns. The model for PPP should learn from successful PPPs like NDPL of Delhi.
3.24 IMPACT OF POWER SECTOR REFORMS – SUCCESS STORIES Andhra Pradesh Andhra Pradesh has been in the fore-front of power sector reform. It has achieved significant improvements in transmission & distribution loss reduction and brought about significant improvements in the functioning of power sector. Transmission & distribution losses have reduced by about 12% in the last five years and collection efficiency has increased to 100% level which helped in financial turn around of the sector in the year 2005-06. Andhra Pradesh is consistently campaigning against theft and initiated strict action against theft cases. In the financial year 2003 more than one lakh prosecutions relating to theft of electricity were done. Similarly, in the year 2004 about 90,000 prosecutions have been done. Distribution transformer failure rate have substantially reduced from 29% in 2001 to 11% in 2004. Karnataka Karnataka has also reduced losses from 38% in the financial year 2000 to 31% in 2004. Collection efficiency has improved from 91% in the financial year 2002 to 99% in the financial year 2004. The financial health of the Corporation has improved with a decline in revenue deficit per unit from 109 paise to 73 paise. Orissa In Orissa the trend of T&D losses is towards reduction for all the Discoms. It varies from 41% to 36% in the case of WESCO, 44 % to 41% in the case of NESCO 42% to 40% in the case of SOUTHCO and 45% to 40% in the case of CESCO from the year 2000 to 2004.

Distribution Including Village & Household Electrification Working Group on Power for 11th Plan
Page 46 of Chapter 3
Delhi NDPL Experience Aggregate technical and commercial losses have reduced and collection efficiency has reached 100% after privatization of Delhi Discoms. The losses have reduced from 51% to 35% from 2002 to 2005. Similarly, the collection efficiency has gone up from 92.80% to 100.30% during the same period. Other states have also started showing improvement due to number of initiatives at various levels. 3.25 BEST PRACTICES Certain actions are required as a prerequisite for attaining the AT&C loss reduction which have given the best results. List of such best practices which can be adopted across the country are listed below:
1) Consumer Indexing 2) Assets Codification 3) GIS mapping & integrating GIS with other business process 4) Spot billing 5) Automated Meter Reading 6) Meter reading through computerized meter reading instruments 7) Web based billing & collection 8) Online collection for depositing bills at any counter 9) Collection through ATM equipments 10) Online payment through credit cards 11) Cheque drop boxes 12) Preventive Maintenance 13) Overhead/underground routine maintenance 14) DTC maintenance 15) Turn Key execution 16) Project Management Teams 17) Quality Management through ISO/TQM 18) S/stn .Data logging/SCADA/DMS 19) Online Material Management & Inventory Management 20) Out sourcing of O & M activities 21) Rural franchisee. 22) HVDS 23) 100% metering 24) Energy accounting & auditing 25) Theft control 26) Management Information Systems. 27) Identification & monitoring through Key Performance Indicators 28) Call Centers 29) Customer Facilitation Centre
Out of the above list the best practices adopted by some of the states utilities are given below. All these states have been successful in reducing the AT&C loses.
Distribution Including Village & Household Electrification Working Group on Power for 11th Plan
Page 47 of Chapter 3
Best Practices – ANDHRA PRADESH (AP DISCOMS)
1) Consumer Indexing 2) Key Performance Indicators (KPIs) for monitoring performances 3) GIS mapping 4) Automated Meter Reading 5) Meter reading through computerized meter reading instruments 6) Collection through computerized meter reading instruments 7) HVDS 8) 100% DTC metering 9) MIS System 10) SCADA 11) Call Centre 12) Customer Care Centre 13) Spot billing
Best Practices – NEW DELHI (NDPL)
1) HVDS 2) Capacitors 3) Standardization of cable sizes 4) GIS mapping 5) Distribution automation 6) Use of planning software tools 7) Electronic meters 8) Customer Care & Cash Collection Centers 9) Mobile Maintenance crews 10) Mobile Transformer unit 11) Replacement of Cable: Ring Mains Unit 12) Use of Package Sub-stations 13) Meter Installations: Outsourced 14) Computerisation of all activities 15) Commercial wing separate from maintenance wing 16) ‘Sampark’ Communication with Consumer. 17) ‘Sarthi’ communication with employers 18) Automated Meter Reading (AMR)
Best Practices – KARNATAKA (BESCOM)
1) Energy Accounting at DTC level with synchronized meter reading schedule
2) System improvement work 3) 11kV and LT re-conductoring 4) Rural load management system 5) HVDS 6) Gram Vidyut Pradinithi 7) Distribution of CFL lamps in DSM program
Best Practices – RAJASTJAN (Jaipur Vidyut Vitaran Nigam Ltd.)
1) Creation of more 33 kV Sub-stations 2) Renovation of existing 11 kV feeders 3) Establishment of Consumer Grievance Redressal mechanism
Distribution Including Village & Household Electrification Working Group on Power for 11th Plan
Page 48 of Chapter 3
4) Releasing new connections within time frame 5) Reduction of AT & C losses 6) HVDS for rural areas 7) Energy metering of 100% consumers 8) Meters mounted on base of meter boxes & cover having push fit
arrangement after making electric connections 9) Meter box to have number seal
Best Practices – CESC Limited (West Bengal)
1) Development of consumer database with pilferage history and ongoing IT based monitoring of their consumption pattern.
2) Installation of meter pillar boxes in pilfer-prone pockets. 3) Blocking of service cutouts and installation of cutout less service with
MCCBs. 4) Holographic seal and imported ferrule seal on all meters. 5) 24 hours monitoring and surveillance by Loss Control Engineers
against theft/pilferage of electricity particularly through night drives. 6) IT based surveillance against theft and pilferage of electricity. 7) Meter reading of all the HV & CT operated MV meters by
computerized meter reading instrument. 8) Monthly meter reading and billing of 100% consumers with rotation of
meter readers in each cycle. 9) Energy auditing and accounting in MVAC distribution transformers
through Automated Meter Reading (AMR). 10) Very high collection efficiency with intensive follow-up for outstanding
realization. 11) Fully computerized consumer indexing system (CIS). 12) Documented maintenance and operation practices with ISO
certification for Distribution Office Operation. 13) Extensive training facility at distribution training institute to hone up
the technical skills and impart the training on best practices to ground staffs, supervisory level and Engineer / Sr. Engineer level.
14) Diagnostic fault analysis to prevent recurrence. 15) Installation of Compact Sub-stations with Gas-insulated Switchgears. 16) Fully mobile maintenance crews with mobile communication
equipment operating round the clock. 17) GIS covering of HVAC & MVAC network. 18) Integration between Commercial and Engineering database with ERP
software. 19) Fully integrated 1 GBPS intranet optical fiber communication
backbone network. 20) Application of Six Sigma for improvement of operations. 21) Structured Grievance Redressal Mechanism with computer aided
monitoring. 22) Unified Call Centre operation for all supply related complaints. 24
hours help desk for all consumers. 23) Dissemination of consumer awareness messages at regular intervals
along with the consumption bills and periodic visits to target segments.

Distribution Including Village & Household Electrification Working Group on Power for 11th Plan
Page 49 of Chapter 3
THRUST OF THE 11th PLAN IN DISTRIBUTION AND RURAL ELECTRIFICATION
EXPECTED OUTCOMES Urban Areas 1. Consumer Indexing - 2000 towns 2. House holds will have access to electricity - 100% (Including urban poor) 3. Development of PPPs – Major towns 4. Customer Care Centres – to cover all urban consumers - All towns 5. SCADA in - 27 cities 6. IT usage - all Towns Rural Areas 1. Villages to be electrified - 100% 2. Households will have access to electricity -100% 3. One or more 33/11 kV ( or 66/11 kV) substations in every Block 4. One or more Distribution Transformers in every village 5. SC/ST bastis to be electrified - 100% 6. BPL households to be electrified -100% 7. Schools, Panchayat offices, health centres, dispensaries, Community centres to be electrified - 100% 8. Street Lights in every village - 100% 9. DDG schemes through grid inter connections - 1000 Nos. 10. Setting up e-seva centres/ customer care centres - 1000 Nos. 11. Direct employment generation - 1 million 12. Development of Franchisees - 2,50,000 villages 13. Centres of Excellence in rural distribution - 500 Losses 1. Reduce AT&C losses - up to 15-20% Urban Areas - 15% Rural Areas - 20%
• Feeder separation in states which consume high energy for agriculture for improved load management & proper accounting.
• Improved T&D network in all NE states • Introduction of HVDS system to bring down HT:LT ratio • Energy Accounting & Auditing In all Utilities.
2. Metering • all feeders - 100% • all distribution transformers - 100% • all industrial consumers - 100% • domestic consumers -100%

Distribution Including Village & Household Electrification Working Group on Power for 11th Plan
Page 50 of Chapter 3
• prepaid metering system pilot projects in all states for rural areas and urban areas.
Energisation of Pumpsets 1. Agricultural Pumpsets to be energized - 35 lakhs Turnaround Targets for State Utilities 1. Reform process and perceptible turnaround of State Utilities - 50 utilities 2. Energy Conservation and Demand Side Management on
Priority Time of the Day metering - 15 States Management 1. Public Private Partnership Towns & Cities - 500
Villages - 2,50,000 2. Inclusive growth Supervisory role for all gram Panchayats/ local bodies Other Reforms 1. Open Access operational In all states 2. Multi Year Tariff In all states 3. Integration of IT applications In all states Human Resource Development 1. Human Resource Development – Upgrading CIRE Hyderabad into National Training Centre for distribution related activities. 2. Establishment of Training centres for capacity building20 state level
115 district centres
A. The requirement of funds for sub transmission and distribution have been worked out on the following assumptions:
1. The total capacity addition planned during 11th plan has been taken as 70,000 MW and the transformer capacities have been worked out on that basis for an appropriate system with proper loading pattern.
2. The total line length adopted is based on the actual progress achieved up to 31.03.2005 and the rate of growth per year to estimate the likely achievement in 10th plan. The quantities have been increased by over 10% for the 11th Plan.
3. Since access has to be provided to all households has been taken for estimation purpose. Similarly other quantities have been assumed.
4. The costs adopted in various states are different under various schemes and as such a reasonable cost has been assumed also keeping in view escalation over next five to six years.
B. Under APDRP balance amount has been estimated at Rs. 25000 crores at the end of 10th plan. Agricultural pumpsets connections for about 35 lakhs pumpsets have been estimated @ Rs. 45000/- per pumpsets including additional infrastructure requirements. Accordingly, a provision of Rs. 15000 crores has been estimated.

Distribution Including Village & Household Electrification Working Group on Power for 11th Plan
Page 51 of Chapter 3
C. A total of 4000 MW under DDG has been considered @ Rs. 5 crore/ MW and accordingly the estimate worked out to Rs. 20000 crores. D. Reforms process is to continue during the 11th plan and a suitable provision has been considered for transitional finance. A modest provision of Rs. 10000 crore has been kept accordingly.
Table 3.6
Sl. Name of Segment Units Physical
2007-12 Financial
2007-12 (Rs. Lakhs)
I Lines (i) 33 KV Ckt Kms 150000 810000 (ii) 11 KV Ckt Kms 675000 2025000 (iii) LV Ckt Kms 675000 1518750 II Sub-Station (i) 33/11 KV MVA 130000 2600000 (ii) 11/0.4 KV MVA 162000 5184000 III Capacitors MVAR 15565 77825
IV Service Connections to
(i) Domestic Installations Nos. 70000000 1162000
(ii) Commercial Installations Nos. 3500000 66500
(iii) Industrial Installations
(a) HT Nos. 500000 90000 (b) LT Nos. 50000 2000 (iv) Public Light Nos. 750000 18750 (v) Agriculture Nos. 3500000 140000 Total (I to IV) 13694825
V
A. Re-conductoring of Lines
(i) 33 KV Ckt. Kms 100000 378000 (ii) 11 KV Ckt. Kms 2200000 4620000 (iii) LV Ckt. Kms 700000 1106000 Total V (A) 6104000
B. Augmentation of S/Ss
(i) 33/11 KV MVA 88000 1408000 (ii) 11/0.4 KV MVA 110000 2530000 Total V (B) 3938000 Total (V) 10042000 Grand Total 23736825
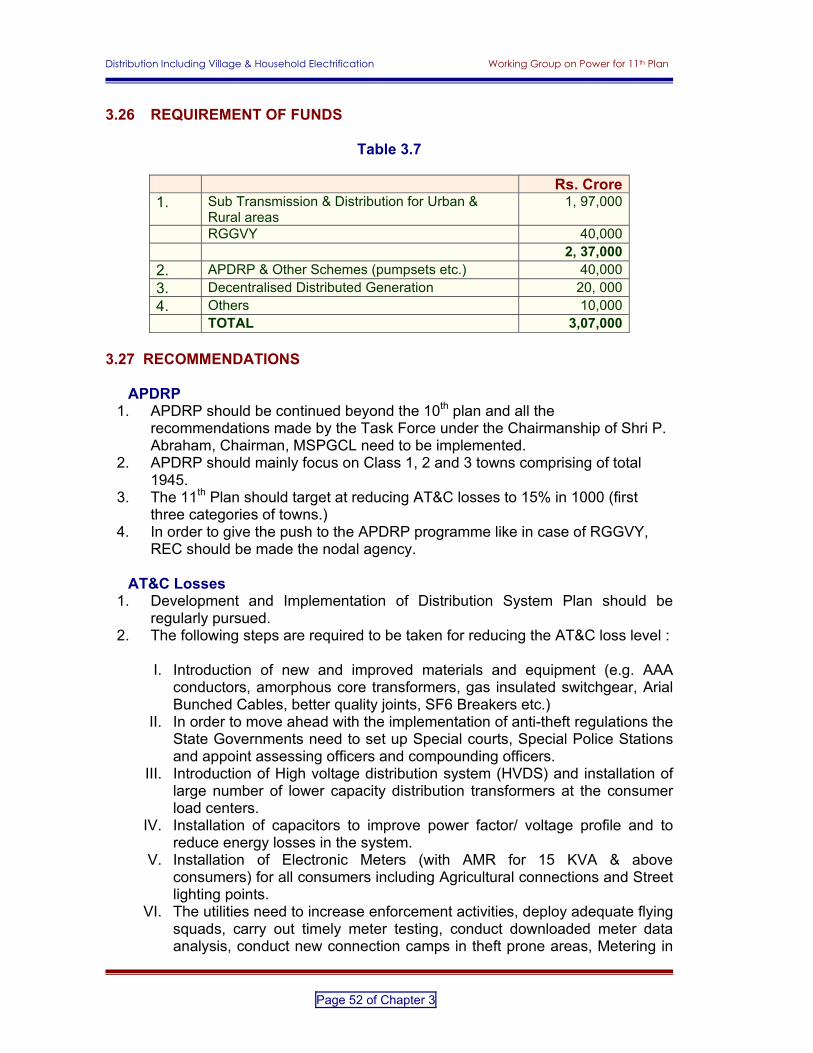
Distribution Including Village & Household Electrification Working Group on Power for 11th Plan
Page 52 of Chapter 3
3.26 REQUIREMENT OF FUNDS
Table 3.7
Rs. Crore 1. Sub Transmission & Distribution for Urban &
Rural areas 1, 97,000
RGGVY 40,000 2, 37,000 2. APDRP & Other Schemes (pumpsets etc.) 40,000 3. Decentralised Distributed Generation 20, 000 4. Others 10,000 TOTAL 3,07,000
3.27 RECOMMENDATIONS
APDRP
1. APDRP should be continued beyond the 10th plan and all the recommendations made by the Task Force under the Chairmanship of Shri P. Abraham, Chairman, MSPGCL need to be implemented.
2. APDRP should mainly focus on Class 1, 2 and 3 towns comprising of total 1945.
3. The 11th Plan should target at reducing AT&C losses to 15% in 1000 (first three categories of towns.)
4. In order to give the push to the APDRP programme like in case of RGGVY, REC should be made the nodal agency.
AT&C Losses
1. Development and Implementation of Distribution System Plan should be regularly pursued.
2. The following steps are required to be taken for reducing the AT&C loss level :
I. Introduction of new and improved materials and equipment (e.g. AAA conductors, amorphous core transformers, gas insulated switchgear, Arial Bunched Cables, better quality joints, SF6 Breakers etc.)
II. In order to move ahead with the implementation of anti-theft regulations the State Governments need to set up Special courts, Special Police Stations and appoint assessing officers and compounding officers.
III. Introduction of High voltage distribution system (HVDS) and installation of large number of lower capacity distribution transformers at the consumer load centers.
IV. Installation of capacitors to improve power factor/ voltage profile and to reduce energy losses in the system.
V. Installation of Electronic Meters (with AMR for 15 KVA & above consumers) for all consumers including Agricultural connections and Street lighting points.
VI. The utilities need to increase enforcement activities, deploy adequate flying squads, carry out timely meter testing, conduct downloaded meter data analysis, conduct new connection camps in theft prone areas, Metering in

Distribution Including Village & Household Electrification Working Group on Power for 11th Plan
Page 53 of Chapter 3
Pillar Box based systems and conduct awareness campaigns in targeted areas.
Energy Audit and Accounting & GIS
1. The focus on the 11th Plan should be to standardize energy accounting and auditing practices and incentivizing efforts of utilities undertaking complete accounting and auditing exercise and metering.
2. GIS and consumer indexing in distribution system needs to be introduced in all utilities.
IT Intervention 1. IT Blue print should be prepared and focus on integrated approach to get the
best results. 2. Installation of SCADA and distribution automation is to be taken up in all major
cities/towns. 3. Improvement in billing by using modern meter reading technologies (AMR,
CMRI etc.), billing database correction/ strengthening, and implementation of IT based Billing system.
4. Mobile van with GSM connectivity needs to be introduced in all districts. 5. e-seva Kendra’s to be set up in all districts. 6. Customer service centers should be introduced in all urban areas.
Reliability Index 1. All reliability indices for quality and reliability of supply should be adopted and
measured. 2. Standards of performance to be enforced by SERCs. 3. Proper trouble calls management to be adopted in all States by the end of 11th
Plan. Distribution Reforms 1. Unbundling of SEBs, Privatization of loss making utilities, and handing over of
high loss feeders need to be pursued further.
RGGVY Programme 2. The programme requires continuous support from all the agencies concerned,
with regular flow of funds and constant monitoring to ensure that the envisaged benefits reach the rural masses well before the targeted date.
3. To develop an appropriate Monitoring and Evaluation (M&E) framework with measurable indicators for implementation and long-term sustainability of RGGVY.
4. To benchmark procedures and practices for designing sustainable projects. 5. There is also need to introduce wide spread use of prepaid cards, hand held
meters for the spot billing, anti theft microchip devices in meters and metering at distribution transformer level so as to enhance collection efficiency in rural distribution and to reduce theft and pilferage.
6. Use of energy saving lamps e.g. CFL be encouraged.
Distribution Including Village & Household Electrification Working Group on Power for 11th Plan
Page 54 of Chapter 3
Franchisee Development 1. Various avenues for financial support to franchisee which should include
financial support from rural banks, cooperative banks and other financial institutions.
2. Loans given to franchisee can be refinanced by Apex bank, NABARD and model schemes could be developed in consultation with RBI in order to encourage wide spread participation by lending community.
3. Rural Infrastructure Development Fund (RIDF) of NABARD provides funds to States for infrastructure development purposes. Franchisees should be given funds from RIDF at a concessional interest rate, for financing expenditure involved in collection of bills, O&M etc.
4. Micro-financing agencies nowadays are providing small loans to the tune of around Rs. 20,000/- without security. These agencies may be empanelled and made known to franchisees so that whenever they require funds they can approach these agencies.
5. Corporate sector can play an important role in handholding the franchisees. Not only power sector CPSUs, which have network all over the country but also corporate leaders like Infosys, Wipro, Reliance, HLL, L&T etc. be encouraged to help SHGs in the development of franchisees.
Capacity Building
1. It is essential that institutes are identified at Central and State level for undertaking capacity building in a systematic manner.
2. Proper human resource development and capacity building requirements to be given special attention for a sustainable development.
Decentralized Distributed Generation 1. DDG scheme implementation should be taken up on a mission mode. Stand Alone 2. Stand alone projects up to 1 MW size to be implemented by MNES through
NTPC, IREDA or other agencies by setting up Joint Ventures. 3. The funds available under RGGVY can be utilized for such stand alone
schemes with a capital subsidy. Grid Inter Connected 4. Grid Interconnected Schemes to be implemented for supplementary power
needs. These schemes may be up to 5 MW capacity. 5. Corporate Agencies may take up such grid interconnected DDG schemes on
competitive bidding basis. Public Private Partnership to be encouraged. Viability Gap funding may be adopted.
Cost 6. Cost of electricity should be based on cost to serve/ avoided cost. Technologies 7. All available commercial technologies (both conventional and non
conventional) may be utilized. 8. Suitable standard size packs may be used in order to reduce production costs.

Distribution Including Village & Household Electrification Working Group on Power for 11th Plan
Page 55 of Chapter 3
9. Multi-fuel technologies may be adopted for sustainability of DDG projects. Biomass Plantation 10. Biomass cultivation and development of short duration (cycle) high yielding
varieties of biomass for combustion/ gasification/ bio-fuels be encouraged with minimum support price.
11. Financial Institutions should support bio-diesel plantations, consultancy, R&D, DPR preparation etc.
Policy Issues 12. DDG projects should be exempted from income tax, excise duties or customs
duties or accelerated depreciation benefits be provided. 13. All concessions extended by States for Industrial development may be given
for DDG projects. 14. Clear allocation of power for rural areas be ensured, so that there is no
discrimination in the hours of supply between rural and urban areas. 15. A separate Rural Electricity Agency (REA) may be considered for each state
to look into needs of rural areas. 16. The State Govts., State Utilities/ Discoms and Local administration should
create proper enabling atmosphere to encourage DDG projects. 17. Priority Sector lending status and long term loans up to 25 years through
International Agencies may be provided for DDG projects. Survey 18. Urgent need for comprehensive survey of available resources in each village
should be taken and be completed in eighteen months. R&D 19. R&D on fuel cells, efficiency of other existing systems etc be encouraged by
extending financial support or Income Tax benefits. 20. Improvement in quality and life of batteries is very essential; R&D is required
in this area. Capacity Building 21. Suitable capacity building measures be adopted like training of local youth in
the maintenance of DDG equipment at local levels. Nodal Agency 22. REC should act as Nodal Agency for Grid Interconnected DDG schemes and
Survey of villages. Other issues 23. All subsidies to be based on outcomes and not outlay. 24. Carbon Credit benefits to be utilized by use of DDG projects. 25. The electricity should be provided through Rural Electricity Supply Providers/
franchisees. Local Management & Monitoring

Distribution Including Village & Household Electrification Working Group on Power for 11th Plan
Page 56 of Chapter 3
26. District Committees be strengthen & empowered suitably. Local Institutions like Panchayats, NGOs, Cooperatives, SHGs may be activated to coordinate or participate in the DDG projects.
Other Issues on Distribution Open Access 1. Open access in distribution should be fully operationalised including phasing
out cross subsidy surcharge by end of 11th plan. Tariffs 2. Multi year tariff framework to be adopted by all states. 3. Benchmarking for MYT should be properly adopted after adequate studies to
establish the desired performance standards. Regular review of the performance levels also need to be suitably under taken.
4. The subsidy for agriculture needs to be reduced in line with the National Electricity Policy to a level of + 20% of average cost of supply by 2010-11. However, it needs a strong political will.
5. Combined tariff for electricity and water may need to be considered for judicious use and conservation of both.
Agriculture 6. Mandatory/ obligatory requirement to be made for international standard
Agricultural pumpsets based on least energy requirements. 7. Command area development using drip and sprinkler irrigation for water
management should go hand in hand with the pumpsets energisation policy of the States.
8. Diesel pump sets should be replaced by non-conventional sources of energy including bio-fuels.
9. Agriculture Feeder separation programme to be launched. 10. Agriculture consumers to be metered. Other Issues 11. The priority sector status available to REC for the energisation of Agricultural
pumpsets etc was recently withdrawn which should be restored in order to enhance the pumpset energisation programme during the 11th plan to at least 35 lakh pumpsets.
12. Wherever applicable Carbon credit benefits be obtained. 13. India must improve their equipment standards by raising the benchmark levels
to that of international standards in order to reduce technical losses and no. of outages.
New Programmes for Introduction in the 11th Plan In order to implement various recommendations there is a need to adopt comprehensive schemes on the following besides continuation of APDRP and RGGVY.
1. One Megawatt Power plant Programme for Rural electricity supply 2. Setting up of Centres of Excellence for Rural Distribution

Distribution Including Village & Household Electrification Working Group on Power for 11th Plan
Page 57 of Chapter 3
3. Consumer awareness programme on the lines of Akshay Prakash Yojana of Maharashtra
4. Special Programmes for Capacity Building of franchisee 5. Special Agriculture Pumpset Energisation Programme 6. Special Schemes for Urban Poor 7. Special Programmes for Development of North East 8. Programme on Decentralized Distributed Generation (DDG) for village
electrification in remote areas and also for overcoming shortage of power. Supplementary Power supply needs are essential for protecting the already created infrastructure under RGGVY. This programme will cater to all such needs. Pilot projects should be set up initially to gain experience and till instill confidence. Thereafter, a National Programme on DDG be launched including under the PPP model.
9. REC/PFC may introduce reform to result programmes by extending large value, long term loans as the mutually agreed reform conditionality.
10. REC to set up a wing to lay down the specifications / standards for the equipment suppliers.
11. REC/PFC may finance the power equipment manufactures in their modernization and expansion plans.
12. REC/PFC may float Venture Capital Funds to encourage manufacture of critical quality components used for power infrastructure and promote ready market for such products at competitive rates.
**********

Demand Side Management & Energy Efficiency Working Group on Power for 11th Plan
Page 1 of Chapter 4
Chapter- 4
DEMAND SIDE MANAGEMENT AND ENERGY EFFICIENCY
4.0 INTRODUCTION In rapidly growing economy of India, the energy requirements have been increasing at a very fast pace. Indian economy has been gradually reforming itself with the developments taking place in the dynamic global energy scenario as well as with the advancements in technologies worldwide. The Government of India at the highest level is giving top priority to the attainment of nation’s long-term energy security. India ranks 5th in the world in terms of primary energy consumption, accounting for about 3.5% of the world commercial energy demand in the year 2003. The total commercial energy consumption of various sectors stood at 218 million toe (2003-04).The share of energy by different end-use sectors is given in Figure 1.
If it perseveres with sustained economic growth, achieving 8-10% of GDP growth per annum through 2030, its primary energy supply, at a conservative estimate, will need to grow 3 to 4 times and electricity supply by 5 to 7 times of present consumption. Its power generation would increase to 780,000 MW from a current level of about 120,000 MW and annual coal demand would be in excess of 2000 million tons from a current level of 350 million tons. This extraordinary growth in energy demand will place great stress on the financial, managerial and physical resources of the country. For meeting desired growth rate of the economy, the country faces formidable challenges in meeting its energy needs and in providing adequate energy in various forms to users in a sustainable manner and at reasonable costs. While it is essential to add new power generation capacity as well as ensure availability of substantial commercial fuels to meet the nation’s growing energy requirements, it is equally important to look out for options that help in reducing energy demand by various end-use sectors. The need for enhancing energy conservation efforts has become very important.
93 (42%)
35 (16%)
26 (12%)
20 (9%)
15 (7%)
30 (14%)
AgricultureIndustryTransportResidentialOther energy usesNon-energy uses
Figure 1. Sectoral share of commercial energy consumption (mtoe) (2003-04)

Demand Side Management & Energy Efficiency Working Group on Power for 11th Plan
Page 2 of Chapter 4
4.1 THE ENERGY CONSERVATION ACT The planning process so far has been leaning heavily towards the supply side strategies. Efforts made to implement DSM, energy conservation and energy efficiency measures were symbolic, lacked continuity due to absence of a well knit institutional mechanism at the national and state levels. The 10thplan period (2002-07) is marked by enactment of the Energy Conservation Act, 2001 and setting up of the Bureau of Energy Efficiency (BEE) at the national level. The Act has given mandate to BEE to implement the provisions of the Act, and spearhead the improvement in energy efficiency of the economy through various regulatory and promotional measures. Some key activities that BEE is pursuing include the development of energy efficiency labels for refrigerators and other mass produced equipment, certification of energy managers and auditors, assisting industry in the benchmarking of their energy use, and energy audits of prominent government buildings. A beginning has been made by the State Governments in designating agencies to oversee implementation of the Energy Conservation Act and deliver energy efficiency services including through public-private partnership. BEE was provided with a one-time grant of Rs.50 Crores and it utilizes the interest earned on the same to institutionalize energy conservation activities by the Government of India. The Planning Commission in its recent report on an Integrated Energy Policy (IEP) laid out a vision of providing energy security to all citizens. IEP emphasizes energy efficiency & demand side management as essential components of the natural energy strategy. The Group report focuses on operationalizing and implementing the recommendations of the integrated energy policy. 4.2 ENERGY SAVING –TARGET AND ACHIEVEMENT OF 10TH PLAN 4.2.1 Energy Conservation Target The 10th Five Year Plan (2002-07) targeted energy savings of 95 BU(13% of estimated demand) in the industrial, agricultural, domestic and commercial sectors against the expected electricity demand of 719 BU in the terminal year of the Plan i.e. 2006-07. The 10th Plan highlighted the need for institutional arrangement to coordinate different programmes on energy conservation. It also stressed the mobilization of resources for funding the energy conservation programs. The 10th Plan however did not provide any specific budget allocation to meet and validate the energy saving targets. ( Planning Commission, Government of India (2006), Report of the Expert Committee on Integrated Energy Policy) 4.2.1 Energy Conservation in the 10th Plan Authentic and updated database is not available due to which it is difficult to assess the potential and achievements made. A rough attempt to assess energy savings achieved during 2002-05, puts this figure at 1170MW comprising of 508 MW from electric power savings achieved in industrial sector (participating units of National Energy Conservation Award for the years 2002-03, 03-04 and 04-05), 181 MW from supply side in Power Sector and 481 MW due to penetration of energy efficient CFL & 36W tube lights.

Demand Side Management & Energy Efficiency Working Group on Power for 11th Plan
Page 3 of Chapter 4
Authentic and updated database of energy consumption patterns and energy saving potential are not available for majority of the energy consuming sectors. The data availability is limited to a few units/sub-sectors based on some specific studies or interventions and thus can not be extrapolated to arrive at national figures. Such database is vital for providing direction to policy makers and other stakeholders with regard to augmentation of additional capacity requirements in generation and transmission. The centrally available database would also be useful for other stakeholders who are directly or indirectly involved in the end-use consuming sectors (industry, transport, buildings, agriculture). There is a need to develop and implement energy conservation programmes, setting up of energy saving targets and an effective monitoring of energy savings achievements periodically. 4.3 ENERGY CONSERVATION STRATEGY IN THE 11TH FIVE-YEAR PLAN The basic aim of the energy conservation strategy in the 11th Five Year Plan will be to prioritize and implement the provisions under the EC Act 2001 by decentralizing the energy conservation programmes at the State level. The strategy will strengthen the existing institutional linkages, and pursue the task of consolidating the energy conservation information, trends and achievements and create a market for energy conservation and for energy efficient goods and services. Keeping in view the provisions of the Act, an appropriate institutional mechanism and energy database will be developed in the 11th Plan by BEE. As a part of the mechanism, a fully dedicated ‘Energy Conservation Information Centre’ (ECIC) with Information Technology facilities will be set up within BEE and Central Energy Conservation Fund as mandated under EC Act will be established by the Government of India. 4.3.1 Energy Conservation and Information Centre (ECIC) at BEE Information/ database availability on sectoral/ sub-sectoral trends on energy consumption and energy conservation potential is not readily available at a centralized place for all the sectors of Indian economy. As mentioned earlier, this can be mainly attributed to the absence of any institutional mechanism that enables collection of the information from various users and then to undertake detailed analysis that can feed into decision-making processes at the policy level. Substantial resources (manpower, infrastructure, funds and time) will be required if the information on energy conservation related activities is to be made available at national level from a single source. Collection of such information is a mammoth task and requires systematic handling and coordination of efforts of various agencies. 4.3.2 Strengthening of BEE and SDAs In the 11th Five Year Plan, BEE will be strengthened as a nodal organization at the national level, and will be empowered to provide direction to the energy conservation programmes in the States. An appropriate institutional mechanism and a fully dedicated ‘Energy Conservation Information Centre’ (ECIC) will be set up within BEE to analyze energy consumption trends and monitor energy conservation achievements in the country on the basis of data received from the states through

Demand Side Management & Energy Efficiency Working Group on Power for 11th Plan
Page 4 of Chapter 4
State Development Agencies (SDAs, notified by the State Governments under the Act). BEE will also take the responsibility of disseminating information in the public domain. To carry out these tasks, BEE will be strengthened with additional professional staff and expertise. Supporting organizational set-up will also be strengthened at SDAs in various States and Union Territories (UTs). For this, a matching grant support from Central Government restricted to the contribution made by the respective States/UTs Governments will be extended to establish State Energy Conservation Fund as mandated under EC Act. To facilitate various functions of BEE and SDAs, a national level network of institutions will be developed by BEE. 4.3.3 Institutional Network BEE will strengthen its existing institutional linkages with SDAs, and formalize its association with various other national level institutions such as PCRA, NPC, TERI, CEA, energy centres in academic institutes/universities, etc. with a view to utilize their expertise and knowledge in the field of energy conservation. In its institutional network, BEE will also include a number of sector specific associations and research institutions, and private organizations in various states, and will delegate specific tasks to facilitate the implementation of energy conservation programmes. Funding support proposed is Rs. 320 Crores (for BEE Rs 150 Crores and for SDAs Rs. 170 Crores). Details are furnished in Cl.4.5. 4.3.4 Energy Conservation Programmes in the Targeted Sectors In the 11th Five Year Plan, BEE will focus energy conservation programmes in the following targeted sectors: 4.3.5 Targeted sectors
(a) Industrial Sector (Energy Intensive Industries). Industry sector offers maximum potential for energy conservation. The Government of India has recognized this when a number of energy intensive industries have been included as designated consumers in the EC Act. To bridge the efficiency gaps in the various units within the same industrial sub sector, BEE in association with SDAs, industry associations and research institutions, will develop 15 industry specific energy efficiency manuals/guides for the following sectors: Aluminum, Fertilizers, Iron &Steel, Cement, Pulp & Paper, Chlor Alkali, sugar, textile, chemicals, Railways, Port trust, Transport Sector ( industries and services), Petrochemical &Petroleum Refineries, Thermal Power Stations &hydel power stations , electricity transmission companies & distribution companies. The manuals will cover Specific energy consumption norms as required to be established under the EC Act, energy efficient process and technologies, best practices, case studies etc. Follow up activities will be undertaken in the States by SDAs. and manuals will be disseminated to all the concerned units in the industries.

Demand Side Management & Energy Efficiency Working Group on Power for 11th Plan
Page 5 of Chapter 4
Funding support proposed is Rs.21.8 Crores (BEE Rs.15 Crores and SDAs Rs. 6.8 Crores). Details are furnished in Cl.4.5 (b) Small and Medium Enterprises (SMEs) Many of the energy intensive SMEs clusters located in various states of the country are said to have large potential for energy savings. In quantitative terms, there is very little authentic information and data is available with respect to their energy consumption and energy saving opportunities. SDAs in consultation with BEE will initiate diagnostic studies in 25 number of SMEs clusters in the country, including 4-5 priority clusters in North East Region, and develop cluster specific energy efficiency manuals/booklets, and other documents to enhance energy conservation in SMEs. Clusters tentatively proposed for these activities are: Warn gal (AP) rice mills, Bhimavaram (AP) ice plants, Surat (Gujarat) textile, Jamnagar ( Gujarat) Brass, Jagadhri (Haryana) Plywood, Sambalpur (Orissa) rice mills, Bhubneshwar (Orissa) utensils, Pali (Rajsathan) textile, Jodhpur (Rajsathan) textile, Balhotra (Rajasthan) textile, Kota (Rajasthan) textile, Jaipur (Rajasthan) textile, Tripur (TN) textile, West Coast (TN) rice mill, Coimbatore (TN) foundry, Kanur (UP) textile, Bhadoi (UP) carpet, Bundre (UP) khandsari, Dehradun (Utranchal) Plywood, Howrah (WB) foundry , Agra (UP) foundry , Ferozabad (UP) Glass, Bodhjungnagar (Tripura) agri- processing, Kamrup (Assam) forest/agro based industry, Dibrugarh (Assam) light engineering , Dimapur (Nagaland) Timber-bamboo products Funding support proposed is Rs.19.3 Crores (BEE Rs.12.5 Crores and SDAs Rs. 6.8 Crores). Details are furnished in Cl.4.5 (c) Commercial Buildings and Establishments Government and public buildings constitute a very large sub-sector but so far very little organized efforts have been put in to save energy in the same. In the 11th Plan, BEE will initiate comprehensive studies in selected buildings/establishments such as office buildings, hotels, hospitals and shopping malls to prepare building specific energy efficiency manuals covering Specific energy consumption norms, energy efficient technologies, best practices, case studies, model energy performance contracts, model monitoring and verification protocol for implementation of ESCO projects etc. As a follow up, SDAs in association would initiate energy audits and their implementation in 10 Government buildings in each state and 1-2 buildings at UT level. BEE will also assist SDAs in the establishment and promulgation of energy conservation building codes (ECBC) in the States, and facilitate SDAs to adapt ECBC to the local conditions and make them ready for implementation at municipal levels. In addition, BEE will also strengthen a few test laboratories for testing of building materials and building utility systems for ECBC compliance. Funding support proposed is Rs.41 Crores (BEE Rs.14 Crores and SDAs Rs. 27 Crores). Details are furnished in Cl.4.5
Demand Side Management & Energy Efficiency Working Group on Power for 11th Plan
Page 6 of Chapter 4
(d) Residential/Domestic sector BEE has been working to introduce energy efficiency standards and labeling programme to facilitate consumers in selecting energy efficient domestic appliances. For promoting energy efficiency programmes in this sector, SDAs will actively involve Electric Utilities/ Distribution Companies. Emphasis would be to encourage the consumers to adopt energy efficient lighting systems, air conditioners, refrigerators, water heating systems and other domestic appliances. BEE will enlarge its on-going energy labeling programme for ‘frost free refrigerators’ and ‘tubular fluorescent lamps’ to 10 other appliances - Air conditioners , Ceiling Fans , Agricultural pump-sets , Electric motors ( general purpose) , CFLs, FTL – 61cm (2ft) , Television sets , Microwave ovens, Set top boxes , DVD players , Desk top monitors To facilitate this, 10 testing laboratories will be strengthened, and consumer awareness will be enhanced nation wide. Funding support proposed is Rs. 84 Crores (BEE Rs. 50 Crores and SDAs Rs. 34 Crores). Details are furnished in Cl.4.5 (e) Street Lighting & Municipal Water Pumping Street lighting and municipal water pumping put excessive pressure on electric utilities. Quite a few of studies/projects have been successfully demonstrated in some states. In the 11th Plan, such projects will be identified, documented and disseminated nation wide. Further, to promote such projects in various states, SDAs in association with State utilities will initiate pilot energy conservation projects in selected municipal water pumping systems and street lighting to provide basis for designing state level programmes. Funding support proposed is Rs.10.5 Crores (BEE Rs.2.0 Crores and SDAs Rs. 8.5 Crores). Details are furnished in Cl.4.5 (f) Agriculture Sector Increasing energy consumption trend is being seen in irrigation systems in the sector. Due to low power tariff for the sector in majority of the States, it is not in the farmers’ financial interest to buy efficient pumps, but it may be in the utility’s interest to promote their use. In the 11th Plan, SDAs will collect, document and disseminate information on successful projects implemented by some states, launch awareness campaign in all regional languages in print and electronic media and follow up work in initiating state level programmes along with utilities. SDAs with assistance of concerned institutions will also develop suitable energy conservation models which will take into consideration measures like introduction of subsidy in replacement of inefficient pump sets with efficient ones, power factor improvement by installation of capacitor banks, rebate for optimum usage of pumps, energy efficiency labeling of pumps, etc. These models will be subsequently

Demand Side Management & Energy Efficiency Working Group on Power for 11th Plan
Page 7 of Chapter 4
promoted through the electricity utilities/distribution companies and SDAs with involvement of State Regulatory Commissions. Funding support proposed is Rs. 10 Crores (BEE Rs.5.0 Crores and SDAs Rs 5.0 Crores). Details are furnished in Cl.4.5 (g) Transport Sector The sector is mainly dependent on the petroleum products. In the 11th Five-Year Plan, SDAs will develop linkages with State Road Transport Undertakings and private enterprises owning large fleet of trucks/buses to establish the status of energy consumption and conservation in the sector. SDAs with assistance of concerned institutions/agencies will conduct diagnostic studies to support urban bodies and transport research organizations in adopting multi modal public transport system which shall shift demand from personalized to public transport. SDAs will develop linkages with the state transport undertakings to establish the status of energy consumption and conservation potential and support studies to promote public transportation systems. BEE will also set up norms for specific fuel consumption for a few automobile and Transport models (Services/ Public transport). Funding support proposed is Rs 10.5 Crores (BEE Rs. 2.0 Crores and SDAs Rs 8.5 Crores). Details are furnished in Cl.4.5. 4.3.6 Demand Side Management Programmes DSM programmes driven by State Utilities has made a beginning in India, though these are yet to pick up momentum. In the 11th Plan, BEE in association with SDAs will facilitate State Utilities to pursue DSM options more intensely by focusing on the following:
• Orientation workshops for awareness building on DSM amongst the State Electricity Regulatory Commissions (SERCs) and the chief executives and senior engineers of utilities/ DISCOMs.
• Setting up of DSM cells in utilities to conceive and implement DSM programs. • Support load research and studies to rationalize the tariff structures to
encourage options such as time-of-use rates or interruptible rates to capture the needs and opportunities of different market segments.
• Initiation of DSM programmes especially in the sectors (such as residential, agricultural pumping, municipal water works & street lighting) where customers are paying tariff far below the marginal cost of power
• Utilization of private sector energy service providers to market DSM program to consumers to maximize uptake, participation and Implementation of DSM programmes through ESCO route
• Development of pilot tariff based incentive schemes to reward utilities/ DISCOMs through Megawatt (Watts saved) through Ministry of Power for Megawatt savings implemented (actual realized after implementation & verification by SERCs).
• Utilities that have established appropriate DSM cells would be rewarded by state electricity regulators for initiatives involved in DSM bidding, load research studies, impact monitoring while fixing tariffs.

Demand Side Management & Energy Efficiency Working Group on Power for 11th Plan
Page 8 of Chapter 4
• For supplementing DSM programs, supply side initiatives such as segregation of feeders, high voltage distribution system (HVDS), etc will be taken up with support under the state funding and other programs such as Accelerated Power Development and Reform Program (APDRP) on a case-to-case basis.
For DSM programs, Funding support proposed is Rs. 15 Crores (BEE and SDAs). Distribution companies are expected to be supported by electricity regulators through tariff fixation as well as use ESCO route for implementing the programs. Details are furnished in Cl.4.5 4.3.7 Human Resource Development Programmes There is a vast potential for energy savings through human intervention. BEE and SDAs have a major responsibility for stimulating a major change in the energy efficiency ethos and practices (energy modesty) by directing the national energy conservation campaign as a mass movement and seeking wide support. In the 11th Plan, BEE will continue with their campaigns. In addition Central government will partially fund the SDAs for their respective campaigns in the States. The following initiatives will be taken in the area of HRD:
I. Capacity building: a) Officials of BEE & SDAs in abroad/ India; b) Code officials from SDAs , urban & municipal bodies for promoting & enforcement of energy conservation building codes; c) Orientation programs every year for senior officials from Central & State Govt. departments to review the achievements, impediments and strategies to step up the tempo of energy conservation.
II. Capacity building for new breed of professionals: a) energy managers/auditors being developed under the EC Act from 2003 by BEE through National Certification Examination by offering Refresher training modules for life long training for Energy Auditors & Managers; b) Tutorial /help-line support for prospective candidates in the national examination for energy managers/auditors.
III. Demonstration centers in 2 industrial estates to show case and convince the entrepreneurs & plant engineers/technicians for industrial energy efficiency products /technologies
IV. Orientation workshops on energy efficiency for top management , middle level executives and shop floor operating personnel
V. Farmers training by display of energy efficient pump-sets & other relevant products
VI. Training to drivers in road transport on fuel efficient driving VII. Nationwide campaigns: a) through media; b) awareness programs for general
public & institutions in state capitals and other locations; c) painting competition for school children; d) Eco clubs activities for youth clubs
VIII. Introduction of the modules on energy efficiency/ DSM in the curricula of a) schools b) technical institutes engineering colleges c) other degree/ post graduate courses including MBA programs.
For HRD programs, funding support proposed for HRD programs to be administered by BEE and SDAs is Rs 110.4 Crores. Details are furnished in Table below:

Demand Side Management & Energy Efficiency Working Group on Power for 11th Plan
Page 9 of Chapter 4
Table 1 Fund Requirements during 11th plan - HRD for DSM, EE & EC
Sl No
Description Nos Rate Rs. Lakhs
Amount Rs. Cr.
Purpose
1
Capacity building
1a Capacity building of officials of BEE –alternate years abroad/ India
30 2 0.6
1b Training of State Nodal Agency officers (34)
102 2 2.04
1d Code officers’ training for ECBC
150 0.1 0.15
1e Orientation programs –Central Govt. officials
5 0.6 0.03
1 f Orientation programs –State Govt. officials
5 x 34 0.6 1.02
2a 2b
Refresher training and continuing education for Energy Auditors & Managers, Support for prospective candidates for energy managers/auditors
3000 10000
0.02 0.01
0.6 1.0
Partial funding
3 Knowledge Network through internet for implementation of Energy Efficiency-
Rs. 1 crore/year
100 5.0 Supplementary efforts to be reviewed every year.
3c Top Management awareness workshops
20 2.5 0.50 partial funding
3d Middle Management awareness workshops
100 programs
1 1.0 partial funding
3e Operator level Awareness & Training
100 programs
1.0 1.0 Partial funding
4 Energy efficiency demonstration centres
2 300 6.0 Additional support from industry also to be sought
5. Farmers training 30 events 5 1.5 Additional support from industry also to be sought
7. Drivers training 200 programs
0.5 1.0
8. Publicity campaigns to Every year 1700 85.0 sponsors to

Demand Side Management & Energy Efficiency Working Group on Power for 11th Plan
Page 10 of Chapter 4
create awareness in public & institutions, painting competition for school children, Eco clubs
supplement efforts also needed
9. Introduction of DSM, EE and EC concepts in School and College Curricula.
One project
400 4.0
Total 110.44 4.4 POLICY RESEARCH FOR ACCELERATING ADOPTION OF ENERGY
EFFICIENCY AND DSM PROGRAMS The energy conservation Act does not have specific provisions regarding an Energy Efficiency Policy Research. Such a program, however would complement the other provisions and thereby support the basic objective of the Act itself. Key among these includes legislative amendments, establishing norms, policy interventions including fiscal and non- fiscal measures. Among key result areas include: 4.4.1 Legislative measures So far, enforcement of the EC Act has not been pursued during the tenth five year plan. These efforts would have to be intensified during the eleventh five year plan. There is a perceived need to have a fresh look at the EC Act to review the implementation of various provisions. A review committee consisting of professionals, legal experts and concerned agencies /stake holders will be constituted by BEE to look into this. It may be established on a continuing basis with a mechanism to receive feedback from the stake holders on the EC act and suggestions for improvement. BEE will also adequately support the activities to establish &review energy consumption norms for the notified designated consumers. 4.4.2 Identify the barriers for improving energy efficiency and propose fiscal
and other measures Business firms often claim that that they do not have the financial means to implement the EC measures and consequently the government should provide financial assistance. Lack of access to capital, perceived uncertainty concerning savings, a high private discount rate and limited avenues to vet the energy efficiency measures and inadequacy of a reliable measurement and verification regime are the major barriers impeding implementation of energy efficiency projects. Customers are unwilling to invest their own funds in what is considered a “non-core” activity. Financial institutions are unfamiliar with energy efficiency investments and perceive them as risky. Energy services organizations are inadequately funded. Creation of an energy efficiency fund can provide needed resources to implement pilot or demonstration energy efficiency projects, help reduce risk perceptions, stimulate the ESCO market, and fund projects in the public sector.

Demand Side Management & Energy Efficiency Working Group on Power for 11th Plan
Page 11 of Chapter 4
Financing and information programs can play a central role in promotion of energy efficiency. To promote energy efficiency, there is an imperative need to create an appropriate set of incentives through pricing and other policy measures. For a chronically electricity-short situation, short-turnover-period technologies should be the primary candidates for implementation followed by the planting of energy efficiency seeds that will yield longer term benefits. Short term measures can be supported by public policy measures such as information & demonstration, standards and labeling, R&D, market transformation, taxes/tariffs. Long term measures can be fostered & promoted on business line by demonstration/pilots, Energy Performance Contracting in Govt. buildings, aggregation of projects (similar to approach being followed for bundling small CDM projects), demonstration/pilots and standard ESCO contracts. Financial institutions would be roped in for promoting ESCO businesses. Among non- fiscal measures may be award schemes similar to national energy conservation awards recognizing performing units. A rating scheme may also be evolved to rank the performance of units other than best performers and publicize the same to the share holders of the company. 4.4.3 Other strategies Among other strategies include the following: • Track emerging trends in energy efficient technologies and device plans to
support research, development and deployment by end users in the designated consumer and other sectors
• Encourage planners & regulators related to energy sector to adopt integrated resource planning in the entire value chain of activities, right from extraction or procurement, conversion to final end use.
• Rationalizing pricing for various forms/sources of energy to encourage promoting efficient choices and appropriate substitution in tune with the Electricity Policy, Tariff Policy and Rural Electrification (RE Policy ) of Govt. of India.
Funding support proposed for the policy measures is Rs 10 Crores (BEE). It does not include provision for fiscal measures. 4.5 BUDGET OUTLAY FOR THE 11TH PLAN The total budget requirement for a period of five years for the overall establishment and functioning of the identified activities/ projects on DSM, EE and EC has been estimated to be Rs 653 Crores and the details of the same are given below:

Demand Side Management & Energy Efficiency Working Group on Power for 11th Plan
Page 12 of Chapter 4
Funds Requirements - 11th Plan
Funds Requirements in Rs. Crores
No. Focus Area/Sector Activity
At BEE
At SDAs
Total
1. Strengthening of Institutional Set up in BEE and SDAs
Establishment of Central Energy Conservation Funds under EC Act Organizational strengthening of BEE, and Establishment of Energy Conservation and Information Centre (ECIC) within BEE Establishment of State level Energy Conservation Funds under EC Act
150 170 320
2 EC Programs in targeted sector A Industrial Sector
(Energy Intensive industries as covered in the EC Act)
Comprehensive Studies in 15 sub-sectors including development of specific energy consumption norms
15 6.8 21.8
B Small & Medium Enterprises
Comprehensive Studies in 25 clusters sub-sectors, including 3 clusters in North Eastern Region )
12.5 6.8 19.3
C Commercial Buildings & Establishments
Comprehensive Studies in commercial buildings covering office buildings, hotels, hospitals and shopping malls Expertise development of energy auditors, architects, builders, municipalities, etc for promotion /development of ECBC in states,
4
10
17
10
21
20
d Domestic/Residential Sectors
Undertaking of studies by SDAs to efficient appliances, labeling of 10 more appliances/equipment, Strengthening of 10 testing labs, Awareness campaigns on labeling program by BEE and SDAs
50 34 84

Demand Side Management & Energy Efficiency Working Group on Power for 11th Plan
Page 13 of Chapter 4
E Street lighting and Municipal water pumping
Dissemination of information on successful projects implemented by some of the states, Pilot energy audits and projects in states and follow up work in initiating and implementation of state level EC programmes
2 8.5 10.5
F Agriculture Sector Collection, documentation and dissemination of information on successful projects implemented by some states, launching of awareness campaign in all regional languages in print and electronic media and
5 5 10
G Transport Sector Setting up of norms for specific fuel consumption for automobile and Transport (Services/Public transport) and promotional studies for public transportation systems.
2 8.5 10.5
3. DSM PROGRAMS Orientation Programs for regulators & DISCOMs -, Design of pilot scheme for Negawatt savings for DISCOMs
15 (for BEE and
SDAs)
15
4. HRD PROGRAMS Orientation programmes for Government departments/ Ministries, Cadre for energy managers/auditors, Programmes and awareness campaigns for schools, colleges, farmers, NGOs, Public, industrial operators, drivers, etc. (Details at Table-1)
75(for BEE and
SDAs)
35 110.44
5 Policy Research
Policy Research for Accelerating Adoption of Energy Efficiency and DSM Programs
10 10
Total 350.5 301.6 653

Demand Side Management & Energy Efficiency Working Group on Power for 11th Plan
Page 14 of Chapter 4
4.6 RECOMMENDATIONS The target of additional electricity savings which may accrue to the national economy at the end of 11th Five year plan as a consequence of intensive energy conservation and DSM drive is expected to be about 5% of the anticipated energy consumption level in the beginning of 11th Plan. BEE will device a suitable mechanism for assessing these savings. The outlay for various strategies and programs as proposed is Rs. 652 Crores. Out of this proposed allocation, Rs 350.5 crs is the estimated requirement for BEE at the centre and the balance Rs. 301.6 crs as the assistance for strengthening the institutional structure at the State level for effective implementation of EC Act. These initiatives will also seek funding support from state governments, other complementary programs, user industry, financial institutions, and other donor agencies besides innovative financing options.
*******

Research & Development Working Group on Power for 11th Plan
Page 1 of Chapter 5
Chapter 5
RESEARCH & DEVELOPMENT
5.0 INTRODUCTION With the twin cries of depletion of energy resources and environmental pollution, it has become more crucial to develop efficient & clean power plants and their delivery system. These plants should be capable of effective utilization of resources such as coal, natural gas & other sources of energy. Thus, in order to meet India centric requirements, various sectors related to the field of energy have been identified for segregating different research avenues. The depletion of fuel resources has resulted into the need of exploring renewable power generation. Similarly, the application of distributed power generation may be useful for electrification of remotely located unelectrified villages. Apart from this, application of new technologies in the field of generation, transmission & distribution also needs to be given utmost emphasis. In view of the above, it is proposed to categorize the R&D initiatives into three different sectors, viz. Generation, Transmission and Distribution. Generation will have 7 Subgroups. Necessary emphasis is given to each sector. In each sector various technologies will be taken up for demonstration & development. The list of different sectors can be enumerated as below:
1. Generation Sector Thermal Hydro Fuel Environment Renewables Distributed Generation Nano materials
2. Transmission sector 3. Distribution sector
Considering that certain overlaps between different sectors such as fuel, environment and renewables are unavoidable, they have been put under one head of Generation. 5.1 OVERVIEW OF R&D R&D in the power sector is presently in the domain of following organizations: i) R&D wings of Corporations like the NTPC, NHPC, PGCIL and other units of the
Ministry of Power (MoP).

Research & development Working Group on Power for 11th Plan
Page 2 of Chapter 5
ii) Applied R&D under MoP schemes like RSoP, in-house Research projects of CPRI and the National Perspective Plan projects recommended recently.
iii) R&D laboratories of CSIR working on energy related areas and sponsored projects of DST.
iv) Industrial R&D by organizations like BHEL and other equipment manufacturers. In the generation sector commendable work has been done by NTPC and BHEL in the areas of stabilization of 210 and 500 MW units, development of pulverized coal fired boiler for coal with high ash content, efficiency improvement of Thermal Power Plants, control, instrumentation and loss minimization. Similarly in the hydro generation, BHEL, NHPC and other hydro utilities have contributed in uprating of old units, improving turbine design etc. In transmission, PGCIL and BHEL have introduced many new technologies like Series Compensation, Thyristor Controlled Series Capacitor, Controlled Shunt Reactor, etc. PGCIL have contributed to the development of high temperature conductors, development of insulators, introduction of 800kV AC and planning for ± 800 kV DC first time in the country. Many of the developments by PGCIL and NTPC have come through project route in the county and although their R&D units have not shown substantial expenditure on R&D, the organizations have encouraged new technology. It is noticed that where as some of the available technology abroad are being introduced in the country, commensurate R&D efforts to get it improved and sustained through available inhouse resources, has not been pursued. As a result, there is no technology breakthrough that has actually taken place in power sector through indigenous route. 5.2 TECHNOLOGY DEVELOPMENT IN POWER SECTOR The in-house R&D setups of major utilities like NTPC, NHPC and PGCIL address introduction and absorption of new technology primarily through project routes. Major manufacturers like BHEL, Crompton Greaves have their own R&D set up, focusing on product development. Central Power Research Institute (CPRI) is provided with capital funds from the Ministry of Power for inhouse research as well as disbursement of research funds to utilities, industries and academic institution. Central Electricity Authority has a role in identification of appropriate new technology for the country. Recently a few projects under National Perspective Plan on R&D have been taken up which are collaborative research projects involving more than one organisation. The R&D policy of the Government is to promote R&D projects that help the nation to become self reliant in technology. R&D by the PSUs has so far been at a low level. It is only in late 10th Five Year Plan NTPC and PGCIL have taken up a few good research projects mainly oriented towards performance improvement of generating stations and National grid. Government initiative in the distribution under APDRP scheme and in the area of renewables has initiated good research work by many organizations involving academia, utilities, NGOs, equipment suppliers and research laboratories. This spur in R&D in the field of distribution of power which is attributed to a large investment in this area could also pave way for higher R&D initiative in transmission and generation.

Research & Development Working Group on Power for 11th Plan
Page 3 of Chapter 5
Looking at the R&D expenditure in India it is learnt that the R&D expenditure by organizations like the NTPC with turn over of more than Rs.28000 crore and profit above Rs. 6000 crore is less than Rs.7 crore in last 2 years. PGCIL’s R&D expenditure is still less. BHEL has been spending on R&D 1.0% of its turn over for the last 2 to 3 years and plans to increase it to 1.5% The expenditure by CPRI in the Xth Plan is around Rs. 67 crore. The RGGVY scheme of MOP launched in 2005 has earmarked Rs.160 crore amounting to Rs.1% of scheme cost, for enabling activities including technology development. The expenditure on R&D incurred by Coal India Ltd. during the X Plan was Rs.7.5 crore and none of the work undertaken by it was related to Power Sector. 5.3 IDENTIFIED PROJECTS FOR 11TH PLAN BY CENTRAL UTILITIES
An interaction was made with NTPC, BHEL, PGCIL, DSIR to find out their R&D plan for the XI Plan period. The projects identified by Central Sector Units viz. NTPC, Powergrid, BHEL and CSIR are listed below: NTPC has identified a few projects for inhouse research where they would involve other research institutes like BARC, CPRI, CSIR and other consulting houses. The list of projects identified by NTPC is as follows:
1. Development of Flue gas heat recovery system for a 200 MW Unit. 2. IGCC technology demonstration project. 3. Development of Automated boiler tube inspection system (robotics
application). 4. On line condition monitoring of power transformers. 5. Modelling & design of natural draft cooling tower assisted flue gas
dispersion. 6. Technology demonstration for suitable capacity solar (Thermal). 7. Development of 10 KW sterling engine based TDP suitable for distributed
generation. PGCIL has also identified a number of inhouse projects for research which are as follows:
1. Technology Development for +/- 800 kV HVDC system for transfer of 6000 MW power from NER to NR
2. Aerial route survey using Air borne laser terrain (ALTM) along with National Remote Sensing Agency (NRSAR)
3. Development of High surge impedance loading line (HSIL) – 400 kV Purnea – Biharshariff D/C
4. Development of Fault current limiter at 400 kV level 5. Indigenization of polymer insulator 6. Specification of suitable oil for transformer 7. Intelligent grid 8. Design of Converter transformer 9. Development of Converter transformer-less HVDC system 10. Development of 1000 / 1200 kV EHVAC 11. Residual life assessment of transmission system

Research & development Working Group on Power for 11th Plan
Page 4 of Chapter 5
12. Indigenous development of GIS 13. Real time digital simulator and studies 14. Indigenous development of high strength insulators like 320 / 420 kV AC &
HVDC 15. Development of 400kV compact line 16. Lightening mapping
BHEL has identified a few broad based projects in generation, transmission and distribution which are given as under: 1. Clean coal technologies. 2. Super critical boilers. 3. Ultra High Voltage Equipment. 4. IGBT based drives and controls.
The laboratories of CSIR who also carry out basic and applied research have identified following inhouse research programmes related to Power Sector for the 11th plan:
1. R&D on Photovoltaics and other solar energy applications (NPL, New
Delhi) 2. Energy for cleaner and greener environment (CECRI, Karaikudi). 3. Bio energy technology: Strategy designing of Jatropha curcas for bio
diesel (NBRI). 4. Development of gas to liquid (GTL) processes for fuels (NCL). 5. Hydrogen economy initiative (NCL, Pune). 6. Development of coal to liquid (CTL) technology for synthesis of liquid from
hydrocarbons (CFRI, Dhanabad). 7. Development of a composite approach suitable for clean coal initiatives
(CMRI, Dhanabad). 8. Development of Underground coal gasification and IGCC Technology in
India (CMRI, Dhanabad).
5.4 R&D PROJECT PROVISIONS AND TEST FACILITIES FOR CPRI
CPRI, Bangalore has proposed various in-house & collaborative research activities. Budget allocation for carrying out such functions & developing a world class test labs along with the enabling infrastructure has already been proposed. CPRI proposes an allocation in the range of Rs. 731 crores to be made available in 11Ith Five Year Plan. The detailed break up is:

Research & Development Working Group on Power for 11th Plan
Page 5 of Chapter 5
5.4.1 Need for restructuring of CPRI CPRI was established to work as a nodal agency for power sector research but had a larger role assigned to work as a neutral testing laboratory. Although the organisation has contributed to encourage R&D in utilities, academic institutions and in its own laboratories, it has not been able to build up resources to work as a driver of R&D in the power sector. It is recommended that a restructuring of CPRI is necessary if it has to play a proactive role in collaborative research in the country. For this the following are suggested:
a) Testing has to sustain on its own and as far as possible government grant should not be utilized for meeting test facility requirements. The beneficiaries of test facility, i.e., the manufacturing units and utilities should largely bear this burden.
b) CPRI should be corporatised to reduce its dependence on Government
funding and have better operational flexibility. This would help CPRI to be competitive and self reliant. The major utilities like NTPC, PGCIL, NHPC and PFC should come forward to make it happen.
c) CPRI is to develop its ability to enhance industrial & system related
consultancy work and get more sponsored projects for improving its financial health.
5.5 MAJOR PROJECT PROPOSALS FOR 11TH FIVE YEAR PLAN 5.5.1 IGCC Technology IGCC technology, using coal gasification, allows the environmental benefits of a natural gas fueled plant and the thermal performance of a combined cycle. Coal is gasified with either oxygen or air and the resulting synthesis gas (or syn. Gas) consisting primarily of hydrogen and carbon monoxide is cooled, cleaned and fired in
A Investment on Dielectric Material, Diagnostic Testing & Simulation Techniques
Rs. 25.80 crores
B R&D Projects (In-house, RSoP and National PowerPlan)
Rs. 61.20 crores
C Facility addition to upgrade laboratories to test 400 kV breakers, etc.
Rs. 94.00 crores
D Expenditure on Spill over schemes from X Plan Rs. 36.00 crores E High Power Test Facility Addition and Creation
of new facilities of CPRI Rs.514.00 crores
F Upgradation of Ultra High Voltage Test Facility at Hyderabad
Rs.30.00 crores
Total Rs.761.00 crores

Research & development Working Group on Power for 11th Plan
Page 6 of Chapter 5
a gas turbine. The hot exhaust from the gas turbine feeds a heat recovery steam generator (HRSG) where it produces steam that drives a steam turbine.
IGCC plants are reported to work well with bituminous coals (262 MW Wabash River, 250 MW Tampa USA and others). Other features are high sulphur removal, total volatile mercury removal, production of 40% lesser solid -products by and consume 40% less water compared to PC plants. Entrained flow gasifiers are used in IGCC plants abroad, which deliberately operates in the higher temperature slagging regime to avoid tar formation.
Further it is noted from the reports that Wabash River IGCC plant showed a drop in the performance owing to reduction in fuel quality to sub-bituminous and lignite variety. The moisture content in the coal seems to play a role in slurry concentration combined with the increased ash content in the lower rank coals. The energy density of the slurry deteriorates markedly. Generally, it is felt that there is a greater need to demonstrate and improve the performance of IGCC for low rank sub-bituminous coal. While entrained flow gasifier appears to accommodate all ranks of coal there is a marked increase in cost and reduction in performance with low rank and high ash coals.
For Indian conditions pressurized fludized bed gasification is preferred. Efforts are in progress in the country for the development of125 MW IGCC Unit (gross efficiency 39.5%). The technical approach to scale up is yet to be established and the commercial utility size IGCC Unit is likely to be operational by 2011. One IGCC Project on this route has already been launched and it is recommended that it should be speeded up, by NTPC with its own funds.
5.5.2 Steam Generator Condition Assessment Model Through Neutron
Activation Techniques The objective of the proposal is to development of a comprehensive Boiler Condition & Performance Assessment. Boiler Condition asessment shall be done through a combinatorial program of Neutron Activation Technique, Electro-Mechanical Acoustic Transducer, Fiber Optic embedded Raman Scattering Technique. The entire proposal is to be executed in an integrated manner. The nature of the project is such that the elements mentioned below are neither modular nor discreete, rather they are intrinsically intermingled and interdependent and hence cannot be taken up in a serial manner. Though interdependent, the main elements of technology development in the project shall be following: It would involve complete, identify the required competence areas and potential collaborating institutes for each of the following technologies and initiation of its execution:
i. Neutron Activated Tomography for scanning of Boiler Tube Thickness. ii. Electro-Mechanical Acoustic Transducer based scanning of Boiler Tube
Thickness. iii. Fiber Optic embedded Raman Scattering Technique or any other
alternate technology for scanning of Boiler Tube Metal Temperature. iv. Neutron Activation based combustion visualization technology.

Research & Development Working Group on Power for 11th Plan
Page 7 of Chapter 5
Technologies are available for boiler condition assessment. However the major issue involved is to make it suitable & approachable, when it comes to real life situation in a boiler. The main deliverable for the project is to demonstrate these technologies in an integrated manner for true assessment of boiler condition. 5.5.3 Advanced RLA methodologies (Robotic corrosion mapping, phased
array technology, remote eddy current, temper embrittlement and electro magnetic acoustic transducers)
Robotic based Corrosion mapping system for water wall tubes through Magnetic Inductance Bridge based robotic system. The water wall tubes in the primary pass of thermal power plant boiler are subjected to severe corrosion problems especially in the burner zones leading to loss in thickness. The wall thickness of each tube needs to be monitored during annual shutdown periods for ascertaining their suitability for continued service and schedule for replacement if necessary. In view of the short shut down periods, it is not possible to measure the thickness of all tubes using conventional ultrasonic technique. In a robotic based system, the probe/magnetizing coil is supported on robotic device which can crawl along the whole length of the water wall tubes and maps the corrosion thickness. The high temperature boiler tube during service forms coherent oxide layer on the outer surface due to oxidation. The presence of this oxide layer on the outside of tubes interferes with ultrasonic wall thickness measurement and prevents proper sound coupling during conventional UT technique. The application of EMAT probes permits enables direct measurement without any surface cleaning of the boiler. When coupled with a robotic device, large no. of tubes and different elevations can be covered in a short shut down period.
Phased array technique is a specialized type of testing that utilizes multi element array transducers and software controls for steering the ultrasonic beam. In view of complexity in shape & geometry of component of turbine components such as blades, rotor steeple and disk rim attachments, the conventional techniques suffer by reliability, accuracy & reproducibility. The advanced linear phased array ultrasonic technology wherein multiple UT probes mounted in a single holder is used to for this purpose and reported that the reliable and redundant results can be obtained in respect of defect detection, sizing and shape.
HP / IP rotors suffer in-service degradation from rotor material temper embrittlement. The rotor material fracture toughness, which governs the size of the critical flaw for fracture, is hence adversely affected. A reliable assessment of the fracture toughness properties of steam turbine rotor requires sampling of material from in-service rotor. A miniature sample removal and small punch testing technique for direct estimation of fracture toughness provides a rational basis for reduction of conservatism during RLA of rotor. The remote eddy current/CCTV system is capable of examining the trailing and attachment areas of L-0 and L-1 turbine blades without turbine disassembly. Eddy current tests have also been successfully used to detect cracks in the area of the satellite wear strips on the leading edge of last stage blades and for inspection of

Research & development Working Group on Power for 11th Plan
Page 8 of Chapter 5
turbine casing bolt and bolt holes. Critical turbine components must be evaluated to assure safe operation during their lifetime. The adoption of advanced RLA methodologies leads to the emergence of sophisticated practice in RLA with reliable and upgraded assessment technologies in the short time available during periodic maintenance, application of Robotics, improved deterministic routes and evolution of technology options. The project envisages development of state-of-art technology in the area and adopts them in a few thermal power stations. The project will support a number of spin off research in the related area. 5.5.4 Combustion modeling and technologies for utilization of fly ash
unburnt carbon in pressurized fluidized bed gasifier The objective of the project is to demonstrate pressurized fluidized bed char combustor in a pilot scale facility & to explore other ways of separating char from fly ash of pressurized fluidized bed gasifier. Pressurized fluidized bed gasifier operating in a bubbling mode normally gives lower carbon conversion efficiency in the range of 90-91% only. The attributing factors are particle attrition & elutriation from the bed. Freeboard reaction is normally limited due to dearth of oxidant resulting in 15% combustibles in fly ash. The fly ash recycling is another option to reduce the overall combustible in ash. For high ash Indian coal, large amount of ash recycling is always a big threat in a pressurized system. Another option is to separate char from fly ash & utilize the char in a separate furnace. Various separation methodologies are still in developmental stage only. Tribo-electrostatic separation, & dry fluidization separation are among few technologies, which have been tried so far. However research work needs to be carried for demonstration of such technologies for Indian coal.
The third option is to put the fly ash in a pressurized fluidized bed combustor to produce steam & the hot gases i.e. a mixture of nitrogen & carbon dioxide at around 1000C can be reintroduced back to main gasifier. The heat carried over with the flue gas will sustain the endothermic reaction & carbon dioxide can be used as a gasifying agent in the gasification process.
The project would have deliverables in three stages. Modelling of the char combustor with actual fly ash constituent as an input would be the first deliverable. Next would be a development of a bench scale pressurized char combustor & final will be its integration with main gasifier.
The cost of the project has been estimated as 19 crores & project is expected to be completed in six years.

Research & Development Working Group on Power for 11th Plan
Page 9 of Chapter 5
5.5.5 Carbon Dioxide Storage In Geological Formations The objective of the project is to study the possibility of long-term storage of CO2 in geological formations such as basalt & other sedimentary rocks for CO2 sequestration. Global warming, due to CO2 emission from different anthropogenic activities including power plants is one of the major environmental problems, the world is facing today. Carbon sequestration, consists of CO2 capture, transport and permanent storage, is one of the pathways to contain CO2 emission. Establishment of environmentally safe and permanent storage of CO2 is a major issue of the whole carbon sequestration activity. Geological storage is considered to be most available and safe for long term CO2 storage. CO2 storage in basalt or sedimentary formation will be explored to demonstrate the possibility of CO2 storage in these formations. Initially noninvasive technologies like 2D/3D & MT studies, bore hole sampling, physical and chemical characterization of formations, kinetic studies, wire logging for temperature & pressure profile, geological modelling etc. will be carried out to establish the feasibility of CO2 storage in the identified formation. Subsequently CO2 will be injected at appropriate depth through bore hole and the movement of injected CO2 will be monitored through surface and subsurface measurement. Detailed modelling will be carried to predict the fate of CO2 in geological storage system in long term. Final deliverable for the project would be to demonstrate the process in field. The cost of the project will approximately be 15 crores & duration is expected to be seven years. 5.5.6 Value Added Products Technology For Fly Ash Utilization The establishment of technology demonstration and production centers for value added products from fly ash at six thermal power plants in India shall involve introduction of state of art plant and machinery for manufacture of fly ash based building products to demonstrate the techno economic viability for commercialization. Certain separation and beneficiation facilities are also proposed to be established for the benefit of power plants in terms of adding value to fly ash as a raw material, which will lead to sale of fly ash as a commodity to various user industries. Facilities are also planned at these centres, to ensure quality assurance of fly ash products. The six centres proposed shall be at Ennore Thermal Power Station, Tamil Nadu, Vijayawada Thermal Power Station, Andhra Pradesh, Wanakbori Thermal Power Station, Gujarat, Koradi Thermal Power Station, Maharashtra, Badarpur Thermal Power Station, Delhi and Ropar Thermal Power Station, Punjab. The implementation of the project will lead to dissemination of home grown technologies and showcasing of product centers, revealing the features of fly ash products, promoting widespread use of indigenous plant and machinery, promoting energy efficient building concepts with fly ash products leading to zero energy philosophy. Industry – Institute interactions for entrepreneur development, awareness, training programmes and workshops, organized from time to time at

Research & development Working Group on Power for 11th Plan
Page 10 of Chapter 5
these centers will lead to promoting environment friendly value added utilization of fly ash in India.
5.5.7 Fuel Cells: Demonstration Of Direct Alcohol/ Polymer Electrolyte Fuel
Cell Plant There are many technical challenges, the fuel cell R&D work must cover wide application in distributed generation market, embodying co-generation. The positive technological implications, which would create the tendency towards more economical fuel cell systems, hold the key. Further the significant technical challenges with regard to integrating fuel cell system with available infrastructure, reducing the capital cost through volume manufacturing and achieving widespread use in various sectors needs to be addressed. The key points to be addressed regarding cost reduction include (i) materials, (ii) complexity of integrated systems, (iii) temperature constraints, (iv) manufacturing processes, (v) power density (footprint reduction), and (vi) benefit from economies of scale (volume) through increased market penetration. Under fuel flexibility the R & D topics are (i) non-traditional fuel storage (H2), (ii) transportation fuel reforming, (iii) renewable fuels processing (reforming, gasifying, clean-up), (iv) biogas operation, and (v) tolerance to gas supply variation. Further, the RD & D occurring today for specific systems and system integration include (i) power inventers, (ii) power conditioners, (iii) hybrid system designs, (iv) hybrid system integration and testing, (v) operation and maintenance issues, and (vi) robust controls for integrated systems. Direct Alcohol –methanol based fuel cells are of interest as a future source of power, because of two reasons. These are in early stages of development. Firstly methanol is easier to transport, distribute and store than hydrogen. Secondly , when produced from biomass sources it is almost CO2 neutral to the environment. These are an excellent candidate for very small to mid-sized applications, such as cellular phones, PCs up to automobile power plants.The challenges in R&D are both at the level of system integration and also at the more fundamental level of researching better catalysts and membranes that are less leaky to the methanol. Cost optimization is also needed. Improvements are needed in expensive catalysts presently used. The R&D project shall address these concerns by using a multi-disciplinary effort and suitable networking with CSIR labs and institutions abroad. The project includes integration of a two/five kW output fuel cell stack and its evaluation under various practical environmental conditions.
5.5.8 Distributed Generation Although substantial development is being carried out in various institutions with support from MNES and a number of designs based on biomass gasification, bio fuels, are available, the penetration into the India market has been poor. Small units of distributed generation in unit sizes of 10 – 20 kW shall be able to complement village electrification but cannot be a stand alone reliable source of power supply. In order to contribute to power sector, the size has to be up to 0.5 - 1 MW which would need to have connection to the grid. For large scale use of distributed generation using biomass gasification as primary method and its integration with other generation based on solar, diesel and grid, the scaling up issues, reliability issues, capacity building, revenue models, fuel linkages, etc. are to be addressed at a much larger scale.

Research & Development Working Group on Power for 11th Plan
Page 11 of Chapter 5
It is proposed to have a 2 stage implementation strategy during the. 11th Five Year Plan. At the end of 1st year of 11th Plan, the package solution to ‘Distributed Generation’ will be found for different alternatives which will suit the rural resource base (including solar energy). Five demonstration projects will be made fully functional with 100 to 1000 kW rating by end of 3rd year. The R&D will address biomass generator efficiency improvement, biomass gasification, solar, diesel and grid connectivity and optimum use of the option for energy saving. The issues of fuel linkage and maintenance would also be addressed. The project shall support a number of small prototypes taken on experimental basis depending on R&D content. IIT, Guwahati and NIT, Silchar shall be associated in engineering and research activities of projects for North-East. The R&D programme in 1st stage would be a confidence building exercise to refine and optimize the technology which would lead to mass production in 2nd stage. Following schemes shall be designed and demonstrated:
1) Stand alone Biomass based generation 2) Biomass based generation connected to the grid 3) Biomass based generation that can be integrated with solar-PV, solar thermal
based or diesel based generation by a suitable micro or mini grid. The above would have the benefits of being able to provide access to electricity, depending on local conditions in rural areas. A group of five to ten Distributed Generation units spread over different villages that are reasonably close together would form a cluster. This is aimed at providing necessary technology and service support to the individual villages. The service cum technology centre for a cluster would have necessary skilled manpower, tools instruments and spares. Good monitoring of individual projects during installation, and commissioning to achieve sustained operation would also be done. This approach is considered essential for the success of the programme. Typical project cost is between Rs. 2 crore to Rs. 20 crore and the total allocation for this scheme is estimated to be Rs. 75 crore. 5.5.9 Nano Material Applications – For Power Sector Research on Nano materials in various fields of science is promising and needs to be directed towards practical and useful application. This project will be exploratory in nature to promote research in Nano materials for power system applications. Application – 1 Super Capacitors : High energy storage compact super- capacitors are available for small energy long duration applications. It is expected that larger size capacitors would be available in market. Large number of capacitors in series and parallel can work for energy storage devices in voltage source converters which has a large number of application. In larger sizes, these capacitors can be substituted for super conducting magnetic energy storage devices (SMES) for providing grid stability.

Research & development Working Group on Power for 11th Plan
Page 12 of Chapter 5
Application - 2 Carbon fibers reinforced aluminum conductors for transmission line application could be promising for high temperature application. Research needs to be promoted in this areas. Application – 3 Nano Composite Polymer and Ceramic research - In ceramic and polymer applications use of additives shows promise. Research in this area should be focused to practical power system application such as high strength ceramic insulators, dielectric material with high dielectric control for capacitors etc. Ceramic based nano material paint can work better than photo voltaic cells for solar power generation. Nano materials hold promise in CO2 capturing and sequestration. Application – 4 MEMS and Sensors – Nano material application in sensor development has shown promise. Sensors of all types, temperature, pressure, strain gauges andfor electrical qualities can have much better efficiency using nano materials. Research in these areas have to be promoted and directed to Power System application. Although good work is being carried out in IITs and IISc the funding is too meagre to support useful research. The production technology of nano material is complicated and equipments are expensive. Unless high quality research is carried the institutions having good infra structure, the impact of the technology will not be substantial As knowledge in nano science grows, application in thermal power engineering ash handling, environment control, un-burnt carbon detection, etc. can be increased. Although Science & Technology Department would be focusing on Nano material research, it is felt that MoP should contribute to give it an application orientation. A budget of Rs.100 crores is proposed in the 11th Plan for supporting Nano materials research for power system applications. 5.5.10 Advanced Power Electronics Technologies for Transmission There are a number of technologies under FACTS controllers which provide flexibility to power transmission and are considered important in view of open access being introduced. We have in India TCSC (Thyrister Controlled Series Compensation) already introduced. Other promising technologies are:
i. Static Synchronous Series Capacitor (SSSC)
ii. Static Compensator (STATCOM)
iii. Unified Power Flow Controller (UPFC)
iv. Thyrister Controlled Phase Angle Regulator (TCPAR)

Research & Development Working Group on Power for 11th Plan
Page 13 of Chapter 5
The design of equipments, controllers for these devices need extensive research. One major demonstration project is recommended to be taken up on R&D route with private participation. 5.5.11 AC/ DC Microgrid Demonstration Project By Deploying Various
Distributed Energy Sources, Energy Storage Systems, Communication Systems, AMR, DVR, STATCOM, HVDC Light
Distributed power generation system is emerging as a complementary infrastructure to the traditional central power plants. This infrastructure is constructed on the basis of decentralized generation of electricity close to consumption sites using Distributed Generation (DG) sources. The increase in DG penetration depth and the presence of multiple DG units in electrical proximity to one another have brought about the concept of the micro-grid. A micro-grid is a portion of a power system which includes one or more DG units capable of operating either in parallel with or independent from a large utility grid, while providing continuous power to multiple loads and end-users. The idea supporting the formulation of the micro-grid is that a paradigm consisting of multiple generators and aggregated loads is far more reliable and economical than a single generator serving a single load. India being geographically diverse country with habitation spread over all kind terrains such as, hilly inaccessible areas, desert lands, small islands etc, providing reliable power at affordable price is a challenging task. At the same time, India is endowed with different kinds of renewable sources like solar, hydro, bio-mass etc. Micro grid system encompassing locally available one or more resources for power generation could offer possible solution to the challenges of a nation to provide energy to the remote locations.
The demonstration micro-grid project would also include energy storage systems to supply power to critical loads and also for emergency system start-up power. These projects incorporating concepts of microgrid would include suitable communication system required for AMR. Research on AMR technology is needed to optimize cost of overall distribution system.
The advantages of VSC based HVDC system can be best utilized for applications like:
Deep river crossings Power supply to isolated loads (supply to distant town, mine, island or even
production platform in the sea needing power from main land), Feeding Power from small isolated generation (wind, small hydro, tidal solar
etc.) to a grid or to a separate load without affecting power quality of receiving network.
The implementation of technology developed in the area of power distribution is also envisaged. Here, power electronics devices such as DVR, STATCOM etc. based on VSC based converters would be developed. These would be included in the feeders to improve power quality. These demonstration systems would have suitable AMR

Research & development Working Group on Power for 11th Plan
Page 14 of Chapter 5
system to monitor energy supplied to customers. The deliverables from the project would result in demonstration of high quality power distribution systems. The selection and development of suitable power electronics devices and a field show casing as stated above forms an integral part of the project. The project would pave the way for design of future rural energy network, where distributed generation sources are likely to be deployed and would act as a benchmark. 5.6 SHORT LISTED SHORT TERM & LONG TERM PROJECTS The projects identified to be taken for R&D during the 11th Plan are;
Sr. No
Project Definition Sector Duration
of the project
Budget (in
Crores)1 GENERATION SECTOR 333.50
A THERMAL GENERATION
1.1 Generation technology, Fuels and
Environment
1.1
Development of sensor systems for online fuel calorific value & unburnt carbon in ash measurement(Deployment in 5 units)
Generation Thermal
Short term 3 *
1.2
Steam Generator condition assessment model through neutron activation techniques
Generation Thermal
Long term 20 *
1.3
Development of desalination technology with LP exhaust steam/ Solar heat source (10 cubic m/hr)
Generation Thermal
Short term 16 *
1.4
Advanced RLA methodologies (Robotic based corrosion mapping system – Phased array ultrasonic technique – Hydrogen embrittlement –Remote eddy current technique – Temper embrittlement of rotors – Electromagnetic Acoustic Transducers for boiler inspection )
Generation Thermal
Long term 25 *
B
HYDRO SECTOR
1.5 Excavation of large size Caverns with
appropriate stabilization technology Generation
Hydro Short term 1.5*

Research & Development Working Group on Power for 11th Plan
Page 15 of Chapter 5
Sr. No
Project Definition Sector Duration
of the project
Budget (in
Crores)
1.6 Soft rock tunneling Generation Hydro
Short term 1.5*
1.7
Application of GIS / GPS in river inflow / discharge measurements, flood forecasting, etc.
Generation Hydro
Short term 1.5*
C
FUELS AREA
1.8
Combustion modeling and technologies for utilizing unburnt carbon in ash in PFB gasification
Fuel Long term 19*
1.9
Development of multiple feed conditioning system for biomass fired boiler
Fuel Short term 2*
1.10
Advanced circulating pressurized fluidized bed gasifier
Fuel Long term 10*
D
ENVIRONMENTAL AREA
1.11
Technology development of flue gas desulphurization system for NE high sulphur coal through electron beam (SO2 to SO3 conversion)
Environment Short Term 6*
1.12
CO2 storage in geological formations like Basalt and Sedimentary rocks
Environment Long term 15*
1.13
Value added products technology demonstration and 6 production centers for fly ash utilization(Production technology, state of art plant and machinery, fly ash beneficiation schemes, quality assurance measures)
Environment Long Term 20*
1.14
Emission control technologies for NOx, SOx
Environment Short Term 3*
E RENEWABLES AREA 1.15
Demonstration of direct alcohol/polymer electrolyte fuel cell plant(5 kw/2kw) and exploratory work
Renewables Short term 3*

Research & development Working Group on Power for 11th Plan
Page 16 of Chapter 5
Sr. No
Project Definition Sector Duration
of the project
Budget (in
Crores)on Deep coal beneficiation and Ultra Super Critical Technology
1.16
Demonstration of LED lighting for rural electrification of one model village
Renewables Short term 1*
1.17
Solar bio photovoltaic cells for generation of Hydrogen, methane using hybrid organic / inorganic system
Renewables Long term 10*
1.18 Development of geothermal power generation technology Renewables Long
term 1*
1.19 Distributed Generation – Major Project Distributed
Generation Long term 75.00
F NANOMATERIAL APPLICATIONS FOR POWER SECTOR Material Long
term 100.00
2
TRANSMISSION
70.00
2.1 Wide area measurements for grid protection & control Transmission Long
term 10*
2.2
Testing and simulation laboratory for SCADA (Complying with IEEE 61850) & demonstration projects
Transmission Short term 7.5*
2.3
Development of online monitoring systems for substation equipments (like transformers, breakers, CTs, etc.) to get early warning of failures
Transmission Short term 4*
2.4
Advanced power electronic technologies for transmission
Transmission Long Term 48.5*
3 DISTRIBUTION 25
3.1
AC / DC Micro-grid demonstration project by deploying various distributed energy resources, energy storage systems, communication systems, AMR, HVDC light, DVR, STATCOM, etc. for improving reliability and power quality
Distribution Long term 20*

Research & Development Working Group on Power for 11th Plan
Page 17 of Chapter 5
Sr. No
Project Definition Sector Duration
of the project
Budget (in
Crores)
3.2
Energy storage schemes for improving the reliability of sensitive loads
Distribution Short term 5*
NOTE: figures in last column with suffix * indicates sub components of the budget indicated for the area of research.
New Projects yet to be identified : Rs. 24.00 crores
SUMMARY
Total for Generation : Rs.333.50 crores Total for Transmission : Rs. 70.00 crores Total for Distribution : Rs. 25.00 crores New Projects yet to be identified : Rs. 24.00 crores Total : Rs.452.50 crores 5.7 R&D FUNDING R&D expenditures of some major utilities and manufacturers in the field of power are indicated below: It may be observed that most of the organizations spend between 1.8 to 6% of net sales on R&D depending upon the nature of their business. Compared to this, the R&D expenditure in India is very low.
Company 2003 2004 2005
R & D Exp Net sales
% of R&D Exp
R & D Exp Net sales
% of R&D Exp R & D Exp Net sales % of R&D
Exp
GE (billion Dollar) 2.7 149.7 1.80 3.091 154.481 2.00 3.425 122.886 2.79
Siemens (Billion Euro) 4.73 69.77 6.78 4.65 70.23 6.62 5.155 75.455 6.83
Company 2003-04 2004-05 2005-2006
R & D Exp Net sales % of R&D
Exp R & D Exp Net sales
% of R&D Exp R & D Exp Net sales % of R&D
Exp Alstom (million Euro) 473 16688 2.834 405 12920 3.13 365 13413 2.72
Hitachi ( billion Yen) 371.8 8632.4 4.307 388.6 9027 4.305 405 9464.8 4.279
Mitsubishi Electric (million Yen) 136518 3309651 4.125 130548 3410685 3.828 130629 3604185 3.624
BHEL (million Rupee) 1041 103364 1.007 1252 103364 1.211 1517 145255 1.044

Research & development Working Group on Power for 11th Plan
Page 18 of Chapter 5
NTPC has identified and taken up New Technology Development which started during the Xth Plan. About Rs. 400 crore in IGCC project was proposed out of which expenditure has been very little. NTPC has further envisaged to spend 0.5% of its profit (i.e. about Rs. 30 crore per year) in new R&D projects. The list of such project areas is given in para 5.3.1. PGCIL has envisaged an expenditure of Rs.190 crore for R&D during 2007-12 in the areas of EHV transmission, monitoring of Substations, and power flow enhancement and grid availability. A list of projects identified by PGCIL is given in para. The provisions for R&D activities are built into the transmission projects to be taken up and do not reflect in separate R&D budget. BHEL’s R&D efforts are directed towards development of technology in areas of their commercial /business interest BHEL have indicated that it is spending 1 to 1.5% of turn over on R&D and are prepared to participate in national level R&D projects in any of the following ways:
a) If BHEL invests, they need some assurance of business and some relaxation in qualifying norms.
b) BHEL shall participate in national level R&D without issues on commercial
right or IPR provided that the entire funding is by the central government. BHEL’s interest in R&D areas during 11th plan is listed in para 5.3.3 CSIR has identified a few projects for the XI Plan which are listed in para 5.3.4. CSIR has a scheme ‘New Millennium Technology Development Scheme’ in which it provides R&D funding to manufacturers without any IPR issues. At present, it is recommending funding to organizations like BHEL in technology development areas and IGCC. Coal India would continue its work on Coal Bed Methane(CBM) which was taken up through CMPDI during X Plan. The expenditure on R&D incurred by Coal India Ltd. during the X Plan was Rs. 7.5 crores and none of the work was in the areas related to Power Sector. 5.7.1 R&D Budget for 11th Plan
A substantial increase is recommended for the present level of R&D expenditure. As the investment in the Power Sector is going to be upwards of Rs.9 lakh crore, the Group recommends a budget approval of a modest 0.25% of it, which is around Rs. 1213 crore in 5 years. The requirement of funds required for R&D during the 11th Plan would be Rs. 1213.50 crore.

Research & Development Working Group on Power for 11th Plan
Page 19 of Chapter 5
Sl No
Item Budget ( Rs in Crores)
1 R&D on Thermal& Hydro Generation, Fuels & Environment
158.50
2 Distributed Generation – R&D and Demonstration 75.003 Nano materials applications for power sector 100.004 Transmission 70.00 5 Distribution 25.006 New Projects yet to be identified 24.007 CPRI( Details in Para 5.4) 761.00 TOTAL 1213.50 5.8 INTELLECTUAL PROPERTY RIGHTS A few of the IPR issues both in public & private domain have been reviewed. As a matter of fact, Government of India is the main funding agency & various institutions & industry are also contributing in terms of technical assistance, the IPR needs to be a shared model, specifically developed to match the present need. A general guideline of the proposed IPR model is given below. Since Government as such can’t own the IPR, a corporate body is supposed to be constituted for the purpose. Complying with proposed institutional mechanism of project implementation, the IPR of individual research component (Sub project) will be owned jointly by the corporate body & individual research institute, carrying out the sub-project. If the executed project is a new technology demonstration, comprising of more than one research components involving system integration, the IPR for the developed technology as a whole will be owned by the corporate body & the project deploying agency (P1). The detailed mode of sharing the IPR & technology licensing for each project will be specific to the project & will be given a final shape only at the time of signing MOU between project implementation committee & individual research partners. 5.9 HUMAN RESOURCE DEVELOPMENT AND TECHNICAL COMPETENCE
BUILDING India is on its accelerated path to become a global leader in power sector. It is not only anticipating additional capacity, but also expecting more competitive technologies both in terms of lower operating cost as well as lesser environmental pollution. In order to comply with the growth rate, it needs both skilled manpower for operating those plants as well as highly qualified research personnel to sustain a steady growth in technology development. The manpower requirement research centers are very specialized as fundamental research calls for a lot of dedication, clarity of concept, innovation and patience. It is very difficult to get this breed of researchers not only at induction level but also at middle and senior level. In order to match it research program, XI plan envisages certain expenditure for human resource development in power sector. Few of the proposed schemes are enumerated below.

Research & development Working Group on Power for 11th Plan
Page 20 of Chapter 5
• Special fellowship scheme for research scholar employed for the purpose of
carrying out research both at individual research centres as well as at project deployment stage. On completion of project, the researchers would be given an opportunity to get absorbed in the agencies, where the project would be deployed.
• Some of the research institutes should be assisted for developing them to Centre of Excellence (COE) with all required infrastructure.
The success of the R&D projects will largely depend upon quality manpower, freedom for research and continuity of work. The budget for HRD is not specifically mentioned but included in the project cost. It is expected that project implementation authorities will have sufficient autonomy given to them for selection of research fellows. 5. 10 RECOMMENDATIONS AND POLICY ISSUES. 1. Technology advancements and research & development have so far not been
properly addressed. Major organizations like NTPC, NHPC, POWERGRID, on the generation side and BHEL , ABB, SIEMENS on the manufacturing side must enhance substantially their budget allocations for research and development. The utilities should aim at least about 1% of their profit to be utilized for research and development activities and the manufacturing organizations should consider 3-4% to be provided for technology development.
2. Networking of R&D resources and expertise would be an important strategy aimed at getting effective results. CPRI, apart from testing, must reorient its strategy and activities towards research.
3. Ultra Super Critical boiler technology, IGCC technology and oxy-fuel
technology are well researched abroad but have to be developed for Indian coal. NTPC, the major Indian Central Sector utility should have its R&D centre strengthened to expedite the work started during 10th plan on IGCC. It is recommended that this project may be given top priority and completed with the help of BHEL or with a private party if necessary.
4. There is a need to work with specialized S&T laboratories under CSIR & other
space and nuclear establishments to develop material technology for advanced boilers, fuel cells, solar power, battery & super conducting material application in power sector.
5. For the projects of National interest to be taken upon collaborative research
route the estimated R&D expenditure of 452 crores is recommended. It is also recommended that in future capital fund support for R&D should be reduced and utilities and industries should collaborate to fund R&D projects.
6. An institutional change in handling R&D is required. A suggestion is to have
generation, transmission & distribution R&D units to be established as separate entities in the central sector undertakings or to set up a corporate technology centre for R&D activities in various areas of power sector

Research & Development Working Group on Power for 11th Plan
Page 21 of Chapter 5
7. R&D import should be exempted from custom duty to encourage indigenous
R&D 8. Power sector should seriously consider attracting young talents by offering
them challenging opportunities. This will be possible by encouraging R&D and offering a good package, like many MNCs are offering at present.
9. A High Power Committee in R&D should monitor R&D projects and regulate
funds. This will avoid duplication & ensure competitive R&D. 10. Organisations like CPRI and NPTI should be spared from manpower
optimization rules where vacant positions are surrendered. This is in view of the depleting cadre of scientists and specialists in these organizations.
*********

Development of Power Sector in NER Working Group on Power for 11th Plan
Page 1 of Chapter 6
Chapter -6
DEVELOPMENT OF POWER SECTOR IN NORTH-EASTERN REGION
6.0 INTRODUCTION The North Eastern Region of the country comprises of 7 states; namely Arunachal Pradesh, Assam, Manipur, Meghalaya, Mizoram, Nagaland, Tripura and Sikkim. It is a land-locked region with ninety eight percent of its border being international. The land -locked area which constitutes 8 percent of the total area of the country is connected with the main land through chicken-neck across West Bengal. In view of the slow growth of the region, special focus has been laid on economic development of North-Eastern Region and Sikkim. Accordingly strategies have been formulated for removal of infrastructure bottlenecks and creating a conducive environment for overall progress of the region including private investment etc 6.1 STATUS AT THE BEGINNING OF 10TH PLAN The Installed Capacity of North-Eastern Region was 2,230.3 MW at the beginning of 10th Plan. This Installed Capacity comprises of 1089.9 MW from Hydro, 1,140.2MW from Thermal and 0.2 MW from Renewable Energy Sources. In addition, the Installed Capacity of Sikkim was 107.9 MW including shares from Central Sector power stations at the beginning of 10th Plan. State-wise details of Installed Capacity and Power Supply Position are given Table 6.1 and6.2 respectively:
Table-6.1
Installed Capacity at the Beginning of 10th Plan.
(All figures in MW) Thermal
State
Hydro
Coal Gas Diesel Total Renewable
Energy Sources
Total
Assam 322.00 330.00 447.00 20.70 797.70 0.00 1119.70 Arunachal Pradesh 114.50 0.00 21.00 15.90 36.90 0.00 151.40 Meghalaya 257.70 0.00 26.00 2.00 28.00 0.00 285.70 Tripura 76.00 0.00 97.50 4.80 102.30 0.00 178.30 Manipur 82.20 0.00 26.00 27.40 53.40 0.00 135.6 Nagaland 72.20 0.00 19.00 2.00 21.00 0.20 93.4 Mizoram 41.30 0.00 16.00 28.90 44.90 0.000 86.20 Central Unallocated 124 0.00 56.00 0.00 56.00 0.00 180.00 Total(NER) 1089.9 330.00 708.50 101.70 1140.20 0.20 2230.3 Sikkim 44.9 58.00 0.00 5.00 63.00 0.00 107.9 Total (NER+Sikkim) 1134.8 388.00 708.00 106.7 1203.2 0.20 2338.2

Development of Power Sector in NER Working Group on Power for 11th Plan
Page 2 of Chapter 6
Table-6.2 Power Supply Position at the Beginning of 10th Plan
State
Peak
Shortage / Surplus (MW) (%)
Energy Shortage / Surplus
(MU) (%) Assam -70 -10.2 -25 -0.7 Aru’chal Pradesh -0 -0.0 -2 -1.2 Meghalaya -5 -3.0 5 0.7 Tripura -16 -10.3 -34 -5.3 Manipur -4 -4.1 -16 -3.5 Nagaland -3 -4.9 -2 -0.7 Mizoram -2 -2.7 -6.0 -2.1 Total(NER) -105 -9.1 -80.0 -1.4 Sikkim -200 -5.5 -95 -0.5
6.2 REVIEW OF generation CAPACITY ADDITION PROGRAMME DURING 10TH PLAN Planning Commission had set a generation capacity addition target of 1017.92 MW in NER and 510 MW in the state of Sikkim during Tenth Plan. Out of these targets only 128 MW could be achieved during the 10th Plan. Capacity addition of 100 MW is likely to be achieved during balance period of 2006-07. The State-wise details of capacity addition target and achievement during tenth plan is given in table 6.3 below:
Table 6.3
Generation Capacity addition (MW) Achievement
S. No.
State/Central Sector Target
From 2002-03 to 31.12..2006
Expected from
1.1..2007 to
31.03.2007
Total
1 Assam 138.00 - 100.00 100.00 2 Manipur 18.00 18.00 - 18.00 3 Meghalaya 132.00 - - - 4 Mizoram 102.92 22.92 - 22.92 5 Tripura 42.00 42.00 - 42.00 6 Arunachal
Pradesh - - - -
7 Nagaland - - - - A State Sector 432.92 103.92 100.00 203.92 B Central Sector 585.00 25.00 - 25.00 C Total NER 1017.92 128.92 100.00 228.92
In addition to the target set by Planning Commission, Rokhia GT Ext. (21 MW) is also commissioned during 10th plan

Development of Power Sector in NER Working Group on Power for 11th Plan
Page 3 of Chapter 6
INSTALLED CAPACITY AS ON 31.12.2006 The total Installed Capacity of NE Region (excluding Sikkim) as on 31.12.2006 was 2404.2 MW comprising 1113.1 MW hydro and 1244.2 MW thermal (including gas and diesel) and 46.9 MW from Renewable Energy Sources., The total installed capacity of Sikkim as on 31.12.2006 was 116.1 MW comprising 44 MW hydro and 63 MW thermal (including gas and diesel) and 9.1 MW from Renewable Energy Sources. The State-wise details of Installed Capacity as on 31.12.2006 are given in Table 6.4
Table-6.4
(All figures in MW) Thermal State Hydro Coal Gas Diesel Total
Renewable Energy Sources
Total
Assam 332.0 330.0 447.0 20.7 797.7 0.2 1129.9 Arunachal Pradesh 116.5 0.0 21.0 15.9 36.9 26.0 179.4 Meghalaya 260.6 0.0 26.0 12.0 28.0 1.5 290.1 Tripura 78.0 0.0 160.5 4.8 165.3 1.1 244.4 Manipur 81.5 0.0 26.0 45.4 71.4 4.0 156.9 Nagaland 78.5 0.0 19.0 2.0 21.0 3.2 102.7 Mizoram 38.0 0.0 16.0 51.9 67.9 10.9 116.8 Central Unallocated 128.0 0.0 56.0 0.0 56.0 0.0 184.0 Total(NER) 1113.1 330 771.5 142.7 1244.2 46.9 2404.2 Sikkim 44.0 58.0 0.0 5.0 63.0 9.1 116.1 Total (NER+Sikkim) 1157.1 388.0
771.5 147.7 1307.2 56.0 2520.3
ACTUAL POWER SUPPLY POSITION AS ON 31.12.2006 The State-wise actual power supply position as on 31.12.2006 is given in table 6.5 below:
Table-6.5 Power Supply Position as on 31.12.2006
State
Peak
Shortage / Surplus (MW) (%)
Energy Shortage / Surplus
(MU) (%) Assam -83 -10.8 -232 -7.1 Arunachal Pradesh
-1.0 -1.3 -7.0 -3.7
Meghalaya -145 -42.3 -215 -20.4 Tripura -27.0 -16.0 -58 -9.1 Manipur -5.0 -4.7 -16 -4.4 Nagaland 0.0 0.00 -10 -3.8 Mizoram -2.0 -2.9 -8 -4.7 Total(NER) -241 -17.1 -546 -9.2 Sikkim 0.0 0.00 -3 -1.9

Development of Power Sector in NER Working Group on Power for 11th Plan
Page 4 of Chapter 6
6.3 REASONS FOR SLOW PACE OF PROJECT EXECUTION Overall development of N.E region has been very slow. The basic infrastructure is inadequate and this is one of the reasons for development of various industries as well as power projects in this region. The sub-group deliberated on the reasons for the slow pace of power project execution, major ones is as follows:
• Difficulties faced in obtaining Environment & forest clearance, land acquisition, R&R issues.
• Hydro electric project sites are inaccessible and have very difficult approach/ maintenance of access roads.
• Lack of Infrastructural facility • Inter State Aspects • Geological surprises • Inadequate Survey & Investigation • Law and Order problems • Shortage of Funds • Inadequate organisational set in state sector for implementation of projects • Decision of Arunachal Pradesh regarding type of Hydro schemes.
6.4 POWER DEMAND & SUPPLY ANALYSIS OF THE REGION An analysis has been carried out to assess the gap between power demand and supply position of the region. Data of the hourly generation and demand met has been examined and it is observed that there is shortage of power even during off peak hours of the winter season. It is estimated that by the year 2011-12(at the end of 11th plan) the demand of the North Eastern Region will be of the order of 2800 MW. To meet the peak shortages and even off-peak shortages during the winter season when the hydro availability is low, it is essential that NER should have base load generation capacity or alternatively allocation may be made from central thermal stations of the Eastern Region 6.5 GENERATING CAPACITY ADDITION PROGRAMME IN NORTH EASTERN REGION/ SIKKIM DURING 11TH PLAN Tentative capacity addition programme of 5615MW has been envisaged in North Eastern Region (including Sikkim) for the 11th Plan. This comprises of 4055 MW hydro and 1560 MW of thermal power.

Development of Power Sector in NER Working Group on Power for 11th Plan
Page 5 of Chapter 6
Table-6.6 (Capacity in MW)
11th Plan Thermal
N E Region Hydro
Coal Gas Diesel Total
Total
Assam 750 37 - 787 787 Manipur - - - - - Meghalaya 124 - - - - 124 Mizoram - - - - - Ar. Pradesh 2600 - - - - 2600 Nagaland - 23 - 23 23 Tripura - 750 - 750 (*)750 Total(NER) 2724 750 810 - 1560 4284 Sikkim 1331 - - - - 1331 Total(NER+ Sikkim)
4055 750 810 - 1560 5615
The State-wise/Project-wise details are given at Annexure- 6.1 (*) It is learnt that power from this station will be sold to PTC 6.6 DEVELOPMENT OF TRANSMISSION SYSTEM IN NORTH EASTERN
REGION 6.6.1 Power System in NER The North Eastern Regional Power Grid comprises of transmission network of seven States of Arunachal Pradesh, Assam, Manipur, Meghalaya, Mizoram, Nagaland and Tripura with Central Sector system superimposed on it. Due to low magnitude of demand levels in most of the states, the growth and development of state transmission systems has been primarily at 132kV and 66kV levels. Due to its geographical location, Power System of Assam wheels power to other NER states through many of its transmission elements. The inter-state lines wheeling through Assam grid have been constructed as centrally sponsored schemes. Till regional grid of North-eastern region is developed to provide full connectivity to all the states, the wheeling of power to other states through Assam grid would continue. 6.6.2 Meeting the Power Supply Requirement of NER The power supply situation in NER remains better during monsoon period when availability from hydro-generating stations are good. During non-monsoon period and particularly during winters, shortage, both in terms of MW and MWh, are much higher due to low generation at hydro stations in the region. To meet the requirement of power in NER, it would be necessary that sufficient power from base load thermal stations located in Easter-region is allocated to the states of NER and major part of power from higher sized hydro station in NER such as Subansiri Lower (2000MW) and Kameng(600MW), is allocated to states outside NER. This would help the states of NER in two ways. While the additional allocation

Development of Power Sector in NER Working Group on Power for 11th Plan
Page 6 of Chapter 6
from thermal projects located outside NER to the states of NER would help in meeting their demand during low hydro generation period of winter months, allocation from hydro projects in NER to outside NER would help to regulate the surpluses during monsoon period when there is over-all higher availability in all the regions. Allocation from hydro projects in NER to states in NR/WR would also facilitate the development of the NER – NR/WR inter-connecting HVDC transmission system. While considering allocation of power from generation projects in NER to outside NER and from thermal generation projects outside to NER to the states of NER, it needs to kept in view that the benefit of hydro development in NER is adequately passed on to the states of NER by leaving out sufficient surpluses with the NER states which they could trade profitably in the opened-up bulk power market. This would help in improving the commercial health of the NER states. However, if the surpluses are higher, and that too in monsoon period, trading of such power may not be profitable. Therefore, an optimum power allocation strategy needs to be adopted. 6.6.3 Regional Transmission System in NER Till 1984, the transmission network in the region was essentially comprised of 132kV and underlying networks, both in State as well as Central sector. Since then, with the planning of various hydro projects in the region, 220 kV transmission system was first commissioned in 1984 under Central sector for evacuation of power from Kopili Stage-I HEP (200MW). Subsequently, 400 kV Kathalguri-Mariani -Misa D/C line (operated at 220kV) and Misa-Balipara-Bongaigaon 400 kV D/C line as part of evacuation for Kathalguuri GBPP in Central sector, and Bongaigaon-Malda 400kV D/C line as an inter-regional line between ER and NER, were developed by 2000. This provided 400kV interconnectivity with the Eastern region. Subsequently, Ranganadi-Balipara 400kV D/C line was commissioned along with Ranganadi-I-HEP. Also, the Bongaigaon-Malda 400kV D/C line has been LILOed at Siliguri (one ckt in July 2002, other ckt in March 2005) and Purnea (one ckt in November 2003, other ckt in September 2005) in Eastern region.. The North-eastern regional grid has also been developed with 220kV and 132kV lines established in Central sector as associated transmission system for various generation projects viz. Loktak HEP, Agartala GBPP, Kopili HEP Extn, etc. Per unit cost of regional transmission in NER has been much higher as compared to other parts of the country. Five factors responsible for this are - (1) the cost of building transmission lines in NER is much higher due to uneven terrain and area specific factors; (2) the PLF of hydro stations, being inherently low, makes per unit cost of transmission higher; (3) higher cost in NER due to law and order problem; (4) due to delay in completion of Ranganadi-I HEP, while the 400kV Misa-Balipara-Bangaigaon lines were completed, the resulting under utilization of transmission system leading to higher per unit charges; and (5) 50% transmission charges for Bongaigaon-Malda 400kV D/C line on account of NER while Siliguri-Purnea-Malda section of the link utilized as part of eastern grid. It may be noted that factor (4) has since been addressed and (5) can also be addressed by appropriate revision of transmission tariff. Government and public efforts may also fructify to address the factor (3). However, factor (1) and (2) are inherent and would continue to push up the transmission tariff in NER. To the issue of higher transmission tariff in NER, Zonal Matrix Transmission Tariff method for location, distance and flow direction related

Development of Power Sector in NER Working Group on Power for 11th Plan
Page 7 of Chapter 6
allocation of National pooled transmission charges amongst the beneficiaries could be adopted as an effective solution. CERC has capped the regional transmission charges in NER at 35 paise/kWh. As a result, PGCIL is not recovering its full transmission charges. Due to non-recovery of its full transmission charges, PGCIL has not been making further investment in the NER transmission system and system strengthening in the regional/inter-state transmission system had been suffering. The issue needs to be addressed urgently. With intervention from MOP and CEA, urgent strengthening requirements in the regional system have been identified and taken-up for implementation by POWERGRID under scheme titled ‘NER System Strengthening Scheme – I’. within existing transmission tariff ceiling of 35 paise/kWh. Works covered under this schemes are: NER System Strengthening Schemes – I
(i) 132 kV Kopili HEP – Khandong HEP 2nd circuit (ii) Extension of Kopili S/S by 1x160 MVA, 220/132 kV transformer (3x53.3
MVA single phase units). (iii) LILO of Dimapur (Nagaland) – Kohima 132 kV S/C at Dimapur (PG) (iv) Augmentation of Dimapur (PG) S/S by 1x100 MVA, 220/132 kV
transformer. 6.6.4 Power Evacuation from North East Development of generation projects in NER envisaged during the XI plan period would add hydro as well as gas based generation capacity in NER. Generation from this capacity would be partly utilized locally to the extent of meeting the increasing load demands with development in the area and the balance, which would be the major part of the additional generation capacity, would need to be evacuated outside the region. For meeting power requirements for the states of NER, the component of allocation from these projects within NER would be utilized locally for which adequate transmission system with in NER – both inter-state as well as intra-state – would be required. 6.6.5 Transmission System Under State Sector Inadequate development of sub-transmission and distribution system facilities in the States of NER has been adversely affecting the reliability of power supply to the consumers and also hampering the load growth in the region. The transmission, sub-transmission and distribution systems of states require major strengthening/up-gradation. Transmission lines that are under outage require speedy restoration for bringing them into operation so that the states could avail their central sector shares as well as utilize their own generation without any constraint. Inadequacies in the transmission and distribution system had been on account of slow implementation of schemes due to various factors such as time consumed in E&F clearances, land acquisition, RoW constraints, fund limitation, organizational

Development of Power Sector in NER Working Group on Power for 11th Plan
Page 8 of Chapter 6
difficulties of state utilities, lack of vendor response due to locational factors, law and order, terrain specific difficulties, etc. Due to limited funding capabilities of state utilities, most of the required transmission projects are generally funded by NEC or by NLCPR under DONER and investment/funding approval of scheme so funded also takes additional time. All these issues need to be addressed to achieve the accelerated demand growth in NER. 6.7 EVACUATION OF POWER FROM MAJOR GENERATION PROJECTS IN
THE NORTH-EASTERN REGION ALONG WITH POWER FROM PROJECTS COMING UP IN SIKKIM AND BHUTAN DURING THE 11TH PLAN AND EARLY 12TH PLAN PERIOD
Generation projects of 10000 MW have been envisaged during the 11th Plan and early 12th Plan in the NER, Sikkim and Bhutan. The projects are Tripura Gas (750 MW), Bongaigaon Thermal (750 MW), Kameng HEP (600 MW), Subansiri Lower HEP (2000 MW), Siang Middle HEP (1000 MW), Tipaimukh HEP (1500 MW), Teesta- I, II, III, IV & VI HEPs in Sikkim (2700 MW), Phunatsangchu-I & II and Mangdechu HEPs in Bhutan (2600MW). The generation from these projects would be utilized in the NER, Sikkim and Bhutan, only to the extent of meeting the increasing load demands in the area. However, even with accelerated growth in local demand, substantial power from these projects would need to be exported to the power deficit regions that is the Northern Region and the Western Region. In order to have an optimum system and addressing the transmission corridor constraints in the chicken neck area (the ‘chicken-neck’ refers to the area between Siliguri and Bidhan Nagar in West Bengal), a comprehensive transmission system has been evolved. The requirement of power evacuation through the chicken neck has been estimated corresponding to the capacity of hydro projects which may be feasible to develop say in the next 20-25 years. This generation is estimated to be about 35000 MW in NER, about 8000 MW in Sikkim and about 15000 MW in Bhutan. Taking local development at accelerated pace resulting in demand within the NER, Sikkim and Bhutan to be in the range of 10000 – 12000 MW (presently it is about 1500 MW), the transmission requirement through the chicken neck works out to be of the order of 45000 MW. With 800kV HVDC, each bi-pole line of 6000 MW capacity could be planned. The 400kV AC D/C lines with quad conductor in the hybrid system would be of 2000 MW transmission capacity. Multi-circuit of higher transmission capacity would also be considered in chicken-neck area. The total requirement including additional circuits for meeting the contingencies and reliability needs, would work out to 7 or 8 numbers of HVDC bi-pole lines and 4 or 5 numbers of 400kV double circuit lines – a total of 12 numbers of high capacity transmission corridors passing through the chicken neck. For this, RoW requirement would be about 800 m and considering minimum distance between adjacent towers to be such that fall of any tower does not affect the adjoining line, a width of about 1.5 km would be needed. The option of 765kV transmission system has not found favor that besides a wider RoW, we have to take into account nature of hydro generation. While the system would need to be planned for full generation capacity, in winter months, when the generation would be much less and restricted to just peak hours, the lines can’t be kept energized due to reactive power management and resulting high voltage problem. This would require frequent switching of the lines resulting in loss of

Development of Power Sector in NER Working Group on Power for 11th Plan
Page 9 of Chapter 6
reliability and also reduced life of equipment. Therefore 765kV bulk transmission would not be recommended choice in this case. The option of hybrid network of HVDC, and high capacity 400kV line has been found to be most suitable from cost, corridor, operational and phased development consideration. As the transmission distance from NER upto NR/WR is quite long – 2000 – 2500 kms, the requirement of keeping losses within reasonable and cost effective limits, suggests strongly in favor of adopting as high a HVDC transmission voltage as possible. At present the HVDC voltage for bi-pole transmission in India is 500kV. The highest HVDC system in world is at 600kV at Itaipu, Brazil, which is in operation since 1987. The next higher voltage of 800kV HVDC is under final stages of development. The first 800kV HVDC bi-pole line has been planned from a pooling substation at Biswanath Chariyali in North-eastern Region to Agra in Northern region. This is being programmed for commissioning matching with Subansiri Lower HEP in 2011-12. The transmission line would be for 6000 MW capacity and HVDC terminal capacity would be 3000 MW between Biswanath Chariyali and Agra and, for transmission of power from hydro projects at Sikkim and Bhutan pooled at Siliguri, another 3000 MW terminal modules would be added between Siliguri and Agra. It is envisaged to take-up the proposed 800kV, 6000MW HVDC bi-pole line from Biswanath Chariyali to Agra under a scheme titled ”Inter-regional Transmission system for power export from NER to NR/WR”. This would the first scheme of its kind in the world and this would be a flagship endeavor towards a quantum leap in the Indian Power System. To supply the power from the various generation schemes catering to increasing demand within the North-eastern Region, system strengthening within the NER would also to be needed. The requirement of the system strengthening would depend on trend of demand growth in the states. The strengthening network in NER would also provide local anchoring of the network which would improve the reliability of the National Grid. Provision for system strengthening within NER would be kept in each of the generation related transmission schemes. 6.8 SPECIAL ATTENTION FOR DISTRIBUTION IN NE REGION The North East region is lagging behind in the development of the power sector compared to other regions. The region offers immense potential for the development of the electricity sector due to the huge hydro potential in the North East. The investments in and growth of transmission, sub-transmission and distribution systems have not matched the increase in generation capacity. As a result, there are constraints in electricity evacuation from generation stations. CEA has estimated that the share of the North East region is only 2.5%. In the consumer profile, domestic consumers accounted for 75% of the total consumers followed by commercial consumers which accounted for 11% of the total. Agricultural consumers accounted for 10% of the total while industrial consumers were 2.5%. As much as 40% of the Electricity consumers reside in Southern India, followed by Western India which accounts for 27% of the electricity consumers. Northern India accounts for 23% of the total electricity consumers while the East &

Development of Power Sector in NER Working Group on Power for 11th Plan
Page 10 of Chapter 6
North East together account for only 10% of the consumers. North East accounts for only 1.6% of all consumers. The above figures reflect the position of North East in the power sector development in the country. This regional imbalance needs to be corrected. In APDRP and RGGVY this region should get priority. In all the backward and north-eastern States the programme of electricity distribution projects need to be supported with low cost funds along with substantial portion of subsidy or grants. It is also felt that performing Middle/Senior level managerial personnel from the most progressive utilities may be deputed to utilities in North-eastern states to ensure quick deployment of initiatives already deployed in the progressive states. Also, personnel from Utilities in North-eastern states should be deputed in other utilities. All such deputation should range from a period of at least 6 months to 3 years. In all the backward and north-eastern States the programme of electricity distribution projects need to be supported with low cost funds along with substantial portion of subsidy or grants. Rural Infrastructure Development Funds (RIDF) available with NABARD should be utilized for the development of electricity distribution in the North-eastern and other backward regions of the country. For the System Improvement Schemes in these regions RIDF funds may be allowed to be utilized for making available cheaper credit for an accelerated development of these regions. 6.9 FUND REQUIREMENT The requirement of funds during XI Plan for generation projects has been estimated as about Rs. 15,375 crore. In addition, the matching Transmission and Distribution shall also need similar quantum of funds and thus overall requirement is estimated to be about Rs. 30,750 crore. 6.10 POLICY INITIATIVES AND RECOMMENDATIONS Following recommendations are made to overcome major problems being faced in project implementation in the N.E. Region and overcome the slow pace of development.
The Survey & Investigation works, preparation of DPR, clearance from various organizations including MoEF have to be taken up and a time bound programme for clearance of hydro projects from various agencies including MoEF has to be formulated.
A comprehensive plan for adequate road network be formulated taking into
consideration various development projects including remote located hydro power station sites.
Non availability of construction materials like cement steel etc and long
procurement time makes the Hydro Projects costly and unviable. Setting up of Industries for construction material including Cement Industry may be encouraged in the North Eastern Region.

Development of Power Sector in NER Working Group on Power for 11th Plan
Page 11 of Chapter 6
Availability of power in NE Region reduces during winter season due to reduction in generation from hydro projects. Gap between demand and supply is of the order of 400-500 MW. Therefore, NE Region has shortage of power during winters even during off-peak hours. Therefore, NE Region should have base load generation capacity i.e. thermal generation or allocation from central sector thermal stations of Eastern Region.
For achieving accelerated load growth in NER, efforts are needed on all
fronts. Specific efforts are needed in development in transmission at the regional level as well in the transmission, sub-transmission and distribution system at the state level.
To supply the power from the various generation schemes catering to
increasing demand within the North-eastern Region, system strengthening within the NER would be needed. The required transmission system in NER needs to be developed along with the power evacuation system.
Hydro power development in NER would requirement of power to other
regions through the chicken neck. The total requirement would be 7 or 8 numbers of HVDC bi-pole lines and 4 or 5 numbers of 400kV double circuit lines – a total of 12 numbers of high capacity transmission corridors for which a total width of about 1.5 km in two or three corridors would be needed. The total right of way in chicken neck area needs to be reserved on priority.
Establishment of manufacturing units for the electro-mechanical equipments
in the region. This will help the region in establishment of a heavy industry, which will also generate considerable employment.
ADB or any other suitable developmental agency to be engaged for
comprehensive development of power projects in the NE Region. Extension of Rural Infrastructure Development Funds (RIDF) available with
NABARD should be made available for the development of electricity distribution in the North-eastern and other backward regions of the country in order to get cheaper credit for an accelerated development of these regions.
A national level training center for Distribution should be created in at least
one of the North-eastern states by a Central Government Institution/body.
**********

Human Resource Development Working Group on Power for 11th Plan
Page 1 of Chapter 7
Chapter - 7
HUMAN RESOURCE DEVELOPMENT
7.0 BACK GROUND Human Resource Development and capacity building, in the present power scenario, demands a very comprehensive and pragmatic approach to attract, utilize, develop and conserve valuable human resources. Training, re-training and career prospects are some of the important elements of human resources development. The reforms in the power sector have led to change in the role of Senior Engineers from a purely Government controlled technical management to business management in a corporatised framework. Technically trained manpower comprising of skilled engineers, supervisors, artisans, and managers etc. is required in every sphere of the power supply industry. Growing concern over environmental degradation and depletion of the conventional energy sources has made the task of electricity generation even more challenging and therefore quality standard of the manpower is becoming increasingly essential. The technical knowledge acquired from engineering colleges, polytechnics, industrial training institutes and other technical institutions provides the basic foundation, but the same needs to be supplemented with applied engineering skills in the various spheres i.e. power generation, its transmission and distribution aspects. All these skills are to be regularly updated to cope with the rapidly advancing technologies and very often the speed of obsolesce overtakes the rate of acquisition of particular skill and knowledge. It has been noticed that due to the introduction of more sophisticated technology and automation, the Man/MW ratio is declining over the years. The Man/MW ratio in thermal sector has reduced from 4.71 in 6th Plan to about 1.78 at the end of 9th Plan; it is projected to touch 1.44 towards the end of 10th Plan and is further expected to go down during the subsequent plans. The same trend is observed in the Hydro Power Sector also, where the Man/MW ratio of 6.04 in the Sixth Plan has come down to 2.2 at the end of Ninth Plan; it is expected to go down further to about 1.95 towards the end of 10th Plan and even reduce in the subsequent Plans. The overall Man/MW ratio which was 9.42 at the end of 9th Plan is expected to go down to 7.00 at the end of 10th Plan and 5.82 at the end of 11th Plan. This indicates the increasing importance of each individual, the man behind the machine. The HRD/Training needs of Technical, Non-Technical and Supporting Staff should be addressed keeping in view the National Training Policy for the Power Sector. In this Chapter, the existing manpower and training facilities in the Power Sector have been reviewed. A broad assessment has been made of the manpower requirements for construction, commissioning, O&M of Generation, Transmission, Distribution system during 11th & 12th Plans, taking into account present staffing pattern, requirements arising out of proposed capacity and network expansions, staff out turns on account of retirements and expected changes in technology etc. A
Human Resource Development Working Group on Power for 11th Plan
Page 2 of Chapter 7
review and assessment of training arrangements required have been made as well as measures for training of staff in various categories. have been suggested. The financial requirement of manpower planning and training arrangements during the 11th & 12th Plans have also been worked out. 7.1 ELEMENTS OF HRD PLANNING Comprehensive HRD planning involves the following elements: Organization: Organizational structure, position descriptions, responsibility and authority, delegation etc. Skills and Trades: Qualitative and quantitative assessment of skills and trades required at various points of time in future. Productivity and Performance: Utilization, control, performance appraisal, productivity development etc. Working Conditions and Facilities: Working environment, safety, health, fatigue, rest and facilities to workers, both inside and outside the factory. Salary and Wages: Working classification, wage structure, salary, administration, service conditions and fringe benefits. Recruitment: Recruitment, training, placement, phasing of recruitment and blending of requirements at different stages of construction, operation and growth. Motivation: Personnel development, promotion incentive, morale, satisfaction and attitudes. Industrial Relations: Trade Unionism, discipline, social, economic and political environment, group dynamics etc. 7.2 ASSESSMENT OF MANPOWER 7.2.1 Capacity Addition – Plan-wise Assessment of manpower during the plan periods is based on capacity addition during the respective plans and the norms for manpower. Besides this, 20% reduction of personnel during the plan period due to retirement, death, change of profession etc. and assumed recouping @ 7.5% during the plan due to wastage, decommissioning etc is also made. Details of capacity addition during various Plans are furnished below:

Human Resource Development Working Group on Power for 11th Plan
Page 3 of Chapter 7
Table 1
Sector Capacity in MW
End of 9th Plan
Addition in 10th Plan
End of 10th Plan
Addition in 11th
Plan
End of 11th Plan
Addition in 12th Plan
End of 12th Plan
Thermal 74,429 20,387 94,816 50,124 1,44,940 40,200 185,140 Hydro 26,269 8,854 35,123 15,585 50,708 30,000 80,708 Nuclear 2,720 1,400 4,120 3,160 7,280 12,000 19,280 Additionduring the Plan
19119 30,641 * 68,869 82,200
Grand Total
1,05,046 (1628 Wind )
1,35,687
2,04,556 2,86,756
*- This includes 2578 MW on best efforts basis and further additional capacity of 2445 MW to require extra efforts. However in current scenario this capacity would slip to 11th Plan and would therefore not change the capacity at end of 11th Plan. As per latest indication, a capacity of 5,727 MW may slip to 11th Plan because of various reasons including delay in supply and execution by BHEL 7.2.2 Growth of Manpower – Present Trend According to the National Electricity Plan, the total Manpower (Technical and Non-Technical) available at the beginning of 9th Plan i.e. 1-4-1997 was of the order of 1,061.7 thousands. During the 9th Plan a capacity addition of 19,119 MW was achieved for which an additional manpower is estimated to be 60.9 thousands. The manpower available at the end of the 9th Plan i.e. 31-3-2002 was of the order of 989.9 thousands. This takes into account 20% reduction of personnel during the plan period due to retirement, death, change of profession etc. and assumed recouping @ 7.5% during the plan due to wastage & decommissioning etc. 7.2.3 Manpower Assessment for 10th Plan The actual capacity addition expected during the 10th Plan is of the order of 30,641 MW*. The total manpower calculated at the end of 10th Plan is estimated to be 9.50 lakhs for the total installed capacity of 1,35,687 MW. Details of calculations and assumptions are furnished in Tables 2 to 8. 7.2.4 Manpower Assessment for 11th Plan Considering the proposed capacity addition of 68,869 MW during 11th Plan (Table 1), the additional manpower requirement will be of the order of 3.44 lakhs out of which 2.62 lakhs will be technical and 0.81 lakhs Non-Technical. The total manpower at the end of 11th Plan has been estimated at 11.76 lakhs for the total installed capacity of 2,04,556 MW. Details of calculations and assumptions are furnished in Tables 9 to 16.

Human Resource Development Working Group on Power for 11th Plan
Page 4 of Chapter 7
7.2.5 Manpower Assessment for 12th Plan Considering the proposed capacity addition of 82,200 MW during 12th Plan (Table 1), the additional manpower requirement will be the order of 3.27 lakhs out of which 2.52 lakhs will be technical and 0.75 Non-Technical. The total manpower at the end of XII Plan has been estimated as 13.22 lakhs. Details of calculations and assumptions are furnished in Tables 17 to 22.
Table 2
Estimated manpower employees in power supply industry (utilities) as on 1.4.2002 (beginning of 10th plan)
(Figures in Thousands)
S.No. Formation Technical Non-Technical
Total
1. Thermal Generation*
98.2 34.4 132.6
2. Hydro Generation 38.3 19.5 57.8 3. Nuclear 7.3 3.5 10.8 4. Power System*
Transmission Distribution
30.01
570.28
9.42
178.98
39.43
749.26 Total 744.1 245.8 989.9
These estimates do not include persons employed in civil construction works of power generation projects. *This includes steam, Gas and Diesel plants. **Personnel working in Transmission are considered 5% of the total working in Transmission and Distribution together.
Table 3
Manpower available for the 10th Plan after 20% reduction (due to retirement, death, change of profession etc. @ 4% per year)
(Figures in Thousands)
Sl.No. Formation Technical Non-Technical
Total
1. Thermal Generation
78.56 27.52 106.08
2. Hydro Generation 30.64 15.6 46.24 3. Nuclear 5.84 2.8 8.64 4. Power System
Transmission Distribution
24.01456.22
7.54143.18
31.55
599.40 Total 595.28 196.64 791.92

Human Resource Development Working Group on Power for 11th Plan
Page 5 of Chapter 7
Table 4 7.5% Manpower recouped during 10th Plan @ 1.5% per year
(Figures in Thousands) Sl.No. Formation Technical Non-
Technical Total
1. Thermal Generation 7.3 2.58 9.882. Hydro Generation 2.87 1.46 4.333. Nuclear 0.54 0.26 0.84. Power System
Transmission Distribution
2.25
42.77
0.71
13.42
2.96
56.19 Total 55.73 18.43 74.16 Against the wastage of 4%, the intake will be of the order of 2% in view of improvement in quality, technology advancement and redundancy available in technical manpower at semi/unskilled level. It is also assumed that 0.5% of the total capacity is decommissioned annually and the manpower available from these units shall be utilized at other units thus the effective recouping of 1.5% every year.
Table 5
Manpower available during the 10th Plan after considering retirement of 20% and 7.5% recouping etc.
(Figures in Thousands) Sl.No. Formation Technical Non-
Technical Total
1. Thermal Generation 85.9 30.1 116.02. Hydro Generation 33.5 17.1 50.63. Nuclear 6.4 3.1 9.54. Power System
Transmission Distribution* - Hilly 10% - Plains 90% Sub-Total
26.26 49.90449.14
525.3
8.24
15.66 140.94
164.9
34.50 65.56
590.08690.2
Total 651.1 215.1 866.3*In Distribution 10% assumed for Hilly Terrains and 90% for Plains
Table 6

Human Resource Development Working Group on Power for 11th Plan
Page 6 of Chapter 7
Norms for Manpower (for 10th Plan) Central & State Sectors per MW
(Figures in Thousands) Technical Non-Technical Sl.No. Formation
Central State Central State Thermal (Total) 500 MW Unit 0.60 0.82 0.18 0.3 < 500 MW Unit 0.7 1.15 0.21 0.61
1.
Gas/Liquid Fuel 0.35 0.36 0.11 0.17 2. Hydro 1.66 1.53 0.50 0.26 3. Nuclear 1.35 - 0.58 - 4. Power System
1.12- 0.30 -
For Central & Private Sectors as per NTPC & NHPC For State Sector as per National Electricity Plan For T&D for 10th Plan norms as per National Electricity Plan
Table 7 Additional Manpower required due to capacity addition of 30,641 MW in 10th Plan, T&D Line length of 8,26,863 ckt kms & 20 Crore consumers for Distribution (Figures in Thousands)
Technical Non-Technical
Total Sl. No.
Formation
Central
State Central
State Central State
Thermal Generation 500 MW Unit 4.20 0.41 1.26 0.15 5.46 0.56 Below 500 MW Unit 3.36 5.38 1.01 2.85 4.37 8.23
1.
Gas/Liquid Fuel 0.74 0.46 0.23 0.22 0.97 0.682. Hydro Generation 8.62 5.59 2.59 0.95 11.21 6.543. Nuclear 1.89 - 0.81 - 2.70 -4. Power System
Transmission(41443 ckm)* Distribution - Hilly - Plains Sub-Total
1.723.26
29.3434.32
-0.460.877.869.19
-
2.18 4.13
37.12 43.51
-
Total 53.13 11.84 15.09 4.17 68.22 16.01 Grand Total
84.23
*Combined Lines of HV, EHV & UHV

Human Resource Development Working Group on Power for 11th Plan
Page 7 of Chapter 7
Table 8 Total Manpower available at the end of 10th Plan i.e. on 1.4.2007
(Figures in Thousands) Sl.No. Formation Technical Non-
Technical Total
1. Thermal Generation 100.45 35.82 136.272. Hydro Generation 47.71 20.64 68.353. Nuclear 8.29 3.91 12.204. Power System
Transmission(41,443 ckm) Distribution - Hilly - Plains Sub-Total
27.9853.16
478.48559.62
8.70
16.53 148.80 174.03
36.6869.69
627.28733.65
Total 716.07 234.40 950.47
Table 9 Manpower available during the 11th Plan after 20% reduction (due to retirement, death, change of profession etc. @ 4% per year)
(Figures in Thousands) Sl.No. Formation Technical Non-
Technical Total
1. Thermal Generation 80.36 28.66 109.022. Hydro Generation 38.17 16.51 54.683. Nuclear 6.63 3.13 9.764. Power System
Transmission Distribution - Hilly - Plains Sub-Total
22.3842.53
382.78447.69
6.96
13.22119.04139.22
29.3455.75
501.82586.91
Total 572.85 187.52 760.37

Human Resource Development Working Group on Power for 11th Plan
Page 8 of Chapter 7
Table 10 7.5% Manpower recouped during 11th Plan @ 1.5% per year
(Figures in Thousands) Sl.No. Formation Technical
Non-
Technical Total
1. Thermal Generation 7.53 2.69 10.22 2. Hydro Generation 3.58 1.55 5.13 3. Nuclear 0.62 0.29 0.91 4. Power System
Transmission Distribution - Hilly - Plains Sub-Total
2.093.98
35.8841.95
0.651.24
11.1613.05
2.74 5.22
47.04 55.00
Total 53.68 17.58 71.26
Table 11
Manpower available during the 11th Plan after considering retirement of 20% and 7.5% recouping etc. (Figures in Thousands)
Sl.No. Formation Technical
Non-Technical
Total
1. Thermal Generation 87.89 31.35 119.24
2. Hydro Generation 41.75 18.06 59.813. Nuclear 7.25 3.42 10.674. Power System
Transmission Distribution - Hilly - Plains Sub-Total
24.4746.51
418.66489.64
7.6114.46
130.20152.27
32.0860.97
548.86641.91
Total
626.53 205.10 831.63

Human Resource Development Working Group on Power for 11th Plan
Page 9 of Chapter 7
Table 12
Norms for Manpower (for 11th Plan)
(10% reduction due to Technological Achievements)
(Figures in Thousands) Sl. No.
Technical Non-Technical
Central State Central State Thermal (Total) 500 MW Unit & above 0.54 0.74 0.16 0.27 Below 500 MW Unit 0.63 1.03 0.19 0.55
1.
Gas/Liquid Fuel 0.32 0.32 0.10 0.15 2. Hydro 1.49 1.38 0.45 0.23 3. Nuclear 1.22 - 0.52 - 4. Power System
Transmission Distribution - Hilly - Plains
1 Employee for 3.83 ckm
2.00 per 1000
Consumers 1.00 per 1000
Consumers
-
30% of the Technical
Manpower
-do-
-
Table 13
Additional Manpower required due to envisaged Capacity Addition of 68,869 MW in 11th Plan, HV, EHV, UHV Transmission Line lengths of about 1,00,000 Ct.kms and an estimated 16 crore Distribution Consumers for Central and Private Sectors
(Figures in Thousands)
Sl.No. Capacity (MW) Technical Non-Technical Total Thermal 500 MW Unit & above
34,520 10.75 3.18 13.93
Below 500 MW Unit
13,490 5.37 1.62 6.99
1.
Gas/Liquid Fuel 2,114 0.48 0.15 0.63 2. Hydro
15,585 21.68 6.54 28.22
3. Nuclear
3160 3.85 1.64 5.49
4. Power System Transmission Distribution Hilly Plains Sub-Total
1 lakh Ckms & 16 crore
consumers considered
26.11
32.00 144.00
202.11
7.83
9.6 43.2
60.63
33.94
41.60 187.20 262.74
Total 244.24 73.76 318.00
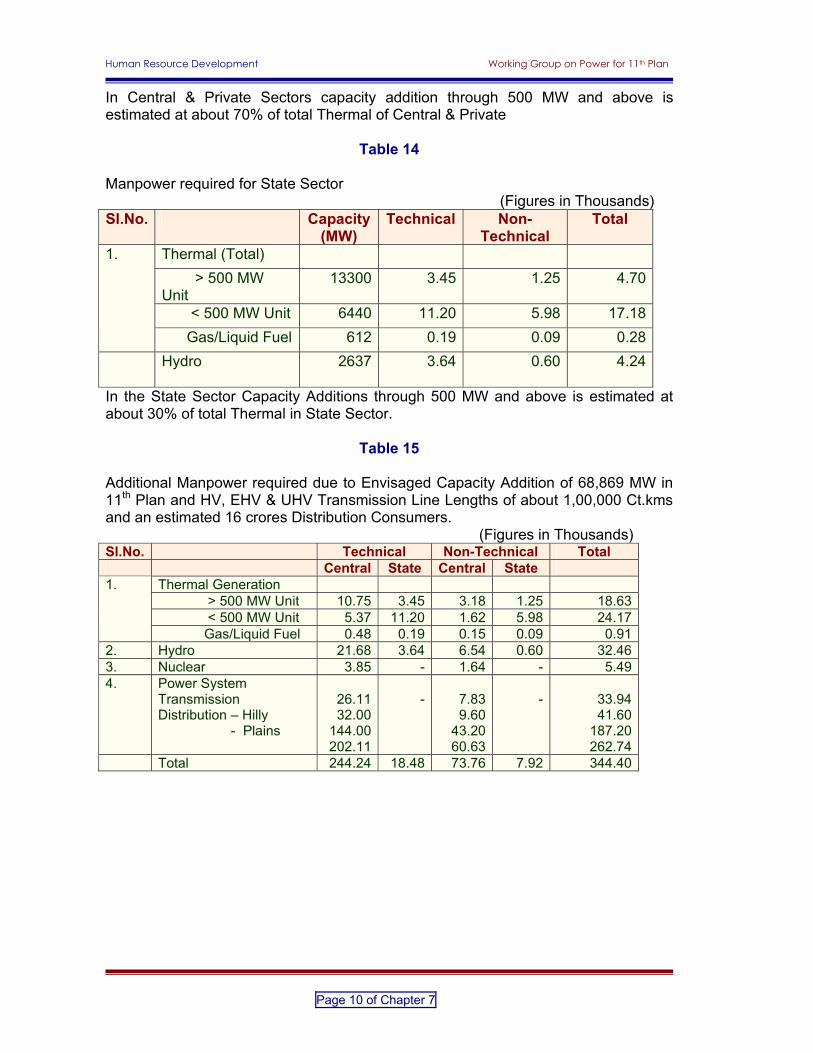
Human Resource Development Working Group on Power for 11th Plan
Page 10 of Chapter 7
In Central & Private Sectors capacity addition through 500 MW and above is estimated at about 70% of total Thermal of Central & Private
Table 14
Manpower required for State Sector (Figures in Thousands)
Sl.No. Capacity (MW)
Technical Non-Technical
Total
Thermal (Total) > 500 MW Unit
13300 3.45 1.25 4.70
< 500 MW Unit 6440 11.20 5.98 17.18
1.
Gas/Liquid Fuel 612 0.19 0.09 0.28 Hydro
2637 3.64 0.60 4.24
In the State Sector Capacity Additions through 500 MW and above is estimated at about 30% of total Thermal in State Sector.
Table 15
Additional Manpower required due to Envisaged Capacity Addition of 68,869 MW in 11th Plan and HV, EHV & UHV Transmission Line Lengths of about 1,00,000 Ct.kms and an estimated 16 crores Distribution Consumers.
(Figures in Thousands) Sl.No. Technical Non-Technical Total
Central State Central State Thermal Generation > 500 MW Unit 10.75 3.45 3.18 1.25 18.63 < 500 MW Unit 5.37 11.20 1.62 5.98 24.17
1.
Gas/Liquid Fuel 0.48 0.19 0.15 0.09 0.91 2. Hydro 21.68 3.64 6.54 0.60 32.46 3. Nuclear 3.85 - 1.64 - 5.49 4. Power System
Transmission Distribution – Hilly - Plains
26.1132.00
144.00202.11
- 7.839.60
43.2060.63
-
33.94 41.60
187.20 262.74
Total 244.24 18.48 73.76 7.92 344.40

Human Resource Development Working Group on Power for 11th Plan
Page 11 of Chapter 7
Table 16 Total Manpower required by the end of 11th Plan (Beginning of 12th Plan) i.e., on 1-4-
2012
(Figures in Thousands) Sl.No. Technical
Non-
Technical Total
1. Thermal Generation 119.33 43.62 162.852. Hydro Generation 67.07 25.20 92.273. Nuclear 11.10 5.06 16.164. Power System
Transmission Distribution - Hilly - Plains Sub-Total
50.5878.51
562.66691.75
15.44 24.06
173.40 212.90
66.02102.57736.06904.65
Total 889.25 286.78 1176.03
Table 17
Manpower available for the 12th Plan after 20% reduction (Due to retirement, death, change of profession etc. @ 4% per year)
(Figures in Thousands) Sl.No. Technical
Non-
Technical Total
1. Thermal Generation
95.46 34.89 130.35
2. Hydro Generation
53.65 20.16 73.81
3. Nuclear
8.89 4.05 12.94
4. Power System Transmission Distribution - Hilly - Plains Sub-Total
40.4662.81
450.13553.40
12.3519.25
138.72170.32
52.8182.06
588.85723.72
Total 711.40 229.42 940.82

Human Resource Development Working Group on Power for 11th Plan
Page 12 of Chapter 7
Table 18 7.5% Manpower required during 12th Plan due to recouping @ 1.5 per year
(Figures in Thousands) Sl.No. Technical
Non-
Technical Total
1. Thermal Generation 8.95 3.27 12.22 2. Hydro Generation 5.03 1.89 6.92 3. Nuclear 0.83 0.38 1.21 4. Power System
Transmission Distribution - Hilly - Plains Sub-Total
3.795.89
42.2051.88
1.161.80
13.0015.97
4.95 7.69
55.20 67.85
Total 66.69 21.50 88.19
Table 19
Manpower available for the 12th Plan after 20% retirement and 7.5%
(Figures in Thousands) Sl.No. Technical
Non-
Technical Total
1. Thermal Generation 104.41 38.16 142.57 2. Hydro Generation 58.68 22.05 80.73 3. Nuclear 9.72 4.43 14.15 4. Power System
Transmission Distribution - Hilly - Plains Sub-Total
44.2568.70
492.33605.28
13.5121.05
151.72186.29
57.76 89.75
644.05 791.56
Total 778.09 250.92 1029.01

Human Resource Development Working Group on Power for 11th Plan
Page 13 of Chapter 7
Table 20 Norms for 12th Plan
Sl.No. Technical Non-
TechnicalThermal (Total) > 500 MW Unit 0.67 0.25< 500 MW Unit 0.93 0.50
1.
Gas/Liquid Fuel 0.29 0.142. Hydro 1.25 0.213. Nuclear 1.10 0.474. Power System 1 Employee for 3.83 ckm
2 Employees per 1000 Consumers in Hilly Terrain 1 Employee per 1000 Consumers in Plains
30% of the Technical Manpower
Norms for the 12th Plan have been chosen as per the practice in CPSUs
Table 21
Additional Manpower in the 12th Plan for the envisaged Capacity Addition of 82,200 MW, Transmission Ct. Kms of 63,000 and about 14 crore Distribution Consumers
(Figures in Thousands)
Sl.No. Technical Non-Technical
Total
Thermal Generation 1. Thermal 40,200 26.93 10.0 36.932. Hydro 30,000 37.5 6.3 43.83. Nuclear 12,000 13.2 5.64 18.844. Power System
148.37 45.06 193.43
Total 82,200 226.0 67.0 293.0

Human Resource Development Working Group on Power for 11th Plan
Page 14 of Chapter 7
Table 22
Manpower required at the end of 12th Plan (Table 19 + 21)
(Figures in Thousands)
Formation Technical
Non-Technical
Total
1. Thermal Generation 131.34 48.16 179.5 2. Hydro Generation 96.18 28.35 124.53 3. Nuclear 22.92 10.07 32.99 4. Power System 753.65 231.35 985.0
Total 1004 318 1322 Based on the above estimation it is noted that the man/MW figure decreases as illustrated below
Table 23
Man/MW Ratio during various Plan Periods
End of Plan Period Overall Thermal Hydro Nuclear
Power System
9th 9.42 1.78 2.2 3.97 7.5 10th 7.00 1.44 1.95 2.96 5.41 11th 5.82 1.16 1.76 2.22 4.47 12th 4.93 0.97 1.52 1.77 3.77
7.3 TRAINING Training is an organized activity for increasing the knowledge and skill of people for a definitive purpose. It should involve systematic procedures for transferring technical know-how to the employees for doing specific jobs with proficiency and to bring about improvement in their performance. It plays an important role in human resource development and is necessary, useful and productive for all categories of the organisation. Trained personnel are like valuable assets of an organisation and are responsible for the progress and stability of the organisation. 7.3.1 Training Strategy The Working Group has come to the conclusion that the most important component of the strategy should be “Training for All” irrespective of the level in the hierarchy. At least one week of training in a year must be provided to every individual. Five days

Human Resource Development Working Group on Power for 11th Plan
Page 15 of Chapter 7
training per annum per technical person based on National Training Policy is being implemented selectively at some utilities. This needs to be strictly implemented. The Strategy includes training at following levels: i) Induction level training for new recruits ii) Refresher/advanced training for existing personnel iii) Management training to the Senior Executives/Managers i) Induction Level Training: Induction level training is mandatory under Indian Electricity Rules for thermal and hydro power stations. Training is to be imparted in recognized training institutes and is of 52 weeks duration for Engineers, Operators, Technicians engaged in Thermal Generation. The training is of 39 weeks for Engineers and 26 weeks for Supervisors and Technicians working in Hydro Power Stations. In case of Power systems, the training is of 52 weeks for graduate Engineers and 26 weeks each for Supervisors and Technicians. ii) Refresher/Advanced Training The post employment training provides opportunities for personnel at different levels of organizations to gain new skills and take up new responsibilities and keep pace with advancement in technology. Also, specialized programs must be organized for improving the workmen’s skill mainly in maintenance work. Training must be arranged for each individual on promotion, which calls for performing new/different roles and working conditions. Upgradation of skills at periodic intervals is necessary to keep pace with developments in the scientific world. This phenomena has entered into all areas of human life, but the need has been felt acutely, particularly in fields involving use of expensive, complex equipment like SCADA and for good O&M processes. The advent of automation and extensive use of computers has resulted in the creation of SIMULATORS. They have been found to be indispensable in periodic training of personnel in Thermal and Hydro Power Stations and also in Power System Networks. Simulators give a feel of the whole system to the trainee. Simulators need not necessarily be envisaged only for training in operation of equipment but also for systems, incorporating various experiences undergone by different personnel. Simulator happens to be a cost effective tool to provide highly interactive and high quality training to the operation personnel In view of the above the Working-Group recommends that Simulator training should be made compulsory for operation and maintenance staff of the Power Plants, including refresher training at suitable intervals.

Human Resource Development Working Group on Power for 11th Plan
Page 16 of Chapter 7
iii) Management Training Continuous development of Executives/Managers, specially at the transition period in their career and in the context of constantly changing business environment is of utmost importance. It has been noticed that while there are a large number of capable and knowledgeable engineers available in the Power Sector, their managerial ability needs to be improved. Due to process of reforms, restructuring, unbundling, privatization etc. the role of Managers have gained more importance. Executives in Finance and Management with non-technical background should also be provided technical orientation through suitable training programs. iv) Training for Nuclear Power Personnel Due to stringent safety requirements and other national and international regulations, every personnel working in Nuclear Power Sector is exposed to very specialized training. To meet the multi-disciplinary needs the Department of Atomic Energy (DAE) has built in-house training facilities both for professionals and Non-professionals and the well-established Nuclear Training Centre (NTC) at RAPS, MAPS and the TAPS. These Training Centres impart specialized training to their personnel. DAE has also established a few Nuclear Power Plant Simulators to impart specialized training to their personnel. Nuclear Power Corporation is fulfilling its training needs requirements in a long-term perspective. v) Training in Demand Side Management, Energy Efficiency And Energy Conservation There is a vast potential for energy savings through Human Resource Intervention. BEE has a major responsibility for simulating a major change in the energy efficiency ethos and practices (energy modesty) by directing the national energy conservation campaign as a mass movement and seeking wide support. In the 11th Plan, BEE will continue with their campaigns. In addition it will guide and partially fund the SDAs for their respective campaigns in the states. A few target groups to be addressed by BEE include the Central Government Officials in the administrative Ministries and Departments by triggering ideas for accelerating energy conservation drive and addressing of Policy Barriers impeding the same. Round Tables on energy policy sponsored by MoP will be organized to deliberate on the related issues. At the state level, SDAs will develop synergistic partnerships to spread the activities in the interior locations with active involvement of the local community, chambers of industry and Commerce, DISCOMs, Professionals and the media. SDAs will organize energy conservation interactive meets and senior officials of the state Ministries and Govt. departments and state Govt. enterprises. The meets would

Human Resource Development Working Group on Power for 11th Plan
Page 17 of Chapter 7
focus on Policy support needed to step up the tempo of energy conservation movement in the states.
• Cadre of energy managers and energy auditors BEE is conducting examinations for certifying energy managers and energy auditors in collaboration with National Productivity Council. These efforts will be continued and periodically reviewed. BEE will also augment these efforts through distance learning programs, tutorial support to the prospective candidates for the national examination besides refresher programs to the certified energy managers/energy auditors. • Orientation Programs: Top Level Industry –personnel Energy efficiency improvement in India is still considered to be the engineer’s domain, and CEOs and Chief Finance Officers are not yet aware that energy efficiency improvement has to improve the profitability of their companies. Industry bodies will be roped in by the SDAs for orienting top executives from the industry. • Demonstrative Training – operators SDAs may support skill development for operators on efficient energy use through demonstrative approach involving exposure of the participants to the best practices. This may also include setting up of two demonstration centers to show case energy efficient products through models, field visits and video presentations to simulate shop floor conditions. • Farmers awareness programs Ministry of Power had mounted awareness programs with the support of manufacturers to demonstrate the energy efficient agricultural pumps in various Trade Fairs as well as local Fairs. Such efforts will be continued with the support of SDA, DISCOMs and other voluntary agencies. • Drivers training PCRA has been very active in imparting drivers on fuel-efficient driving practices. It also has award schemes to motivate drivers and state transport agencies to achieve maximum fuel efficiency includes best kilometer per liter. These efforts will be extended. • Campaign for General public & Youth National wide campaign on Energy Conservation will be mounted to publicize the simple ways of saving energy by involving the general public, the youth, government agencies, public and private sector, professionals. BEE will utilize mass media effectively for conveying the message of energy conservation. Yardsticks for evaluation of awareness campaigns will be developed.

Human Resource Development Working Group on Power for 11th Plan
Page 18 of Chapter 7
• Energy conservation in curriculum There is a need for introducing module on energy conservation (EC) in the curriculum in schools and colleges. The EC concept will be introduced by modifying existing text of related subjects in school & college curriculum. Active involvement of NCERT, State Boards, Academic institutions, Universities will be ensured for review of the existing curriculum, training and sensitization of teachers and principals.
Efforts would be put in for training /equipping the teachers of vocational schools, Industrial Training Institutes on inducting energy efficiency modules in the compulsory and optional subjects. The curricula for graduation /post –graduation in engineering levels needs to suitably modify. Suitable modules will be included for the management education as well as finance, science and humanities streams (for subjects such as social sciences, economics, environmental education, etc. vi) Training in Information Technology Information technology has pervaded all spares of life, adequate training according to the job requirement should be provided in the field of information technology. Use of IT should be promoted and maximum number of personnel should be made computer literate. As information technology is also developing very fast, the training should be dynamic in nature to ensure that knowledge and skill of people are in tune with latest development in the field of IT. Employees should also be made aware of the Right to Information Act. vii) Introduction of Training on attitudinal changes/ behavioral sciences. Attitude of an individual plays an extremely important role in contributing to his/her performance level. Thus, in spite of availability of the best of knowledge and skill, the ability of providing the desired services may still be found wanting in individuals if they are not imbued with appropriate attitudinal disposition. It has been observed that the training is presently concentrated mainly in the area of acquisition of knowledge and upgradation of skill and very little emphasis is given on attitudinal changes/behavioral sciences as it is high time to introduce this aspects of training in the management curriculum of induction level training as well as retraining programs. In some of the Utilities behavioral science has achieved very good results particularly with respect to the attitudinal change of the lower category of personnel. After undergoing such training, the personnel develop a sense of belongingness to the organization. In Addition To Technical Skills, Power Professionals, Need To Have Life Skills Such As:
Communication Skills Time Management Team Work Technical Writing Ethics

Human Resource Development Working Group on Power for 11th Plan
Page 19 of Chapter 7
7.3.2 Training Load Training requirement for 11th and 12th Plans have been worked out on the basis of manpower projections with the following assumptions:
i) Induction training to all freshly recruited technical persons as per statutory requirements under Indian Electricity Rules.
ii) For all freshly recruited non-technical staff induction training of three
months for executives and one month for non-executives. iii) Minimum one week training (Refresher/Managerial/Attitudinal) every year
for all personnel. Overall training load during 11th Plan is estimated as 4.65 lakh man-months/year against the available training infrastructure of 0.77 lakh man-months/year. Out of the total, training load for technical people is estimated as 3.64 lakh man-months/year (Appendix 7.1). The estimation for non-technical personnel is 0.73 lakh man-months/year (Appendix 7.2). While assessing the above, Assumptions made are:
1. One week refresher training for all employees. 2. Fresh Manpower on account of re-coupment and capacity addition not
considered for refresher training. 3. For Non-Technical staff induction level training duration is 3 months for
Executives & 1 month for Non-Executives. 4. 20% of the refresher training load is taken as training load for Management
training including behavioural component Overall training load during 12TH Plan is estimated as 4.78 lakh man-months/year against the available infrastructure of 0.80 lakh man-months/year. Out of the total training load for technical people is estimated as 3.98 lakh man-months/year (Appendix 7.3). The estimation for non-technical personnel is 0.80 lakh man-months/year (Appendix 7.4). While assessing the above, Assumptions made are:
1. One week refresher training for all employees. 2. Fresh Manpower on account of re-coupment and capacity addition not
considered for refresher training. 3. For Non-Technical staff induction level training duration is 3 months for
Executives & 1 month for Non-Executives. 4. 20% of the refresher training load is taken as training load for Management
training including behavioural component Basically three types of training infrastructure/facilities are available:
i) Training institutes recognized by CEA for imparting statutory induction training

Human Resource Development Working Group on Power for 11th Plan
Page 20 of Chapter 7
ii) Lineman Training Institutes
Other Training facility (Class/board rooms for refresher/ management programs) including networking with academic/training institutions outside power sector. 7.3.3 Training Infrastructure-Requirements vis-à-vis availability It may be seen from Appendix 7 .1 that during 11th Plan the availability of infrastructure is about 0.77 lakh man-months against the requirement of 3.40 lakh man-months/year i.e., a deficit of about 77%. It may be noted that inspite of such a situation of lack of availability of required infrastructure, quite often a number of training institutes remain under utilized. The Sub Group also stressed on Networking with the training/academic institutions like NPTI, IIMs, ASCI and other reputed institutions for providing training to power sector personnel and other stakeholders. 7.4 FUNDING & CAPITAL OUTLAY Establishing and sustaining a continuous training initiative needs adequate funds. Decision makers must appreciate that training is an investment and not a mere expenditure towards a ritual. The funds required for training can broadly be categorized under two heads, ‘Capital outlay (Plan)’ and “Recurring Expenditure (Non Plan). The fund required for creating training infrastructure is booked under the first one while expenses towards salaries, TA/DA training fee etc. comes under the second. 10 major states should set up State Level Training Institutes encompassing training infrastructure for Induction level, Linemen and for Franchisees. GoI may provide part funding of Rs 10 Crores for each state. An incentive to the sponsoring organization @ Rs 2000 per man-week of Refresher Training (towards part Training Fee Component only) may be provided by GoI to the institute providing training. Approximate outlay during the 11th Plan will be 100 crores. Central assistance of about Rs 140 Crores may be provided for setting up National Level Transmission, Distribution and a Hydro Institute. GIS Based Electrical Distribution Systems to be set-up in various regions for training. Budgetary allocation of Rs 6.00 crores is proposed. For Upgradation of various labs and Infrastructure of National Institutes, 100 crores is proposed. A 660 MW Super Critical Power Plant Simulator at a cost of Rs. 16.00 Crores is also proposed.
Human Resource Development Working Group on Power for 11th Plan
Page 21 of Chapter 7
The Total Plan period outlay is about Rs 462 Crores. This does not include the plan fund outlay proposed by other Sub-Groups The Working Group recommends Training Institutes and Centers to enter into bilateral/multilateral agreements with various funding agencies such as UNDP, USAID, GTZ, World Bank, ADB, Japanese Aid etc., through appropriate forums such as MoP, State Boards /Utilities for the development of state-of-the-art training facilities. Recurring Expenditure 5% of Salary budget should be earmarked exclusively for training by every organization. Expenditure towards training may be included while costing for power tariff like other essential cost heads like servicing of capital, fuel charges, salary, insurance etc. and this expenditure should be reflected in the annual balance sheet of the organization. 7.5 MAJOR RECOMMENDATIONS Every employee should be provided refresher training of minimum one week per year as mandated in National Training Policy. Statutory rules provide for periodical refresher training for all O&M personnel in different segments. In addition, refresher training to all power sector personnel as per their requirement should also be included. A national programme also needs to be launched for training and capacity building for upgrading and enhancing the skills of franchisee who are proposed to be deployed on a large scale for small as well as urban areas.
**********

Human Resource Development Working Group on Power for 11th Plan
Page 22 of Chapter 7
Appendix 7.1 Training Load during 11th Plan for Technical (Includes Infrastructure) in Thousand-Man-Months (TMM)
S. No. Area
Category Manpower to be trained in Thousands
Average duration in Months
Total for 11th Plan Thou-Man-Months
Per year Thou-Man-Months (A)
On-Job component 50%of (A)
Infrastructure required per year (TMM)
Infrastructure available in 10th Plan + 5% (TMM)
Surplus (+) Deficit (-)
Thermal (Induction)
Engrs – 30% Engineers 11.69 12 140.28 28.06 14.03 14.03 12.85 -1.18 Opers – 15% Op/Sup/JEs 5.84 12 70.08 14.01 7.00 7.00 10.95 +3.94 Tech – 55% Technicians 21.43 12 257.16 51.43 25.71 25.71 15.05 -10.66
1.
Sub-Total 38.97 467.52 93.50 46.74 46.74 38.86 -7.88 Hydro(Induction) Engrs – 20% Engineers 5.78 9 52.02 10.40 5.20 5.20 0.64 -4.56 Oper – 35% Op/Sup/JEs 10.11 6 60.66 12.13 6.06 6.06 1.43 -4.63 Tech – 45% Technicians 13.00 6 78.00 15.6 7.8 7.8 2.18 -5.62
2.
Sub-Total 28.90 190.68 38.13 19.06 19.06 4.26 -14.80 3. Power System
Transmission (Induction)
Engrs – 10% Engineers 2.82 12 33.84 6.77 3.38 3.38 2.40 - 0.98Oper – 20% Op/Sup/JEs 5.64 6 33.84 6.77 3.38 3.38 1.76 -1.62 Tech – 70% Technicians 19.75 6 118.50 23.70 11.85 11.85 9.82 -2.03
(a)
Sub-Total 28.21 186.18 37.24 18.62 18.62 13.98 -4.64 (b) Distribution
(Induction)
Engrs – 10% Engineers 21.59 6 129.54 25.91 12.95 12.95 2.40 -10.55
Oper – 20% Op/Sup/JEs 43.18 3 129.54 25.91 12.95 12.95 1.76 -11.19
Tech – 70% Technicians 151.10 1 151.10 30.22 15.11 15.11 9.82 -5.29
Sub-Total 215.86 410.18 82.04 41.01 41.01 13.98 -27.03
4. Refresher Course Refresher Course
566.22 1.25 566.22 113.24 0 113.24 4.53 -108.71
5. Management Training
Management (20%)
566.22 141.55 28.31 0 28.31 1.50 -26.81
Grand Total 878.16 1820.78 364.15 125.43 266.92 77.13 -189.79

Human Resource Development Working Group on Power for 11th Plan
Page 23 of Chapter 7
Appendix 7.2
Training Load during 11th Plan for Non-Technical (Includes Infrastructure) in Thousand-Man-Months
S. No.
Area Category Manpower to be trained in Thousands
Average duration in Months
Total for 11th Plan Thou-Man-Months
Per year Thou-Man-Months (A)
On-Job component 50%of (A)
Infrastructure required per year (TMM)
Infrastructure available in 10th Plan + 5%(TMM)
Surplus (+) Deficit (-)
Thermal (Induction) Exec – 20% Executives 2.99 3 8.97 1.79 0 1.79 0 -1.79
Non-Exec – 80% Sup/UDCs /LDCs etc.
11.97 1 11.97 2.39 0 2.39 0 -2.39
1.
Sub-Total 14.96 20.94 4.18 0 4.18 0 -4.18 Hydro(Induction)
Exec – 20% Executive 1.74 3 5.22 1.04 0 1.04 0 -1.04 Non-Exec – 80% Sup/UDCs
/LDCs etc. 6.95 1 6.95 1.39 0 1.39 0 -1.39
2.
Sub-Total 8.69 12.17 2.43 0 2.43 0 -2.43 3. Power System
Transmission (Induction)
Exec – 20% Executive 1.69 3 5.07 1.01 0 1.01 0 -1.01 Non-Exec – 80% Sup/UDCs
/LDCs etc. 6.79 1 6.79 1.35 0 1.35 0 -1.35
(a)
Sub-Total 8.48 11.86 2.36 0 2.36 0 -2.36 (b) Distribution
(Induction)
Exec – 20% Executive 13.04 3 39.12 7.82 0 7.82 0 -7.82 Non-Exec – 80% Sup/UDCs
/LDCs etc. 52.16 1 52.16 10.43 0 10.43 0 -10.43
Sub-Total 65.20 91.28 18.25 0 18.25 -18.25 4. Refresher Course Refresher
Course 184.39 1.25 184.39 36.87 0 36.87 0 -36.87
5. Management Training
Management (20%)
184.39 46.09 9.22 0 9.22 0 -9.22
Grand Total 281.72 366.73 73.31 0 73.31 -73.31

Human Resource Development Working Group on Power for 11th Plan
Page 24 of Chapter 7
Appendix 7.3 Training Load (Induction) during 12th Plan for Technical (Includes Infrastructure) in Thousand-Man-Months
S. No.
Area Category Manpower to be trained in Thousands
Average duration in Months
Total for 12th Plan Thou-Man-Months
Per year Thou-Man-Months (A)
On-Job component 50%of (A)
Infrastructure required per year (TMM)
Infrastructure available in 11th Plan + 5% (TMM)
Surplus (+) Deficit (-)
Thermal (Induction)
Engrs. – 30% Engineers 9.92 12 119.04 23.81 11.90 11.90 13.49 +1.59 Oper – 15% Op/Sup/JEs 4.96 12 59.52 11.90 5.95 5.95 11.49 +5.54 Tech – 55% Technicians 18.19 12 218.28 43.66 21.82 21.82 15.80 +6.03
1.
Sub-Total 33.08 396.84 79.37 39.68 39.68 40.78 +1.10 Hydro
(Induction)
Engrs. – 20% Engineers 6.00 9 54.00 10.80 5.40 5.40 0.67 -4.73 Oper – 35% Op/Sup/Jes 10.51 6 63.06 12.61 6.30 6.30 1.50 --4.80 Tech – 45% Technicians 13.51 6 81.06 16.21 8.10 8.10 2.28 -5.82
2.
Sub-Total 30.03 198.12 39.62 19.80 19.80 4.45 -15.35 3. Power System
(a) Transmission (Induction)
Engrs. – 10% Engineers 2.02 12 24.24 4.85 2.43 2.43 2.52 -0.09
Oper – 20% Op/Sup/JEs 4.04 6 24.24 4.85 2.43 2.43 1.85 -0.58 Tech – 70% Technicians 14.17 6 85.02 17.00 8.50 8.50 10.30 -1.80 Sub-Total 20.24 133.50 26.70 13.36 13.36 14.67 -2.47 (b) Distribution
(Induction)
Engrs. – 10% Engineers 20.21 6 121.26 24.25 12.12 12.12 2.52 -9.60 Oper – 20% Op/Sup/JEs 40.42 3 121.26 24.25 12.12 12.12 1.85 -10.27 Tech – 70% Technicians 141.46 1 141.46 28.29 14.14 14.14 10.30 -3.84 Sub-Total 202.09 383.98 76.79 38.38 38.38 14.67 -23.71 4. Refresher Course Refresher Course 702.51 1.25 702.51 140.50 0 140.50 4.75 -135.75
5. Management Training
Management (20%)
702.51 175.62 35.12 0 35.12 1.57 -33.55
Grand Total 987.95 1990.57 398.11 111.22 286.84 80.89 -205.95

Human Resource Development Working Group on Power for 11th Plan
Page 25 of Chapter 7
Appendix 7.4 Training Load (Induction) during 12th Plan for Non-Technical (Includes Infrastructure) in Thousand-man-months
S. No.
Area Category Manpower to be trained in Thousands
Average duration in Months
Total for 12th Plan Thou-Man-Months
Per year Thou-Man-Months (A)
On-Job component 50%of (A)
Infrastructure required per year (TMM)
Infrastructure available in 11th Plan +5% (TMM)
Surplus (+) Deficit (-)
Thermal (Induction)
Exec – 20% Executives 2.57 3 7.71 1.54 0 1.54 0 -1.54Non-Ex – 80% Sup/UDCs
/LDCs etc. 10.28 1 10.28 2.06 0 2.06 0 -2.06
1.
Sub-Total 12.85 18.20 3.60 0 3.60 0 -3.60Hydro(Induction)
Exec – 20% Executives 1.22 3 3.66 0.73 0 0.73 0 -0.73Non-Exec – 80% Sup/UDCs
/LDCs etc. 4.87 1 4.87 0.97 0 0.97 0 -0.97
2.
Sub-Total 6.09 8.53 1.70 0 1.70 0 -1.703. Power System
Transmission (Induction)
Exec– 20% Executives 1.22 3 3.66 0.73 - 0.73 0 -0.73 Non-Exec – 80% Sup/UDCs
/LDCs etc. 4.88 1 4.88 0.97 - 0.97 0 -0.97
Sub-Total 6.10 8.54 1.70 1.70 -1.70 Distribution
(Induction)
Exec– 20% Executives 12.20 3 36.60 7.32 - 7.32 0 -7.32 Non-Exec – 80% Sup/UDCs
/LDCs etc. 48.80 1 48.80 9.76 - 9.76 0 -9.76
Sub-Total 61.00 85.40 17.08 17.08 -17.094. Refresher Course Refresher
Course 225.37 1.25 225.37 45.07 0 45.07 0 -45.07
5. Management Training
Management (20%)
225.37 56.34 11.27 0 11.27 0 -11.27
Grand Total 311.41 402.38 80.42 80.42 -80.42

Legislative and Policy Issues Working Group on Power for 11th Plan
Page 1 of Chapter 8
Chapter-8
LEGISLATIVE AND POLICY ISSUES
8.0 BACK GROUND The Electricity Act 2003 has put in place a liberal and progressive framework for the development of electricity sector in the country. Its main objectives are promoting competition, Protecting interest of consumers, Supply of electricity to all areas, Rationalization of electricity tariff and ensuring transparent policies regarding subsidies. The National Electricity Policy and the Tariff Policy have been notified under the provisions of the Act. The National Electricity Policy, inter-alia, aims at Providing access to electricity to all in next five years, Overcoming energy and peaking shortages and having adequate spinning reserves by year 2012 for fully meeting the demand, Supply of reliable and quality power of specific standards in an efficient manner and at reasonable rates. The Tariff Policy aims at ensuring financial viability of the sector and promoting transparency, consistency and predictability in regulatory approaches. It also aims at promoting competition and efficiency in operation and meeting quality of supply. The Working–Group deliberated on the specific recommendations made in the Integrated Energy Policy and National Electricity Policy and recommended measures for their implementation. The Integrated Energy Policy and the National Electricity Policy endeavor to fundamentally change the Power Sector to function in an open, competitive regime under regulatory oversight. The provisions of these Policies must be implemented within the stipulated time in order to make power available at affordable cost to all by 2012. This Chapter includes the provisions of the Policies and measures recommended by the Working-Group for their implementation. In certain cases provisions of the Policies are countered by the Working-Group, in case of which the Government may take appropriate action. Comments of Prayas Energy Group are enclosed at Appendix 8.2 and IIT Kanpur are enclosed at Appendix 8.3. 8.1 IMPLEMENTATION OF PROVISIONS OF ACT AND POLICIES The legal provisions of the Act, National Electricity Policy, Tariff Policy and the Integrated Energy Policy provide an appropriate legislative and policy framework for the development of the country. There is a need to implement these at the earliest to achieve the stated goals.

Legislative and Policy Issues Working Group on Power for 11th Plan
Page 2 of Chapter 8
8.2 STATUS OF IMPLEMENTATION AND DEVIATIONS OF INTEGRATED
ENERGY POLICY The Integrated Energy Policy announced by the Government aims at overall development of the Energy Sector. It is essential that its recommendations are implemented within the stipulated time period in order to realize the benefits envisaged, Details of the recommendations of the Policy and the status of their recommendations are as furnished below: 1. Recommendation : Bifurcate agricultural pumping load from the non-pumping
load in all rural feeders and use available technological measures to limit and measure the amount of energy supplied to pumps.
Position Being recommended by the Working Group
2. Recommendation : To introduce automatic meter reading at distribution transformers to pinpoint theft of electricity. To introduce an incentive scheme for staff whereby they share additional revenue collected in their distribution circle.
Position Tariff Policy (para 8.2.1(2)) provides that SERCs may encourage suitable local area based incentive and disincentive scheme for the staff of the utility linked to reduction in losses. Further, States are being advised to introduce suitable incentive schemes for rewarding informers who assist in control of theft.
3. Recommendation : The data about AT&C losses should be disseminated to the public to create support for corrective action.
Position The National Electricity Policy (para 5.12.2) provides that the data reliable index should be compiled and published by the Central Electricity Authority. Similar action should be taken in respect of feederwise AT&C losses.
4. Recommendation : For all loads above 50 kWh, intelligent metering to facilitate real time and remote recording should be adopted.
Position The National Electricity Policy (para 5.4.10) provides adoption of modern IT systems with due consideration to costs and benefits.
5. Recommendation : Introduce time-of-day pricing with shift to electronic meters.

Legislative and Policy Issues Working Group on Power for 11th Plan
Page 3 of Chapter 8
Position CEA’s Metering Regulations provide that all new consumer meters would be of electronic type. The Tariff Policy (para 8.4) provides that time differentiated tariff shall be introduced on priority for large consumers (above 1 MW) within one year.
6. Recommendation : All Central assistance to States in power sector must be linked exclusively to loss reduction and improved viability.
Position Being recommended by Working Group.
7. Recommendation : Management reforms particularly in the distribution sector are as important as a liberal captive and open access regime.
Position Working Group has given specific recommendations in this regard.
8. Recommendation : Involve stakeholders for successful regulation. Appoint an office of “Consumer Advocate” at State level.
Position Working Group has recommended encouraging participation of consumer organizations in the regulatory process. The Electricity Act provides for Ombudsman to look into settlement of consumer grievances. The Electricity Rules, 2005 provide for six monthly report of the ombudsman to the Regulatory Commission in this regard.
9. Recommendation : Strength of dominant public sector can be effectively leveraged to introduce competition that extracts efficiency gains in generation, transmission and distribution.
Position The Working Group has also recommended that the public sector companies should be encouraged to participate in the competitive bids.
10. Recommendation : In case of tariff determination based on costs and norms, the Regulatory Commission may adopt either ROE approach or ROC approach whichever is considered better in the interest of consumers.
Position Tariff Policy (para 5.3(a)) provides for this.
11. Recommendation : Distribution should be bid on the basis of distribution margin or paid for by a regulated distribution charge.
Legislative and Policy Issues Working Group on Power for 11th Plan
Page 4 of Chapter 8
Position Tariff Policy (para 5.3(a)) provides that the SERC may consider “distribution margin” as basis for allowing return in distribution.
12. Recommendation : All generation and transmission projects should be developed through competitive route with a transition window of 5 years for public sector.
Position Tariff Policy (para 5.1) already provides for this.
13. Recommendation : Liberal captive and group captive regime should be realized on the ground on the basis of competitive wheeling charges.
Position Tariff Policy provides for this and Forum of Regulators has been requested to expedite this.
14. Recommendation : Any subsidy given to poor households or farmers should be funded from the State Government budget.
Position Section 65 of the Electricity Act already provides for this.
15. Recommendation : Existing projects and future investment which are not competitively bid must comply with CERC tariff guidelines.
Position This is already provided in section 61 of the Act which makes it mandatory to follow CERC’s principles and methodologies in respect of tariff for generation and transmission.
16. Recommendation : Regulators should set tariff for a number of years and differentiate them by time-of-day.
Position Tariff Policy (para 5.3(h)) provides that the Multi Year Tariff is to be adopted for tariffs to be determined from April 1, 2006. The policy also provides for TOD tariffs.
17. Recommendation : Respective regulators should adopt best international practices for harnessing distributed generation with waste heat recovery, Demand Side Management and energy conservation.
Position This is already provided in the National Electricity Policy and needs to be implemented.
18. Recommendation : Regulators must establish feed-in-tariffs for power from renewable energy sources. Such tariffs should provide Time of day benefits.
Legislative and Policy Issues Working Group on Power for 11th Plan
Page 5 of Chapter 8
Position Tariff Policy in its para 6.4 provides for competitive procurement of power from non-conventional sources of energy. The policy envisages bidding among the suppliers from same sources of non-conventional energy. To elaborate, bids are required to be called separately for energy from solar based plants, wind based plants, biomass based plants etc. The Tariff Policy also provides that the Appropriate Commission may introduce differential rates of fixed charges for peak and off-peak power for better management of load.
19. Recommendation : Separate content from carriage in both transmission and distribution with regulated caps for wheeling charges at different voltages and distribution margins for consumers. Introduce competition in building transmission capacity on the basis of wheeling tariffs and in distribution on the basis of distribution margins.
Position The Act debars Central Transmission Units (CTU) from trading. Tariff Policy already provides for developing transmission projects through competitive bidding. The policy also gives option of adopting “distribution margin” as a method for regulating distribution.
20. Recommendation : Transmission lines critical for inter-state flows of power and for system stability should be managed by the Central body even if such lines are entirely in one State.
Position CERC has full jurisdiction over inter-state transmission of electricity. Such inter-state transmission includes conveyance of electricity within a State also.
21. Recommendation : Independent and/or fully transparent load dispatch is required to create level playing field.
Position RLDC is under the control of the Central Commission. Presently, RLDCs are being operated by CTU i.e. Power Grid. This function of CTU could be ring fenced adequately to ensure transparency.
22. Recommendation : An independent planning body is necessary for transmission networks.

Legislative and Policy Issues Working Group on Power for 11th Plan
Page 6 of Chapter 8
Position According to section 3 of the Electricity Act, 2003, CEA has to prepare the National Electricity Plan in accordance with the National Electricity Policy. The National Electricity Policy provides that CEA shall prepare short-term and perspective plan. Further the plan has to include transmission planning also. The National Electricity Policy (para 5.3.2) provides that the CTU and the STU shall discharge responsibility of network planning and development based on the National Electricity Plan in coordination with all concerned agencies as provided in the Act. This arrangement takes care of planning by an expert body CEA and necessary coordination in network expansion by the respective transmission utility.
23. Recommendation : Require the State Governments to notify rural areas under section 14 of the Act.
Position The Rural Electrification Policy (para 8.2) provides that the State Governments would notify the rural area for this purpose within two months. 23 States have already issued notifications.
24. Recommendation : To facilitate distributed generation and promote renewable sources of energy, make mandatory setting up grid interconnections for feeding surplus power into the grid at the grid’s avoided cost.
Position Tariff Policy (para 6.4) provides for competitive procurement of power from non-conventional sources of energy.
25. Recommendation: Encourage the organized sector to adopt rural communities in their areas of operation for setting up off-grid and distributed generation facilities and involve local community.
Position The Rural Electrification Policy (para 8.8) provides for a special enabling dispensation for setting up standalone system upto one MW using locally available resources. This needs to be implemented at the earliest.
26. Recommendation : Augment exploration/drilling capacity of CMPDIL and it should also be given more autonomy. Open up coal exploration for other players also.
Position Working Group has given recommendations in this regard.

Legislative and Policy Issues Working Group on Power for 11th Plan
Page 7 of Chapter 8
27. Recommendation : Allocate coal blocks in competitive and transparent way creating a level playing field with a condition that these blocks be brought into production by year 2011-12.. Transfer pricing of coal from captive mines needs to be established both for assessing royalties as well as tariffs in a regulated sector such as power wherein coal cost is a pass through.
Position Working Group has recommended allotment of captive coal blocks in a transparent and competitive manner.to power generation projects based on competitive bidding for lowest cost of electricity.
28. Recommendation : Rail freight rates for coal transport should be rationalized.
Position Working Group recommends implementation of this
measure as it is essential for lowering the cost of power
29. Recommendation : Simplify procedures for preparation of EMPs for coal mining. Create a reserve of compensatory afforestation in advance.
Position Working Group recommends implementation of this measure as it is necessary to accelerate captive coal mining.
30. Recommendation : A regulator in coal sector for regulating allotment and exploitation of coal blocks, for approving coal price revisions.
Position Working Group recommends implementation of this measure.
31. Recommendation : Coal linkages should be made tradable in the first instance with long term objective of replacing the current coal linkages for power plants with fuel supply and transport agreements.
Position Working Group opines that there is a requirement to convert the coal linkages into formal fuel supply contracts catering to full requirement of the power plant. However, there is a need to be cautious in implementation of this recommendation for making coal linkages tradable as there is a possibility of speculative trading leading to increase in price of fuel.
32. Recommendation : Include natural gas and LNG in the category of declared goods so that only central sales tax of 4% is levied.

Legislative and Policy Issues Working Group on Power for 11th Plan
Page 8 of Chapter 8
Position Working Group recommends implementation of this measure.
33. Recommendation : In the present scenario price of domestic natural gas, its allocation should be independently regulated on a cost plus basis including reasonable returns.
Position Working Group has also recommended this.
34. Recommendation : The Integrated Energy Policy gives two options for ensuring environmental impact. First option is to impose environmental tax and give subsidies. Second option is setting up emission and energy conservation standards on the equipments.
Position The Integrated Energy Policy provides for optional strategies. Second option of setting emission and energy conservation standards on equipments is more suitable for power sector and can be implemented easily. The National Electricity Policy also provides that all generating stations should ensure full compliance with prescribed environmental norms and standards. This is considered to be a better option than imposing environmental tax. Environmental tax would raise the cost of electricity which is a basic infrastructure requirement and would adversely affect development of our economy. Instead of taxes, penalties should be imposed on those who fail to comply with the laid down standards.
35. Recommendation: Institutionalize the selection of regulators and their impact assessment under the regulatory academy.
Position Setting up the suggested regulatory academy would be appropriate for capacity building in the staff of various regulatory bodies. The selection of the regulators is governed by the relevant provision of law. However, there is a genuine concern about the outcome of the selection process in case of some of the State Electricity Regulatory Commissions. Since the electricity is a concurrent subject, ways and means to strengthen and improve the selection process at State level needs to be discussed in depth with the State Governments. Assessment of impact of regulatory process is being done by NGOs and other similar organizations.
36. Recommendation : Mandate training for all regulators.
Position Recommended by the Working Group.

Legislative and Policy Issues Working Group on Power for 11th Plan
Page 9 of Chapter 8
37. Recommendation : Grant financial autonomy to regulatory institutions.
Position The Electricity Act already provides for a fund for each Regulatory Commission.
38. Recommendation : Make regulators accountable to the Parliament and mandate annual reports.
Position This is already provided in the Act. Format of the reports has been laid down in the rules.
39. Recommendation : With reference to Mega Power Policy, there should be no discrimination in available incentive based on the size or type of technology or fuel used .
Position Working Group opines that this needs further examination.
40. Recommendation : The Central Government and the State Governments and FIs should develop long term (20 years plus) debt instrument.
Position This would be necessary in view of the provisions of the Tariff Policy to dispense with advance against depreciation.
41. Recommendation : Special policies for encouraging renewable energy should be for a well defined period or upto a well defined limit in a way that encourages outcome and not just outlays.
Position Working Group has given specific recommendation in this regard.
42. Recommendation : The environmental subsidy for renewables could be financed by a cess on non-renewables and fuels causing environmental damage.

Legislative and Policy Issues Working Group on Power for 11th Plan
Page 10 of Chapter 8
Position This would increase the cost of electricity across the board. The Electricity Act provides for preferential purchase from non-conventional sources to the extent specified by the Regulatory Commission taking into account local situation. The National Electricity Policy provides for preferential charges for procuring energy from non-conventional sources in view of the fact that such non-conventional technologies would take some time to compete with conventional sources in terms of cost. The Tariff Policy stipulates that these technologies would compete with conventional sources in the long term in terms of full costs. Some of the non-conventional sources like wind have almost reached the stage of self-sustainability. To promote non-conventional source further, there is a need to provide for a long term financing because initial capital cost is higher in these cases.
43. Recommendation : Supply companies/ entrepreneurs could be free to set up micro grid and recover revenues from customers.
Position The Rural Electrification Policy (para 8.8) provides for a special enabling dispensation for setting up standalone system upto one MW using locally available resources. Working Group also recommends that this needs to be implemented at the earliest.
44. Recommendation : A charge of Rupee one per unit for the first 30 units per month could be levied on poor households.
Position National Electricity Policy (para 5.5.2) provides for cross subsidized tariff for 30 units per month for BPL households.
45 More Effective Planning & Implementation Recommendation in Policy (Pg. 114 Cl 18) - Policy stipulates “In order to avoid shortages and take timely action, annual electricity requirements should be projected and year-wise targets for generation capacity be set for seven years. Each project should be monitored along with a number of milestones ………..” Working-group – Implementation The achievements in capacity addition during 8th & 9th plan periods have been merely 50% of the plan target. Also during 10th Plan the actual capacity addition is expected to be about 31,000 MW against the plan target of 41,110 MW. The Working-Group deliberated on the reasons for this large variation and recommended as follows:-

Legislative and Policy Issues Working Group on Power for 11th Plan
Page 11 of Chapter 8
The status of preparation and approvals etc. for each of scheme included in the 11TH Plan must be realistically assessed and the sponsoring entity must indicate 5 to 6 time based milestones for each scheme. Plan document should indicate scheme wise commissioning targets for 7 years (5 years of the Plan period and first two years of the next plan) and monitoring should be done for all these schemes so that substantial capacities are commissioned from the first year of the Plan onward. However, for 11th Plan, five year plan period may be considered. Since Hydro & Nuclear Projects have comparatively larger Gestation period, planning for their projects shall be for a period of 10 years. In order to facilitate timely implementation of projects, capacity building in respect of infrastructural requirements like road, railways, erection, manufacturing etc. is essentially to be ensured. Well structured plans need to be evolved to ensure this aspect. Demand adopted for Planning 46. Recommendation in Policy ( Pg 20, Table 2.5) Policy has projected the following installed capacity requirements during the subsequent Plans corresponding to 8% and 9% GDP growth: (Fig. in GW)
Plan 8% GDP Growth 9% GDP Growth 11th 220 233 12th 306 337 13th 425 488 14th 575 685 15th (till 2031-32) 778 960
Working- group – deviation The Working-Group recommends that generation capacity addition shall be planned by adopting demand projections as per the current Report of Electric Power Survey rather than GDP growth rate. The Electric Power Surveys assess the demand based on a systematic, detailed analysis of electric utilization in various sectors of consumption and the expansion plans of various sectors. These figures are also validated by econometric model. However for Plans beyond that covered by the current EPS, growth as per Government’s GDP growth plans and elasticity figures could be adopted. For 12th Plan we have worked out demand taking 7%, 8% & 9% growth with elasticity of 0.9 & 1.0 in each case. The demand as per the EPS Reports has therefore been found to be very close to the actual demand and therefore its adoption for working out the generation capacity addition would be more accurate then assuming the same GDP growth for each sector of our economy.

Legislative and Policy Issues Working Group on Power for 11th Plan
Page 12 of Chapter 8
47. Use of Washed Coal Recommendation in Policy (Pg.xv Cl i) – Policy stipulates that “washed coal must become the norm and use of unwashed coal must become the exception. “ Working-group - recommendation In this connection, the Working-Group opined that the major problems faced on account of coal are related to inconsistency of indigenous coal quality and lack of appropriate quality control measures at mining end. Such measures would effectively control the menace of excessive overburden and extraneous matter in the coal as supplied to power stations. Use of washed coal would be imperative for power stations located at a farther distance from the coal source and/or in those cases where cost of coal washing gets neutralized by improvement in plant performance. Therefore, Working group recommends that use of washed coal has to be appropriately adopted based on overall cost economics taking into account the low washing yields for most of our coals. 48. Improvement in Efficiency of Generating Plants Recommendation in Policy (Pg xxi Cl vii) – Policy envisages to “ Increase the gross efficiency in power generation from the current average of 30.5% to 34%. All new plants should adopt technologies that improve their gross efficiency from the prevailing 36%to at least 38-40%”. Working-group – recommendation Working-Group concluded that towards implementation of stipulation of Policy, units of 500 MW and supercritical units of higher sizes have been considered during 11th Plan onwards, which would be able to meet the criteria of designed efficiency of 38-40% depending on coal quality envisaged. 49. Captive Power Generation Recommendation in Policy (Pg xvi, Cl iv) The Policy stipulates “The Committee also recommends that the liberal captive and group captive regime foreseen under Electricity Act 2003 be realized on the ground” Working-group - implementation India’s liberal captive regime will not only derive economic benefits from the availability of distributed generation but will also set competitive wheeling charges to supply power to group captive consumers. This will pave the way for open access to distribution networks. It will also facilitate private generation that limits its interface with the host utility to the use of the distribution network for a fee and thus can be realised even before AT&C losses are reduced. The Working-Group discussed the
Legislative and Policy Issues Working Group on Power for 11th Plan
Page 13 of Chapter 8
issues to be reckoned with i.e. open access, wheeling and banking and duties and made recommendations to solve these issues. 50. Imported coal based coastal plants Recommendation in Policy (Pg.xiv, Cl i) Policy mentions that “….needed infrastructure must be created to facilitate thermal coal imports. This will facilitate coastal power generation capacity based on imported thermal coal…..” Working-group- recommendation Some Coastal Ultra Mega Projects based on imported coal are already being conceived. 51 Standardization of Unit Size and Bulk Procurement Recommendation in Policy (Chapter X clause 5) – “MOP should seek global tenders for large-scale (20,000 MW or more) National Power Projects that seek to exploit objectives such as standardised (super critical 800 MW units or better) bulk orders to reduce capital costs, internationally comparable conversion/energy efficiencies, coastal locations with dedicated facilities for handling domestic coal moved by sea or imported coal, improved emission standards etc.” Working-group- recommendation As regards bulk procurement, it may be stated that presently the invitation of the tenders/procurement of the projects for capacity addition are being taken up by different Power Generation companies such as NTPC, SEBs/ State generation companies, IPPs etc. For Bulk procurement to be undertaken, a Centralized Procurement Body would be required. Further, for bulk procurement to be tendered on global basis, clearances for all the projects would be required concurrently. While undertaking bulk procurement, the competition angle would also have to be borne in mind as it is felt that presently only a few players would be in a position to offer bids in case of bulk procurement. It is proposed that to benchmark the Price for different Unit Sizes, an Empowered Committee may be nominated. 52. Rate of Return Recommendation in Policy ( Chapter X, clause 16) Policy provides that where the cost plus regime cannot be avoided and payment security mechanism under TPA is available, rate of return should be linked to long-term Govt. bonds.

Legislative and Policy Issues Working Group on Power for 11th Plan
Page 14 of Chapter 8
Working-group- Deviation Any policy while deciding the rate of return in power sector must consider present scenario of the power sector. The need of the time is to provide attractive return for power utilities. Return is an issue of tariff determination and as per Electricity Act, 2003, tariffs are to be determined by the Regulatory Commissions. In doing so, they are to be guided by the provisions of National Electricity Policy and Tariff Policy issued by Govt. of India. Accordingly, GOI has already issued these policy documents for setting out guiding principles for the regulatory commissions. Mention of such provisions in different policy documents will only lead to confusion. Hence, the provisions of the Integrated Energy Policy may be reviewed. 53. Coal pricing Recommendation in Policy(Chapter XI clause 22) regarding coal prices Policy provides that “Pit-head price of coal under FSTAs should be revised annually by coal regulator based on the formula that reflects prices obtained through e-auction, FOB price of imported coal and production cost inclusive of return based on efficiency standards.” Working-group- Deviation Linking coal price to price obtained through e-auction will only push up coal price and is not advisable in view of goal of providing power to all at affordable price. Linking the coal price with the imported coal price also would not be appropriate as the prices there are quite volatile and vary in line with oil prices and as such would have adverse impact on electricity prices. If at all it has to be linked, it should be linked to the pit-head price of imported coal with respect to the pit-head price of Indian coal on heat value basis. In view of the above, it is suggested that coal price for supply under FSTA should be fixed by Regulator based on cost of production inclusive of return based on efficiency standards. Further, once the utilities develop the captive mines allocated to them, the same can be used for benchmarking the coal prices. 54. Allocation of Coal mining Blocks Recommendation in Policy “Domestic coal production should be stepped up by allotting coal blocks to central and state public sector units and for captive mines to notified end users. Coal blocks held by Coal India Limited (CIL) which CIL cannot bring into production by 2016-17, either directly or through joint ventures, should be made available to other eligible candidates for development and bringing into production by 2011-12.” Working-group- Deviation –

Legislative and Policy Issues Working Group on Power for 11th Plan
Page 15 of Chapter 8
It is suggested that the allocation of coal blocks should be in an orderly and transparent manner. There is a need to enroll more specialist agencies to conduct exploration of blocks and prepare GRs, so that production from blocks can start in a timely manner. Support of the State Govt. in providing required statutory clearances and administrative support for law and order is essential for creating conducive environment for captive mining. 8.3 NATIONAL ELECTRICITY POLICY - DEVIATIONS AND STATUS OF
IMPLEMENTATION i. Availability and Security of Power POLICY(Pg.2 Cl 2.0) Policy aims at achieving the following objectives : Access to Electricity - Available for all households in next five years Availability of Power - Demand to be fully met by 2012. Energy and peaking shortages to be overcome and adequate spinning reserve to be available. Supply of Reliable and Quality Power of specified standards in an efficient manner and at reasonable rates. Per capita availability of electricity to be increased to over 1000 units by 2012. Minimum lifeline consumption of 1 unit/household/day as a merit good by year 2012. Financial Turnaround and Commercial Viability of Electricity Sector. Protection of consumers’ interests. Also (Pg 5, Cl 5.2.3)“In addition to enhancing the overall availability of Installed Capacity to 85%, a spinning reserve of at least 5% at national level, would need to be created to ensure grid security and quality and reliability of power supply”. WORKING-GROUP – RECOMMENDATION The Working-Group has considered these objectives of the National Electricity Policy and the generation capacity requirements for 11TH & 12th Plans recommended by the Working-Group take into account these objectives. The reserve of 5% has also been included in the capacity requirement calculations. By maintenance and modernization of power plants, the overall availability of already installed capacity shall be improved to about 85%. The Working-Group also feels that a spinning reserve is very much on higher side, since after formation of National Grid, only tripping of the highest unit size must be the appropriate spinning reserve to be catered to. This could be corrected in future after the system becomes more commercially established. Spinning reserve of around 1000 MW will be created at the end of 11th Five Year Plan. In addition to this, there would be capacity available from non-conventional as
Legislative and Policy Issues Working Group on Power for 11th Plan
Page 16 of Chapter 8
well as surplus of captive power plants to meet total spinning reserve of 5% as specified in National Electricity Policy. ii. Suggested Areas/Location of Generation Capacity Addition & Transmission System POLICY (Pg 3, Cl 3.2)- Policy stipulates “National Electricity Plan would be for a short-term framework of five years while giving a 15 year perspective and would include : Short term and long term demand forecast for different regions. Suggested areas/locations for capacity additions in generation and transmission keeping in view the economics of generation and transmission……….”. WORKING-GROUP – IMPLEMENTATION CEA has prepared National Electricity Plan considering demand as per 16th EPS and the above parameters. The Working-Group has discussed and decided to include generation expansion plan as contained in NEP. NEP is expected to be finalized shortly. Other aspects like economics of generation, setting up of power plants at pit head, load centre requirement, environment considerations taking into account the allocation and capacity of the power plants have also been included in the recommendations of the Working-Group. (iii) National Electricity Plan POLICY (Pg.3, Cl 3.1) Policy mentions that “Plan prepared by CEA and approved by Central Government can be used by perspective generating companies, transmission utilities and transmission/distribution licensees as reference document.” WORKING-GROUP – DEVIATION The Working-Group opined that development of hydro power is a crucial issue requiring a comprehensive development plan comprising of a balanced development of Run of the River projects as well as Storage Schemes. Storage schemes assume importance in view of their capability to provide peaking power. However, since development of Storage schemes also involve a number of clearances etc., generally developers find it more hassle free and attractive to develop storage sites also as Run of the River schemes. The Working group recommends that hydro projects developed, their siteing, capacity and type (whether storage or/RoR) shall be in accordance with the National Electricity Plan. The projects to be developed by the developers shall generally be from amongst the projects included in NEP.

Legislative and Policy Issues Working Group on Power for 11th Plan
Page 17 of Chapter 8
(iv) Monitoring and Adjustment in Capacity Addition Plans POLICY (Pg.5, Cl 5.2.4) Policy states that “The progress of implementation of capacity addition plans and growth of demand would need to be constantly monitored and necessary adjustments made from time to time. In creating new generation capacities, appropriate technology may be considered keeping in view the likely widening of the difference between peak demand and the base load.” WORKING-GROUP – IMPLEMENTATION Working-Group feels that there is need for extensive and intensified monitoring of implementation of capacity addition plans and the growth of demand at regular intervals. However, considerations like non-availability of gas have made the task of choosing appropriate technology more difficult. Super critical technologies and higher size units have been considered. Pump storage schemes in Northern region and Eastern region are being implemented and also storage type hydro projects are being planned where ever possible. (V) Hydro Generation POLICY (Pg.6, Cl 5.2.5) Policy stipulates that “Maximum emphasis would be laid on the full development of the feasible hydro potential in the country. The 50,000 MW hydro Institute has already been launched and is being vigorously pursued ……………..” WORKING-GROUP – DEVIATION An analysis has been carried out to assess the projects which can materialize during the 11th Plan. The Working group opines that even with best efforts, about 15,585 MW hydro projects are possible during 11th Plan. (vi) Lignite based Plants POLICY(Pg.6, Cl 5.2.14) The Policy mentions that “significant Lignite resources in the country are located in Tamil Nadu, Gujarat and Rajasthan and these should be increasingly utilized for power----------------------.” WORKING-GROUP - IMPLEMENTATION The Working-Group agrees that lignite extraction technology needs to be improved. There are plans to add a total capacity of 1375 MW based on lignite during 11TH Plan.

Legislative and Policy Issues Working Group on Power for 11th Plan
Page 18 of Chapter 8
(vii)Gas based Plants(Pg.6, Cl 5.2.15) POLICY Policy mentions that “Use of gas as a fuel for power generation would depend upon its availability at reasonable prices. Natural gas is being used in Gas Turbine/Combined Cycle Gas Turbine (GT/CCGT) stations which currently accounts for about 10% of total capacity”. WORKING-GROUP - IMPLEMENTATION The Working-Group states that due to non-availability of gas/LNG at a favorable price not much gas based generation capacity is expected during 11th Plan. However, the position could be reviewed as and when gas prices are favorable and the availability of gas improves. (viii)R&M Schemes POLICY(Pg.7, Cl 5.2.22 & 5.2.23) The Policy mentions that “If economic operation does not appear feasible through R&M, then there may be no alternative but to closure of such plants as the last resort. In case of plants with poor O&M record and persisting operational problems, alternatives strategies including change of management may need to be considered so as to improve the efficiency to acceptable levels of these power stations. WORKING-GROUP - IMPLEMENTATION Working-Group has recommended that R&M/LE schemes should only be considered if they are economically viable. If cost analysis show that closure of the plant and installation of a new unit is more economical, this alternative shall be considered. Working-Group opines that in case the management of the Plant continuously has poor O&M record, this shall be changed by way of joint ventures with central undertakings like NTPC or State Sector undertakings like APGENCO. 8.4 MAJOR ISSUES AND RECOMMENDATIONS Major Issues deliberated and recommendations of the Working Group are as follows:
Capacity Building Promoting Open Access & Trading Controlling the Cost of Electricity Making Regulatory Process more effective Improving Distribution Segment Empowering Consumers Rural Electricity Supply Planning at State Level

Legislative and Policy Issues Working Group on Power for 11th Plan
Page 19 of Chapter 8
8.4.1 Capacity Building The National Electricity Policy aims at overcoming energy and peaking shortages and having 5% spinning reserves by year 2012. The Tariff Policy stipulates that all future requirement of power is to be procured competitively by distribution licensees except the expansion projects and public sector projects for which a five year window has been envisaged after which all the generation and transmission projects would be developed through competitive route. In accordance with the provisions of section 63 of the Act, the Central Government has already issued the competitive bidding guidelines for:
Procurement of power by distribution licensees and Procuring transmission services
To facilitate competitive procurement of power, the Central Government has already issued standard bidding documents for development of power projects at a specific given site and based on a particular fuel (Case-II of the bidding guidelines). The competitive bidding guidelines also envisage procurement of power without specifying any specific location or fuel (Case-I procurement). The Working Group is of the view that situation is not yet ripe for procurement through Case-I route because fuel, both coal and gas, are not yet freely available in the market. Therefore, all efforts should be made to develop new capacity through developing new power projects under Case-II procurement. This route is fully feasible and successful as has been demonstrated by tariff based competitive bidding in Uttar Pradesh for Anapara-C expansion project. The Central Government has also taken up major initiative for developing Ultra Mega Power Projects through Case-II procurement. Few coastal power stations based on imported coal can be set up based on the option of competitive bids for net heat rate Experience in the past has shown that projects had got delayed considerably because of difficulties in tying-up various inputs like land, fuel, water and clearances particularly environmental and forest clearance. Since we are envisaging private sector participation at a large scale, the Working -Group recommends that Special Purpose Vehicle(SPV) route would be necessary to develop new generation capacities quickly. The SPV is responsible for arranging necessary inputs such as land, fuel and water and also tying-up initial clearances and offering the project for tariff based competitive bidding. Important areas for further improvement are environmental/ forest clearance and geological report for coal blocks. In the area of environmental clearance, the experience has been that the procedure takes a long time. Therefore, there is a need to streamline and standardize the procedure to shorten the time cycle for obtaining environmental/forest clearance with greater emphasis on compliance with laid down standards and conditions imposed while granting environmental clearance. Regarding the geological report of the coal blocks, it is being felt that the blocks being made available for power project development are not adequately explored which is leading to longer project preparation cycle and uncertainties. Presently, CMPDI is the main agency for exploration of coal reserves. The Working -Group recommends that the exploration capacity of the CMPDIL needs to be augmented and it needs to be given more autonomy so that it can discharge its responsibility in a fair and neutral manner. Number of agencies having authorization to undertake exploration of coal blocks also needs to be increased.

Legislative and Policy Issues Working Group on Power for 11th Plan
Page 20 of Chapter 8
The Working - Group also recommends the possibility of making available power projects sites quickly by scrapping those small sized old power generation units which are operating at significantly higher heat rates. An appropriate cut-off of gross station heat rate, say 3000 kilo calorie per unit, can be considered for identifying inefficient old power plants of more than 25 years age and these sites could be released for setting-up power plants of more efficient and large sized units depending upon the scope of expansion available and with due cost benefit analysis. Coal linkages of the old power plants should also be transferred to the new generating units. Regarding the promotion of non-conventional energy sources, the Tariff Policy provides that minimum percentage for procurement of energy from such sources by a licensee should be made applicable immediately for the tariffs to be determined by the SERCs. The Policy further states that procurement of future requirement of power from non-conventional energy sources shall be done as far as possible through competitive bidding process u/s 63 of the Act among the suppliers offering energy from same type of non-conventional sources. The Policy provides that in the long-term, these technologies would need to compete with other sources in terms of full costs. In view of these provisions in the Tariff Policy, a Sub Group recommends: In the interest of larger competition aimed at consumer benefits, the procurement from non-conventional energy sources should not be restricted to only within that State but suppliers from outside State should also be allowed to compete. Procurement from non conventional sources should invariably ,unless there are compelling reasons, be done through the competitive bidding process as this would add to transparency and lower procurement costs. After assessing the stage of development of various non conventional energy technologies, a definite timeframe should be laid down after which preferential tariff for power generated from such sources would not be available. Such an arrangement is already in place in Germany. For encouraging captive generators to supply surplus power to grid, the Implementation of recommendations of Forum of Regulators for rationalising various charges such as parallel operation charge, minimum demand charge, start-up power charge etc. on captive power generators could be a made a condition which may be linked to Central assistance to the State power sector. With a view to encourage Renovation & modernization (R&M) of old power plants additional benefits after R&M are clearly identified and shared with consumers who will bear the burden of servicing additional capital expenditure. It is required to be seen that depreciation is allowed to the power producer and normal maintenance and replacement should be funded from such depreciation amount. The Working Group recommends that CERC could set up benchmarks for capital expenditure on R&M. 8.4.2 Promoting Open Access & Trading The key features of the Electricity Act 2003 for promoting competition and providing choice to the consumers are open access in transmission from outset and for phased

Legislative and Policy Issues Working Group on Power for 11th Plan
Page 21 of Chapter 8
introduction of open access in distribution. Most of the State Electricity Regulatory Commissions (SERCs) have notified open access regulations and many of them have also notified cross-subsidies surcharge. Open access in distribution would become a realty only if certain pre-requisites are met. These are availability of power beyond long-term PPAs, adequate transmission facilities and an appropriate transmission tariff To make available adequate power for open access consumers, there is a requirement of having an enabling policy framework for merchant power plants which could be in the size of up to 1000 MW. This size is considered appropriate from the view point of greater possibility of financial closure without long-term PPAs and also of making available transmission corridors for such merchant power plants. We could target a merchant capacity of about 10,000 to 12,000 MW by the end of 11th Five Year Plan. Working Group recommends that coal linkages should be made freely available for power project developers to come forward to set up such merchant power projects. In case captive coal blocks are considered to be given to such merchant power plants, it should be a mandatory condition that such a power project developer would not compete in competitive bidding for long-term PPA based power procurement in order to avoid unequal competition (because only few developers would have such coal blocks and others would not). For allocation of both coal linkage or coal blocks for merchant power plants, an additional condition should be that captive coal mining must begin within a period of three to four years failing which the allocation should be cancelled. For providing transmission corridors for such merchant power plants, the Working Group recommends that adequate redundancy should be built at the stage of transmission planning with the approval of Appropriate Regulatory Commission. The National Electricity Policy already provides that prior agreement with the beneficiaries would not be a pre-condition for network expansion and that CTU/STU should undertake network expansion after identifying the requirements in consultation with stakeholders and taking up the execution after due regulatory approvals. There is a need to identify the major load centres who would be drawing power from such merchant power plants and the required redundancies could be planned. The cost of providing such redundancy should be absorbed in the transmission tariff by the concerned region / zone and should be shared by all the beneficiaries. A rationale transmission tariff framework is essential for facilitating optimum network use and promoting power trade. Presently, the pricing principle applied to the transmission systems have differentiated between the inter-regional, regional and State level flows with such tariffs applied for each component of network used. This has led to ‘pancaking’ of the network. Realizing this problem fully, the Tariff Policy envisages a National Transmission Tariff Framework which is sensitive to distance and direction and related to quantum of power offered. Regarding the regulation of tariff of merchant power, the Electricity Act 2003 provides regulation by SERC of cost of power purchased by the licensees under section 86 (1) (b) of the Act. The Act further provides that in case of open access is availed by the consumer; the price would be as mutually agreed by the consumer and the supplier.

Legislative and Policy Issues Working Group on Power for 11th Plan
Page 22 of Chapter 8
However, there is an urgent need for regulations for providing grid connectivity to the merchant power plants. 8.4.3 Controlling cost of bulk power Main efficiency gains leading to reduction in the cost of bulk power would come through procurement of power through tariff based competitive bidding. In addition to competitive procurement, cost of power could be reduced by reducing the fuel cost as major part of the cost of bulk power is fuel cost. Captive coal mining has been permitted for power sector The Working Group recommends that the coal blocks should be offered on the basis of competitive bidding as part of the integrated coal mine-cum-power project to achieve this objective. Natural gas is another fuel which could be used for power production if it is available at reasonable prices. Due to shortage of gas, the Working Group recommends that the price of domestic natural gas and its allocation should be independently regulated on a cost plus basis including reasonable return. Incidence of various taxes on power sector projects and fuel used for power generation needs to be rationalized. Therefore, Working Group recommends following: In line with crude oil and coal, natural gas and LNG may also be included in the category of declared goods so that a central sales tax of 4% is levied on them and exemption from any state sales tax is extended. Lowering of Import duty on coal to 5% needs to be continued. Exemption of import duties is available to power generation projects under the Mega Power Policy. Similar dispensation should be made available to all important transmission projects where imported components forms a large part of the project cost. It is likely that nuclear power stations would be segregated from other strategic nuclear installations in future. In that case determination of tariff from nuclear power stations needs to be done through regulatory mechanism in a transparent manner adopting two part tariff structure and efficient operating norms. It is understood that the cess being levied on water used by power stations for cooling purposes is on gross volume basis i.e. no consideration is given for the quantity of water actually consumed. There is a need to move to levy cess on the basis of consumptive use of water. This would encourage the closed cooling system which is a need of hour in view of the decreasing availability of water at power project sites. 8.4.4 Making regulatory process more effective The CERC and the SERCs are discharging a very important role in power sector reforms by bringing in close scrutiny of the data furnished by the licensees and also enhancing transparency in the whole process. It is therefore essential to attract

Legislative and Policy Issues Working Group on Power for 11th Plan
Page 23 of Chapter 8
regulatory personnel with required background and also to provide training to raise regulatory capacity in terms of the required expertise and skill sets. The Working Group recommends the following measures to make the regulatory approach more effective: Service conditions of the staff of the Regulatory Commissions as well as BEE i.e. providing housing accommodation, medical facilities etc need to be made attractive. State Governments should be asked to establish the Regulatory Commission Funds at the earliest. This could be one of the follow up point while releasing central assistance to the States. There is a need to put in place a mechanism for periodical training/ reorientation for the staff of the Regulatory Commission and for the newly appointed regulators. A broad estimation has been done about the requirement of funds for this pupose. The total cost per year for training 25 regulators and 50 staff is about Rs 40 lakhs. Total expected expenditure for the next five years is about Rs 2 crores 21 lakhs. Details of the above estimation are furnished in Appendix 8 .1. A corpus could be made available to the Forum of Regulators for this purpose, income from which could be used for these training programmes. The FOR has been entrusted with number of responsibilities in the Tariff Policy with a view to ensure consistency in the regulatory approach. For discharging this role, the FOR would require consultancy for availing relevant expertise including international experience on various matters. The Central Government should provide funds for this purpose. 8.4.5 Improving Distribution Segment It is well known that making distribution segment efficient and financially viable is the key to the power sector reforms. This would not only improve the consumer services including the power tariffs but also be critical for mobilization of investment in generation and transmission segment. The Working Group has deliberated indepth on various possible measures for reducing distribution losses and improving quality of supply to the consumers. For reducing AT&C losses, larger investments would be required for upgradation of distribution networks and a special drive would be necessary for identifying high loss areas and controlling commercial losses in such areas. Following is recommended by the Working Group in this regard:
i. High loss making feeders need to be franchised by the distribution companies. Towns having ATC losses higher than 35% need to be franchised on input energy basis immediately whereas towns having losses between 25-30% should be observed for improvement for six months and if there is no improvement then these towns should also be franchised.
ii. Through appropriate metering and energy audit, feeders incurring
high level of losses (may be more than 20% for urban feeders and more than 35% for rural feeders, this would depend on the stage in

Legislative and Policy Issues Working Group on Power for 11th Plan
Page 24 of Chapter 8
which distribution reforms are in a particular state) should be identified. Performance of the staff should then be assessed on the basis of Key Performance Indicators(KPI) which would be primarily loss reduction. AT&C loss reduction of 3% every year in next five years should be targeted.
iii. The Tariff Policy emphasizes on the need for putting in place local
area based incentive/disincentive scheme for the staff linked to distribution losses. This should be immediately implemented by the SERCs.
iv. To realize the objective of Tariff Policy of supplying uninterruptible
electricity to those consumers who are ready to pay efficient cost, the Working Group recommends that distribution tariff should move to distribution margin model which is also provided in the Tariff Policy. Such distribution margin could be based on loss reduction trajectory in a MYT framework and the actual power purchase costs should be paid by the consumers over and above the distribution margin. Consumers of a particular area should be given option to collectively choose either uninterruptible supply or otherwise and the tariff could be determined accordingly.
v. The Working Group also recommends that setting up of peaking
power stations should be encouraged to overcome peaking shortages as the additional power cost of supply from such a station could then be passed on to the consumers who opt for uninterruptible supply.
vi. Correct metering and billing is crucial to reducing distribution losses
and also for ensuring that consumers pay according to their consumption. CEA has notified metering regulations which mandate that all new consumer meters would be of static type (electronic). These meters measure the consumption correctly over a long period of time. The Working Group recommends that use of electronic meters and spot billing needs to be expanded rapidly and the State should be emphasized to do so. Also, with the objective of promoting more efficient use of electricity and also to provide another payment option to consumers, use of pre-paid meters needs to be promoted.
vii. The Electricity Act gives discretion to the licensees to undertake
supply for a specified area within his area of supply through a franchisee. The Working Group recommends that the Forum of Regulators should develop a model agreement for distribution of electricity by distribution licensee through a franchisee in urban areas outlining the responsibilities and duties of various parties clearly.
8.4.6 Empowering Consumers The Electricity Act has many important provisions for protecting consumer interests and for redressal of their grievances. These are:

Legislative and Policy Issues Working Group on Power for 11th Plan
Page 25 of Chapter 8
Setting up of Forums for redressal of consumer grievances Ombudsman to supervise and oversee the Forum Standards of performance for licensee with provision of penalty for non-
fulfillment. Advisory Committees to the Regulatory Commissions.
It is utmost important that consumers are involved fully in the regulatory process. National Electricity Policy emphasizes on capacity building of consumer groups and their effective representation before the Regulatory Commission. The Working Group recommends that necessary financial assistance could be provided to consumer groups having proven track record for facilitating their effective representation before the Regulatory Commission. In addition to the financial assistance, the Central Government should also arrange orientation programmes to educate these groups about various provisions of the law and rules. Such scheme(s) should be administered by the Department of Consumer Affairs. 8.4.7 Rural Electricity Supply The Central Government is already implementing the ambitious nationwide programme of RGGVY for providing access to electricity to all the households. Need is felt to take up programmes to ensure supply of quality power at reasonable cost to the rural areas. The Rural Electrification Policy notified by the Government under the Electricity Act provides for a facilitative framework for encouraging local resources based decentralized distributed generation systems. Most of the States have already notified rural areas for the purpose of section 14 of the Act. Now there is a need to promote such decentralized distributed generation system. 8.4.8 Planning at State Level Prior to reorganization of SEBs, the planning for electricity sector at State level was used to be done by the SEBs. Working Group opines that there is a need to institutionalize a framework for indicative planning at State level post restructuring of SEBs so that steps could be taken in time for necessary planning and execution of projects. This becomes all the more important as generation projects are now to be developed through competitive route for inviting power sector investment and therefore initiative is to be taken at the State Government level. Similarly, advance planning is required for augmenting the State level transmission network for catering to new generation capacity and also for enabling open access. Therefore, the Working Group recommends that State Government should set up a dedicated planning cell for developing electricity plan at the State level including specific projects which could be posed for investment to the power sector. Such a plan could be on the lines of National Electricity Plan. 8.4.9 Agriculture Sector- Subsidies and Cross subsidies Besides agriculture, domestic consumers are also provided subsidized tariff in most the States. The Electricity Act 2003 and subsequent policy statements require gradual elimination of cross subsidies. Section-61(G) of Electricity Act states that appropriate commissioning shall be guided by the following while determining tariffs:

Legislative and Policy Issues Working Group on Power for 11th Plan
Page 26 of Chapter 8
“that the tariff progressively reflects the cost of supply of electricity and also, reduces and eliminates cross subsidies within the period to be specified by the Appropriate Commission” Clause 8.3 of the National Tariff Policy (NTP) states, “1. In accordance with the National Electricity Policy, consumers below poverty line who consume below a specified level, say 30 units per month, may receive a special support through cross subsidy. Tariffs for such designated group of consumers will be at least 50% of the average cost of supply. This provision will be re-examined after five years. 2. For achieving the objective that the tariff progressively reflects the cost of electricity, the SERCs would notify roadmap within six months with a target that latest by the end of year 2010-2011 tariffs are within + 20% of the average cost of supply. The road map would also have intermediate milestones, based on the approach of a gradual reduction in cross subsidy.” Most of the SERCs are yet to specify the trajectory for reduction of cross subsidies in accordance with the provisions of NTP. Given the fact that the prevailing agricultural tariff are significantly lower than the average cost of supply tariffs towards cost of supply will lead to steep upward movement of bringing tariffs for the agricultural and residential consumer categories which is bound to be resisted by the affected groups. National Electricity Policy and tariff policy provides for creation of life line category for consumers below poverty line including those consuming less than 30 units per month. These categories will also face steep increase in tariff as the present level of subsidy is far below the average cost of supply. There will also be practical difficulties in administering the provision. In these circumstances, it may not be feasible to eliminate cross subsidies completely in the near future, though it can be gradually reduced over time. Some of the steps that can be taken to ensure that the agricultural tariffs are reflective of the costs incurred and appropriate tariff signals are given to the consumers, are:
• Energy audits based on scientific sampling methods, to assess electricity consumption for agriculture across regions, crops, ground water level, etc.
• Higher tariffs for higher capacity pumpsets • Tariffs linked to acreage under cultivation • Tariffs linked to cost-to-serve, rather than average cost of supply or voltage
level cost of supply. •
Clause 8.3 of the NTP states, “3. While fixing tariff for agricultural use, the imperatives of the need of using ground water resources in a sustainable manner would also need to be kept in mind in addition to the average cost of supply. Tariff for agricultural use may be set at different levels for different parts of a state depending of the condition of the ground water table to prevent excessive depletion of ground water. Section 62 (3) of the Act provides that geographical position of any area could be one of the criteria for tariff
Legislative and Policy Issues Working Group on Power for 11th Plan
Page 27 of Chapter 8
differentiation. A higher level of subsidy could be considered to support poorer farmers of the region where adverse ground water table condition requires larger quantity of electricity for irrigation purposes subject to suitable restrictions to ensure maintenance of ground water levels and sustainable ground water usage.” Alternative mechanism for cross-subsidies is provision of subsidy by the State Governments which intend to provide supply of power to certain categories at less than the prevailing average cost of supply. If cross-subsidy has to be reduced and no tariff increase is planned for the subsidized categories, the State Governments will have to bear the financial burden by providing subsidy to the utilities. Since the gap between average cost of supply and tariffs for agricultural consumer is large the burden is bound to be significant on the State Governments which are already providing capital subsidy in many states. The Electricity Act provides that State Governments should provide such subsidies in advance to the utilities. Section 65 of the EA 2003 states, “If the State Government requires the grant of any subsidy to any consumer or class of consumers in the tariff determined by the State Commission under section 62, the State Government shall, notwithstanding any direction which may be given under section 108, pay, in advance in the manner as may be specified by the State Commission, the amount to compensate the person affected by the grant of subsidy in the manner the State Commission may direct, as a condition for the licensee or any other person concerned to implement the subsidy provided for by the State Government.” Clause 5.5.4 of the National Electricity Policy (NEP) notified in February 2005, states, “The State Governments may give advance subsidy to the extent they consider appropriate in terms of section 65 of the Act in which case necessary budget provision would be required to be made in advance so that the utility does not suffer financial problems that may affect its operations. Efforts would be made to ensure that the subsidies reach the targeted beneficiaries in the most transparent and efficient way.” Clause 8.2.1 (3) of the National Tariff Policy (NTP) notified in January 2006 states, “Section 65 of the Act provides.. To ensure implementation of the provision of the law, the State Commission should determine the tariff initially, without considering the subsidy commitment by the Sate Government and subsidized tariff shall be arrived at thereafter considering the subsidy by the State Government for the respective categories of consumers.” Clause 8.3 of the NTP states, “The State Governments can give subsidy to the extent they consider appropriate as per the provisions of section 65 of the Act. Direct subsidy is a better way to support the poorer categories of consumers than the mechanism of cross-subsidizing the tariff across the board. Subsidies should be targeted effectively and in transparent manner. As a substitute of cross-subsidies, the State Government has the option of
Legislative and Policy Issues Working Group on Power for 11th Plan
Page 28 of Chapter 8
raising resources through mechanism of electricity duty and giving direct subsides to only needy consumers. This is a better way of targeting subsidies effectively.” Considering the stretched finances of most State Governments, the provision of this subsidy affects investments and expenditure in other areas. The huge losses incurred by utilities due to various technical and commercial reasons is aggravating the financial position of the utilities making them unviable and force them to depend on the State Government for support. To withstand this financial burden, State Governments will have to look for additional revenue sources. Direct subsidy will eliminate various issues associated with cross subsidy as the burden of subsidy shifts to general tax payers in the State. 8.5 SUMMARY OF RECOMMENDATIONS
1. Situation is not ripe for procurement through Case-I route since both coal and
gas are not yet freely available in the market. All efforts should be made to develop new capacity under Case-II procurement.
2. SPV is necessary to develop new generation capacities quickly. 3. There is need to streamline and standardize the procedure to shorten time
cycle for obtaining environmental/forest clearance with greater emphasis on compliance with laid down standards and conditions.
4. Exploration capacity of CMPDIL may be augmented and also it may be given more autonomy so that it can discharge its responsibility in fair and neutral manner. Number of agencies having authorization to undertake exploration of coal blocks should be increased.
5. Coal blocks to be used for captive coal mining by power projects should be explored fully at the earliest and GRs should be readily made available to power project developers on actual cost basis.
6. Appropriate cut-off of gross station heat rate, say 3000 kilo calorie per unit, can be considered for identifying inefficient old power plants of more than 25 years age and the sites could be released for setting-up plants of more efficient and large sized units depending on the scope of expansion available and with due cost benefit analysis. Coal linkages of the old power plants should be transferred to new generating units.
7. Till the long-term coal supply contracts emerge in international coal markets, the option of competitive bids for net heat rate may be explored for imported coal based stations.
8. In the interests of larger competition aimed at consumer benefits, procurement from non-conventional energy sources should not be restricted to within the State but suppliers from outside State should also be allowed to compete.

Legislative and Policy Issues Working Group on Power for 11th Plan
Page 29 of Chapter 8
9. Procurement from non conventional sources should, unless there are compelling reasons, be done through competitive bidding process as this would add to transparency and lower procurement costs.
10. After assessing the stage of development of various non conventional energy technologies, definite timeframe should be laid down for doing away with preferential tariff for power generated from such sources.
11. Tariff Policy advises States to rationalize taxes and duties on captive power consumption. This may be reviewed periodically with States and made a condition for Central assistance to State power sector.
12. In competitive procurement of power, bidding by CPSUs should be ensured in initial few projects to encourage competition.
13. CERC could set up benchmarks for capital expenditure to facilitate accelerated R&M of old power plants.
14. To make available adequate power for open access consumers, there is need for enabling policy framework for merchant power plants. Size of MPPs could be up to 1000 MW which may be appropriate considering greater possibility of financial closure without long-term PPAs for comparatively smaller sized projects and also of making available transmission corridors for such MPPs. We could target MPP capacity of about 10,000 to 12,000 MW by end of 11th Plan. Such merchant capacity would be without the basis of long term PPAs.
15. Coal linkages should be freely available for power project developers who come forward to set up such MPPs. In case captive coal blocks are given to MPPs, there should be a mandatory condition that such the project developer would not compete in competitive bidding for long-term PPA based power procurement in order to avoid unequal competition since only few developers would have such coal blocks. For allocation of linkage or coal blocks for MPPs, an additional condition should be that captive mining must begin within a period of 3 to 4 years failing which the allocation should be cancelled.
16. For providing transmission corridors for such MPPs, adequate redundancy should be built at the stage of transmission planning. Presently, also there is a redundancy of about 20-25% in the transmission planning. There is need to identify the major load centres who would draw power from such MPP. These load centres would be most likely situated in northern and western region where many States are deficit in power supply. Therefore, the required redundancies could be planned from the likely location of the MPP (which would be in eastern region) to such load centres. The cost of providing such redundancy should be absorbed in the transmission tariff by the concerned beneficiaries. This would be in the long-term interests of consumers who will gain from efficiency arising out of competition among the generators.
17. Tariff Policy envisages a National Transmission Tariff Framework sensitive to distance and direction and related to quantum of power offered. CERC is in the process of developing such a Framework which needs to be done

Legislative and Policy Issues Working Group on Power for 11th Plan
Page 30 of Chapter 8
expedited. This would be a necessary pre-requisite for promoting open access and power trading.
18. There is urgent need for regulations for providing grid connectivity to MPPs. The National Electricity Policy already provides that prior agreements would not be a pre-condition for network expansion and the transmission utilities should undertake network expansion after identifying the requirements in consonance with the National Electricity Plan and in consultation with the stakeholder, and taking up the execution after due regulatory approvals.
19. The reduction in cost of production of coal on account of higher efficiency in captive coal mining should be passed on to the consumers through reduced cost of bulk power. The coal blocks should be offered on the basis of competitive bidding as part of the integrated coal mine-cum-power project to achieve this objective. Any other method of allocating coal blocks for power projects is not likely to pass on the efficiencies of captive coal mining to the consumers.
20. As long as there is shortage of natural gas and the two major users of gas fertilizer and power work in a regulated cost plus environment, price of domestic gas and its allocation should be independently regulated on cost plus basis including reasonable returns.
21. Like crude oil and coal, natural gas and LNG may also be included in the category of declared goods so that central sales tax of 4% is levied on them and exemption from any state sales tax is extended.
22. Import duty on coal has been lowered to 5%. This position needs to be continued as we would be depending on imported coal for generation.
23. Exemption of import duties available to generation projects under Mega Policy should be available to all important transmission projects where imported components form large part of the project cost.
24. Nuclear power stations are likely to be segregated from other strategic nuclear installations in future. In that case, tariff determination from nuclear power stations should be done through regulatory mechanism in a transparent manner adopting two part tariff structure and efficient operating norms.
25. There is a need to levy cess on the basis of consumptive use of water. This would encourage closed cooling system which is the need of the hour considering decreasing availability of water at project sites.
26. Service conditions of staff of the Regulatory Commissions and BEE should be made attractive. Such staff should be eligible for housing accommodation, medical facilities etc. on the lines of Government employees.
27. State Governments should be asked to establish the Regulatory Commission Funds at the earliest. This could be one of the follow up points while releasing central assistance to the States.

Legislative and Policy Issues Working Group on Power for 11th Plan
Page 31 of Chapter 8
28. There is a need to put in place a mechanism for periodical training/ reorientation for staff of the Commissions and for newly appointed regulators. A corpus could be made available to the Forum of Regulators (FOR) for this purpose income from which could be used for the training programmes. The training programme and the training institutions should be settled by FOR after taking into account guidelines issued by the Central Government in this regard.
29. FOR has been entrusted with number of responsibilities in the Tariff Policy with a view to ensure consistency in the regulatory approach. For discharging this role, the FOR would require consultancy for availing relevant expertise including international experience on various matters. Central Government should provide funds for this purpose.
30. FOR should also compile periodically various progressive orders of the SERCs for sharing the best practices. The compilation may also include important judgments of the Appellate Tribunal for Electricity.
31. To bring in appropriate accountability of the regulatory process, proposed regulations of the Regulatory Commissions should be examined indepth at draft stage itself. Further, there is a need for scrutinizing the regulations for ensuring consistency with the letter and spirit of the law before they are laid in the Parliament/ State Assembly. This is important since regulations, once published in the gazette, become sub-ordinate legislation.
32. FOR should also undertake periodical review of implementation of the National Electricity Policy and Tariff Policy since the law requires the Commissions to be guided by these policies.
33. High loss making feeders may be franchised by distribution companies. Towns having ATC losses higher than 35% may be franchised on input energy basis immediately. Towns having losses between 25-30% should be observed for improvement for 6 months and if there is no improvement, these towns should also be franchised.
34. Through appropriate metering and energy audit, feeders incurring high level of losses (may be more than 20% for urban feeders and more than 35% for rural feeders, this would depend on the stage in which distribution reforms are in a particular state) should be identified. Performance of the staff should be then assessed on the basis of Key Performance Indicators(KPI) which would be primarily loss reduction. ATC loss reduction of 3% every year in next five years should be targeted. The Tariff Policy emphasizes on the need of putting in place local area based incentive/disincentive scheme for the staff linked to distribution losses. This should be immediately implemented by the SERCs.
35. The robust legal framework contained in the Act for control of theft is being further strengthened. Annual conferences of power utilities should be organized at national level for highlighting success stories and achievement made in different States in controlling theft.

Legislative and Policy Issues Working Group on Power for 11th Plan
Page 32 of Chapter 8
36. To enlist public support for rapid reduction of commercial losses, the list of high losses feeders should be publicized periodically.
37. To realize the objective of Tariff Policy of supplying uninterruptible electricity to those consumers who are ready to pay efficient cost, the distribution tariff should move to distribution margin model which is also provided in the Tariff Policy. Such distribution margin could be based on loss reduction trajectory in a MYT framework and the actual power purchase costs should be paid by the consumers over and above the distribution margin. Consumers of a particular area should be given option to collectively choose either uninterruptible supply or otherwise and the tariff could be determined accordingly.
38. Setting up of peaking power stations should be encouraged to overcome peaking shortages as the additional power costs of supply from such a station could be then passed on to the consumers who opt for uninterruptible supply.
39. Use of electronic meters and spot billing should be expanded rapidly and State should be emphasized upon to do so.
40. FOR should develop a model agreement for distribution of electricity by distribution licensee through a franchisee in urban areas outlining the responsibilities and duties of various parties clearly.
41. There have been some experimental efforts, with good success, for outsourcing distribution of electricity for an identified feeder by the licensee to a private entrepreneur selected competitively. This model needs to be supported fully and replicated in high loss areas.
42. Necessary financial assistance may be provided to consumer groups having proven track record for facilitating effective representation before the Regulatory Commission. In addition, Central Government should also arrange orientation programmes to educate these groups about various provisions of the law and rules. Such scheme(s) should be administered by the Department of Consumer Affairs.
43. The Rural Policy provides that standalone systems of upto one MW would have automatic approval for
a. Land use change for area as per norms
b. Pollution clearance if technology is proven within laid down norms and
c. Safety clearance on the basis of self certification.
These policy measures need to be implemented by the concerned authorities at the earliest.
44. Schemes for separation of agricultural feeders in rural areas need to be promoted. Agricultural consumers could be supplied electricity as per seasonal demand for agricultural purpose and the tariff could be fixed taking into view off-peak pricing and uninterruptible supply.

Legislative and Policy Issues Working Group on Power for 11th Plan
Page 33 of Chapter 8
45. Schemes for transferring subsidies directly to consumers may be encouraged.
46. State Government should set up a dedicated planning cell for developing electricity plan at the State level including specific projects which could be posed for investment to the power sector. Such a plan could be on the lines of National Electricity Plan.
47. With the objective of promoting more efficient use of electricity and also to provide another payment option to the consumers, use of pre-paid meters needs to be promoted.
48. In order to assess the progress made in achieving higher energy efficiency, suitable mechanism should be put in place indicating the clear cut methodology for computing various parameters in this regard.
**********

Legislative and Policy Issues Working Group on Power for 11th Plan
Page 34 of Chapter 8
Appendix 8.1
FUND REQUIREMENT FOR TRAINING OF ELECTRICITY REGULATORS AND STAFF
TRAINING FOR STAFF OF ERCS • There are 25 SERCs including CERC • It is proposed to give training to 2 staff per ERC • Total staff to be trained in a year is 50 • 2 training programme in a year each batch with 25 persons • Duration of Training Programme : 9 days Details of Expenditure
Expenditure Item Projected Expenditure (Rs.) Professional Cost 4,31,750 Communication and local conveyance 20,000 Logistics (including accommodation and meals)
7,97,500
Sub-Total 12,49,250 Overheads 12,495 Service tax @12.24% 1,66,199 Grand Total 15,42,374 (Approx. Rs.16
lakhs) Cost for one Training Programme (25 persons per batch)
Rs.16 lakhs
Cost for two Training Programme (25 persons per batch)
Rs.32 lakhs
TRAINING FOR REGULATORS OF ERCS • 25 Regulators to be trained in a year • One training programme in a year each batch with 25 Regulators • Duration of training programme: 3 days

Legislative and Policy Issues Working Group on Power for 11th Plan
Page 35 of Chapter 8
Details of Expenditure
Expenditure Item Projected Expenditure (Rs.) Professional Cost 259200 Communication and local conveyance 1000 Logistics (including accommodation and meals)
338000
Sub-Total 607200 Overheads 60720 Service tax @12.24% 81753 Grand Total 749673 (Approx. Rs.8 lakhs) Cost for one Training Programme (25 persons per batch)
Rs.8 lakhs
Total cost per year for training 25 Regulators and 50 Staff : Rs.32 lakhs + Rs.8 lakhs = Rs.40 lakhs Total expected expenditure for the next five years:
Year Expected Expenditure (Including escalation @ 5%) Rs.
2006-07 40 lakhs 2007-08 42 lakhs 2208-09 44.1 lakhs 2209-10 46.3 lakhs 2010-11 48.6 lakhs Total Rs.2 crores 21 lakhs

Legislative and Policy Issues Working Group on Power for 11th Plan
Page 36 of Chapter 8
Appendix 8.2
REF: PEG/2006/296 Dated: 30h Dec 2006 To, Shri R. V. Shahi, Chairman Working Group on Power, Ministry of Power Subject: Comments / suggestions on the draft report of the Working Group on Power Sir,
On behalf of Prayas Energy Group, I wish to thank you for the opportunity to comment on the Draft report of the Working Group. As per your suggestion I have attempted to keep it short.
There were limitations in our inputs earlier arising from (1) some of the sub-groups (that we were involved in, could not have meeting to discuss the draft report, (2) only after reading all reports, one could develop an holistic picture, (3) we have limited support for such work. In light of this, I request you to allow little longer comments.
Larger Comments - As elaborated in Box at the end, the estimate of MW and Rs Crore investment is on an
optimistic side. This has a material impact while recommending the policies necessary to raise the required funds. Hence, these estimates should be reviewed.
- There is a large increase in kind and quantity of central government subsidy schemes (RGGVY, DDG, 1 MW stand along systems etc.). A well-balanced committee should be established to transparently monitor the targets and operation of these schemes and a separate committee to find ways in which performance of REC / PFC can be further improved to meet the sector objectives.
- Draft report suggests several different roles for REC. Considering the potential conflict of interest among these roles we strongly suggest institutional separation of roles.
- Success SPV route adopted for Ultra-mega should be further enhanced. A mechanism should be created to develop projects for Case-2 Tariff bidding. These projects then could be offered to Discoms for competitive bidding.
- Consumer funding should be done at multi-level (state and national) which is well aligned with activity & agency work.
- A committee should be constituted to look into the options for meeting intermediate and peak load demand in the most economic manner. This could help remove the critical planning gap during Advance Actions for the 12th plan.
- Tariff impact of the proposed schemes should be included in the report.
The remaining comments are given chapter-wise. Demand-Supply: - The capital cost of projects over the last 10 years should be plotted as a scatter diagram
(Rs/MW and year), with each project shown as one point. Two separate graphs for coal and CCGT could be drawn.
- It appears that the energy demand forecast does not consider generation by addition of CPP (estimated addition of 12,000 MW), NCES (~10,000 MW), or co-generation plants.

Legislative and Policy Issues Working Group on Power for 11th Plan
Page 37 of Chapter 8
It is possible that these would generate 85,000 MU/yr. In which case, it would be equal to a third of the incremental energy demand (on the grid) during the XIth plan. The expected increase in MU generation (due to additional CPP) should be clearly specified and cross-checked with total industrial demand (met from grid and CPP). Generation from NCES should be considered in the grid.
- The 210 / 250 MW units have large variation in heat rates. The bottom 10% units with highest heat rates and the top 5 units with least heat rate should be audited to draw lessons.
- CERC tariff should provide incentive for Heat rate improvement, based on report of energy audit & heat rate verification for all power plants. This report should be put up on Website by all utilities. This could be a condition for R&M assistance.
Transmission: - It may be useful to represent the addition of inter-regional transmission capacities, major
Transmission lines on national map.
- The capital cost of Rs 140,000 Cr seems on a high side for the projected increased in grid capacity as well as the incremental energy sales. Annual fixed charges of Transmission investment (@15% of 140,000 Cr) translates to a wheeling cost of 90 Paisa/unit – based on incremental sales of 290,000 MU. This is quite large.
Distribution: - Role of REC: It is proposed that (1) REC be nodal agency for several programs – like
DDG (subsidy of Rs 20,000 Cr), RGGVY (Rs 40,000 Cr), APDRP (Rs 40,000 Cr, including pump energization). (2) REC would fund the equipment manufacturers – for expansion and modernisation, (3) REC would set up venture capital fund for equipment manufacturers, (4) REC would set standards for equipment manufacturers. The role of REC has undergone a major change with RGGVY and more radical changes are proposed. We suggest that (a) In light of likely conflict of interest among the multiple roles proposed for REC – such a move is not desirable. REC may have invested in some equipment manufacturer either through venture capital fund or simply given it a loan. REC would be setting equipment standards and REC would also be a major buyer of the distribution equipment (under RGGVY, DDG, etc.). The potential conflict of interest between different roles - facilitator, nodal agency for implementation, financing agency, and regulator (setting standards) may be large and these roles should NOT be integrated in one institution (b) performance of REC as nodal / implementation agency for the large subsidized schemes (e.g. RGGVY) should be reviewed to identify areas that need strengthening. A committee could be constituted for this.
- REC / PFC giving reform loans: The conditions to be imposed by REC / PFC should be approved in writing by MoP. The states may accept a shorter list of these conditions as mutually approved by REC / PFC and the recipient.
- Role of REC/ PRF: The Planning Commission should appoint an oversight committee to transparently evaluate possible ways in which these agencies can better meet their and power sector objectives.
- RGGVY: (1) The revised cost estimation of RGGVY should be mentioned along with its basis (2) Scope of RGGVY - electricity connection to all houses by year 2012 – should be reaffirmed in accordance with the government’s mandate.
- DDG – (a) Business model of DDG is not yet fully clear. A group should be formed to monitor these projects. (b) The cost effectiveness of DDG would come from utilizing them in say co-generation mode or linked to waste heat applications – a 5 MW size is high for this purpose. (c) Title of section 3.13 is “Cost to Serve/ Delivered Cost”. It should be
Legislative and Policy Issues Working Group on Power for 11th Plan
Page 38 of Chapter 8
modified to suite content. The Tariff policy does not advocate the “Cost to Serve” as basis for Tariff. (d) Consumers are not listed in the description of “Role of Stakeholders”. At least in initial experimental 100 cases there should be annual survey of consumer experience. The cost of such survey can be minimized and accuracy enhanced by giving a Response Form to all consumers as bill-insert (to be mailed to the independent survey agency).
- Water-electricity nexus: The suggestion from Prayas was to form a ‘Task force’ on this issue to create wider awareness of negative implications of free-power and ground water depletion. The members of task force should come from agriculture, ground water, irrigation and power sectors.
DSM, Energy Efficiency and BEE:
- MoP has taken a broader mandate through BEE, to improve efficiency of not just power consumption but also oil, gas and coal consumption. MoP has responsibility to fulfill this mandate.
- The BEE proposed budget of 650 Cr is less than 0.1% of the overall budget of the sector. This should be given as grant in aid (linked to activity plan)
- The BEE should be made accountable for its performance, while making it autonomous. A steering group of six / seven persons should be appointed for a period of 3 or 5 years, for this task. The steering group should have mandate of approving BEE schemes and taking an annual review of its performance. Members of steering group should be on contract from MoP.
- There is an urgent need to encourage technical institutions / engineering colleges to carry out R&D related to energy efficiency. Improved linkage of industry need-funding-manpower resources is necessary.
- Need for improved appliance standards should be explained with an example such as one given here – “We are adding about 100 million CFLs in the system each year – this number is doubling in less than 3 years. With such a large addition of CFLs, improvement in their quality is urgent. Raising the Power Factor of CFLs from 50% to 85% by adding passive PF correction in the electronic ballast would reduce 10,000 MVA demand in the XI th plan period. This will reduce the need for addition in Distribution Transformers capacity by nearly 10% of planned addition.”
R&D: - Following topics should be added to the focus areas for R&D:
o Assessment of needs of the 10 crore very poor consumers (including to be consumes)
o Soft technologies like DSM, improved use of IT for accountability of utilities, better forecasting models, and power plant dispatch planning.
o On-line detection of faults to improve plant availability - Clear process for evaluation / effectiveness of public money spent on R&D should be
initiated
- The plan for spending 1% of RGGVY money reserved for evaluation, training and R&D should be developed by MoP through an open and consultative process.
Key inputs - Land (forest and non-forest land) and water requirement for power plants are critical
inputs for the sector. The chapter should estimate total land requirements (by projects) and the persons likely to be displaced.

Legislative and Policy Issues Working Group on Power for 11th Plan
Page 39 of Chapter 8
- Coal requirement: It has been worked out assuming base-load PLF (~ 85% for new power plants). This would generate about 300,000 MU, but as seen in Box –1, the energy demand forecast indicates additional energy requirement of only 290,000 MU. The coal requirement may be reasonable if it is clarified that it also includes the requirement of 12,000 MW of CPP capacity addition. Table 9.7 would need corresponding modification.
Finance: - Capitalization of dividend in construction period: Rather than a piecemeal adjustment,
the treatment given to equity should be comprehensively reconsidered by MoP. In some countries equity is returned (along with loan) to reduce the tariff in later years. Such aspects can be integrated in the review.
- Estimation of MU, MW and Rs Cr: On the conservative side the MU and MW addition numbers can be considered on a higher side. The same when done about finance can have negative impacts (See Box 1 at the end for details). If the fund requirement is not Rs 9.67 Trillion but say Rs 6 Trillion, then required financing adjustments may be much different than what is proposed.
- Banking norms: If relaxation of lending norms is to be considered, at the minimum there should be complete transparency in terms of which banks are using the relaxed norms for which corporate groups and for which specific projects.
Policy: - E-Act: Ministry of Power should do a review of E Act when five years are complete. The
review should be broad based to be able to remove the difficulties being faced, such as the legal precedence being created by ATE and court orders that are contrary to the intent of the Act.
- Coal pricing and allocation of mines:
o It is welcome idea to give mines to integrated ‘mine-power project’ that intends to sell power to utilities. This will pass the benefit of mining efficiency to small consumers – that are going to face a large tariff hike.
o The coal pricing should be directly linked with calorific value (on delivered basis) rather than grades of coal.
- Merchant Plants:
The draft report recommends that merchant plants be encouraged through measures such as giving coal blocks, so as to create the liquidity necessary to make markets function. We think this is not a good idea for large-scale promotion, for the following reasons: o Experience of merchant plants in other countries shows problems. For example,
the merchant plant industry in USA has been almost decimated. Initial optimism about the industry led to many projects being announced. However, as conditions in the market changed and investors began to understand the real risks in building merchant plants and trading electricity, the share prices of these companies plummeted. Many of the proposed projects were either postponed indefinitely or cancelled.
o On a priority basis, the coalmines should be allocated to projects that will supply electricity to utilities under a long-term contract. If they are allocated to merchant plants, then the benefits go to the plant owner.
o Utilities (hence small consumers) should not be burdened for creating redundancies in Transmission system for facilitating the merchant plants. Benefit and cost sharing under this would be unfair.

Legislative and Policy Issues Working Group on Power for 11th Plan
Page 40 of Chapter 8
o If inspite of this experience, the government decides to give coal blocks to merchant plant developers then it should lay down three conditions (1) if the plants does not come up or stops operation, then the coal blocks must be returned and (2) the coal block should be given to the developer through a price bid, (3) such a promotion should be limited to only a handful demonstration projects by PSUs.
- SERCs: It should be clarified that fundamental duties of SERCs include monitoring the demand-supply situation and ensure that utilities meet the power demand.
- Separation of Agricultural consumption: Example of “Akshay Prakash’ in Maharashtra is a noteworthy example, where this is achieved, in addition to theft reduction – at not cost to the utility. This should be included in the Box in Policy chapter.
- Consumer Funding: It is much safer to have multiple mechanisms for consumer funding. It is only natural to have different mechanism for state level education, national training, and intervention and policy analysis support. [Refer to the note submitted by Prayas and Dr Navroz Dubash.]
- Real time meter Reading: Remote reading of all 33/11 KV (or 66/11 KV) substations should be the first priority. This will give exact amount of load shedding and help establish 11 KV energy audits. Remote reading of DTs should not be mixed with this, as this may increase the work burden exponentially. Remote reading of all consumers above 50 KW is utility’s commercial priority but remote reading at substation is a priority for public accountability of utilities.
- Captive plants: The captive plants should pay wheeling charges and transmission losses by voltage level (reference saying that ‘captive plants should pay only the technical losses in Transmission system’ should be removed).
- Public Sector improvement: In association with some state distribution utilities the MoP should test the results of ‘incentive-disincentive’ scheme for employees and managers of utility. This could be implemented as a part of APDRP scheme.
Miscellaneous Issues
Distribution - Lack of accountability of utilities: Take the case of Sec 3.6.2 in the Chapter on
Distribution – where Maharashtra is said to have achieved 100% metering of 11 KV
Box 1: MU, MW, and Rs Cr investment linkage MU-MW linkage:
Chapter 1 states the demand forecast on the basis of expected increase in sales by 290,000 MU (on the grid - Ex bus) and plans addition of 71,000 MW. The implicit net-PLF of this 71,000 MW capacity would be below 50% (for 290,000 MU sales). This is unlikely. Following factors need to be looked into:
- The MU generation of 10,000 MW of NCES (nearly 26,000 MU @ 30% PLF) should be accounted for in grid supply in chapter 1.
- Spinning reserve should be considered as ‘capacity of the two largest units in the region’.
Rs. Crore investment estimate The total investment of Rs 967,000 Crore projected in the XI th plan would result in a
fixed cost of Rs 175,000 Cr p.a. (fixed cost @ 18% p.a.) Dividing this by the incremental sales of 290,000 MU implies a capacity charge of Rs 6/unit. The fuel cost would be additional. This is an anomaly. And the financing need should be pegged at a lower level.
Legislative and Policy Issues Working Group on Power for 11th Plan
Page 41 of Chapter 8
feeders. In fact MoP data shows that Maharashtra has achieved 100% metering of 11 KV feeders several years ago. But MSEDCL submitted data to MERC is contradictory. In the recent ARR submitted to MERC, MSEDCL indicates following:
o 11 KV feeders with meter – 80% (of 8500 feeders of MSEDCL) o 11 KV feeders with reliably working meter – 68% o Only 570 meters have data download facility – but the facility is not used.
This raises doubts about the validity of data submitted by utility to MoP and / or to the SERC.
- HVDS, GIS and consumer indexing etc.: When some states have implemented the scheme – a post-factor Cost:Benefit analysis should be the basis for recommendation by Planning Commission. Simple articulation of claimed benefits is inadequate for recommending such high cost schemes for all utilities.
- Experience of Reforms: Orissa is not really a success in terms of reduction in T&D loss. It is better to remove that from the list (section 3.24)
- It would be useful to mention that utilities should be able to demonstrate that they are meeting Standards of Performance Regulations of the regulatory commissions.
- Rs / employee: (a) It needs to be clarified that some utilities are concentrated urban utilities while some are low-density rural utilities. (b) It would be good to clarify that it excludes cost of contract labor and also franchisees. (c) The AP numbers should be given for different Discoms – instead of one number for the state, (d) Year for which the data is given should be indicated.
I wish to thank you once again for this opportunity and hope that you will give due consideration to the points raised. Thanking you, (Girish Sant) for Prayas Energy Group CC: Dr Sethi (Planning Commission), Addn Sec (MoP), CEA.


Financial Issues & Power Sector Financing Working Group on Power for 11th Plan
Page 1 of Chapter 10
Chapter 10
FINANCIAL ISSUES AND POWER SECTOR FINANCING
10.0 The Tenth Plan outlay approved for the power sector was Rs. 2,70,276 crore or 18.2% of the total public sector outlay of Rs.14,84,131 crore.
Table10. 1
Power Sector Outlay of 10th Plan (Rs. crore)
Sector Generation including R&M T&D including RE etc Total State 32,216 61,010 93,226 Central 150,373 26,677 177,050 Total 182,589 87,687 270,276 The detailed breakup of various State sector outlay for the 10th Plan is placed at Appendix-10.1. The breakup of the Central sector financial resources of Rs.1, 77,050 crore is as under and detailed breakup is placed at Appendix-10.2.
Table 10.2 Central Sector Financial Resources for 10th Plan
(Rs. crore) INTERNAL AND EXTRA BUDGETARY RESOURCES GROSS BUDGETARY SUPPORT I.R. BONDS DFI OTHERS IEBR EAB DBS GBS UOTLAY
MOP 14138 59546 11622 33093 118399 0 25000 25000 143399 NLC 2804 5204 0 0 8008 0 0 0 8008 DAE 2271 7536 0 0 9807 5654 10183 15837 25644
TOTAL 19212 72286 11622 33093 136214 5654 35183 40837 177050
Note: Outlay = (IEBR + GBS)
10.1 FINANCIAL PERFORMANCE OF POWER SECTOR DURING 10TH PLAN The likely investment in the power sector is estimated as Rs. 1,83,166 crore (67.77%) of the total outlay of Rs. 270,276 crore by the end of 10th Plan including the investment by NLC and DAE. The State sector expenditure is likely to be Rs. 90,101 crore (96.65%) and the Central sector expenditure is likely to be Rs. 93,065 crore (52.56%) of their respective outlays during 10th Plan. Details of the same are as under:

Financial Issues & Power Sector Financing Working Group on Power for 11th Plan
Page 2 of Chapter 10
Table 10.3
10th PLAN BUDGET VS. ACHIEVEMENT
(All figures in current prices and in Rs. crore) Year Central State Total 1 Tenth Plan approved 177,050 93,226 270,276 2 Actuals for the year: 2002-03 10,993 17,103 28,096 2003-04 14,327 17,837 32,164 2004-05 17,040 17,035 34,075 2005-06 20,734 17,406(RE) 38,140 Total 63,094 69,381 1,32,475 3 2006-07 (Estimated) 29,971 20,720 50,691 4 Likely investment during
10th Plan 93,065 90,101 1,83,166
5 % Utilisation 52.56% 96.65% 67.77% Source: Planning Commission
The short fall in fund utilization in the Central sector outlay is on account of few main reasons which are as under:
• During the first two years, there was a delay in according investment approval for various projects such as Teesta Low Dam-III & IV, Sewa-II, Omkareshwar, Subansari Lower, Parbati-III, Purulia PSP, Chamera HEP-III, Uri-II, Tripura Gas etc.
• In case of NTPC, an outlay of about Rs. 3,000 crore was included as Gross
Budgetary support to be utilized if need be. However, it was decided to fund the projects from its internal resources and gas projects like Kawas and Gandhar could not takeoff;
Average lead time for 500 MW unit was reduced from 49 months to 38
months e.g. Ramagundam STPS III and from 32 months to 28 months for 210/250 MW e.g. Raichur TPS etc thus new benchmarks were set without cost and time overruns.
Further, capital cost of new projects and tariffs is lower than the anticipated and Cost per MW do not escalate and remained around Rs 4 crore per MW in new coal fired thermal power Stations mainly due to prevailing low interest regime and compressed cycle of execution of projects under best effort scenario.
Thus, even with low utilization of funds (~53.7%) the physical targets achievement during 10th Plan is likely to be between 75% to 80%.Region-wise expenditure likely to be incurred during 10th Plan in Transmission Schemes in both State and Central sector is as follows:

Financial Issues & Power Sector Financing Working Group on Power for 11th Plan
Page 3 of Chapter 10
Table 10.4 Regional expenditure incurred during 10th Plan in Transmission Schemes
(Rs. crore)
Source : CEA; * actual 10.1.1 Distribution The extent of sub-transmission and Distribution systems at the beginning of 10th Plan on all India basis was 57,69,739 ckm of lines and 1,76,026 MVA of distribution transformer capacity. This has increased to 65,70,823 ckm of 33 kV, 11 kV and LT lines and 2,36,070 MVA of Distribution capacity by March 31, 2005, which implies an increase of 8,01,084 ckm of network and 60,044 MVA addition of Distribution capacity in the first 4 years of the Plan. It is expected that the addition envisaged by the Working Group on 10th Plan of 8,28,863 ckm of 33 kV, 11 kV and LT lines and 2,36,070 MVA of Distribution capacity would be surpassed. 10.1.2 Accelerated Power Development & Reforms Programme (APDRP) The Govt. of India has launched the Accelerated Power Development & Reforms Programme (APDRP) since FY’2002. It focuses on Upgradation/ improvement of Sub-Transmission and Distribution networks in densely electrified zones in the urban and industrial areas with an aim to reduce AT&C losses, enhance customer satisfaction and improve commercial viability of DISCOMs/ State Electricity Boards. It has following two components:
I. Investment component for strengthening and Upgradation of the sub-transmission and distribution system (Outlay of Rs. 20,000 crore for 10th Five Year Plan).
II. Incentive component to encourage/ motivate utilities to reduce cash losses (Outlay of Rs. 20,000 crore for 10th Five Year Plan).
Transmission Works Actual Actual Actual Actual Estimated Total
Name of the Utility
2002-03 2003-04 2004-05 2005-06 2006-07 10th planState Sector Northern Region
938 1,027 1,129 1,834 1,815 6,743
Western Region
827 1,107 1,065 1,432 3,020 7,450
Southern Region
994 1,205 1,097 1,356 1,693 6,346
Eastern Region 995 1,004 1,264 1,785 2,337 7,385N-E Region 50 56 120 125 238 590State sector 3,804 4,399 4,675 6,532 9,103 28,513Central Sector 2,671* 2,351* 3,218* 4,111* 4,849 17,200Total all India 6,475 6,750 7,893 10,643 13,952 45,713

Financial Issues & Power Sector Financing Working Group on Power for 11th Plan
Page 4 of Chapter 10
Under investment component 583 projects were sanctioned with cost of Rs.19180.46 Crore against this Rs.6131.70 crores were released. The Counter-Part funds tied up were Rs. 7044.34 Crore and funds drawn were Rs. 4087.04 Crore and Funds utilized were Rs. 9518.13 Crore. 10.1.3 Rajiv Gandhi Grameen Vidhyutikaran Yojana (RGGVY) The RGGVY was launched in April, 2005 to provide access to electricity to all un-electrified rural households by 2009. The scheme envisages electrification of over 1,00,000 villages and provide access to electricity to 7.8 crore rural household through creation of (i) Rural Electricity Distribution Backbone (REDB) with at least one 33/11 kV (or 66/11 kV) sub-station in each block; (ii) Village Electrification Infrastructure (VEI) with at least one distribution transformer in each village/ habitation; (iii) Decentralized Distributed Generation (DDG) Systems where grid supply is not feasible or cost-effective. RGGVY is being implemented in two phases. The first phase will cover the village headquarter and its at-least one hamlet. The 2nd phase will cover the balance number of hamlets that have a population of 300 or less. Given the experience of the awarded cost of about 200 DPRs received from the State and the CPSUs, the total project cost for phase one is expected to be Rs. 24,000 crore and Rs. 21,000 for the phase two. The phase one will be completed by 2009 and will reach electricity to all the unelectrified villages and 3 lakhs unelectrified hamlets. The 2nd phase, starting from 2009 onwards will reach the electricity to the balance unelectrified hamlets and complete the task of providing access to all unelectrified rural households in the electrified villages and hamlets by 2012. 10.2 FUND REQUIREMENT FOR 11TH PLAN 10.2.1 Generation Schemes It has been estimated that 30,641 MW is likely to be added during 10th Plan period and feasible capacity addition of about 68,8691 MW is likely during 11th Plan. These have been categorized as under:
1. Projects Under Construction 2. Committed Projects
The funding requirement for generation Schemes under Central, State and Private sector had been worked out based on various assumptions (placed at Appendix-10.3 w.r.t. cost and phasing of expenditure for various types of schemes. The funding requirements for the projects categorized above are as follows. 10.2.2 Projects Under Construction A capacity addition of 17,743 MW has been achieved during 10th Plan till 31st October, 2006, and 12,898 MW is expected to be commissioned during balance period of 10th Plan. Based on the status of various projects, about 31,345 MW capacity is under construction for likely benefit during 11th plan.
1 Excluding NCES & Captive

Financial Issues & Power Sector Financing Working Group on Power for 11th Plan
Page 5 of Chapter 10
Table 10.5
Summary of Projects under Construction
Sector Type Likely capacity addition
(MW)
Fund Requirement (Rs. crore)
Hydro 7,633 18,929
Thermal 7,200 16,917
Central
Nuclear 3,160 8,970
Total 17,993 44,816
Hydro 2,107 1,935 State
Thermal 5,852 14,308
Total 7,959 16,244
Hydro 2,191 8,835 Private
Thermal 3,202 6,818
Total 5,393 15,653
Hydro 11,931 29,700
Thermal 16,254 38,043
Nuclear 3,160 8,970
Total Under Construction
Grand Total 31,345 76,713
Source: CEA (Note: The aggregate capital cost of these projects is Rs 147,096 crore of which Rs. 76,713 crore is to be expended in 11th plan). 10.2.3 Committed Projects In addition to projects under construction, a number of projects are under various stages of development for which necessary inputs are being arranged by the implementing agencies and various clearances required for setting up these projects are being obtained such as environment and forest clearance, cooling water availability, land acquisition, DPR preparation, concurrence of CEA/ State Government (wherever required), financial tie ups/ CCEA clearance from govt., fuel linkages etc.. Based on present status, a capacity of 37,524 MW could be considered as committed capacity for benefit during 11th plan comprising of 3,654 MW Hydro and 33,870 MW Thermal.

Financial Issues & Power Sector Financing Working Group on Power for 11th Plan
Page 6 of Chapter 10
Table 10.6 Summary of Committed Projects
Sector Type Likely
capacity addition (MW)
Fund Requirement (Rs. crore)
Hydro 2,052 8,301 Central
Thermal 15,110 57,865
Total 17,162 66,166 Hydro 530 2,414 State
Thermal 16,000 60,970
Total 16,530 63,384 Hydro 1,072 4,399 Private
Thermal 2,760 11,040
Total 3,832 15,439 Hydro 3,654 15,114
Thermal 33,870 1,29875
Total Committed
projects Grand Total 37,524 1,44,988
Source: CEA
Table 10.7 Summary of 11th plan capacity addition (In MW)
10.2.4 Shelf of Projects to be taken up in 11th Plan for likely benefit in 12th Plan In addition to above projects, a shelf of projects benefiting in 12th Plan of about 91,759 MW (31,734 MW Hydro, 47,225 MW Thermal and 12,800 MW Nuclear) has also been considered for funding that would be at various stages of implementation during 11th Plan. 10.2.5 Summary of Fund Requirement for Generation Projects The details of the overall capacity addition programme of 68,869 MW during 11th Plan and fund requirement of Rs 4,10,897 crore including start-up projects for capacity addition in 12th Plan are tabulated in Table 10.8.
SECTOR HYDRO THERMAL NUCLEAR TOTAL
Projects Under Construction 11,931 16,254 3,160 31,345Committed Projects 3,654 33,870 0 37,524Total capacity 15,585 50,124 3,160 68,869

Financial Issues & Power Sector Financing Working Group on Power for 11th Plan
Page 7 of Chapter 10
Table 10.8 11th Plan Capacity addition & Fund Requirement (including advance action
funds for 12th plan projects)
Sector Fuel Type Likely capacity addition (MW)
Fund Requirement (Rs. crore)
Central Hydro 9,685 27,231 Thermal 22,310 74,782 Nuclear 3,160 8,970 Total 35,155 1,10,982
State Hydro 2,637 4,349 Thermal 21,852 75,278 Total 24,489 79,627
Private Hydro 3,263 13,234 Thermal 5,962 17,858 Total 9,225 31,092
All India Hydro 15,585 44,814 Thermal 50,124 1,67,918 Nuclear 3,160 8,970
Funds for projects benefiting in 11th Plan
Total 68,869 2,21701
Hydro 31,734 86,291Thermal 47,225 81,877
Funds for projects benefiting in 12th Plan Nuclear 12,800 21,208
Total 91,759 1,89,195Grand Total 1,60,628 4,10,896
10.2.6 Decentralized Distributed Generation In addition to the fund requirement for conventional generation projects, an investment of Rs. 20,000 crore is envisaged under Decentralized Distributed Generation projects, some of which would be for grid interconnected schemes. 10.2.7 Non-Conventional Energy Resources The estimated potential by FY 2032 for power generation from renewable energy sources such as wind, small hydro, solar, waste to energy and biomass in the country is estimated of about 183,000 MW. A capacity of 13,500 MW is expected from renewable energy source during 11th plan. This shall comprise of around 75% from wind (10,000 MW), 10% from small hydro power (1,400 MW) and 15% from bio energy (2,100 MW). The details of cumulative potential and achievements of - Renewable Grid Interactive Power and 10th plan Targets and Achievements and 11th Plan tentative targets are given in Table 10.9, Table 10.10 and Table 10.11.

Financial Issues & Power Sector Financing Working Group on Power for 11th Plan
Page 8 of Chapter 10
Table 10.9 Renewable Grid Interactive Power and 10th plan Targets vs. Achievements and
11th plan tentative targets (Figures in MW)
Table 10.10 10th Plan Targets and Achievements of renewable power
(Figures in MW) Sources / Systems Target Achievement (2002-
03 to 2005-06) Target
2006-07 Wind Power 1,500 3,684 1,515 Biomass Power Bagasse Co-generation Biomass Gasifiers
700 532 228
Small Hydro (up to 25 MW) 600 388 132 Waste to Energy -MSW -Industrial Waste
80
25 13
Solar Power 145 1 TOTAL 3,075 4,630 1,888
Thus there has been a significant achievement in all sources except solar power
Table 10.11
11th Plan Tentative Targets of Grid interactive renewable power
(Figures in MW) Sources / Systems Target for 11th plan
Wind Power 10,000
Biomass Power, Bagasse Co-generation Biomass Gasifiers
2,100
Small Hydro (up to 25 MW) 1,400
TOTAL 13,500
Sources / Systems Estimated Potential (by 2032)
Cumulative Installed Capacity
(As on 31.3.2006) Wind Power 45,000 5,310 Bio-Power(Agro residues & Plantations)
61,000 46
Co-generation Bagasse 5,000 867 Small Hydro (up to 25 MW) 15,000 1,826 Waste to Energy 7,000 34 Solar Photovoltaic 50,000 2
TOTAL 183,000 8,088

Financial Issues & Power Sector Financing Working Group on Power for 11th Plan
Page 9 of Chapter 10
Installed capacity by the end of 9th Plan (As on 31.3.2002) 3,475 MW Installed capacity by the end of 2005-06 (As on 31.3.2006) 8,088 MW Program for 2006-07 1,888 MW 11th Plan program for 2007-12 13,500 MW Total Installed Capacity by the end of 11th plan 23,476 MW
(Say 23,500 MW) 10.2.8 Captive Power Plants At present, the Installed Capacity of Captive Power Plants (1MW and above) is about 19,000 MW. The energy generation from captive power plants (1MW and above) during the year 2004-05 has been about 72 billion units. Further, a capacity addition of about 12,000 MW from Captive plants is expected by 2012 based on information/ details received from power plant manufacturers. The estimated cost of Non-Conventional Energy Sources and Captive power projects during 11th Plan period is estimated as follows:
NCE Sources (13,500 MW @ Rs. 5 crore/MW) Rs. 67,500 crore Captive Power Plants (12,000 MW @ Rs. 4 crore/MW) Rs. 48,000 crore
10.2.9 Merchant Power Plants A Merchant power plant does not have long term PPA for sale of its power and is generally developed on balance sheet of the developer. Government of India has reserved coal blocks with reserves of 3.2 bn Tonnes for allotment by the screening committee of Ministry of Coal for merchant plants and captive plants. About 10,000 MW capacity is expected to be developed through this initiative. Estimated funds required thereof is as follows:
Merchant Power Plants (10,000 MW @ Rs. 4 crore/MW) Rs. 40,000 crore 10.3 RENOVATION AND MODERNIZATION OF POWER PLANTS Based on current price level the fund requirement for R&M of Thermal and Hydro Power Stations for the 11th Plan is estimated as Rs. 15,875 crore, the details of which are given in Table 10.12.
Table 10.12 R&M Estimated Costs
Item Capacity in MW Estimated Cost
(Rs. crore) R&M of Hydro Power 11,278 3,478R&M of Thermal Power 12,389 12,397
TOTAL 15,875 10.4 TRANSMISSION NETWORK Total Fund requirement for transmission system development and related schemes has been estimated as following:

Financial Issues & Power Sector Financing Working Group on Power for 11th Plan
Page 10 of Chapter 10
Rs Crore
Inter-State 75,000 Intra-State 65,000
TOTAL 1,40,000 Central sector/ Inter-State schemes during 11th Plan Development of National and Regional grids and related systems would require the following types of schemes:
11th Plan Transmission Schemes for power evacuation and system strengthening for Central sector generation capacity requiring inter-state transmission
Transmission schemes for IPP Generation Capacity seeking open access from CTU for inter-state transmission
Spill over expenditure of 10th Plan transmission schemes and advance action for 12th Plan transmission schemes
Other related important schemes in Central sector State Sector/ Intra-State Schemes during 11th Plan Development of State grids and related systems would require the following types of schemes: 11th Plan Transmission Schemes of STUs for evacuation of state sector
generation including intra-state open access to IPP Generation in state sector STUs transmission schemes at 220kV, 132kV and 66kV to meet the transmission
needs of growth in demand Spill over expenditure of 10th Plan transmission scheme and advance action for
12th Plan transmission schemes Other related important schemes in the State sector for Renovation and
modernization of aging transmission system, State/Area load dispatch system, Protection system up-gradation, and Software for planning and management information system.
10.5 DISTRIBUTION AND RURAL ELECTRIFICATION It is estimated that to transmit the generation capacity to end consumers envisaged in 11th Plan, a matching distribution network of about 15,00,000 ckm of 33 kV, 11 kV and LV lines and 2,92,000 MVA of distribution capacity will need to be established in addition to installation of capacitors and re-conductoring of sub-transmission/ distribution network of about 30,00,000 ckm and augmentation of distribution capacity of 1,98,000 MVA of various sub-stations. In addition to the above the

Financial Issues & Power Sector Financing Working Group on Power for 11th Plan
Page 11 of Chapter 10
estimated fund requirement of various other initiatives like Rajiv Gandhi Gramin Vidyut Yojna (RGGVY) under rural electrification and APDRP etc. is as follows:
Table 10.13
Distribution and Rural Electrification Estimates (Rs. crore)
10.6 HUMAN RESOURCE DEVELOPMENT Based on the assumed norms and additional capacity addition during 11th Plan and to set up facilities by NPTI in NER, hydro power training institute at Nagal, technology upgradation schemes etc. an outlay of Rs. 462 crore has been made which is to be sourced from governmental assistance and other sources. 10.7 RESEARCH AND TECHNOLOGY DEVELOPMENT The funding requirement of about Rs. 1,214 crore in 11th Plan Period has been made for various schemes to be undertaken by Central Power Research Institute (CPRI). The schemes include investment in new technology demonstration in thermal generation 400 MW stations, R&D and demonstration in distributed generation, Gas cum solar hybrid project, Nano materials applications for power sector, Transmission & distribution, High power test facility addition, Upgradation of laboratory to test 400 kV breakers etc., R&D Projects (In-house, RsoP & NPP), UHV laboratory Hyderabad etc. 10.8 DEMAND SIDE MANAGEMENT To strengthen existing institutional set-up in Bureau of Energy Efficiency (BEE) and State Designated Agencies (SDA) & other energy conservation programmes, an outlay of Rs. 653 crore has been estimated during the 11th plan period. 10.9 11TH PLAN ESTIMATED FUND REQUIREMENT The total requirement of funds in 11th Plan has been estimated as Rs. 10,31,600 crore as given in the following tables:
Particulars Amount Sub-transmission and Distribution 1,97,000 RGGVY 40,000 APDRP & Other Schemes (pump sets etc.) 40,000 Others 10,000
TOTAL 2,87,000

Financial Issues & Power Sector Financing Working Group on Power for 11th Plan
Page 12 of Chapter 10
Table 10.14 Total Fund Requirement
(Rs. Crore) Particulars State Central Private Total Generation including Nuclear 1,23,792 2,02,067 85,037 4,10,896DDG 20,000 20,000R & M 15,875 15,875Transmission 65,000 75,000 1,40,000Distribution including Rural electrification
2,87,000 2,87,000
HRD 462 462R&D Outlay 1,214 1,214DSM 653 653
Total Power Sector 4,91,667 2,99,396 85,037 8,76,100NCES and Captive 22,500 93,000 1,15,500Merchant Plants 40,000 40,000
Total Funds Requirement 5,14,167 2,99,396 2,18,037 10,31,600
10.10 YEAR WISE FUND REQUIREMENT: The year wise fund requirement during 11th Plan has been given in Table 10.15.
Table 10.15 Year wise Funding Requirement for 11th Plan
(Rs. Crore) 2007-08 2008-09 2009-10 2010-11 2011-12 Total 1,27,804 1,74,611 2,27,280 2,55,656 2,46,249 10,31,600
10.11 SOURCES OF FUNDS 10.11.1 Introduction A Debt: Equity (D/E) ratio of 70:30 has been taken based on the current financial practices for funding of power sector. A scenario has also been developed at D/E of 80:20. The possible sources of funding are commercial banks, public financial institutions, dedicated infrastructure/power finance institutions (PFC, IIFCL, IDFC and REC), insurance companies, overseas markets, bilateral/ multilateral credit, bond markets and equity markets. The issues regarding each of these agencies and the possible sources of funds are enumerated below. 10.11.6 Commercial Banks / AIFIs As per the prevalent guidelines/ prudential norms, the financing limits applicable for Banks/ AIFIs are:

Financial Issues & Power Sector Financing Working Group on Power for 11th Plan
Page 13 of Chapter 10
10.11.6.1 Exposure Ceilings of Banks for Individual/ Group Borrowers Credit exposure to borrowers belonging to a group may exceed the exposure norm of 40% of the bank’s capital funds by an additional 10% (i.e. up to 50%), provided the additional credit exposure is on account of extension of credit to infrastructure projects. Credit exposure to single borrower may exceed the exposure norm of 15% of the bank’s capital funds by an additional 5% (i.e. up to 20%) provided the additional credit exposure is on account of infrastructure. Banks may, in exceptional circumstances, with the approval of their Boards, consider enhancement of the exposure to a borrower up to a further 5% of capital funds. As per the guidelines on exposure norms, the banks may further fix internal limits for aggregate commitments to specific sectors / industries. 10.11.6.2 Exposure Ceilings of Financial Institutions for Individual /Group
Borrowers As per the prudential norms, the credit exposure to single borrowers shall not exceed 15% of capital funds of the AIFI. However, the exposure may exceed by additional 5% (i.e. up to 20%) provided the additional credit exposure is on account of infrastructure projects. AIFIs may, in exceptional circumstances, with the approval of their Boards, consider enhancement of the exposure to a borrower up to a further 5% of capital funds (i.e. 25% of capital funds for infrastructure projects and 20% for other projects). The credit exposure to the borrowers belonging to a group shall not exceed 40% of capital funds of the AIFI. However, the exposure may exceed by additional 10% (i.e. up to 50%) provided the additional credit exposure is on account of infrastructure projects. AIFIs may in exceptional circumstances, with the approval of their Boards, consider enhancement of the exposure to a borrower up to a further 5% of capital funds (i.e. 55% of capital funds for infrastructure projects and 45% for other projects). The AIFIs may fix internal limits for aggregate commitments to specific sectors. The policy of funding infrastructure projects by Domestic Commercial Banks (DCBs) is typically governed by the prudential guidelines prescribed by Reserve Bank of India (RBI) and further limited by the internal credit policy of each bank. As per RBI guidelines for funding infrastructure projects, maximum exposure to a single borrower and to a single group is limited to 20% and 50% respectively of the bank’s networth. With the approval of the Board of Directors, an additional 5% could be sanctioned for both the categories. Some banks also have an internal cap broadly on the following lines:
i. Maximum term loans not to exceed 30% (of total time / term deposits / total non food advances) at any time
ii. Terms loans per industry at a maximum of 10% of non-food advances iii. Maximum limit for infrastructure advances at 7% of non-food advances
As per data complied by RBI, as on 31st March 2006, the Aggregate Time Deposits of Scheduled Commercial Banks stood at approx. Rs 17,40,419 crore and total credit

Financial Issues & Power Sector Financing Working Group on Power for 11th Plan
Page 14 of Chapter 10
at Rs 14,96,474 crore. Out of the at Rs 14,96,474 crore, the infrastructure credit was Rs. 2,24,471 crore representing about 15% of total credit. 10.11.7 Insurance Companies While considering the other major category of investment institutions - the insurance companies, it may be observed that the Insurance Regulatory and Development Authority of India (IRDA) have mandated the pattern of investments to be followed by the various insurance companies. Investments in Government securities, approved securities, approved investments and in infrastructure and social sectors have been prescribed in the Insurance Act, 1938 and the regulations have been framed thereunder. IRDA has also specified that every insurer carrying on the business of life insurance shall invest and at all times keep invested its controlled fund (other than funds relating to pension and general annuity business and unit-linked life insurance business) in the prescribed manner. Currently, IRDA has specified the following limits for the investments that are to be maintained by life insurance companies. (Source: Insurance Regulatory and Development Authority).
Table 10.16 Limits for investments by Life Insurance Companies
S.No Type of Investment % of fund i) Government securities or other approved securities Not less than 50% -Government securities 25%
ii) Approved Investments as specified in Schedule – 1 a) Infrastructure and Social Sector Not less than 15% b) Others to be governed by Exposure Norms. (Investments in
`Other than in approved Investments' in no case exceed 15% of the Fund)
Not exceeding 35%
For general insurance companies, IRDA has specified the following sectoral caps for investments:
Table 10.17 Limits of Insurance specified for General Insurance companies
S No. Type of Investment Percentage i) State Government Securities and other guaranteed securities being
not less than 30%
-Central Government securities being not less than 20% ii) Housing and Loans to State Government for Housing and Fire
Fighting equipment being not less than 5%
iii) Investments in Approved Investments a) Infrastructure and Social Sector Not less than 10% b) Others to be governed by Exposure Norms. However the
investments in `Other than in Approved Investments' in no case exceed 25% of the Assets
Not exceeding 55%

Financial Issues & Power Sector Financing Working Group on Power for 11th Plan
Page 15 of Chapter 10
The total aggregate incremental investments in the infrastructure sector were Rs. 70,000 – Rs. 80,000 crore in FY 2003-04 and FY 2004-05. Estimated amount that can be invested in the infrastructure sector after complying the prudential norms stands at Rs. 10,000 crore p.a. Assuming 40% of the infrastructure exposure is in the power sector, the annual availability for it is estimated at around Rs. 4,000 crore on an yearly basis. 10.11.8 Overseas Markets: ECBs As regards financing from overseas markets is concerned, while there is no paucity of funds, the same need to be appropriately channelized towards the power sector, either in the form of syndicated debt, tied financing / supplier’s credit, or assistance from multilateral agencies. However, the availability of long-term funds in overseas markets too is an issue, with the lenders generally preferring to limit their exposure to 5 years tenures. ECB for investment in infrastructure sector falls under the Automatic Route i.e. it will not require RBI/ Government approval. Borrowers can raise ECB from internationally recognized sources such as international banks, international capital markets, multilateral financial institutions, export credit agencies and suppliers of equipment, foreign collaborators and foreign equity holders. However, the following are the limits in regards to the amount and duration of ECBs raised through automatic route:
i. ECB up to USD 20 million or equivalent with minimum average maturity of three years
ii. ECB above USD 20 million and up to USD 500 million or equivalent with minimum average maturity of five years.
iii. The maximum amount of ECB, which can be raised by an eligible borrower under the Automatic Route, is USD 500 million during a financial year. Moreover as per the credit policy announced in October 2006, these borrowers can raise additional $250 million with average maturity of 10 years under the approval route.
iv. ECB up to USD 20 million can have call/put option provided the minimum average maturity of 3 years is complied before exercising call/put option.
The RBI indicates the all-in-cost ceilings for ECB from time to time. The following ceilings will be valid currently:
Table 10.18 Ceilings for ECB Lending
Minimum Average Maturity Period All-in-cost Ceilings over six month
LIBOR* Three years and up to five years 200 basis points More than five years 350 basis points * For the respective currency of borrowing or applicable benchmark.

Financial Issues & Power Sector Financing Working Group on Power for 11th Plan
Page 16 of Chapter 10
While the depth of ECB market is not perceived to be a problem, the issue remains that the tenure of ECB borrowings is usually short, and the impact the shorter tenure has on the returns to the Developer on account of the Depreciation norms allowed as part of tariffs being lower than the actual loan repayment. As can be seen above, Developers can explore this route more aggressively of raising loans from international markets at competitive rates and for a longer tenure.
10.11.9 Multilateral Agencies Some of the concerns that need to be addressed, related to funding of projects from multilateral agencies, such as World Bank, Asian Development Bank etc. are:
i. Significant emphasis on Environment and Social Issues with added costs of audits and certifications.
ii. Comparatively lengthy and time consuming appraisal and due diligence exercise, conducted by multilateral agencies.
The above can be attributed to the requirement on the part of multilateral agencies regarding the risk profile of the project and past experiences of the progress of power sector reforms in the country. Further, inadequate returns due to poor financial health of the SPUs/ SEBs; announcements of free power by State Governments implications; lack of comprehensive payment security mechanism etc. are acting as deterrents to advancement of financing by multilateral agencies to the sector in a big way. 10.11.10 Bond Market The Indian Financial system does not have large active and liquid debt market. The Corporate Debt Market in India is in its infancy both in terms of microstructure as well as market outcomes. Primary market is dominated by financial sector and relatively small amount of funds are raised by manufacturing and other service industries. The government securities market has grown exponentially during last decade due to many structural changes introduced by the government and Reserve Bank of India. However, secondary market activities in corporate bonds have not picked up as in the case of government securities. The Debt Markets in India are dominated by Government securities, which account for 70 - 75% of the outstanding value of issued securities and 90-95% of the trading volumes in the Indian Debt Markets. State Government securities & Treasury Bills account for around 3-4 % of the daily trading volumes. The trading activity in the G-Sec. Market is also very concentrated currently (in terms of liquidity of the outstanding G-Sec.) with the top 10 liquid securities accounting for around 70% of the daily volumes. The primary market in corporate debt is basically a private placement market with most of the corporate bond issues being privately placed among the wholesale investors i.e. the Banks, Mutual Funds, Provident Funds & other large investors like LIC, etc. The proportion of public issues in the total quantum of debt capital issued annually has substantially decreased in the last few years. For example, as per SEBI, in 2005-06 corporate sector raised more than Rs. 83,000 crore from the bond markets, most of which was through private placements.

Financial Issues & Power Sector Financing Working Group on Power for 11th Plan
Page 17 of Chapter 10
RBI to take steps to develop corporate bond market with screen based trading, rating of Bonds and Government to encourage the same. 10.12 ESTIMATED FUNDS MOBILIZATION The details of major sources and estimated mobilization, funding gap and possible sources of bridging the gap is given below in following Tables alongwith details as under:
Table 10.19 Estimated Funding for 11th Plan
(Rs. Crore) Description State Central Private Total Funds required 5,14,167 2,99,396 2,18,037 10,31,600
A) Equity Required (D/E - 70:30) 154,250 89,819 65,411 3,09,480 B) Equity Available 1 -Promoters including FDI for IPPs 0 0 25,511 25,511
-Promoters including FDI for NCES & Captive 0 0 27,900 27,900 -Merchant Power Plant 12,000 12,000
2 Internal Resources 0 62,922 0 62,922 3 Govt. Support
3.1 State Govt. 0 0 0 0 3.2 Central Govt. 0 0 0 0 C) Total Equity Available 0 62,922 65,411 1,28,333 D) Additional Equity to be arranged (A-C) 1,54,250 26,897 0 1,81,147 E) Debt Required (D/E - 70:30) 3,59,917 2,09,577 1,52,626 7,22,120 F) Debt Available
1.1 Direct Market Borrowing 10,000 15,000 0 25,000 1.2 Banks and AIFIs 37,173 58,415 10,621 106,210 1.3 PFC 64,960 8,120 8,120 81,200 1.4 REC 47,320 5,915 5,915 59,150 1.5 IIFCL 0 6,000 9,000 15,000 2.1 Multilateral/Bilateral Credits 5,520 19,320 2,760 27,600 2.2 ECA/ECB/Syndicated Loan etc. 0 46,000 11,500 57,500 G) Total Debt Available 1,64,973 1,58,770 47,916 3,71,660 H) Additional Debt to be arranged (E-G) 1,94,943 50,807 1,04,710 3,50,460 I) Additional Equity & Debt required (D+H) 3,49,193 77,704 1,04,710 5,31,607
J) Total Availablity of Debt and Equity 1,64,973 2,21,692 1,13,327 4,99,993 K) Funding by Special Schemes 1 APDRP 40,000 0 0 40,000 2 RGGVY 40,000 0 0 40,000
L) Total shortfall to be arranged (I-K) 2,69,193 77,704 1,04,710 4,51,607

Financial Issues & Power Sector Financing Working Group on Power for 11th Plan
Page 18 of Chapter 10
Table 10.20 Summary of Funds Requirement and Mobilization for
Different Debt: Equity Scenario
( Rs. Crore) Description D/E
70:30 D/E
80:20 Funds required 10,31,600 10,31,600Equity Required 3,09,480 2,06,320Total Equity Available 1,28,333 1,28,333Additional Equity to be arranged 1,81,147 77,987Debt Required 7,22,120 8,25,280Total Debt Available 3,71,660 3,71,660Additional Debt to be arranged 3,50,460 4,53,620Additional Equity & Debt required 5,31,607 5,31,607Less: Funding by Special Schemes 80,000 80,000Total shortfall to be arranged 4,51,607 4,51,607Equity required after funding from special schemes 1,21,147 17,987Debt required after funding from special Schemes 3,30,460 4,33,620 The above estimates are based on the following norms and assumptions: 10.12.6 Debt Equity Mix Debt Equity Mix for power projects taken to be 70:30. 10.12.7 Exchange Rate An exchange rate of Rs. 46 per USD has been assumed for the plan period. Based on a 70:30 debt-equity ratio and considering the availability of Rs 40,000 crore from APDRP and Rs 40,000 crore from RGVVY, the overall gap in funding is Rs. 4,51,607 crore comprising equity gap of Rs 1,21,1472 crore and debt gap of Rs 3,30,460 crore. Further, for a debt-equity ratio of 80:20, overall gap in funding remains the same with equity gap of Rs. 17,987 crore and debt gap of Rs. 4,33,620 crore. 10.12.8 Sources of Equity: 10.12.8.1 Promoters’ Equity including FDI in Private Sector It has been assumed that equity portion of the total funding required for generation (including nuclear & DDG) and transmission in the private sector, will be met through
2 RGVVY funding is considered a part of Equity funding whereas APDRP funding is split equally between Equity and Debt.

Financial Issues & Power Sector Financing Working Group on Power for 11th Plan
Page 19 of Chapter 10
FDI and brought by the promoters in the private sector through own sources. FDI during the plan period has been assumed to be USD 360 Million per annum. 10.12.8.2 Gross Budgetary Support by Central Government Planned Budgetary Outlay by Central Government is assumed to grow at CAGR of 19% over Budgeted Estimates (BE) of 2006-07 (CAGR of BE from 2002-03 to 2006-07 being 19.64%). Actual Outlay is assumed at 73% of BE (based on average performance during 2002-03 to 2004-05), 80% of Actual Outlay is assumed in the form of IEBR and 20% in the form of GBS (based on BE of 2006-07). Internal Sources as a part of IEBR has been estimated as Rs. 62,922 crore during 11th plan period. 10.12.9 Sources of Debt: 10.12.9.1 Direct Borrowings The Direct Borrowings include direct fund raising through bonds and other instruments by companies such as NTPC, NHPC, PGCIL, DVC, NEEPCO, SJVNL, THDC and SEBs which are subscribed by provident and pension funds, gratuity trusts, insurance companies, mutual funds, individuals etc. but excludes subscription by banks which are separately included in funding by banks and AIFIs. The annual aggregate issuance through these instruments is estimated to be about Rs. 5,000 crores. 10.12.9.2 Banks, NBFCs and AIFIs a) Deployment of Non-food Gross Bank Credit in Infrastructure sector during FY
2005-06 and FY 2004-05 was Rs. 29,778 Crore and Rs. 21,829 Crore respectively, indicating a growth of 36%. Assuming the base figure of Rs 29,778 crore for FY 2005-06 and assuming a growth in infrastructure sector credit at 15% p.a.3 and share of power sector in infrastructure credit be 40%, funding under this source during the plan period comes to Rs. 106,210 Crore.
b) Funding by Banks exclude the funds channelised through PFC & REC, which
PFC & REC borrow from Banks & AIFIs in the form of Term Loans c) Reserve Bank of India has issued guidelines on the subject of Financial
regulation of systemically important NBFCs (with asset size of more than Rs. 100 crores) and Banks’ relationship with them vide circular no. RBI/2006-07/204 and RBI/2006-07/205 dated December 12, 2006. Consequently, lending by systemically important NBFCs to a single borrower (15% of Networth) and a group borrower (25% of Networth) is capped by the exposure norms as laid down in the aforesaid guidelines. This will affect the ability of the institutions (such as PFC, REC, IREDA etc) to fund the power sector. Besides, the exposure to be taken by a bank on a single NBFC has also been capped at 15% of Bank’s
3 Though growth last year was 36%, the average growth of industrial credit from year 2000 to year 2005 has been 13% per annum and hence a growth of 15% per annum in infrastructure sector credit growth has been taken.

Financial Issues & Power Sector Financing Working Group on Power for 11th Plan
Page 20 of Chapter 10
Capital Funds. These guidelines also indicate that Banks may also consider fixing internal limits for their aggregate exposure to all NBFCs put together. This in-turn will affect the ability of the institutions such as PFC, REC, IDFC, IREDA etc to mobilize the resources from the Indian financial system and channelise funds to the power sector. All the affected NBFCs are required to give a roadmap to RBI to comply with these guidelines by March 31, 2007. Thus, these guidelines are expected to have an unfavorable impact on the availability of funds to the power sector and impact of these restrictive guidelines is not ascertainable at this stage.
10.12.9.3 PFC PFC has disbursed Rs. 37,404 Crore during first 4 years of the 10th Plan. Its disbursements during FY 2005-06 and FY 2004-05 stood at Rs. 11,680 Crore and Rs. 9,409 Crore respectively indicating a growth rate of 24% p.a. Assuming the same growth rate, expected Disbursement by PFC during 11th Plan Period is estimated at about Rs. 81,200 crore approximately. It is assumed that term loans will be about 80% of total Disbursements. The fund allocation to State, Central & Private sector is estimated in the ratio of 80%, 10% and 10% respectively. 10.12.9.4 REC REC has disbursed Rs 20,508 Crore during first 3 years of the 10th Plan. CAGR of its disbursements during FY 1999-2000 to FY 2004-2005 stands at 20.91%. Assuming the same growth rate, expected disbursement by REC during 11th Plan Period is pegged at Rs. 59,150 Crore. It is assumed that term loans will be about 80% of total Disbursements. The fund allocation to State, Central & Private sector is estimated in the ratio of 80%, 10% and 10% respectively. 10.12.9.5 IIFCL It has been assumed that IIFCL will fund Rs. 15,000 Crore during the 11th Plan Period to Central & Private Sector in the ratio of 40:60. 10.12.9.6 Multilateral/Bilateral Credit It has been assumed that World Bank & ADB each will fund USD 600 million per annum. During the plan period fund allocation to State, Central & Private sector is estimated in the ratio of 20%, 70% and 10% respectively.
10.12.9.7 ECA, ECBs It is assumed that funding through ECA & ECBs will be to the tune of USD 2,500 million per annum during the plan period and the fund allocation to Central and Private sector is estimated in the ratio of 80% and 20% respectively.
10.13 LENDERS’ ISSUES
i. It may be noted that the estimates made in Table - 25 above for funding
infrastructure projects could at best be viewed as indicative as they do not take into account competing demands of various sectors that the lenders may decide to fund based on perceived risk and return criteria. Further, banks

Financial Issues & Power Sector Financing Working Group on Power for 11th Plan
Page 21 of Chapter 10
need to comply with prudent Asset Liability Management guidelines prescribed by RBI while taking up long term exposures. Dedicated institutions set up for funding the power sector, namely, Power Finance Corporation that typically supports SEBs, APDRP and IPPs and Rural Electrification Corporation that has its thrust on funding Rural Electrification projects, are however, not constrained in this regard.
ii. Power projects are also plagued by lack of suitable fuel linkage, evacuation,
off take and payment security mechanisms. Environment as well as Rehabilitation and Resettlement issues also need to be taken care of. Many a time, as a parallel process, loans are approved by lenders pending satisfactory arrangements in this regard. Any delay in achieving these milestones could delay disbursement leading to cost and time overrun and ultimate viability of the project.
iii. The off takers of power are mostly SEBs and almost all of them (and their
successor DISCOMS) continue to make cash losses. The lenders are extremely concerned over this and continue to seek a credible payment security mechanism that often entails suitable credit enhancement as may be required. While the situation varies from State to State, few States like Delhi, Andhra Pradesh, Gujarat and Tamil Nadu have managed to reduce their AT&C losses substantially and come close to break even levels. However, till the time these entities start making cash profit, the concerned Governments may need to provide suitable comfort to the lenders by signing/ operationalising satisfactory escrow agreements or required changes in other project documents (PPA etc).
iv. It is also necessary for the Government authorities to expedite critical
clearances, especially those pertaining to environmental clearances; land acquisition and related Rehabilitation and Resettlement (R&R) issues; water drawal permissions etc. Most states have till date, not put in place a single window clearance mechanism to assist in obtaining these clearances in an expeditious manner. Needless to say that delays and uncertainties, in allocation of fuel linkage also adds to avoidable cost and time overrun in these projects.
10.13.1 Credit Enhancing Mechanisms For Enhancing Comfort To Lenders It must be re-emphasized that the utilities in the power sector need to generate profits through levy of adequate user charges/recovery so that the Lenders are enthused to lend to the entities in the sector. Whenever the sector becomes self-sufficient, the lending and security payment mechanism will be based on commercial negotiations between the lenders and the borrowers, as in other infrastructure sectors like telecom, roads, ports, oil & gas etc. However, till the time this happens, the governments will have to provide required comfort regarding payment security to the lenders and the developers. The lenders have been requesting the Government that the payment security to CPSUs and Private Developers should be on the same footing. This would enable a

Financial Issues & Power Sector Financing Working Group on Power for 11th Plan
Page 22 of Chapter 10
quicker financial close and give adequate comfort to lenders. It is the Governments’ argument that the offer of incremental escrow might be sufficient as it expects the sector to break even in the next few years. In any case, if this is the case, the Government can extend the same benefits as those extended to CPSUs as anyway this will become redundant whenever the turnaround happens. Thus, developers and lenders are, demanding the payment security such as direct RBI debit facility that is currently available to CPSUs for the projects to be considered satisfactorily attractively & safe, as far as payment security is concerned. Government may also consider allowing credit enhancement from select specified multilateral and development agencies without attracting the need to get specific approval from RBI for such structured obligations. This will bring down the cost of funds and help reduce the cost of generation. Grant to SEBs by the State Government should be provided upfront for meeting the shortfall in the debt servicing rather than guaranteeing the entire debt. 10.13.2 Regulatory Framework Issues - Banking Sector
i. It is being often suggested that prudential norms for exposure to a particular Sector/ Group be relaxed. It may be mentioned that for some of the exposure limits, the Boards of the Banks can decide on the same and are willing to do so on commercial principles considering promoters’ background and financial strength of off-takers.
ii. However, prudential guidelines of RBI in respect of single borrower and single Group exposure are tied to the networth of the lender and tinkering with this measure that serves to mitigate the credit concentration risk is not in the interest of the banking system and the economy, and as such may not be acceptable to RBI/ MoF. However, recent changes by RBI in respect of single client and single group exposure limits for Infrastructure dedicated NBFCs, needs to be reviewed and brought back to original limits specified earlier.
iii. In order to supplement the domestic resources, banks and NBFCs may be allowed to raise ECBs under the automatic approval route and on-lend them to developers of power projects including Ultra Mega Power Projects, preferably with proper hedging as these projects do not provide natural export cover.
iv. Explicit exemptions would be needed in respect of stamp duty to encourage take out financing so as to enable lenders take long term position in power projects.
v. Banks should be allowed to augment their capital base through innovative instruments as most exposure norms are linked to the bank’s networth. Moreover, definition for exposure limit as a % of regulatory capital as applicable to Banks/AIFIs should also be applicable to NBFCs thereby allowing NBFCs to use their tier II capital for calculating exposure limits.
10.13.3 Regulatory Issues related to ERCs, Government Policies (i) Only a few states have come out with Multi-year Tariff Principles that encourage
developers and lenders to take a long term view. For generation projects developed on a cost-plus basis, the norms for RoE, depreciation, etc should be frozen on the date of signing of agreements, as any change directly impacts

Financial Issues & Power Sector Financing Working Group on Power for 11th Plan
Page 23 of Chapter 10
lenders’ ratios as well as developers’ ratios. Adverse changes, while benefiting off-takers in the short term actually reduce interests of developers and lenders in the long run and thus should be avoided.
(ii) Similarly, in Distribution, a long term loss reduction trajectory should be specified
by the ERC so that lenders have an idea of the time to achieve break-even. The Financial Restructuring Plans prepared for these entities should be made available to lenders enable them to take a view.
(iii) Most ERCs have not specified levels of cross-subsidy surcharge to be charged,
and the time table for reduction of the same. This discourages development of an open multi-buyer model and discourages capacity addition for supplying to consumers directly.
(iv) There is a significant uncertainty regarding applicability of Section 63 of Electricity
Act 2003. Many states have sought multiple extensions and have received the same. It creates uncertainty in minds of lenders over the overall direction in which the power sector is progressing. Further, principles like open access etc are compromised if utilities are not unbundled. Any further extension of time for unbundling should not be entertained to reduce the uncertainties.
(v) Most States had signed MoUs to privatize distribution in large cities. However,
there is almost nil progress on that front. Privatization model of Delhi, where the ATC losses have come down by the promised levels (and even over-achieved in one DISCOM) & the sector is close to the break-even levels, could be followed in various cities and states should be encouraged to go for the same. The Central Government, in order to encourage such steps, could promise to bring in transition funding in case of privatization of DISCOMS.
10.14 DEVELOPERS’ CONCERNS Some of the specific concerns of the equipment suppliers & developers, in relation to the attractiveness of the power sector, issues in bringing in the required equity finances & problems faced at the time of financial closure are as follows.
a) In order to achieve the 11th Plan Capacity addition target of the 11th Plan and to
avoid bunching of the schedules during last years of the Plan period, Ministry of Power is emphasizing on a time schedule for finalization of orders. However, past experience shows that some of the projects are not able to take off even after all settlement between the developer and EPC contractor, mainly because of delay in the financial closures of the project. In view of this, there is a need to look into a short-term arrangement to meet the funds requirement for initiating the project till the project achieves the final financial closure.
b) Power projects being capital intensive in nature and due to a mismatch between
the depreciation rates (as allowed in the CERC regulations and Companies Act) most developers desire to have longer tenure repayment (say 15 years or more), for a comfortable cash flow situation in the initial years of the Project. However, the Indian banking sector as on date, is not in a position, to provide such long

Financial Issues & Power Sector Financing Working Group on Power for 11th Plan
Page 24 of Chapter 10
tenor loans. Long term financing, exceeding 10 years repayment tenure is required because in a bidding scenario, shorter duration of debt causes front loading of tariff resulting in high tariff in the initial years. Insurance Companies, Financial Institutions should be encouraged/provided incentives to invest in longer dated securities to evolve an optimal debt structure to minimize the cost of debt servicing. This would ensure lowest tariff structure and maximum financial viability. Option of a moratorium for an initial 2 to 5 years may also reduce tariff structure during the initial years.
c) MoF may be required to allow a structure where banks take up loans having
tapering payment (major repayments in initial 10 years) whereas institutions like IIFCL/Insurance Companies etc. accept ballooning repayment (major repayments after 10th year). This would entail funding of a project in such a fashion that major portion of bank loan is repayable in initial years while major portion of IIFCL/Insurance Companies loans are repayable after 10 years. Such a structure would fit into banks ALM repayment when specialized institutions like IIFCL promoted for specific objective of priority Infrastructure projects lending can accept repayment which are back ended.
d) In case of a competitive bidding scenario, difficulties are being faced by
developers to achieve financial closure. It is quite difficult to convince lenders to grant sanctions and approve credit facilities for projects where off-take is not fully tied up, at the time of approaching lenders. The dilemma of whether to appraise the project on the basis of its marketing arrangements or whether to conduct an appraisal of the cost of generation of the project (i.e. whether the project is generating power at competitive rates) needs to be addressed by the bankers.
10.15 RECOMMENDATIONS & IMPLEMENTATION STRATEGY 10.15.1 Policy Measures for Equity Participation IPO by Power companies: Profit making Central/ State Utilities in generation as well as transmission & distribution to be encouraged for supply of PSUs stock in the market by way of IPOs/ FPOs (Follow-on Public Offer)/ Offer for sale. If there is an Offer for sale coupled with a raising of fresh equity, the money received through offer for sale could be channelized to a Power Investment Fund or to a Power Finance holding company which will use such funds solely for investments in the Power Sector. It is estimated that an amount of Rs. 10,000 -15,000 crore can be raised over the plan period. Allow lower risk weightage of 100% (equivalent to normal commercial lending) to the primary equity investment/ capital market exposure directly or through an Infrastructure Fund by Banks and AIFIs as against the risk weightage of 150% recently enhanced by RBI. Despite an excellent performance of such investments in the past, Banks and IFIs are reluctant to take exposure in any Indian Infrastructure Development Fund due to increased risk weightage. In view of the need for channelising additional resources for infrastructure development, the increased risk weightage for such investment should not be applicable to equity investments made in Infrastructure dedicated Companies or Funds.

Financial Issues & Power Sector Financing Working Group on Power for 11th Plan
Page 25 of Chapter 10
10.15.2 Public Private Participation models: PPP on the lines of UMPP where Govt. undertakes to get the various clearances before the bidding facilitates the quicker financial closure.
10.15.3 Relaxation in Companies (Issue of Share Capital with Differential Voting Rights) Rules, 2001, for issuing Equity Shares with Differential Voting Rights
i. The power sector has a huge equity requirement for funding the power projects and the ability of the promoters to put in equity is limited. The possibility of the promoters to invite other financial investors to bridge the equity gap is also restricted as it would dilute their controlling stake due to participation of other equity investors with equal voting rights. However, if by a practicable mechanism the balance equity (with differentiated voting rights) can be infused without diluting controlling stake of the existing promoters, it would facilitate bridging the equity funding gap.
ii. As per Section 86(a) (ii) of the Companies Act, 1956, a company can issue
equity shares with differential rights as to dividend, voting or otherwise subject to Companies (Issue of Share Capital with Differential Voting Rights) Rules, 2001. However, under Rule 3 (1) of the above said Rules require a company to have distributable profits in terms of Section 205 of the Companies Act, 1956 for three financial years in which it was decided to issue such shares. This makes it impracticable to use this proviso for bringing equity Funds in a new Power Company/ Project.
iii. In case of power companies (esp. SPVs) the construction period spans over a
longer period with huge capital requirement, therefore, the above condition of having distributable profits will restrict the ability to issue such shares by power companies. Therefore, it is proposed that Rule 3 (1) of Companies (Issue of Share Capital with Differential Voting Rights) Rules, 2001 may be waived for power companies for issuing equity shares with differential voting rights before the date of commissioning of the project. A relaxation to this effect will help power companies to bridge the equity funding gap and allow faster off take of the power projects.
10.15.4 Equity support by State Governments through Budget Allocation: The State Government should allocate funds through its budget for providing equity support to State utilities in power sector. The recent RBI Study on State finances clearly indicates improvement in finances of major States. This is also reflected in RBI’s move to allow better off States to buy back guaranteed bonds from institutional investors. More over States who have availed direct loans from institutions have also come forward to prepay the loans. 10.15.5 Sector Specific Funds From time to time, GoI introduces sector specific funds with specific objective of making funds available to a particular sector from the respective fund. Some of these

Financial Issues & Power Sector Financing Working Group on Power for 11th Plan
Page 26 of Chapter 10
funds which can be considered potential source of funds for the infrastructure sector are: 10.15.5.1 Scheme For Financing Viable Infrastructure Projects GoI has decided to put into effect the Scheme for financing Viable Infrastructure Projects for providing financial support to improve the viability of infrastructure projects. The scheme is being administered by the Ministry of Finance through the India Infrastructure Finance Company Ltd (IIFCL), a company incorporated under the Companies Act, 1956. Apart from its equity, the IIFCL is being funded through long-term debt raised from open market. This debt can be any or all of the following:
i. Rupee debt raised from the market through suitable instruments created for the purpose; the IIFCL would ordinarily raise debt of maturity of 10 years and beyond.
ii. Debt from bilateral or multilateral institutions such as the World Bank and Asian Development Bank. However, the conditions of multilateral agencies include conditions like ADB generally stipulates that the its loan proceeds be utilized for procurement in member countries of ADB, to comply with various covenants on resettlement and environment difficult to implement by borrowers etc.
iii. Foreign currency debt, including through external commercial borrowings raised with prior approval of the Government.
The IIFCL would raise funds as and when required, for on lending, in consultation with the Department of Economic Affairs. The magnitude of funds raised would be determined by demand from viable infrastructure projects. To the extent of any mismatch between the raising of funds and their disbursement, surplus funds would be invested in marketable government securities. The borrowings of IIFCL may be guaranteed by the Government of India. The extent of guarantees to be provided shall be set at the beginning of each fiscal year by the Ministry of Finance, within the limits available under the Fiscal Responsibility & Budget Management Act. However bonds issued by IIFCL, unless otherwise directed by Government of India, will not be included against Statutory Liquidity Ratio requirements. For year 2005-06, as per guidelines laid down for IIFCL, extent of guarantee to be provided by Government of India will be Rs. 10,000 crore. The total lending by the IIFCL to any Project Company shall not exceed 20% of the Total Project Cost. Loans will be disbursed in proportion to debt disbursements from Banks and AIFIs and it has been estimated that IIFCL exposure as a proportion of Banks and AIFIs would be around 14% to 15%. Further, IIFCL shall finance only commercially viable projects. 10.15.5.2 Specialized Debt Funds For Infrastructure Financing Creation of specialized long-term debt funds to cater to the needs of the infrastructure sector. A regulatory and tax environment that is suitable for attracting investments is key for channelizing long-term funds into infrastructure development.

Financial Issues & Power Sector Financing Working Group on Power for 11th Plan
Page 27 of Chapter 10
i. RBI may look into the feasibility of not treating investments by banks in such close-ended debt funds as capital market exposure.
ii. IRDA may consider including investment in SEBI registered debt funds as approved investments for insurance companies.
iii. FII may also be allowed to participate in SEBI registered infrastructure debt funds. This could be done by modifying SEBI foreign VC regulations 2000 to extend its purview to cover debt FIIs such that these are allowed to invest / commit contributions to rupee denominated infrastructure debt funds registered with SEBI along the same lines as applicable for domestic QIBs.
10.15.6 Venture Fund/ Private Equity Fund (PE) Development of a Venture Capital / PE fund to invest in equity of power projects is also an option that needs to be explored, as a possible source of equity funds available to the projects. The features of the fund can be as follows:
Development of Power Venture/ PE Fund is a very viable and sound value proposition to help meet energy security needs of the country. Coupled with this, allowing power companies to issue equity shares with differential voting rights along with a relaxation to have distributable profits as indicated in above para 10.14.3, such arrangement can be a potent source of funds for the development of Power Infrastructure.
i. It can participate in equity of new projects ii. An initial corpus can be contributed from corporate sector, domestic and
international investors. iii. Consortium and joint ventures between developers, promoters, end user,
contractors, mine developer to be encouraged. iv. The infusion of equity capital by the Venture Capital/ PE Funds in power
companies may be facilitated by allowing power companies to issue equity shares with differential voting rights along with a relaxation of the Rule 3 (1) of Companies (Issue of Share Capital with Differential Voting Rights) Rules, 2001 on having distributable profits as indicated in para 4.2.5. This would create space for Financial Investors to infuse funds in the Projects without threatening the ownership pattern of the Developer.
v. Financial institutions involvement in equity funding of the power projects or contributing towards the corpus of Power Fund should not attract the recently modified Risk weightage of 150% for equity investment and Govt. should consider the same weightage as is assigned for normal commercial lending. For this, Norms/ policies need to be re-looked by RBI.
There is a space for raising and deploying Energy focused Private Equity Fund (India Power Fund) in line with Infrastructure Development Fund (Rs 930 crore fund) managed by IDFC Private Equity Company Limited and deployed in airports, ports, roads, power plants, gas pipelines etc in its portfolio and IDFC Private Equity (Rs. 2,000 crore in June 2006) being deployed in various infrastructure sectors including Power.

Financial Issues & Power Sector Financing Working Group on Power for 11th Plan
Page 28 of Chapter 10
IDFC Private Equity has raised IDFC Private Equity Fund II of $440m approx. Rs 2000 crore in June 2006 and the same is being deployed in various infrastructure sectors including Power. Since the need for Power sector is significant, there exists a potential for raising and deploying Energy focus private Equity Fund. 10.15.7 Development Of Primary Markets For Bonds And Corporate Debt A robust primary market ensures supply of quality papers to the secondary markets leading to growth of secondary market. The issues those need to be addressed for development of primary market in corporate bonds are listed below: 10.15.7.1 Enhancing issuer base Currently corporates have no compulsions to access the market for raising funds.
i. It would be in the interest of banks that the corporates meet at least part of their requirement through the bond route as they would be in a better position to manage balance sheet related risks (ALM, credit exposure, etc).
ii. Banks’ entry into the retail bond market would greatly facilitate in bringing good quality paper to the market through MBS (Mortgage Backed Securities) and ABS (Asset Backed Securities) which provide major impetus for developing corporate debt market.
10.15.7.2 Enhancing investor base
i. Allowing all cooperative banks to invest in quality corporate bonds would be helpful as cooperative banks have large deposits.
ii. Retail investors should be encouraged to participate in the market through stock exchanges by providing fiscal incentives for such investments.
iii. Encouraging the foreign investor to participate in subordinate/hybrid debt instruments
10.15.8 Hydro Power Viability Fund In case of Hydro Power Projects, the high cost of generation in the initial 4-5 years is comparatively much higher than in the later years. It is suggested that for long term contracts, a component (say 25%) in the tariff of hydro power projects for the first five years after start of commercial operation is deferred and not recovered from the buyers but is added in the tariff from 11 - 15 years. To operationalise such schemes, lenders will need to initiate a scheme which finances the deferred component of the power tariff of the first five years and recovers its money during 11th to 15th year of the operation. For this, a Fund can be set up by AIFIs which cater to payments and receipts. The responsibility of developing and operating the Hydro Project Viability Fund can be vested with financial intermediaries like PFC etc. This will also rationalize the gap between the tariff of hydro and thermal in the initial years of operations. Any extra financing cost incurred on such viability gap financing should also be permitted as a pass on in the tariff by regulators.

Financial Issues & Power Sector Financing Working Group on Power for 11th Plan
Page 29 of Chapter 10
10.15.9 Viability Gap Fund (for Remote areas) The power projects especially in generation or Transmission and Distribution schemes in remote areas like Northeastern region, J&K etc and other difficult terrains need financial support in the form of a viability gap for the high initial cost of power which is difficult to be absorbed in the initial period of operation. A scheme may be implemented in the remote areas as a viability gap fund either in the form of subsidy or on the lines of hydro power development fund a loan which finances the deferred component of the power tariff of the first five years and recovers its money during 11th to 15th year of the operation. Any extra financing cost incurred on such viability gap financing should also be permitted as a pass through in the tariff by Regulators. 10.16 IMPLEMENTATION MECHANISMS Some of the implementation mechanisms aimed at channelising more funds into the power sector, for the recommendations made in the report have been discussed ahead. 10.16.1 Policy Interventions & Financial Measures For Reducing Funding Gap 10.16.1.1 Change In External Commercial Borrowing Guidelines
Modification of ECBs guidelines permitting infrastructure borrowers including intermediaries PFC, REC, IDFC etc to borrow funds from overseas market under automatic approval route of ECB Guidelines of the RBI. Debt Servicing to be eligible for exemption under Section 10 (15) (iv) of Income Tax Act - Presently, the ECBs raised by infrastructure companies like power are required to gross up interest payment with the tax amount and deposit the Tax in India on interest servicing done to foreign lenders. This additional liability does not arise in case of multilateral loans or certain export credit loans from countries with which India has double taxation avoidance treaties. The borrowing by power companies, raised during the 11th Plan period (even if the repayment continues beyond 11th Plan) should be notified to be eligible for exemption under Section 10 (15) (iv) of the Income Tax Act 10.16.1.2 Instruments for wider retail participation
Introduce Power Bonds or Vidyut Vikas Patra, as transferable bearer instrument admissible on the lines of erstwhile Indira Vikas Patra with a lock in period of at least 3-5 years to enable wider participation of retail segment in the domestic market for investment in the power sector which can be issued by financial intermediaries such as PFC, REC, IDFC and Banks etc. The money raised through these bonds may be channelized to the power sector. Respective institutions may monitor the project implementation. Another variant of Vidyut Vikas Patra could be a tax-free bond of 15 – 20 years to mobilize small savings for long tenor. Amount expected to be mobilized during 11th Plan is Rs. 50,000 crore i.e. Rs. 10,000 crore per year. (During the last 3 years

Financial Issues & Power Sector Financing Working Group on Power for 11th Plan
Page 30 of Chapter 10
amount mobilized through Kisan Vikas Patra was to the tune of over Rs. 20,000 crore per year)
10.16.1.3 Tax incentives on investments
A higher economic growth can only be sustained through investment in the infrastructure sector. For garnering additional funds for the sector to introduce additional investment limit of Rs. 50,000 per year for infrastructure bonds under Section 80C of the Income Tax Act, 1961 over and above existing limit of Rs. 1,00,000 with a lock in period of at least 5 years. Assuming a subscriber base of 15 million (~ 33% of total tax payers) out of a tax payer base of 45 million people, the amount mobilized p.a. is estimated as Rs. 75,000 crore p.a. Assuming a 40% flow to the power sector out of the above, the mobilization over 5 years is estimated at Rs. 1,50,000 crore. The loss of tax revenue from this step would be compensated by higher tax revenue in future due to higher GDP growth rate. Such a step can be supported at this junction as we expect higher tax collection due to a growing economy.
10.16.1.4 Low Cost Long term Capital Gains Bonds Allow Section 54EC benefit under Income Tax Act for bond issuances by PFC & IIFCL in line with REC & NHAI at Rs. 5,000 crore p.a. which shall facilitate mobilization of Rs. 25,000 crore per organization during 11th Plan period. This will enable additional low cost funds for this sector. The possible sources of bridging the gap is given below :
Table 10.21
Possible Sources of Bridging the Gap
(Rs. Crore) S. No. Particulars Estimated Amount
Debt 1 Power Bonds 50,000 2 Tax incentive under Section 80 C 1,50,000 3 Bonds under Section 54EC 50,000 4 Insurance 20,000
Sub Total 2,70,000 Equity
5 IPO/FPO 15,000 Grand Total 2,85,000 Net Gap 1,66,607
10.16.1.5 Reinstatement of 10(23) G benefit (tax exemption on interest income
from infrastructure projects) to be reintroduced with following provision: “Exemption should be extended to all categories of investors (lenders) and in all kinds of investments (whether by way of shares, loans, cash credit limit, public deposits etc) with a lock in period of at least 5 years.” The provision of Tax incentive will facilitate low interest lending and

Financial Issues & Power Sector Financing Working Group on Power for 11th Plan
Page 31 of Chapter 10
shall accelerate investment in the power sector as otherwise increased cost of financing in power sector results in higher power tariffs.
10.16.1.6 All investments in Power Bonds should be considered for SLR
computation and accorded SLR status. This measure will enable investment in Power bonds by the banks. It will also promote trading of power bonds in the secondary market.
10.16.1.7 5% of pf, gratuity, pension and insurance funds must be regulated for
investments in power bonds. power bonds may be included in the designated securities for the purpose of income tax in cpf investment guidelines. this measure will enable investment in power bonds by pf, gratuity, pension and insurance funds. it will also promote trading of power bonds in the secondary market. 10% of power bonds issued by each entity must necessarily be of smaller denomination through public issues to promote their further trading by small investors in the secondary market which shall encourage retail participation in the debt segment.
10.16.2 Institutional / Regulatory Interventions 10.16.2.1 Proper security mechanism
a. Commitment of escrow upfront as in case of successful UMPPs to be provided
b. Alternatively, to provide access to large industrial consumers on payment of wheeling charges, in case of default, as adequate security in lieu of ESCROW.
10.16.2.2 Uniform rules for cross subsidy and additional surcharges to be levied by SEB on sale of power by an IPP in that state to a third party
10.16.2.3 Postal stamp Transmission/Wheeling charges by IPPs in various states
with access for pooling for power fund. 10.16.2.4 In line with the National Electricity Policy, states should be encouraged to
follow Intra - State ABT regime such that they are eligible for 14% return on equity. This would encourage better discipline even within the States and shall enhance internal resources for deployment in R&M/capacity expansion.
10.16.3 Fiscal and other Measures to enable cheaper power 10.16.3.1 Excise duty/ CVD on power generation, transmission & distribution
equipment (which is currently at 16%) should be abolished for projects with 1000 mw dispatch on the lines of concession provided to the mega power project as per para 8.3 of the foreign trade policy (2004-09). This is required, as power sector has no advantage of “cenvat” credit as there is no excise on power, which increases the cost of power.

Financial Issues & Power Sector Financing Working Group on Power for 11th Plan
Page 32 of Chapter 10
10.16.3.2 The import duty relaxation presently available for generation equipments may also be extended to include all equipment related to power transmission, distribution metering and energy conservation so that the supply of equipments at reasonable cost is available to continue with Distribution reforms which are being supported by schemes like APDRP etc.
10.16.3.3 Existing Income tax exemption for Power Sector projects under section
80IA expiring in March 2010 to be extended till March 2017, i.e. end of 12th plan period.
10.16.3.4 Additional depreciation of 20% (WDV) under IT Act is available for
investments in plant and machinery in industries other than power. Same depreciation should be made available to power industry also.
10.16.3.5 Technology transfer for developing and enhancing existing manufacturing
facilities in India so that Indigenous vendor development is facilitated for high-tech supplies in future.
**********

Financial Issues & Power Sector Financing Working Group on Power for 11th Plan
Page 33 of Chapter 10
Appendix 10.1 DETAILED OUTLAY AND ACHIEVEMENT FOR FUNDING X PLAN - STATE
SECTOR (In Rs. Crore)
State / UTs Tenth Plan
(Appd.)
2002-03 (Appd.)
2002-03 (Actual)
2003-04 (Appd.)
2003-04 (R.E.)
2004-05 (Appd.)
States
Andhra Pradesh
7139.47 3122.69 2167.96 2175.55 2012.33 2125.86
Arunachal Pradesh
491.19 121.24 72.77 114.52 114.52 155.30
Assam 835.42 187.11 82.77 191.42 182.92 290.48 Bihar 2719.58 275.30 131.68 493.68 389.17 667.88 Chhattisgarh 99.19 20.05 13.75 30.81 43.81 157.17 Goa 400.00 55.22 58.53 71.82 66.81 98.99 Gujarat 5958.49 792.24 571.39 762.24 580.14 635.45 Haryana 1395.33 261.40 202.97 280.00 212.00 470.00 Himachal Pradesh
1235.00 202.46 363.79 155.70 155.90 57.50
Jammu & Kashmir
2879.49 411.91 437.75 611.29 688.55 719.89
Jharkhand 814.00 150.00 138.80 204.50 204.50 380.63 Karnataka 2206.99 886.30 860.06 1094.94 1169.69 2711.89 Kerala 3425.00 589.00 743.01 619.00 542.10 693.00 Madhya Pradesh
5503.78 913.76 566.11 814.75 572.07 916.92
Maharashtra 10149.71 730.56 1260.49 413.48 349.05 382.43 Manipur 228.86 62.73 10.43 71.00 71.00 61.20 Meghalaya 501.37 135.47 55.81 118.08 109.39 157.11 Mizoram 192.80 41.32 38.98 45.40 53.74 57.86 Nagaland 247.95 34.78 21.40 46.60 47.10 65.48 Orissa 2858.54 1003.27 322.16 671.21 571.79 502.25 Punjab 5963.65 782.69 751.22 576.00 626.44 783.92 Rajasthan 6674.22 1114.00 1220.07 1186.00 1653.71 1816.18 Sikkim 240.00 41.20 37.49 39.50 39.50 90.75 Tamil Nadu 8000.00 905.00 1197.78 1294.81 1294.81 1255.53 Tripura 223.30 44.43 28.53 53.87 34.96 43.69

Financial Issues & Power Sector Financing Working Group on Power for 11th Plan
Page 34 of Chapter 10
State / UTs Tenth Plan
(Appd.)
2002-03 (Appd.)
2002-03 (Actual)
2003-04 (Appd.)
2003-04 (R.E.)
2004-05 (Appd.)
Uttar Pradesh 9082.49 981.56 1046.31 965.83 965.83 835.78 Uttaranchal 1847.05 303.67 194.38 310.67 278.67 253.84 West Bengal 7846.45 1558.33 754.92 1222.74 700.50 1567.48 Sub Total (States)
89159.32 15727.69 13351.31 14635.41 13731.00 17954.46
Union Territories A & N Islands 193.80 32.00 20.78 25.00 24.80 29.10 Chandigarh 108.94 15.66 16.52 19.60 19.60 19.95 Dadra & Nagar Haveli
77.50 18.88 18.85 12.81 12.81 9.36
Daman & Diu 51.26 19.24 19.30 12.71 12.72 10.44 Delhi 3456.00 1413.00 1575.86 1462.25 1748.94 932.50 Lakshadweep 13.89 10.78 2.78 2.00 7.75 2.09 Pondicherry 165.00 27.53 24.97 27.00 26.66 28.00 Sub Total (UTs)
4066.39 1537.09 1679.06 1561.37 1853.28 1031.44
Total (States & UTs)
93225.71 17264.78 15030.37 16196.78 15584.28 18985.90

Financial Issues & Power Sector Financing Working Group on Power for 11th Plan
Page 35 of Chapter 10
Appendix 10.2 APPROVED TENTH PLAN OUTLAY
INTERNAL AND EXTRA BUDGETARY RESOURCES GROSS BUDGETARY SUPPORT
(Rs Crore) ORGANISATION I. R. BONDS DFA OTHERS IEBR EAB DBS GBS OUTLAY
NTPC 8356 41266 0 9058 58680 0 3000 3000 61680
NHPC 1159 15602 794 470 18026 0 14200 14200 32226
POWERGRID 2938 0 8214 9218 20370 0 1000 1000 21370
DVC 1601 1928 0 9981 13510 0 10 10 13520
THDC 0 0 1150 1897 3047 0 600 600 3647
NJPC 84 0 0 2470 2554 0 700 700 3254
NEEPCO 0 750 1463 0 2213 0 2011 2011 4224
PFC 0 0 0 0 0 0 0 0 0
REC 0 0 0 0 0 0 0 0 0
MOP (MISC.) 0 0 0 0 0 0 3479 3479 3479
TOTAL MOP 14138 59546 11622 33093 118399 0 25000 25000 143399
NLC 2804 5204 0 0 8008 0 0 0 8008
DAE 2271 7536 0 0 9807 5654 10183 15837 25644
TOTAL (C. S ) 19212 72286 11622 33093 136214 5654 35183 40837 177051

Financial Issues & Power Sector Financing Working Group on Power for 11th Plan
Page 36 of Chapter 10
Appendix 10.3
ASSUMPTIONS FOR ESTIMATION OF COST OF GENERATION PROJECTS
1. Thermal generation projects a. Coal based @Rs. 4.00 crore per MW b. Gas based @ Rs. 3.00 crore per MW
2. Hydro generation projects a. Run of the river @Rs. 4.50 crore per MW for on-going projects
@Rs. 5.00 crore per MW for new projects b. Storage based @Rs. 5.50 crore per MW for on-going projects
@Rs. 6.00 crore per MW for new projects c. Storage based @Rs. 6.00 crore per MW for on-going projects
(J&K, NE<100 MW) @Rs. 7.25 crore per MW for new projects d. Pump Storage @Rs. 5.00 crore per MW
@Rs. 2.50 crore per MW for Tehri PSS 3. Nuclear projects @Rs. 6.50 crore per MW
Assumptions for phasing of expenditure of generation projects:
Thermal generation projects & gas based project <= 1000 MW plant capacity 1-4 years @ 15%, 25%, 30% & 30%.
Thermal generation projects > 1000 MW plant capacity 1-5 years @ 10%, 20%, 30%, 25% & 15%.
Hydro generation projects 1-6 years @ 10%, 15%, 20%, 20%, 25% & 10%.
Hydro generation projects taken up in XI Plan for benefiting in XII Plan, the commissioning is assumed as 7 yrs after DPR is prepared for < 100 MW and 9 yrs for > 100 MW

Financial Issues & Power Sector Financing Working Group on Power for 11th Plan
Page 37 of Chapter 10
Appendix 10.4 PROJECTS UNDER CONSTRUCTION
S. no.
PLANT NAME STATE AGENCY SECTOR Type BENEFITS XI PLAN (MW)
LIKELY YEAR OF BENEFIT
1 ALLAIN DUHANGAN HP RSWML P HYG 192 2008-09 2 AMARKANTAK MP MPGENCO S THG 210 2007-08 3 ATHIRAPALLI KERL KSEB S HYG 163 2010-11 4 BAGLIHAR-I J&K JKPDCL S HYG 450 2007-08 5 BAKRESHWAR U-5 WB WBPDCL S THG 210 2007-08 6 BARH U1 BIH NTPC C THG 660 2008-09 7 BARH U2 BIH NTPC C THG 660 2009-10 8 BARH U3 BIH NTPC C THG 660 2010-11 9 BARSINGSAR LIG RAJ NLC C THG 250 2008-09 10 BELLARY TPS U-2 KAR KPCL S THG 500 2009-10 11 BHAWANI BARRAGE II & III TN TNEB S HYG 60 2009-10 12 BHILAI JV CHG NTPC C THG 500 2007-08 13 BHOPALAPALLY (KAKTIYA) AP APGENCO S THG 500 2008-09 14 BUDGE-BUDGE EXT WB CESC P THG 250 2009-10 15 BUDHIL HP LANCO IPP P HYG 70 2008-09 16 CHABRA TPS RAJ RRVUNL S THG 500 2008-09 17 CHAMERA-III HP NHPC C HYG 231 2010-11 18 CHANDRAPURA JHAR DVC C THG 500 2007-08 19 CHUJACHEN SIKKIM GATI P HYG 99 2009-10 20 DADRI EXT (U-5) UP NTPC C THG 490 2009-10 21 DHOLPUR RAJ RRVUNL S THG 110 2007-08 22 DIMAPUR DG MEGH MeSEB S THG 23 2007-08 23 FARAKKA STAGE-III WB NTPC C THG 500 2009-10 24 GIRAL*U-2 RAJ RVUNL S THG 125 2008-09 25 HARDUAGANJ UP UPRVUNL S THG 500 2009-10 26 JURALA PRIYADARSHNI* AP APGENCO S HYG 195 2007-08 27 KAIGA* KAR NPC C Nucl 220 2007-08 28 KAMENG AR.PR. NEEPCO C HYG 600 2009-10 29 KARCHAM WANGTOO HP JPKHCL P HYG 1000 2011-12 30 KOL DAM HP NTPC C HYG 600 2008-09 31 KOL DAM HP NTPC C HYG 200 2009-10 32 KORBA III CHG NTPC C THG 500 2009-10 33 KOTA U7 RAJ RRVUNL S THG 195 2008-09 34 KOTESHWAR UTTAR'L THDC C HYG 400 2008-09 35 KUDANKULAM U 1,2 TN NPC C Nucl 1000 2007-08 36 KUDANKULAM U 1,2 TN NPC C Nucl 1000 2008-09 37 KUTYADI EXTN KERL KSEB S HYG 100 2007-08 38 LAKWA WH ASM ASGENCO S THG 37.2 2008-09 39 LOHARI NAGPALA UTTAR'L NTPC C HYG 600 2011-12 40 MAHESHWAR MP IPP P HYG 400 2010-11 41 MALANA II HP EVREST PC P HYG 100 2008-09 42 MYNTDU St-I MEGH MeSEB S HYG 84 2008-09 43 NAGARJUNA SAGAR TR AP APGENCO S HYG 50 2009-10 44 NEYVELI - II TN NLC C THG 500 2008-09 45 OMKARESHWAR MP NHDC C HYG 520 2007-08

Financial Issues & Power Sector Financing Working Group on Power for 11th Plan
Page 38 of Chapter 10
S. no.
PLANT NAME STATE AGENCY SECTOR Type BENEFITS XI PLAN (MW)
LIKELY YEAR OF BENEFIT
46 PARAS EXT U-2 MAH MAHA GEN S THG 250 2008-09 47 PARBATI - II (a) HP NHPC C HYG 400 2008-09 48 PARBATI - II (b) HP NHPC C HYG 400 2009-10 49 PARBATI - III HP NHPC C HYG 520 2010-11 50 PARICHHA EXT. UP UPRVUNL S THG 500 2009-10 51 PARLI EXT U-2 MAH MAHA GEN S THG 250 2008-09 52 PATHADI (LANCO) CHG LANCO-IPP P THG 300 2009-10 53 PATHADI (LANCO) CHG LANCO-IPP P THG 300 2008-09 54 PFBR(Kalapakkam) TN NPC C Nucl 500 2010-11 55 PURLIA PSS* WB WBSEB S HYG 675 2007-08 56 RAICHUR U 8 KAR KPCL S THG 250 2008-09 57 RAIGARH PH II (OP Jindal)
(250 MW in 10th plan) CHG JIN. POWER P THG 750 2007-08
58 RAPP U5&6 RAJ NPC C Nucl 220 2007-08 59 RAPP U5&6 RAJ NPC C Nucl 220 2008-09 60 SEWA-II J&K NHPC C HYG 120 2008-09 61 SIPAT U 1 CHG NTPC C THG 660 2007-08 62 SIPAT U 2 CHG NTPC C THG 1320 2008-09 63 SRINAGAR UTTAR'L GVK P HYG 330 2011-12 64 SUBANSIRI LOWER AR.PR. NHPC C HYG 2000 2010-11 65 SUGEN TORRENT (365 MW
in 10th plan) GUJ TORRENT P THG 752 2007-08
66 SURAT LIGNITE EXT GUJ GIPCL S THG 250 2008-09 67 SURATGARH EXT RAJ RRVUNL S THG 250 2008-09 68 TEESTA LOW DAM-III WB NHPC C HYG 132 2008-09 69 TEESTA LOW DAM-IV WB NHPC C HYG 160 2009-10 70 TEESTA V SIKKIM NHPC C HYG 510 2007-08 71 TORANGALLU KAR JINDAL P THG 300 2009-10 72 TORANGALLU KAR JINDAL P THG 300 2010-11 73 TROMBAY TPS MAH TATAPOWER P THG 250 2008-09 74 UHL - III HP HPJVVNL S HYG 100 2009-10 75 URI-II J&K NHPC C HYG 240 2009-10 76 VALUTHUR EXTN. TN TNEB S THG 92 2007-08 77 VARAHI EXTN. KAR KPCL S HYG 230 2008-09 78 VIJAYWADA TPP AP APGENCO S THG 500 2008-09 79 YAMUNA NAGAR HAR HPGCL S THG 600 2007-08 Total 31345
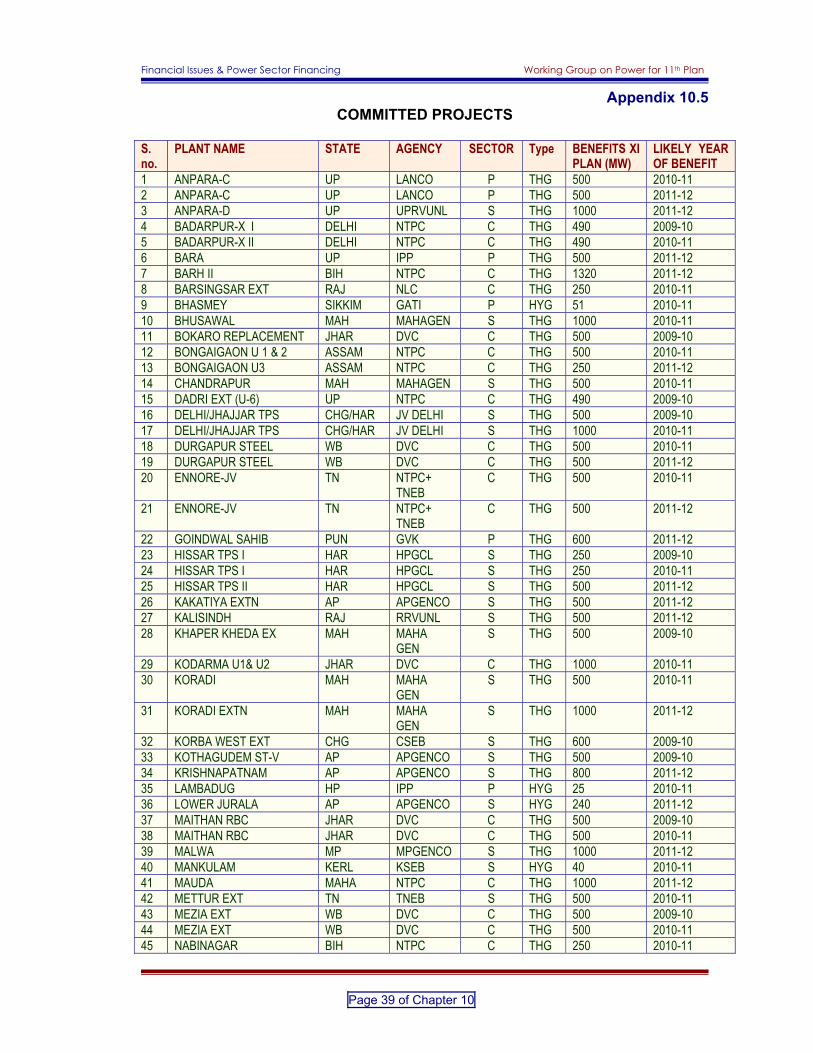
Financial Issues & Power Sector Financing Working Group on Power for 11th Plan
Page 39 of Chapter 10
Appendix 10.5 COMMITTED PROJECTS
S. no.
PLANT NAME STATE AGENCY SECTOR Type BENEFITS XI PLAN (MW)
LIKELY YEAR OF BENEFIT
1 ANPARA-C UP LANCO P THG 500 2010-11 2 ANPARA-C UP LANCO P THG 500 2011-12 3 ANPARA-D UP UPRVUNL S THG 1000 2011-12 4 BADARPUR-X I DELHI NTPC C THG 490 2009-10 5 BADARPUR-X II DELHI NTPC C THG 490 2010-11 6 BARA UP IPP P THG 500 2011-12 7 BARH II BIH NTPC C THG 1320 2011-12 8 BARSINGSAR EXT RAJ NLC C THG 250 2010-11 9 BHASMEY SIKKIM GATI P HYG 51 2010-11 10 BHUSAWAL MAH MAHAGEN S THG 1000 2010-11 11 BOKARO REPLACEMENT JHAR DVC C THG 500 2009-10 12 BONGAIGAON U 1 & 2 ASSAM NTPC C THG 500 2010-11 13 BONGAIGAON U3 ASSAM NTPC C THG 250 2011-12 14 CHANDRAPUR MAH MAHAGEN S THG 500 2010-11 15 DADRI EXT (U-6) UP NTPC C THG 490 2009-10 16 DELHI/JHAJJAR TPS CHG/HAR JV DELHI S THG 500 2009-10 17 DELHI/JHAJJAR TPS CHG/HAR JV DELHI S THG 1000 2010-11 18 DURGAPUR STEEL WB DVC C THG 500 2010-11 19 DURGAPUR STEEL WB DVC C THG 500 2011-12 20 ENNORE-JV TN NTPC+
TNEB C THG 500 2010-11
21 ENNORE-JV TN NTPC+ TNEB
C THG 500 2011-12
22 GOINDWAL SAHIB PUN GVK P THG 600 2011-12 23 HISSAR TPS I HAR HPGCL S THG 250 2009-10 24 HISSAR TPS I HAR HPGCL S THG 250 2010-11 25 HISSAR TPS II HAR HPGCL S THG 500 2011-12 26 KAKATIYA EXTN AP APGENCO S THG 500 2011-12 27 KALISINDH RAJ RRVUNL S THG 500 2011-12 28 KHAPER KHEDA EX MAH MAHA
GEN S THG 500 2009-10
29 KODARMA U1& U2 JHAR DVC C THG 1000 2010-11 30 KORADI MAH MAHA
GEN S THG 500 2010-11
31 KORADI EXTN MAH MAHA GEN
S THG 1000 2011-12
32 KORBA WEST EXT CHG CSEB S THG 600 2009-10 33 KOTHAGUDEM ST-V AP APGENCO S THG 500 2009-10 34 KRISHNAPATNAM AP APGENCO S THG 800 2011-12 35 LAMBADUG HP IPP P HYG 25 2010-11 36 LOWER JURALA AP APGENCO S HYG 240 2011-12 37 MAITHAN RBC JHAR DVC C THG 500 2009-10 38 MAITHAN RBC JHAR DVC C THG 500 2010-11 39 MALWA MP MPGENCO S THG 1000 2011-12 40 MANKULAM KERL KSEB S HYG 40 2010-11 41 MAUDA MAHA NTPC C THG 1000 2011-12 42 METTUR EXT TN TNEB S THG 500 2010-11 43 MEZIA EXT WB DVC C THG 500 2009-10 44 MEZIA EXT WB DVC C THG 500 2010-11 45 NABINAGAR BIH NTPC C THG 250 2010-11

Financial Issues & Power Sector Financing Working Group on Power for 11th Plan
Page 40 of Chapter 10
S. no.
PLANT NAME STATE AGENCY SECTOR Type BENEFITS XI PLAN (MW)
LIKELY YEAR OF BENEFIT
46 NABINAGAR BIH NTPC C THG 500 2011-12 47 NEW UMTRU MEGH MeSEB S HYG 40 2010-11 48 NORTH CHENNAI EXT TN TNEB S THG 500 2011-12 49 NORTH K PURA JHAR NTPC C THG 1320 2011-12 50 OBRA REPLACEMENT UP UPRVUNL S THG 500 2011-12 51 PALLIVASAL KERL KSEB S HYG 60 2010-11 52 RAMPUR HP SJVNL C HYG 412 2011-12 53 SADAMANDER SIKKIM GATI P HYG 71 2009-10 54 SAGARDIGHI EXT WB WBPDCL S THG 500 2010-11 55 SAGARDIGHI EXT WB WBPDCL S THG 500 2011-12 56 SANTHALDIH EXT WB WBPDCL S THG 250 2009-10 57 SATPURA MP MP S THG 500 2011-12 58 SAWARA KUDDU HP PVC S HYG 110 2010-11 59 SIKKA EXT GUJ GSECL S THG 500 2010-11 60 SIMHADRI-EXT AP NTPC C THG 500 2010-11 61 SIMHADRI-EXT AP NTPC C THG 500 2011-12 62 SORANG HP SORAND
PC P HYG 100 2011-12
63 TALWANDI PUNJAB PSEB S THG 500 2011-12 64 TANGU ROMAI HP PCP/IPP P HYG 50 2010-11 65 TAPOVAN VISHNUGARH UTTAR'L NTPC C HYG 520 2011-12 66 TEESTA III SIKKIM TEESTA
URJA P HYG 600 2011-12
67 TEHRI PSS UTTAR'L THDC C HYG 500 2010-11 68 TEHRI PSS UTTAR'L THDC C HYG 500 2011-12 69 THOTTIAR KERL KSEB S HYG 40 2010-11 70 TIDONG-I HP PCP/IPP P HYG 100 2010-11 71 TRIPURA GAS ILFS TRI ONGC C THG 750 2009-10 72 TUTICORIN JV TN NLC+
TNEB C THG 500 2010-11
73 TUTICORIN JV TN NLC+ TNEB
C THG 500 2011-12
74 UBDC III PUN MALANA POWER CO.
P HYG 75 2009-10
75 UKAI EXTN. GUJ GSECL S THG 500 2011-12 76 ULTRA MEGA SASAN MP LANCO P THG 660 2011-12 77 UTRAN GUJ GSECL S THG 350 2008-09 78 VYASI UTTAR'L NHPC C HYG 120 2011-12 Total 37524

Financial Issues & Power Sector Financing Working Group on Power for 11th Plan
Page 41 of Chapter 10
Appendix 10.6
PROJECTS TO BE TAKEN UP IN XI PLAN FOR LIKELY BENEFIT IN XII PLAN
S. no. PLANT NAME STATE AGENCY SECTOR
Type BENEFITS XII PLAN
(MW) 1 ACHENKOVIL KERALA KSEB S HYG 30 2 BADAO ARUNACHAL PRADESH NEEPCO C HYG 60 3 BAGLIHAR-II JAMMU & KASHMIR PDC S HYG 225 4 BAIRABI MIZORAM PDD S HYG 80 5 BAJOLI HOLI HIMACHAL PRADESH IPP P HYG 180 6 BAKRESHWAR EXT WB WBPDCL S THG 500 7 BALIMELA DPH ORISSA IPP P HYG 60 8 BARA UP IPP P THG 500 9 BHARMOUR HIMACHAL PRADESH IPP P HYG 45 10 BHAVNAGAR LIGNITE GUJARAT NIRMA P THG 250 11 BOGADIYAR SIRKARI
BHYAL @ UTTARANCHAL IPP P HYG 170
12 BOKARO STEEL JHAR DVC C THG 500 13 BORUS MP NHDC C HYG 55 14 CHAMBA HIMACHAL PRADESH IPP P HYG 126 15 CHHABRA II RAJASTHAN RRVUNL S THG 500 16 CHINNAR KERALA KSEB S HYG 28 17 CHIRGAON
(MAJHGAON) HIMACHAL PRADESH HPSEB S HYG 46
18 CHUTAK J&K NHPC C HYG 44 19 DHAULA SIDH HIMACHAL PRADESH IPP P HYG 40 20 DIBBIN ARUNACHAL PRADESH NEEPCO C HYG 100 21 DPL TPS WB WBPDCL S THG 300 22 DPL TPS WB WBPDCL S THG 500 23 EMCO MAHARASHTRA IPP P THG 270 24 ENNORE EXT TN TNEB S THG 500 25 GANOL MEGHALAYA MeSEB S HYG 25 26 GOHANA TAL UTTARANCHAL THDC C HYG 60 27 GUJRAT LIGNITE U 1 GUJ NLC C THG 500 28 GUNDIA KARNATAKA KPCL S HYG 200 29 HALDIA PH I WB CESC P THG 600 30 HANDIA MP NHDC C HYG 51 31 HANOL TIUNI UTTARANCHAL Sunflag P HYG 42 32 HOSHANGABAD MP NHDC C HYG 60 33 IFFCO SARGUJA CHG CSEB JV S THG 500 34 IGTPP BHAIYATHAN CHG CSEB S THG 800 35 INTEGRATED
PROJECT DARIPALLI ORISSA NTPC C THG 800
36 JADH GANGA UTTARANCHAL THDC C HYG 50 37 JAKHOL SANKARI UTTARANCHAL SJVNL C HYG 33 38 JELAM TAMAK UTTARANCHAL THDC C HYG 60 39 KAKARAPAR EXT. GUJARAT NPCIL C Nuclear 700 40 KALISINDH RAJ RRVUNL S THG 500 41 KAPAK LEYAK ARUNACHAL PRADESH NEEPCO C HYG 160 42 KARMOLI UTTARANCHAL THDC C HYG 140
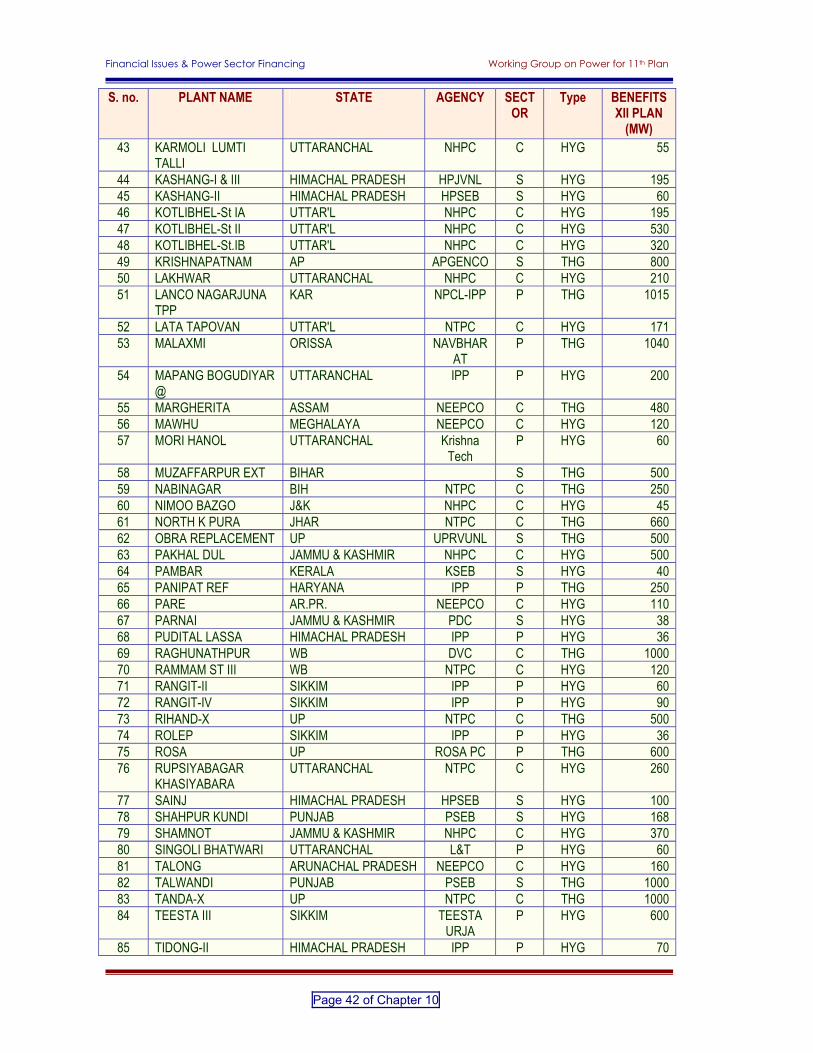
Financial Issues & Power Sector Financing Working Group on Power for 11th Plan
Page 42 of Chapter 10
S. no. PLANT NAME STATE AGENCY SECTOR
Type BENEFITS XII PLAN
(MW) 43 KARMOLI LUMTI
TALLI UTTARANCHAL NHPC C HYG 55
44 KASHANG-I & III HIMACHAL PRADESH HPJVNL S HYG 195 45 KASHANG-II HIMACHAL PRADESH HPSEB S HYG 60 46 KOTLIBHEL-St IA UTTAR'L NHPC C HYG 195 47 KOTLIBHEL-St II UTTAR'L NHPC C HYG 530 48 KOTLIBHEL-St.IB UTTAR'L NHPC C HYG 320 49 KRISHNAPATNAM AP APGENCO S THG 800 50 LAKHWAR UTTARANCHAL NHPC C HYG 210 51 LANCO NAGARJUNA
TPP KAR NPCL-IPP P THG 1015
52 LATA TAPOVAN UTTAR'L NTPC C HYG 171 53 MALAXMI ORISSA NAVBHAR
AT P THG 1040
54 MAPANG BOGUDIYAR @
UTTARANCHAL IPP P HYG 200
55 MARGHERITA ASSAM NEEPCO C THG 480 56 MAWHU MEGHALAYA NEEPCO C HYG 120 57 MORI HANOL UTTARANCHAL Krishna
Tech P HYG 60
58 MUZAFFARPUR EXT BIHAR S THG 500 59 NABINAGAR BIH NTPC C THG 250 60 NIMOO BAZGO J&K NHPC C HYG 45 61 NORTH K PURA JHAR NTPC C THG 660 62 OBRA REPLACEMENT UP UPRVUNL S THG 500 63 PAKHAL DUL JAMMU & KASHMIR NHPC C HYG 500 64 PAMBAR KERALA KSEB S HYG 40 65 PANIPAT REF HARYANA IPP P THG 250 66 PARE AR.PR. NEEPCO C HYG 110 67 PARNAI JAMMU & KASHMIR PDC S HYG 38 68 PUDITAL LASSA HIMACHAL PRADESH IPP P HYG 36 69 RAGHUNATHPUR WB DVC C THG 1000 70 RAMMAM ST III WB NTPC C HYG 120 71 RANGIT-II SIKKIM IPP P HYG 60 72 RANGIT-IV SIKKIM IPP P HYG 90 73 RIHAND-X UP NTPC C THG 500 74 ROLEP SIKKIM IPP P HYG 36 75 ROSA UP ROSA PC P THG 600 76 RUPSIYABAGAR
KHASIYABARA UTTARANCHAL NTPC C HYG 260
77 SAINJ HIMACHAL PRADESH HPSEB S HYG 100 78 SHAHPUR KUNDI PUNJAB PSEB S HYG 168 79 SHAMNOT JAMMU & KASHMIR NHPC C HYG 370 80 SINGOLI BHATWARI UTTARANCHAL L&T P HYG 60 81 TALONG ARUNACHAL PRADESH NEEPCO C HYG 160 82 TALWANDI PUNJAB PSEB S THG 1000 83 TANDA-X UP NTPC C THG 1000 84 TEESTA III SIKKIM TEESTA
URJA P HYG 600
85 TIDONG-II HIMACHAL PRADESH IPP P HYG 70
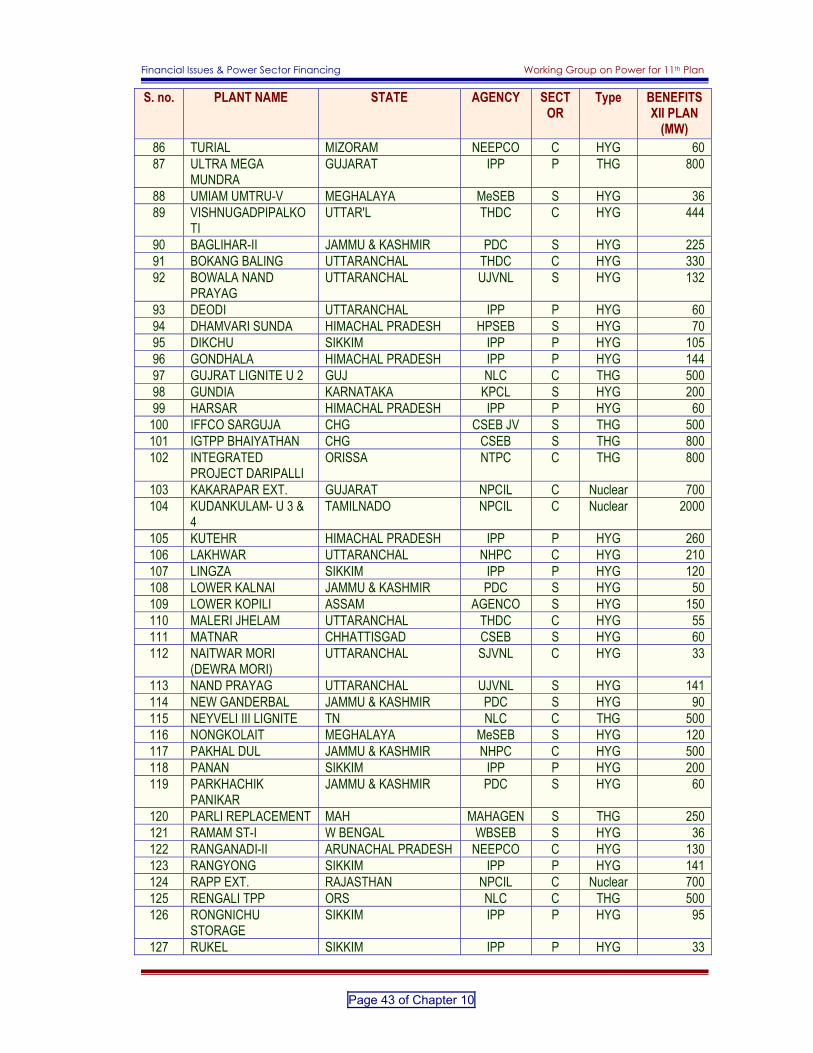
Financial Issues & Power Sector Financing Working Group on Power for 11th Plan
Page 43 of Chapter 10
S. no. PLANT NAME STATE AGENCY SECTOR
Type BENEFITS XII PLAN
(MW) 86 TURIAL MIZORAM NEEPCO C HYG 60 87 ULTRA MEGA
MUNDRA GUJARAT IPP P THG 800
88 UMIAM UMTRU-V MEGHALAYA MeSEB S HYG 36 89 VISHNUGADPIPALKO
TI UTTAR'L THDC C HYG 444
90 BAGLIHAR-II JAMMU & KASHMIR PDC S HYG 225 91 BOKANG BALING UTTARANCHAL THDC C HYG 330 92 BOWALA NAND
PRAYAG UTTARANCHAL UJVNL S HYG 132
93 DEODI UTTARANCHAL IPP P HYG 60 94 DHAMVARI SUNDA HIMACHAL PRADESH HPSEB S HYG 70 95 DIKCHU SIKKIM IPP P HYG 105 96 GONDHALA HIMACHAL PRADESH IPP P HYG 144 97 GUJRAT LIGNITE U 2 GUJ NLC C THG 500 98 GUNDIA KARNATAKA KPCL S HYG 200 99 HARSAR HIMACHAL PRADESH IPP P HYG 60
100 IFFCO SARGUJA CHG CSEB JV S THG 500 101 IGTPP BHAIYATHAN CHG CSEB S THG 800 102 INTEGRATED
PROJECT DARIPALLI ORISSA NTPC C THG 800
103 KAKARAPAR EXT. GUJARAT NPCIL C Nuclear 700 104 KUDANKULAM- U 3 &
4 TAMILNADO NPCIL C Nuclear 2000
105 KUTEHR HIMACHAL PRADESH IPP P HYG 260 106 LAKHWAR UTTARANCHAL NHPC C HYG 210 107 LINGZA SIKKIM IPP P HYG 120 108 LOWER KALNAI JAMMU & KASHMIR PDC S HYG 50 109 LOWER KOPILI ASSAM AGENCO S HYG 150 110 MALERI JHELAM UTTARANCHAL THDC C HYG 55 111 MATNAR CHHATTISGAD CSEB S HYG 60 112 NAITWAR MORI
(DEWRA MORI) UTTARANCHAL SJVNL C HYG 33
113 NAND PRAYAG UTTARANCHAL UJVNL S HYG 141 114 NEW GANDERBAL JAMMU & KASHMIR PDC S HYG 90 115 NEYVELI III LIGNITE TN NLC C THG 500 116 NONGKOLAIT MEGHALAYA MeSEB S HYG 120 117 PAKHAL DUL JAMMU & KASHMIR NHPC C HYG 500 118 PANAN SIKKIM IPP P HYG 200 119 PARKHACHIK
PANIKAR JAMMU & KASHMIR PDC S HYG 60
120 PARLI REPLACEMENT MAH MAHAGEN S THG 250 121 RAMAM ST-I W BENGAL WBSEB S HYG 36 122 RANGANADI-II ARUNACHAL PRADESH NEEPCO C HYG 130 123 RANGYONG SIKKIM IPP P HYG 141 124 RAPP EXT. RAJASTHAN NPCIL C Nuclear 700 125 RENGALI TPP ORS NLC C THG 500 126 RONGNICHU
STORAGE SIKKIM IPP P HYG 95
127 RUKEL SIKKIM IPP P HYG 33

Financial Issues & Power Sector Financing Working Group on Power for 11th Plan
Page 44 of Chapter 10
S. no. PLANT NAME STATE AGENCY SECTOR
Type BENEFITS XII PLAN
(MW) 128 SHONGTONG
KARCHAM HIMACHAL PRADESH HPSEB S HYG 402
129 TALEM SIKKIM IPP P HYG 75 130 TEESTA ST.-I SIKKIM IPP P HYG 280 131 TEESTA ST.-II SIKKIM IPP P HYG 330 132 THOPAN POWARI HIMACHAL PRADESH IPP P HYG 480 133 ULTRA MEGA
MUNDRA GUJARAT IPP P THG 1600
134 ULTRA MEGA SASAN MP IPP P THG 1600 135 ALAKNANDA
(BADRINATH) UTTARANCHAL IPP P HYG 140
136 BARA BHANGAL HIMACHAL PRADESH IPP P HYG 200 137 BHARELI LIFT DAM-I ARUNACHAL PRADESH NEEPCO C HYG 510 138 BHUSAWAL
REPLACEMENT MAH MAHAGEN S THG 250
139 BODGHAT CHHATTISGAD CSEB S HYG 500 140 CHHUNGER CHAL UTTARANCHAL NHPC C HYG 240 141 DIBANG ARUNACHAL PRADESH NHPC C HYG 500 142 GARBA TAWA GHAT UTTARANCHAL NHPC C HYG 630 143 GARO HILL MEGHALAYA MeSEB S THG 360 144 GHAROPA HIMACHAL PRADESH IPP P HYG 114 145 HIRONG ARUNACHAL PRADESH IPP P HYG 500 146 INTEGRATED
PROJECT DARIPALLI ORISSA NTPC C THG 800
147 JAITAPUR MAHARASHTRA NPCIL C Nuclear 1000 148 JAITAPUR MAHARASHTRA NPCIL C Nuclear 1000 149 JHANGI THOPAN HIMACHAL PRADESH IPP P HYG 480 150 KHOKSAR HIMACHAL PRADESH IPP P HYG 90 151 KISHAU DAM UTTARANCHAL THDC C HYG 300 152 KUNDAH PSS TAMIL NADU TNEB S HYG 500 153 LACHEN SIKKIM NHPC C HYG 210 154 LUHRI HIMACHAL PRADESH SJVNL C HYG 700 155 MARWA CHG CSEB S THG 1000 156 NAYING ARUNACHAL PRADESH IPP P HYG 500 157 NEYVELI III LIGNITE TN NLC C THG 500 158 NONGNAW MEGHALAYA MeSEB S HYG 50 159 PAKHAL DUL JAMMU & KASHMIR NHPC C HYG 1000 160 PALA MANERI UTTARANCHAL UJVNL S HYG 480 161 PARAS
REPLACEMENT MAH MAHAGEN S THG 250
162 RANGMAW MEGHALAYA MeSEB S HYG 65 163 RAPP EXT. RAJASTHAN NPCIL C Nuclear 700 164 SIRKARI BHYAL
RUPSIABAGAR UTTARANCHAL UJVNL S HYG 210
165 TAMAK LATA UTTARANCHAL UJVNL S HYG 280 166 TATO-II ARUNACHAL PRADESH IPP P HYG 350 167 TEESTA ST.-IV SIKKIM NHPC C HYG 495 168 TEESTA ST.-VI SIKKIM LANCO P HYG 500 169 TUINI PLASU UTTARANCHAL UJVNL S HYG 42 170 ULTRA MEGA GUJARAT IPP P THG 1600

Financial Issues & Power Sector Financing Working Group on Power for 11th Plan
Page 45 of Chapter 10
S. no. PLANT NAME STATE AGENCY SECTOR
Type BENEFITS XII PLAN
(MW) MUNDRA
171 ULTRA MEGA SASAN MP IPP P THG 1600 172 ARKOT TIUNI UTTARANCHAL UJVNL S HYG 70 173 ATTUNLI ARUNACHAL PRADESH NTPC C HYG 500 174 BHARELI LIFT DAM-I ARUNACHAL PRADESH NEEPCO C HYG 510 175 BURSAR JAMMU & KASHMIR NHPC C HYG 250 176 DIBANG ARUNACHAL PRADESH NHPC C HYG 500 177 DUMMUGUDEM ANDHRA PRADESH APID S HYG 320 178 ETALIN u1 ARUNACHAL PRADESH NTPC C HYG 500 179 ETALIN u2 ARUNACHAL PRADESH NTPC C HYG 500 180 INTEGRATED PROJ
LARA CHG NTPC C THG 800
181 INTEGRATED PROJECT DARIPALLI
ORISSA NTPC C THG 800
182 KAMENG DAM ARUNACHAL PRADESH NEEPCO C HYG 300 183 KIRTHAI-I JAMMU & KASHMIR PDC S HYG 240 184 KISHAU DAM UTTARANCHAL THDC C HYG 300 185 KORBA SOUTH CHG CSEB S THG 500 186 NAYING ARUNACHAL PRADESH IPP P HYG 500 187 RENGALI TPP ORS NLC C THG 500 188 SONAMARG JAMMU & KASHMIR PDC S HYG 165 189 TALUKA SANKRI UTTARANCHAL UJVNL S HYG 140 190 TATO-II ARUNACHAL PRADESH IPP P HYG 350 191 TIPAIMUKH MANIPUR NEEPCO C HYG 500 192 ULTRA MEGA
AKALTARA CHHATISGARH IPP P THG 800
193 ULTRA MEGA AP AP IPP P THG 800 194 ULTRA MEGA
KARNATAKA KAR IPP P THG 1600
195 ULTRA MEGA ORISSA ORISSA IPP P THG 800 196 ULTRA MEGA
SINDHUDURG MAHARASHTRA IPP P THG 800
197 BURSAR JAMMU & KASHMIR NHPC C HYG 250 198 ETALIN u3 ARUNACHAL PRADESH NTPC C HYG 500 199 ETALIN u4 ARUNACHAL PRADESH NTPC C HYG 500 200 INTEGRATED PROJ
LARA CHG NTPC C THG 800
201 KAMENG DAM ARUNACHAL PRADESH NEEPCO C HYG 300 202 KIRTHAI-II JAMMU & KASHMIR PDC S HYG 360 203 KIRU JAMMU & KASHMIR NHPC C HYG 430 204 KISHAN GANGA JAMMU & KASHMIR NHPC C HYG 330 205 KUDANKULAM- U 5 &6 TAMILNADO NPCIL C Nuclear 2000 206 LWR 3 & 4 C Nuclear 2000 207 MAYURPUR
(SONEBHADRA) UP UPRVUNL S THG 500
208 NEW NUCLEAR NTPC NTPC C Nuclear 2000 209 RENUKA DAM HIMACHAL PRADESH HPSEB S HYG 40 210 SELIM MEGHALAYA CWC C HYG 170 211 TIPAIMUKH MANIPUR NEEPCO C HYG 500 212 ULTRA MEGA CHHATISGARH IPP P THG 1600
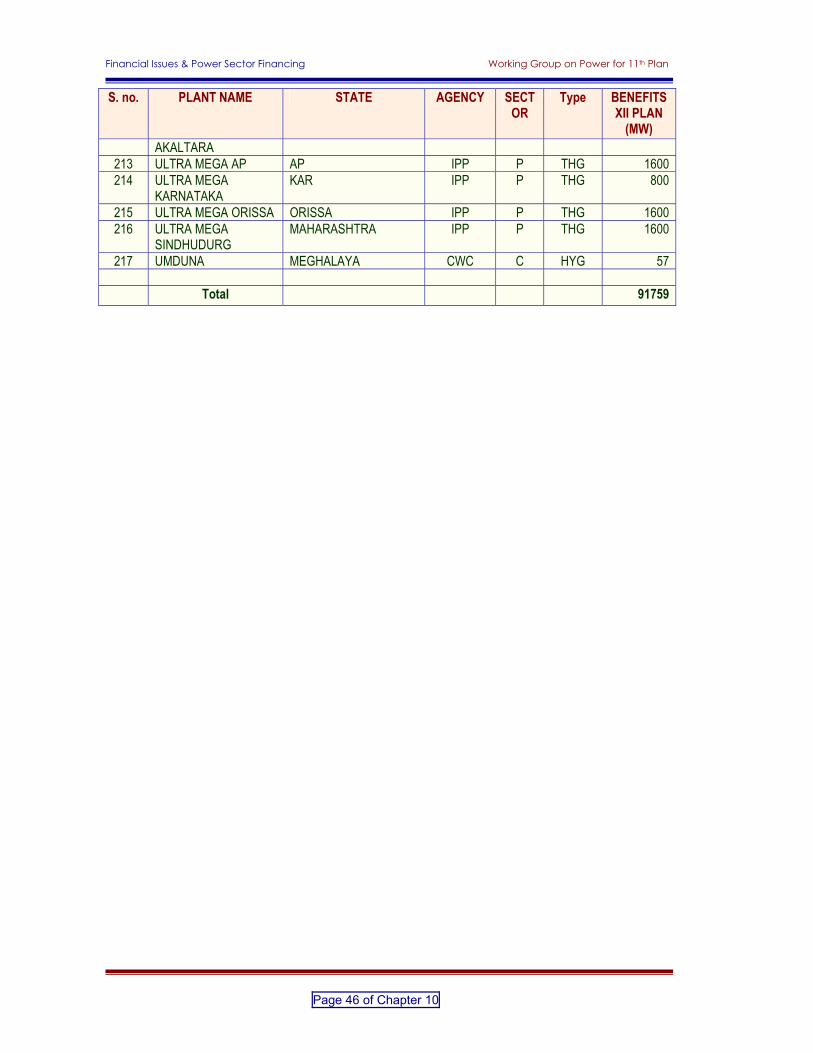
Financial Issues & Power Sector Financing Working Group on Power for 11th Plan
Page 46 of Chapter 10
S. no. PLANT NAME STATE AGENCY SECTOR
Type BENEFITS XII PLAN
(MW) AKALTARA
213 ULTRA MEGA AP AP IPP P THG 1600 214 ULTRA MEGA
KARNATAKA KAR IPP P THG 800
215 ULTRA MEGA ORISSA ORISSA IPP P THG 1600 216 ULTRA MEGA
SINDHUDURG MAHARASHTRA IPP P THG 1600
217 UMDUNA MEGHALAYA CWC C HYG 57 Total 91759

Acronyms Working Group on Power for 11th Plan
Page 1 of Acronyms
ACRONYMS
ACRONYMS EXPANSION AAAC All Aluminium Alloy Conductor ABS Asset Backed Securities ABT Availability Based Tariff AC Alternating Current ADB Asian Development Bank AG&SP Accelerated Generation & Supply Programme AHWR Advance Heavy Water Reactor AIIMS All India Institute of Medical Sciences ALM Asset Liability Mismatch ALTM Airborne Laser Terrain Mapping AMD Atomic Minerals Directorate APC Auxiliary Power Consumption APDRP Accelerated Power Development & Reform Programme APH Air Pre Heater APM Administered Price Mechanism APY Akshay Prakash Yojna AREP Accelerated Rural Electrification Programme AT&C Aggregate Technical & Commercial BARC Bhabha Atomic Research Centre Bcum, BCM Bm3 Billion cubic meter
BE Budget Estimates BEE Bureau of Energy Efficiency BFP Boiler Feed Pump BHEL Bharat Heavy Electricals Ltd.
BIMSTEC Bay Of Bengal Initiative For Multi-Sectoral Technical & Economic Co-orporation
BOOL Built Own Operate Lease BOOT Built Own Operate & Transfer BOT Built Operate & Transfer BPCL Bharat Petroleum Corporation Limited BPR Business Process Re-engineering BSEB Bihar State Electricity Board BSES Bombay Suburban Electric Supply BU Billion units or Billion Kwh C&I Control & Instrumentation CAD & CAM Computer Aided Design & Computer Aided Management CAGR Compounded Annual Growth Rate CBIP Central Board of Irrigation & Power CBM Coal Bed Methane CCEA Cabinet Committee On Economic Affaires CCGT Combined Cycle Gas Turbine CD Compact Disc CDAC Centre for Development of Advance Computing

Acronyms Working Group on Power for 11th Plan
Page 2 of Acronyms
ACRONYMS EXPANSION CDM Clean Development Mechanism CEA Central Electricity Authority CERC Central Electricity Regulatory Commission CFBC Circulating Fluidized Bed Combustion CFL Compact Florescent Lamp CFL Compact Fluorescent Lamp CFRI Central Fuel Research Institute CIDC Construction Industry Development Council CIL Coal India Ltd. CIRE Centre For Insurance Research & Education ckm Circuit Kilometer CLA Central Loan Assistance CMPDIL Central Mine Planning & Design Institute Limited COE Centre Of Excellence CPP Captive Power Producer CPRI Central Power Research Institute CPSU Central Public Sector Undertaking CRGO Cold Rolled Grain Oriented Crs Crores CS Central Sector CSIR Council for Scientific and Industrial Research CSMRS Central Soil & Materials Research Station CTU Central Transmission Utilities CVD Counter Veiling Duty CWC Central Water Commission CWS Circulating Water System D/C Double Circuit D/E Debt : Equity DAE Department of Atomic energy DC Direct Current DCB Domestic Commercial Banks DDG Decentralised Distributed Generation DFI Domestic Financial Institution DG Set Diesel Generating Set DGH Director General Hydro Carbon DISCOM Distribution Company DMLF Data Management & Load Forecasting DONER Development of North Eastern Region DOPT Department of Personnel & Training DPR Detailed Project Report DPRS Distributed Renewable Power System DRUM Distribution Reform Upgrade Management DSM Demand Side Management DST Department of Science & Technology DSTATCOM Distribution Static Compensation DTR Distribution Transformer Metering DVC Damodar Valley Corporation

Acronyms Working Group on Power for 11th Plan
Page 3 of Acronyms
ACRONYMS EXPANSION DVR Dynamic Voltage Restorer E&F Environment And Forest EA 2003 Electricity Act 2003 EAB External Aided Borrowing EAP External Aided Projects EC Energy Conservation ECB External Commercial Borrowing ECBC Energy Conservation Building Code ECIC Energy Conservation & Information Centre ECIL Electronic Corporation of India Ltd. ECL Eastern Coal Fields Limited EGEAS Electric Generation Expansion Analysis System EHV Extra High Voltage ENS Energy Not Served EPC Engineering Procurement Contract EPS Electric Power Survey ERC Electricity Regulatory Commission ERDA Electric Research & Development Association ERS Emergency Restoration System ESCO Energy Service Company ESP Electro Static Precipitator FACTS Flexible Alternating Current Transmission System FAUP Fly Ash Utilisation Programme FBC Fluidised Bed Combustion FMIS Finance Management Information System FO Forced Outage FOR Forum Of Regulators FPO Follow-on Public Offer FSTA Fuel Supply And Transport Agreement FY Financial Year GAIL Gas Authority Of India Limited GBS Gross Budgetary Support GCV Gross Calorific Value GDP Gross Domestic Product GHG Green House Gas GIS Gas Insulated Substation GOI Government Of India GPS Geographic Positioning System GR General Review GSPC Gujarat State Petroleum Corporation GT Gas Turbine GVA Gega Volt Ampere GVP Grameen Vidyut Pratinidhi GW Gega Watt GWe Gega Watt (Electrical) HBJ Hazira-Bijapur-Jagdishpur ( pipeline) HEP Hydro Electric Project

Acronyms Working Group on Power for 11th Plan
Page 4 of Acronyms
ACRONYMS EXPANSION HFO Heavy Fuel Oil HPS Heavy Petroleum Stock HRD Human Resource Development HRT Head Race Tunnel HSD High Speed Diesel HSIL High Surge Impedance Loading HT High Tension HVDC High Voltage Direct Current HVDS High Voltage Distribution System IBF Input Based Franchisee ID Induced Draft IEBR Internal and Extra Budgetary Resource IEEMA Indian Electrical & Electronics Manufacturers’ Association IEP Integrated Energy Policy IGCAR Indira Gandhi Centre for Atomic Research IGCC Integrated Gasification Combined Cycle IIFCL India Infrastructure Financial Corporation IISC Indian Institute of Science IIT Indian Institute of Technology IOCL Indian Oil Corporation Limited IPO Initial Public Offer IPP Independent Power Producer IPR Intellectual Property Rights IR Internal Resources IRDA Insurance Regulatory And Development Authority IS Indian Standard ISCC Integrated Solar Combined Cycle ISO International Standard Organisation ISPLAN Integrated System Planning IT Information Technology KAPS Kalpakkam Atomic Power Station kCal Kilo Calorie kg Kilogram KKNPP Kudankulam Nuclear Power Project kV Kilo Volts kW Kilo Watt kWh Kilo Watt hour LEP Life Extension Programme LF Load Factor LILO Loop In Loop Out LNG Liquefied Natural Gas LOA Letter Of Award LOLP Loss of Load Probability LP Linear Programming LRVI Loss Reduction & Voltage Improvement LSHS Low Sulphur Heavy Stock LT Low Tension

Acronyms Working Group on Power for 11th Plan
Page 5 of Acronyms
ACRONYMS EXPANSION LWR Light Water Reactor M&E Monitoring And Evaluation MAPS Madras Atomic Power Station MBS Mortgage Backed Securities MCFC Mother Carbonate Fuel Cell Mcm Million cubic meter MFGs Micro Financing Institutions MHD Magneto Hydro Dynamics MMSCMD Million Metric Standard Cubic Meter per Day MNP Minimum Need Programme MNRE Ministry of New & Renewable Energy MoEF Ministry of Environment & Forest MoP Ministry of Power MOU Memorandum Of Understanding MT Million Tonne MToe Million Tonnes Oil equivalent MTPA Million Tonnes Per Annum MU Million Units MVA Mega Volt Ampere MW Mega Watt Mwe Mega Watt electric MYT Multi Year Tariff NABRD National Bank For Agriculture & Rural Development NAPS Narora Atomic Power Station NCL Northern Coal Fields Limited NCPS National Capital Power Station NDT Non Destructive Test NEA Nepal Elecricity Authority NEC North Eastern Council NELP New Exploration Liscencing Policy NEP National Electricity Policy NFC Nuclear Fuel Complex NGOs Non-Governmental Organisations NHAI National Highways Authority Of India NHPC National Hydroelectric Power Corporation NICMAR National Institute Of Construction Management & Research NIT National Institute Of Technology NLC Neyveli Lignite Corporation NMDC National Mineral Development Corporation NML National Metallurgical Laboratory NOX Oxides of Nitrogen NPC National Productivity Council NPCIL Nuclear Power Corporation of India Ltd.
NPTI National Power Training Institute NSC National Steering Committee NTC Nuclear Training Centre

Acronyms Working Group on Power for 11th Plan
Page 6 of Acronyms
ACRONYMS EXPANSION NTP National Tariff Policy NTPC National Thermal Power Corporation O&M Operation & Maintenance OCGT Open Cycle Gas Turbine OGIP Original Gas In Place OIL Oil India Limited ONGC Oil & Natural Gas Commission PAFC Phosphoric Acid Fuel Cell PC Pulverized Coal PCRA Petroleum Conservation Research Association PFBC Pressurised Fluidized Bed Combustion PFC Power Finance Corporation PFR Preliminary Feasibility Report PGCIL Power Grid Corporation of India pH Hydrogen Ion concentration PHWR Pressurised Heavy Water Reactor PIB Public Investment Board PIC Programme & Implementation Committee PIE Partnership In Excellence PLF Plant Load Factor PMGY Pradhan Mantri Gramodaya Yojna PMI Power Management Institute PMO Prime Minister’s Office PPA Power Purchase Agreement PPM Parts Per Million PPP Public Private Partnership PRI Panchayati Raj Institute PRC Project Review Committee PRM Project Review Meetings PS Private Sector PSC Production Sharing Contract PSP Power Supply Position PSS Pumped Storage Schemes PSTI Power System Training Institute PSU Public Sector Undertaking. QIB Qualified Institutional Bidder R&D Research & Development R&M Renovation & Modernisation R&M Renovation & Modernisation RAPP Rajasthan Atomic Power Project RAPS Rajasthan Atomic Power Station RBI Reserve Bank Of India RCC Roller Compacted Concrete REA Rural Electricity Agency REB Regional Electricity Board REC Rural Electrification Corporation REDB Rural Electricity Distribution Backbone

Acronyms Working Group on Power for 11th Plan
Page 7 of Acronyms
ACRONYMS EXPANSION RES Renewable Energy Sources RFP Request For Proposal RFQ Request For Qualification RGGVY Rajiv Gandhi Grameen Vidyutikaran Yojna RHE Rural Household Electrification RIDF Rural Infrastructure Development Fund RIL Reliance Industries Limited RLA Résiduel Life Assesment RM Reserve Margin RSOP Research Scheme On Power S/C Single Circuit SAARC South Asian Association for Regional Corporation SCADA Supervisory Control & Data Acquisition SCCL Singereni Collieries Company Limited SDA State Development Agency SEB State Electricity Board SECL South Eastern Coal Fields Limited SERC State Electricity Regulatory Commission SGC State Generation Corporation SHG Self Help Group SLR Statutory Liquidity Ratio SMEs Small And Medium Enterprises SOG Sanctioned & Ongoing SOX Oxides of Sulphur SPIC Southern Petro India Chemicals Ltd. SPM Suspended Particulate Matter SPM Single Point Metering SPS Single Point Supply SS State Sector SSB Solid State Breakers SSTS Solid State Transfer Switches ST&D Sub Transmission Distribution STOA Short Term Open Access STPP Super Thermal Power Project STPS Super Thermal Power Station T&D Transmission & Distribution TAPP Tarapur Atomic Power Project TAPS Tarapur Atomic Power Station TCF Terra cubic Feet Tckm Thousand Circuit Kilometre TCSC Thyristorised Controlled Series Compensation TERI The Energy Research Institute TG Techo Generator TIFAC Technology Information Forecasting & Assessment Council TOD Time Of Day TOU Time of Use TPS Thermal Power Station

Acronyms Working Group on Power for 11th Plan
Page 8 of Acronyms
ACRONYMS EXPANSION U Up rating UCIL Uranium Corporation of India Ltd. UI Unscheduled Interchange UMPP Ultra Mega Power Project UN United Nations UNDP United Nation Development Programme UPCL Uttaranchal Power Corporation Limited UPPCL Uttar Pradesh Power Corporation Limited UT Union Territory VAMBAY Valmiki Ambedkar Awas Yojna VEI Village Electrification Infrastructure VEMB Village Electricity Management Board WAMS Wide Area Monitoring System WBPDCL West Bengal Power Development Corporation


![Classroom Embedded Assessment [CEA] Title: Particle Modellouisville.edu/education/centers/crimsted/cea-examples/grades-3-5-cea... · This CEA is administered at the beginning of a](https://static.fdocuments.us/doc/165x107/5e0c9c02fc643312e40fb808/classroom-embedded-assessment-cea-title-particle-this-cea-is-administered-at.jpg)