
Finite Element Modeling of Shallow Foundations on Nonlinear Soil Medium

CE 240Soil Mechanics & Foundations
Lecture 5.2
Permeability III(Das, Ch. 6)
Summary Soil Index Properties(Das, Ch. 2-6)

Outline of this Lecture
1.Getting the in situ hydraulic conductivity1.1 pumping test1.2 percolation test
2.Summary Soil Index Properties

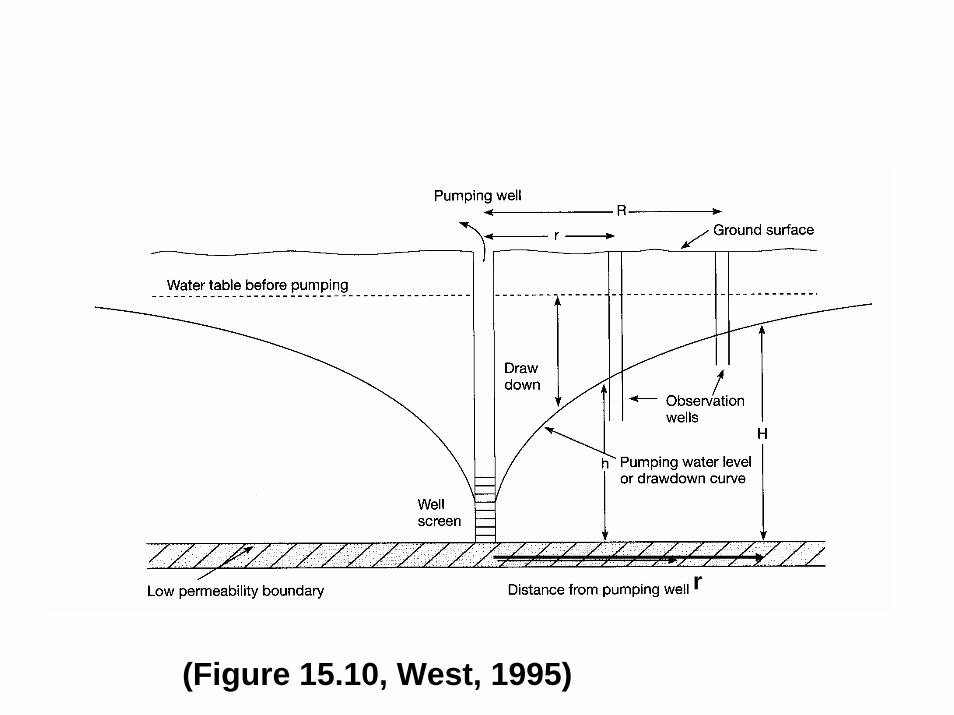
Pumping test
• The purpose of pumping test is to get the information of permeability;
• Pumping test is the active way to get k, the permeability. The passive way is to do the percolation test.

Some fundamental concepts: 1
• Drawdown: the amount of water level to be lowered by pumping in a well;
Time increase
Q
q

Some fundamental concepts (cont.)
• Steady state: the equilibrium state when the drawdown keeps no change at one particular location to the well, no further drawdown develops as pumping continues.
• Specific yield: the quantity of water that a unit volume of the aquifer will give up when drained by gravity;
• Specific retention: those part not given up by gravity drainage;
Specific yield+ Specific retention = porosity
r
(Figure 15.10, West, 1995)

0 0
T T dH dHQ vAdt k Adt k ATdr dr
= = =∫ ∫where H is the head and x is the distance. The surface area A is really the surface area of the wall of a cylinder with a head of H, given the fact the groundwater flow is essentially horizontal in the aquifer to the well. So that
After the pump reaches a steady state ( the water table drawdown does not change with respect to time), for a given amount of time T, the amount of water has been pumped out is Q, in the unit of volume, like cubic meter, or gallons.
2A rHπ=

then
2
2
dH dHQ k AT k rH Tdr dr
rkT HdHdr
π
π
= =
=
Transform it we get
2dr kTHdHr Q
π=

Integration with respect to, respectively, horizontal distance r from the well, and the height of the drawdown cone, we have
2 2
1 1
2r h
r h
dr kT HdHr Q
π=∫ ∫
The integration gives
2
2
1
1
22 1ln2
hr
rh
r kT HQπ
=

So that if we know the head h in each well and the wells’ locations, we can calculate the hydraulic conductivity k
and
)()ln(lnln 21
22
1
212 hhkT
Qrrrr −==−
π
32
2 2 22 1 1
22 2
2 1 1
2102 2
2 1 1
ln( ) [ ] [ ]( ) sec sec
ln( ) /( )2.303 log ( )( )
rQ m mkT h h r m
rqk q Q Th h r
rqkh h r
π
π
π
= =− ⋅
= =−
=−

If you use gallon per minute (gpm) for flow rate q, and feet for head h1 and h2, then the equation is
2102 2
2 1 1
2.303( / sec) log ( )14.7 ( )
rqk cmh h rπ
=−

Percolation Test
Percolation test is a passive and cheap way to estimate soil permeability.

Percolation TestIn the leaching field of the septic system:
• Need more than 6 holes, after test do the average;• Each hole to certain depth, usually 3’-5’;• Put 2” thick of coarse sand or gravel into the hole;• Fill 12” water above the sand/gravel;• Stay overnight;• In the next day before testing filling water by 6”
above the sand/gravel;• Measure the water level drop at 30 minutes interval
for 4 hours. Every time, if needed, add 6” of water again;
• The drop occurred at the final 30 min. is used to determine the percolation rate;
• If the soil is highly permeable, use 10 min. for the duration of 1 hour.
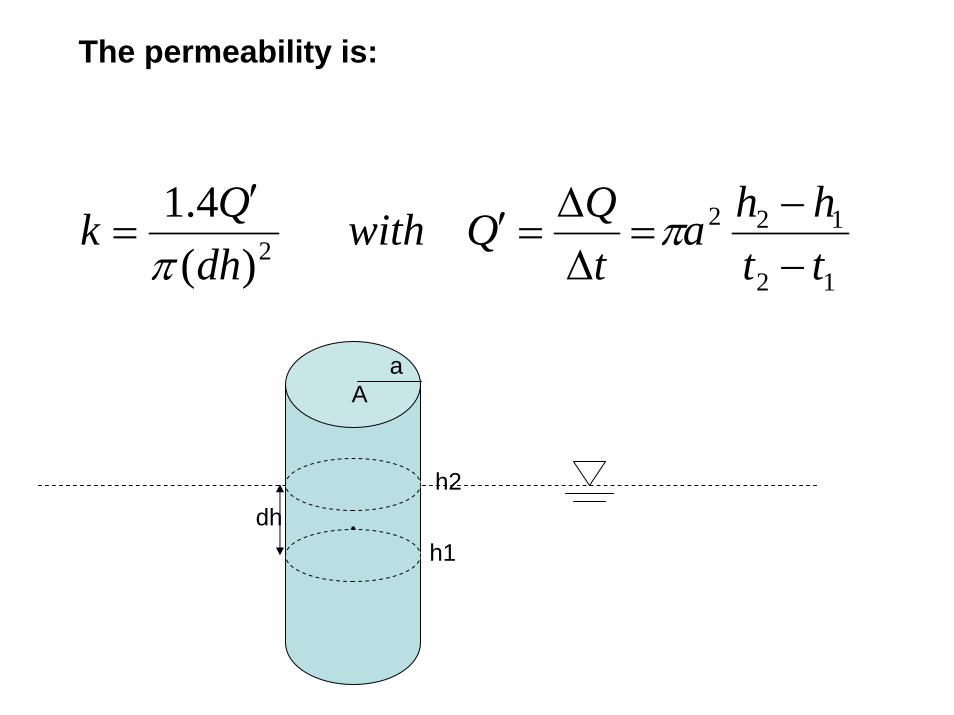
The permeability is:
12
1222)(
4.1tthha
tQQwith
dhQk
−−
=∆∆
=′′
= ππ
Ah1
h2dh
Aa
Section 6.11: in situ hydraulic conductivity tests for compacted clay soils adapt similar approach as showed in the above percolation test. It is dry and straightforward, you can easily read through it.

Summary Soil Index Properties(Das, Ch. 2-6)

Elements of soil mechanicsIndex properties:
Index properties mean the observable physical characteristics with significant influence on a soil’s behavior. Index properties include the descriptions of:
• Soil particles;• Soil density;• Phase relationships;• Soil consistency;• Relative density;• moisture content.
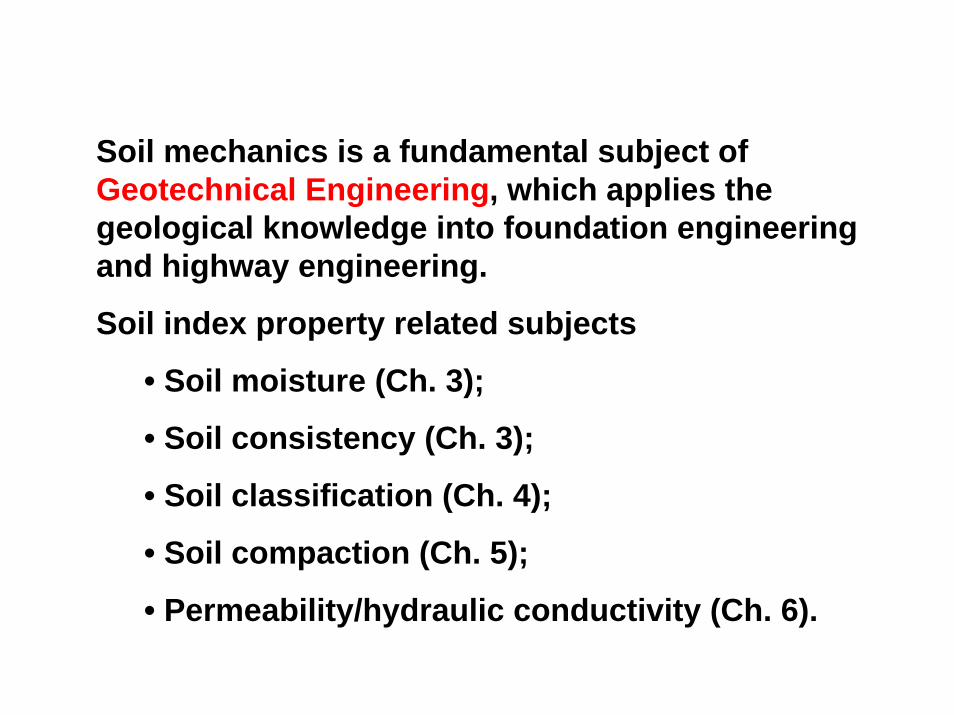
Soil mechanics is a fundamental subject of Geotechnical Engineering, which applies the geological knowledge into foundation engineering and highway engineering.
Soil index property related subjects
• Soil moisture (Ch. 3);
• Soil consistency (Ch. 3);
• Soil classification (Ch. 4);
• Soil compaction (Ch. 5);
• Permeability/hydraulic conductivity (Ch. 6).

Lab tests
1. specific weight, moisture content, dry unit weight
2. Sieve test/hydrometer test 3. Atterberg limit test

Soil particles
The description of the grain size distribution of soil particles according to their texture (particle size, shape, and gradation).
Major textural classes include:gravel (>2 mm);sand (0.1 – 2 mm);silt (0.01 – 0.1 mm);clay (< 0.01 mm).
Furthermore, gravel and sand can be roughly classified as coarse textured soils, wile silt and clay can be classified as fine textures soils.

For engineering purposes, soils can also be divided into cohesive and non-cohesive soils. Non-cohesive means the soil has no shear strength if no confinement.
Cohesive soil contains clay minerals and posses plasticity.
In engineering practice, plasticity is defined as the ability to be rolled into thin thread before breaking into pieces.
Clay is cohesive and plastic. For example, mud sticking on shoes in a rainy day when one walk in a field.
Sand is non-cohesive and non-plastic.

Phase relationship: the phase diagram
Wt: total weightWs: weight of solidWw: weight of waterWa: weight of air = 0
Vt: total volumeVs: volume of solidVw: volume of waterVv: volume of the void
Solid
Air
WaterWT
Ws
Ww
Wa~0
Vs
Va
Vw
Vv
VT

Weight-Volume Relationships (Table 3.1)
The 3rd column is a special case of the 1st column when S = 1.

Example: If you have a soil sample with a weight of 150 g, afterthorough sieving you get the following result.
sieve# size(mm) W(g) % accum% 100-accum%
4 4.750 30.0 20 20 8020 0.850 40.0 26.7 46.7 53.360 0.250 50.0 33.3 79 21100 0.150 20.0 13.3 92 8200 0.074 10.0 6.67 98 2
The last column shows the percentage of material finer than that particular sieve size by weight.

West, Figure 7.1
D10
D60D60 D60
D10 D10

Soil Consistency
Soil consistency is defined as the relative ease with which a soil can be deformed use the terms of soft, firm, or hard.
Consistency largely depends on soil minerals and the water content.
Atterberg limits are the limits of water content used to define soil behavior. The consistency of soils according to Atterberg limits gives the following diagram.
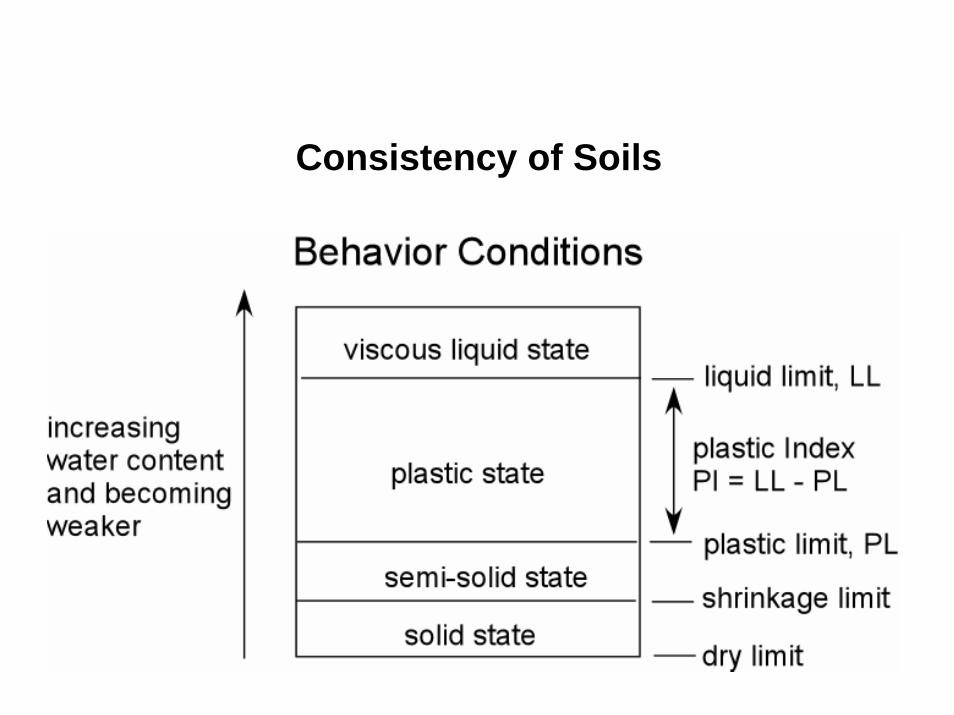
Consistency of Soils
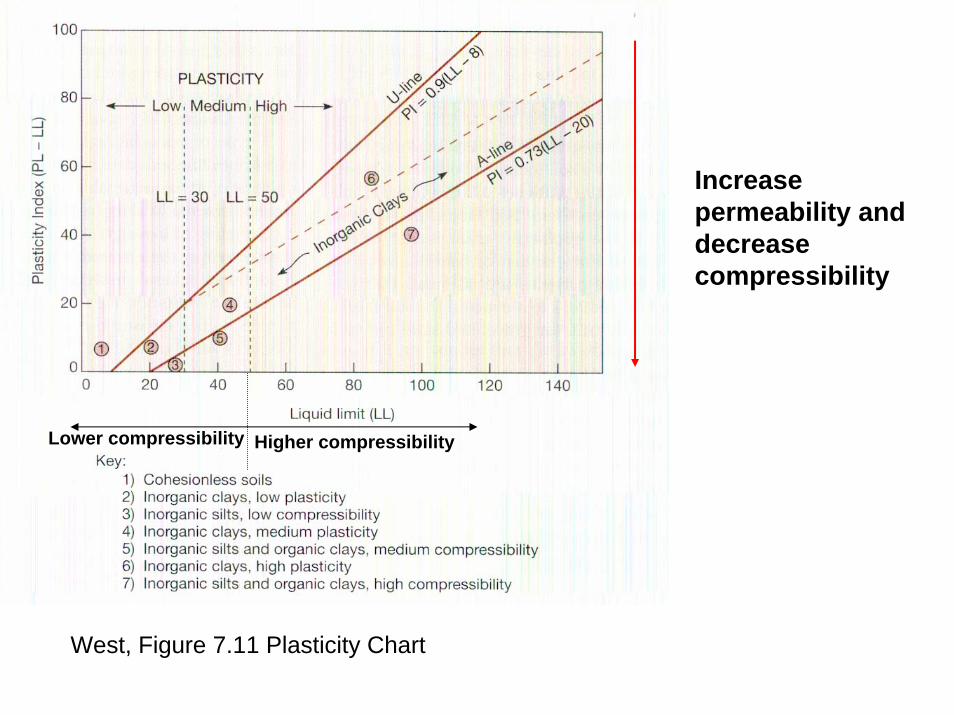
Increase permeability and decrease compressibility
West, Figure 7.11 Plasticity Chart
Lower compressibility Higher compressibility
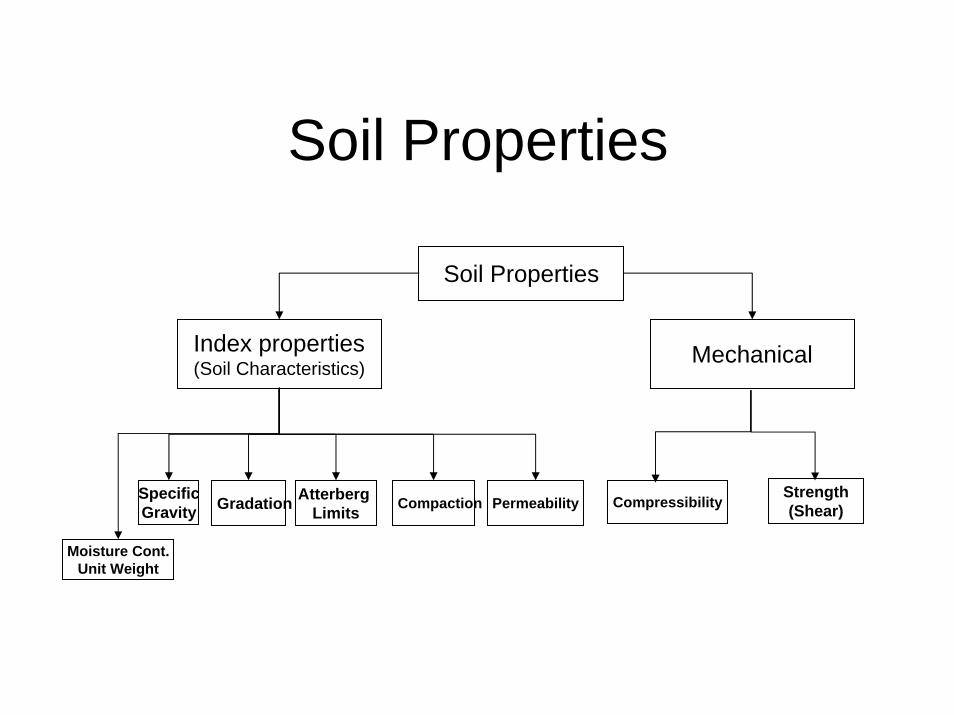
Soil Properties
Index properties(Soil Characteristics) Mechanical
Moisture Cont.Unit Weight
CompressibilityPermeabilitySpecificGravity Gradation Atterberg
LimitsStrength(Shear)
Soil Properties
Compaction

In summary, course lectures in the past 5 weeks discussed in detail about the physical properties (the index property) of soil as a material.
After these 5 weeks, we will change the theme to talk about the behavior of soil under a variety of load, i.e., we start to talk about the mechanics and the mechanical properties of soil.

Midterm Exam
Open book, open notes
Das, Chs. 2-6
Problems similar to homework in style
~4 problems.


