CDP 2015 Climate Change 2015 Information Request 2015 Climate Change 2015 Information Request ......
57
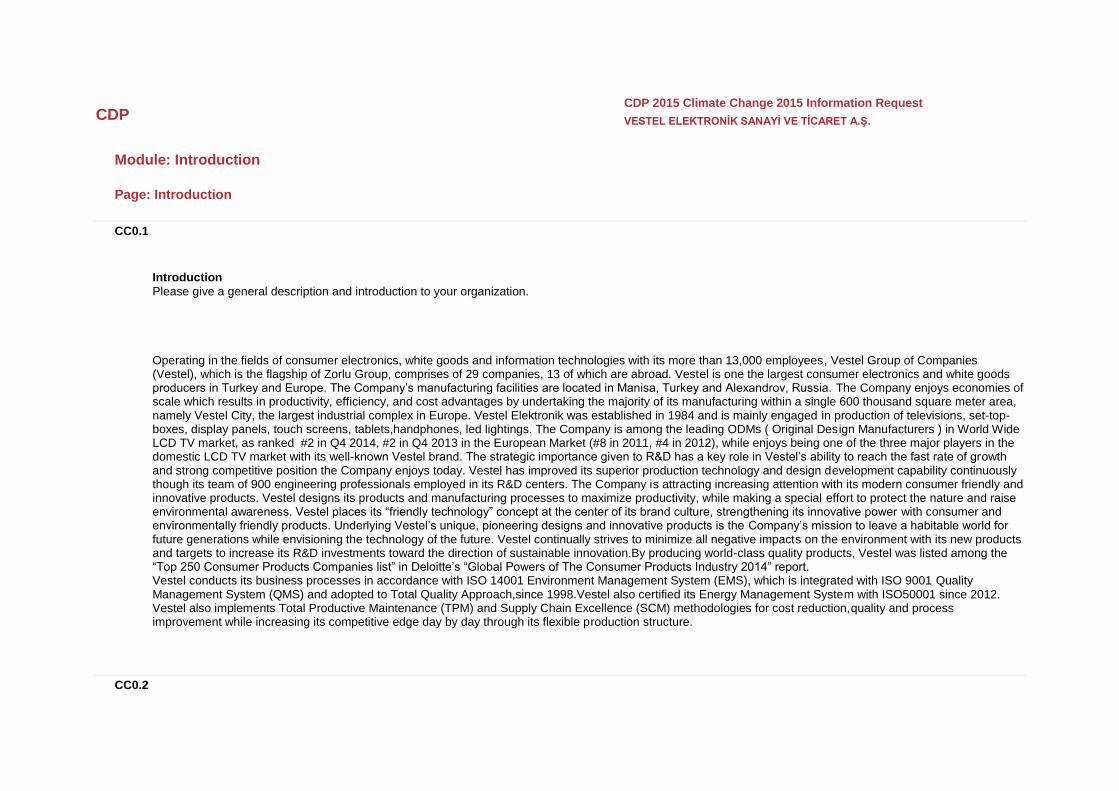
CDP CDP 2015 Climate Change 2015 Information Request VESTEL ELEKTRONİK SANAYİ VE TİCARET A.Ş. Module: Introduction Page: Introduction CC0.1 Introduction Please give a general description and introduction to your organization. Operating in the fields of consumer electronics, white goods and information technologies with its more than 13,000 employees, Vestel Group of Companies (Vestel), which is the flagship of Zorlu Group, comprises of 29 companies, 13 of which are abroad. Vestel is one the largest consumer electronics and white goods producers in Turkey and Europe. The Company’s manufacturing facilities are located in Manisa, Turkey and Alexandrov, Russia. The Company enjoys economies of scale which results in productivity, efficiency, and cost advantages by undertaking the majority of its manufacturing within a single 600 thousand square meter area, namely Vestel City, the largest industrial complex in Europe. Vestel Elektronik was established in 1984 and is mainly engaged in production of televisions, set-top- boxes, display panels, touch screens, tablets,handphones, led lightings. The Company is among the leading ODMs ( Original Design Manufacturers ) in World Wide LCD TV market, as ranked #2 in Q4 2014, #2 in Q4 2013 in the European Market (#8 in 2011, #4 in 2012), while enjoys being one of the three major players in the domestic LCD TV market with its well-known Vestel brand. The strategic importance given to R&D has a key role in Vestel’s ability to reach the fast rate of gr owth and strong competitive position the Company enjoys today. Vestel has improved its superior production technology and design development capability continuously though its team of 900 engineering professionals employed in its R&D centers. The Company is attracting increasing attention with its modern consumer friendly and innovative products. Vestel designs its products and manufacturing processes to maximize productivity, while making a special effort to protect the nature and raise environmental awareness. Vestel places its “friendly technology” concept at the center of its brand culture, strengthening its innovative power with consumer and environmentally friendly products. Underlying Vestel’s unique, pioneering designs and innovative products is the Company’s mission to leave a habitable world for future generations while envisioning the technology of the future. Vestel continually strives to minimize all negative impacts on the environment with its new products and targets to increase its R&D investments toward the direction of sustainable innovation.By producing world-class quality products, Vestel was listed among the “Top 250 Consumer Products Companies list” in Deloitte’s “Global Powers of The Consumer Products Industry 2014” report. Vestel conducts its business processes in accordance with ISO 14001 Environment Management System (EMS), which is integrated with ISO 9001 Quality Management System (QMS) and adopted to Total Quality Approach,since 1998.Vestel also certified its Energy Management System with ISO50001 since 2012. Vestel also implements Total Productive Maintenance (TPM) and Supply Chain Excellence (SCM) methodologies for cost reduction,quality and process improvement while increasing its competitive edge day by day through its flexible production structure. CC0.2
Transcript of CDP 2015 Climate Change 2015 Information Request 2015 Climate Change 2015 Information Request ......
CDP CDP 2015 Climate Change 2015 Information Request
VESTEL ELEKTRONİK SANAYİ VE TİCARET A.Ş.
Module: Introduction
Page: Introduction
CC0.1
Introduction
Please give a general description and introduction to your organization. Operating in the fields of consumer electronics, white goods and information technologies with its more than 13,000 employees, Vestel Group of Companies (Vestel), which is the flagship of Zorlu Group, comprises of 29 companies, 13 of which are abroad. Vestel is one the largest consumer electronics and white goods producers in Turkey and Europe. The Company’s manufacturing facilities are located in Manisa, Turkey and Alexandrov, Russia. The Company enjoys economies of scale which results in productivity, efficiency, and cost advantages by undertaking the majority of its manufacturing within a single 600 thousand square meter area, namely Vestel City, the largest industrial complex in Europe. Vestel Elektronik was established in 1984 and is mainly engaged in production of televisions, set-top-boxes, display panels, touch screens, tablets,handphones, led lightings. The Company is among the leading ODMs ( Original Design Manufacturers ) in World Wide LCD TV market, as ranked #2 in Q4 2014, #2 in Q4 2013 in the European Market (#8 in 2011, #4 in 2012), while enjoys being one of the three major players in the domestic LCD TV market with its well-known Vestel brand. The strategic importance given to R&D has a key role in Vestel’s ability to reach the fast rate of growth and strong competitive position the Company enjoys today. Vestel has improved its superior production technology and design development capability continuously though its team of 900 engineering professionals employed in its R&D centers. The Company is attracting increasing attention with its modern consumer friendly and innovative products. Vestel designs its products and manufacturing processes to maximize productivity, while making a special effort to protect the nature and raise environmental awareness. Vestel places its “friendly technology” concept at the center of its brand culture, strengthening its innovative power with consumer and environmentally friendly products. Underlying Vestel’s unique, pioneering designs and innovative products is the Company’s mission to leave a habitable world for future generations while envisioning the technology of the future. Vestel continually strives to minimize all negative impacts on the environment with its new products and targets to increase its R&D investments toward the direction of sustainable innovation.By producing world-class quality products, Vestel was listed among the “Top 250 Consumer Products Companies list” in Deloitte’s “Global Powers of The Consumer Products Industry 2014” report. Vestel conducts its business processes in accordance with ISO 14001 Environment Management System (EMS), which is integrated with ISO 9001 Quality Management System (QMS) and adopted to Total Quality Approach,since 1998.Vestel also certified its Energy Management System with ISO50001 since 2012. Vestel also implements Total Productive Maintenance (TPM) and Supply Chain Excellence (SCM) methodologies for cost reduction,quality and process improvement while increasing its competitive edge day by day through its flexible production structure.
CC0.2

Reporting Year
Please state the start and end date of the year for which you are reporting data. The current reporting year is the latest/most recent 12-month period for which data is reported. Enter the dates of this year first. We request data for more than one reporting period for some emission accounting questions. Please provide data for the three years prior to the current reporting year if you have not provided this information before, or if this is the first time you have answered a CDP information request. (This does not apply if you have been offered and selected the option of answering the shorter questionnaire). If you are going to provide additional years of data, please give the dates of those reporting periods here. Work backwards from the most recent reporting year. Please enter dates in following format: day(DD)/month(MM)/year(YYYY) (i.e. 31/01/2001).
Enter Periods that will be disclosed
Wed 01 Jan 2014 - Wed 31 Dec 2014
CC0.3
Country list configuration
Please select the countries for which you will be supplying data. If you are responding to the Electric Utilities module, this selection will be carried forward to assist you in completing your response.
Select country
Turkey
CC0.4
Currency selection
Please select the currency in which you would like to submit your response. All financial information contained in the response should be in this currency. TRY
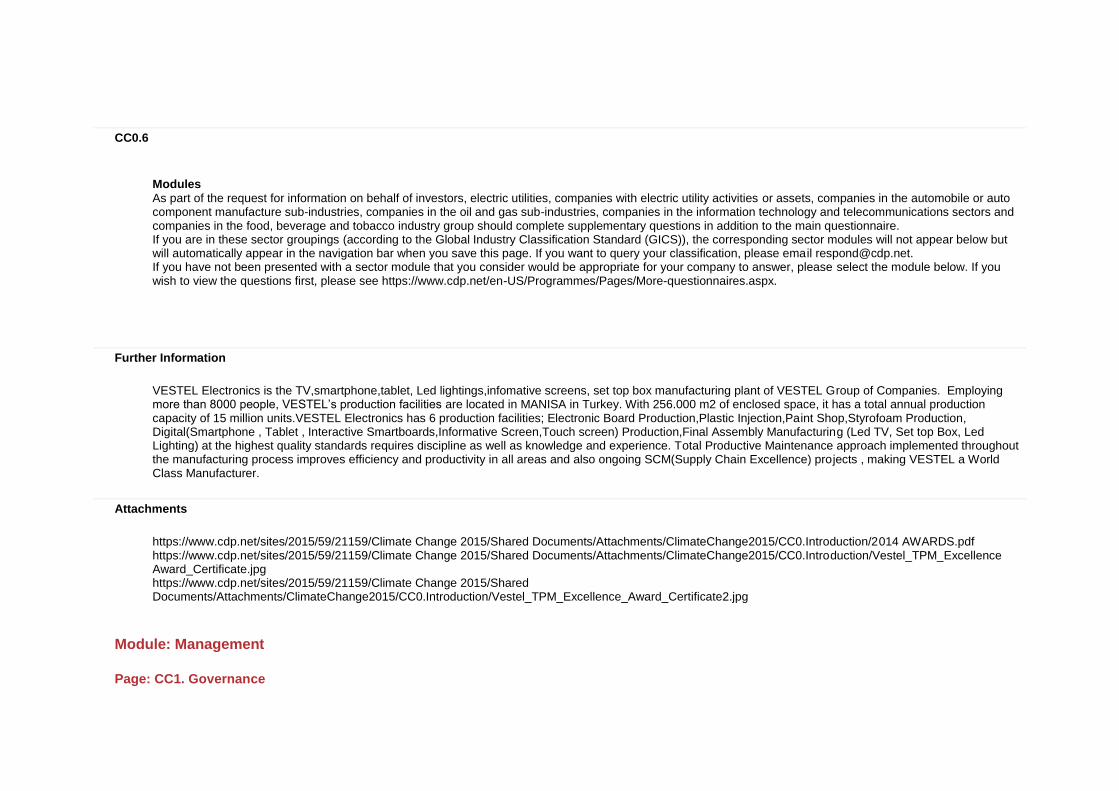
CC0.6
Modules
As part of the request for information on behalf of investors, electric utilities, companies with electric utility activities or assets, companies in the automobile or auto component manufacture sub-industries, companies in the oil and gas sub-industries, companies in the information technology and telecommunications sectors and companies in the food, beverage and tobacco industry group should complete supplementary questions in addition to the main questionnaire. If you are in these sector groupings (according to the Global Industry Classification Standard (GICS)), the corresponding sector modules will not appear below but will automatically appear in the navigation bar when you save this page. If you want to query your classification, please email [email protected]. If you have not been presented with a sector module that you consider would be appropriate for your company to answer, please select the module below. If you wish to view the questions first, please see https://www.cdp.net/en-US/Programmes/Pages/More-questionnaires.aspx.
Further Information
VESTEL Electronics is the TV,smartphone,tablet, Led lightings,infomative screens, set top box manufacturing plant of VESTEL Group of Companies. Employing more than 8000 people, VESTEL’s production facilities are located in MANISA in Turkey. With 256.000 m2 of enclosed space, it has a total annual production capacity of 15 million units.VESTEL Electronics has 6 production facilities; Electronic Board Production,Plastic Injection,Paint Shop,Styrofoam Production, Digital(Smartphone , Tablet , Interactive Smartboards,Informative Screen,Touch screen) Production,Final Assembly Manufacturing (Led TV, Set top Box, Led Lighting) at the highest quality standards requires discipline as well as knowledge and experience. Total Productive Maintenance approach implemented throughout the manufacturing process improves efficiency and productivity in all areas and also ongoing SCM(Supply Chain Excellence) projects , making VESTEL a World Class Manufacturer.
Attachments
https://www.cdp.net/sites/2015/59/21159/Climate Change 2015/Shared Documents/Attachments/ClimateChange2015/CC0.Introduction/2014 AWARDS.pdf https://www.cdp.net/sites/2015/59/21159/Climate Change 2015/Shared Documents/Attachments/ClimateChange2015/CC0.Introduction/Vestel_TPM_Excellence Award_Certificate.jpg https://www.cdp.net/sites/2015/59/21159/Climate Change 2015/Shared Documents/Attachments/ClimateChange2015/CC0.Introduction/Vestel_TPM_Excellence_Award_Certificate2.jpg
Module: Management
Page: CC1. Governance

CC1.1
Where is the highest level of direct responsibility for climate change within your organization?
Board or individual/sub-set of the Board or other committee appointed by the Board
CC1.1a
Please identify the position of the individual or name of the committee with this responsibility
(i)The highest level of direct responsibility for climate change rests with Mr. İhsaner Alkım, who is a member of the Executive Board responsible for top level management of all environmental, energy, and social responsibility issues. (ii)Position in the corporate structure and climate change related responsibilities: Mr. İhsaner Alkım reports directly to the Group CEO, Mr. Turan Erdoğan.
CC1.2
Do you provide incentives for the management of climate change issues, including the attainment of targets?
Yes
CC1.2a
Please provide further details on the incentives provided for the management of climate change issues
Who is entitled to benefit from these incentives?
The type of incentives
Incentivized performance
indicator
Comment
All employees Recognition (non-monetary)
Emissions reduction target Energy reduction project
Employees can submit ideas for new environmental programs, and are eligible to receive spot awards such as gifts for coming up with ideas that enhances the company's overall environmental performance, including those that result in greenhouse gas emissions reductions according to TPM Suggestion&Appreciation Evaluation System.

Who is entitled to benefit from these incentives?
The type of incentives
Incentivized performance
indicator
Comment
Business unit managers Monetary reward
Emissions reduction project Energy reduction project Efficiency project
Notable performance on environment and climate change issues (e.g. site activities for GHG reduction and product design that contributes to energy efficiency) and prevention of environmental incidents are reflected on the annual performance evaluation of Business Units
Executive officer Monetary reward
Emissions reduction project Energy reduction project Efficiency project Behaviour change related indicator
Notable performance on environment and climate change issues (e.g. site activities for GHG reduction and product design that contributes to energy efficiency) and prevention of environmental incidents are reflected on the annual performance evaluation of Business Units
Environment/Sustainability managers
Monetary reward
Emissions reduction project Emissions reduction target Energy reduction project Energy reduction target Efficiency project Efficiency target Behaviour change related indicator
Notable performance on environment and climate change issues (e.g. site activities for GHG reduction and product design that contributes to energy efficiency) and prevention of environmental incidents are reflected on the annual performance evaluation of Business Units
Further Information

VESTEL ELECTRONICS is continue to impelement TPM (Total Productive Maintenance) program and was awarded by Japan Institute of Plant Maintenance at the end of 2012. In the framework of this program , Vestel slogan comes from the fact that Vestel is friend to its employees, customers,suppliers, share holders, the community and beyond all, mother earth. Vestel Electronics started TPM program to avoid any sacrifice of quality while remaining competitive. In accordance with this aims, Vestel mainly focused on following items: Reducing number of work accidents, Increasing production capacity (OEE), Decreasing unit cost ,Increasing First time true rate, Reducing Scrap rate, Decreasing Breakdowns, Decreasing Service Call Rate, Reducing Maintenance Costs , Decreasing spare part stocks and usage cost, Improving Time to delivery, Shortening lead times on all processes, Decreasing Setup times, Becoming a benchmark plant in 5S achievement and creating a better working environment, Reducing Energy use, Increasing Number of suggestions, Reducing Environmental pollution, Reducing Consumable material usage. These aims can serve reducing carbon disclosure;directly or indirectly. In order to reach these goals, VESTEL builds up 9 committees and Suggestion and Appreciation System all around the factory. Then,VESTEL identified and set the rules for evaluation and awarding. The TPM excellence and TPM excellence continuity award of VESTEL can be seen attached.
Attachments
https://www.cdp.net/sites/2015/59/21159/Climate Change 2015/Shared Documents/Attachments/ClimateChange2015/CC1.Governance/TS EN ISO 14001_Environmental Management System Certificate.pdf https://www.cdp.net/sites/2015/59/21159/Climate Change 2015/Shared Documents/Attachments/ClimateChange2015/CC1.Governance/TS EN ISO 50001_Energy Management System Certificate.pdf https://www.cdp.net/sites/2015/59/21159/Climate Change 2015/Shared Documents/Attachments/ClimateChange2015/CC1.Governance/Vestel_TPM_Excellence Award_Certificate.jpg https://www.cdp.net/sites/2015/59/21159/Climate Change 2015/Shared Documents/Attachments/ClimateChange2015/CC1.Governance/TS 18001_Labour Health and Safety Certificate.pdf https://www.cdp.net/sites/2015/59/21159/Climate Change 2015/Shared Documents/Attachments/ClimateChange2015/CC1.Governance/TS EN ISO 9001_Quality Management System Certificate.pdf https://www.cdp.net/sites/2015/59/21159/Climate Change 2015/Shared Documents/Attachments/ClimateChange2015/CC1.Governance/Vestel_TPM_Excellence_Award_Certificate2.jpg https://www.cdp.net/sites/2015/59/21159/Climate Change 2015/Shared Documents/Attachments/ClimateChange2015/CC1.Governance/TS ISO IEC 27001_Information Security Management System Certificate.pdf
Page: CC2. Strategy
CC2.1
Please select the option that best describes your risk management procedures with regard to climate change risks and opportunities
Integrated into multi-disciplinary company wide risk management processes
CC2.1a

Please provide further details on your risk management procedures with regard to climate change risks and opportunities
Frequency
of monitoring
To whom are results
reported?
Geographical areas
considered
How far into
the future are risks
considered?
Comment
Annually
Board or individual/sub-set of the Board or committee appointed by the Board
The assessment of risks is mainly relying on monitoring of environmental data related to climate change in domestic and external markets.
> 6 years
(i)Zorlu Holding's Corporate Risk Management Department commenced -at first quarter of 2012- its operations as support. In this context, to be effective for all of the associated companies operating within Zorlu Holding, Zorlu Risk Policy;Procedure and Enterprise Risk Management , Key Risk Criteria framework was prepared. Studies as well as the evaluation of 9 risk item financial risks, operational, environmental technological, etc. are included in the risk management system. (ii)Periodical "Vestel Search Conference" is done once a 5 years with participation of board members and employees from different levels and attendies evaluate long term risks and opportunities for future of Vestel by workshops.
CC2.1b
Please describe how your risk and opportunity identification processes are applied at both company and asset level
The risk management procedure related to climate change risks and opportunities basically involves consideration of regulatory and reputational risks, which may have the highest impact on the demand for our products (prioritization criteria). The procedure is mostly influenced by the climate change awareness among the top-level management and the requests/feedback of our consumers and retailers concentrating more on climate change/energy efficiency related performance. The assessment of risks is mainly relying on monitoring of environmental data related to climate change such as GHG emissions and emission intensity (i.e. GHG emissions per product) which is being collected and processed by the Management Systems unit. Zorlu Risk Management Group and Chief of Management Systems regularly report to the responsible executive board member and observed risks (if any) are being discussed by the Board and actions are being defined by the top management. Physical risks (risks/opportunities at an asset level) are also assessed by Zorlu Risk Management Group and related departments like IT,Maintenance&Investment etc..They continuously evaluate Vestel factory and office facilities.
CC2.1c

How do you prioritize the risks and opportunities identified?
The major environmental and energy performance reporting including performance related to climate change is done by our ISO 14001 Environmental Management representative and ISO 50001 Energy Management Representative at the annual screening meeting. However, chief of Management Systems and Facility Energy Manager have continuous and direct communication with the responsible executive board member for matters that require earlier consideration. There also the Audit Committee, operating under Zorlu Holding, implementing audits also on our environmental and energy performance, which identifies any problems related to environmental compliance and implementation of environmental strategy. Included in the collected environmental data, the GHG emissions data is presented with Scope 1, Scope 2 and Scope 3 emissions. , Zorlu Holding's Corporate Risk Management Department commenced -at first quarter of 2012- its operations as support. In this context, to be effective for all of the associated companies operating within Zorlu Holding, Zorlu Risk Policy;Procedure and Enterprise Risk Management framework was prepared. Studies as well as the evaluation of financial risks, operational, environmental technological, etc. are included in the non-financial risks.
CC2.1d
Please explain why you do not have a process in place for assessing and managing risks and opportunities from climate change, and whether you plan to introduce such a process in future
Main reason for not having a process
Do you plan to introduce a process?
Comment
CC2.2
Is climate change integrated into your business strategy?
Yes
CC2.2a
Please describe the process of how climate change is integrated into your business strategy and any outcomes of this process
Having received significant attention of governments, investors and also individuals over the last decades, the risks associated with the climate change are inevitably affecting the manufacturing industry as well as all industries, although the risks are assumed not to have considerably higher impacts as in the case of energy sector and/or energy intensive industries. As Vestel Electronics, we are placing ‘environmental sustainability’ and decreasing the ecological footprint of our products at the core of our business strategy. Furthermore, as being the manufacturer of high technology energy efficient products, which help our consumers to actually reduce
their footprint, we have increased awareness on the impacts of climate change on our business. Climate drivers are important factors that we pay attention in building our broad company strategy that addresses; •Caring for the environment and climate starting from the designing phase of our products to the manufacturing phase •Prioritizing investment and expansion in manufacturing of the most energy efficient products in our production portfolio •Increasing RD activities and dedicated budget for developing new production methodologies and products with decreased ecological footprint •Continuously looking for opportunities to reduce waste and enable use of materials suitable for reuse and recycle • Promoting use of new technologies to save energy and to boost energy efficiency in all operations •Raising employees’ and consumers’ awareness on environmental protection and energy efficiency •Ensuring effective communication to stakeholders and proper disclosure of environmental and climate performance The basic influence of climate change in our strategy is that we have taken the first step in preparing our company for the impacts by working on understanding how our business activities and investments are affected by climate change and preparing the infrastructure to make it a part of our management culture also by identifying the interdependencies between climate change risks and other risks relevant to our company. Investing in R&D has always been valued by our company, and R&D that is directed to serving for eliminating climate risks, such as developing practices and/or products that improve efficiency and/or eliminate emissions both on the production side and on the consumer side, has become our leading strategy. While building our climate strategy, in the short term, we have started by quantifying our emissions broadly and we are planning to prepare a detailed carbon emission inventory and seek for third party verification. In the medium term, we will also be identifying and quantifying the carbon impacts along our value chain. In the long terms we will be planning for putting targets related to our climate performance. On the product end, our strategy has basically led to manufacturing of Energy Class A TVs and to our decision in expanding business in manufacturing of LED TVs&eco TVs and LED lightings in 2014 by increasing our production capacity. We also spared an unlimited R&D budget for developing products with improved environmental performance. Vestel Electronics, which is already a strong market player, is gaining distinctive competency through implementation of its business strategy, which enables our company to be the manufacturer of most energy efficient products with decreased ecological footprint, which are being preferred by the environmentally conscious consumers, who are increasing with a sharp pace.
CC2.2b
Please explain why climate change is not integrated into your business strategy
CC2.2c
Does your company use an internal price of carbon?
No, and we currently don't anticipate doing so in the next 2 years
CC2.2d
Please provide details and examples of how your company uses an internal price of carbon

CC2.3
Do you engage in activities that could either directly or indirectly influence public policy on climate change through any of the following? (tick all that apply)
Direct engagement with policy makers Trade associations
CC2.3a
On what issues have you been engaging directly with policy makers?
Focus of legislation
Corporate Position
Details of engagement
Proposed legislative solution
Energy efficiency
Support
We are engaging with policy makers, i.e. Ministry of Environment and Urbanisation, Ministry of Energy and Natural Sources, Ministry of Science, Industry and Technology as an individual company as well as with trade associations. During the EU energy labeling adaptation process in Turkey, Vestel shared its opinions with Ministry of Science, Industry and Technology.
Energy Labeling Regulation is completely supported by Vestel.
Other: Support
We are engaging with Turkish Standards Institution via Mirror Committees. Because Turkish Standards Institution is a member of International Organization for Standardization (ISO), and the International Electrotechnical Commission (IEC) on 26 May 1955 and 1 January 1956 respectively, we as Vestel Electronics directly influence the consumer products, energy consumption and environment related standards.
As a major player, by joining Mirror Committees, we support the creation and improvement of the standards.
CC2.3b
Are you on the Board of any trade associations or provide funding beyond membership?
Yes
CC2.3c
Please enter the details of those trade associations that are likely to take a position on climate change legislation

Trade association
Is your position
on climate change
consistent with
theirs?
Please explain the trade association's position
How have you, or are you attempting to, influence the position?
TESİD Consistent
The Electronic Industries in Turkey are organized in an independent association in order to deal with the common interests of the individual companies. In 2000, due to rapid changes in the high tech industry TESID has decided to widen its scope and include software houses and telecom operators accordingly. MISSION: Leading the Turkish Electronics Industry, Information Technologies and related service sectors towards continuous competitiveness and increasing its contributions to the national economy and the people. VISION: 1. Encouraging and supporting technological creativity to achieve a common goal among universities, industry and the government so that competitive, flexible, productive and high quality goods and services are produced. 2. To support: b) the development of a modern, globally competitive electronics industry. c) the expansion of capacity and productivity as well as the enchancement of the investment opportunities of the industry. d) the improvement of the standard of living of employees, for greater employee satisfaction. 3. Concerning policies, strategies, standards and development within the electronics industry. 4. Supporting the Electronics Industry to develop into a strong, environmentally aware, safety conscious establishment that is an overall positive contributor to the community.
Supporting the Electronics Industry to develop into a strong, environmentally aware, safety conscious establishment that is an overall positive contributor to the community.
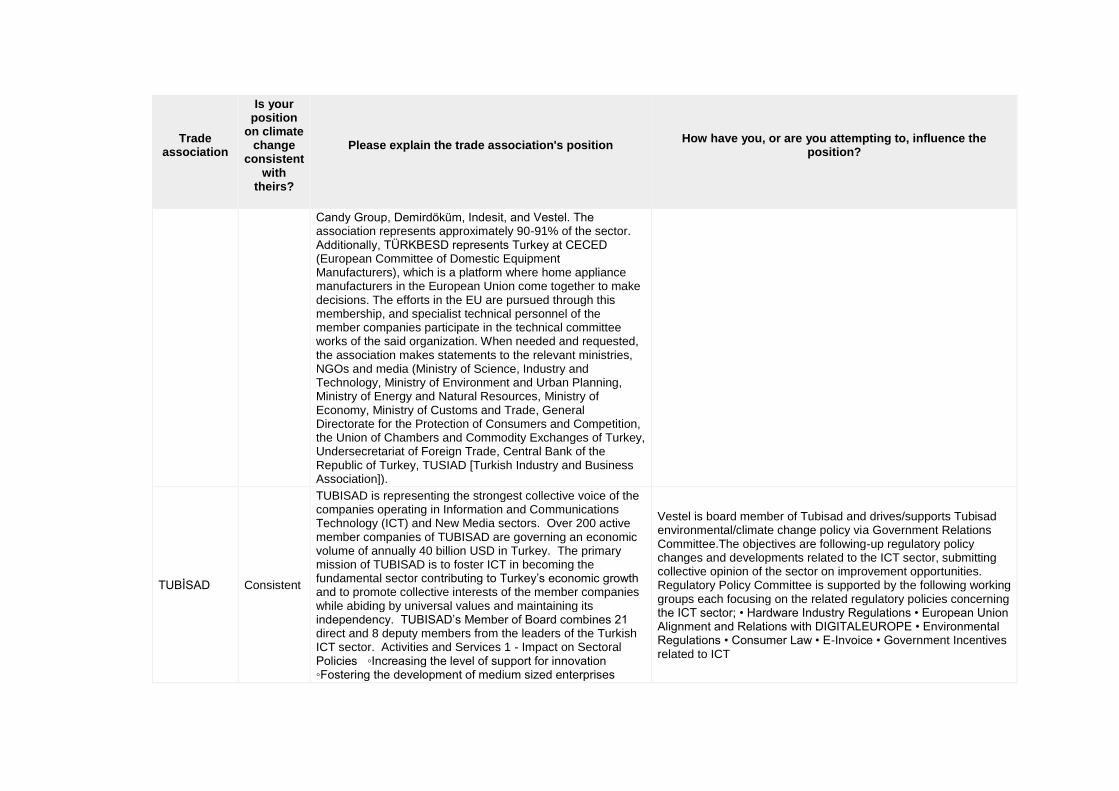
TÜRKBESD Consistent
White Goods Manufacturers’ Association of Turkey, whose acronym is TÜRKBESD, was established in 1986 as White Goods Manufacturers’ Association (BESD) by the leading white goods companies of the sector. In 1999, following its membership to the European Union’s senior organization of the field CECED (European Committee of Domestic Equipment Manufacturers), the association received permission to use “Turkey” in its name through a Cabinet of Ministers decree, and changed its name to White Goods Manufacturers’ Association of Turkey (TÜRKBESD). Currently, the association has six members: Arçelik, B/S/H,
Vestel is one of the board members of TURKBESD and works close with other members to drive TURKBESD policies related with energy efficiency, environmental compliance regulations. For instance, recent studies are about the determining control and collect methods of waste electrical and electronic equipments via directives such as AEEE.
Trade association
Is your position
on climate change
consistent with
theirs?
Please explain the trade association's position
How have you, or are you attempting to, influence the position?
Candy Group, Demirdöküm, Indesit, and Vestel. The association represents approximately 90-91% of the sector. Additionally, TÜRKBESD represents Turkey at CECED (European Committee of Domestic Equipment Manufacturers), which is a platform where home appliance manufacturers in the European Union come together to make decisions. The efforts in the EU are pursued through this membership, and specialist technical personnel of the member companies participate in the technical committee works of the said organization. When needed and requested, the association makes statements to the relevant ministries, NGOs and media (Ministry of Science, Industry and Technology, Ministry of Environment and Urban Planning, Ministry of Energy and Natural Resources, Ministry of Economy, Ministry of Customs and Trade, General Directorate for the Protection of Consumers and Competition, the Union of Chambers and Commodity Exchanges of Turkey, Undersecretariat of Foreign Trade, Central Bank of the Republic of Turkey, TUSIAD [Turkish Industry and Business Association]).
TUBİSAD Consistent
TUBISAD is representing the strongest collective voice of the companies operating in Information and Communications Technology (ICT) and New Media sectors. Over 200 active member companies of TUBISAD are governing an economic volume of annually 40 billion USD in Turkey. The primary mission of TUBISAD is to foster ICT in becoming the fundamental sector contributing to Turkey’s economic growth and to promote collective interests of the member companies while abiding by universal values and maintaining its independency. TUBISAD’s Member of Board combines 21 direct and 8 deputy members from the leaders of the Turkish ICT sector. Activities and Services 1 - Impact on Sectoral Policies ◦Increasing the level of support for innovation ◦Fostering the development of medium sized enterprises
Vestel is board member of Tubisad and drives/supports Tubisad environmental/climate change policy via Government Relations Committee.The objectives are following-up regulatory policy changes and developments related to the ICT sector, submitting collective opinion of the sector on improvement opportunities. Regulatory Policy Committee is supported by the following working groups each focusing on the related regulatory policies concerning the ICT sector; • Hardware Industry Regulations • European Union Alignment and Relations with DIGITALEUROPE • Environmental Regulations • Consumer Law • E-Invoice • Government Incentives related to ICT

Trade association
Is your position
on climate change
consistent with
theirs?
Please explain the trade association's position
How have you, or are you attempting to, influence the position?
◦Facilitating standardization of regulations imposed on taxation and foreign trade and auditing of compliance with them ◦Advocating widespread compliance with the copyright protection laws ◦Increasing the number of public services offered via electronic platforms ◦Supporting environment-friendly technologies 2 - Increasing Publicity and Awareness about the Sector ◦Creating awareness about the economic importance of the sector ◦Announcing nationwide and international success stories ◦Communicating collective objectives of the sector ◦Building strong relationships with the local and foreign press 3 - Sectoral Growth and Profitability ◦Development of local value added solutions and services ◦Launching sectoral standards, certification programmes and regulations ◦Fostering high quality in education and employment ◦Establishing proper conditions for fair competition ◦Fostering export sales of technological products and services ◦Enabling collaboration and information sharing among companies in sector 4 - Center for Reliable Commercial and Intellectual Information ◦Reliable sectoral data creation and sharing ◦Performing sectoral data analysis and market research ◦Informing the society about sectoral trends and estimates
EU Trade Associations
Consistent
Vestel Electronics has membership on Trade Associations of some European countries via its sales offices i.e. Vestel Germany, Vestel UK, Vestel France, Vestel Italy, Vestel Iberia which are located in these countries.
We are engaging with European countries' policy makers by sharing our comments via Vestel sales offices.
CECED Consistent Vestel Electronics has membership on CECED (The European Committee of Domestic Equipment Manufacturer ).The membership type is direct membership.
Vestel is one of the direct members of CECED and works close with other members to drive CECED policies related with energy efficiency, environmental compliance regulations.
CC2.3d
Do you publicly disclose a list of all the research organizations that you fund?
CC2.3e
Do you fund any research organizations to produce or disseminate public work on climate change?
CC2.3f
Please describe the work and how it aligns with your own strategy on climate change
CC2.3g
Please provide details of the other engagement activities that you undertake
CC2.3h
What processes do you have in place to ensure that all of your direct and indirect activities that influence policy are consistent with your overall climate change strategy?
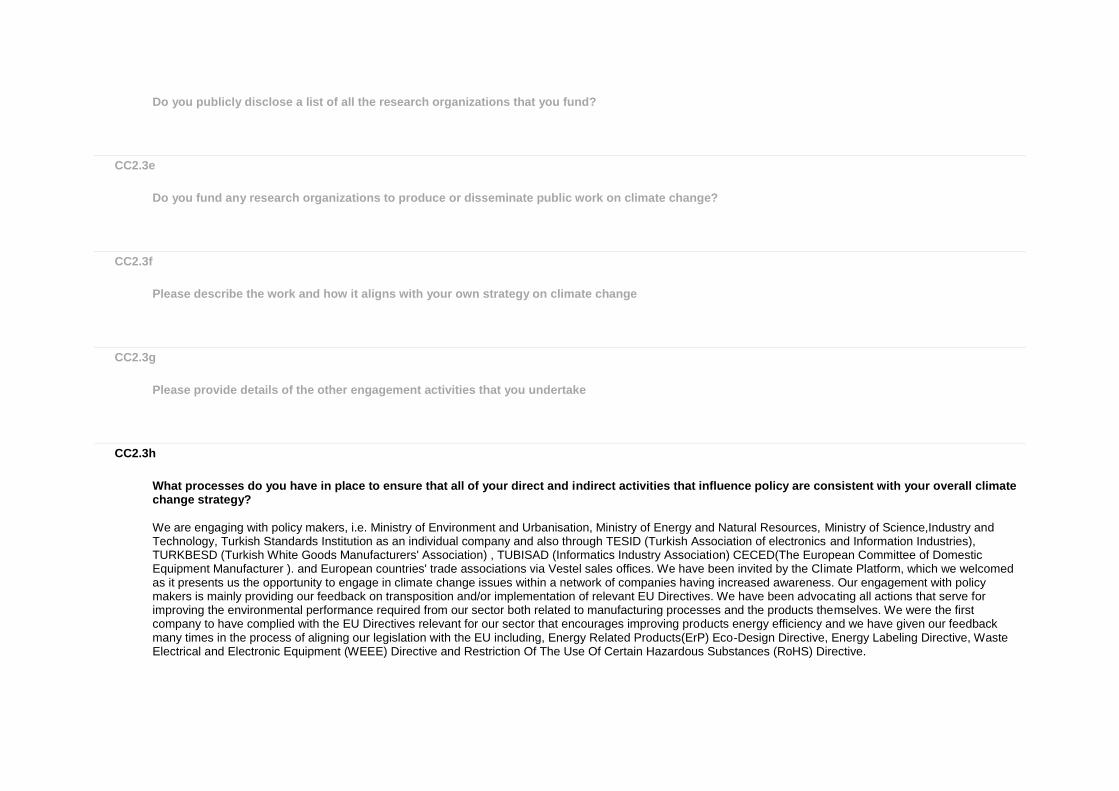
We are engaging with policy makers, i.e. Ministry of Environment and Urbanisation, Ministry of Energy and Natural Resources, Ministry of Science,Industry and Technology, Turkish Standards Institution as an individual company and also through TESID (Turkish Association of electronics and Information Industries), TURKBESD (Turkish White Goods Manufacturers' Association) , TUBISAD (Informatics Industry Association) CECED(The European Committee of Domestic Equipment Manufacturer ). and European countries' trade associations via Vestel sales offices. We have been invited by the Climate Platform, which we welcomed as it presents us the opportunity to engage in climate change issues within a network of companies having increased awareness. Our engagement with policy makers is mainly providing our feedback on transposition and/or implementation of relevant EU Directives. We have been advocating all actions that serve for improving the environmental performance required from our sector both related to manufacturing processes and the products themselves. We were the first company to have complied with the EU Directives relevant for our sector that encourages improving products energy efficiency and we have given our feedback many times in the process of aligning our legislation with the EU including, Energy Related Products(ErP) Eco-Design Directive, Energy Labeling Directive, Waste Electrical and Electronic Equipment (WEEE) Directive and Restriction Of The Use Of Certain Hazardous Substances (RoHS) Directive.
CC2.3i
Please explain why you do not engage with policy makers
CC2.4
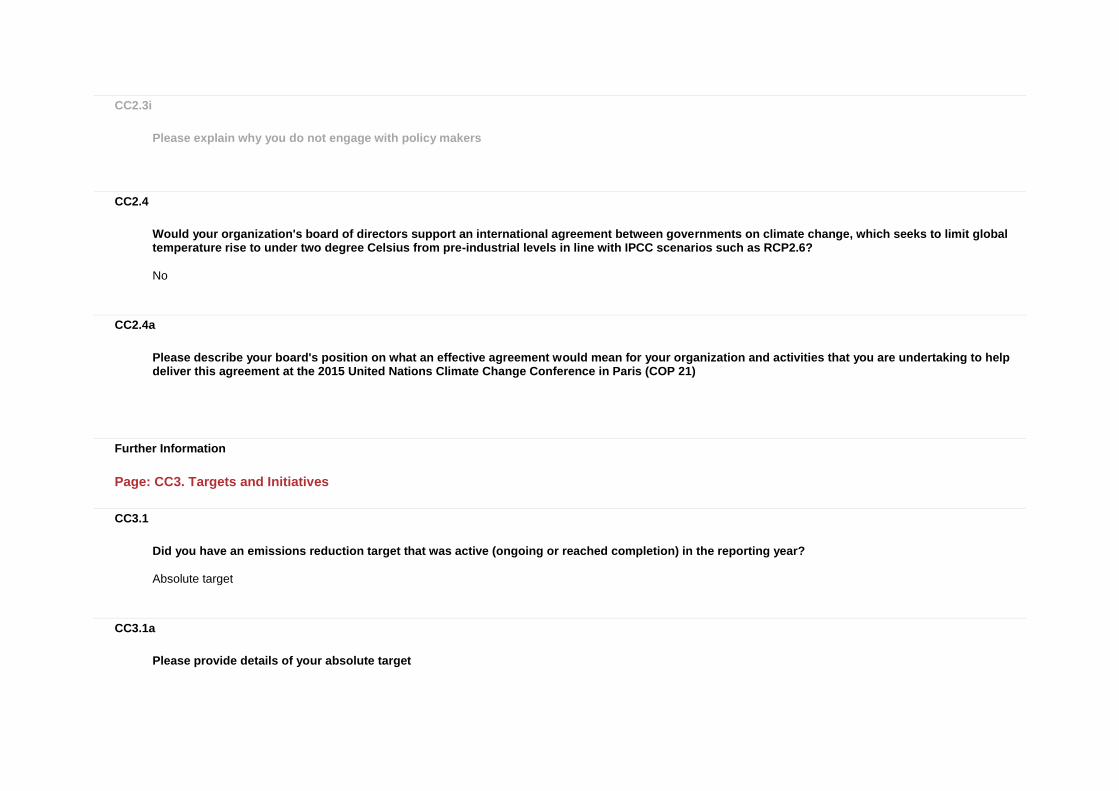
Would your organization's board of directors support an international agreement between governments on climate change, which seeks to limit global temperature rise to under two degree Celsius from pre-industrial levels in line with IPCC scenarios such as RCP2.6?
No
CC2.4a
Please describe your board's position on what an effective agreement would mean for your organization and activities that you are undertaking to help deliver this agreement at the 2015 United Nations Climate Change Conference in Paris (COP 21)
Further Information
Page: CC3. Targets and Initiatives
CC3.1
Did you have an emissions reduction target that was active (ongoing or reached completion) in the reporting year?
Absolute target
CC3.1a
Please provide details of your absolute target
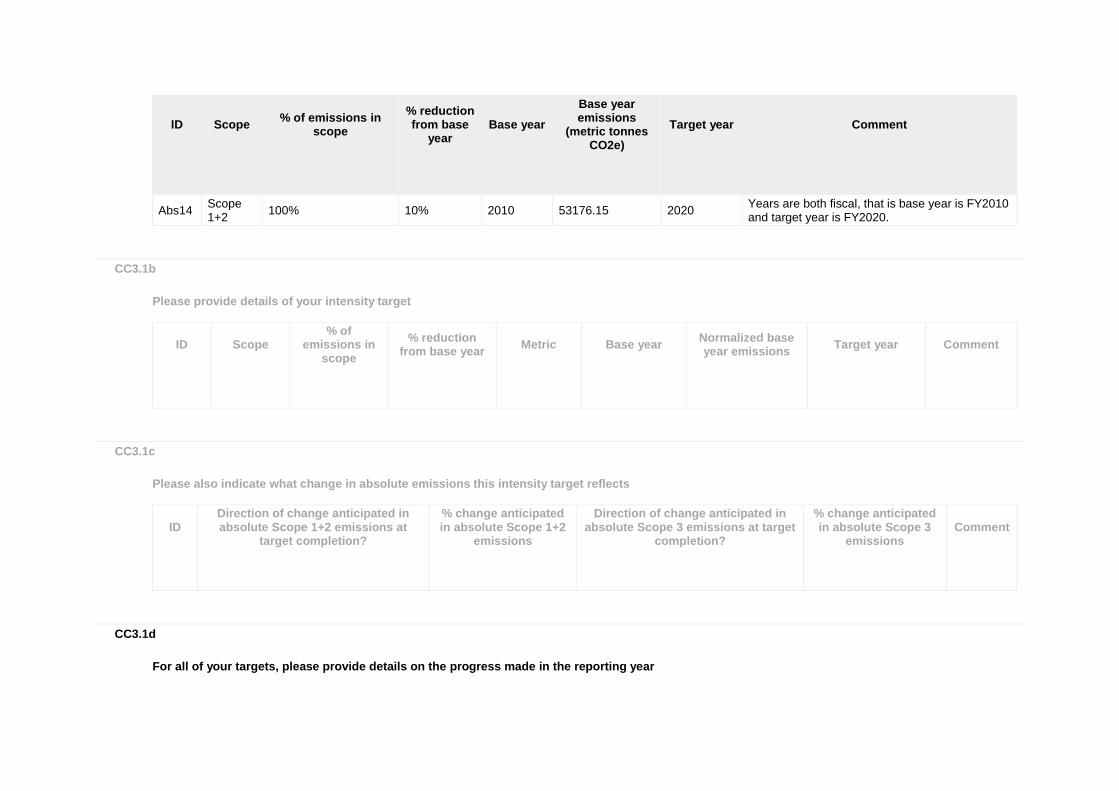
ID
Scope
% of emissions in scope
% reduction from base
year
Base year
Base year emissions
(metric tonnes CO2e)
Target year
Comment
Abs14 Scope 1+2
100% 10% 2010 53176.15 2020 Years are both fiscal, that is base year is FY2010 and target year is FY2020.
CC3.1b
Please provide details of your intensity target
ID
Scope
% of emissions in
scope
% reduction from base year
Metric
Base year
Normalized base year emissions
Target year
Comment
CC3.1c
Please also indicate what change in absolute emissions this intensity target reflects
ID
Direction of change anticipated in absolute Scope 1+2 emissions at
target completion?
% change anticipated in absolute Scope 1+2
emissions
Direction of change anticipated in absolute Scope 3 emissions at target
completion?
% change anticipated in absolute Scope 3
emissions
Comment
CC3.1d
For all of your targets, please provide details on the progress made in the reporting year
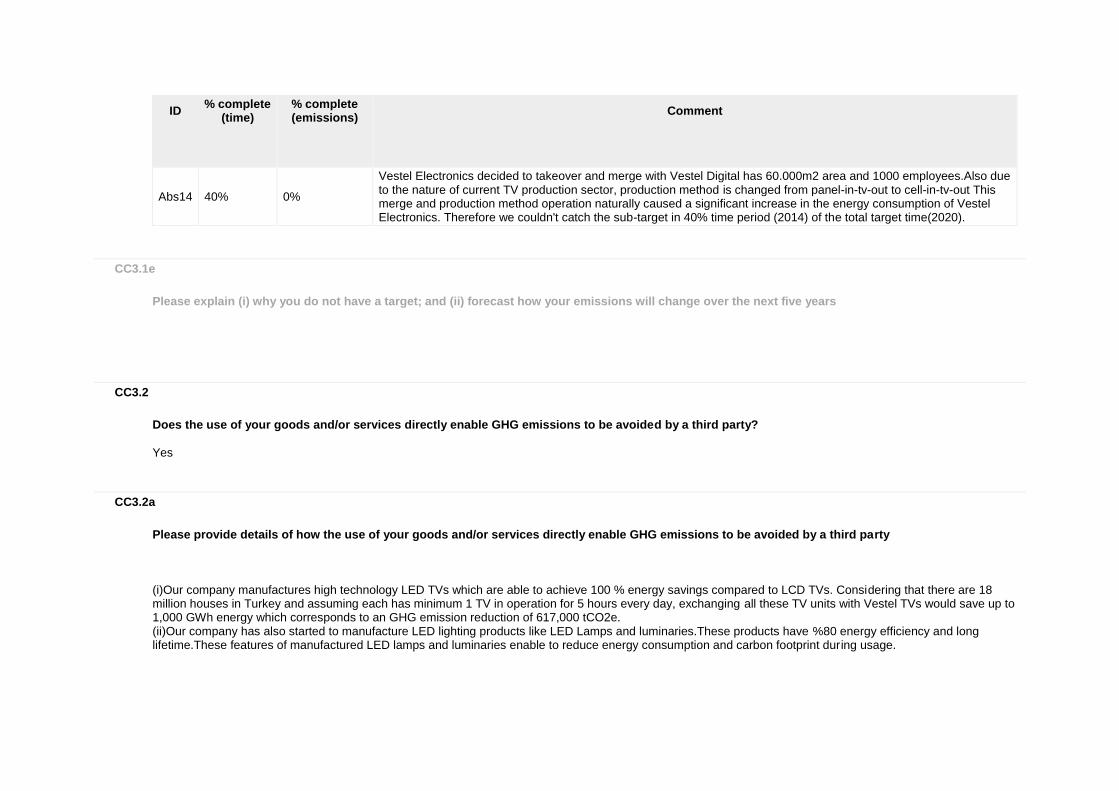
ID
% complete (time)
% complete (emissions)
Comment
Abs14 40% 0%
Vestel Electronics decided to takeover and merge with Vestel Digital has 60.000m2 area and 1000 employees.Also due to the nature of current TV production sector, production method is changed from panel-in-tv-out to cell-in-tv-out This merge and production method operation naturally caused a significant increase in the energy consumption of Vestel Electronics. Therefore we couldn't catch the sub-target in 40% time period (2014) of the total target time(2020).
CC3.1e
Please explain (i) why you do not have a target; and (ii) forecast how your emissions will change over the next five years
CC3.2
Does the use of your goods and/or services directly enable GHG emissions to be avoided by a third party?
Yes
CC3.2a
Please provide details of how the use of your goods and/or services directly enable GHG emissions to be avoided by a third party
(i)Our company manufactures high technology LED TVs which are able to achieve 100 % energy savings compared to LCD TVs. Considering that there are 18 million houses in Turkey and assuming each has minimum 1 TV in operation for 5 hours every day, exchanging all these TV units with Vestel TVs would save up to 1,000 GWh energy which corresponds to an GHG emission reduction of 617,000 tCO2e. (ii)Our company has also started to manufacture LED lighting products like LED Lamps and luminaries.These products have %80 energy efficiency and long lifetime.These features of manufactured LED lamps and luminaries enable to reduce energy consumption and carbon footprint during usage.
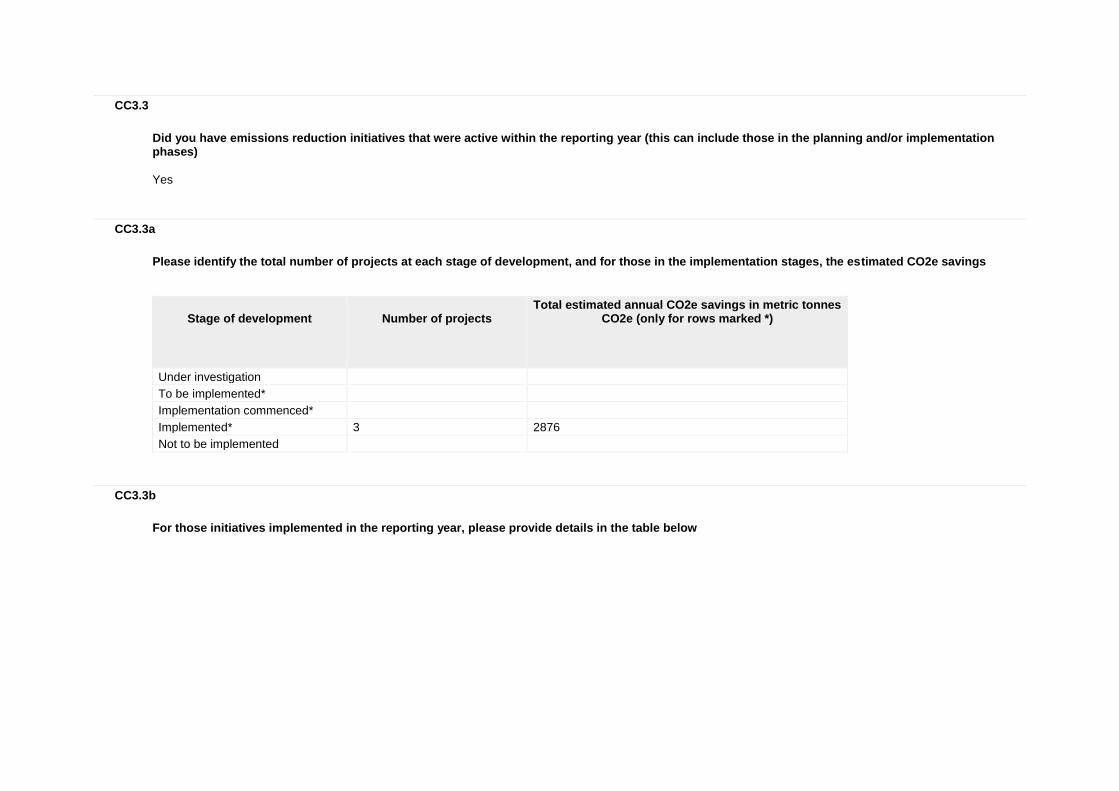
CC3.3
Did you have emissions reduction initiatives that were active within the reporting year (this can include those in the planning and/or implementation phases)
Yes
CC3.3a
Please identify the total number of projects at each stage of development, and for those in the implementation stages, the estimated CO2e savings
Stage of development
Number of projects
Total estimated annual CO2e savings in metric tonnes CO2e (only for rows marked *)
Under investigation
To be implemented*
Implementation commenced*
Implemented* 3 2876
Not to be implemented
CC3.3b
For those initiatives implemented in the reporting year, please provide details in the table below
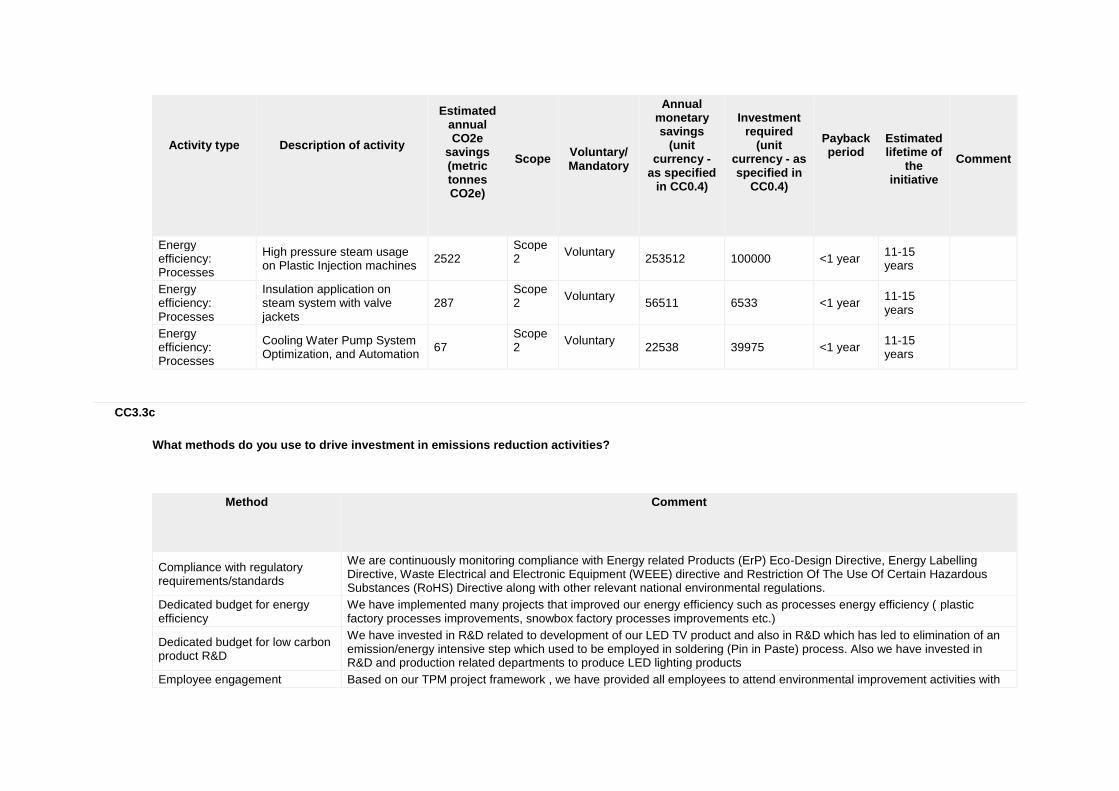
Activity type
Description of activity
Estimated annual CO2e
savings (metric tonnes CO2e)
Scope
Voluntary/ Mandatory
Annual monetary savings
(unit currency -
as specified in CC0.4)
Investment required
(unit currency - as specified in
CC0.4)
Payback period
Estimated lifetime of
the initiative
Comment
Energy efficiency: Processes
High pressure steam usage on Plastic Injection machines
2522 Scope 2
Voluntary
253512 100000 <1 year 11-15 years
Energy efficiency: Processes
Insulation application on steam system with valve jackets
287 Scope 2
Voluntary
56511 6533 <1 year 11-15 years
Energy efficiency: Processes
Cooling Water Pump System Optimization, and Automation
67 Scope 2
Voluntary
22538 39975 <1 year 11-15 years
CC3.3c
What methods do you use to drive investment in emissions reduction activities?
Method
Comment
Compliance with regulatory requirements/standards
We are continuously monitoring compliance with Energy related Products (ErP) Eco-Design Directive, Energy Labelling Directive, Waste Electrical and Electronic Equipment (WEEE) directive and Restriction Of The Use Of Certain Hazardous Substances (RoHS) Directive along with other relevant national environmental regulations.
Dedicated budget for energy efficiency
We have implemented many projects that improved our energy efficiency such as processes energy efficiency ( plastic factory processes improvements, snowbox factory processes improvements etc.)
Dedicated budget for low carbon product R&D
We have invested in R&D related to development of our LED TV product and also in R&D which has led to elimination of an emission/energy intensive step which used to be employed in soldering (Pin in Paste) process. Also we have invested in R&D and production related departments to produce LED lighting products
Employee engagement Based on our TPM project framework , we have provided all employees to attend environmental improvement activities with

Method
Comment
suggestion evaluation and appreciation recognazition system which has over 1.000.000 TRY investment cost and it will continue untill 2020.
CC3.3d
If you do not have any emissions reduction initiatives, please explain why not
Further Information
Attachments
https://www.cdp.net/sites/2015/59/21159/Climate Change 2015/Shared Documents/Attachments/ClimateChange2015/CC3.TargetsandInitiatives/Vestel Elektronik-Energy Saving Projects.pdf
Page: CC4. Communication
CC4.1
Have you published information about your organization’s response to climate change and GHG emissions performance for this reporting year in places other than in your CDP response? If so, please attach the publication(s)
Publication
Status
Page/Section reference
Attach the document
In voluntary communications Underway - previous year
pg.149-167 https://www.cdp.net/sites/2015/59/21159/Climate Change 2015/Shared Documents/Attachments/CC4.1/ZORLU HOLDİNG 2014.pdf

Publication
Status
Page/Section reference
Attach the document
attached
In mainstream financial reports in accordance with the CDSB Framework
Complete pg.46-51 https://www.cdp.net/sites/2015/59/21159/Climate Change 2015/Shared Documents/Attachments/CC4.1/vestel_elektronik_faaliyet raporu2014.pdf
In other regulatory filings Complete pg.2-3 https://www.cdp.net/sites/2015/59/21159/Climate Change 2015/Shared Documents/Attachments/CC4.1/Enerji Tüketim Bildirim Formu_2014.pdf
Further Information
Module: Risks and Opportunities
Page: CC5. Climate Change Risks
CC5.1
Have you identified any inherent climate change risks that have the potential to generate a substantive change in your business operations, revenue or expenditure? Tick all that apply
Risks driven by changes in regulation Risks driven by changes in physical climate parameters Risks driven by changes in other climate-related developments
CC5.1a
Please describe your inherent risks that are driven by changes in regulation

Risk driver
Description
Potential impact
Timeframe
Direct/ Indirec
t
Likelihood
Magnitude of
impact
Estimated financial
implications
Management method
Cost of management
Fuel/energy taxes and regulations
We may be exposed to the risk of carbon taxes via our suppliers operating in certain parts of the world, where these taxes expected in the near future.
Increased operational cost
Unknown Indirect (Supply chain)
More likely than not
Medium-high
%10 of reveneu
Following and Managing of domestic and worldwide regulations, Zorlu Risk Management Group
Department and consultancy costs
Product efficiency regulations and standards
If we fail to comply with the product efficiency regulations and standards required for selling our products to EU and Domestic Market, there is a risk for us to loose 95% of our market.
Reduced demand for goods/services
Up to 1 year
Direct Very unlikely
High loose %95 of market
Following and Managing of domestic and worldwide regulations, Zorlu Risk Management Group, powerfull R&D
Department,research&development and consultancy costs

Risk driver
Description
Potential impact
Timeframe
Direct/ Indirec
t
Likelihood
Magnitude of
impact
Estimated financial
implications
Management method
Cost of management
Product labelling regulations and standards
If we fail to comply with the product efficiency regulations and standards required for selling our products to EU and Domestic Market, there is a risk for us to loose 95% of our market.
Reduced demand for goods/services
Up to 1 year
Direct Very unlikely
High loose %95 of market
Following and Managing of domestic and worldwide regulations, Zorlu Risk Management Group, powerfull R&D
Department,research&development and consultancy costs
CC5.1b
Please describe your inherent risks that are driven by change in physical climate parameters
Risk driver
Description
Potential impact
Timeframe
Direct/ Indirec
t
Likelihood
Magnitude of
impact
Estimated financial
implications
Management
method
Cost of management
Change in temperatur
Reduced equipment
Increased operational cost
1 to 3 years
Direct Unlikely Low-medium
%10 equipment
TPM(Total Productive
Department and consultancy costs
Risk driver
Description
Potential impact
Timeframe
Direct/ Indirec
t
Likelihood
Magnitude of
impact
Estimated financial
implications
Management
method
Cost of management
e extremes efficiency due to temperature extremes may affect our manufacturing performance and/or increase our air conditioning costs.
costs Maintenance) project
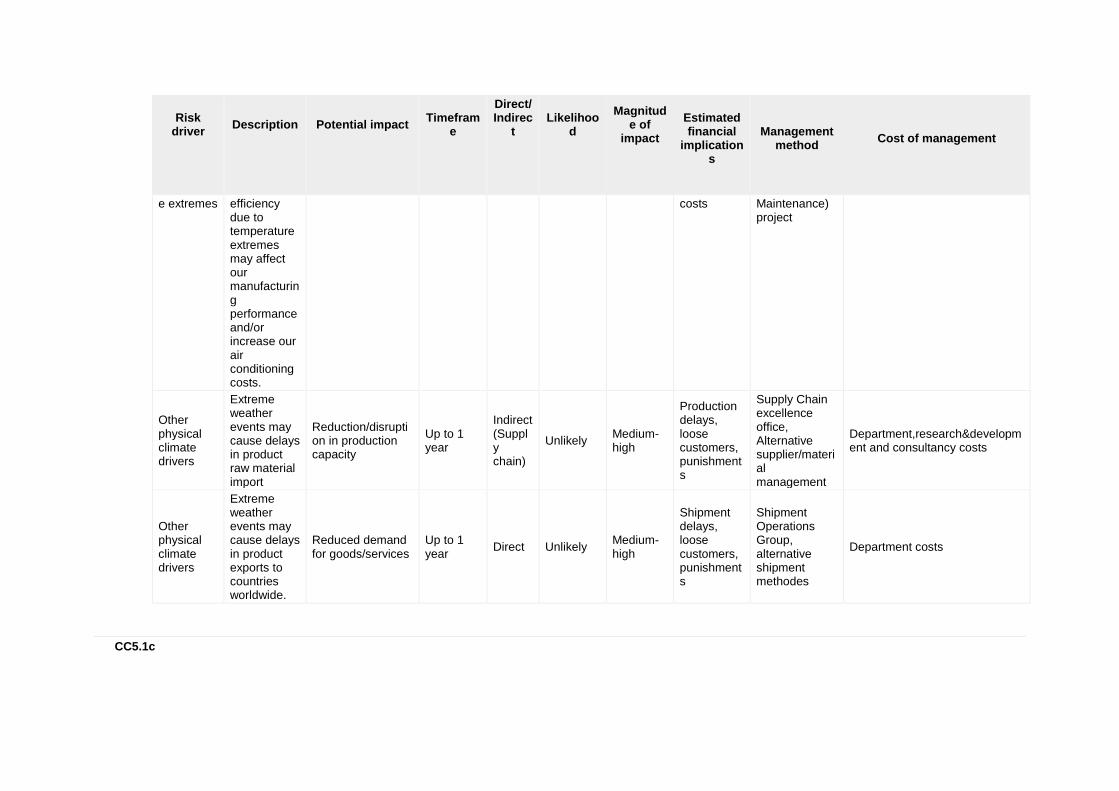
Other physical climate drivers
Extreme weather events may cause delays in product raw material import
Reduction/disruption in production capacity
Up to 1 year
Indirect (Supply chain)
Unlikely Medium-high
Production delays, loose customers, punishments
Supply Chain excellence office, Alternative supplier/material management
Department,research&development and consultancy costs
Other physical climate drivers
Extreme weather events may cause delays in product exports to countries worldwide.
Reduced demand for goods/services
Up to 1 year
Direct Unlikely Medium-high
Shipment delays, loose customers, punishments
Shipment Operations Group, alternative shipment methodes
Department costs
CC5.1c

Please describe your inherent risks that are driven by changes in other climate-related developments
Risk driver
Description
Potential impact
Timeframe
Direct/ Indirec
t
Likelihood
Magnitude of
impact
Estimated financial
implications
Management
method
Cost of management
Changing consumer behaviour
Any failure related to implementation of our environment and climate friendly business strategy and reduced environmental performance in our activities may result in losing of our consumers and our market share.
Reduced demand for goods/services
Up to 1 year
Indirect (Client)
Very unlikely
Low-medium
losing of our consumers and our market share.
Following and Managing of domestic and worldwide regulations, Market researchs, Zorlu Risk Management Group, powerfull R&D
Department,research&development and consultancy costs
Reputation
Our company also sees the risk in failing to actively disclose environment and climate related performance to current and potential investors and therefore affecting our
Reduced stock price (market valuation)
Up to 1 year
Direct Very unlikely
Low-medium
reducing of stock prices
Following and Managing of domestic and worldwide regulations,transparent management, Zorlu Risk Management Group, powerfull R&D
Department,research&development and consultancy costs

Risk driver
Description
Potential impact
Timeframe
Direct/ Indirec
t
Likelihood
Magnitude of
impact
Estimated financial
implications
Management
method
Cost of management
stock prices.
CC5.1d
Please explain why you do not consider your company to be exposed to inherent risks driven by changes in regulation that have the potential to generate a substantive change in your business operations, revenue or expenditure
CC5.1e
Please explain why you do not consider your company to be exposed to inherent risks driven by physical climate parameters that have the potential to generate a substantive change in your business operations, revenue or expenditure
CC5.1f
Please explain why you do not consider your company to be exposed to inherent risks driven by changes in other climate-related developments that have the potential to generate a substantive change in your business operations, revenue or expenditure

Further Information
Page: CC6. Climate Change Opportunities
CC6.1
Have you identified any inherent climate change opportunities that have the potential to generate a substantive change in your business operations, revenue or expenditure? Tick all that apply
Opportunities driven by changes in regulation Opportunities driven by changes in physical climate parameters Opportunities driven by changes in other climate-related developments
CC6.1a
Please describe your inherent opportunities that are driven by changes in regulation
Opportunity driver
Description
Potential impact
Timeframe
Direct/Indirect
Likelihood
Magnitude of impact
Estimated financial
implications
Management
method
Cost of
management
Product efficiency regulations and standards
Our facilities will comply with the "By-Law on Energy Performance of Buildings" and will perform periodic energy audits and performance reporting according to this by-law. This will enable us to identify any
Reduced operational costs
Up to 1 year
Direct Virtually certain
Medium-high
%8 reveneu, %10 export capacity increase
We are closely monitoring such regulatory opportunities especially in the EU market, as our main market, by monitoring all upcoming regulations and standards starting from their drafting
We have invested a total of 200,000 TRY for preparing the technical and administrative infrastructure required for compliance with the EU legislation related to product efficiency and
Opportunity driver
Description
Potential impact
Timeframe
Direct/Indirect
Likelihood
Magnitude of impact
Estimated financial
implications
Management
method
Cost of
management
energy efficiency improvement.
eco-labelling.
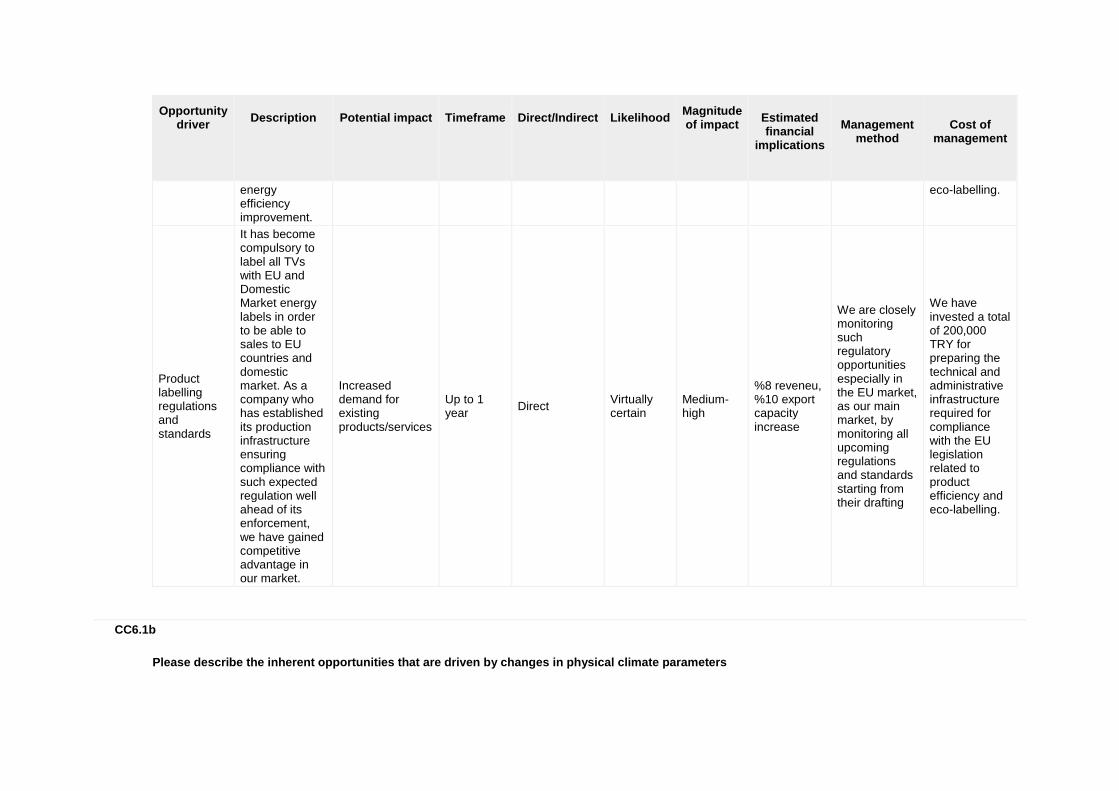
Product labelling regulations and standards
It has become compulsory to label all TVs with EU and Domestic Market energy labels in order to be able to sales to EU countries and domestic market. As a company who has established its production infrastructure ensuring compliance with such expected regulation well ahead of its enforcement, we have gained competitive advantage in our market.
Increased demand for existing products/services
Up to 1 year
Direct Virtually certain
Medium-high
%8 reveneu, %10 export capacity increase
We are closely monitoring such regulatory opportunities especially in the EU market, as our main market, by monitoring all upcoming regulations and standards starting from their drafting
We have invested a total of 200,000 TRY for preparing the technical and administrative infrastructure required for compliance with the EU legislation related to product efficiency and eco-labelling.
CC6.1b
Please describe the inherent opportunities that are driven by changes in physical climate parameters

Opportunity driver
Description
Potential impact
Timeframe
Direct/ Indirect
Likelihood
Magnitude of impact
Estimated financial
implications
Management
method
Cost of
management
Snow and ice
We have been observing an increased demand for our products during times when weather conditions encourage and/or force people to stay indoors such as snow and ice.
Increased demand for existing products/services
Unknown Indirect (Client)
Likely Medium
Potential financial implications of the opportunity are hard to determine due to uncertainty related to such physical phenomena.
Managing inventory, advertising and sales channels
Seasonal costs are like high inventory cost and advertising costs.
CC6.1c
Please describe the inherent opportunities that are driven by changes in other climate-related developments
Opportunity driver
Description
Potential impact
Timeframe
Direct/ Indirect
Likelihood
Magnitude of impact
Estimated financial
implications
Management method
Cost of
management
Changing consumer behaviour
It is observed that the consumers’ climate awareness is rising every year. As a company building its strategy upon sustainability of
Increased demand for existing products/services
Up to 1 year
Indirect (Client)
Virtually certain
High
We expect that the eco TV and LED TV market share will expand up to 98 % in 2014 and continue to increase to an estimated 100 % in
Managing regulations, research&development studies, advertising and sales channels
We have made investment worth of 50 million USD in our energy-efficient LED TV , LED Lighting, Touch screens,

Opportunity driver
Description
Potential impact
Timeframe
Direct/ Indirect
Likelihood
Magnitude of impact
Estimated financial
implications
Management method
Cost of
management
natural resources and materials in its operations, and investing in high technology helping to reduce the ecological footprint of its products, we see this as an important opportunity to drive more consumers to buying our products and continue to be an important player and keep our competitiveness in the market. Vestel Electronics is the manufacturer of Eco TVs with reduced power consumption in stand-by and operation mode and energy efficient LED TVs and LED lightings with
2015. We also expect that the share of our eco-products will be 100 % in 2015, as we observe from the buying trends, which favor eco-friendly design and energy efficiency. A review of the global market
Smartphones production plant for business expansion and our R&D investments reached up to 60 million USD in 2014 supported with our ‘unlimited R&D budget’ strategy.

Opportunity driver
Description
Potential impact
Timeframe
Direct/ Indirect
Likelihood
Magnitude of impact
Estimated financial
implications
Management method
Cost of
management
low power consumption and long lifetime.
Reputation
Positive perceptions about VESTELs carbon performance by clients, investors and the general public will enhance its brand equity in the marketplace.
Increased demand for existing products/services
Unknown Indirect (Client)
Very likely Medium
We expect that the eco TV and LED TV market share will expand up to 98 % in 2014 and continue to increase to an estimated 100 % in 2015. We also expect that the share of our eco-products will be 100 % in 2015, as we observe from the buying trends, which favor eco-friendly design and energy efficiency. A review of the global market
Managing regulations, research&development studies, advertising and sales channels
We have made investment worth of 50 million USD in our energy-efficient LED TV, LED Lighting, Touch screens, Smartphones production plant for business expansion and our R&D investments reached up to 60 million USD in 2014 supported with our ‘unlimited R&D budget’ strategy.
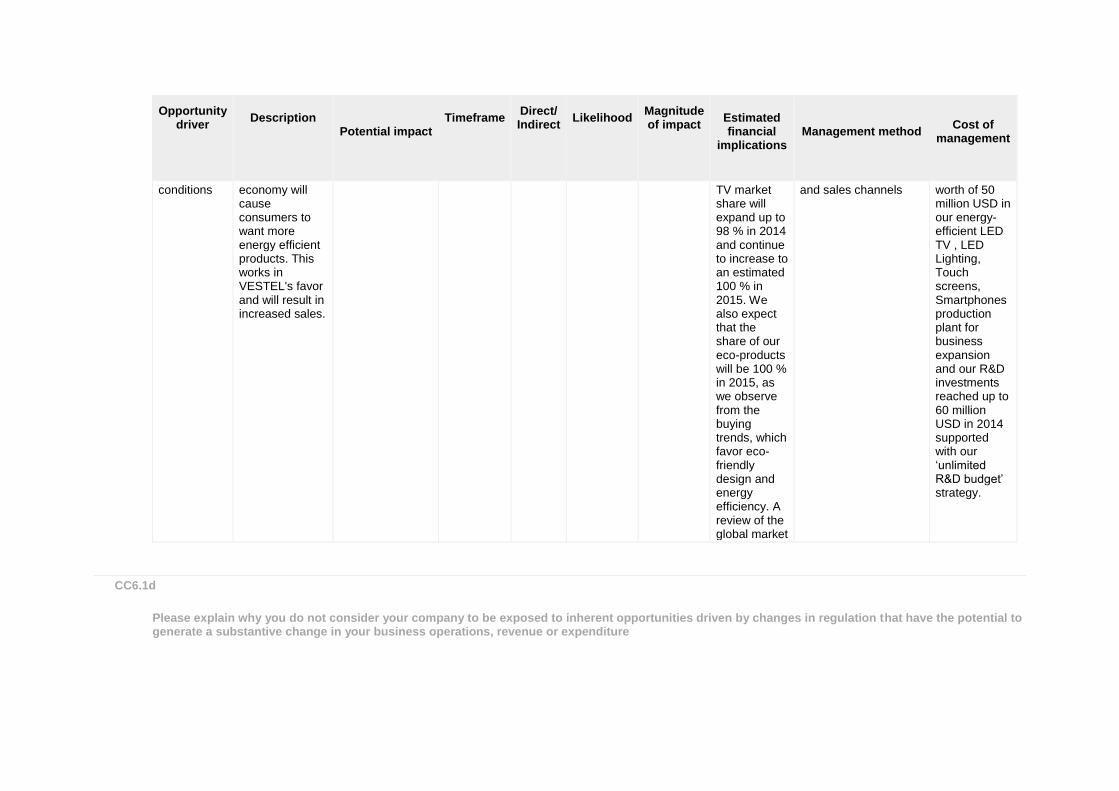
Fluctuating socio-economic
VESTEL is confident that downturns in the
Premium price opportunities
Unknown Direct Very likely Medium-high
We expect that the eco TV and LED
Managing regulations, research&development studies, advertising
We have made investment
Opportunity driver
Description
Potential impact
Timeframe
Direct/ Indirect
Likelihood
Magnitude of impact
Estimated financial
implications
Management method
Cost of
management
conditions economy will cause consumers to want more energy efficient products. This works in VESTEL's favor and will result in increased sales.
TV market share will expand up to 98 % in 2014 and continue to increase to an estimated 100 % in 2015. We also expect that the share of our eco-products will be 100 % in 2015, as we observe from the buying trends, which favor eco-friendly design and energy efficiency. A review of the global market
and sales channels worth of 50 million USD in our energy-efficient LED TV , LED Lighting, Touch screens, Smartphones production plant for business expansion and our R&D investments reached up to 60 million USD in 2014 supported with our ‘unlimited R&D budget’ strategy.
CC6.1d
Please explain why you do not consider your company to be exposed to inherent opportunities driven by changes in regulation that have the potential to generate a substantive change in your business operations, revenue or expenditure

CC6.1e
Please explain why you do not consider your company to be exposed to inherent opportunities driven by physical climate parameters that have the potential to generate a substantive change in your business operations, revenue or expenditure
CC6.1f
Please explain why you do not consider your company to be exposed to inherent opportunities driven by changes in other climate-related developments that have the potential to generate a substantive change in your business operations, revenue or expenditure
Further Information
Attachments
https://www.cdp.net/sites/2015/59/21159/Climate Change 2015/Shared Documents/Attachments/ClimateChange2015/CC6.ClimateChangeOpportunities/Vestel Led Lighting.pdf
Module: GHG Emissions Accounting, Energy and Fuel Use, and Trading
Page: CC7. Emissions Methodology
CC7.1
Please provide your base year and base year emissions (Scopes 1 and 2)

Scope
Base year
Base year emissions (metric tonnes CO2e)
Scope 1 Fri 01 Jan 2010 - Fri 31 Dec 2010
1816.31
Scope 2 Fri 01 Jan 2010 - Fri 31 Dec 2010
52608.99
CC7.2
Please give the name of the standard, protocol or methodology you have used to collect activity data and calculate Scope 1 and Scope 2 emissions
Please select the published methodologies that you use
ISO 14064-1
CC7.2a
If you have selected "Other" in CC7.2 please provide details of the standard, protocol or methodology you have used to collect activity data and calculate Scope 1 and Scope 2 emissions
CC7.3

Please give the source for the global warming potentials you have used
Gas
Reference
CO2 IPCC Fourth Assessment Report (AR4 - 100 year)
CH4 IPCC Fourth Assessment Report (AR4 - 100 year)
N2O IPCC Fourth Assessment Report (AR4 - 100 year)
CC7.4
Please give the emissions factors you have applied and their origin; alternatively, please attach an Excel spreadsheet with this data at the bottom of this page
Fuel/Material/Energy
Emission Factor
Unit
Reference
Natural gas 56100 Other: kgCO2 per tJ IPCC(2006)
Natural gas 1 Other: kgCH4 per tJ IPCC(2006)
Diesel/Gas oil 74100 Other: kgCO2 per tJ IPCC(2006)
Diesel/Gas oil 43 Other: tJ/Gg IPCC(2006)
Electricity 617 metric tonnes CO2 per MWh
Turkish Regulation "By-Law on Energy Performance of Buildings
Steam 267 Other: kgCO2 per t supplier's data and rough emission factors
Heat 0.48 Other: kgCO2 per kcal supplier's data and rough emission factors
Further Information
Page: CC8. Emissions Data - (1 Jan 2014 - 31 Dec 2014)

CC8.1
Please select the boundary you are using for your Scope 1 and 2 greenhouse gas inventory
Operational control
CC8.2
Please provide your gross global Scope 1 emissions figures in metric tonnes CO2e
2625.18
CC8.3
Please provide your gross global Scope 2 emissions figures in metric tonnes CO2e
74288.02
CC8.4
Are there are any sources (e.g. facilities, specific GHGs, activities, geographies, etc.) of Scope 1 and Scope 2 emissions that are within your selected reporting boundary which are not included in your disclosure?
Yes
CC8.4a
Please provide details of the sources of Scope 1 and Scope 2 emissions that are within your selected reporting boundary which are not included in your disclosure
Source
Relevance of
Scope 1 emissions from this source
Relevance of
Scope 2 emissions excluded from this source
Explain why the source is excluded
Some chemical groups used (adhesives, aerosols, oils,paraffin waxes, solvents, solvent based paints, chemicals used for test purposes, EPS etc.) are at a negligible level
Emissions are not relevant
Emissions are not relevant
These chemicals were calculated and determined that they cause greenhouse gas emission at a negligible level; for this reason they are not included in greenhouse gas inventory.
Gases used for controlling gas and smoke detectors
Emissions are not relevant
No emissions from this source
Greenhouse gases from gases used for the Gas and smoke detector control (avg. 1lt.) has been neglected due to having a very low effect in total greenhouse gas.
CO2 and CH4 emission emitted by the waste water treatment plant
Emissions are not relevant
No emissions from this source
During treatment at wastewater treatment plant, greenhouse gas emissions occur as a result of bacteria activities. As CO2 and CH4 emission created during phsyical treatment is not set forth at "IPCC Guidelines for National Greenhouse Gas Inventories, Volume 5: Waste, Chapter 6: Wastewater Treatment and Discharge" it is not included in calculations.
CC8.5
Please estimate the level of uncertainty of the total gross global Scope 1 and 2 emissions figures that you have supplied and specify the sources of uncertainty in your data gathering, handling and calculations
Scope
Uncertainty range
Main sources of uncertainty
Please expand on the uncertainty in your data
Scope 1
More than 5% but less than or equal to
Assumptions Other:
We used published default emission factors of IPCC 2006 for natural gas and diesel oil which have certain uncertainty. We used supplier data related to natural gas consumption.

Scope
Uncertainty range
Main sources of uncertainty
Please expand on the uncertainty in your data
10% supplier's data
Scope 2
More than 5% but less than or equal to 10%
Assumptions Other: supplier's data
The national grid emission factor published in the Turkish Regulation "By-Law on Energy Performance of Buildings" was used. The details and the most recent data used for the calculation of this emission factor is not presented in the regulation hence we assume the uncertainty to be not more than 10% by considering the changes in the grid system. We used the supplier's data and rough emission factors for estimating emissions from purchased steam and heat.
CC8.6
Please indicate the verification/assurance status that applies to your reported Scope 1 emissions
No third party verification or assurance
CC8.6a
Please provide further details of the verification/assurance undertaken for your Scope 1 emissions, and attach the relevant statements
Type of verification or assurance
Attach the statement
Page/section reference
Relevant standard
Proportion of reported Scope 1 emissions verified (%)
CC8.6b

Please provide further details of the regulatory regime to which you are complying that specifies the use of Continuous Emissions Monitoring Systems (CEMS)
Regulation
% of emissions covered by the system
Compliance period
Evidence of submission
CC8.7
Please indicate the verification/assurance status that applies to your reported Scope 2 emissions
No third party verification or assurance
CC8.7a
Please provide further details of the verification/assurance undertaken for your Scope 2 emissions, and attach the relevant statements
Type of verification or assurance
Attach the statement
Page/Section reference
Relevant standard
Proportion of reported Scope 2
emissions verified (%)
CC8.8
Please identify if any data points have been verified as part of the third party verification work undertaken, other than the verification of emissions figures reported in CC8.6, CC8.7 and CC14.2
Additional data points verified
Comment

Additional data points verified
Comment
No additional data verified
CC8.9
Are carbon dioxide emissions from biologically sequestered carbon relevant to your organization?
No
CC8.9a
Please provide the emissions from biologically sequestered carbon relevant to your organization in metric tonnes CO2
Further Information
Page: CC9. Scope 1 Emissions Breakdown - (1 Jan 2014 - 31 Dec 2014)
CC9.1
Do you have Scope 1 emissions sources in more than one country?
No
CC9.1a
Please break down your total gross global Scope 1 emissions by country/region
Country/Region
Scope 1 metric tonnes CO2e
CC9.2
Please indicate which other Scope 1 emissions breakdowns you are able to provide (tick all that apply)
By activity
CC9.2a
Please break down your total gross global Scope 1 emissions by business division
Business division
Scope 1 emissions (metric tonnes CO2e)
CC9.2b
Please break down your total gross global Scope 1 emissions by facility

Facility
Scope 1 emissions (metric tonnes CO2e)
Latitude
Longitude
CC9.2c
Please break down your total gross global Scope 1 emissions by GHG type
GHG type
Scope 1 emissions (metric tonnes CO2e)
CC9.2d
Please break down your total gross global Scope 1 emissions by activity
Activity
Scope 1 emissions (metric tonnes CO2e)
Stationary Combustion 1696.74
Mobile Combustion 875.37
Generators 53.06
CC9.2e
Please break down your total gross global Scope 1 emissions by legal structure
Legal structure
Scope 1 emissions (metric tonnes CO2e)
Further Information
Page: CC10. Scope 2 Emissions Breakdown - (1 Jan 2014 - 31 Dec 2014)
CC10.1
Do you have Scope 2 emissions sources in more than one country?
No
CC10.1a
Please break down your total gross global Scope 2 emissions and energy consumption by country/region
Country/Region
Scope 2 metric tonnes CO2e
Purchased and consumed electricity, heat, steam or cooling
(MWh)
Purchased and consumed low carbon electricity, heat, steam or cooling accounted for in CC8.3 (MWh)
CC10.2
Please indicate which other Scope 2 emissions breakdowns you are able to provide (tick all that apply)
By activity
CC10.2a
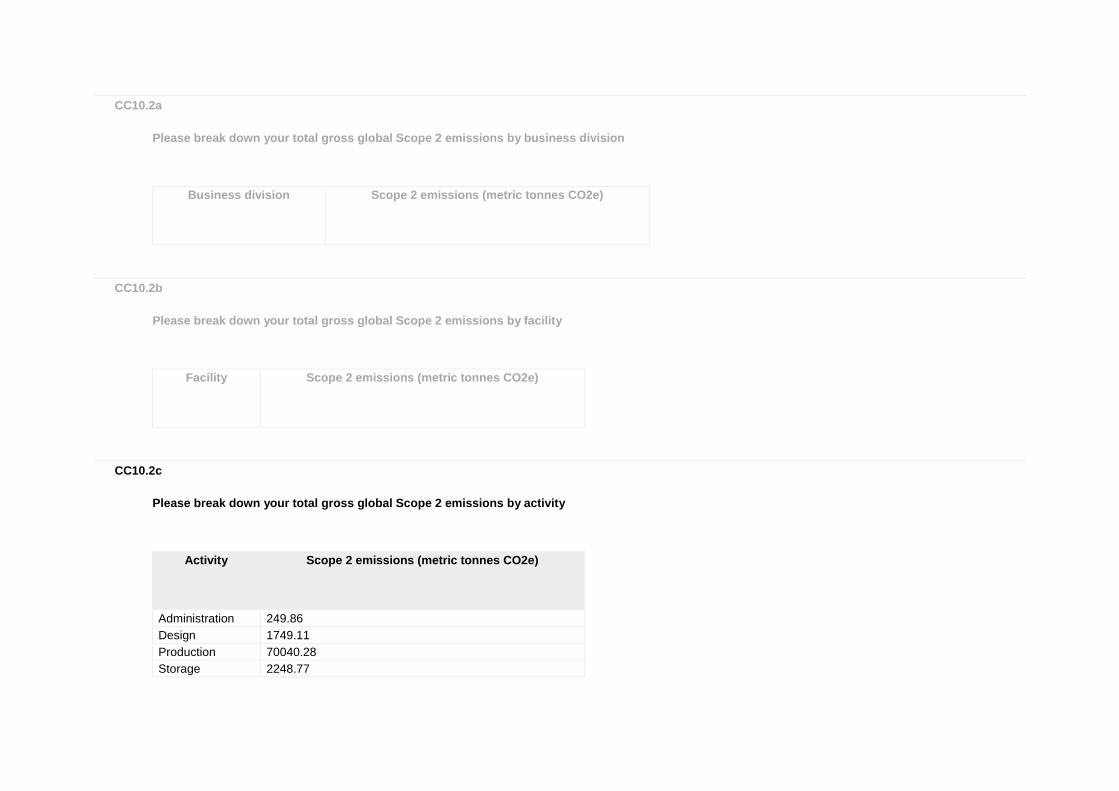
Please break down your total gross global Scope 2 emissions by business division
Business division
Scope 2 emissions (metric tonnes CO2e)
CC10.2b
Please break down your total gross global Scope 2 emissions by facility
Facility
Scope 2 emissions (metric tonnes CO2e)
CC10.2c
Please break down your total gross global Scope 2 emissions by activity
Activity
Scope 2 emissions (metric tonnes CO2e)
Administration 249.86
Design 1749.11
Production 70040.28
Storage 2248.77
CC10.2d
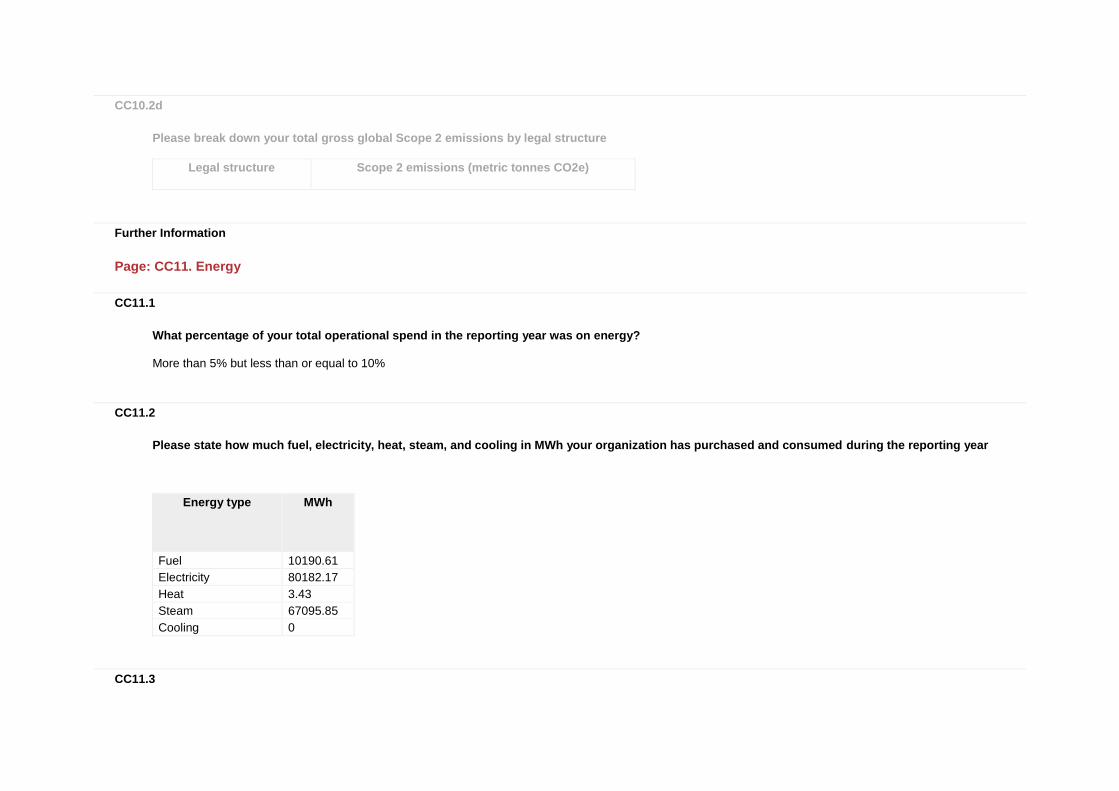
Please break down your total gross global Scope 2 emissions by legal structure
Legal structure
Scope 2 emissions (metric tonnes CO2e)
Further Information
Page: CC11. Energy
CC11.1
What percentage of your total operational spend in the reporting year was on energy?
More than 5% but less than or equal to 10%
CC11.2
Please state how much fuel, electricity, heat, steam, and cooling in MWh your organization has purchased and consumed during the reporting year
Energy type
MWh
Fuel 10190.61
Electricity 80182.17
Heat 3.43
Steam 67095.85
Cooling 0
CC11.3

Please complete the table by breaking down the total "Fuel" figure entered above by fuel type
Fuels
MWh
Natural gas 7377.17
Diesel/Gas oil 2813.44
CC11.4
Please provide details of the electricity, heat, steam or cooling amounts that were accounted at a low carbon emission factor in the Scope 2 figure reported in CC8.3
Basis for applying a low carbon emission factor
MWh associated with low carbon electricity, heat, steam or cooling
Comment
No purchases or generation of low carbon electricity, heat, steam or cooling accounted with a low carbon emissions factor
0 Vestel is located in Manisa Industrial Zone and purchases its energy i.e. electricity, natural gas, heat, steam from Manisa Industrial Zone Energy Facility. For now, there is no low carbon/renewable energy availability in this Industrial Area.
Further Information
Attachments
https://www.cdp.net/sites/2015/59/21159/Climate Change 2015/Shared Documents/Attachments/ClimateChange2015/CC11.Energy/Manisa Industrial Zone Energy Facility.jpg
Page: CC12. Emissions Performance
CC12.1
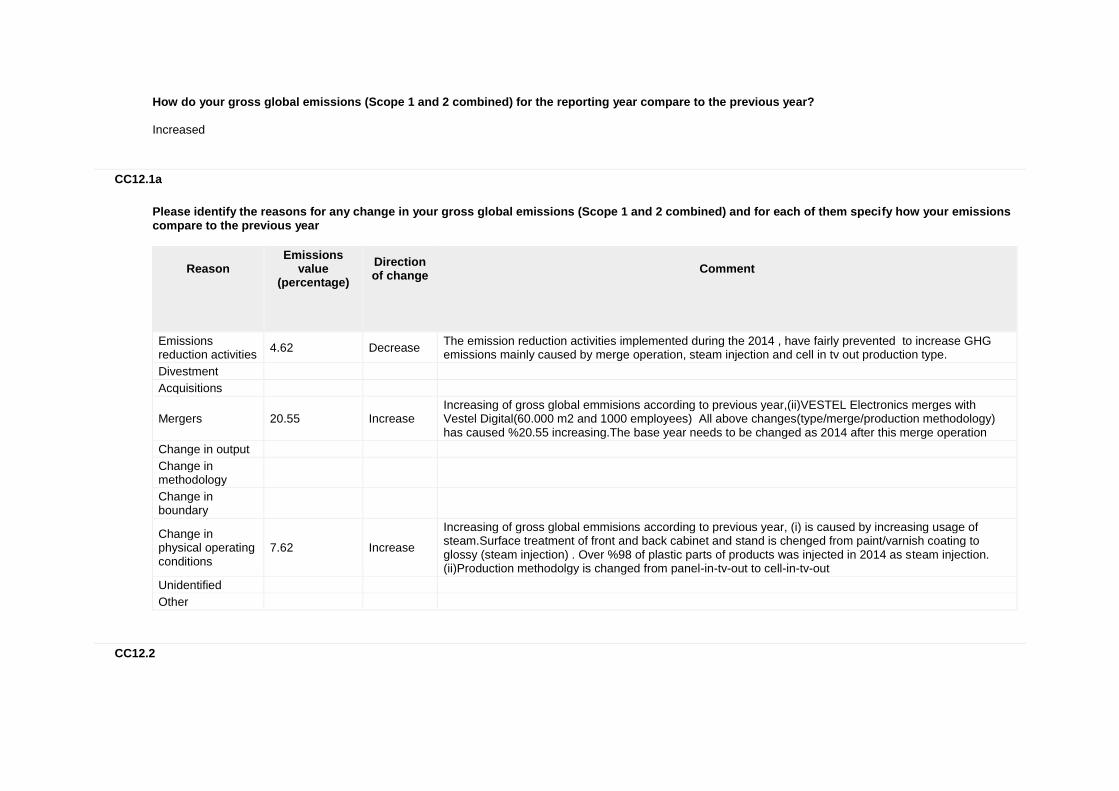
How do your gross global emissions (Scope 1 and 2 combined) for the reporting year compare to the previous year?
Increased
CC12.1a
Please identify the reasons for any change in your gross global emissions (Scope 1 and 2 combined) and for each of them specify how your emissions compare to the previous year
Reason
Emissions value
(percentage)
Direction of change
Comment
Emissions reduction activities
4.62 Decrease The emission reduction activities implemented during the 2014 , have fairly prevented to increase GHG emissions mainly caused by merge operation, steam injection and cell in tv out production type.
Divestment
Acquisitions
Mergers 20.55 Increase Increasing of gross global emmisions according to previous year,(ii)VESTEL Electronics merges with Vestel Digital(60.000 m2 and 1000 employees) All above changes(type/merge/production methodology) has caused %20.55 increasing.The base year needs to be changed as 2014 after this merge operation
Change in output
Change in methodology
Change in boundary
Change in physical operating conditions
7.62 Increase
Increasing of gross global emmisions according to previous year, (i) is caused by increasing usage of steam.Surface treatment of front and back cabinet and stand is chenged from paint/varnish coating to glossy (steam injection) . Over %98 of plastic parts of products was injected in 2014 as steam injection. (ii)Production methodolgy is changed from panel-in-tv-out to cell-in-tv-out
Unidentified
Other
CC12.2
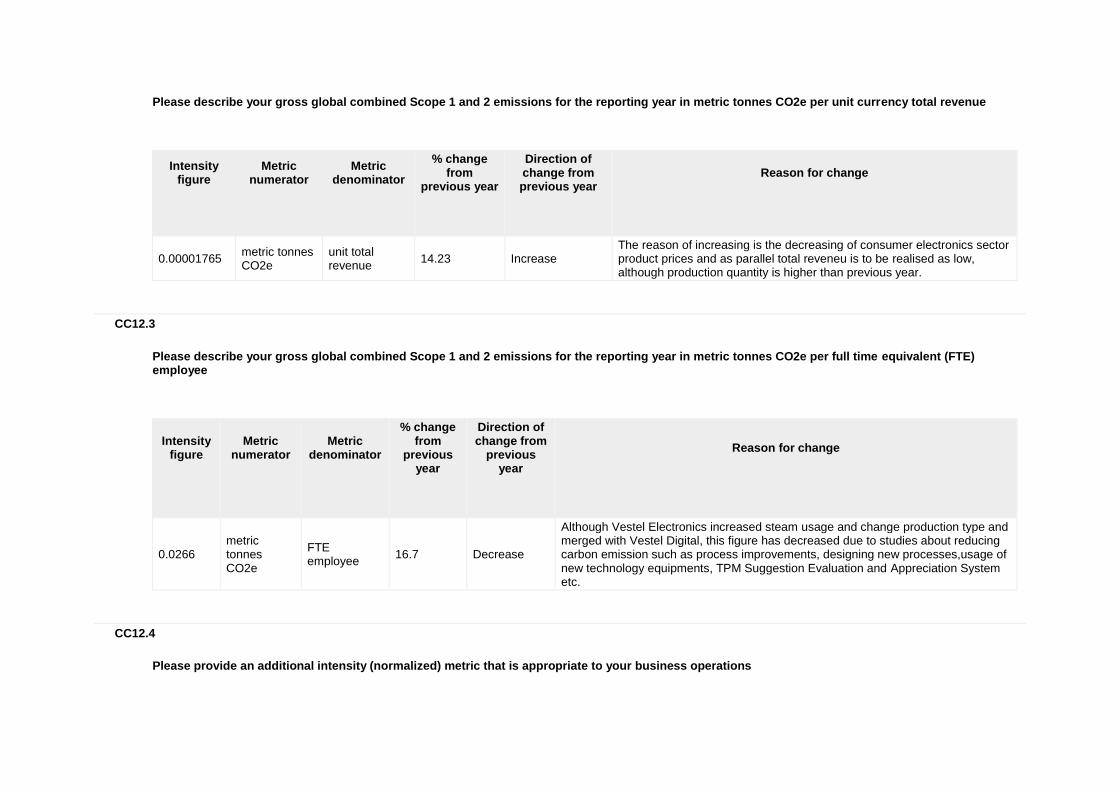
Please describe your gross global combined Scope 1 and 2 emissions for the reporting year in metric tonnes CO2e per unit currency total revenue
Intensity figure
Metric numerator
Metric denominator
% change from
previous year
Direction of change from previous year
Reason for change
0.00001765 metric tonnes CO2e
unit total revenue
14.23 Increase The reason of increasing is the decreasing of consumer electronics sector product prices and as parallel total reveneu is to be realised as low, although production quantity is higher than previous year.
CC12.3
Please describe your gross global combined Scope 1 and 2 emissions for the reporting year in metric tonnes CO2e per full time equivalent (FTE) employee
Intensity figure
Metric numerator
Metric denominator
% change from
previous year
Direction of change from
previous year
Reason for change
0.0266 metric tonnes CO2e
FTE employee
16.7 Decrease
Although Vestel Electronics increased steam usage and change production type and merged with Vestel Digital, this figure has decreased due to studies about reducing carbon emission such as process improvements, designing new processes,usage of new technology equipments, TPM Suggestion Evaluation and Appreciation System etc.
CC12.4
Please provide an additional intensity (normalized) metric that is appropriate to your business operations
Intensity figure
Metric numerator
Metric denominator
% change from previous year
Direction of change from previous year
Reason for change
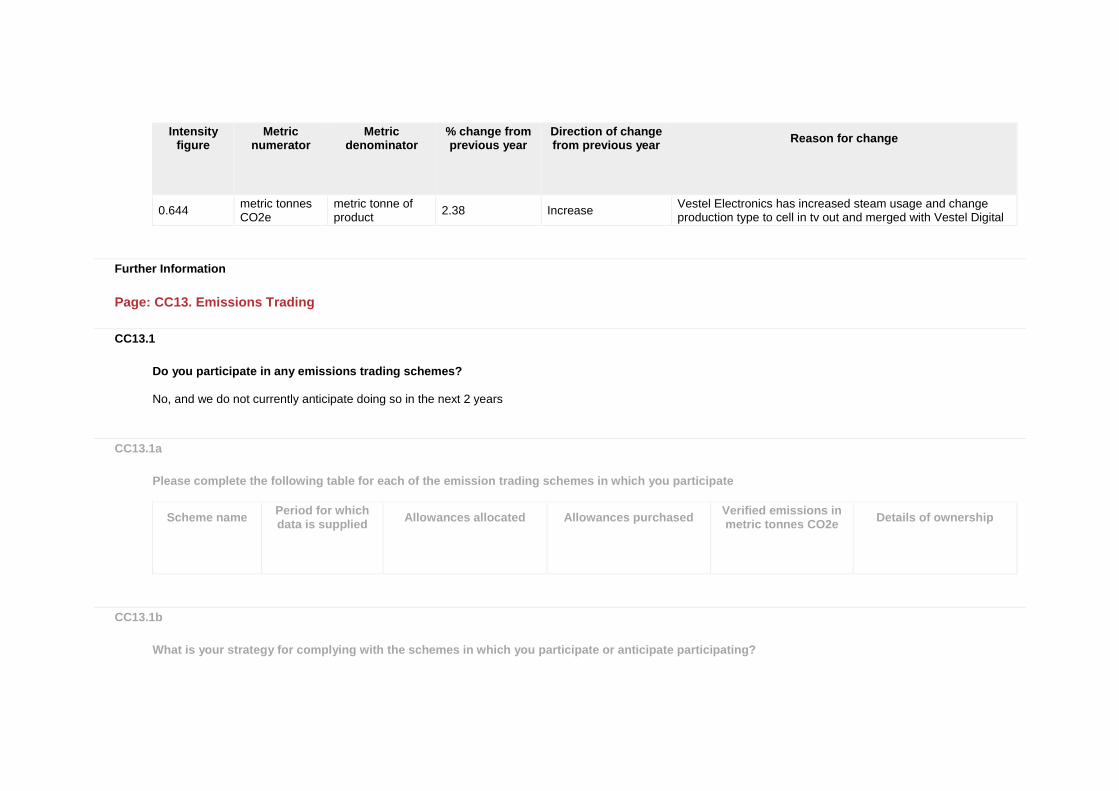
0.644 metric tonnes CO2e
metric tonne of product
2.38 Increase Vestel Electronics has increased steam usage and change production type to cell in tv out and merged with Vestel Digital
Further Information
Page: CC13. Emissions Trading
CC13.1
Do you participate in any emissions trading schemes?
No, and we do not currently anticipate doing so in the next 2 years
CC13.1a
Please complete the following table for each of the emission trading schemes in which you participate
Scheme name
Period for which data is supplied
Allowances allocated
Allowances purchased
Verified emissions in metric tonnes CO2e
Details of ownership
CC13.1b
What is your strategy for complying with the schemes in which you participate or anticipate participating?

CC13.2
Has your organization originated any project-based carbon credits or purchased any within the reporting period?
No
CC13.2a
Please provide details on the project-based carbon credits originated or purchased by your organization in the reporting period
Credit origination
or credit purchase
Project type
Project identification
Verified to which standard
Number of credits (metric
tonnes of CO2e)
Number of credits (metric tonnes
CO2e): Risk adjusted volume
Credits cancelled
Purpose, e.g. compliance
Further Information
Page: CC14. Scope 3 Emissions
CC14.1
Please account for your organization’s Scope 3 emissions, disclosing and explaining any exclusions

Sources of Scope 3 emissions
Evaluation status
metric tonnes CO2e
Emissions calculation methodology
Percentage of
emissions calculated using data obtained
from suppliers or value chain
partners
Explanation
Purchased goods and services
Relevant, calculated
30869 Average data is used to calculate transportation of purchased raw materials.
6.31% This calculation includes the transportation emissions of all materials and components which are purchased during 2014
Capital goods Relevant, calculated
1.31 Average data is used to calculate transportation of purchased raw materials.
0.01%
This calculation includes the transportation emissions of 9 PLASTIC INJECTION MACHINES (ENGEL 1300, ENGEL 1500, ENGEL 2000) which is purchased during in 2014
Fuel-and-energy-related activities (not included in Scope 1 or 2)
Relevant, calculated
990.13
Diesel/Gas oil emission factors that explained in IPCC(2006) are used to calculate emissions of fuel and energy related activities(not included in Scope 1 or 2).
0.20%
This calculation includes fuel consumption of inside transportation cars and manager and top management vehicles provided by Vestel Electronics.
Upstream transportation and distribution
Not relevant, explanation provided
0.00 Not applicable 0.00%
The downstream transportation and distribution of the products VESTEL sells in each of its major business groups, including any retail and storage.
Waste generated in operations
Relevant, calculated
3.37
Diesel/Gas oil emission factors that explained in IPCC(2006) are used to calculate emissions of fuel and energy related activities(not included in Scope 1 or 2).
0.07%
This calculation includes emissions from the transportation of wastes between Vestel Electronics facilities and licenced waste companies and also Municipal Wastes.
Business travel Relevant, calculated
4361.49
2012 Guidelines to Defra / DECC's GHG Conversion Factors for Company Reporting is used to calculate total emissions of business travels.
0.89% This calculation includes all business flights of Vestel Electronics employee.
Employee commuting Relevant, calculated
7333.56 Diesel/Gas oil emission factors that explained in IPCC(2006) are used to calculate employee commuting emissions.
1.50% This calculation includes emissions from the transportation of employees between their homes and Vestel Electronics facilities.
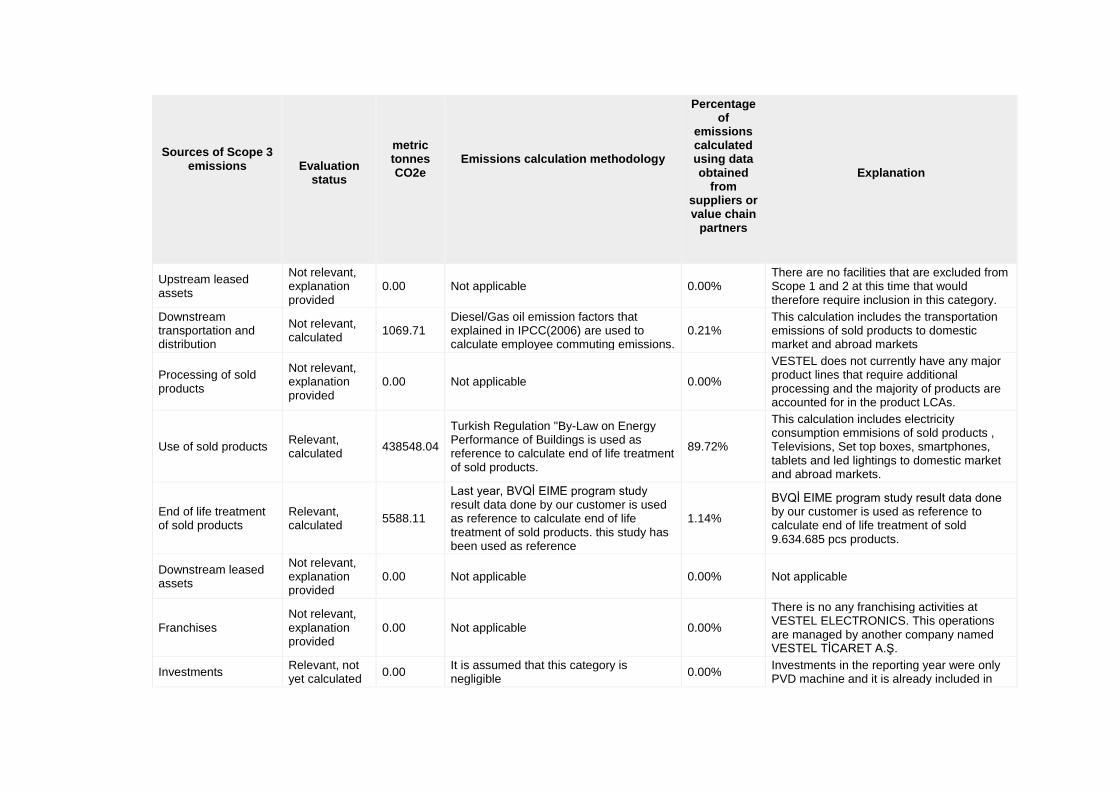
Sources of Scope 3 emissions
Evaluation status
metric tonnes CO2e
Emissions calculation methodology
Percentage of
emissions calculated using data obtained
from suppliers or value chain
partners
Explanation
Upstream leased assets
Not relevant, explanation provided
0.00 Not applicable 0.00% There are no facilities that are excluded from Scope 1 and 2 at this time that would therefore require inclusion in this category.
Downstream transportation and distribution
Not relevant, calculated
1069.71 Diesel/Gas oil emission factors that explained in IPCC(2006) are used to calculate employee commuting emissions.
0.21% This calculation includes the transportation emissions of sold products to domestic market and abroad markets
Processing of sold products
Not relevant, explanation provided
0.00 Not applicable 0.00%
VESTEL does not currently have any major product lines that require additional processing and the majority of products are accounted for in the product LCAs.
Use of sold products Relevant, calculated
438548.04
Turkish Regulation "By-Law on Energy Performance of Buildings is used as reference to calculate end of life treatment of sold products.
89.72%
This calculation includes electricity consumption emmisions of sold products , Televisions, Set top boxes, smartphones, tablets and led lightings to domestic market and abroad markets.
End of life treatment of sold products
Relevant, calculated
5588.11
Last year, BVQİ EIME program study result data done by our customer is used as reference to calculate end of life treatment of sold products. this study has been used as reference
1.14%
BVQİ EIME program study result data done by our customer is used as reference to calculate end of life treatment of sold 9.634.685 pcs products.
Downstream leased assets
Not relevant, explanation provided
0.00 Not applicable 0.00% Not applicable
Franchises Not relevant, explanation provided
0.00 Not applicable 0.00%
There is no any franchising activities at VESTEL ELECTRONICS. This operations are managed by another company named VESTEL TİCARET A.Ş.
Investments Relevant, not yet calculated
0.00 It is assumed that this category is negligible
0.00% Investments in the reporting year were only PVD machine and it is already included in
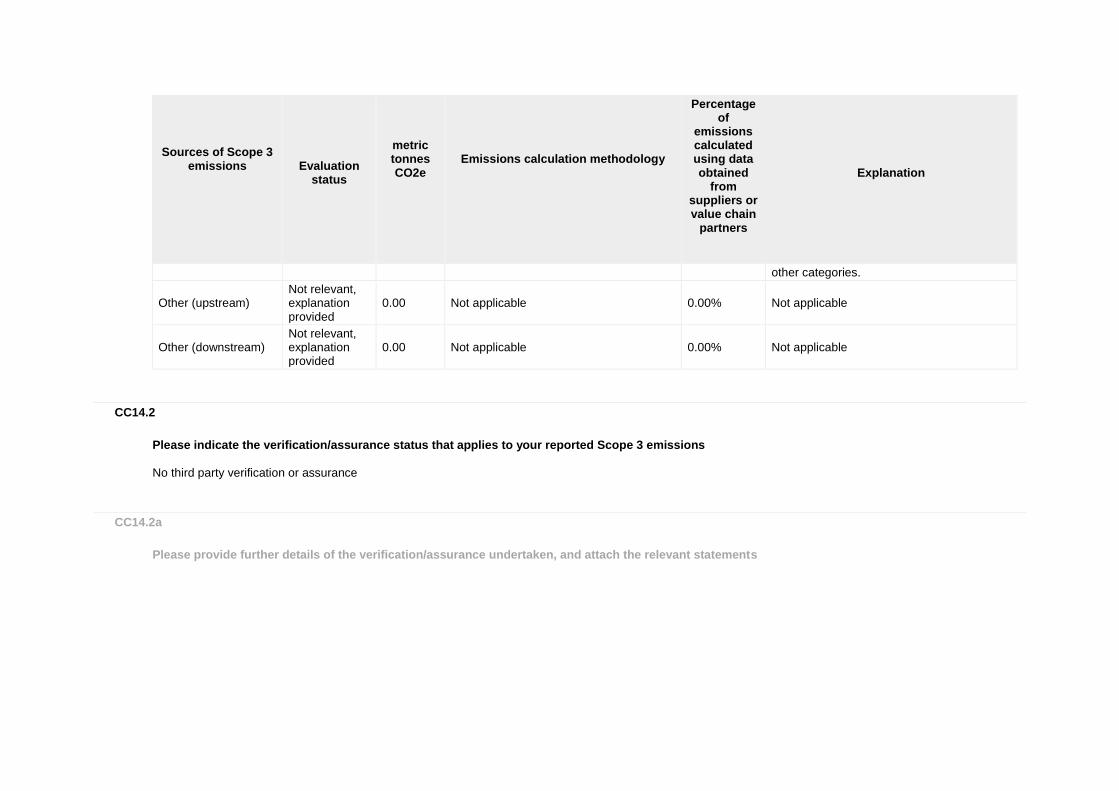
Sources of Scope 3 emissions
Evaluation status
metric tonnes CO2e
Emissions calculation methodology
Percentage of
emissions calculated using data obtained
from suppliers or value chain
partners
Explanation
other categories.
Other (upstream) Not relevant, explanation provided
0.00 Not applicable 0.00% Not applicable
Other (downstream) Not relevant, explanation provided
0.00 Not applicable 0.00% Not applicable
CC14.2
Please indicate the verification/assurance status that applies to your reported Scope 3 emissions
No third party verification or assurance
CC14.2a
Please provide further details of the verification/assurance undertaken, and attach the relevant statements

Type of verification
or assurance
Attach the statement
Page/Section reference
Relevant standard
Proportion of Scope 3 emissions verified (%)
CC14.3
Are you able to compare your Scope 3 emissions for the reporting year with those for the previous year for any sources?
Yes
CC14.3a
Please identify the reasons for any change in your Scope 3 emissions and for each of them specify how your emissions compare to the previous year
Sources of Scope 3
emissions
Reason for change
Emissions
value (percentage)
Direction of change
Comment
Employee commuting Mergers 11.93 Increase The reason of increasing is merge of facilities, increasing of employee quantities and increasing of employee pickup stations
Purchased goods & services Other: All materials are included this year
450.20 Increase The reason of increasing is calculation of all purchased materials and components.ın previous year this calculation had been made only based on purchased plastic raw material
Downstream transportation and distribution
Mergers 1.16 Increase The reason of increasing is merge of facilities, increasing of manufactured products.
Use of sold products Change in methodology
100 Decrease The reason of decreasing is changing calculation methodology.
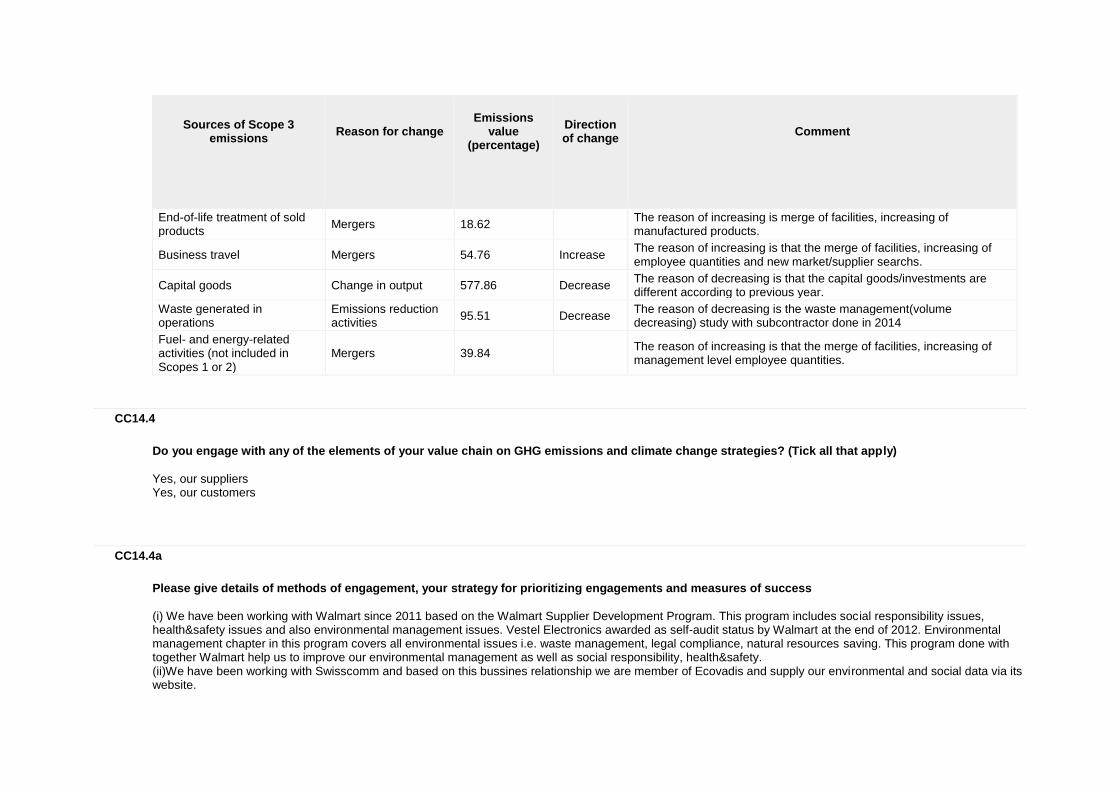
Sources of Scope 3
emissions
Reason for change
Emissions
value (percentage)
Direction of change
Comment
End-of-life treatment of sold products
Mergers 18.62
The reason of increasing is merge of facilities, increasing of manufactured products.
Business travel Mergers 54.76 Increase The reason of increasing is that the merge of facilities, increasing of employee quantities and new market/supplier searchs.
Capital goods Change in output 577.86 Decrease The reason of decreasing is that the capital goods/investments are different according to previous year.
Waste generated in operations
Emissions reduction activities
95.51 Decrease The reason of decreasing is the waste management(volume decreasing) study with subcontractor done in 2014
Fuel- and energy-related activities (not included in Scopes 1 or 2)
Mergers 39.84
The reason of increasing is that the merge of facilities, increasing of management level employee quantities.
CC14.4
Do you engage with any of the elements of your value chain on GHG emissions and climate change strategies? (Tick all that apply)
Yes, our suppliers Yes, our customers
CC14.4a
Please give details of methods of engagement, your strategy for prioritizing engagements and measures of success
(i) We have been working with Walmart since 2011 based on the Walmart Supplier Development Program. This program includes social responsibility issues, health&safety issues and also environmental management issues. Vestel Electronics awarded as self-audit status by Walmart at the end of 2012. Environmental management chapter in this program covers all environmental issues i.e. waste management, legal compliance, natural resources saving. This program done with together Walmart help us to improve our environmental management as well as social responsibility, health&safety. (ii)We have been working with Swisscomm and based on this bussines relationship we are member of Ecovadis and supply our environmental and social data via its website.

(ii) We are working EU retailes and they follow SEDEX,BSCI,ICS,FWC and all these code of conducts include environmental issues.Because of the audit and compliancy requirements, these help us to improve our our environmental management
CC14.4b
To give a sense of scale of this engagement, please give the number of suppliers with whom you are engaging and the proportion of your total spend that they represent
Number of
suppliers
% of total
spend
Comment
432 100%
“Sustainability” is the key element of Vestel’s Environmental Compliance Management practices. Vestel reduces the environmental impacts of all the processes from production of raw material to disposal of product, complies with all the environmental law and regulations during the life cycle of product and commits this approach with its Environmental Policy. In order to manage the movement of raw materials into Vestel, certain aspects of the internal processing of materials into finished goods, and the movement of finished goods out of Vestel and toward the end consumer, Vestel has started SCM(Supply Chain Excellence Project) in 2014. The SCM will help us to reduce total supply chain management cost, to terminate non-value adding processes , to increase productivity and to reach perfect order fulfilment. In the frame of this project , Vestel has been member of SCC(supply Chain council) and made investments on SNC(Supplier Network Collaboration) , SLC (Supplier Lifecycle Management) and TM(Transportation Management) modules. Also Vestel established Supply Chain Academy and started to train 140 SCM process employees from different levels at VESTEL.
CC14.4c
If you have data on your suppliers’ GHG emissions and climate change strategies, please explain how you make use of that data
How you make use of the data
Please give details
Managing physical risks in the supply chain
Vestel uses all suppliers' data to improve capacity management, perfect order fulfilment, material and logistics costs, vendor capacity management and lead time. This project will reduce losses and unnecessary process and therefore it will help us to improve energy efficiency through Supply chain from suppliers to customers.
Managing the impact of regulation in the supply chain
Vestel SCM project also provides strict collaboration and communication tool with suppliers and subcontractors via Vestel Supplier Portal and Vestel RoHSNet portal. All Vestel supplier has unique user-password to see their material which they supply to Vestel and must comply necessary regulations via these web sites.

CC14.4d
Please explain why you do not engage with any elements of your value chain on GHG emissions and climate change strategies, and any plans you have to develop an engagement strategy in the future
Further Information
Module: Sign Off
Page: CC15. Sign Off
CC15.1
Please provide the following information for the person that has signed off (approved) your CDP climate change response
Name
Job title
Corresponding job category
ERSİN KÖSEOĞLU
MANAGEMENT SYSTEMS
Environment/Sustainability manager
Further Information
CDP 2015 Climate Change 2015 Information Request