CDP 2014 Investor Information Request
53
CDP Investor CDP 2014 Information Request Aspen Pharmacare Holdings Module: Introduction Page: Introduction CC0.1 Introduction Please give a general description and introduction to your organization. Aspen Holdings Limited, listed on the Johannesburg Stock Exchange, is one of the largest pharmaceutical manufacturers in the Southern Hemisphere and the ninth largest generic manufacturers worldwide. Aspen has a proud heritage dating back more than 160 years. Aspen is a supplier of branded and generic pharmaceuticals in approximately 150 countries across the globe and of consumer and nutritional products in selected territories. Sustainability is engrained in Aspen’s culture. The Group is committed to sustaining life and promoting healthcare through increasing access to its high quality, effective, affordable medicines and products. The extensive basket of Aspen products provides treatment for a broad spectrum of acute and chronic conditions experienced throughout all stages of life. As at March 2014, the Group has 24 manufacturing facilities at 18 pharmaceutical manufacturing sites on six continents and approximately 9300 employees. CC0.2 Reporting Year Please state the start and end date of the year for which you are reporting data. The current reporting year is the latest/most recent 12-month period for which data is reported. Enter the dates of this year first. We request data for more than one reporting period for some emission accounting questions. Please provide data for the three years prior to the current reporting year if you have not provided this information before, or if this is the first time you have answered a CDP information request. (This does not apply if you have been offered and selected the option of answering the shorter questionnaire). If you are going to provide additional years of data, please give the dates of those reporting periods here. Work backwards from the most recent reporting year. Please enter dates in following format: day(DD)/month(MM)/year(YYYY) (i.e. 31/01/2001). Enter Periods that will be disclosed Sun 01 Jul 2012 - Sun 30 Jun 2013
Transcript of CDP 2014 Investor Information Request

CDP
Investor CDP 2014 Information Request
Aspen Pharmacare Holdings
Module: Introduction
Page: Introduction
CC0.1 Introduction
Please give a general description and introduction to your organization.
Aspen Holdings Limited, listed on the Johannesburg Stock Exchange, is one of the largest pharmaceutical manufacturers in the Southern Hemisphere and the ninth largest generic manufacturers worldwide. Aspen has a proud heritage dating back more than 160 years. Aspen is a supplier of branded and generic pharmaceuticals in approximately 150 countries across the globe and of consumer and nutritional products in selected territories. Sustainability is engrained in Aspen’s culture. The Group is committed to sustaining life and promoting healthcare through increasing access to its high quality, effective, affordable medicines and products. The extensive basket of Aspen products provides treatment for a broad spectrum of acute and chronic conditions experienced throughout all stages of life. As at March 2014, the Group has 24 manufacturing facilities at 18 pharmaceutical manufacturing sites on six continents and approximately 9300 employees.
CC0.2 Reporting Year
Please state the start and end date of the year for which you are reporting data. The current reporting year is the latest/most recent 12-month period for which data is reported. Enter the dates of this year first. We request data for more than one reporting period for some emission accounting questions. Please provide data for the three years prior to the current reporting year if you have not provided this information before, or if this is the first time you have answered a CDP information request. (This does not apply if you have been offered and selected the option of answering the shorter questionnaire). If you are going to provide additional years of data, please give the dates of those reporting periods here. Work backwards from the most recent reporting year. Please enter dates in following format: day(DD)/month(MM)/year(YYYY) (i.e. 31/01/2001).
Enter Periods that will be disclosed
Sun 01 Jul 2012 - Sun 30 Jun 2013

CC0.3 Country list configuration Please select the countries for which you will be supplying data. This selection will be carried forward to assist you in completing your response.
Select country
South Africa Germany Australia
CC0.4 Currency selection Please select the currency in which you would like to submit your response. All financial information contained in the response should be in this currency.
ZAR (R)
CC0.6 Modules
As part of the request for information on behalf of investors, electric utilities, companies with electric utility activities or assets, companies in the automobile or auto component manufacture sectors, companies in the oil and gas industry, companies in the information technology and telecommunications sectors and companies in the food, beverage and tobacco sectors should complete supplementary questions in addition to the main questionnaire. If you are in these sectors (according to the Global Industry Classification Standard (GICS)), the corresponding sector modules will not appear below but will automatically appear in the navigation bar when you save this page. If you want to query your classification, please email [email protected]. If you have not been presented with a sector module that you consider would be appropriate for your company to answer, please select the module below. If you wish to view the questions first, please see https://www.cdp.net/en-US/Programmes/Pages/More-questionnaires.aspx.

Further Information
Module: Management
Page: CC1. Governance
CC1.1
Where is the highest level of direct responsibility for climate change within your organization? Individual/Sub-set of the Board or other committee appointed by the Board
CC1.1a
Please identify the position of the individual or name of the committee with this responsibility The Social and Ethics Committee, a sub-committee of the board of Aspen Pharmacare Holdings, is tasked with this responsibility.
CC1.2
Do you provide incentives for the management of climate change issues, including the attainment of targets? No
CC1.2a
Please provide further details on the incentives provided for the management of climate change issues
Who is entitled to benefit from these incentives?
The type of incentives
Incentivized performance indicator
Further Information

No further information
Page: CC2. Strategy
CC2.1
Please select the option that best describes your risk management procedures with regard to climate change risks and opportunities Integrated into multi-disciplinary company wide risk management processes
CC2.1a
Please provide further details on your risk management procedures with regard to climate change risks and opportunities
Frequency of monitoring
To whom are results reported
Geographical areas
considered
How far into the future are risks
considered?
Comment
Six-monthly or more frequently
Individual/Sub-set of the Board or committee appointed by the Board
South Africa; Germany; and Australia
1 to 3 years Group-wide consideration of risks, with formal measurement of environmental key performance indicators for manufacturing facilities.
CC2.1b
Please describe how your risk and opportunity identification processes are applied at both company and asset level Risk management is embedded in Aspen’s culture and management is responsible for the effective identification and mitigation of risks, including climate risks, on a day-to-day basis in consultation with affected stakeholders. Strategic, operational, financial and compliance risk assessments are conducted annually at a business unit (asset) level and formally reported to the Executive Risk Forum .The Forum monitors the progress of key risk mitigation plans for major risks on a quarterly basis. These risks, together with the status of risk mitigation plans, are reported to the Audit & Risk Committee quarterly and include an assessment of risks relating to climate change, impacting the Group’s product supply strategy across all business units. The risk review process includes consideration of opportunities or risk “upside”. Management’s self-assessment of risk mitigation plan effectiveness is substantiated using the combined assurance model of internal and externally obtained assurances. The material sustainability key performance indicators, including the environmental indicators which are reported in the Group’s Sustainability Report, are verified by external auditors. Through the Group’s risk management processes and sustainability reporting, the Audit & Risk Committee and Social and

Ethics Committee monitor compliance and initiatives towards responsible environmental management on behalf of the Board. In this way, sustainability objectives are integrated into the risk management process and monitored by the Board collectively.
CC2.1c
How do you prioritize the risks and opportunities identified? Risks and opportunities are prioritised by the business unit management teams, factoring in the impact of such risks to business sustainability, the value and or opportunity cost of the applied environmental resources to the business, and the strategic objectives. This is done in consultation with Group executives. SHE Risk Assessment Procedure: A qualitative risk assessment is conducted using a systematic approach for the identification and assessment of all safety, health and environmental risks. All activities, processes, plant machinery and energy sources are taken into consideration under normal, abnormal and emergency conditions. Three parameters, i.e. severity, occurrence and exposure are used to calculate both raw and residual risks. The results are presented to the Site Executives and risk mitigation plans are drawn up which are approved by the responsible Senior Executive. The status of the risk mitigation plans are reported on a monthly basis during the SHE performance review meetings. Example: The proposed implementation of carbon taxes in South Africa and Australia as well as the reliance on the primary electricity supplier, ESKOM, in South Africa created awareness around the future cost of electricity as well as the sustained supply of electricity at feasible prices. This resulted in an increased focus on conservation initiatives, which led to evaluation of alternatives sources of supply, as well as internal projects to improve efficiencies. Feasible projects were approved by management teams and have been implemented. Benefits in electricity reduction are being realised e.g. power factor correction and installation of energy efficient lighting.
CC2.1d
Please explain why you do not have a process in place for assessing and managing risks and opportunities from climate change, and whether you plan to introduce such a process in future
Main reason for not having a process
Do you plan to introduce a process?
Comment
CC2.2

Is climate change integrated into your business strategy? Yes
CC2.2a
Please describe the process of how climate change is integrated into your business strategy and any outcomes of this process i) Process: Aspen’s strategic objective, “To practise good corporate citizenship”, supports the Group’s objectives around climate change and responsible environmental management. To this end, Aspen’s sustainability management initiatives promote the themes of “Preserving our environment” and “Managing efficient utilisation of scarce resources." These initiatives are monitored by the following material key performance indicators which are reported to the Board as per the agreed reporting timelines: • Volume of carbon emissions (annually); • Volume of waste recycled (quarterly); • Electricity consumed (quarterly); and • Volume of water used(quarterly). These indicators flag areas of risks and opportunities within the environmental management systems and programmes. Aspen’s business strategy is defined at a Board level and the Board is made aware of potential climate change risks and opportunities via pre-existing reporting channels e.g. Audit and Risk Committee and the Executive Risk Forum. Aspen’s Group Environmental Management Principles formally describes the Group’s commitment to the "Containment and reduction of our carbon footprint in our operations and in the broader supply chain in a technically and economically feasible manner through structured systems of environmental monitoring, reporting and management”. This intent is integrated into strategies for the Group’s manufacturing facilities, with formal conservation projects currently in progress at the facilities in South Africa, Australia and Germany. Resource availability, cost and changes to environmental legislation in each territory are factors applied in the approval and prioritisation of conservation projects. In addition, investment in energy efficient technology is given due consideration during the construction of new facilities and when replacing equipment and machinery. Plans are in place to extend similar projects to other sites in the Group when appropriate. The South African, German and Australian facilities, being the Group’s most material operations, have demonstrated an increased commitment to resource conservation initiatives, and the reduction of the quantity of waste disposed in landfills, with the ultimate goal of reducing Scope 2 and 3 emissions. The progress and outcomes of these initiatives are reported monthly in SHE Performance Review meetings and in the quarterly Sustainability Key Performance Indicator Report to the Board. ii) Aspects influencing the strategy - Improving Aspen's carbon footprint as a responsible corporate citizen and potential regulatory changes (e.g. Potential Carbon tax implementation in South Africa and the introduction of energy reduction targets in Germany and Australia) are the major aspects that have influenced our strategy. Sustainable access to scarce resources e.g. water, the rising cost and security of electricity supply in South Africa and business disruptions due to bad weather, have also been key drivers to resource conservation projects . iii) Short term strategy - Although Aspen has not yet set formal targets linked to climate change, Aspen has implemented resource conservation projects. An important component of our short term strategy involves the energy efficient operation of utilities, which drive production processes and requirements for Good Manufacturing Practice, e.g. the use of variable speed drive pumps, the installation of high efficiency motors in air handling units, and the installation of motion sensors for lighting.
iv) Long term strategy: Aspen’s long term strategy is to remain sustainable and to continue to deliver stakeholder value, be a good corporate citizen and ensure supply of quality, affordable medicines. Resource Conservation and Continuous Improvement are key to ensuring business sustainability. v) Strategic advantage - Aspen Pharmacare believes that resources such as energy and water will in future be further constrained. Implementing proactive and voluntary management systems and programmes to increase resource efficiency and decrease consumption, will therefore be an advantage. These proactive systems will facilitate the management of future regulatory requirements and reduction of operational costs, resulting in a competitive edge whilst fulfilling the Group’s strategic objective of sustainably supplying affordable products to customers. vi) Substantial business decisions that have been influenced by climate change include the following: • The adoption of an internationally recognised environmental management system (ISO 14001) for the SA Operations in 2013 to formally manage continuous improvement projects linked to resource conservation and reduced environmental pollution. • The German site has implemented an ISO 50001 certified energy management system for Aspen Bad Oldesloe (ABO). The system will enable ABO to implement a systematic approach for achieving continual improvement with respect to energy efficiency, energy security, energy use and consumption. Consequently, the system will facilitate the continuous reduction in energy use, resulting in lower energy costs and greenhouse gas emissions. • The appointment of a Resource Conservation Engineer to manage all water and energy reduction projects in South Africa. • The expansion of the carbon footprint boundary for CDP reporting by including additional manufacturing sites within the Aspen global structure • The expansion of energy, water and waste reduction projects to all manufacturing sites within the Aspen global structure.
CC2.2b
Please explain why climate change is not integrated into your business strategy
CC2.3
Do you engage in activities that could either directly or indirectly influence public policy on climate change through any of the following? (tick all that apply) Direct engagement with policy makers Trade associations
CC2.3a
On what issues have you been engaging directly with policy makers?

Focus of legislation
Corporate Position
Details of engagement
Proposed legislative solution
Mandatory carbon reporting
Support Although not legislated, Aspen is committed to reporting to the Carbon Disclosure Project on an annual basis through the National Business Initiative.
Industry context to be applied in interpretation of information in CDP submissions, through direct engagement with the reporting company.
Energy efficiency Support
At COP17, Aspen Pharmacare made a commitment to participate in the Energy Efficiency Leadership Network (EELN). Where relevant, the Aspen Group Risk and Sustainability Manager, or designated nominee, represents the Pharmaceutical industry on matters impacting climate change particularly groups focussing on the healthcare industry.
Energy efficiency projects need to contribute to the business sustainability and must demonstrate return on investment. A national plan, which incentivises business, to reduce their carbon footprint will support the implementation of energy efficiency projects. In addition, national carbon reduction plans need to weight legislated obligations across industries appropriately with due regard of economic conditions impacting general industry sustainability in the relevant countries.
Carbon tax Support with minor exceptions
Aspen consults with its external tax auditors and with relevant industry forums on this matter.
Consider the objective of carbon taxes in relation to other commercial factors which impact the sustainability of business in the relevant countries.
CC2.3b
Are you on the Board of any trade associations or provide funding beyond membership? Yes
CC2.3c
Please enter the details of those trade associations that are likely to take a position on climate change legislation
Trade association
Is your position on
climate change
consistent with theirs?
Please explain the trade association's position
How have you, or are you attempting to, influence the position?
Energy Efficiency Leadership Network (EELN)
Consistent Maintain an awareness of energy efficiency, proposed legislations/regulations, new energy technologies in business and identify risks and opportunities thereof.
Attaining guidance on implementation of energy management and climate change strategies into the Healthcare/pharmaceutical industry.
National Consistent National Business Initiative (NBI) is one of the key platforms for engagement Attaining guidance on how to implement

Trade association
Is your position on
climate change
consistent with theirs?
Please explain the trade association's position
How have you, or are you attempting to, influence the position?
Business Initiative
between business and the Government. climate change strategies into the Healthcare/pharmaceutical industry.
Business Unity South Africa (BUSA)
Consistent
Business Unity in South Africa (BUSA) serves as the interface between businesses in SA and government on high level macroeconomic issues to ensure that businesses are able to play meaningful role in contributing to national objectives in a feasible manner for all stakeholders. BUSA supports the need to move to a lower carbon intensive economy as being in the long run interests of South Africa. However, it believes that the carbon tax proposal needs to be further critically interrogated with regards to the impact of such tax on the economy. In addition, BUSA believes there remain a number of challenges around the implementation and administration of the carbon tax proposal that need to be taken into account in the final design if serious unintended consequences are to be avoided.
Aspen participates as required to support BUSA in aiding a better understanding of the carbon tax to the healthcare industry
Clean Energy Programme (Australia)
Consistent The Clean Energy Programme was designed solely around Scope 1 emissions with the ensuing “Carbon Pricing Scheme (CPS)” being legislated. This was to orchestrate a shift from coal generated electricity towards lower carbon sources.
Aspen participates as required to support the Clean Energy Programme in Australia.
CC2.3d
Do you publically disclose a list of all the research organizations that you fund?
CC2.3e
Do you fund any research organizations to produce or disseminate public work on climate change?
CC2.3f
Please describe the work and how it aligns with your own strategy on climate change
CC2.3g
Please provide details of the other engagement activities that you undertake
CC2.3h
What processes do you have in place to ensure that all of your direct and indirect activities that influence policy are consistent with your overall climate change strategy? All direct and indirect activities are communicated as per the ISO 14001 Environmental Management Systems Communication procedure for ISO certified facilities, ensuring consistency with the overall group environmental management principles and sustainability reporting structures. A culture of continuous improvement exists at the South African, Australian and German operations.
CC2.3i
Please explain why you do not engage with policy makers
Further Information
No further information
Page: CC3. Targets and Initiatives
CC3.1
Did you have an emissions reduction target that was active (ongoing or reached completion) in the reporting year? No
CC3.1a
Please provide details of your absolute target
ID
Scope
% of emissions in
scope
% reduction from base year
Base year
Base year emissions
(metric tonnes CO2e)
Target year
Comment
CC3.1b
Please provide details of your intensity target
ID
Scope
% of emissions in
scope
% reduction from base year
Metric
Base year
Normalized base year emissions
Target year
Comment
CC3.1c
Please also indicate what change in absolute emissions this intensity target reflects
ID
Direction of change anticipated in absolute Scope 1+2 emissions at
target completion?
% change anticipated in absolute Scope 1+2
emissions
Direction of change anticipated in absolute Scope 3 emissions at target
completion?
% change anticipated in absolute Scope 3
emissions
Comment
CC3.1d
For all of your targets, please provide details on the progress made in the reporting year
ID
% complete (time)
% complete (emissions)
Comment

CC3.1e
Please explain (i) why you do not have a target; and (ii) forecast how your emissions will change over the next five years Focus is being given to implementing effective systems to measure energy usage and savings and to identify feasible conservation projects which will yield meaningful reductions within the South African and Australian Operations. Once this is in place, consideration will be given to establishing medium term targets for energy conservation projects, and the related reduction of the carbon footprint. Air handling units for the maintenance of environmental controls contribute to a large portion of the sites energy consumption (approximately 70%) as such conservation on other variable consumption systems will not contribute materially to a reduction in Aspen’s carbon footprint. However, the commitment to efficient utilisation of scare resources remains. In South Africa, the Department of Environmental Affairs is conducting an exercise to establish appropriate carbon budgets, Aspen is awaiting clarity with respect to this and the carbon tax process, so that meaningful targets can be set. The German site has already implemented an ISO 50001 energy management system in order to be able to meet the targets that have been set by the German Government. ii) An increase in the reporting of total energy consumption for the Aspen Group is expected over the following three years with the addition of three acquired manufacturing sites and expansion of existing facilities. A rationalisation project, which will see the reduction of production volumes for the Australian sites and the closure of some of the facilities, will indirectly reduce greenhouse gas emissions in the region – two of the three remaining facilities are scheduled to be closed by December 2014.
CC3.2
Does the use of your goods and/or services directly enable GHG emissions to be avoided by a third party? No
CC3.2a
Please provide details of how the use of your goods and/or services directly enable GHG emissions to be avoided by a third party
CC3.3

Did you have emissions reduction initiatives that were active within the reporting year (this can include those in the planning and implementation phases) Yes
CC3.3a
Please identify the total number of projects at each stage of development, and for those in the implementation stages, the estimated CO2e savings
Stage of development
Number of projects
Total estimated annual CO2e savings in metric tonnes CO2e (only for rows marked *)
Under investigation 3 To be implemented* 0 Implementation commenced* 0 Implemented* 2 971.21 Not to be implemented 0
CC3.3b
For those initiatives implemented in the reporting year, please provide details in the table below
Activity type
Description of activity
Estimated annual CO2e
savings (metric
tonnes CO2e)
Annual monetary savings
(unit currency -
as specified in CC0.4)
Investment required
(unit currency -
as specified in
CC0.4)
Payback period
Estimated lifetime of
the initiative, years
Comment
Low carbon a) Installation of energy efficient lighting 116.31 358795 1131925 1-3 Ongoing Implemented at 3

Activity type
Description of activity
Estimated annual CO2e
savings (metric
tonnes CO2e)
Annual monetary savings
(unit currency -
as specified in CC0.4)
Investment required
(unit currency -
as specified in
CC0.4)
Payback period
Estimated lifetime of
the initiative, years
Comment
energy installation
b) Reduction of Scope 2 c) Voluntary activity d) Completed and ongoing
years facilities within the South African Operations.
Energy efficiency: Processes
a) Energy conservation through power factor correction b) Reduction of Scope 2 c) Voluntary activity d) Completed and ongoing
854.9 278372 310165 1-3 years Ongoing
Implemented in 4 facilities within South African Operations.
CC3.3c
What methods do you use to drive investment in emissions reduction activities?
Method
Comment
Dedicated budget for energy efficiency
Investment in emission reduction activities is primarily driven by Aspen's commitment to continual improvement as a responsible corporate citizen and potential future regulatory changes, as well as sustainable access to scarce resources e.g. water, and the rising cost and security of electricity supply in South Africa. Energy efficiency is factored into all expansion and replacement projects and project teams are tasked with ensuring that equipment procured and processes installed are energy efficient and consume the least possible amount of resources. In South African Operations investments approximately R1, 5 million were made towards energy projects and in Germany an investment of R650 000 (€ 63 000) was made for the ISO 50 001 implementation and certification. Additional costs are expected in future for the maintenance and auditing of the system.
CC3.3d
If you do not have any emissions reduction initiatives, please explain why not

Further Information
No further information.
Page: CC4. Communication
CC4.1
Have you published information about your organization’s response to climate change and GHG emissions performance for this reporting year in places other than in your CDP response? If so, please attach the publication(s)
Publication
Page/Section reference
Attach the document
In voluntary communications (complete) 36-37 https://www.cdp.net/sites/2014/69/1069/Investor CDP 2014/Shared
Documents/Attachments/CC4.1/Aspen Sustainability 2013.pdf
Further Information
No further information.
Module: Risks and Opportunities
Page: CC5. Climate Change Risks
CC5.1
Have you identified any climate change risks that have the potential to generate a substantive change in your business operations, revenue or expenditure? Tick all that apply

Risks driven by changes in regulation Risks driven by changes in physical climate parameters
CC5.1a
Please describe your risks driven by changes in regulation
Risk driver
Description
Potential impact
Timeframe
Direct/ Indirect
Likelihood
Magnitude of impact
Estimated financial
implications
Management
method
Cost of
management
Carbon taxes
A Carbon Tax Policy Paper was published in South Africa for comment in May 2013 stating that the South African government aims to reduce GHG emissions by 34 % by 2020 and 42 % by 2025. This was after the Minister of Finance had stated that a carbon tax will be implemented by 2015. However, introduction of the tax was postponed to
Increased operational cost
1 to 3 years Direct Virtually
certain Low-medium
The Carbon Tax Policy Paper refers to the implementation of a carbon tax rate of R120 per ton of CO2e increasing at 10 per cent per annum during the first phase. When the tax-free threshold and additional relief are taken into account, the effective tax rate will range between R12- R48 per ton of CO2e. Based on the current proposed tariff structure the potential impact
Aspen’s Risk and Sustainability and Tax/Treasury departments are responsible for monitoring developments regarding carbon taxes. Aspen will initiate consultation with its external tax auditors on this matter to maintain an understanding of the potential inherent risks to the business.
Not yet established.

Risk driver
Description
Potential impact
Timeframe
Direct/ Indirect
Likelihood
Magnitude of impact
Estimated financial
implications
Management
method
Cost of
management
2016 in order to align the design of the carbon tax to desired emissions reductions outcomes being developed by the Department of Environmental Affairs and to allow for further public consultation. This will result in a number of adjustments to proposed policies such as a reduction in Eskom's tax liability, with a credit for the renewable energy premium, limiting the potential effect of the tax on electricity prices. Among the new changes expected in the final carbon tax are reducing power utility Eskom’s tax
is estimated to be under R1 million for the South African Operations.

Risk driver
Description
Potential impact
Timeframe
Direct/ Indirect
Likelihood
Magnitude of impact
Estimated financial
implications
Management
method
Cost of
management
liability and addressing concern about international competitiveness, including a formula to adjust the basic percentage tax-free threshold to reward over-performance. National reduction targets may have an impact on existing and new permissions as well as potential energy costs therefore increasing Aspen’s operational cost. We have provisionally calculated the potential costs to the company although implementation methodology is uncertain i.e. cost of tax, cost administrations and so forth.
General environmental
Electricity and water are critical
Reduction/disruption in production
1 to 3 years Direct About as
likely as Medium In South Africa,Aspen is
Planning and implementation
Variable costs
Risk driver
Description
Potential impact
Timeframe
Direct/ Indirect
Likelihood
Magnitude of impact
Estimated financial
implications
Management
method
Cost of
management
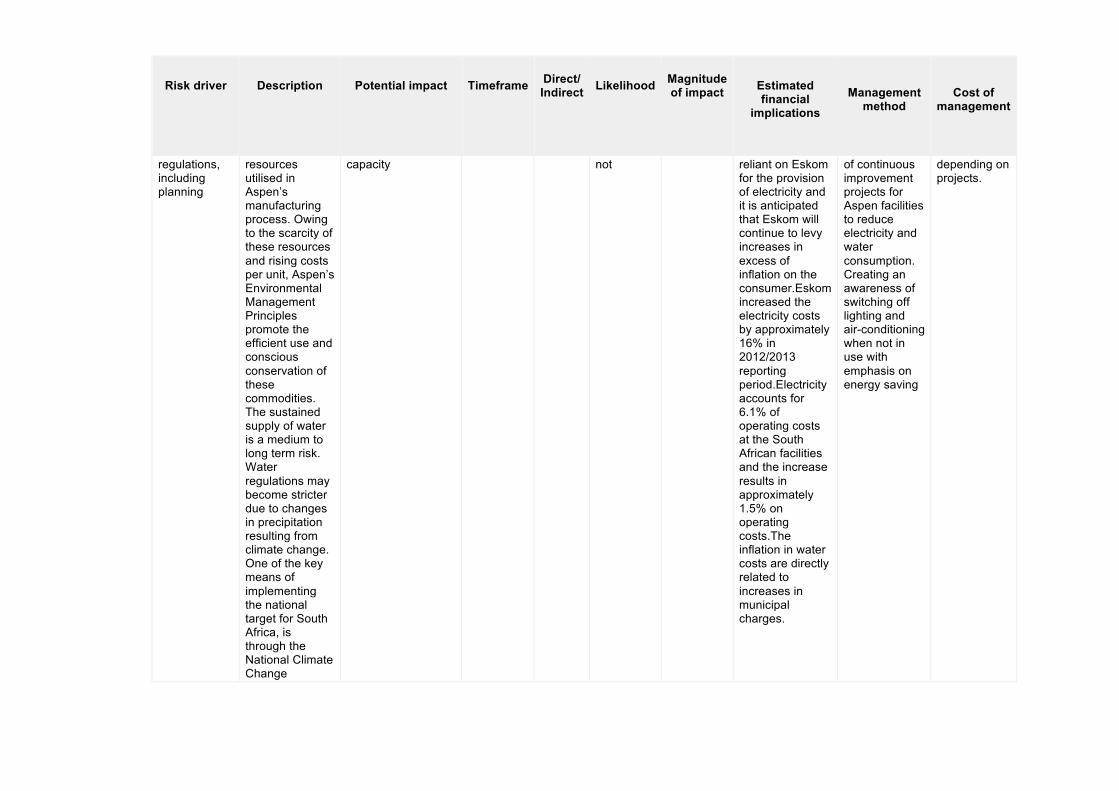
regulations, including planning
resources utilised in Aspen’s manufacturing process. Owing to the scarcity of these resources and rising costs per unit, Aspen’s Environmental Management Principles promote the efficient use and conscious conservation of these commodities. The sustained supply of water is a medium to long term risk. Water regulations may become stricter due to changes in precipitation resulting from climate change. One of the key means of implementing the national target for South Africa, is through the National Climate Change
capacity not reliant on Eskom for the provision of electricity and it is anticipated that Eskom will continue to levy increases in excess of inflation on the consumer.Eskom increased the electricity costs by approximately 16% in 2012/2013 reporting period.Electricity accounts for 6.1% of operating costs at the South African facilities and the increase results in approximately 1.5% on operating costs.The inflation in water costs are directly related to increases in municipal charges.
of continuous improvement projects for Aspen facilities to reduce electricity and water consumption. Creating an awareness of switching off lighting and air-conditioning when not in use with emphasis on energy saving
depending on projects.

Risk driver
Description
Potential impact
Timeframe
Direct/ Indirect
Likelihood
Magnitude of impact
Estimated financial
implications
Management
method
Cost of
management
Response white paper 2011. The policy confirms that climate change is already a measurable reality along with other developing countries. The White paper presents the South African Government’s vision for an effective climate change response and long term plans in creating a low-carbon economy and society. Through consistent application of sound environmental management principles by each business in the Group, Aspen strives towards supporting the Government mitigation plans as well as containment and
Risk driver
Description
Potential impact
Timeframe
Direct/ Indirect
Likelihood
Magnitude of impact
Estimated financial
implications
Management
method
Cost of
management
reduction of its carbon footprint.
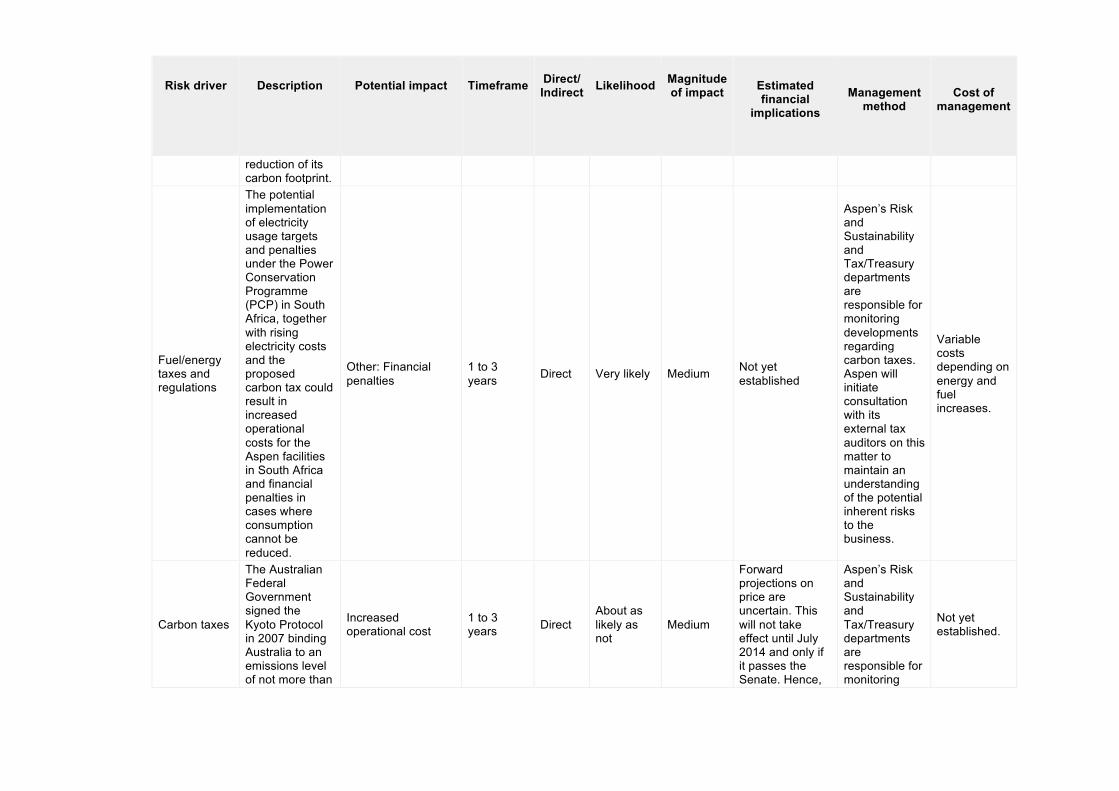
Fuel/energy taxes and regulations
The potential implementation of electricity usage targets and penalties under the Power Conservation Programme (PCP) in South Africa, together with rising electricity costs and the proposed carbon tax could result in increased operational costs for the Aspen facilities in South Africa and financial penalties in cases where consumption cannot be reduced.
Other: Financial penalties
1 to 3 years Direct Very likely Medium Not yet
established
Aspen’s Risk and Sustainability and Tax/Treasury departments are responsible for monitoring developments regarding carbon taxes. Aspen will initiate consultation with its external tax auditors on this matter to maintain an understanding of the potential inherent risks to the business.
Variable costs depending on energy and fuel increases.
Carbon taxes
The Australian Federal Government signed the Kyoto Protocol in 2007 binding Australia to an emissions level of not more than
Increased operational cost
1 to 3 years Direct
About as likely as not
Medium
Forward projections on price are uncertain. This will not take effect until July 2014 and only if it passes the Senate. Hence,
Aspen’s Risk and Sustainability and Tax/Treasury departments are responsible for monitoring
Not yet established.

Risk driver
Description
Potential impact
Timeframe
Direct/ Indirect
Likelihood
Magnitude of impact
Estimated financial
implications
Management
method
Cost of
management
108% of the 1990 emission levels by 2012. The ensuing program called the “Clean Energy Program (CEP)” aimed at reducing GHG emissions in Australia by 5% below 2000 levels and 80% by 2050.With a change in the Federal Government in 2013 the Clean Energy Programme (CEP) has been replaced with a “Direct Action Plan (DAP)”. An election commitment, as part of the DAP, was to repeal the Carbon Tax
there is uncertainty re the future of the Carbon Tax.
developments regarding carbon taxes. Aspen will initiate consultation with its external tax auditors on this matter to maintain an understanding of the potential inherent risks to the business.
Emission reporting obligations
Increased reporting requirements in terms of SRI, GRI, CDP and submissions to government authorities. For example, In
Increased operational cost Direct Very likely Medium Not currently
established.
The individual business units are responsible for providing the information to the Group Risk and Sustainability
Not currently established.

Risk driver
Description
Potential impact
Timeframe
Direct/ Indirect
Likelihood
Magnitude of impact
Estimated financial
implications
Management
method
Cost of
management
future, the South African Department of Environmental Affairs plans to implements mandatory emission reporting and Germany is required to report on emission performance.
Department for collation into the various reports required.
CC5.1b
Please describe your risks that are driven by change in physical climate parameters
Risk driver
Description
Potential impact
Timeframe
Direct/ Indirect
Likelihood
Magnitude of impact
Estimated financial
implications
Management
method
Cost of
management
Change in mean (average) precipitation
Climate change may result in water scarcity in some areas in which Aspen operates . Changes in global precipitation patterns may impact on the
Reduction/disruption in production capacity
Unknown Direct Likely Medium
The financial implications cannot be quantified as the impact will be determined by the severity of the water shortage or flood. An example could
In response to energy and water scarcity, continuous improvement projects are put in place to recycle water and increase energy efficiency.
Variable costs depending on project. For Example: The installation of one HVAC chiller control system, used in a resource conservation project, costs

Risk driver
Description
Potential impact
Timeframe
Direct/ Indirect
Likelihood
Magnitude of impact
Estimated financial
implications
Management
method
Cost of
management
crops used in the synthesis of raw materials. For example: Floods in a source country resulted in a shortage of a crop (Sapolins) which is used in the production of Active Pharmaceutical Ingredients. Manufacturers had to pay a premium in order to secure stock.
be that in the event of water scarcity, Aspen might have to source alternative water sources such as underground and hence drill boreholes or other feasible technologies.
Projects implemented previously include installation of automated HVAC chiller control systems, installation of occupancy sensors and replacement of high wattage lighting with high efficiency light fittings. The Procurement Department source from more than one geographical region, where possible.
approximately R161 000.
Induced changes in natural resources
Global temperature increases caused by climate change could impact on agricultural crops utilised in the synthesis of raw materials. In addition, elevated temperatures may result in higher energy usage in order to
Reduction/disruption in production capacity
Unknown Indirect (Supply chain)
About as likely as not
Low
The financial implications have not been quantified as the risk is remote
The Procurement department manage relationships with key suppliers and sufficient interaction takes place to keep abreast of any risks facing suppliers which could indirectly impact Aspen. In addition, alternative suppliers for key
No costs have been incurred.

Risk driver
Description
Potential impact
Timeframe
Direct/ Indirect
Likelihood
Magnitude of impact
Estimated financial
implications
Management
method
Cost of
management
maintain optimum temperature and humidity levels in the production facilities. For example: Droughts in the USA and Europe resulted in reduced maize production and Aspen was required to secure stock from an alternative region.
active pharmaceutical ingredients are registered in order to diversify the risk of reliance on a single supplier of material. Commodity trends are monitored to identify and mitigate foreseeable risks impacting sustainability of raw material supply.
CC5.1c
Please describe your risks that are driven by changes in other climate-related developments
Risk driver
Description
Potential impact
Timeframe
Direct/ Indirect
Likelihood
Magnitude of impact
Estimated Financial
Implications
Management
method
Cost of
management
CC5.1d
Please explain why you do not consider your company to be exposed to risks driven by changes in regulation that have the potential to generate a substantive change in your business operations, revenue or expenditure
CC5.1e
Please explain why you do not consider your company to be exposed to risks driven by physical climate parameters that have the potential to generate a substantive change in your business operations, revenue or expenditure
CC5.1f
Please explain why you do not consider your company to be exposed to risks driven by changes in other climate-related developments that have the potential to generate a substantive change in your business operations, revenue or expenditure a. No other specific climate related risks have been identified, while potential reputational risk, should customers consider Aspen not to be acting responsibly with respect to climate change management is a possible risk, this is deemed to be remote as Aspen’s corporate objective is to act as a responsible corporate citizen and sustainability is key to our business. b. No costs have been associated with these risks. c. Geographical areas considered - South Africa, Australia and Germany. d. In the next 1-5 years.
Further Information
No further information.
Page: CC6. Climate Change Opportunities
CC6.1

Have you identified any climate change opportunities that have the potential to generate a substantive change in your business operations, revenue or expenditure? Tick all that apply Opportunities driven by changes in regulation Opportunities driven by changes in physical climate parameters
CC6.1a
Please describe your opportunities that are driven by changes in regulation
Opportunity driver
Description
Potential impact
Timeframe
Direct/Indirect
Likelihood
Magnitude of impact
Estimated financial
implications
Management
method
Cost of
management
Fuel/energy taxes and regulations
Aspen Pharmacare is making considerable advances in improving electricity efficiency at all facilities in the South African operations. Regulations could thus offer beneficial opportunities from energy efficiency investments and new technology. Government incentives could provide motivation to invest more in energy and fuel
Reduced operational costs
3 to 6 years Direct More likely
than not Medium
The potential financial implications of the opportunity are currently unknown, however potentially of significant financial savings could be realised through rebates and incentives.
Effective metering, trend analysis of energy consumption and setting sound objectives and targets to reduce consumption by targeting high consumers e.g. HVAC systems (Heat, Ventilation Air conditioning) and tracking the reductions. Aspen has installed automated chiller controls, energy efficient lighting, motion sensors and more recently power factor correction. Aspen also conducts on-going awareness training to all
Considerable investments of approximately R1.5million have been made towards resource conservation projects.

Opportunity driver
Description
Potential impact
Timeframe
Direct/Indirect
Likelihood
Magnitude of impact
Estimated financial
implications
Management
method
Cost of
management
efficiency and new technology.
employees on energy, water and waste reduction.
Fuel/energy taxes and regulations
Tax refunds of approximately € 150000 (R1,6-million) could be received if Aspen Bad Oldesloe (German site) meets the required targets set by the German Government.
Reduced operational costs
1 to 3 years Direct Virtually
certain Medium-high
Bad Oldesloe, our German site, could receive tax refunds up to € 150000 (R1,6 million).
The German site successfully implemented ISO 50001 energy management system to accurately monitor and report energy conservation projects and the corresponding decrease in emissions.
A total investment of approximately € 63 000 (R650 000) to implement then additional costs for maintenance and auditing of the system.
Carbon taxes
Under the Federal Government’s CEP (Clean Energy Programme) a “Clean Technology Investment Program (CTIP)” enabled the Dandenong site to successfully secure a Government Grant. This will enable the installation of new technology with the aim to reduce the annualised
Reduced operational costs
1 to 3 years Direct Very likely Low
Under the Federal Government’s CEP (Clean Energy Programme) a “Clean Technology Investment Program (CTIP)” enabled the Dandenong site to successfully secure a Government Grant. This enabled the installation of new technology with the aim to reduce the annual
This grant covered 33.33% of a AUS$1.26Million capital investment. An annual saving of AUS$533k is expected from the 5000MW/h. reduction in electricity consumption
Grant application costs and costs associated with follow up documentation and meetings.

Opportunity driver
Description
Potential impact
Timeframe
Direct/Indirect
Likelihood
Magnitude of impact
Estimated financial
implications
Management
method
Cost of
management
consumption of electricity by 5000 MW/h
consumption of electricity by 5000 MW/h
CC6.1b
Please describe the opportunities that are driven by changes in physical climate parameters
Opportunity driver
Description
Potential impact
Timeframe
Direct/ Indirect
Likelihood
Magnitude of impact
Estimated financial
implications
Management
method
Cost of
management
Change in precipitation pattern
Opportunities to develop supply chains in different geographic areas and more regional and local supply chains can be considered.
Other: Increased negotiation power. Decreased reliance on one geographical region as a source of supply.
Unknown Direct More likely than not
Low-medium
Not currently established.
Aspen sources raw materials from multiple geographic regions, where possible, to eliminate climate change risks, e.g. monsoon and drought areas.
Not currently established.
Induced changes in natural resources
Opportunities to investigate and install alternative sources of energy, as more suppliers offer wider product offerings and costs are reduced.
Other: Decreased reliance on fossil fuel based resources e.g. coal.
Unknown Direct More likely than not
Low-medium
Not currently established.
Aspen to continue to evaluate cost effective alternative energy sources.
Not currently established.
CC6.1c

Please describe the opportunities that are driven by changes in other climate-related developments
Opportunity driver
Description
Potential impact
Timeframe
Direct/ Indirect
Likelihood
Magnitude of impact
Estimated financial
implications
Management
method
Cost of
management
CC6.1d
Please explain why you do not consider your company to be exposed to opportunities driven by changes in regulation that have the potential to generate a substantive change in your business operations, revenue or expenditure
CC6.1e
Please explain why you do not consider your company to be exposed to opportunities driven by physical climate parameters that have the potential to generate a substantive change in your business operations, revenue or expenditure
CC6.1f
Please explain why you do not consider your company to be exposed to opportunities driven by changes in other climate-related developments that have the potential to generate a substantive change in your business operations, revenue or expenditure i. No other climate related risks have been identified, while potential reputational risk, should customers consider Aspen not to be acting responsibly with respect to climate change management is a possible risk, this is deemed to be remote as Aspen’s corporate objective is to act as a responsible corporate citizen and sustainability is key to our business. ii. No costs have been associated with these risks. iii. Geographical areas considered - South Africa, Germany and Australia

iv. In the next 1-5 years.
Further Information
No further information.
Module: GHG Emissions Accounting, Energy and Fuel Use, and Trading
Page: CC7. Emissions Methodology
CC7.1
Please provide your base year and base year emissions (Scopes 1 and 2)
Base year
Scope 1 Base year emissions (metric tonnes
CO2e)
Scope 2 Base year emissions (metric
tonnes CO2e)
Fri 01 Jul 2011 - Sat 30 Jun 2012
6774 88088
CC7.2
Please give the name of the standard, protocol or methodology you have used to collect activity data and calculate Scope 1 and Scope 2 emissions
Please select the published methodologies that you use
The Greenhouse Gas Protocol: A Corporate Accounting and Reporting Standard (Revised Edition)

CC7.2a
If you have selected "Other" in CC7.2 please provide details of the standard, protocol or methodology you have used to collect activity data and calculate Scope 1 and Scope 2 emissions Not applicable.
CC7.3
Please give the source for the global warming potentials you have used
Gas
Reference
CO2 IPCC Second Assessment Report (SAR - 100 year) HFCs IPCC Fourth Assessment Report (AR4 - 100 year) CH4 IPCC Fourth Assessment Report (AR4 - 100 year) N2O IPCC Fourth Assessment Report (AR4 - 100 year)
CC7.4
Please give the emissions factors you have applied and their origin; alternatively, please attach an Excel spreadsheet with this data at the bottom of this page
Fuel/Material/Energy
Emission Factor
Unit
Reference
Diesel/Gas oil 2.676 kg CO2e per liter DEFRA, 2012 Motor gasoline 2.314 kg CO2e per liter DEFRA, 2012 Kerosene 2.542 kg CO2e per liter DEFRA, 2012 Electricity 1.03 Other: kg CO2e per kWh ESKOM, South Africa
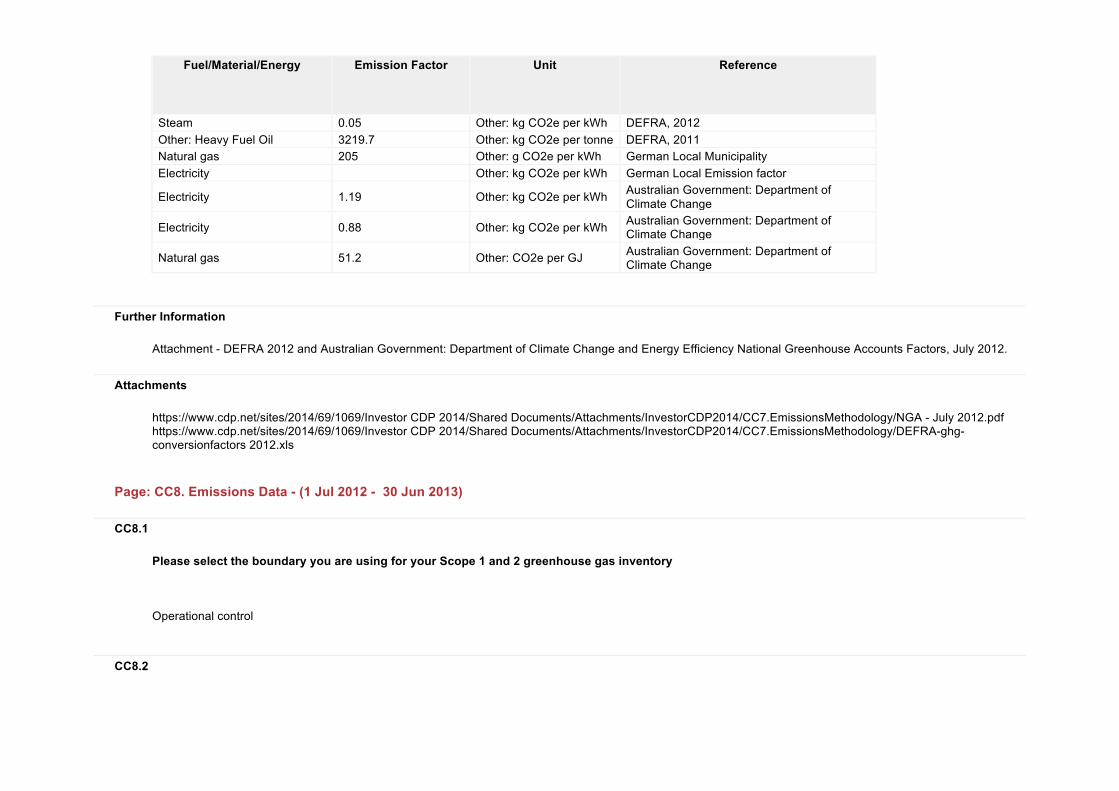
Fuel/Material/Energy
Emission Factor
Unit
Reference
Steam 0.05 Other: kg CO2e per kWh DEFRA, 2012 Other: Heavy Fuel Oil 3219.7 Other: kg CO2e per tonne DEFRA, 2011 Natural gas 205 Other: g CO2e per kWh German Local Municipality Electricity Other: kg CO2e per kWh German Local Emission factor
Electricity 1.19 Other: kg CO2e per kWh Australian Government: Department of Climate Change
Electricity 0.88 Other: kg CO2e per kWh Australian Government: Department of Climate Change
Natural gas 51.2 Other: CO2e per GJ Australian Government: Department of Climate Change
Further Information
Attachment - DEFRA 2012 and Australian Government: Department of Climate Change and Energy Efficiency National Greenhouse Accounts Factors, July 2012.
Attachments
https://www.cdp.net/sites/2014/69/1069/Investor CDP 2014/Shared Documents/Attachments/InvestorCDP2014/CC7.EmissionsMethodology/NGA - July 2012.pdf https://www.cdp.net/sites/2014/69/1069/Investor CDP 2014/Shared Documents/Attachments/InvestorCDP2014/CC7.EmissionsMethodology/DEFRA-ghg-conversionfactors 2012.xls
Page: CC8. Emissions Data - (1 Jul 2012 - 30 Jun 2013)
CC8.1
Please select the boundary you are using for your Scope 1 and 2 greenhouse gas inventory Operational control
CC8.2
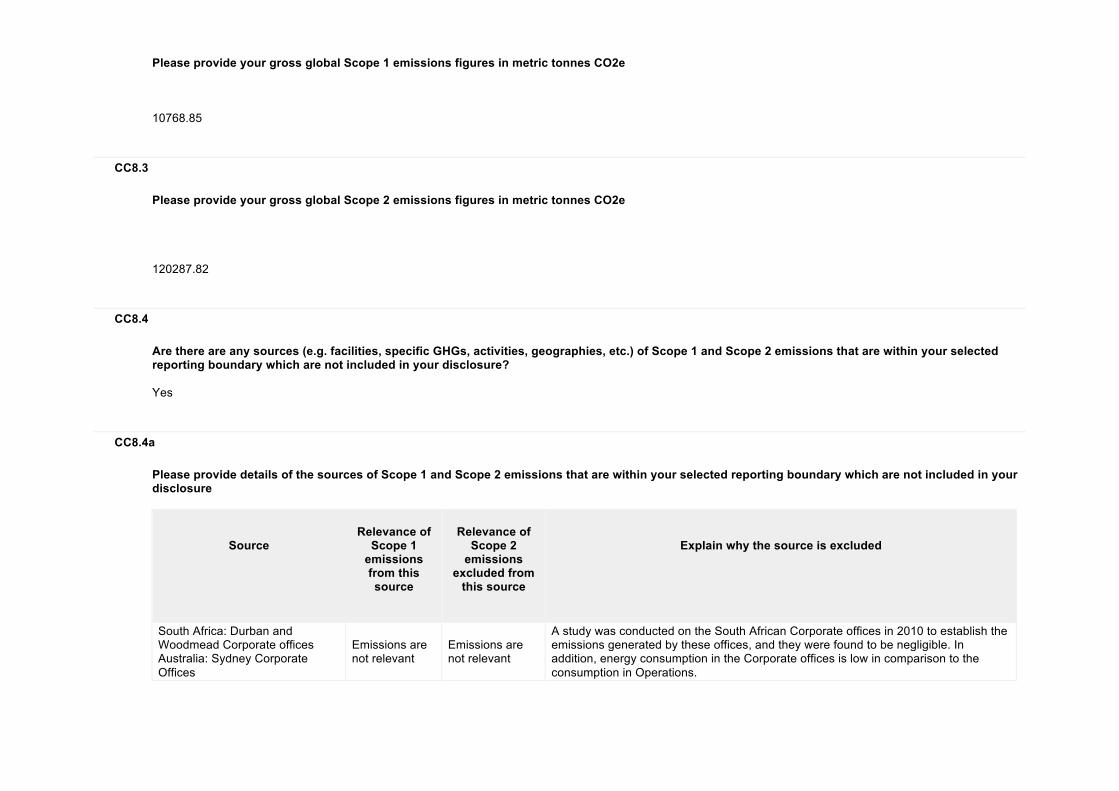
Please provide your gross global Scope 1 emissions figures in metric tonnes CO2e 10768.85
CC8.3
Please provide your gross global Scope 2 emissions figures in metric tonnes CO2e 120287.82
CC8.4
Are there are any sources (e.g. facilities, specific GHGs, activities, geographies, etc.) of Scope 1 and Scope 2 emissions that are within your selected reporting boundary which are not included in your disclosure? Yes
CC8.4a
Please provide details of the sources of Scope 1 and Scope 2 emissions that are within your selected reporting boundary which are not included in your disclosure
Source
Relevance of
Scope 1 emissions from this source
Relevance of
Scope 2 emissions
excluded from this source
Explain why the source is excluded
South Africa: Durban and Woodmead Corporate offices Australia: Sydney Corporate Offices
Emissions are not relevant
Emissions are not relevant
A study was conducted on the South African Corporate offices in 2010 to establish the emissions generated by these offices, and they were found to be negligible. In addition, energy consumption in the Corporate offices is low in comparison to the consumption in Operations.

CC8.5
Please estimate the level of uncertainty of the total gross global Scope 1 and 2 emissions figures that you have supplied and specify the sources of uncertainty in your data gathering, handling and calculations
Scope 1
emissions: Uncertainty range
Scope 1
emissions: Main sources of uncertainty
Scope 1 emissions: Please expand
on the uncertainty in your data
Scope 2
emissions: Uncertainty range
Scope 2
emissions: Main sources of uncertainty
Scope 2 emissions: Please expand
on the uncertainty in your data
More than 2% but less than or equal to 5%
Other: Published Emission Factors
Published emission factors were used, which take into account certain assumptions and have varying levels of certainty.
More than 2% but less than or equal to 5%
Published emission factors were used, which take into account certain assumptions and have varying levels of certainty.
CC8.6
Please indicate the verification/assurance status that applies to your reported Scope 1 emissions Third party verification or assurance complete
CC8.6a
Please provide further details of the verification/assurance undertaken for your Scope 1 emissions, and attach the relevant statements
Type of verification or
assurance
Attach the statement
Page/section
reference
Relevant standard
Proportion of reported Scope 1
emissions verified (%)

Type of verification or
assurance
Attach the statement
Page/section
reference
Relevant standard
Proportion of reported Scope 1
emissions verified (%)
Limited assurance
https://www.cdp.net/sites/2014/69/1069/Investor CDP 2014/Shared Documents/Attachments/CC8.6a/Aspen 2013 ERM Sustainability Development Report Asssurance Statement.pdf
Page 1 AA1000AS 100
CC8.6b
Please provide further details of the regulatory regime to which you are complying that specifies the use of Continuous Emissions Monitoring Systems (CEMS)
Regulation
% of emissions covered by the system
Compliance period
Evidence of submission
CC8.7
Please indicate the verification/assurance status that applies to your reported Scope 2 emissions Third party verification or assurance complete
CC8.7a
Please provide further details of the verification/assurance undertaken for your Scope 2 emissions, and attach the relevant statements

Type of verification or
assurance
Attach the statement
Page/Section reference
Relevant standard
Proportion of
Scope 2 emissions verified (%)
Limited assurance
https://www.cdp.net/sites/2014/69/1069/Investor CDP 2014/Shared Documents/Attachments/CC8.7a/Aspen 2013 ERM Sustainability Development Report Asssurance Statement.pdf
Page 1 AA1000AS 100
CC8.8
Please identify if any data points other than emissions figures have been verified as part of the third party verification work undertaken
Additional data points verified
Comment
Emissions reduction activities The auditor verified Aspens Sustainability KPI submission.
CC8.9
Are carbon dioxide emissions from biologically sequestered carbon relevant to your organization? No
CC8.9a
Please provide the emissions from biologically sequestered carbon relevant to your organization in metric tonnes CO2
Further Information

Aspen Sustainability Report which is referenced in the Assurance Statement is attached.
Attachments
https://www.cdp.net/sites/2014/69/1069/Investor CDP 2014/Shared Documents/Attachments/InvestorCDP2014/CC8.EmissionsData(1Jul2012-30Jun2013)/Aspen Sustainability 2013_Hi-res.pdf
Page: CC9. Scope 1 Emissions Breakdown - (1 Jul 2012 - 30 Jun 2013)
CC9.1
Do you have Scope 1 emissions sources in more than one country? Yes
CC9.1a
Please break down your total gross global Scope 1 emissions by country/region
Country/Region
Scope 1 metric tonnes CO2e
South Africa 4030.22 Germany 3219.86 Australia 3518.77
CC9.2
Please indicate which other Scope 1 emissions breakdowns you are able to provide (tick all that apply)

By facility By activity
CC9.2a
Please break down your total gross global Scope 1 emissions by business division
Business division
Scope 1 emissions (metric tonnes CO2e)
CC9.2b
Please break down your total gross global Scope 1 emissions by facility
Facility
Scope 1 emissions (metric tonnes CO2e)
Latitude
Longitude
Port Elizabeth (SA) 354.64 -33.9167 25.5667 East London (SA) 1226.19 -32.9810 27.8282 Johannesburg (SA - Nutritionals) 258.22 -25.9874 28.2418 Cape Town (SA - Fine Chemicals) 2191.18 -33.9157 18.5770 Aspen Bad Oldesloe (Germany) 3219.86 53.8009 10.3983 Dandenong (Australia) 1961.47 -37.9810 145.2150 Croydon (Australia) 372.99 -37.7963 145.2810 Noble Park (Australia) 946.43 -37.9670 145.1760 Baulkham Hills (Australia) 237.88 -33.7629 150.9921
CC9.2c

Please break down your total gross global Scope 1 emissions by GHG type
GHG type
Scope 1 emissions (metric tonnes CO2e)
CC9.2d
Please break down your total gross global Scope 1 emissions by activity
Activity
Scope 1 emissions (metric tonnes CO2e)
Company owned Mobile transport 156.44 Stationery fuel combustion 3194.84 Fugitive emissions 717.77 Natural Gas 6645.79
CC9.2e
Please break down your total gross global Scope 1 emissions by legal structure
Legal structure
Scope 1 emissions (metric tonnes CO2e)
Further Information
No further information
Page: CC10. Scope 2 Emissions Breakdown - (1 Jul 2012 - 30 Jun 2013)

CC10.1
Do you have Scope 2 emissions sources in more than one country? Yes
CC10.1a
Please break down your total gross global Scope 2 emissions and energy consumption by country/region
Country/Region
Scope 2 metric tonnes CO2e
Purchased and consumed electricity, heat, steam or cooling
(MWh)
Purchased and consumed low carbon electricity, heat, steam or cooling accounted for CC8.3 (MWh)
South Africa 90437.66 103554 0 Germany 1009.86 0 9257 Australia 28840.31 0 23054
CC10.2
Please indicate which other Scope 2 emissions breakdowns you are able to provide (tick all that apply) By facility By activity
CC10.2a
Please break down your total gross global Scope 2 emissions by business division

Business division
Scope 2 emissions (metric tonnes CO2e)
CC10.2b
Please break down your total gross global Scope 2 emissions by facility
Facility
Scope 2 emissions (metric tonnes CO2e)
Port Elizabeth (South Africa) 60371.87 East London (South Africa) 15409.33 Johannesburg (Nutritionals) 7114.02 Fine Chemicals Corporation (Cape Town) 7542.44 Bad Oldesloe (Germany) 1009.86 Dangenong (Australia) 17799.83 Croydon (Australia) 2714.46 Noble Park (Australia) 5561.85 Baulkham Hills (Australia) 2764.17
CC10.2c
Please break down your total gross global Scope 2 emissions by activity
Activity
Scope 2 emissions (metric tonnes CO2e)
Electricity 119209.48 Steam 1078.34

CC10.2d
Please break down your total gross global Scope 2 emissions by legal structure
Legal structure
Scope 2 emissions (metric tonnes CO2e)
Further Information
Note: South Africa Scope 2 includes both electricity and steam purchased. Australia and Germany electricity is comprised of a mix of different sources of energy for electricity production including low carbon.
Page: CC11. Energy
CC11.1
What percentage of your total operational spend in the reporting year was on energy? More than 5% but less than or equal to 10%
CC11.2
Please state how much fuel, electricity, heat, steam, and cooling in MWh your organization has purchased and consumed during the reporting year
Energy type
MWh
Fuel 46727.35 Electricity 121337.41 Heat 0 Steam 19796.96 Cooling 0
CC11.3

Please complete the table by breaking down the total "Fuel" figure entered above by fuel type
Fuels
MWh
Diesel/Gas oil 514.04 Motor gasoline 201.01 Kerosene 280.76 Natural gas 34344.28 Other: Heavy Fuel Oil 11387.25
CC11.4
Please provide details of the electricity, heat, steam or cooling amounts that were accounted at a low carbon emission factor in the Scope 2 figure reported in CC8.3
Basis for applying a low carbon emission factor
MWh associated with low carbon electricity, heat, steam or cooling
Comment
Grid connected low carbon electricity generation owned by company, no instruments created
34581 Australia and Germany make use of a mix of different sources of low carbon energy for electricity production and the emission factors are provided by the local electricity service providers.
Further Information
Heavy Fuel Oil density used is 0.98 and calorific value of 45.53
Page: CC12. Emissions Performance
CC12.1
How do your gross global emissions (Scope 1 and 2 combined) for the reporting year compare to the previous year? Increased

CC12.1a
Please identify the reasons for any change in your gross global emissions (Scope 1 and 2 combined) and for each of them specify how your emissions compare to the previous year
Reason
Emissions value (percentage)
Direction of change
Comment
Emissions reduction activities Not Applicable at this stage
Divestment Not Applicable at this stage Acquisitions Not Applicable at this stage Mergers Not Applicable at this stage Change in output Not Applicable at this stage Change in methodology Not Applicable at this stage
Change in boundary 38.2 Increase These increases are largely as a result of the inclusion of data for facilities in Australia contributing 3 518 CO2e to Scope 1 emissions and 28 840 CO2e to Scope 2 emissions.
Change in physical operating conditions Not Applicable at this stage
Unidentified Not Applicable at this stage Other Not Applicable at this stage
CC12.2
Please describe your gross global combined Scope 1 and 2 emissions for the reporting year in metric tonnes CO2e per unit currency total revenue
Intensity figure
Metric numerator
Metric denominator
% change from previous year
Direction of change from previous year
Reason for change
0.0000087820 metric tonnes CO2e unit total revenue 39 Decrease Change of boundary to include the
Australian Operations.

CC12.3
Please describe your gross global combined Scope 1 and 2 emissions for the reporting year in metric tonnes CO2e per full time equivalent (FTE) employee
Intensity figure
Metric numerator
Metric denominator
% change from previous year
Direction of change from previous year
Reason for change
38.82010367 metric tonnes CO2e FTE employee 0.59 Decrease Change of boundary to include the
Australian Operations.
CC12.4
Please provide an additional intensity (normalized) metric that is appropriate to your business operations
Intensity figure
Metric numerator
Metric denominator
% change from previous year
Direction of change from previous year
Reason for change
0.928575 metric tonnes CO2e
megawatt hour (MWh) 57 Increase Change of boundary to include the Australian
Operations.
Further Information
No further information.
Page: CC13. Emissions Trading
CC13.1

Do you participate in any emissions trading schemes? No, and we do not currently anticipate doing so in the next 2 years
CC13.1a
Please complete the following table for each of the emission trading schemes in which you participate
Scheme name
Period for which data is supplied
Allowances allocated
Allowances purchased
Verified emissions in metric tonnes CO2e
Details of ownership
CC13.1b
What is your strategy for complying with the schemes in which you participate or anticipate participating?
CC13.2
Has your organization originated any project-based carbon credits or purchased any within the reporting period? No
CC13.2a
Please provide details on the project-based carbon credits originated or purchased by your organization in the reporting period

Credit origination
or credit purchase
Project type
Project identification
Verified to which standard
Number of credits (metric
tonnes of CO2e)
Number of credits (metric tonnes
CO2e): Risk adjusted volume
Credits cancelled
Purpose, e.g. compliance
Further Information
No further information.
Page: CC14. Scope 3 Emissions
CC14.1
Please account for your organization’s Scope 3 emissions, disclosing and explaining any exclusions
Sources of Scope 3 emissions
Evaluation status
metric tonnes CO2e
Emissions calculation methodology
Percentage of
emissions calculated
using primary
data
Explanation
Purchased goods and services
Relevant, calculated 1132.8
Data is provided by our service providers and the following activities are included: 1)Paper usage: Emission Factor 1.09 kg CO2e, Emission factor source - Mondi Paper, 2009. 2)Glass recycled: Emission factor - 1.09 kg CO2e. Emission Factor source - Consol through the South African Fruit & Wine Industry Carbon Calculator 3)Cardboard recycled: Emission factor 1.31 kg CO2e – Emission factor source: Carbon Trust (2010) through The South African Fruit & Wine Industry Carbon Calculator. 4)Water Consumption: Emission factor 0.925 lt CO2e -Emission factor Source Friedrich, Pillay & Buckley 2007 - The use of LCA in water industry. Methodology used is based on GHG Protocol Corporate Value Chain (Scope 3) Accounting and Reporting Standard.
100.00%
Sources of Scope 3 emissions
Evaluation status
metric tonnes CO2e
Emissions calculation methodology
Percentage of
emissions calculated
using primary
data
Explanation
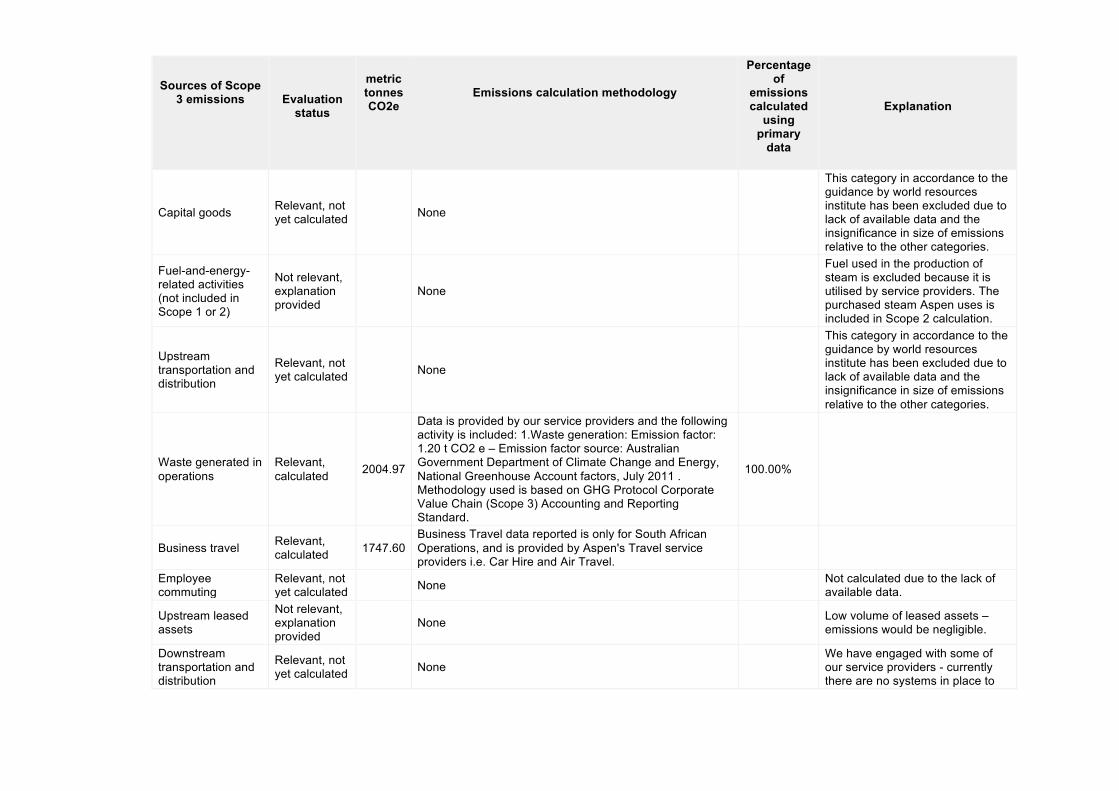
Capital goods Relevant, not yet calculated None
This category in accordance to the guidance by world resources institute has been excluded due to lack of available data and the insignificance in size of emissions relative to the other categories.
Fuel-and-energy-related activities (not included in Scope 1 or 2)
Not relevant, explanation provided None
Fuel used in the production of steam is excluded because it is utilised by service providers. The purchased steam Aspen uses is included in Scope 2 calculation.
Upstream transportation and distribution
Relevant, not yet calculated None
This category in accordance to the guidance by world resources institute has been excluded due to lack of available data and the insignificance in size of emissions relative to the other categories.
Waste generated in operations
Relevant, calculated 2004.97
Data is provided by our service providers and the following activity is included: 1.Waste generation: Emission factor: 1.20 t CO2 e – Emission factor source: Australian Government Department of Climate Change and Energy, National Greenhouse Account factors, July 2011 . Methodology used is based on GHG Protocol Corporate Value Chain (Scope 3) Accounting and Reporting Standard.
100.00%
Business travel Relevant, calculated 1747.60
Business Travel data reported is only for South African Operations, and is provided by Aspen's Travel service providers i.e. Car Hire and Air Travel.
Employee commuting
Relevant, not yet calculated None
Not calculated due to the lack of available data.
Upstream leased assets
Not relevant, explanation provided None
Low volume of leased assets – emissions would be negligible.
Downstream transportation and distribution
Relevant, not yet calculated None
We have engaged with some of our service providers - currently there are no systems in place to

Sources of Scope 3 emissions
Evaluation status
metric tonnes CO2e
Emissions calculation methodology
Percentage of
emissions calculated
using primary
data
Explanation
calculate emissions exclusively for Aspen Pharmacare.
Processing of sold products
Not relevant, explanation provided None
The complexity and extent of the supply chain prohibits accurate calculation.
Use of sold products
Not relevant, explanation provided None
The complexity and extent of the supply chain prohibits accurate calculation.
End of life treatment of sold products
Not relevant, explanation provided None
The complexity and extent of the supply chain prohibits accurate calculation.
Downstream leased assets
Not relevant, explanation provided None
Not relevant in our business currently
Franchises Not relevant, explanation provided None We have no franchises.
Investments Not relevant, explanation provided None
Not relevant in our business currently
Other (upstream) None Other (downstream) None
CC14.2
Please indicate the verification/assurance status that applies to your reported Scope 3 emissions No third party verification or assurance
CC14.2a

Please provide further details of the verification/assurance undertaken, and attach the relevant statements
Type of verification
or assurance
Attach the statement
Page/Section reference
Relevant standard
Proportion of Scope 3 emissions verified (%)
CC14.3
Are you able to compare your Scope 3 emissions for the reporting year with those for the previous year for any sources? Yes
CC14.3a
Please identify the reasons for any change in your Scope 3 emissions and for each of them specify how your emissions compare to the previous year
Sources of
Scope 3 emissions
Reason for
change
Emissions value
(percentage)
Direction of
change
Comment
Waste generated in operations
Change in boundary 34 Increase
Australian waste quantities were added in this reporting year, accounting for 16% of the increase. The remainder of the variance can be attributed to increased waste generation at the SA facilities.
Business travel Acquisitions 70 Increase Air travel increased by 65%, due to the expanded global footprint. Inclusion of car rental data, previously not reported accounted for 5% of the variance.

CC14.4
Do you engage with any of the elements of your value chain on GHG emissions and climate change strategies? (Tick all that apply) Yes, our suppliers
CC14.4a
Please give details of methods of engagement, your strategy for prioritizing engagements and measures of success Aspen has prioritised engagement with key service suppliers who are able to supply the required level of data, In some cases, e.g. downstream transport and distribution, the service providers have not been able to isolate emissions generated due to Aspen products specifically. We have been able to obtain statistics relating to travel and waste. Travel and car rental service providers supply Aspen with monthly reports advising on the emissions from Business Travel related to activities for Aspen Pharmacare. Waste service providers submit reports and statistics of all Aspen waste that have been incinerated, recycled or disposed in landfills. We use this information to calculate the emissions.
CC14.4b
To give a sense of scale of this engagement, please give the number of suppliers with whom you are engaging and the proportion of your total spend that they represent
Number of suppliers
% of total spend
Comment
5 0.00% Proportion of total spent not calculated
CC14.4c
If you have data on your suppliers’ GHG emissions and climate change strategies, please explain how you make use of that data
How you make use of the data
Please give details

How you make use of the data
Please give details
We do not have any data none
CC14.4d
Please explain why you do not engage with any elements of your value chain on GHG emissions and climate change strategies, and any plans you have to develop an engagement strategy in the future
Further Information
No further information
Module: Sign Off
Page: CC15. Sign Off
CC15.1
Please provide the following information for the person that has signed off (approved) your CDP climate change response
Name
Job title
Corresponding job category
Dr Morne Geyser Executive: Group Strategic Operations Board/Executive board
Further Information
No further information. CDP 2014 Investor CDP 2014 Information Request