CDP 2013 Investor CDP 2013 Information Request Carbon …€¦ · Hasbro strives to delight its...
51
Carbon Disclosure Project CDP 2013 Investor CDP 2013 Information Request Hasbro, Inc. Module: Introduction Page: Introduction 0.1 Introduction Please give a general description and introduction to your organization Hasbro, Inc. (NASDAQ: HAS) is a branded play company dedicated to fulfilling the fundamental need for play for children and families through creative expression of the Company's world class brand portfolio, including TRANSFORMERS, MONOPOLY, PLAY-DOH, MY LITTLE PONY, MAGIC: THE GATHERING, NERF, LITTLEST PET SHOP and G.I. JOE. From toys and games, to television programming, motion pictures, digital gaming and a comprehensive licensing program, Hasbro strives to delight its global customers with innovative play and entertainment experiences, in a variety of forms and formats, anytime and anywhere. The Company's Hasbro Studios develops and produces television programming for more than 170 markets around the world, and for the U.S. on The Hub TV Network, part of a multi-platform joint venture between Hasbro and Discovery Communications (NASDAQ: DISCA, DISCB, DISCK). Through the company's deep commitment to corporate social responsibility, including philanthropy, Hasbro is helping to build a safe and sustainable world for future generations and to positively impact the lives of millions of children and families every year. It has been recognized for its efforts by being named one of the "World's Most Ethical Companies" and is ranked as one of Corporate Responsibility Magazine's "100 Best Corporate Citizens." In 2012, Hasbro was also recognized by the U.S. Environmental Protection Agency (EPA) with a Climate Leadership award for reduction of greenhouse gas emissions – goal achievement and was named by Climate Counts as the Toy Sector Leader for the fourth consecutive year - scoring highest in transparency and reduction of impact on global warming. Learn more at www.hasbro.com and www.hasbro.com/csr. 0.2 Reporting Year Please state the start and end date of the year for which you are reporting data. The current reporting year is the latest/most recent 12-month period for which data is reported. Enter the dates of this year first. We request data for more than one reporting period for some emission accounting questions. Please provide data for the three years prior to the current reporting year if you have not provided this information before, or if this is the first time you have answered a CDP information request. (This does not apply if you have been offered and selected the option of answering the shorter questionnaire). If you are going to provide additional years of data, please give the dates of those reporting periods here. Work backwards from the most recent reporting year.
Transcript of CDP 2013 Investor CDP 2013 Information Request Carbon …€¦ · Hasbro strives to delight its...
Carbon Disclosure Project CDP 2013 Investor CDP 2013 Information Request
Hasbro, Inc.
Module: Introduction
Page: Introduction
0.1
Introduction
Please give a general description and introduction to your organization Hasbro, Inc. (NASDAQ: HAS) is a branded play company dedicated to fulfilling the fundamental need for play for children and families through creative expression of the Company's world class brand portfolio, including TRANSFORMERS, MONOPOLY, PLAY-DOH, MY LITTLE PONY, MAGIC: THE GATHERING, NERF, LITTLEST PET SHOP and G.I. JOE. From toys and games, to television programming, motion pictures, digital gaming and a comprehensive licensing program, Hasbro strives to delight its global customers with innovative play and entertainment experiences, in a variety of forms and formats, anytime and anywhere. The Company's Hasbro Studios develops and produces television programming for more than 170 markets around the world, and for the U.S. on The Hub TV Network, part of a multi-platform joint venture between Hasbro and Discovery Communications (NASDAQ: DISCA, DISCB, DISCK). Through the company's deep commitment to corporate social responsibility, including philanthropy, Hasbro is helping to build a safe and sustainable world for future generations and to positively impact the lives of millions of children and families every year. It has been recognized for its efforts by being named one of the "World's Most Ethical Companies" and is ranked as one of Corporate Responsibility Magazine's "100 Best Corporate Citizens." In 2012, Hasbro was also recognized by the U.S. Environmental Protection Agency (EPA) with a Climate Leadership award for reduction of greenhouse gas emissions – goal achievement and was named by Climate Counts as the Toy Sector Leader for the fourth consecutive year - scoring highest in transparency and reduction of impact on global warming. Learn more at www.hasbro.com and www.hasbro.com/csr.
0.2
Reporting Year
Please state the start and end date of the year for which you are reporting data. The current reporting year is the latest/most recent 12-month period for which data is reported. Enter the dates of this year first. We request data for more than one reporting period for some emission accounting questions. Please provide data for the three years prior to the current reporting year if you have not provided this information before, or if this is the first time you have answered a CDP information request. (This does not apply if you have been offered and selected the option of answering the shorter questionnaire). If you are going to provide additional years of data, please give the dates of those reporting periods here. Work backwards from the most recent reporting year.

Please enter dates in following format: day(DD)/month(MM)/year(YYYY) (i.e. 31/01/2001).
Enter Periods that will be disclosed
Sun 01 Jan 2012 - Mon 31 Dec 2012
0.3
Country list configuration
Please select the countries for which you will be supplying data. This selection will be carried forward to assist you in completing your response
Select country
Australia
United States of America
Canada
Mexico
Chile
France
United Kingdom
Germany
Spain
Ireland
Greece
Switzerland
Belgium
Hungary
Netherlands
Denmark
Turkey
Russia

Select country
Italy
Romania
Austria
Poland
New Zealand
China
Malaysia
Singapore
Taiwan
Japan
Czech Republic
Vietnam
South Korea
0.4
Currency selection
Please select the currency in which you would like to submit your response. All financial information contained in the response should be in this currency. USD($)
0.6
Modules
As part of the request for information on behalf of investors, electric utilities, companies with electric utility activities or assets, companies in the automobile or auto component manufacture sectors, companies in the oil and gas industry and companies in the information technology and telecommunications sectors should complete supplementary questions in addition to the main questionnaire. If you are in these sectors (according to the Global Industry Classification Standard (GICS)), the corresponding sector modules will not appear below but will automatically appear in the navigation bar when you save this page. If you want to query your classification, please email [email protected]. If you have not been presented with a sector module that you consider would be appropriate for your company to answer, please select the module below. If you wish to view the questions first, please see https://www.cdproject.net/en-US/Programmes/Pages/More-questionnaires.aspx.

Module: Management [Investor]
Page: 1. Governance
1.1
Where is the highest level of direct responsibility for climate change within your company?
Individual/Sub-set of the Board or other committee appointed by the Board
1.1a
Please identify the position of the individual or name of the committee with this responsibility
The highest level of responsibility for climate change at Hasbro resides with the Nominating, Governance and Social Responsibility Committee of the Board of Directors of Hasbro, Inc. Additionally, the Chief Executive Officer (CEO) chairs an executive CSR Committee that sets strategic direction for CSR policies and initiatives, including climate change, and ensures their integration throughout the entire corporation. Our Chief Development Officer, a CSR Committee member, oversees climate change issues related to Hasbro owned and third party factories. Additionally, a Senior Vice President of Global Quality Assurance is responsible for implementing environmental sustainability initiatives throughout the company and supply chain.
1.2
Do you provide incentives for the management of climate change issues, including the attainment of targets?
Yes
1.2a
Please complete the table
Who is entitled to benefit from these incentives?
The type of incentives
Incentivized performance indicator

Who is entitled to benefit from these incentives?
The type of incentives
Incentivized performance indicator
Chief Executive Officer (CEO) Monetary reward Meeting sustainability goals and objectives
Chief Executive Officer (CEO) Recognition (non-monetary)
Meeting sustainability goals and objectives
Executive officer Monetary reward Meeting sustainability goals and objectives
Executive officer Recognition (non-monetary)
Meeting sustainability goals and objectives
Business unit managers Monetary reward Meeting sustainability goals and objectives
Business unit managers Recognition (non-monetary)
Meeting sustainability goals and objectives
Other: Environment/sustainability managers
Monetary reward Meeting sustainability goals and objectives
Other: Environment/sustainability managers
Recognition (non-monetary)
Meeting sustainability goals and objectives
Facility managers Monetary reward Meeting sustainability goals and objectives
Facility managers Recognition (non-monetary)
Meeting sustainability goals and objectives
All employees Monetary reward Annual performance objectives are tied to Corporate Social Responsibility, which includes Climate Change as a corporate priority
All employees Recognition (non-monetary)
Annual performance objectives are tied to Corporate Social Responsibility, which includes Climate Change as a corporate priority
Other: Corporate Function Head Monetary reward Meeting sustainability goals and objectives
Other: Corporate Function Head Recognition (non-monetary)
Meeting sustainability goals and objectives
Other: Employee Green Teams Recognition (non-monetary)
Communicating climate change issues and developing grassroots programs supporting emission reduction targets as an integral part of the Hasbro culture
Page: 2. Strategy
2.1
Please select the option that best describes your risk management procedures with regard to climate change risks and opportunities
Integrated into multi-disciplinary company wide risk management processes

2.1a
Please provide further details
i. Scope of process: Hasbro has developed an enterprise risk management (ERM) process that guides the identification, assessment and actions taken related to potential developments that can have impact on our business. The process incorporates an interdisciplinary group with a diverse set of skills to assess the potential risks that issues may pose for the company. Proposed and final regulatory actions and other developments related to climate change are considered as part of this risk management process. At Hasbro, business continuity planning is a priority element of corporate governance accountability against which management performance is measured. Hasbro maintains a Business Continuity Planning Commitment Statement which is signed by the Chief Executive Officer, Chief Operating Officer and Chief Financial Officer. Hasbro’s commitment includes effective and timely crisis response, avoiding damage to the company’s profitability, reputation or ability to operate. Specific to potential physical impacts of climate change on our operations, Hasbro has a Business Continuity Plan in place that establishes safeguards to minimize the risk, cost and duration of disruption to essential business processes in the event of a catastrophe at critical company locations. Additionally, for Hasbro owned and operated factories in the U.S. and Ireland, annual environmental objectives are set which are often more stringent than government requirements. We annually implement new project initiatives that advance our environmental stewardship and our cost competitiveness. Environmental policies and procedures are in place which are audited by internal (Hasbro) and external (ISO14001, FSC COC, SGP, etc.) auditors. ii. How risks/opportunities are assessed at a company level: At a company level, Enterprise Risk Management (ERM) is applied systematically top-down for Product Brands and Entertainment; in all Markets; on Strategic Partnerships/Adjacencies; in Sourcing and Human Capital; on Financial, Internal Systems and Controls, and Regulatory and Compliance, and finally on an ad hoc basis in many other areas. ERM is proactively managed by embedding the risk identification, monitoring and mitigating activities into our business process at the regional and functional levels with frequent updates to Hasbro’s executive management team and our Board of Directors. ERM is part of our strategic planning process as well as our regional business reviews and influences our Internal Audit program. ERM is embedded into our business process and is included as part of our proactive management of our business on a daily basis. iii. How risks/opportunities are assessed at an asset level: Site specific ERM assessments are performed under the leadership of a cross-functional team. We also perform regional and functional assessments. iv. Frequency of monitoring: At least three times per year. We utilize an ERM Dashboard for Hasbro’s executive management and Board Level reporting with at least three updates per year. We include a deeper dive on our ERM process and risks on an annual basis as part of our strategic planning process. At the regional and functional level our monitoring is constant and embedded into our daily business process. v. Criteria for materiality/priorities: Materiality/priority is based on a combined analysis of Risk Impact and the Risk Trend. We evaluate the overall impact of each risk which may be financial,

operational or reputational and evaluate the magnitude of the risk and the effectiveness of our monitoring and mitigating activities in assessing the potential severity of a risk to Hasbro. We also consider how the risk is trending to determine if any additional mitigating actions are required. We use a color coding system on our reports and dashboards to indicate if our risk is High, Moderate or Low and use arrows for our trend indication to quickly draw attention to risks which are trending up for Hasbro. vi. To whom are results reported: Our ERM reporting system utilizes an ERM Dashboard for Hasbro’s executive team and Board level reporting with at least three updates per year.
2.2
Is climate change integrated into your business strategy?
Yes
2.2a
Please describe the process and outcomes
i. The process by which the strategy is influenced: Climate change is integrated into Hasbro’s business strategy as part of a broader commitment to Corporate Social Responsibility (CSR) and environmental sustainability. A CSR committee, chaired by the CEO and comprised by members of the Senior Management team, oversees CSR policies and initiatives including environmental sustainability. Our Chief Development Officer oversees climate change issues related to Hasbro owned and third-party factories, as well as owned and operated facilities. Additionally, a Senior Vice President of Global Quality Assurance is responsible for implementing environmental sustainability initiatives throughout the company and supply chain. The company also has a formal CSR practice led by Vice President of Corporate Responsibility and Government Affairs. Additionally, we have several working groups comprised of functional leaders focused on driving and executing environmental sustainability initiatives across the company: • CSR Working Group: A subset of the CSR Committee and chaired by the VP of CSR. • Sustainable Design Group: A cross-functional group focused on sustainable product and packaging design and chaired by the Chief Development Officer. • Global Development and Operations Sustainability Group: A cross-functional group focused on operations and supply chain and chaired by the SVP of Global Quality Assurance. • Energy Conservation Committees: A management leadership group focused on driving annual energy reduction initiatives at each Hasbro owned and operated factory. • CSR Core Team: A cross-functional leadership team focused on identifying and evaluating opportunities, challenges and gaps related to CSR, including climate change and environmental sustainability. • Green Teams: Employee-led teams focused on engaging employees and driving site specific environmental improvements, including energy, water and paper conservation and waste reduction.

ii. What aspects of climate change have influenced the strategy: The following risks have influenced Hasbro’s strategy: • Regulatory issues: Hasbro is subject to regulation at national and local levels worldwide. Changes in the laws governing Hasbro can have a direct impact on our business. Through its trade associations or on its own, Hasbro monitors and/or participates in public policy debate and regulatory developments related to key issues, including environmental issues impacting our operations and manufacturing. • Economic issues: Rising fuel and raw material prices, for paperboard and other components such as resin used in plastics or electronic components, increased transportation costs, and increased labor costs in the markets in which our products are manufactured. • Physical climate issues: Work stoppages, slowdowns, or an outbreak of a severe public health pandemic affecting our supply chain; transportation limitations or delays with product shipments; or damage/interruption to our information technology systems due to natural disasters or climate change related events. • Reputation issues: We recognize that our stakeholders’, including consumers, review our progress and performance in these areas influences their perception which in turn can influence our corporate and/or product brands reputation. For example, we have taken steps to address deforestation in our supply chain as well as setting a goal to reduce our product to package ratio size. iii. The most important components of short term strategy that have been influenced by climate change: Our deep commitment to sustainability and minimizing our impact on the environment have influenced the most important component of our short term strategy - sustainable packaging. In 2012, Hasbro announced two major goals to reduce and improve the environmental sustainability of product packaging. The company committed to eliminating all PVC from core product packaging by the end of 2013. Hasbro also pledged to reduce materials used in product packaging for many of its global brands, resulting in an approximate 15 percent improvement in the average product-to-package ratio of brands and products included in the initiative. Previously, Hasbro’s sustainable packaging initiative included the following: • Phase-out of PVC in packaging: In 2011, Hasbro announced plans to eliminate PVC from all new core toy and game packaging beginning in 2013. • Increasing recycled content: In 2011, Hasbro achieved its goal to derive at least 75 percent of paper and board packaging from recycled material, or from sources that practice sustainable forest management. By 2015, Hasbro plans to increase that target to 90 percent. • Responsible paper sourcing policy: Hasbro implemented an aggressive paper sourcing policy in 2011, providing guidelines for suppliers regarding sustainable paper sourcing to help ensure that paper used in Hasbro products aligns with the company's commitment to environmental sustainability and responsibly managed forests. Among the policy's key requirements is the expectation that suppliers will source paper with as much post-consumer recycled content as practical and financially viable. The company has communicated the policy to its suppliers, and has made it a part of its company-wide quality assurance procedures. • Elimination of wire ties: In 2010, Hasbro replaced all wire ties in its packages with ties made from paper rattan or bamboo mix to reduce environmental impact. Answer continued below in 'Further Information.'
2.2b
Please explain why not
2.3

Do you engage in activities that could either directly or indirectly influence policy on climate change through any of the following? (tick all that apply)
Trade associations
2.3a
On what issues have you been engaging directly?
Focus of legislation Corporate Position Details of engagement Proposed solution
2.3b
Are you on the Board of any trade associations or provide funding beyond membership?
Yes
2.3c
Please enter the details of those trade associations that are likely to take a position on climate change legislation
Trade association
Is your position on climate change consistent with
theirs?
Please explain the trade association's position How have you, or are you attempting to influence
the postion?
Extended Producer Responsibility
Consistent All stakeholders have a role to play from government to industry to citizens to NGOs regarding product packaging, waste and recycling.
Engagement with all stakeholder groups (via the trade association); industry fee structures (e.g., in British Columbia, Canada).
2.3d
Do you publically disclose a list of all the research organizations that you fund?

2.3e
Do you fund any research organizations to produce public work on climate change?
2.3f
Please describe the work and how it aligns with your own strategy on climate change
2.3g
Please provide details of the other engagement activities that you undertake
2.3h
What processes do you have in place to ensure that all of your direct and indirect activities that influence policy are consistent with your overall climate change strategy?
Hasbro ensures that all of its direct and indirect activities that influence policy are consistent with its overall climate change strategy through its integrated organizational design and leadership: Hasbro's Government Affairs practice is led by the head of Hasbro's Corporate Social Responsibility practice.
2.3i
Please explain why you do not engage with policy makers
Further Information

2.2a continued iv. The most important components of long term strategy that have been influenced by climate change: Our deep commitment to sustainability and minimizing our impact on the environment have influenced the most important component of our long term strategy, including: On mitigation: • Target reduction of greenhouse gas (GHG) emissions (and other air emissions) at our sites, including own and operated factories. In 2012, we reduced global Scope 1 and 2 greenhouse gas emissions by 32 percent from a 2008 baseline – exceeding our goal of a 10 percent reduction, using Greenhouse Gas Protocol guidelines. • Evaluate GHG emissions from Scope 3 sources, such as data from manufacturing vendors, transportation (logistics) and business travel. • Achieve zero waste to landfill in Hasbro’s owned and operated factories’ (U.S. and Ireland) manufacturing processes. • Align procurement decisions with Hasbro’s commitment to sustainable forest management, which requires that no sources of Mixed Tropical Hardwood (MTH) virgin fiber be used in products, including packaging. On adaptation: • Hasbro has a robust series of policies and standards that set minimum criteria for all operations, and each site is responsible for putting them into practice. Both our owned and operated factories retain the internationally recognized Environmental Management Systems (EMS) standard ISO 14001. In 2011, our owned and operated factories also achieved FSC certification. • Implement energy efficiency projects, minimize water discharges, increase recycling and reduce waste to minimize landfill disposal at Hasbro sites, including owned and operated factories. • Hasbro ships over 75% of its freight using SmartWay carriers and, in 2012, Hasbro became a SmartWay partner and acknowledged for its excellence and leadership in logistics. • Engage Hasbro employees (both non-union and union) in environmental sustainability efforts. • Engage with governments, third party vendors and other stakeholders to evaluate impacts, develop action plans and implement strategies for different regions and markets. • Work with governments, trade bodies and NGOs to assess and address pressing climate change related issues. On reporting: • Report on our CSR/sustainability efforts, including GHG emissions and risks/performance improvement measures related to climate change, via Hasbro’s CSR Report ( published in 2011 and 2012) and Hasbro, Inc. Annual Report. • Track and report non-hazardous waste and recycling efforts for all our U.S. facilities though the U.S. EPA Waste Wise program. • Report via retailer scorecards sustainability related product/packaging initiatives and improvements. • Voluntary reporting on sustainable packaging efforts via the Australia Packaging Covenant. • Respond to shareholder and investor inquiries, as well as other stakeholder groups, as requested. v. Most substantial business decisions made influenced by climate change driven aspects of the strategy: • Paper Sourcing (influenced by reputational aspect of climate change) In 2011, Hasbro issued a Paper and Forest Procurement Policy (PFPP) intended to ensure that procurement decisions align with the Company's commitment to environmental sustainability and support sustainable forest management. The PFPP reiterates the Company goal of industry-leading 90 percent usage of paper packaging and in-box game content derived from recycled material or sources that practice sustainable forest management by 2015. The policy also sets stringent vendor requirements for credible third party certification (such as the Forest Stewardship Council) of fiber. In addition, as one facet of the PFPP's standards related to avoiding fiber from controversial sources, Hasbro requires that no sources of Mixed Tropical Hardwood (MTH) virgin fiber be used in products, including packaging. • Chemicals/Materials (influenced by regulatory and reputation aspects of climate change) Hasbro takes great care in selecting materials to be used in our products in order to ensure that they withstand reasonable use and abuse during play and provide an enjoyable play experience. We use a variety of materials and continue to investigate and assess alternate materials. Our challenge remains identifying cost effective alternates that not only meet our stringent quality and safety standards, but also provide an equal play experience and value for the consumer. Similarly,

with respect to chemicals we are very careful about chemical selection and we have minimized the use of BPA, phthalates and brominated flame retardants in our products. • Packaging (influenced by regulatory and reputation aspects of climate change) Hasbro is actively working to extend our sustainable packaging efforts, including material selection and design, and will be concentrating on standardizing and aligning our business requirements across the global with our third party vendors. • Logistics (influenced by economic aspect of climate change) Emissions reduction initiatives include our regional distribution model, container load maximization program, off-peak loading and unloading, use of closest port, and our utilization of a train line in China to move containers to port instead of numerous truck haulers. • Manufacturing – for Hasbro owned and operated factories (influenced by economic aspect of climate change) Energy reduction projects include lighting upgrades and occupancy sensors, converting boilers to natural gas, installing roof insulation, replacing door and window seals, ensuring equipment is shut off when unused, and using optimal temperature settings for heating and cooling. We have also invested in energy-saving manufacturing equipment, such as all-electric injection molding machines that are 70 percent more energy efficient than hydraulic machines. • Facilities - Hasbro completed a major renovation of a U.S. leased facility in 2012, which included environmental criteria and the company is currently pursuing Leadership in Energy and Environmental Design (LEED) certification for its efforts.
Page: 3. Targets and Initiatives
3.1
Did you have an emissions reduction target that was active (ongoing or reached completion) in the reporting year?
Absolute target
3.1a
Please provide details of your absolute target
ID
Scope
% of emissions in
scope
% reduction from base year
Base year
Base year emissions
(metric tonnes CO2e)
Target year
Comment
1 Scope 1+2
100% 10% 2008 34379 2012 This reporting year will conclude our current goal. Hasbro is in the process of establishing our next goal to continue our commitment to GHG reduction.

3.1b
Please provide details of your intensity target
ID
Scope
% of emissions in
scope
% reduction from base year
Metric
Base year
Normalized base year emissions
Target year
Comment
3.1c
Please also indicate what change in absolute emissions this intensity target reflects
ID
Direction of change anticipated in absolute Scope 1+2 emissions at
target completion?
% change anticipated in absolute Scope 1+2
emissions
Direction of change anticipated in absolute Scope 3 emissions at target
completion?
% change anticipated in absolute Scope 3
emissions
Comment
3.1d
Please provide details on your progress against this target made in the reporting year
ID
% complete (time)
% complete (emissions)
Comment
1 100% 100% Hasbro has exceeded its 10 percent GHG reduction goal and achieved a 32 percent reduction from the 2008 baseline.
3.1e

Please explain (i) why not; and (ii) forecast how your emissions will change over the next five years
3.2
Does the use of your goods and/or services directly enable GHG emissions to be avoided by a third party?
No
3.2a
Please provide details (see guidance)
3.3
Did you have emissions reduction initiatives that were active within the reporting year (this can include those in the planning and implementation phases)
Yes
3.3a
Please identify the total number of projects at each stage of development, and for those in the implementation stages, the estimated CO2e savings
Stage of development
Number of projects
Total estimated annual CO2e savings in metric tonnes CO2e (only for rows marked *)
Under investigation 1
To be implemented* 3 1400

Stage of development
Number of projects
Total estimated annual CO2e savings in metric tonnes CO2e (only for rows marked *)
Implementation commenced* 2 900
Implemented* 2 1200
Not to be implemented 1
3.3b
For those initiatives implemented in the reporting year, please provide details in the table below
Activity type
Description of activity
Estimated annual CO2e savings (metric tonnes
CO2e)
Annual monetary savings (unit currency - as
specified in Q0.4)
Investment required (unit currency - as
specified in Q0.4)
Payback period
Energy efficiency: Processes
Installation of energy efficient compressors 200 31000 210000 4-10 years
Energy efficiency: Building fabric
Replacement of roof insulation with higher value R20 insulation
300 10000 75000 4-10 years
Energy efficiency: Building services
HVAC upgrades and replacements 600 120000 210000 1-3 years
Energy efficiency: Building services
Lighting upgrades, switch to LED lighting 50 1200 3000 1-3 years
Energy efficiency: Processes
Istallation of all-electric injection molding machines
250 400000 1150000 4-10 years
Energy efficiency: Building services
Electrical upgrades 30 10000 2000 <1 year
3.3c

What methods do you use to drive investment in emissions reduction activities?
Method
Comment
Compliance with regulatory requirements/standards
Dedicated budget for energy efficiency Lighting and equipment/machinery projects
Employee engagement Green Teams
Dedicated budget for low carbon product R&D Packaging initiatives
Internal incentives/recognition programs Internal award programs such as the "INNY's".
3.3d
If you do not have any emissions reduction initiatives, please explain why not
Page: 4. Communication
4.1
Have you published information about your company’s response to climate change and GHG emissions performance for this reporting year in places other than in your CDP response? If so, please attach the publication(s)
Publication
Page/Section reference
Attach the document
In voluntary communications (complete)
All Pages https://www.cdproject.net/sites/2013/26/8126/Investor CDP 2013/Shared Documents/Attachments/Investor-4.1-C3-IdentifytAttachment/Investor-4.1-PublishedInformation1/CSR_2011_Report Update.pdf
In mainstream financial reports (complete)
Item 1A. Risk Factors, pages 20-32.
https://www.cdproject.net/sites/2013/26/8126/Investor CDP 2013/Shared Documents/Attachments/Investor-4.1-C3-IdentifytAttachment/Investor-4.1-

Publication
Page/Section reference
Attach the document
PublishedInformation2/2012ar.pdf
In voluntary communications (complete)
Page 1 https://www.cdproject.net/sites/2013/26/8126/Investor CDP 2013/Shared Documents/Attachments/Investor-4.1-C3-IdentifytAttachment/Investor-4.1-PublishedInformation3/ReleaseID=7.pdf
In voluntary communications (complete)
Page 1 https://www.cdproject.net/sites/2013/26/8126/Investor CDP 2013/Shared Documents/Attachments/Investor-4.1-C3-IdentifytAttachment/Investor-4.1-PublishedInformation4/Release100112.pdf
In voluntary communications (complete)
Page 1 https://www.cdproject.net/sites/2013/26/8126/Investor CDP 2013/Shared Documents/Attachments/Investor-4.1-C3-IdentifytAttachment/Investor-4.1-PublishedInformation5/Release081612.pdf
In voluntary communications (complete)
Page 1 https://www.cdproject.net/sites/2013/26/8126/Investor CDP 2013/Shared Documents/Attachments/Investor-4.1-C3-IdentifytAttachment/Investor-4.1-PublishedInformation6/Release041012.pdf
Module: Risks and Opportunities [Investor]
Page: 5. Climate Change Risks
5.1
Have you identified any climate change risks (current or future) that have the potential to generate a substantive change in your business operations, revenue or expenditure? Tick all that apply
Risks driven by changes in regulation Risks driven by changes in physical climate parameters Risks driven by changes in other climate-related developments
5.1a

Please describe your risks driven by changes in regulation
ID
Risk driver
Description
Potential impact
Timeframe
Direct/ Indirect
Likelihood
Magnitude of impact
R1 Cap and trade schemes
Cap and trade schemes are being closely watched and monitored. The European Union Emission Trading Scheme (or EU ETS) is the largest multi-national, greenhouse gas emissions trading scheme in the world. It is one of the EU's central policy instruments to meet their cap set in the Kyoto Protocol. Other countries such as Japan, Australia and the United states have implemented or contemplated cap and trade schemes. These schemes may impact the operational costs of factories participating in the scheme and affect their competitiveness.
Increased operational cost
1-5 years Direct Likely Low
R2
Product labeling regulations and standards
Product labelling requirements are also being closely followed. A California state representative sponsored the carbon labelling act in the California state legislature. The act would require the State Air Resources Board to develop and implement a program for the voluntary assessment, verification, and standardized labelling of the carbon footprint of consumer products sold in the state. Japan announced carbon footprint labelling scheme in 2008. Another label initiative started in spring 2008 in Switzerland. In July 2009, Wal-Mart announced an environmental labelling program for its products. The intent is to create over the next five years a universal rating system, that scores products based on how environmentally and socially sustainable they are over the course of their lives. In 2012, Walmart began rolling out a sustainability index, ranking and differentiating suppliers for their sustainability; Hasbro ranked #2 out of 86 toy suppliers. Wal-Mart’s goal is to have other retailers eventually adopt the indexing system. Retailer actions to bring low carbon products to market could favor competitors and affect consumer purchasing decisions. Perceived environmental performance of products could have an impact on brand desirability and consumer behaviors.
Increased operational cost
1-5 years Direct About as likely as not
Medium
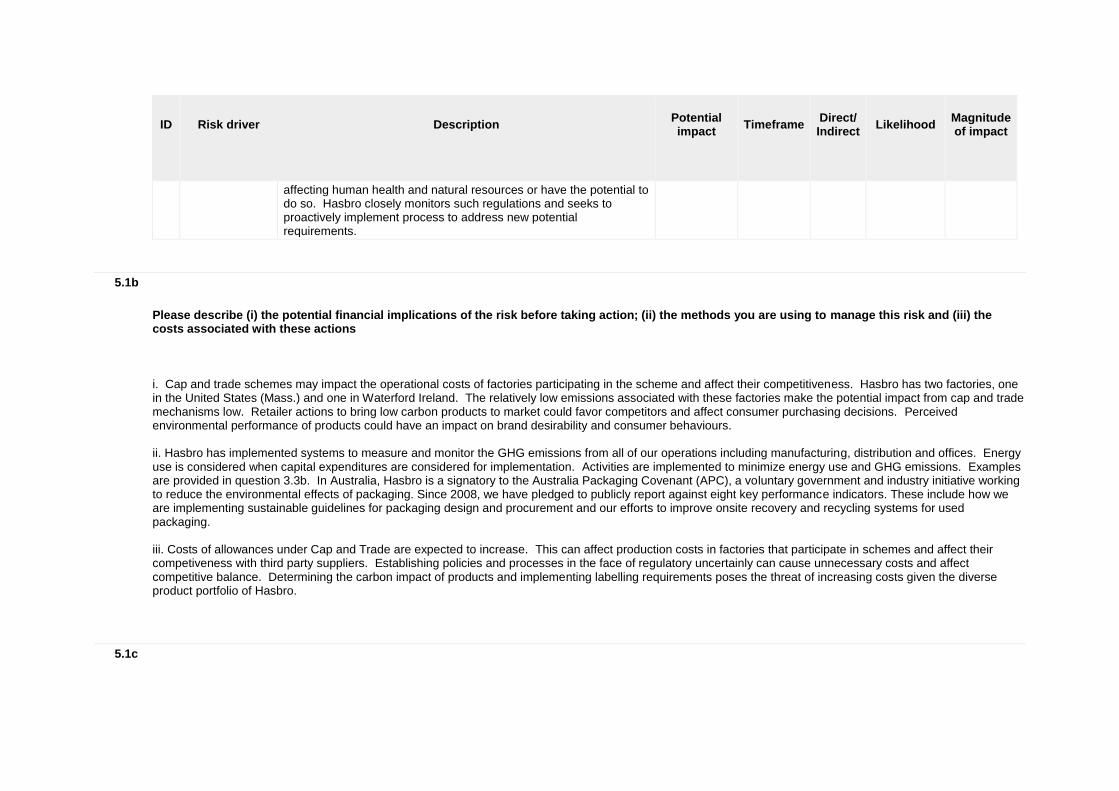
R3 Uncertainty surrounding new regulation
The past three decades have seen a large increase in the number of regulations and other environmental policies affecting the operations of businesses. The vast increase has been driven by a constant stream of discoveries of new environmental issues which are
Increased operational cost
Unknown Direct Likely Low
ID
Risk driver
Description
Potential impact
Timeframe
Direct/ Indirect
Likelihood
Magnitude of impact
affecting human health and natural resources or have the potential to do so. Hasbro closely monitors such regulations and seeks to proactively implement process to address new potential requirements.
5.1b
Please describe (i) the potential financial implications of the risk before taking action; (ii) the methods you are using to manage this risk and (iii) the costs associated with these actions
i. Cap and trade schemes may impact the operational costs of factories participating in the scheme and affect their competitiveness. Hasbro has two factories, one in the United States (Mass.) and one in Waterford Ireland. The relatively low emissions associated with these factories make the potential impact from cap and trade mechanisms low. Retailer actions to bring low carbon products to market could favor competitors and affect consumer purchasing decisions. Perceived environmental performance of products could have an impact on brand desirability and consumer behaviours. ii. Hasbro has implemented systems to measure and monitor the GHG emissions from all of our operations including manufacturing, distribution and offices. Energy use is considered when capital expenditures are considered for implementation. Activities are implemented to minimize energy use and GHG emissions. Examples are provided in question 3.3b. In Australia, Hasbro is a signatory to the Australia Packaging Covenant (APC), a voluntary government and industry initiative working to reduce the environmental effects of packaging. Since 2008, we have pledged to publicly report against eight key performance indicators. These include how we are implementing sustainable guidelines for packaging design and procurement and our efforts to improve onsite recovery and recycling systems for used packaging. iii. Costs of allowances under Cap and Trade are expected to increase. This can affect production costs in factories that participate in schemes and affect their competiveness with third party suppliers. Establishing policies and processes in the face of regulatory uncertainly can cause unnecessary costs and affect competitive balance. Determining the carbon impact of products and implementing labelling requirements poses the threat of increasing costs given the diverse product portfolio of Hasbro.
5.1c

Please describe your risks that are driven by change in physical climate parameters
ID
Risk driver
Description
Potential impact
Timeframe
Direct/ Indirect
Likelihood
Magnitude of impact
P1 Uncertainty of physical risks
Increasing global emissions of greenhouse gases (GHGs) may contribute to floods, droughts, and extreme weather events, as well as to international pressure to reduce emissions and shift to low-carbon technologies. The inability to predict the timing and magnitude of events and their impacts requires that plans be established proactively to manage potential disruptions to Hasbro operations and the supply chain. Thorough business interruption plans are established for this purpose.
Inability to do business
Unknown Indirect (Supply chain)
About as likely as not
Low-medium
5.1d
Please describe (i) the potential financial implications of the risk before taking action; (ii) the methods you are using to manage this risk; and (iii) the costs associated with these actions
i. Financial impact due to operations or supply chain disruptions depends on many factors including the location of the area affected, the extent of the effects, the timing of the event, and the duration of the impacts. ii. Hasbro has an extensive supplier base to work with so that needs can be met under various circumstances. Hasbro works with its suppliers to address supply needs and establish contingency plans. iii. The costs to assess, establish and implement the plans necessary to effectively manage potential disruptive events are part of doing business in a responsible manner and are not material in comparison to the financial impacts from supply chain disruptions they can protect against.
5.1e
Please describe your risks that are driven by changes in other climate-related developments

ID
Risk driver
Description
Potential impact
Timeframe
Direct/ Indirect
Likelihood
Magnitude of impact
O1 Reputation
Consumers, stakeholders and the general public are becoming more conscious of company social responsibility and environmental sustainability performance and rankings. Failure to act in an environmentally responsible manner can affect company or brand reputation in a negative manner and affect sales.
Reduced demand for goods/services
Unknown Direct Unlikely Low
O2 Changing consumer behaviour
Consumer environmental awareness is growing and consumer choices may be influenced by the environmental impacts related to producing toys and games.
Reduced demand for goods/services
Unknown Direct Unlikely Low
5.1f
Please describe (i) the potential financial implications of the risk before taking action; (ii) the methods you are using to manage this risk; (iii) the costs associated with these actions
i. The financial implications associated with reputation and changing consumer behavior risks may be derived from loss of market share. ii. Hasbro has taken a number of actions to address these risks. In 2011, Hasbro reported GHG emissions to the Carbon Disclosure Project as part of our ongoing efforts in transparent reporting of GHG emissions. This was the next stage in our reporting efforts. Early on, Hasbro demonstrated leadership by becoming a charter member of the U.S. EPA Climate Leaders program, the first in our industry and in our state of Rhode Island. Through the voluntary Climate Leaders program, Hasbro has been reporting GHG emissions since 2002. Hasbro also issues press releases on environmental related activities and goals to communicate externally with stakeholders and consumers. Examples of this type of transparent reporting include packaging and wire tie elimination goals, recycled content and sustainable sourcing goals, and GHG reporting and goals. In addition, Hasbro publishes a comprehensive Corporate Social Responsibility report (www.hasbro.com/csr) on its corporate website that discusses environmental sustainability progress and opportunities. iii. The cost of producing products may increase due to increased costs of raw materials. For example, paper based materials that are sourced from sustainably managed forests or certified to FSC standards (in support of our target to derive 90 percent of our paper packaging from recycled material or from sustainably managed sources by 2015), as well as sourcing PVC alternates for use in our packaging (in support of our goal to eliminate PVC from packaging beginning in 2013), can have greater cost.
5.1g

Please explain why you do not consider your company to be exposed to risks driven by changes in regulation that have the potential to generate a substantive change in your business operations, revenue or expenditure
5.1h
Please explain why you do not consider your company to be exposed to risks driven by physical climate parameters that have the potential to generate a substantive change in your business operations, revenue or expenditure
5.1i
Please explain why you do not consider your company to be exposed to risks driven by changes in other climate-related developments that have the potential to generate a substantive change in your business operations, revenue or expenditure
Further Information
As a manufacturer of consumer products and a large multinational corporation, we are subject to various government regulations and may be subject to additional regulations in the future, violation of which could subject us to sanctions or otherwise harm our business. In addition, we could be the subject of future product liability suits or product recalls, which could harm our business. As a manufacturer of consumer products, we are subject to significant government regulations, including, in the United States, under The Consumer Products Safety Act, The Federal Hazardous Substances Act, and The Flammable Fabrics Act, as well as under product safety and consumer protection statutes in our international markets. In addition, certain of our products are subject to regulation by the Food and Drug Administration or similar international authorities. In addition, advertising to children is subject to regulation by the Federal Trade Commission, the Federal Communications Commission and a host of other agencies globally, and the collection of information from children under the age of thirteen is subject to the provisions of the Childrens’ Online Privacy Protection Act. While we take all the steps we believe are necessary to comply with these acts, there can be no assurance that we will be in compliance and failure to comply with these acts could result in sanctions which could have a negative impact on our business, financial condition and results of operations. We may also be subject to involuntary product recalls or may voluntarily conduct a product recall. While costs associated with product recalls have generally not been material to our business, the costs associated with future product recalls individually or in the aggregate in any given fiscal year could be significant. In addition, any product recall, regardless of direct costs of the

recall, may harm consumer perceptions of our products and have a negative impact on our future revenues and results of operations. Governments and regulatory agencies in the markets where we manufacture and sell products may enact additional regulations relating to product safety and consumer protection in the future and may also increase the penalties for failure to comply with product safety and consumer protection regulations. In addition, one or more of our customers might require changes in our products, such as the non-use of certain materials, in the future. Complying with any such additional regulations or requirements could impose increased costs on our business. Similarly, increased penalties for non-compliance could subject us to greater expense in the event any of our products were found to not comply with such regulations. Such increased costs or penalties could harm our business. As a large, multinational corporation, we are subject to a host of governmental regulations throughout the world, including antitrust, customs and tax requirements, anti-boycott regulations, environmental regulations and the Foreign Corrupt Practices Act. Complying with these regulations imposes costs on us which can reduce our profitability and our failure to successfully comply with any such legal requirements could subject us to monetary liabilities and other sanctions that could further harm our business and financial condition.
Page: 6. Climate Change Opportunities
6.1
Have you identified any climate change opportunities (current or future) that have the potential to generate a substantive change in your business operations, revenue or expenditure? Tick all that apply
Opportunities driven by changes in regulation Opportunities driven by changes in other climate-related developments
6.1a
Please describe your opportunities that are driven by changes in regulation
ID
Opportunity driver
Description
Potential impact
Timeframe
Direct/Indirect
Likelihood
Magnitude of impact
R1
Product labeling regulations and standards
Product labelling regulations and standards may present an opportunity to differentiate our products from competitors. In France, a trial is underway with 168 companies volunteering 1000 products. The aim of the trial is to provide sound information to
Increased demand for existing products/services
1-5 years Direct About as likely as not
Low

ID
Opportunity driver
Description
Potential impact
Timeframe
Direct/Indirect
Likelihood
Magnitude of impact
strengthen the nationwide roll-out of the eco-labelling law. Several working groups in various sectors have been collaborating to define the methodologies of the eco-labelling framework including outlining the goal and scope of the simplified LCA for the different product categories. Similar regulations may emerge in other European countries.
6.1b
Please describe (i) the potential financial implications of the opportunity; (ii) the methods you are using to manage this opportunity and (iii) the costs associated with these actions
i. Financially, it can present increased operating efficiencies which could result in cost savings. ii. We regularly assess the environmental characteristics of the materials we use to identify areas for improvement. Streamlined Life Cycle Assessment tools and software are used to support these efforts. We have already made significant progress in reducing packaging related waste, including: Reducing the amount of adhesive taping on master cartons (used to ship our product); Reducing the size of master shipping cartons; Specifying, where feasible, single-wall master carton construction, instead of double-walls; Reducing the use of secondary tissue paper material; Reducing window packaging (PVC) by changing to open and/or “try me” construction; Increasing the percentage of recycled material and post-consumer waste in action figure cards; Specifying 100 percent recycled material in medium-grade paper; Specifying a minimum 98 percent post-consumer recycled content in Kraft grade paper. iii. Materials with improved environmental characteristics can result in higher input costs.
6.1c
Please describe the opportunities that are driven by changes in physical climate parameters
ID
Opportunity driver
Description
Potential impact
Timeframe
Direct/ Indirect
Likelihood
Magnitude of impact

6.1d
Please describe (i) the potential financial implications of the opportunity; (ii) the methods you are using to manage this opportunity and (iii) the costs associated with these actions
6.1e
Please describe the opportunities that are driven by changes in other climate-related developments
ID
Opportunity driver
Description
Potential impact Timeframe
Direct/ Indirect
Likelihood
Magnitude of impact
O1 Reputation
Environmental issues are increasingly being associated with companies by consumers, stakeholders and the public. By taking proactive actions to improve environmental performance of our operations and products, there is an opportunity to obtain operational efficiencies and cost savings as well as distinguishing our company from competitors.
Increased demand for existing products/services
1-5 years Direct About as likely as not
Low
O2 Changing consumer behaviour
Consumer awareness is growing and purchasing decisions may be influenced by consumer values. By producing products which minimize environmental impacts, there is an opportunity to build brand loyalty and differentiate our products from competitors.
Increased demand for existing products/services
1-5 years Direct About as likely as not
Low
6.1f
Please describe (i) the potential financial implications of the opportunity; (ii) the methods you are using to manage this opportunity; (iii) the costs associated with these actions
i. While it is difficult to quantify the financial impact, the reputational and consumer behaviour opportunities have the potential operating efficiencies and to effect sales.

ii. Hasbro has taken a number of steps to address this opportunity. We are working hard to reduce packaging and to maximize the use of recycled materials for our packaging. Where we have to use virgin materials, we strive to find sources that are certified as sustainable. We are fully committed to sustainable packaging and that’s why we are actively pursuing our goal to eliminate PVC from all Hasbro core toy and game packaging beginning in 2013. We have also designed and implemented an internal checklist, which our designers use to compare packaging systems. Environmental factors considered include the number of packaging layers, greenhouse (GHG) emissions associated with the packaging, and the type and weight of material used. Hasbro purchases paper from suppliers who practice sustainable forestry. Both of our owned and operated factories have achieved certification from recognized certifying bodies like the Forest Stewardship Council (FSC). In 2010 we pledged to source at least 75 percent of paper packaging from recycled material or sources that practice sustainable forest management. By 2015, we aim to reach 90 percent usage of these materials and sources for all paperboard packaging and in-box content. iii. Material costs can be higher in some cases and this can be offset, at least in part, through material reduction.
6.1g
Please explain why you do not consider your company to be exposed to opportunities driven by changes in regulation that have the potential to generate a substantive change in your business operations, revenue or expenditure
6.1h
Please explain why you do not consider your company to be exposed to opportunities driven by physical climate parameters that have the potential to generate a substantive change in your business operations, revenue or expenditure
Hasbro has considered physical climate change parameters such as temperature, precipitation, changes in weather patterns and other natural resources and has determined that they do not present substantial opportunities to Hasbro at this time.
6.1i
Please explain why you do not consider your company to be exposed to opportunities driven by changes in other climate-related developments that have the potential to generate a substantive change in your business operations, revenue or expenditure
Module: GHG Emissions Accounting, Energy and Fuel Use, and Trading [Investor]
Page: 7. Emissions Methodology
7.1
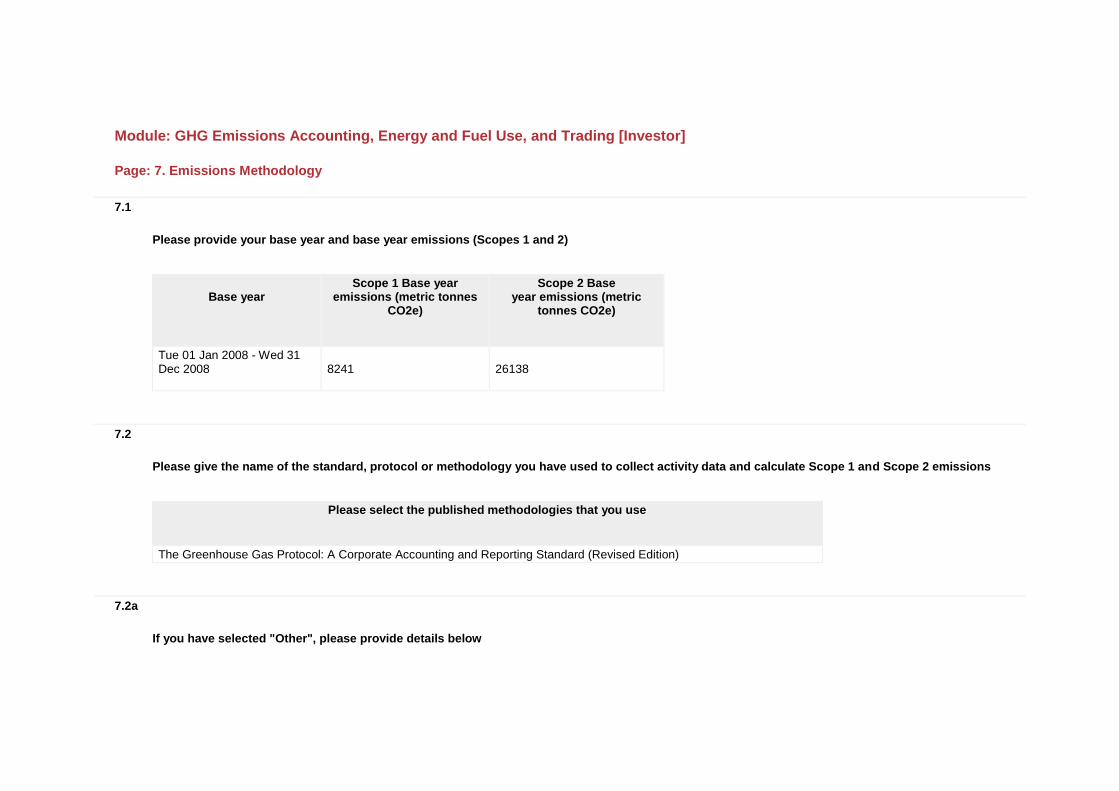
Please provide your base year and base year emissions (Scopes 1 and 2)
Base year
Scope 1 Base year emissions (metric tonnes
CO2e)
Scope 2 Base year emissions (metric
tonnes CO2e)
Tue 01 Jan 2008 - Wed 31 Dec 2008
8241 26138
7.2
Please give the name of the standard, protocol or methodology you have used to collect activity data and calculate Scope 1 and Scope 2 emissions
Please select the published methodologies that you use
The Greenhouse Gas Protocol: A Corporate Accounting and Reporting Standard (Revised Edition)
7.2a
If you have selected "Other", please provide details below

7.3
Please give the source for the global warming potentials you have used
Gas
Reference
7.4
Please give the emissions factors you have applied and their origin; alternatively, please attach an Excel spreadsheet with this data
Fuel/Material/Energy
Emission Factor
Unit
Reference
Page: 8. Emissions Data - (1 Jan 2012 - 31 Dec 2012)
8.1
Please select the boundary you are using for your Scope 1 and 2 greenhouse gas inventory
Operational control
8.2
Please provide your gross global Scope 1 emissions figures in metric tonnes CO2e
5985

8.3
Please provide your gross global Scope 2 emissions figures in metric tonnes CO2e
17422
8.4
Are there are any sources (e.g. facilities, specific GHGs, activities, geographies, etc.) of Scope 1 and Scope 2 emissions which are not included in your disclosure?
No
8.4a
Please complete the table
Source
Scope
Explain why the source is excluded
8.5
Please estimate the level of uncertainty of the total gross global Scope 1 and 2 emissions figures that you have supplied and specify the sources of uncertainty in your data gathering, handling and calculations

Scope 1
emissions: Uncertainty
range
Scope 1
emissions: Main
sources of uncertainty
Scope 1 emissions: Please expand on
the uncertainty in your data
Scope 2
emissions: Uncertainty
range
Scope 2
emissions: Main
sources of uncertainty
Scope 2 emissions: Please expand on
the uncertainty in your data
Less than or equal to 2%
Data Gaps
Where Hasbro leases space in multi-tenant office buildings, specific use data is not always available. Total building energy use is prorated based on percentage of Hasbro occupied space in these cases.
More than 2% but less than or equal to 5%
Data Gaps
Where Hasbro leases space in multi-tenant office buildings, specific use data is not always available. Total building energy use is prorated based on percentage of Hasbro occupied space in these cases.
8.6
Please indicate the verification/assurance status that applies to your Scope 1 emissions
Third party verification or assurance complete
8.6a
Please indicate the proportion of your Scope 1 emissions that are verified/assured
More than 90% but less than or equal to 100%
8.6b
Please provide further details of the verification/assurance undertaken, and attach the relevant statements

Type of verification or assurance
Relevant standard
Attach the document
Moderate assurance AA1000AS https://www.cdproject.net/sites/2013/26/8126/Investor CDP 2013/Shared Documents/Attachments/Investor-8.6b-C3-RelevantStatement/Investor-8.6b-VerificationDetails1/HASBRO CDP 2013 Assurance Statement AA1000.pdf
8.6c
Please provide further details of the regulatory regime to which you are complying that specifies the use of Continuous Emissions Monitoring Systems (CEMS)
Regulation
% of emissions covered by the system Compliance period
Evidence of submission
8.7
Please indicate the verification/assurance status that applies to your Scope 2 emissions
Third party verification or assurance complete
8.7a
Please indicate the proportion of your Scope 2 emissions that are verified/assured
More than 90% but less than or equal to 100%
8.7b
Please provide further details of the verification/assurance undertaken, and attach the relevant statements

Type of verification or assurance
Relevant standard
Attach the document
Moderate assurance AA1000AS https://www.cdproject.net/sites/2013/26/8126/Investor CDP 2013/Shared Documents/Attachments/Investor-8.7b-C3-RelevantStatement/Investor-8.7b-VerificationDetailsS21/HASBRO CDP 2013 Assurance Statement AA1000.pdf
8.8
Are carbon dioxide emissions from biologically sequestered carbon relevant to your organization?
No
8.8a
Please provide the emissions in metric tonnes CO2
Page: 9. Scope 1 Emissions Breakdown - (1 Jan 2012 - 31 Dec 2012)
9.1
Do you have Scope 1 emissions sources in more than one country?
Yes
9.1a

Please complete the table below
Country/Region
Scope 1 metric tonnes CO2e
United States of America 2493
Mexico 139
Canada 481
United Kingdom 774
Turkey 112
Switzerland 23
Spain 66
Poland 124
Netherlands 75
Italy 137
Ireland 519
Hungary 108
Greece 37
Germany 234
France 124
Denmark 110
Belgium 289
Austria 32
New Zealand 11
China 11
Romania 34
Czech Republic 1
Australia 50
9.2
Please indicate which other Scope 1 emissions breakdowns you are able to provide (tick all that apply)

By facility By activity
9.2a
Please break down your total gross global Scope 1 emissions by business division
Business division
Scope 1 emissions (metric tonnes CO2e)
9.2b
Please break down your total gross global Scope 1 emissions by facility
Facility
Scope 1 emissions (metric tonnes CO2e)
Latitude
Longitude
RI Bldg 1027 772
RI Bldg 1011 50
RI Bldg NPD 133
RI Bldg 1033 117
MA ELM 1346
TX GP 50
WA Renton 14
FL Miami 8
AK Bentonville 1
MA Dedham 2
Mexico DC 127
Mexico Office 12
Quebec 480
UK Newport 477

Facility
Scope 1 emissions (metric tonnes CO2e)
Latitude
Longitude
UK Uxbridge 296
Istanbul 112
Baar 23
Valencia 66
Warsaw 124
Emmen 26
Utrecht 50
Milan 137
Waterford 519
Budapest 108
Athens 37
Dreieich 2
Soest 231
Cruetzwald 120
Le Bourget 4
Glostrup 110
Brussels 289
Vienna 32
Aukland 11
Wharf HK 2
Shatin HK 1
Shanghai 1
WC HK 4
Shenzhen 3
Bucharest 34
Prague 1
Epping 8
Erskine 42
9.2c

Please break down your total gross global Scope 1 emissions by GHG type
GHG type
Scope 1 emissions (metric tonnes CO2e)
9.2d
Please break down your total gross global Scope 1 emissions by activity
Activity
Scope 1 emissions (metric tonnes CO2e)
Stationary Combustion 4190
Refrigerants 76
Mobile 1719
9.2e
Please break down your total gross global Scope 1 emissions by legal structure
Legal structure
Scope 1 emissions (metric tonnes CO2e)
Page: 10. Scope 2 Emissions Breakdown - (1 Jan 2012 - 31 Dec 2012)
10.1
Do you have Scope 2 emissions sources in more than one country?
Yes

10.1a
Please complete the table below
Country/Region
Scope 2 metric tonnes CO2e
Purchased and consumed electricity, heat, steam or cooling (MWh)
Purchased and consumed low carbon electricity, heat, steam or cooling (MWh)
United States of America 9220
Mexico 466
Switzerland 1
Canada 167
United Kingdom 888
Turkey 53
Spain 401
Russia 39
Poland 15
Netherlands 18
Italy 60
Ireland 2888
Hungary 18
Greece 64
Germany 335
France 205
Denmark 25
Belgium 28
Austria 1
Taiwan 2
Singapore 24
New Zealand 15
Malaysia 43
Japan 6
China 2039
Romania 3

Country/Region
Scope 2 metric tonnes CO2e
Purchased and consumed electricity, heat, steam or cooling (MWh)
Purchased and consumed low carbon electricity, heat, steam or cooling (MWh)
Czech Republic 28
South Korea 43
Australia 326
Chile 1
10.2
Please indicate which other Scope 2 emissions breakdowns you are able to provide (tick all that apply)
By facility By activity
10.2a
Please break down your total gross global Scope 2 emissions by business division
Business division
Scope 2 emissions (metric tonnes CO2e)
10.2b
Please break down your total gross global Scope 2 emissions by facility
Facility
Scope 2 emissions (metric tonnes CO2e)
RI Bldg 1027 1422

Facility
Scope 2 emissions (metric tonnes CO2e)
RI Bldg 1011 121
RI Bldg NPD 1551
RI Bldg 1033 181
MA ELM 4694
TX GP 373
WA Renton 716
FL Miami 68
MA Dedham 53
Mexico DC 354
Mexico Office 112
Santiago 1
Ontario 166
Quebec 1
UK Newport 268
UK Uxbridge 620
Istanbul 53
Valencia 401
Moscow 39
Warsaw 15
Utrecht 18
Milan 60
Waterford 2888
Budapest 18
Athens 64
Dreieich 64
Soest 271
Creutzwald 147
Le Bourget 53
Glostrup 25
Brussels 28
Vienna 1
Taipai 2
Singapore 24

Facility
Scope 2 emissions (metric tonnes CO2e)
Aukland 15
Selangor 43
Tokyo 6
Shatin HK 10
Shanghai 23
WC HK 832
Shenzhen 236
Bucharest 3
Prague 28
Soeul 43
Epping 113
Erskine 213
Beverly, MA 7
Arkansas 34
Baar 1
Paris 5
Wharf HK 938
10.2c
Please break down your total gross global Scope 2 emissions by activity
Activity
Scope 2 emissions (metric tonnes CO2e)
Electricity Purchase 17422
10.2d
Please break down your total gross global Scope 2 emissions by legal structure

Legal structure
Scope 2 emissions (metric tonnes CO2e)
Page: 11. Energy
11.1
What percentage of your total operational spend in the reporting year was on energy?
More than 0% but less than or equal to 5%
11.2
Please state how much fuel, electricity, heat, steam, and cooling in MWh your organization has purchased and consumed during the reporting year
Energy type
MWh
Fuel 20808
Electricity 48320
Heat
Steam
Cooling
11.3
Please complete the table by breaking down the total "Fuel" figure entered above by fuel type
Fuels
MWh
Distillate fuel oil No 2 4728

Fuels
MWh
Natural gas 16080
11.4
Please provide details of the electricity, heat, steam or cooling amounts that were accounted at a low carbon emission factor
Basis for applying a low carbon emission factor
MWh associated with low carbon electricity, heat, steam or cooling
Comments
No purchases or generation of low carbon electricity, heat, steam or cooling
Page: 12. Emissions Performance
12.1
How do your absolute emissions (Scope 1 and 2 combined) for the reporting year compare to the previous year?
Decreased
12.1a
Please complete the table
Reason
Emissions value (percentage)
Direction of change
Comment
Emissions reduction activities 14.4 Decrease No major changes occurred in the calendar year in reporting activity.
Divestment
Acquisitions
Mergers

Reason
Emissions value (percentage)
Direction of change
Comment
Change in output
Change in methodology
Change in boundary
Change in physical operating conditions
Unidentified
Other
12.2
Please describe your gross combined Scope 1 and 2 emissions for the reporting year in metric tonnes CO2e per unit currency total revenue
Intensity figure
Metric numerator
Metric denominator
% change from previous year
Direction of change from previous year
Reason for change
.00572 metric tonnes CO2e
unit total revenue 10.3 Decrease Absolute emissions reduced by 14.4% and revenues decreased by 4.7%
12.3
Please describe your gross combined Scope 1 and 2 emissions for the reporting year in metric tonnes CO2e per full time equivalent (FTE) employee
Intensity figure
Metric numerator
Metric denominator
% change from previous year
Direction of change from previous year
Reason for change
4.25582 metric tonnes CO2e
FTE employee 8.2 Decrease Absolute emissions reduced by 14.4% and employees reduced by approximately 6.8%.

12.4
Please provide an additional intensity (normalized) metric that is appropriate to your business operations
Intensity figure
Metric numerator
Metric denominator
% change from previous year
Direction of change from previous year
Reason for change
.00496 metric tonnes CO2e
square foot 14.1 Decrease Absolute emissions reduced by 14.4% and square footage reduced by 0.4%.
Page: 13. Emissions Trading
13.1
Do you participate in any emissions trading schemes?
No, and we do not currently anticipate doing so in the next 2 years
13.1a
Please complete the following table for each of the emission trading schemes in which you participate
Scheme name
Period for which data is supplied
Allowances allocated
Allowances purchased
Verified emissions in metric tonnes CO2e
Details of ownership
13.1b
What is your strategy for complying with the schemes in which you participate or anticipate participating?

13.2
Has your company originated any project-based carbon credits or purchased any within the reporting period?
No
13.2a
Please complete the table
Credit origination
or credit purchase
Project type
Project identification
Verified to which standard
Number of credits (metric
tonnes of CO2e)
Number of credits (metric tonnes
CO2e): Risk adjusted volume
Credits retired
Purpose, e.g. compliance
Page: 14. Scope 3 Emissions
14.1
Please account for your organization’s Scope 3 emissions, disclosing and explaining any exclusions
Sources of Scope 3 emissions
Evaluation status
metric tonnes CO2e
Methodology
Percentage of emissions calculated
using primary data
Explanation
Purchased goods and services
Relevant, not yet calculated
Capital goods Relevant, not yet calculated

Sources of Scope 3 emissions
Evaluation status
metric tonnes CO2e
Methodology
Percentage of emissions calculated
using primary data
Explanation
Fuel-and-energy-related activities (not included in Scope 1 or 2)
Not evaluated
Upstream transportation and distribution
Relevant, not yet calculated
Waste generated in operations
Relevant, not yet calculated
Business travel Relevant, calculated
2273 The Greenhouse Gas Protocol: A Corporate Accounting and Reporting Standard
100% Includes data for China, UK, USA, New Zealand, Malaysia, and Hungary.
Employee commuting Relevant, not yet calculated
Upstream leased assets Not evaluated
Investments Not evaluated
Downstream transportation and distribution
Relevant, calculated
62171 The Greenhouse Gas Protocol: A Corporate Accounting and Reporting Standard
100% Represents 58906 from third party transportation and 3265 from third party distribution centers.
Processing of sold products Not evaluated
Use of sold products Relevant, not yet calculated
End of life treatment of sold products
Relevant, not yet calculated
Downstream leased assets Not evaluated
Franchises Not relevant, explanation provided
No franchises
Other (upstream) Relevant, calculated
418861 The Greenhouse Gas Protocol: A Corporate Accounting and Reporting Standard
100% Represents data from 42 third party manufacturing suppliers located in China.
Other (downstream) Not evaluated
14.2
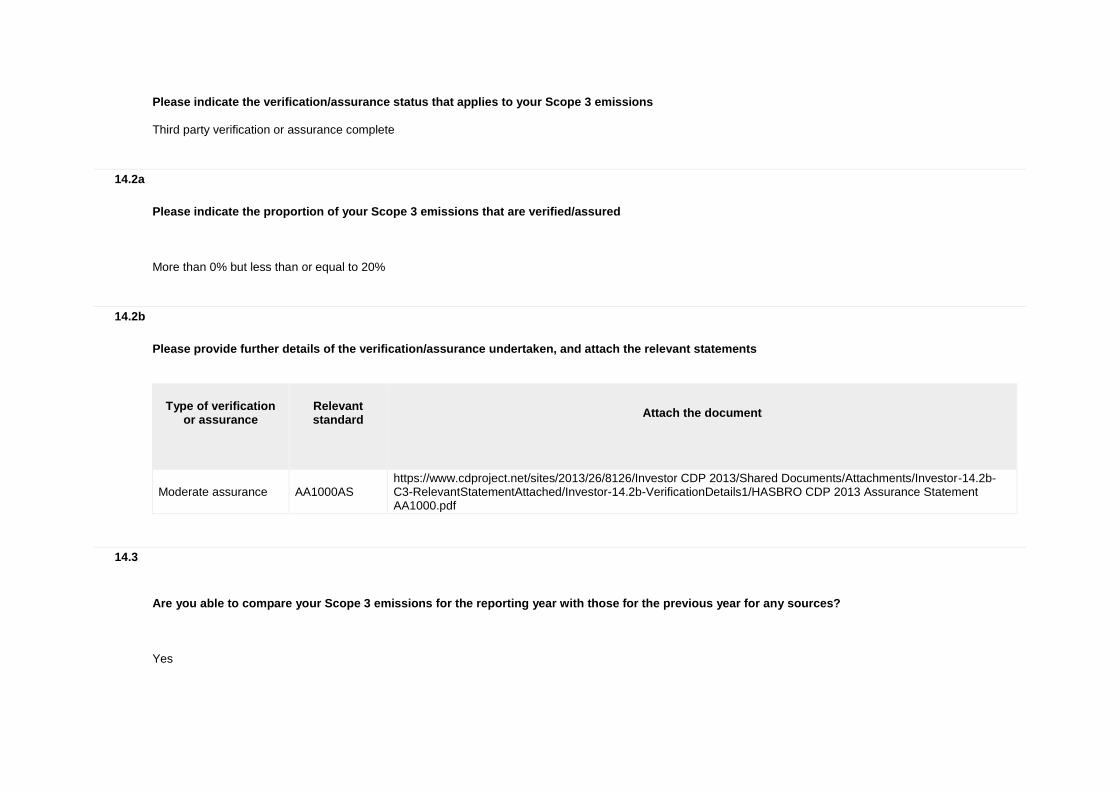
Please indicate the verification/assurance status that applies to your Scope 3 emissions
Third party verification or assurance complete
14.2a
Please indicate the proportion of your Scope 3 emissions that are verified/assured
More than 0% but less than or equal to 20%
14.2b
Please provide further details of the verification/assurance undertaken, and attach the relevant statements
Type of verification
or assurance
Relevant standard
Attach the document
Moderate assurance AA1000AS https://www.cdproject.net/sites/2013/26/8126/Investor CDP 2013/Shared Documents/Attachments/Investor-14.2b-C3-RelevantStatementAttached/Investor-14.2b-VerificationDetails1/HASBRO CDP 2013 Assurance Statement AA1000.pdf
14.3
Are you able to compare your Scope 3 emissions for the reporting year with those for the previous year for any sources?
Yes

14.3a
Please complete the table
Sources of Scope 3
emissions
Reason for
change
Emissions value
(percentage)
Direction of
change
Comment
Business travel
44 Decrease Fewer countries able to collect and report data.
Downstream transportation and distribution
20 Increase Change in percentage of products shipped to international markets verse USA/CA markets.
Other (upstream)
30 Decrease The number of suppliers decreased.
14.4
Do you engage with any of the elements of your value chain on GHG emissions and climate change strategies? (Tick all that apply)
Yes, our suppliers Yes, our customers Yes, other partners in the value chain
14.4a
Please give details of methods of engagement, your strategy for prioritizing engagements and measures of success
Hasbro’s strong culture of compliance, honesty and transparency is the foundation for our corporate social responsibility (CSR) efforts and stakeholder engagement strategy. Stakeholder views are important to us and influence our business decisions. We engage regularly with a wide range of internal and external stakeholders, listening to their suggestions, and using their feedback to improve our business. Collaboration helps us to frame our CSR agenda effectively and appropriately and advance our work in the field. Investors and Analysts: Our Investor Relations department regularly informs and updates our investors and analysts on Hasbro’s financial and operational performance. We have an open line of communication between investors, analysts, the Investor Relations department and our senior management team. We engage with our investors and analysts through means including press releases, SEC filings, conference calls, meetings, and our Investor Relations website. Regulators and Policymakers: Our Government Affairs group interacts with regulators and policymakers around the globe, through company outreach or industry association activities, including public policy forums.

Nongovernmental Organizations (NGOs): We collaborate with NGOs on issues of mutual importance including product safety, manufacturing ethics, and the environment. Retailers: We value the input of our retailers and hold regular meetings with key customers. Our Sales and Marketing teams and senior executives serve as points of contact. In addition to working within the toy industry, we are looking to other industry and social compliance initiatives to identify best practice approaches for tackling tough social compliance issues. For example, in 2008 we joined the Global Social Compliance Programme (GSCP). This partnership of multinational retailers and brands pursues continuous improvement in working and environmental conditions across global supply chains, taking an approach based on consensus and best practice. Employees: CSR is important to Hasbro employees, particularly new recruits who look to the company for CSR leadership and innovation. Our Human Resources department interacts with employees through employee orientation, Green Teams, and other internal communication channels. Supply Chain: We communicate regularly with our third party and licensed manufacturing vendors around the world and their workers. Continued in 'Further Information' below.
14.4b
To give a sense of scale of this engagement, please give the number of suppliers with whom you are engaging and the proportion of your total spend that they represent
Number of suppliers
% of total spend Comment
42 85% Suppliers based in China
14.4c
If you have data on your suppliers’ GHG emissions and climate change strategies, please explain how you make use of that data
How you make use of the data
Please give details
Identifying GHG sources to prioritize for reduction actions
As we expand the reporting of our GHG scope 3 emissions, we are working to track and confirm the environmental footprint of our transportation and distribution partners, manufacturing vendors, warehouse operations and other third party suppliers. We are currently working with our third party manufacturing facilities, establishing internal processes to track GHG emissions and have begun to solicit third party verification on this data. For certain vendors, we have less visibility into emissions data, so Hasbro teams are also working to verify this data internally with an eye toward third party verification in years to come. Hasbro’s commitment to ethical manufacturing includes a process of rigorous review of our suppliers’ practices. Working hours and transparency continue to be our biggest known challenges in this regard. To address these issues, Hasbro works in conjunction with the ICTI CARE Process to develop corrective action plans for factories with violations, solicit commitments to improvement from each factory, and actively work with factories to ensure all areas of non-compliance are corrected. For factories that do not improve their standing within a predetermined timeframe, our policy is to move production to different facilities. We believe our strong and longstanding relationships with our manufacturing partners are due in part to this collaborative approach. ICTI CARE audits assess a factory’s standing in the

How you make use of the data
Please give details
following areas: Working hours Wages and compensation Child labor Forced labor and Prison labor Disciplinary practices Discrimination Employee representation Facilities Fire prevention Environmental Health and Safety Employee welfare (dormitories, cafeteria services, medical).
14.4d
Please explain why not and any plans you have to develop an engagement strategy in the future
Further Information
Consumers: We measure consumer satisfaction based on comments submitted by consumers via email, phone, online chat, social media and written correspondence. Our Consumer Affairs, Marketing teams, and regional offices maintain this dialogue. Hasbro consumers are vitally important to us. Our product safety, manufacturing ethics and environmental sustainability initiatives help us build the trust and confidence of our consumers, and create more enjoyable, entertaining and memorable experiences with Hasbro products. Consumer Affairs and regional offices around the world serve as the first port of call for consumers, responding to inquiries and providing information on Hasbro products. Consumer Affairs records and tracks information from consumers on potential issues of concern, passing this feedback to appropriate divisions for analysis and handling. Our safety procedures and protocols, developed jointly by the Consumer Affairs, Quality Assurance and Legal teams, guide resolution for safety concerns raised by consumers. Trained specialists support consumer inquiries regarding product safety. Customer complaints alleging harm or injury are dealt with by our Quality Assurance and Product Safety teams. We measure consumer satisfaction based on comments we receive via email, phone, online chat, social media and written correspondence. Information on top consumer trends and brand issues is shared internally in monthly consumer feedback reports and year-end reports. Hasbro uses global online communities to gain feedback on a variety of issues important to families, moms and children. Insights gained help to inspire and guide the direction of products across our strategic blueprint in toy, gaming, entertainment, licensing and digital expressions. Our online communities include: 1) Hasbro Kid and Family Hot Spot: a community of multinational children aged six to 14 and their families. 2) Play Panel: a group of child development and preschool education experts from around the world who help inform our product development thinking. Our Playskool team meets with the panel at least twice a year to discuss product, play, and parenting topics. 3) Mom-to-Mom Community: an online global research community of mothers. For over twenty years, our on-site play testing FunLab location at our corporate headquarters has allowed us to observe, play and interact with thousands of kids every year. In 2011 we added a new on-site FunLab at our Stockley Park U.K. office. Direct interaction with children and caregivers in our FunLabs helps inform our product development and inspire our designers. In November 2011, we released our first paper sourcing policy. The policy outlines our approach and our expectations of suppliers on sustainable paper sourcing. We have communicated our new paper policy to our suppliers, informing them of our expectations and goals, and we have embedded the policy into our company-wide quality assurance policies and procedures. We will continue to monitor and report on our progress. Hasbro purchases paper from suppliers who practice sustainable forestry. Both of our owned and operated factories have achieved certification from recognized
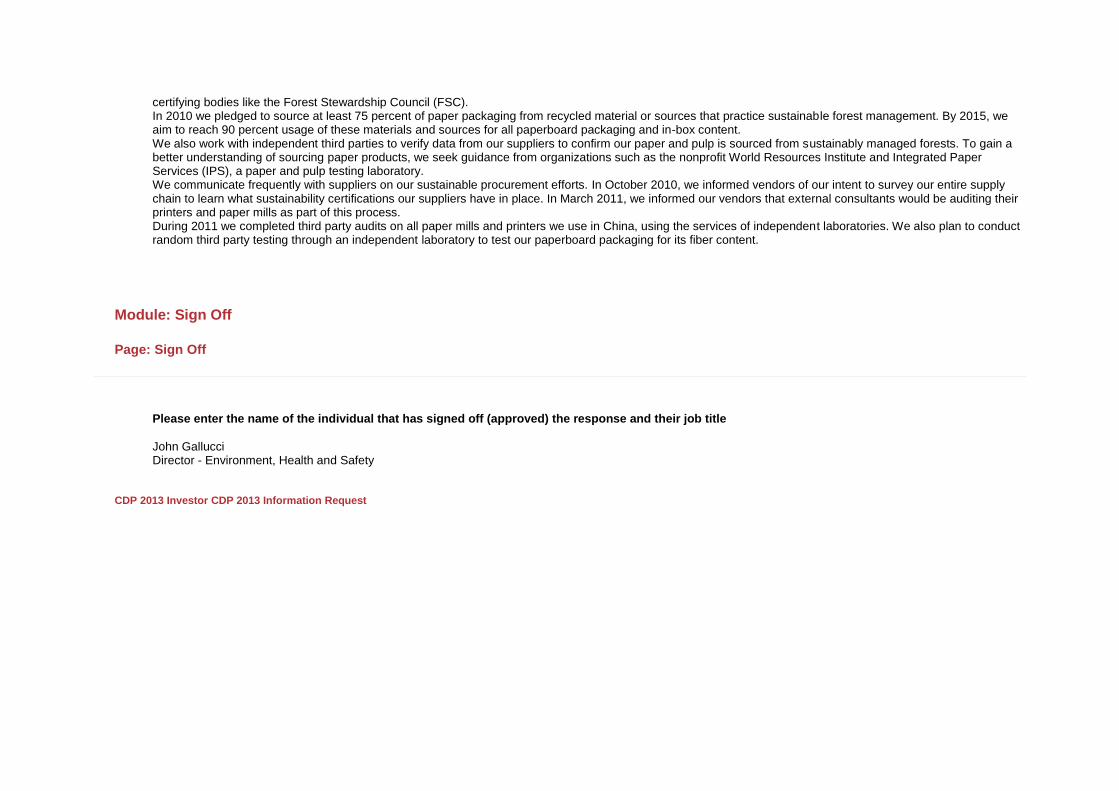
certifying bodies like the Forest Stewardship Council (FSC). In 2010 we pledged to source at least 75 percent of paper packaging from recycled material or sources that practice sustainable forest management. By 2015, we aim to reach 90 percent usage of these materials and sources for all paperboard packaging and in-box content. We also work with independent third parties to verify data from our suppliers to confirm our paper and pulp is sourced from sustainably managed forests. To gain a better understanding of sourcing paper products, we seek guidance from organizations such as the nonprofit World Resources Institute and Integrated Paper Services (IPS), a paper and pulp testing laboratory. We communicate frequently with suppliers on our sustainable procurement efforts. In October 2010, we informed vendors of our intent to survey our entire supply chain to learn what sustainability certifications our suppliers have in place. In March 2011, we informed our vendors that external consultants would be auditing their printers and paper mills as part of this process. During 2011 we completed third party audits on all paper mills and printers we use in China, using the services of independent laboratories. We also plan to conduct random third party testing through an independent laboratory to test our paperboard packaging for its fiber content.
Module: Sign Off
Page: Sign Off
Please enter the name of the individual that has signed off (approved) the response and their job title
John Gallucci Director - Environment, Health and Safety
CDP 2013 Investor CDP 2013 Information Request