CDMA Design
62
ORG000101 Conspectus of Planning and Optimization of CDMA 1X Network ISSUE1.0 Mobile Network Curriculum Development Section
description
Objectives of network planningCDMA 1X Network planning flowDifference between network planning of CDMA and GSM
Transcript of CDMA Design

ORG000101Conspectus of Planning and
Optimization of CDMA 1X Network ISSUE1.0
ORG000101Conspectus of Planning and
Optimization of CDMA 1X Network ISSUE1.0
Mobile Network Curriculum
Development Section
Study objectiveStudy objective
It is required that after the course
study, you should:
• Have a general concept about network planning
• Have an understanding of characteristics of CDMA network planning
• Have an understanding of the main contents of network planning
• Have an understanding of the main contents of network optimization

Contents of the course Contents of the course
Chapter 1 CDMA 1X Network Planning
Process & Characteristics
Chapter 2 CDMA 1X Network Planning
Chapter 3 CDMA 1X Network
Optimization
Chapter 1 CDMA 1X Network Planning Process & Characteristics
Chapter 1 CDMA 1X Network Planning Process & Characteristics
Objectives of network planning
CDMA 1X Network planning flow
Difference between network
planning of CDMA and GSM

To establish the largest radio network To establish the largest radio network both in both in capacitycapacity and and coveragecoverage with a with a certain certain costcost and under the preconditio and under the precondition of meeting the n of meeting the QoSQoS of network, and f of network, and further, adapt to the future network deurther, adapt to the future network development and expansion.velopment and expansion.
To establish the largest radio network To establish the largest radio network both in both in capacitycapacity and and coveragecoverage with a with a certain certain costcost and under the preconditio and under the precondition of meeting the n of meeting the QoSQoS of network, and f of network, and further, adapt to the future network deurther, adapt to the future network development and expansion.velopment and expansion.
Objectives of network planning Objectives of network planning
CoverageCoverage QualityQuality CostCostCapacityCapacity
Realization of excellent balance of all aspects via network planning

CDMA 1X Network planning flowCDMA 1X Network planning flow CDMA 1X Network planning flowCDMA 1X Network planning flow
Analysis of traffic coverage
Emulation
Site survey
System design
Installation andIntegration
Network optimization

Difference of Network Planning Between CDMA and GSM
Difference of Network Planning Between CDMA and GSM
CDMACDMA
Dynamic coverage isrelated to capacityand interference
Dynamic coverage isDynamic coverage isrelated to capacityrelated to capacityand interferenceand interference
Simple, N=1SimpleSimple, , N=1N=1
Interferencelimited
InterferenceInterferencelimitedlimited
Multi-serviceand high speedMulti-serviceMulti-serviceand high speedand high speed
GSMGSM
PredictionPredictionPrediction
Static coverageStatic coverageStatic coverage
Complex, keytechnology
Complex, keyComplex, keytechnologytechnology
Static capacityStatic capacityStatic capacity
Voice serviceas body
Voice serviceVoice serviceas bodyas body
Planningmethod
PlanningPlanningmethodmethod
CoverageCoverageCoverage
Frequencyplanning
FrequencyFrequencyplanningplanning
Capaci typlanningCapaci tyCapaci typlanningplanning
Data serviceplanning
Data serviceData serviceplanningplanning
PredicationEmulation
PredicationPredicationEmulationEmulation

Coverage, capacity and quality
The three factors influence each other and at the same time inter-depend on each other. Therefore, coverage cannot be separated from capacity and quality for discussion.With the increase network capacity, the coverage scope will be definitely reduced, and vice versa.To achieve wider coverage, the total power of traffic channel can be properly reduced to increase the seizure rate of pilot channel, but this may affect the capacity and the quality of conversation.
Relationship among coverage, capacity and quality
QuestionQuestion
What are the objectives of
networking planning?
Please describe the process
of network planning.
Differences between network
planning of CDMA and GSM?

Contents of the course Contents of the course
Chapter 1 CDMA 1X Network Planning
Process & Characteristics
Chapter 2 CDMA 1X Network Planning
Chapter 3 CDMA 1X Network
Optimization

Chapter 2 CDMA 1X Network PlanningChapter 2 CDMA 1X Network Planning
Section 1 Coverage PlanningSection 1 Coverage Planning
Section 2 Capacity PlanningSection 2 Capacity Planning
Section 3 Power PlanningSection 3 Power Planning
Section 4 Handoff PlanningSection 4 Handoff Planning
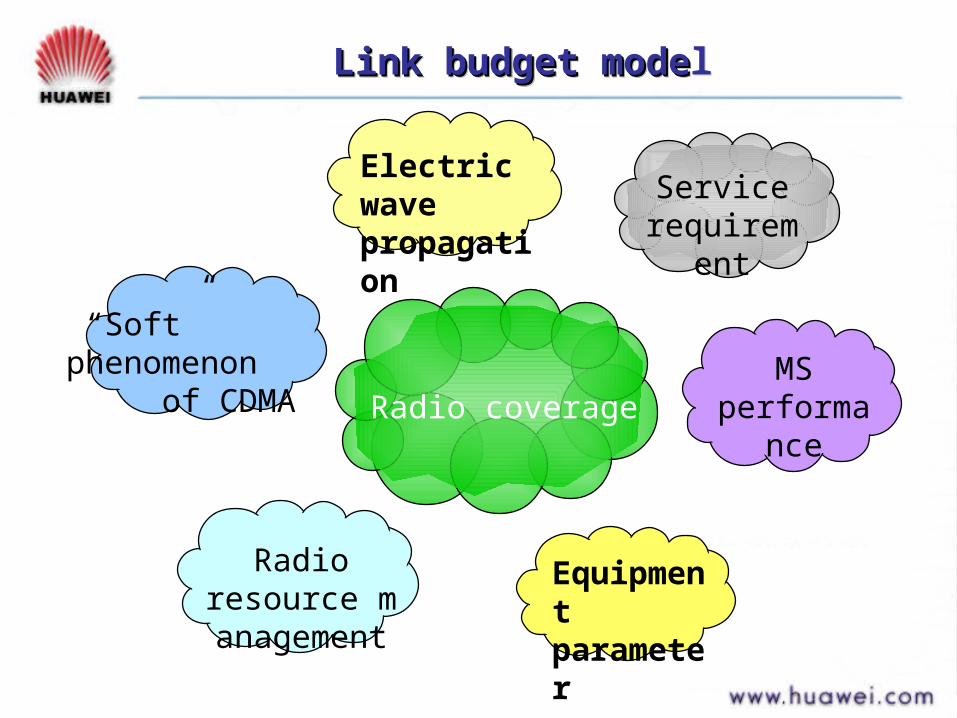
Link budget modeLink budget modelLink budget modeLink budget model
Radio coverage
Electric wave propagation Service
requirement
MS performance
Equipment parameter
Radio resource management
“Soft” phenomenon of CDMA

Link budget modelLink budget modelLink budget modelLink budget model
Forward link
Reverse link
Both forward and reverse links within the coverage area should reach balanceBoth forward and reverse links within the coverage area should reach balance
Parameter related to equipment: transmission power, receiver setransmission power, receiver sensitivity, parts and feeder loss, antenna lossnsitivity, parts and feeder loss, antenna lossParameters related to radio environment: fast fading margin, slofast fading margin, slow fading margin and cluster lossw fading margin and cluster lossParameter related to CDMA technology: system load affection, sofsystem load affection, soft handoff gain and Eb/Ntt handoff gain and Eb/NtParameters related to service: service type, data rate, maximum trservice type, data rate, maximum transmission power of each traffic channelansmission power of each traffic channelPropagation model: classical-Okumura Hata model,etc.classical-Okumura Hata model,etc.
Parameter related to equipment: transmission power, receiver setransmission power, receiver sensitivity, parts and feeder loss, antenna lossnsitivity, parts and feeder loss, antenna lossParameters related to radio environment: fast fading margin, slofast fading margin, slow fading margin and cluster lossw fading margin and cluster lossParameter related to CDMA technology: system load affection, sofsystem load affection, soft handoff gain and Eb/Ntt handoff gain and Eb/NtParameters related to service: service type, data rate, maximum trservice type, data rate, maximum transmission power of each traffic channelansmission power of each traffic channelPropagation model: classical-Okumura Hata model,etc.classical-Okumura Hata model,etc.
Classification of parameters involved in link budget of CDMA 1X:Classification of parameters involved in link budget of CDMA 1X:
Receive/transmitpower
Receive/transmitpowerAntenna gainAntenna gainFeeder lossFeeder loss Interference
margin
Interferencemargin
Antennagain
AntennagainPath LossPath LossTransmit-receive
power
Transmit-receivepower
Soft handoffgain
Soft handoffgain
Fadingmargin
Fadingmargin

Link budget parametersLink budget parameters Link budget parametersLink budget parameters
Eb/Nt parameter setting of BTS
Eb/Nt( dB )
FER 1% FER 5% FER 5% FER 5% FER 5%
Voice service
( 9.6kbps )
Data service
( 19.2kbps )
Data service ( 38.4kbps )
Data service ( 76.8kbps )
Data service ( 153.6kbps )
Static (0km/h)
3.5 3.4 2.59 2.15 1.54
Walking (3km/h)
5.57 4.11 3.01 2.47 1.98
Vehicle speed
(8km/h)
6.34 4.96 3.64 3.01 2.51
Vehicle speed
(30km/h)
7.13 5.96 4.78 4.28 3.8
Vehicle speed
(100km/h)
6.78 5.37 4.26 3.57 2.68
Link budget parametersLink budget parametersLink budget parametersLink budget parameters
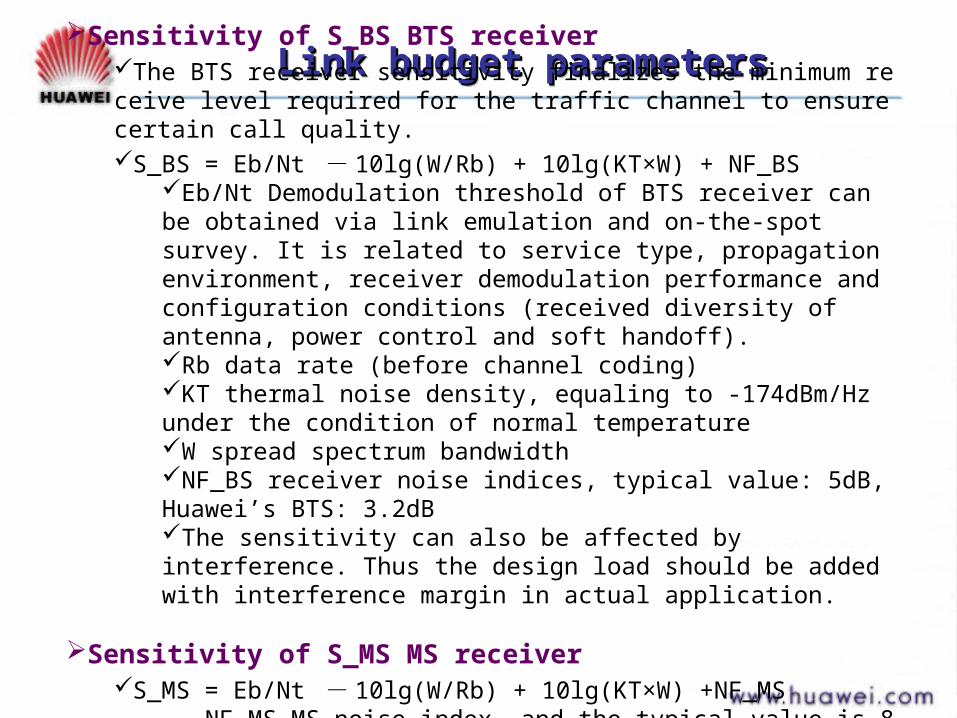
Sensitivity of S_BS BTS receiverThe BTS receiver sensitivity finalizes the minimum receive level required for the traffic channel to ensure certain call quality.S_BS = Eb/Nt - 10lg(W/Rb) + 10lg(KT×W) + NF_BS
Eb/Nt Demodulation threshold of BTS receiver can be obtained via link emulation and on-the-spot survey. It is related to service type, propagation environment, receiver demodulation performance and configuration conditions (received diversity of antenna, power control and soft handoff).Rb data rate (before channel coding)KT thermal noise density, equaling to -174dBm/Hz under the condition of normal temperatureW spread spectrum bandwidthNF_BS receiver noise indices, typical value: 5dB, Huawei’s BTS: 3.2dBThe sensitivity can also be affected by interference. Thus the design load should be added with interference margin in actual application.
Sensitivity of S_MS MS receiverS_MS = Eb/Nt - 10lg(W/Rb) + 10lg(KT×W) +NF_MS
NF_MS MS noise index, and the typical value is 8dB
Link budget parametersLink budget parametersLink budget parametersLink budget parameters
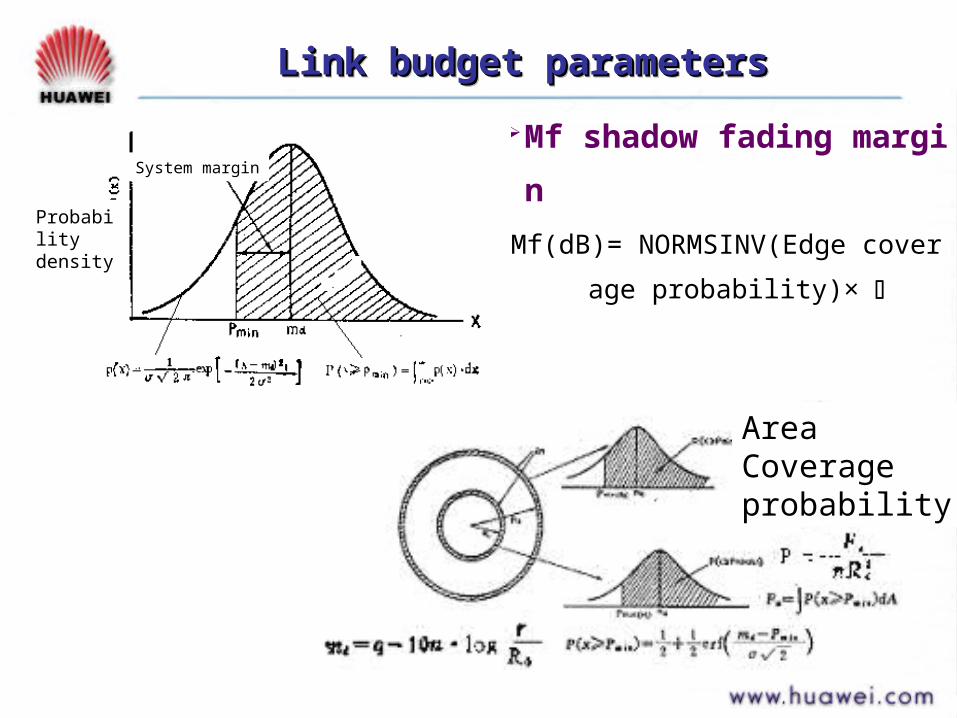
Mf shadow fading marginMf(dB)= NORMSINV(Edge coverage
probability)×
System margin
Probabilitydensity
AreaCoverageprobability

Soft handoff gain G_HO and shadow fading margin In link budget, maximum path losses of both forward and rev
erse links are calculated. If the MS is located in the cell edge,
gain brought by soft handoff should also be taken into consid
eration.
During soft handoff, the shadow fading margin satisfying a ce
rtain coverage probability is decreased due to the existence o
f independent propagation path, and this gain is called soft h
andoff gain, that is, G_HO, in link budget.
Link budget parametersLink budget parametersLink budget parametersLink budget parameters
Link budget parametersLink budget parametersLink budget parametersLink budget parameters
MI: Interference margin The CDMA system is a self-interference one. It is closely related
to coverage and capacity, and this is reflected on the introduction of interference margin to the link budget.
For the reverse link, different load levels correspond to different interference raises. For example, a 3dB interference raise corresponds to 50% load and a 4dB interference raise corresponds to 60% load.
For the forward link, the relationship between load and the interference also exists. But it is hard to perform theory calculation. Thus emulation is required.
In the link budget, the value for the interference margin is finalized by the design capacity of system.
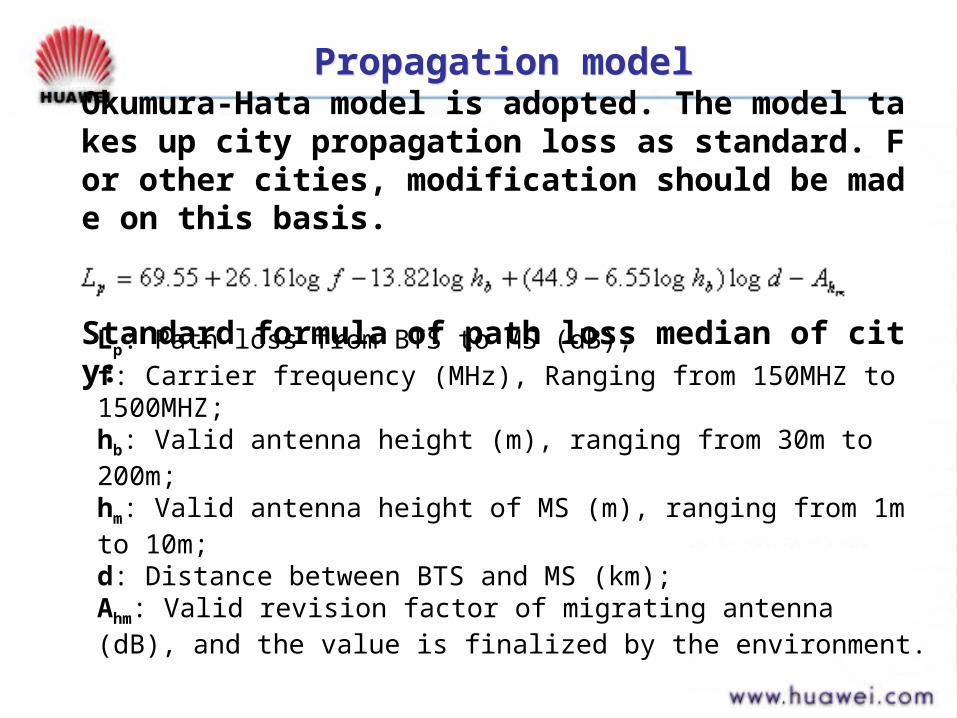
Okumura-Hata model is adopted. The model takes up city propagation loss as standard. For other cities, modification should be made on this basis.
Standard formula of path loss median of city:Lp: Path loss from BTS to MS (dB);f: Carrier frequency (MHz), Ranging from 150MHZ to 1500MHZ; hb: Valid antenna height (m), ranging from 30m to 200m;hm: Valid antenna height of MS (m), ranging from 1m to 10m;d: Distance between BTS and MS (km);Ahm: Valid revision factor of migrating antenna (dB), and the value is finalized by the environment.
Propagation model Propagation model

City link budget
Example of link budget for reverse linkExample of link budget for reverse linkIS-95 CDMA2000-1X
9.6kbps voice 9.6kbps voice 19.2kbps 38.4kbps 76.8kbps 153.6kbps
Maximum transmission power of traffic channel ( dBm ) 23.00 23.00 23.00 23.00 23.00 23.00
Human body loss ( dB ) 3.00 3.00 0.00 0.00 0.00 0.00
EIRP ( dBm ) 20.00 20.00 23.00 23.00 23.00 23.00
Antenna gain of BTS ( dBi ) 15.00 15.00 15.00 15.00 15.00 15.00
Feeder loss ( dB ) 1.97 1.97 1.97 1.97 1.97 1.97
Receiver noise ( dB ) 3.20 3.2 3.20 3.20 3.20 3.20
Eb/Nt required for demodulation ( dB ) 5.80 5.00 3.40 2.59 2.15 1.54
Cell load 50% 50% 50% 50% 50% 50%
Interference margin ( dB ) 3.01 3.01 3.01 3.01 3.01 3.01
Receiver sensitivity ( dBm ) -124.18 -127.50 -124.77 -122.57 -120.00 -117.74
Fast fading margin ( dB ) 0.50 0.50 0.50 0.50 0.50 0.50
Soft handoff gain ( dB ) 3.70 3.70 0.00 0.00 0.00 0.00
Shadow fading standard deviation ( dB ) 8 8 8 8 8 8
Required area coverage probability 90% 90% 90% 90% 90% 90%
Corresponding edge coverage probability 75% 75% 75% 75% 75% 75%
Required shadow fading margin ( dB ) 5.5 5.5 5.5 5.5 5.5 5.5
Clutter loss ( dB ) 20 20 20 20 20 20
Allowable propagation loss for required coverage (dB) 133.90 133.82 131.79 129.59 127.02 124.76
MS antenna height ( m ) 1.50 1.50 1.50 1.50 1.50 1.50
BS antenna height ( m ) 30.00 30.00 30.00 30.00 30.00 30.00
Coverage radius ( km ) 1.72 1.84 1.61 1.40 1.18 1.01

Comparison of service of different rates between IS-95 and CDMA2000-1X
• • The reason of causing different coverage radii is the difference of service rate The reason of causing different coverage radii is the difference of service rate and the difference of demodulation threshold of reverse linkand the difference of demodulation threshold of reverse link
• • In comparison with voice service, the maximum allowable path loss and In comparison with voice service, the maximum allowable path loss and coverage distance is reduced in data service. And the coverage shrinkage of data coverage distance is reduced in data service. And the coverage shrinkage of data service of different rates is different as well.service of different rates is different as well.
• • The coverage shrinkage level is slightly increased along with the raise of The coverage shrinkage level is slightly increased along with the raise of antenna.antenna.
Link budget analysis of reverse linkLink budget analysis of reverse link
Service type
IS-95 CDMA2000-1X
9.6kbps voice
9.6kbps voice
19.2 kbps 38.4 kbps 76.8 kbps 153.6 kbps
Coverage radius ratio
1.00 1.16 0.99 0.86 0.73 0.63
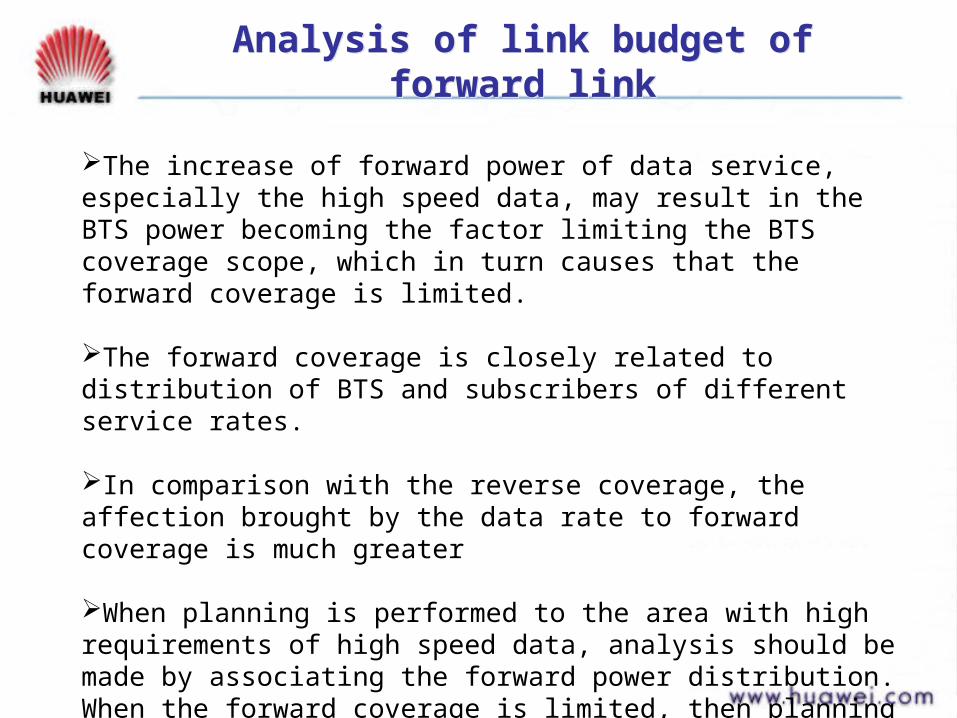
The increase of forward power of data service, especially the high speed data, may result in the BTS power becoming the factor limiting the BTS coverage scope, which in turn causes that the forward coverage is limited.
The forward coverage is closely related to distribution of BTS and subscribers of different service rates.
In comparison with the reverse coverage, the affection brought by the data rate to forward coverage is much greater
When planning is performed to the area with high requirements of high speed data, analysis should be made by associating the forward power distribution. When the forward coverage is limited, then planning should be made according to the forward coverage distance.
Analysis of link budget of forward linkAnalysis of link budget of forward link
QuestionQuestion
What are the parameter types involved in
CDMA 1X link budget?

Chapter 2 CDMA 1X Network Planning Chapter 2 CDMA 1X Network Planning
Section 1 Coverage PlanningSection 1 Coverage Planning
Section 2 Capacity PlanningSection 2 Capacity Planning
Section 3 Power PlanningSection 3 Power Planning
Section 4 Handoff PlanningSection 4 Handoff Planning

Constitution of interference in CDMA systemConstitution of interference in CDMA system
NotherownTOT PIII
IIownown : : Interference from the subscribers of local cellInterference from the subscribers of local cell
IIotherother :: Interference from the subscribers of Neighbor celInterference from the subscribers of Neighbor cel
lsls
PPNN : : Receiver noiseReceiver noise
IIownown 、、 IIotherother :: the main interference componentsthe main interference components

Soft blocking of air interface
Factors affecting the uplink load of sector : Quantity of the subscriber
MS interference of Ncell (neighbor cell)
Setting points of destination FER and Eb/Nt and MS environmen
t
Allocation ratio of voice service and data service
Allocation ratio of data rate service, duty ratio and voice activati
on factor, etc.
Power control error.
Conclusion: The CDMA capacity fluctuates along with the change of
environment
Soft capacity attribute of CDMA 1X system
Soft capacity attribute of CDMA 1X systemSoft capacity attribute of CDMA 1X system

The foundation for capacity analysis is traffic measurement and calculation. In addition t
o the busy hour Erlang used for voice service, more measurements are required for packe
t data service subscribers. The traffic per voice service subscriber is measured by any of t
wo parameters that can be converted to each other. One is BHE (busy hour Erlang) per v
oice service subscriber and the other is throughput per voice service subscriber in bps cal
culated as follows” Throughput = Traffic strength * data rate * activation factor”.
The BHE and Throughput calculation for PSD service should be approached in different
way for the reasons: 1. Different channel assignment scheme for PSD; 2. Different dema
nds of data rate with different subscribers :
System capacity represented by throughput adopted
rAvS
Capacity of CDMA 1X systemCapacity of CDMA 1X system

Reverse capacity model:
))1(
)1((
22
22
222
2
1
0
eM
eMXRW
QBcdma
dtexQ t
x
2/2
2
1)(
10/)10(ln,)/( tb NEe
Reverse capacity model of CDMA 1X systemReverse capacity model of CDMA 1X system

Reverse capacity at different rates and different moving speeds
Reverse capacity of CDMA 1X systemReverse capacity of CDMA 1X system
Static 3km/h 8km/h 30km/h 100km/h
Mean load of the system 50% 50% 50% 50% 50%
Service blocking rate 2% 2% 2% 2% 2%
Interference factor 0.55 0.55 0.55 0.55 0.55
Basic parameter Second order interference factor 0.086 0.086 0.086 0.086 0.086
Power control covariance (dB) 2.5 2.5 2.5 2.5 2.5
Sector factor 2.55 2.55 2.55 2.55 2.55
Activation factor Select 0.4 for voice service and 1 for data service
Service demodulation threshold 6.6 7 7.8 9.2 8.8
IS95 voice Throughput of omni-directional BTS (Kbps)
78.5 70.6 56.9 38.7 43.3
Throughput of directional TRX (Kbps) 66.8 60.0 48.4 32.9 36.8
Service demodulation threshold 5.08 5.57 6.34 7.13 6.78
Throughput of omni-directional BTS (Kbps)
117.2 103.1 84.2 68.2 74.9
1X9.6K voice
Throughput of directional TRX (Kbps) 99.6 87.6 71.5 57.9 63.6
Service demodulation threshold 3.4 4.11 4.96 5.96 5.37
Throughput of omni-directional BTS (Kbps)
138.5 113.0 88.1 65.4 78.0
1X19.2K data
Throughput of directional TRX (Kbps) 117.7 96.0 74.9 55.6 66.3
Service demodulation threshold 2.59 3.01 3.64 4.78 4.26
Throughput of omni-directional BTS (Kbps)
145.7 128.4 105.9 74.2 87.4
1X38.4K data
Throughput of directional TRX (Kbps) 123.8 109.1 90.1 63.1 74.3
Service demodulation threshold 2.15 2.47 3.01 4.28 3.57
Throughput of omni-directional BTS (Kbps)
131.5 118.7 99.5 65.1 82.7
1X76.8K data
Throughput of directional TRX (Kbps) 111.8 100.9 84.6 55.4 70.3
Service demodulation threshold 1.54 1.98 2.51 3.8 2.68
Throughput of omni-directional BTS (Kbps)
118.8 102.1 84.8 53.4 79.9
1X153.6Kdata
Throughput of directional TRX (Kbps) 101.0 86.8 72.1 45.4 67.9
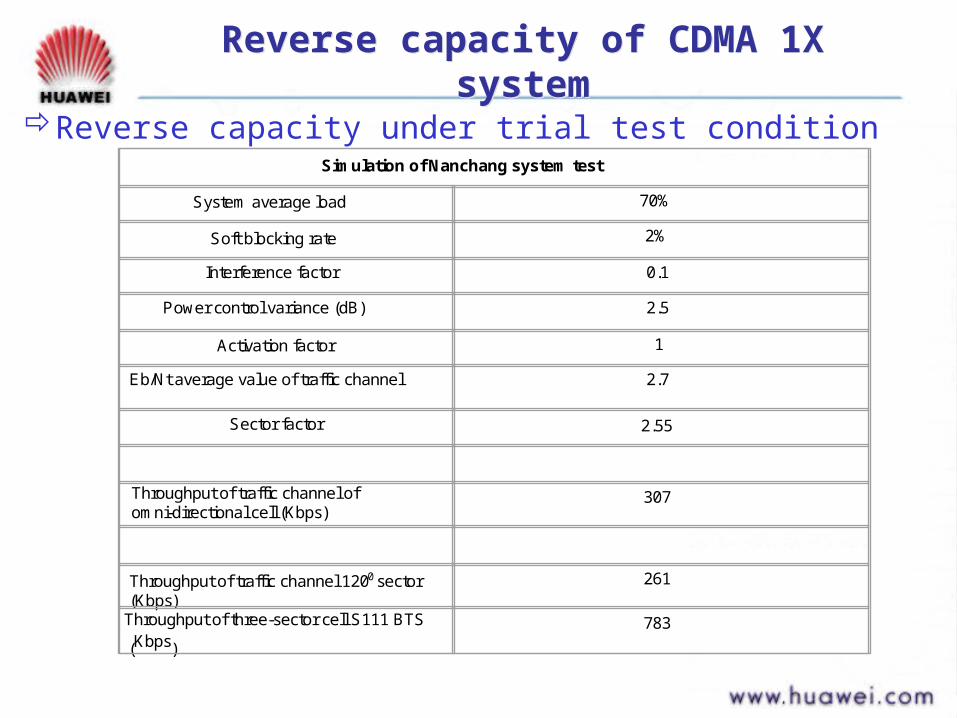
Reverse capacity under trial test condition
Reverse capacity of CDMA 1X systemReverse capacity of CDMA 1X system
Simulation of Nanchang system test
System average load 70%
Soft blocking rate 2%
Interference factor 0.1
Power control variance (dB)
2.5
Activation factor 1
Eb/Nt average value of traffic channel 2.7
Sector factor 2.55
Throughput of traffic channel of omni-directional cell (Kbps)
307
Throughput of traffic channel 1200 sector (Kbps)
261
Throughput of three-sector cell S111 BTS
(Kbps)
783
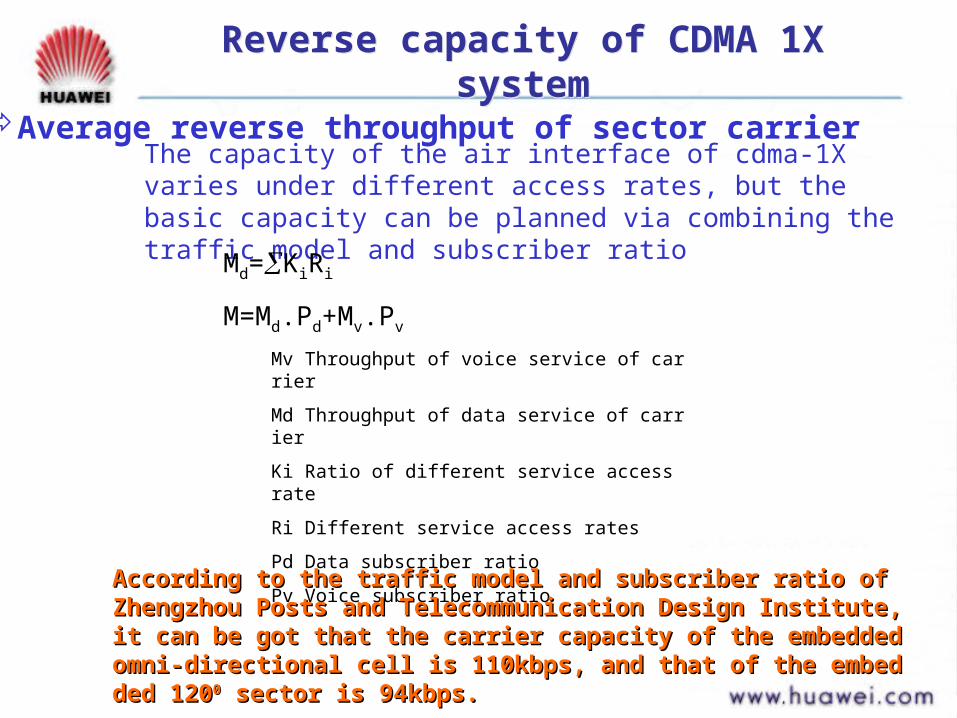
Average reverse throughput of sector carrierThe capacity of the air interface of cdma-1X varies under different access rates, but the basic capacity can be planned via combining the traffic model and subscriber ratio
Md=KiRi
M=Md.Pd+Mv.Pv
Mv Throughput of voice service of carrier
Md Throughput of data service of carrier
Ki Ratio of different service access rate
Ri Different service access rates
Pd Data subscriber ratio
Pv Voice subscriber ratio
According to the traffic model and subscriber ratio of Zhengzhou PosAccording to the traffic model and subscriber ratio of Zhengzhou Posts and Telecommunication Design Institute, it can be got that the carrits and Telecommunication Design Institute, it can be got that the carrier capacity of the embedded omni-directional cell is 110kbps, and thaer capacity of the embedded omni-directional cell is 110kbps, and that of the embedded 120t of the embedded 12000 sector is 94kbps. sector is 94kbps.
Reverse capacity of CDMA 1X systemReverse capacity of CDMA 1X system
Forward capacity model:
].)(
.10[
..)(
max
max10/)(
maxpag
pagp
sync
syncpil
fTm
dBM
traftraf
traf
PGN
PGPKRLN
P
K
PGPM
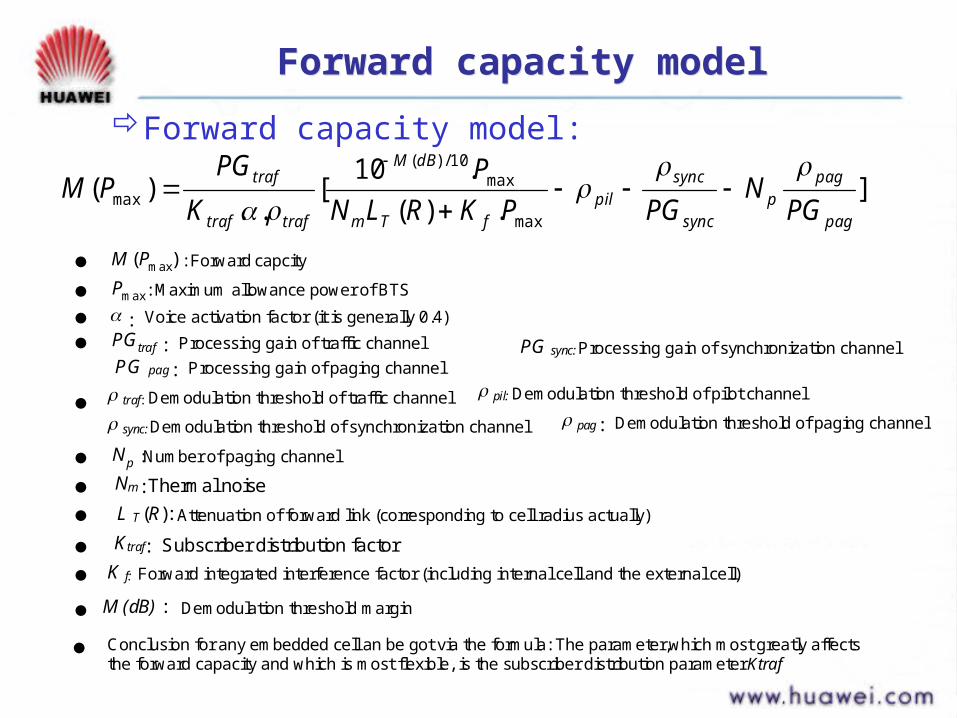
Forward capacity modelForward capacity model
)( maxPM : Forward capcity
maxP : Maximum allowance power of BTS
: Voice activation factor (it is generally 0.4)
trafPG : Processing gain of traffic channel PG sync: Processing gain of synchronization channelPG pag : Processing gain of paging channel
pN :Number of paging channel
traf: Demodulation threshold of traffic channel pil: Demodulation threshold of pilot channel
sync: Demodulation threshold of synchronization channel pag : Demodulation threshold of paging channel
Nm : Thermal noise
L T (R): Attenuation of forward link (corresponding to cell radius actually)
Ktraf: Subscriber distribution factor
K f: Forward integrated interference factor (including internal cell and the external cell)
M (dB) : Demodulation threshold margin
Conclusion for any embedded cell an be got via the formula: The parameter,which most greatly affects the forward capacity and which is most flexible, is the subscriber distribution parameter Ktraf

Analysis example of forward capacity of coverage areaSimulation result of certain trialWhen the cell radius is comparatively small (corresponding to less path loss: 130) and the subscribers are distributing evenly within the cell, the forward capacity will be:
Analysis example of forward capacityAnalysis example of forward capacity
Background noise (dBm) -105
Path loss (dB) 130
System interference index 1.4
Subscriber geographical distribution index
0.4
Maximum transmission power (W) 20
Demodulation threshold of pilot channel (dB)
-15
Demodulation threshold of synchronization channel (dB)
6
Demodulation threshold of paging channel (dB)
6
Demodulation threshold of traffic channel (dB)
7
Throughput of omni-directional site (Kbps)
401
Throughput of traffic channel of 1200
sector (Kbps)341
Throughput of three-sector cell S111 BTS (Kbps)
1024

CDMA system has different capacities under difference networking conditio
n (cellular layout) The variance of total capacities of the equipment is not great under the same
environment and networking condition The moving speed affects the system capacity greatly Both of the main comp
onents of reverse interference depend on the cell load. But in forward interfe
rence, the multipath interference is the main component in the central area,
and the Ncell interference is the main component on the edge of the cell The capacity of the forward link is finalized by the total transmission power
of cell and allocation of transmission power in the traffic channel and other
supplementary channels (the supplementary channels include pilot, paging a
nd synchronization channels, etc)
Analysis of soft capacity of CDMA 1X systemAnalysis of soft capacity of CDMA 1X system

If the power amplifier cannot provide enough forward power, then the sy
stem capacity will be forward limited. For example, improper cellular distr
ibution may result in most of the subscribers being located on the edge o
f the cell, or severe cross-cell coverage, which in turn causes the power o
f forward traffic channel and the soft handoff rate to be too great. Further,
the increase of soft handoff may increase the reverse capacity but reduce
the forward capacity.Maximum number of MSs supported by the forward link and reverse link
of CDMA system are different. Generally, the capacity of CDMA system is
finalized by the capacity of the reverse link. The reverse capacity and load
are used for design reference, while emulation is adopted for analysis of f
orward capacity.
Analysis of soft capacity of CDMA 1X systemAnalysis of soft capacity of CDMA 1X system

In CDMA system, the coverage and the capacity can be inter-converted.In the planning of data service, the asymmetry feature of the uplink/downlink
(Generally, the ratio between the uplink and the downlink is 1:4) of data service
should be fully utilized to design the cell coverage and capacity.
Analysis of forward/reverse balance of CDMA 1X system
Analysis of forward/reverse balance of CDMA 1X system
Throughput
19.2kbps
38.4kbps
76.8kbps
115.2kbps
153.6kbps
192kbps
230.4kbps
268.8kbps
307.2kbps
345.6kbps
384kbps
422.4kbps
460.8kbps
Forward net loss
156.1 153.9 151.1 149.1 147.4 146 144.6 143.2 141.7 140.1 138.1 135.3 128.8
Downtown forward radius
2.5 2.17 1.8 1.58 1.42 1.29 1.18 1.08 0.98 0.88 0.77 0.64 0.42
Downtown reverse radius
1.61 1.4 1.18 1.01
Countryside forward radius
45.19 39.01 32.34 28.29 25.25 22.99 20.93 19.06 17.24 15.49 13.55 11.23 7.27
Countryside reverse radius
28.37 24.49 20.62 17.56

QuestionQuestion
Please state your understandings about the
soft capacity of CDMA system

Chapter 2 CDMA 1X Network PlanningChapter 2 CDMA 1X Network Planning
Section 1 Coverage PlanningSection 1 Coverage Planning
Section 2 Capacity PlanningSection 2 Capacity Planning
Section 3 Power PlanningSection 3 Power Planning
Section 4 Handoff PlanningSection 4 Handoff Planning

Principle of power planning:Power of pilot channel: 10-20% of total powerPower of paging channel: pilot -4.5dB (The rate of paging channel is
4800)Power of synchronization channel: pilot -10dBPower of traffic channel: remnant powerSetting principles of pilot power:Establish proper cell scopeAllow channel estimation of receiverEnable the MS to add the cell to handoff active setGuarantee the power amplification resources needed for the forward
traffic channel within the coverage area.The above settings are the static ones. But cell breath is a dynamic
allocation modification of pilot and power of traffic channel. The purpose is to adapt to the dynamic coverage and capacity variance
Power PlanningPower Planning
Guaranteecorrect accessand normalconversation

Chapter 2 CDMA 1X Network PlanningChapter 2 CDMA 1X Network Planning
Section 1 Coverage PlanningSection 1 Coverage Planning
Section 2 Capacity PlanningSection 2 Capacity Planning
Section 3 Power PlanningSection 3 Power Planning
Section 4 Handoff PlanningSection 4 Handoff Planning
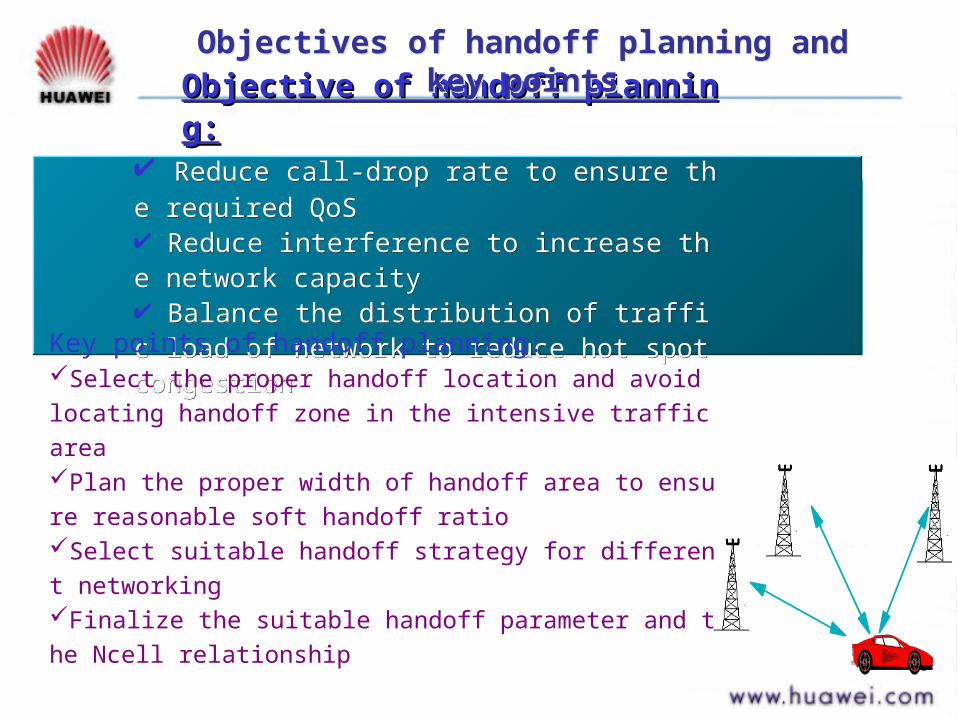
Objective of handoff planning:Objective of handoff planning: Reduce call-drop rate to ensure the required QoSReduce call-drop rate to ensure the required QoS Reduce interference to increase the network capacityReduce interference to increase the network capacity Balance the distribution of traffic load of network to Balance the distribution of traffic load of network to reduce hot spot congestionreduce hot spot congestion
Key points of handoff planning:Select the proper handoff location and avoid locating handoff zone i
n the intensive traffic areaPlan the proper width of handoff area to ensure reasonable soft han
doff ratioSelect suitable handoff strategy for different networkingFinalize the suitable handoff parameter and the Ncell relationship
Objectives of handoff planning and key pointsObjectives of handoff planning and key points

Review
Objectives of handoff planning
Key points of handoff planning

Contents of the course Contents of the course
Chapter 1 CDMA 1X Network Planning
Process & Characteristics
Chapter 2 CDMA 1X Network Planning
Chapter 3 CDMA 1X Network
Optimization

Reasonable forward and reverse coverage (Pla
n the forward and reverse coverage of the paging
channel, access channel and traffic channel, etc.
reasonably)
Achieve the maximum forward and reverse voic
e capacity and data throughput
Realize the least call-drop rate, blocking rate an
d FER
Accomplish excellent soft handoff, softer hando
ff and hard handoff performance
System optimizationSystem optimization
Objectives of system optimization
Realization of system performance optimization viaRealization of system performance optimization viaoptimization and modification of system parametersoptimization and modification of system parameters

Huawei Network Optimization Tools PacketHuawei Network Optimization Tools Packet
Electromagneticenvironment test
Network runningdatabase
33GToolGTool__PoolPoolTMTM
Drive test data
Handling suggestionfor networkadjustment
Interfaceinformation
Traffic statistics database
Geographicalanalysis
information
Planning database

Pilot Pollution Solution Pilot Pollution Solution
4 Pilots with Ec/Io >T_ADD
Question:•Cross-cell coverage or
missed-out Ncell relationshipmay cause that the strongsignal pilot cannot be added tothe active set, which in turnresults in pilot pollution .Solution:
• Modify the main coveragedirection of the local cell• Modify the antenna andpower of Ncell to control thecoverage scope
• Modify handoff parameter
Example 1
Example 2
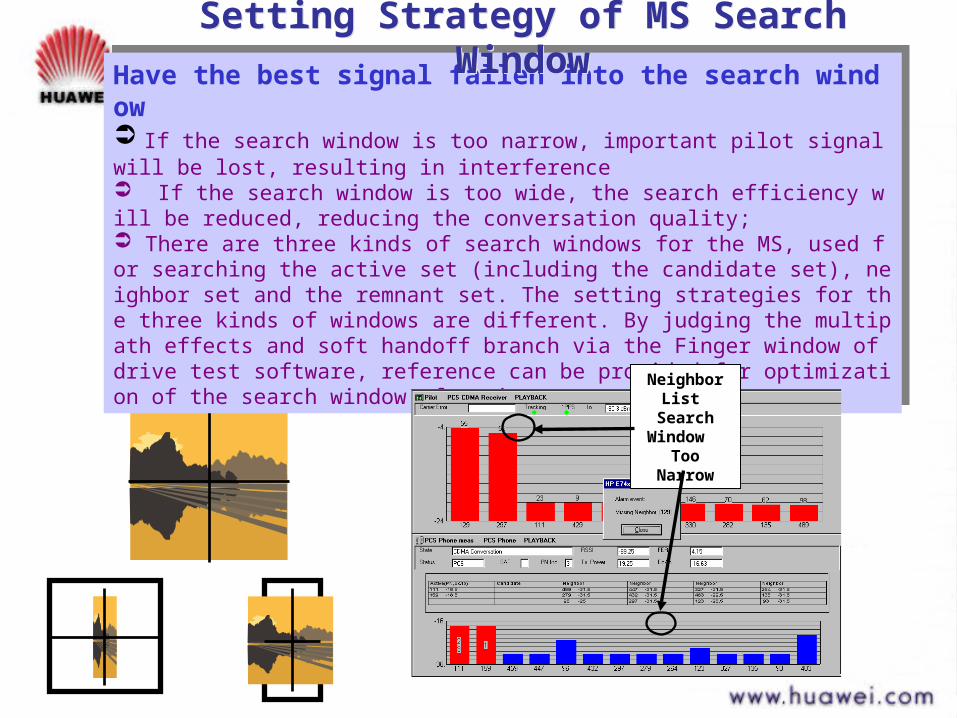
Have the best signal fallen into the search window If the search window is too narrow, important pilot signal will be lost, resulting in interference If the search window is too wide, the search efficiency will be reduced, reducing the conversation quality; There are three kinds of search windows for the MS, used for searching the active set (including the candidate set), neighbor set and the remnant set. The setting strategies for the three kinds of windows are different. By judging the multipath effects and soft handoff branch via the Finger window of drive test software, reference can be provided for optimization of the search window of active set.
Have the best signal fallen into the search window If the search window is too narrow, important pilot signal will be lost, resulting in interference If the search window is too wide, the search efficiency will be reduced, reducing the conversation quality; There are three kinds of search windows for the MS, used for searching the active set (including the candidate set), neighbor set and the remnant set. The setting strategies for the three kinds of windows are different. By judging the multipath effects and soft handoff branch via the Finger window of drive test software, reference can be provided for optimization of the search window of active set.
Cause!
Neighbor List Search Window
Too Narrow
Setting Strategy of MS Search WindowSetting Strategy of MS Search Window

Parameter setting of search windowFor active set (including the candidate set), 5-7 (20-40 chips) is recommended for the window. It is finalized by the delay spread of the propagation environment: It is 7ms for the typical downtown, 2ms for suburban area. It is larger for the macro cell than for the micro cell.For neighbor set, 7-13 (40-226 chips) is recommended. It is finalized by the delay spread of the propagation environment and the distance of reference pilots of cell reaching to the MS. 7-13 is recommended for the reset set window during optimization, and 0 (4 chips) is recommended after the optimization. The time for each chip is 813.8ns and the propagation distance is 244.
Parameter setting of search windowFor active set (including the candidate set), 5-7 (20-40 chips) is recommended for the window. It is finalized by the delay spread of the propagation environment: It is 7ms for the typical downtown, 2ms for suburban area. It is larger for the macro cell than for the micro cell.For neighbor set, 7-13 (40-226 chips) is recommended. It is finalized by the delay spread of the propagation environment and the distance of reference pilots of cell reaching to the MS. 7-13 is recommended for the reset set window during optimization, and 0 (4 chips) is recommended after the optimization. The time for each chip is 813.8ns and the propagation distance is 244.
Setting Strategies of MS Search WindowSetting Strategies of MS Search Window

According to the attribute that data service shrinks due to variance of rates, it is re
quired that high speed data service be provided to the subscribers located in the center
of the cell if possible, while rates of the data service of the subscribers located on the e
dge of the cell should be limited.
According to the distribution of the local integrated service models, different reso
urce allocation strategies can be selected: Those services, no matter the voice service or data service, which comes first, will be firstly served. Voice or data won’t be singly separated for allocation.Reserve part of resource for voice service This strategy can be adopted if the local voice service is the preferred one.Reverse part of resource for data service This strategy can be adopted if the resource required for the local data is comparatively fixed, and further, the preference of the service should be ensured.
Capacity of Mixed Service And Coverage StrategyCapacity of Mixed Service And Coverage Strategy
During RF optimization, group test (spectrum monitor, basic call test, free-load pilot tesDuring RF optimization, group test (spectrum monitor, basic call test, free-load pilot tes
t and loaded coverage test) should be firstly performed, and then comes the optimization t and loaded coverage test) should be firstly performed, and then comes the optimization
of loaded mobile test within the system scope.of loaded mobile test within the system scope.
Many basic objectives of optimization of both of data service and voice service are the Many basic objectives of optimization of both of data service and voice service are the
same.same.
The optimization of voice service should be guaranteed before the data service is put inThe optimization of voice service should be guaranteed before the data service is put in
to large business use. And fine tuning of data service is required after business applicatioto large business use. And fine tuning of data service is required after business applicatio
n.n.
Balance of the performance of both voice service and data service should be ensured.Balance of the performance of both voice service and data service should be ensured.
Optimization Strategy of CDMA Radio NetworkOptimization Strategy of CDMA Radio Network

Main optimization parameters: Optimization of RF environmentThe optimization is the elementary one of the radio cellular layout.Whether t
he cellular layout is successful or not finalizes 85% radio network quality, and
this is especially true for the CDMA radio network.
Total transmission power of each sector
Antenna configuration (azimuth, downtilt, height, graphics mode)
List of neighbor pilots and the priority sequence
Size of search window of neighbor set
Ratio of soft handoff and hard handoff, and thresholds
Secondary optimization parameters: Fine tuning of partial performance
Size of search window of active set of MS
Size of search window of BTS
Setting of digital gain of each (sub) channel, that is, power allocation
Other algorithm parameters
Optimization strategy of CDMA radio networkOptimization strategy of CDMA radio network
Coverage
Forward/reverse voice capacity
Call-loss rate
Access (call attempt or being called) failure rate
Congestion rate of voice call
Call quality FER (1%)
Failure rate of soft handoff
Pilot Ec/Io (-15dB)
Integrated percent of multi-channel soft handoff
(1.5-2 or 35-40%)
transmission power of MS
transmission power of BTS traffic channel
Main measurement parameters of CDMA 1X network (voice service)
Main measurement parameters of CDMA 1X network (voice service)

Coverage
Average throughput
Delay
Data rate
RLP retransmission rate
FER ( 5% ) – FER of basic channel of forward link
– FER of supplementary channel of forward link
– FER of basic channel of reverse link
– Pilot Ec/Io (above -15dB)
Integrated percent of multi-channel soft han
doff (1.5-2 or 35-40%)
transmission power of MS
transmission power of traffic channel of BT
S
Main measurement parameters of CDMA 1X network (data service)
Main measurement parameters of CDMA 1X network (data service)
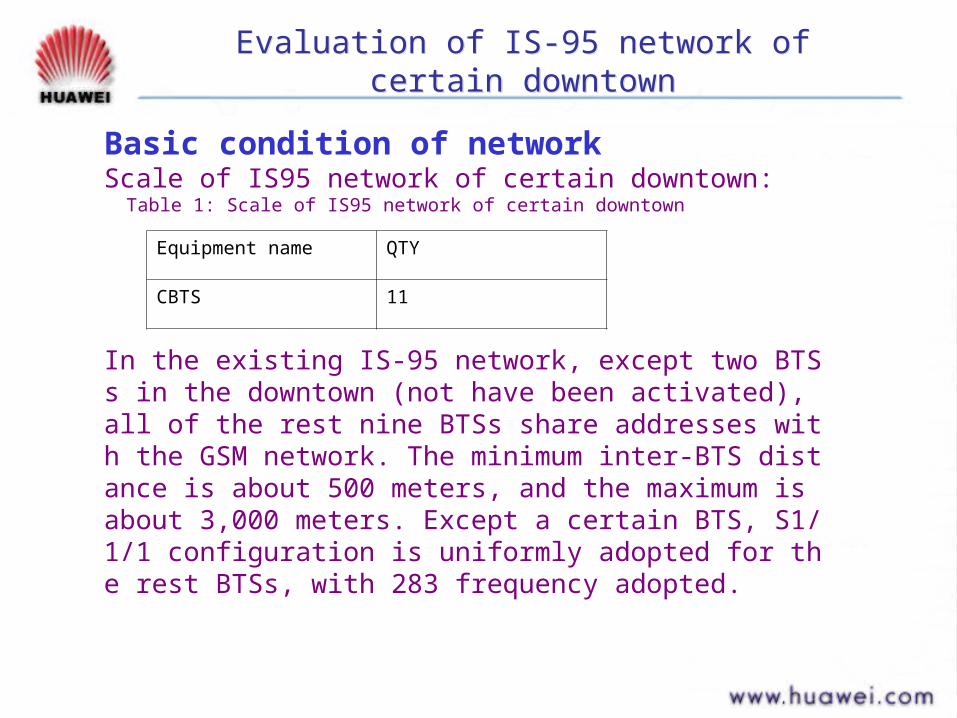
Evaluation of IS-95 network of certain downtownEvaluation of IS-95 network of certain downtown
Basic condition of networkScale of IS95 network of certain downtown: Table 1: Scale of IS95 network of certain downtown
In the existing IS-95 network, except two BTSs in the downtown (not have been activated), all of the rest nine BTSs share addresses with the GSM network. The minimum inter-BTS distance is about 500 meters, and the maximum is about 3,000 meters. Except a certain BTS, S1/1/1 configuration is uniformly adopted for the rest BTSs, with 283 frequency adopted.
Equipment name QTY
CBTS 11

Distribution of Ec/IoDistribution of Ec/Io

Distribution of Forward FERDistribution of Forward FER
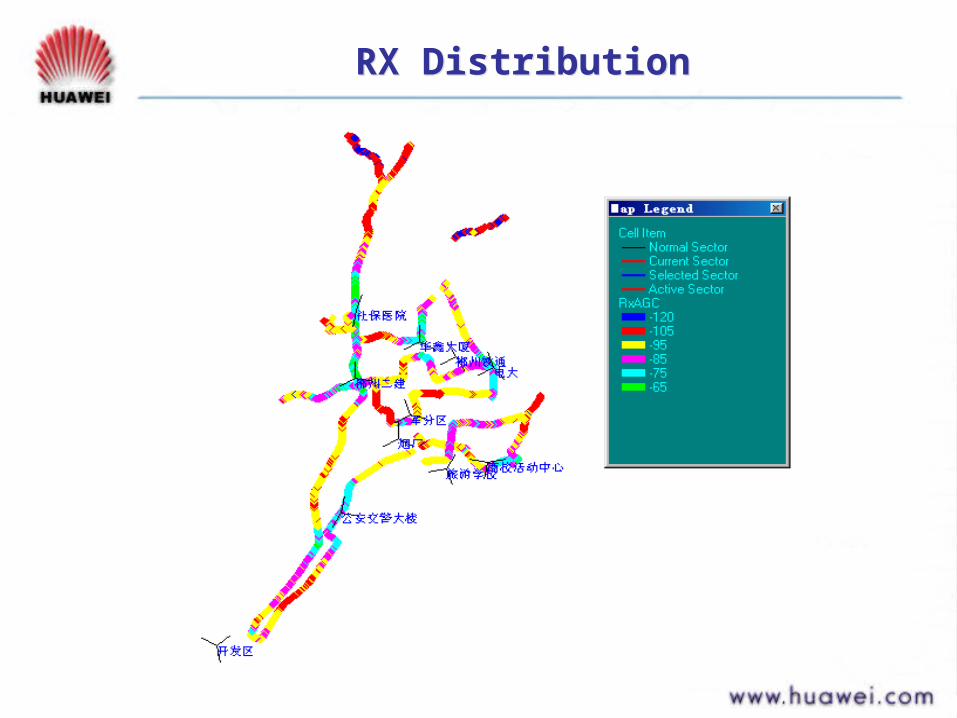
RX DistributionRX Distribution

Handoff BranchHandoff Branch

Result of case analysisResult of case analysis
Through simple analysis of the indices, it can be concluded that the quality of the IS-95 network of the city zone is ecumenical. Specific problems are as follows:1 、 The sites located in central areas in the downtown are so close to each other that the design of downtilt and azimuth is unreasonable, and configuration of pilot power may be unreasonable as well, thus cross-cell may happen in certain sectors, which in turn causes that the Ec/Io in some areas is comparatively low. In the cell where there are crowded with buildings, the above case will be worsened due to (building) penetration loss. As a result, the above data parameters cannot satisfy the requirements of future development of data service in most of the areas.2 、 This low Ec/Io may directly cause high BER of the whole net.3 、 Received power of MS in some important sections of the city zone may be comparatively low.4 、 Because the high BTS density in the city zone may cause high ratio of soft handoff, system resources is wasted, and pilot pollution is brought as well.

Suggestions For Tilt AdjustmentSuggestions For Tilt AdjustmentChannel Height (m) Azimuth(°) Downtilt(°)
Chinese names of BTS
Site type
Channel Antenna (meter)
Azimuth (°) Original downtilt (°)
Modified downtilt
Cehnzhou Er Jian -1
S1/1/1
201 23 0 3 6
Cehnzhou Er Jian -2
201 23 100 3 8
Cehnzhou Er Jian-3
201 23 240 3 6
Jun Fen Qu-1 S1/1/1
201 25 105 3 10
Jun Fen Qu-2 201 25 240 6 10
Jun Fen Qu-3 201 25 340 3 10
Yan Chang-1 S1/1/1
201 33 0 8 10
Yan Chang-2 201 33 120 6 10
Yan Chang-3 201 33 240 6 8
Lv You Xue Yuan-1 S1/1/1
201 25 50 3 6
Lv You Xue Yuan -2
201 25 170 3 3
Lv You Xue Yuan -3
201 25 300 3 3

Review
Optimization objectives of CDMA 1X network
Optimization strategies of CDMA 1X network
Main measurement parameters of CDMA 1X network