
CDM PROJECTS IN CHINA’S ENERGY SUPPLY AND...
41
CDM PROJECTS IN CHINA’S ENERGY SUPPLY AND DEMAND SECTORS – OPPORTUNITIES AND BARRIERS Axel Michaelowa Asuka Jusen Karsten Krause Bernhard Grimm Tobias Koch HWWA DISCUSSION PAPER 90 Hamburgisches Welt-Wirtschafts-Archiv (HWWA) Hamburg Institute of International Economics 2000 ISSN 1432-4458
Transcript of CDM PROJECTS IN CHINA’S ENERGY SUPPLY AND...

CDM PROJECTS IN CHINA’SENERGY SUPPLY ANDDEMAND SECTORS– OPPORTUNITIESAND BARRIERS
Axel MichaelowaAsuka JusenKarsten KrauseBernhard GrimmTobias Koch
HWWA DISCUSSION PAPER
90Hamburgisches Welt-Wirtschafts-Archiv (HWWA)
Hamburg Institute of International Economics2000
ISSN 1432-4458

The HWWA is a member of:
• Wissenschaftsgemeinschaft Gottfried Wilhelm Leibniz (WGL)• Arbeitsgemeinschaft deutscher wirtschaftswissenschaftlicher Forschungsinstitute (ARGE)• Association d‘Instituts Européens de Conjoncture Economique (AIECE)

CDM Projects in China’sEnergy Supply andDemand Sectors– Opportunitiesand Barriers
Axel MichaelowaAsuka JusenKarsten KrauseBernhard GrimmTobias Koch
This Discussion Paper is part of the HWWA‘s research programme„International Climate Policy“.

HWWA DISCUSSION PAPER
Edited by the DepartmentWORLD ECONOMY
Hamburgisches Welt-Wirtschafts-Archiv (HWWA)Hamburg Institute of International EconomicsÖffentlichkeitsarbeitNeuer Jungfernstieg 21 - 20347 HamburgTelefon: 040/428 34 355Telefax: 040/428 34 451e-mail: [email protected]: http://www.hwwa.de/
Axel MichaelowaHamburg Institute for International Economics, Neuer Jungfernstieg 21, 20347 Ham-burg, Germany. Private address: 177 Bd. de la République, 92210 St.-Cloud, France,Phone/Fax +33147712680, [email protected]
Asuka JusenThe Center for Northeast Asian Studies, Tohoku University, Kawauchi, Aoba-ku, Sen-dai, Miyagi 980-8576, Japan, Phone/Fax: +81222177557, [email protected]
Karsten KrausePapenhuderstr. 58, 22008 Hamburg, Germany; Phone/Fax +49402297011,[email protected]
Bernhard GrimmTÜV Süddeutschland Bau und Betrieb GmbH, Westendstr. 199, 80686 Munich, Ger-many; Phone +497117005500, Fax+497117005401, [email protected]
Tobias KochBurgauer Str. 44, 86156 Augsburg, Germany, Phone +491717557480, [email protected]

5
Contents
Abstract 7Zusammenfassung 7
1. INTRODUCTION 9
2. CHINA, THE ENERGY GIANT 92.1 Energy production 92.2 Energy use 132.3 Local environmental damages from energy production and
consumption 15
3. VOLUME OF FOREIGN DIRECT INVESTMENT IN THECHINESE ENERGY SUPPLY SECTOR AND BARRIERS TOITS EXPANSION 16
4. CHINESE CLIMATE POLICY AND CDM PROJECTS 194.1 Chinese climate policy 194.2 Climate cooperation – JI, AIJ and CDM 214.3 U.S.-China climate policy Co-operation 224.4 EU energy and climate policy co-operation with China 234.5 Japanese climate co-operation 24
5. OPTIONS FOR A COMBINATION OF CDM WITHCOMMERCIAL ACTIVITIES IN CHINA 26
5.1 Energy supply 265.1.1 Upgrading of existing and new coal-fired power stations 265.1.2 Capture of coalbed methane 285.1.3 Electricity and natural gas import from Russia 285.1.4 Renewable energy 29
5.2 Energy demand 315.3 Overarching programmes 34
6. CONCLUSIONS: CHANCES AND RISKS OF ENERGY-RELATED CDM PROJECTS IN CHINA 35
6.1 Opportunities 356.2 Risks 35
References 37

6

7
Abstract
China has had an enormous growth of energy and electricity consumption during thelast decades. This has been fuelled primarily by using domestic coal resources. Until1997, annual construction of power stations averaged around 15 GW which was notsufficient to alleviate the demand surplus. Forecasts envisaged continuation of thisgrowth. The majority of power stations is small scale and reather inefficient. Local airpollution is becoming very strong and is increasingly seen as a politi-cal issue. Foreigninvestment in the power sector has been hampered by bureaucracy and unclearcompetencies. On the demand side, energy efficiency has improved markedly in the lasttwo dec-ades, albeit from a very low basis. Due to the economic transformation, manyproven incentives for efficiency improvement cannot be used any more. The CleanDevelopment Mechanism (CDM) opens a host of possibilities to link foreign invest-ment in the energy supply and demand sectors with projects that enhance efficiency andreduce greenhouse gas emissions. All big industrial countries have been very keen onclimate policy coop-eration with China. While the official Chinese negotiation positiontowards the CDM and climate policy in general has been extremely cautious, manygovernment bodies show great interest. The Asian financial crisis, which led to anelectricity oversupply in 1998, gives the possibility to retire the most inefficient powerplants.
Zusammenfassung
China wies in den letzten Jahrzehnten ein enormes Wachstum des Energie- undStromverbrauchs auf. Es wurde hauptsächlich durch heimische Kohleressourcengespeist. Bis 1997 belief sich der jährliche Zubau an Kraftwerksleistung auf ca. 15 GW,aber selbst das reichte nicht aus, um den Nachfrageüberhang abzubauen. Die Mehrzahlder Kraftwerke ist klein und ziemlich ineffizient. Die lokale Luftverschmutzung wirdsehr stark und zusehends als politisches Problem angesehen. Ausländische Investitionenim Energiesektor sind durch bürokratische Hürden und unklare Kompetenzverteilungbehindert worden. Auf der Nachfrageseite ist die Energieeffizienz in den letztenJahrzehnten stark verbessert worden, allerdings von einer sehr niedrigen Ausgangslage.Aufgrund der ökonomischen Transformation können viele bewährte Anreize zurEffizienzsteigerung nicht mehr eingesetzt werden. Der CDM eröffnet vielfältigeMöglichkeiten zur Verbindung von Direktinvestitionen in Energieangebot und -nachfrage. CDM-Projekte erhöhen die Effizienz und verringern Treibhaus-Gasemissionen. Alle großen Industrieländer sind sehr an Klimaschutzkooperation mit

8
China interessiert. Während die offizielle chinesische Verhandlungsposition bezüglichdes CDM und Klima-Politik im allgemeinen sehr zurückhaltend ist, sind vieleRegierungsinstitutionen sehr stark am CDM interessiert. Die Asienkrise, die 1998 zueinem Angebotsüberhang im Stromsektor führte, ermöglicht die Abschaltung derineffizientesten Kraftwerke.

9
1. INTRODUCTION
The Chinese emission of CO2 at 2.2 tons CO2 per capita amounts to 50% of the globalaverage, while it makes up only 20% of the German average. The rapid growth of theChinese economy currently leads to an strongly increasing demand for energy, though.In order to sufficiently meet this demand, the Chinese Ministry of Electric Power(MOEP) planned to expand electricity generation capacity from currently about 280GW1 to 530 GW in 2010 and 800 GW in 2020 (Blackman/Xun 1997). However, therecent financial and economic crisis in neighbouring Asian countries should lead tocaution concerning such projections. Even if the expansion remains below theprojection, it will lead to a massive increase in local environmental pollution andChinese emission of greenhouse gases.
When the 9th Five-Year Plan was discussed in the early 90s, it was planned that animportant share of investments for the 70 GW programme until 2000 would be financedby foreign capital. So far, the realisation of this plan has been fraught with difficultiesand only a small share of the capacity expansion financed by foreign investors.However, foreign investment will be crucial concerning greenhouse gas reduction.Projects under the Clean Development Mechanism (CDM) of the Kyoto Protocol canprovide an opportunity to transfer highly efficient, low-greenhouse gas energy supplyand energy use technologies to China and thus stabilise the environmental impact of itseconomic growth at a relatively low level.
2. CHINA, THE ENERGY GIANT
2.1 Energy production
China is the most populous country on Earth. Nevertheless, its energy production has been very
low historically- just 1.85 GW electric power plant capacity were installed in 1949! Only in the
last four decades energy production started to grow. Its rise was not steady but erratic and
several strong shocks such as the catastrophic Great Leap Forward or the Cultural Revolution
intervened. In the early 1970s over 80% of national primary energy production was supplied
1 Concerning the interpretation of Chinese statistical data one has to be very cautious. Even if the extent
of open forgery encountered in the 50´s and 60´s (Zhang 1997) is no longer likely, doubts remain.Often data calculated by different agencies differ by a factor of two. Also, data are only partiallycollected - see e.g. Sun (1996, p. 838), who estimates rural household energy use to be 2 to 4 times theofficial value. Surprises such as those encountered after the demise of socialism in Eastern Europecannot be ruled out. Even the highest politicians have to rely on anecdotal evidence for policydecisions. See Studwell (1997) for a detailed discussion. Thus the data presented in the paper must beconsidered as tentative.

10
from national coal resources. This rate has now dropped to 75% and by the year 2010 it is
expected to be below 70%. Oil is the second largest supply option at 20%.
In the 1990´s, growth of electric power capacity reached 15 GW per year (see Table 2) and
power production increased by 75 TWh per annum (see Table 3). The bulk is coal-fired.
Table 2:Installed electricity capacity (GW)
1971 1976 1981 1986 1991 1992 1993 1994 1995 1996 1997
Thermal 18.5 32.5 47.2 66.3 113.5 125.8 138.3 150.8 165.0 178.9 192.0
Hydro 7.5 14.7 21.9 27.5 37.9 40.7 44.6 49.1 52.2 55.6 59.7
Source: EP (1996), Logan, Zhang (1998), Wiesegart (1998), p. 20f.
Table 3:Electricity production (TWh)
1981 1986 1991 1992 1993 1994 1995 1996 1997 1998
Thermal 243.7 355.2 552.7 622.9 685.7 760.9 807.4 878.1 912.6 929
Hydro 65.6 94.4 124.7 131.2 150.6 167.0 186.3 186.7 184.7 195
Nuclear - - - - - - 13.0 12.8 14.1 14.1
Renewable n.a. n.a 0.1 0.1 0.1 0.1 0.1 0.2 0.2 0.3
Total 309.3 449.6 677.5 754.2 836.4 927.9 1006.9 1079.4 1117.6 1140
Source: Zhang Z. (1995), Wiesegart (1998), p. 20f, Ögütçü (1999), p. 8
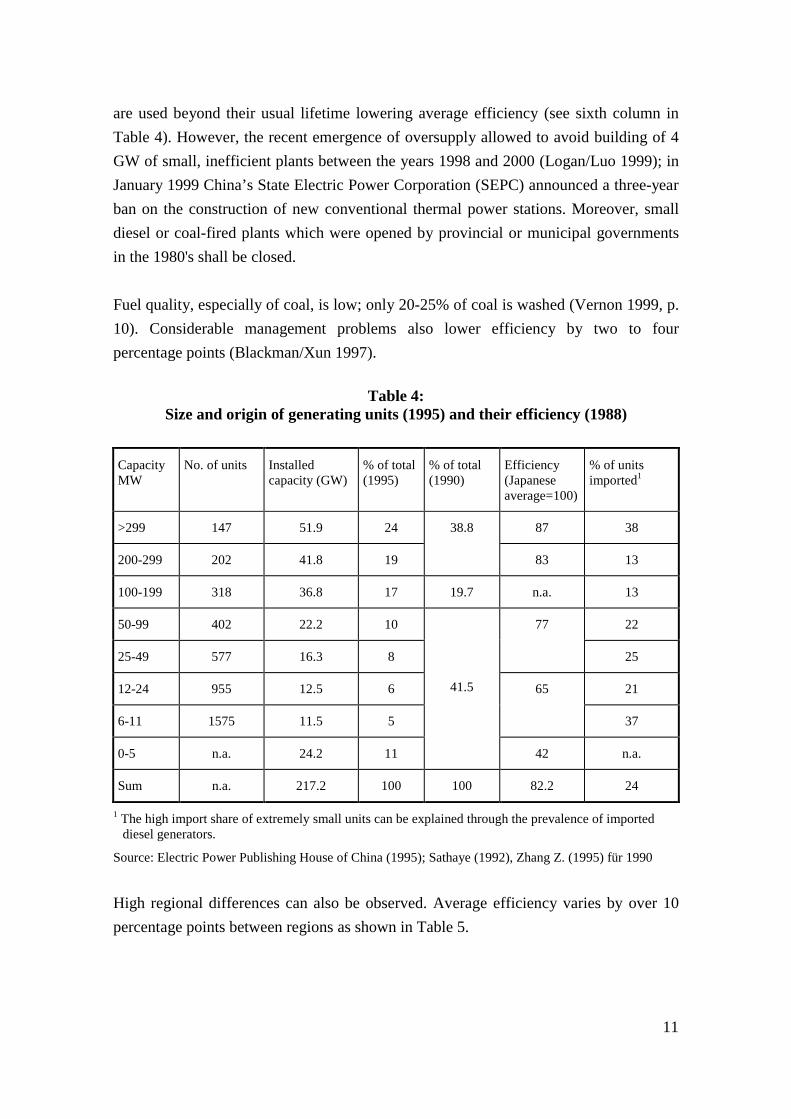
Despite the low age of the bulk of Chinese thermal power plants, their averageefficiency is below 30% compared to 35-40% in industrialised countries. This efficiencygap is due to several factors. Compared to industrial countries, the average size of thethermal power plants is very small (see Table 4). China currently is not able to producegenerators larger than 350 MW (Blackman/Xun 1997, p. 5) but outweighs this handicapwith capital costs of 600 US$/kW, a third lower than in industrial countries(Logan/Zhang 1998, p. 13). Moreover, small power stations with outdated technologies
11
are used beyond their usual lifetime lowering average efficiency (see sixth column inTable 4). However, the recent emergence of oversupply allowed to avoid building of 4GW of small, inefficient plants between the years 1998 and 2000 (Logan/Luo 1999); inJanuary 1999 China’s State Electric Power Corporation (SEPC) announced a three-yearban on the construction of new conventional thermal power stations. Moreover, smalldiesel or coal-fired plants which were opened by provincial or municipal governmentsin the 1980's shall be closed.
Fuel quality, especially of coal, is low; only 20-25% of coal is washed (Vernon 1999, p.10). Considerable management problems also lower efficiency by two to fourpercentage points (Blackman/Xun 1997).
Table 4:Size and origin of generating units (1995) and their efficiency (1988)
CapacityMW
No. of units Installedcapacity (GW)
% of total(1995)
% of total(1990)
Efficiency(Japaneseaverage=100)
% of unitsimported1
>299 147 51.9 24 87 38
200-299 202 41.8 19
38.8
83 13
100-199 318 36.8 17 19.7 n.a. 13
50-99 402 22.2 10 22
25-49 577 16.3 8
77
25
12-24 955 12.5 6 21
6-11 1575 11.5 5
65
37
0-5 n.a. 24.2 11
41.5
42 n.a.
Sum n.a. 217.2 100 100 82.2 24
1 The high import share of extremely small units can be explained through the prevalence of importeddiesel generators.
Source: Electric Power Publishing House of China (1995); Sathaye (1992), Zhang Z. (1995) für 1990
High regional differences can also be observed. Average efficiency varies by over 10percentage points between regions as shown in Table 5.

12
Table 5:Regional differences in efficiency of coal-fired power stations
Region North North-east
East Cen-tral
North-west
Shan-dong
Fujian Guang-xi
Si-chuan
Guiz-hou
Yun-nan
China
g CO2/
kWh1048 1024 1005 1075 1085 1029 1240 1053 1123 1171 1248 1051
Ownuse (%)
8.4 7.5 6.7 5.8 6.1 6.9 3.0 3.9 6.7 5.8 3.8 6.7
Source: Wiesegart (1998), own calculations using emission factor from Vernon (1999)
MOEP set the goal to reach an average efficiency of 33% in 2000 and 35% in 2010.Nevertheless, despite of a 230% increase in capacity between 1980 and 1995 averageefficiency rose only by 3 percentage points, of which one point was achieved between1990 and 1995. Thus, MOEP scaled back its projection for efficiency improvementbetween 1990 and 2000 from 6 to 3.5 percentage points (Blackman/Xun 1997).
The share of hydropower has fallen from a high of almost 25% in the early 1980s to lessthan 17% in 1997. However strong development of hydropower resources, the largestbeing the Three Gorges Dam at the Changjiang river which will be the biggest hydro-power station in the world (18GW) or the Xilodu project with 11 GW begun in 1997,shall stop this trend. So far only 10% of the hydro potential have been tapped(Blackman/Xun 1997). However, due to negative ecological side-effects it is doubtfulwhether the full potential should be exploited.
Li Peng stressed nuclear expansion in his 1997 energy policy programme while statingin the same paragraph that renewable energy „should not be ignored“. He sawrenewables as a local solutions to local problems - they did not even get an ownparagraph! Their major role was to free oil to alleviate projected oil shortages.Therefore, 60 million US$ were spent on rural renewables development. Nevertheless,the expansion programme for wind energy was very ambitious as 1 GW shall beinstalled in the next years.
Due to the lower than expected growth in electricity demand after the financial crisis in1997 and growing budget problems of the central government, expansion of nuclearpower supply is unlikely to reach the planned 9 GW by 2005.

13
2.2 Energy use
From 1979 until 1997 economic reforms led to a sharp and sustained increase in energyconsumption levels (see Table 5a). Growth in energy demand was accompanied by anoverproportional increase of electricity demand which led to frequent shortages inpower supply, particularly in urban areas.
Table 5a:Primary energy consumption (Gtce)
1981 1986 1991 1992 1993 1994 1995 1996 1997 1998
Gtce 0.59 0.81 1.04 1.09 1.16 1.23 1.29 1.40 1.32 1.22
Source: Wiesegart (1998), p. 41, Ögütçü (1999), p. 8, Sathaye, Jayant (1992)
In the early 1990s, MOEP estimated the demand surplus at 15-20% and forecast that by2015 the gap could increase by 150% (EP 1996, p. 37). Demand was projected toincrease by 280% between 1994 and 2010. Moreover, still over 100 million ruralChinese have no access to electricity (U.S. Embassy 1997a). Thus the baseline foremission reduction was very high.
Nevertheless, the Asian financial crisis of 1997 and its consequences that led to anabsolute decline in energy consumption show that an extrapolation of past economicand energy demand growth rates for several decades may lead to gross overestimates.China’s coal and electricity sectors became rapidly oversupplied beginning in 1997.Coal stockpiles totalled nearly 200 million tons in June 1999, despite the closure of23,000 small coal mines and a reduction in output of almost 200 million tons of coalfrom the 1997 level. The power generation sector was oversupplied by an estimated 24GW in mid-1999 (Logan/Luo 1999, p. 2). Besides the decrease of exports due to theAsian crisis this surprising swing has also been caused by dismantling of energysubsidies which kept fuel prices well below world market prices are successivelydismantled. Coal subsidies were reduced from 37 % in 1984 to 29 % in 1995 and fullydismantled in 1997, and petroleum subsidies from 55 % in 1990 to 2 % in 1995(Wu/Logan 1997). Coal and oil prices have been liberalised countrywide – they fell by15% in 1998 - and electricity prices in the coastal provinces. Mathai (1997) shows thateven state owned enterprises react on these increases - the price elasticities he found arecomparable to industrial countries. Nevertheless, delivered heat and residential fuelscontinue to be heavily subsidised (Martinot et al., 1997, p. 385).

14
The low efficiency of Chinese energy consumption is significant. The average intensityper unit of GDP lies eight times above the Japanese average. Corrected by purchasingpower it still remains four times higher. However, in the last two decades, Chineseenergy efficiency has improved markedly. While it declined between 1950 and 1980, itrose by 3.6% p.a. in the 80s and by almost 6% p.a. in the 90s (Zhang Z. 1995). Thelion’s share of the efficiency increase is due to a comprehensive set of policy directives,procedures, regulations, technical assistance programs, and project financing initiativesto promote energy efficiency (for a detailed description see Sinton et al. 1998)1. Only alimited part of it was due to a lower share of heavy industry, especially in the first halfof the 1980s. Companies were assigned energy use quotas. If they exceeded their quota,they had to pay substantially higher energy prices (up to 2005). In addition, a extensivenetwork of energy conservation offices was established throughout the country.Moreover, subsidised loans were provided. In some provinces, companies had to invest20% of depreciation funds in energy conservation. China is one of few developingcountries that introduced building energy standards. These are modelled on thestandards of the American Society of Heating, Refrigeration and Air-ConditioningEngineers of 1989 (Duffy 1996, p. 11). It also has standards for all relevant domesticappliances introduced in 1989 and for industrial motors and boilers supervised by theState Technology Supervision Bureau (STSB) (Duffy 1996, p. 24f.). The formerrefrigerator standards are 5% lower than comparable Mexican standards and 10% belowSwiss target values. Air conditioner standards are 8-24% below comparable Japanesestandards. However, it is unclear whether the standards are actually enforced. Thegovernment sponsors an annual week of energy efficiency campaigning (Zhou et al.1997, p. 2). A large-scale success has been the sale of efficient biomass/coal stoves inrural areas. The central and local government subsidised promotion and training andselected pilot areas (Qiu et al. 1996). In the last decade 120 million stoves were sold thatdoubled efficiency and thus save 22 mtce per year. The target is to provide each ruralhousehold with such a stove by 2000 (U.S. Embassy 1997a).
Rumsey and Flanigan (1995, p. 31) evaluate China’s programmes as „by far Asia’smost successful in achieving actual energy savings, both in gross amount and inpercentage savings“. With deregulation of energy prices and the growing share ofprivate companies, however the impact of the programmes is likely to be reduced.Government support for energy conservation offices is shrinking (Martinot et al. 1997,p. 389) even if the government states that efficiency improvement is a short term
1 However, some analysts think that a considerable share of the efficiency improvement is fictitious and
due to the progressive inclusion of the informal sector in the calculation of GDP.

15
priority (Li 1997) and has enacted an energy efficiency law in 1997. However, many ofthe provisions in the energy conservation regulations are extremely vague or soft;„encouraging“ certain actions, „supporting“ others, using broad language with multiplepossible meanings. Even where more concrete duties are created (e.g., to create a set ofstandards) very little guidance is provided in the regulations as to how extensive theregulations should be or what goals/values they should achieve. It is unclear, in manycases, what behaviour would constitute a violation of the provisions (Wang 1999).
While energy intensive industries are located in the eastern and northern parts of thecountry, energy supply centers in the west and south, necessitating long-distance coaltransport and transmission lines and associated losses. Coal accounts for 40% of railfreight transport in China (Logan/Zhang 1998)!
2.3 Local environmental damages from energy production and consumption
Increasing energy consumption causes striking damages to the local environment(Dasgupta et al. 1997). Serious air pollution has become the most common cause ofdeaths in urban areas, causing respiratory diseases. Abatement benefits of reduction of aton of SO2 in big Chinese cities are calculated by Dasgupta et al. (1997, p. 35) to beabove 50 US$. Chinese studies calculating total damages from SO2 even come to figuresof an order of magnitude higher (see Table 6).
Table 6:Economic values of acidification damages in China (billion Yuan, 8.3 yuan=1 US$)
Damages 1995 2000
Agricultural productsHealthForestry
21.8
17.2
77.6
28.5
19.6
128.3
TotalDamages per unit emission (Yuan / ton SO2)
116.6
4,978
176.4
6,461
Source: Lao (1998)
However, air pollution problems will get worse in the coming years, due to theeconomic growth. Especially township and village enterprises that account for 50% ofChina’s industrial production are major polluters and extremely inefficient. This ismainly due to lack of credit (Martinot et al. 1997, p. 389). Until now, no statistical dataabout their pollution were available (US Embassy 1997a)! Preliminary studies anticipate

16
that Chinese sulfur dioxide emissions will increase by 30% and industrial particulateemissions by 68% if these enterprises are included (U.S. Embassy 1997a). A 2020scenario without SO2 mitigation sees levels of acid deposition three times higher thanthe worst ever recorded in the infamous „black triangle“ of Central Europe (IIASA1998).
However, the situation has been changing recently. "Two controlled Area" (Acid RainControlled Area and SO2 Controlled Area) were established as demonstration project inthe ninth 5-year national plan. Furthermore, to combine the prevention and control ofindustrial (including township and village enterprise) and urban pollution withpromotion of cleaner production, a "Control Plan on the Total Amount of PollutionDischarge and Trans-century Green Engineering Project" was also set as a nationalpolicy. However, central government control over the actions of provinces andmunicipalities has weakened in the last years. It currently more often rests on persuasionthan on regulatory authority. Thus, environmental policy implementation differsstrongly between provinces. While Guangdong has enacted implementation in somesectors, inland provinces lag behind (Dasgupta et al. 1997).
3. VOLUME OF FOREIGN DIRECT INVESTMENT IN THE CHINESEENERGY SUPPLY SECTOR AND BARRIERS TO ITS EXPANSION
According to Shin (1999), 99% of the power plant constructed after 1990 areindependent power producers. The planned expansion of the electricity generatingcapacity requires a total finance volume of 200 billion US$ until 2010 (Blackman/Xun1997, p. 6). Internal Chinese savings will not be sufficient to meet such requirements.Therefore, it will be necessary to attract foreign investors for at least 30% of theinvestment costs. Moreover, current Chinese production capacity for electricitygeneration equipment amounts to only 9 GW per year compared to the currentexpansion rate of 15 GW and a projected rate of 23 GW in the decade 2000-2010(Blackman/Xun 1997, p. 6). Thus imports and foreign direct investment (FDI) arecrucial to reach the expansion targets.
From 1978 to 1993 overseas sources invested approximately 14.3 billion US$ in theChinese power sector, approximately ten percent of total investment during that period.These funds were used in 63 large- and medium-scale projects that have a combinedcapacity of 40 GW. Many of these projects were hydro. 85% of the foreign funds wereprovided by public-sector sources - foreign governments and multilateral lendinginstitutions like the World Bank and Asian Development Bank. FDI played a very

17
minor role (Blackman/Xun 1997). As the Chinese government recognised its crucialrole, it introduced policy changes.
In March 1994, the State Planning Commission promulgated Interim Regulations forthe Use of Foreign Investment for Power Projects which, for the first time, specifiedexplicit rules for FDI. In August 1995, China issued a notice for tendered Build-Operate-Transfer (BOT) projects. In December 1995 the Law on Electric Power wasproposed, which included explicit rules for foreign investment in the power sector. Atthe same time, the MOEP created the China Power Investment Corporation to raiseinternational capital for power projects. An increase in the decentralisation of decisionmaking processes also supported FDI: Regional authorities try independently to acquireforeign investment capital for their projects.
Despite these efforts to attract FDI and an intense project preparation activity, in the lastyears actual levels of FDI in Chinese power generation have been moderate. Only asmall percentage of contracts negotiated have actually been implemented. By June1998, 24 FDI plants with a total capacity of 4.9 GW were in operation, and another 12plants with a total capacity of 9.0 GW were under construction. Thus, only somewhatmore than 10 GW will have been added by 2000 (Blackman/Xun 1999). 25 projectswere financed from the U.S., 4 from the UK, 3 from France, 2 from Germany and oneeach by a company from Japan and Taiwan (Blackman/Xun 1999, p. 701). The projectsare concentrated in the coastal provinces. The share of coal is even higher than in theChinese average: 90.7% of installed power, whereas gas has 6.1%, oil 1.9% diesel 0.8%and hydro 0.5%.
The reason for this low activity is that investors so far have encountered severalimportant institutional barriers (Blackman/Xun 1997, p. 19ff.). These include: owner-ship restriction, rate of return regulation, exchange rate risks, uncertainty governinglaws and regulations that create financial risks; risk that power purchase contracts willnot be honoured; delays in approval that also lower return on investment.
1994 rules stipulate that Chinese partners in non-BOT joint ventures maintain acontrolling interest in plants with a unit capacity larger than 299 MW or a total capacitylarger than 599 MW. Wholly owned foreign ventures of any scale were allowed.Finally, foreign entities were not be permitted to own more than thirty percent ofexisting plants. Because of the low activity, the rules were eased in 1996. Foreign

18
partners in joint ventures are now allowed to have a controlling interest in all type ofplants except hydro plants larger than 250 MW and nuclear plants.
The central government feared that foreign investors would be able to negotiateextremely favourable terms with local governments faced with chronic power shortages,especially if local governments were given the opportunity to become partners in a jointventure. By stiff rate of return regulation it tried to prevent such „exploitation“.Although not officially documented, there is general agreement that beginning in 1993,the State Planning Commission, which must approve all projects costing more than 30million US$, stopped approving all FDI power projects with projected rates of return inexcess of 12%, and later 15% This cap was set at an unusually low level given the risksinvolved. In other Asian countries, rates of return in excess of 20% are the norm. In1996 the rate was raised to 15% after tax. After the financial crisis the cap was de factoabolished (Blackman/Xun 1999, p. 703).
Thus investment in relatively less efficient small-scale plant that are less regulated andgenerally less risky than large investments became attractive (Ma et al. 1997), see Table7. 30% of the implemented projects remained below the 30 million US$ cap. Especiallystriking was the initial prevalence of diesel-fired plants despite a professed preferencefor other types of plants (Blackman/Xun 1997, p. 29).
Table 7:Size of FDI power plants (MW)
Sum >300 200-299 100-199 50-99 25-49 12-24 <12
36 8 3 6 9 6 3 1
Source: Blackman/Xun 1999, p. 702, own calculation
Power purchase contracts require that the power purchaser - usually a local governmentowned power bureau - buy a ‘minimum take’ from the plant for a fixed term at a fixedprice schedule. The minimum take, term, and price schedule are all negotiated beforeplant construction begins based on the plant’s projected operating costs. The term of thecontract can range from 10 to 30 years. Electricity produced above the minimum takecan be sold at a price that is higher than that specified in the contract. Perhaps the mostserious risk run by FDI power plants is that the power purchaser will not to buy thecontracted minimum take. At the present time, the Chinese government maintains that,given existing electricity shortages, power purchase contract default should never

19
actually occur. Nevertheless, default risk is real, especially in areas where largeeconomically unstable state-owned industrial enterprises account for a major share ofelectricity demand. In any case, financiers of FDI ventures often require some type ofassurances regarding default. Since default is not officially expected, contingency plansare fragile. The Chinese legal system is not accustomed to enforcing power purchasecontracts. Government guarantees that existed in the past will no longer be available.Exacerbating the problem is the fact that joint venture plants often include powerpurchasers as a partners, an arrangement that enables foreign investors to obtainfavourable contract terms, but limits legal recourse in case of contract default.
While in the beginning all projects had to be approved by the Ministry of ForeignEconomic Relations and Trade (MOFERT) and the State Administration of ExchangeControl (SAEC) all projects smaller than 150 MW or costing less than 30 million US$can be negotiated locally.
A survey by Blackman and Xun (1997, p. 25) showed that majority control of a non-BOT co-operative joint venture with a local governmental organisation was the mostpopular institutional arrangement for FDI in the power sector. Foreign direct investorshave a controlling interest in fully three quarters of the joint ventures. Martinot et al.(1997, p. 386f.) explain the prevalence of joint venture with the need for local partnersthat know the regulatory and bureaucratic system. So far, these joint venture typicallyhave involved state-owned enterprises.
Blackman/Xun (1999, p. 706f.) tentatively conclude that the efficiency of the FDI plantsis higher than of comparable new Chinese and U.S. plants but could have been better ina less regulated environment.
4. CHINESE CLIMATE POLICY AND CDM PROJECTS
4.1 Chinese climate policy
It is clear that the Chinese environmental policy priorities are on the local and regionallevel (Information Office of the State Council 1996). Thus, greenhouse gas reduction isonly attractive if it includes direct or indirect reduction of local pollutants.Domestically, climate policy objectives were included in China’s Agenda 21 adopted1994. They include formulating a national programme for controlling greenhouse gasemissions by afforestation and energy development. Later, emission targets shall be set.Interestingly, a paragraph states that China „will actively seek investment from the

20
international community for projects which assist in the slowing of climate change.These include projects for coal-fired power plants, hydroelectric power stations, coalgas projects, coal methane utilisation and tree planting“ (EP 1996, p. 87). Despite thelack of mention of energy saving measures, these have actually been at the forefront ofdomestic activities (see 5.2 below).
China’s institutional structure for climate policy is very complex and yet evolving.Major actors are:
- the State Environmental Protection Commission (SEPC), the highest decision bodyon environmental policy who unites ministers and heads of agencies,
- the State Planning Commission (SPC),- the National Environmental Protection Agency (NEPA) which is the secretariat of
SEPC and comparable to an environment ministry.
China has been very cautious in the international climate negotiations and always triedto prevent any decisions that might lead to emission constraints for developingcountries. Its resistance was crucial for the deletion of a Kyoto protocol paragraph thatallowed non-Annex-I countries to set voluntary emission targets (Hogue 1997). In thesame spirit, it was very critical of emissions trading and Joint Implementation as theseinstruments were seen to pave the way for commitments of developing countries. InMarch 1998, the Chinese government established the National Co-ordination Group onClimate Change (NCGCC) to foster a comprehensive approach on the climate changeissue1. The NCGCC is one of 20 committees/groups that are under direct supervision ofthe State Council and composed of following four subgroups similar to IPCC grouping:
1. Scientific assessment team2. Influence and mitigation team3. Social and economical influence team4. International negotiation team
Each of the team has members from various ministries. Members from the ForeignMinistry are in charge of international matters such as negotiation as well as ActivityImplemented Jointly (AIJ) project proposals.
1 In May 1998, China became the 37th signatory country of the Kyoto Protocol of the U.N. Framework
Convention on Climate Change UNFCCC.

21
Many projects that reduce greenhouse gas emissions simultaneously affect otherpollutants such as SO2, nitrogen oxide (NOx), total suspended particles (TSP), etc. Byimplementing these projects, 1) emission reduction countermeasures of air pollutantswill be avoided for the host country, 2) the local environment will be improved. Thismeans that two types of secondary benefits will occur. The first one is the benefitcreated by the avoidance of air pollutants emission reduction cost originally needed atthe host country (avoided cost). The second is the benefit created by the decrease indamage cost. The consideration for these secondary benefits at calculating the emissionreduction cost will greatly change the aspects of the GHGs emission reduction project’soverall evaluation. One of the points of the carbon-offset project is the existence of thebenefit accruing to the host country. Moreover, even in developing countries, especiallyin China, the improvement of air quality is becoming a policy issue with a high priority.Therefore, at negotiations regarding the amount, the price, and the sharing of the carboncredit between the host and investing country, the quantification (monetary valuation) ofsecondary benefits generated by the project is important.
In early 1999, the State Development Planning Commission (SDPC) published a majorstudy on China’s future energy policy that takes climate policy astonishingly serious toderive goals for the energy supply sector in 2050 (US Embassy 2000). The studyfrankly argues that China must halve its dependence on coal while sharply boostingnatural gas production and oil and LNG imports to meet eventual climate change treatycommitments. The share of coal should be 35 % of Chinese energy consumption in2050 with oil and natural gas accounting for 40-50 % and primary energy sources suchas nuclear, hydro, solar and wind power account for 15-20 %. Interim targets for 2020-30 would be 50% coal and 35% gas.
4.2 Climate cooperation – JI, AIJ and CDM
The idea of Joint Implementation (JI) was based on Art. 4, 2a of the 1992 U.N.Framework Convention on Climate Change (UNFCCC). It has been refined in Art. 6and 12 of the Kyoto Protocol negotiated in 1997. Industrial countries with legallybinding emission targets may achieve their target not only through domestic measures,but also through activities in other countries with targets (Art. 6). The CleanDevelopment Mechanism (CDM) (Art. 12) is used with countries without emissiontargets. In this way, industrial countries can use international low cost emissionreduction while transferring financial resources and know-how to developing countries.

22
China is the ideal country for large scale greenhouse gas reduction projects. Thus, theU.S., Japan and other industrial countries have been very eager to start projects andhave provided capacity building since 1995. Nevertheless, for a long time China andother developing countries were strictly opposed to JI because they feared that aparticipation in JI would be the first step towards a commitment to climate protectionmeasures. Thus, the Berlin conference in March 1995 decided to test JI under the newterm „Activities Implemented Jointly“ (AIJ) until 1999 in a pilot phase, where nocrediting of reductions was allowed. The criticism of JI did not prevent Chinese officialsfrom discussing AIJ issues with the Norwegians, Dutch and Japanese (EP 1996, p. 98).It seems that there were interministerial differences concerning the attitude towards AIJ.While NEPA and SEPC were favourable, the Foreign Ministry remained sceptical - andthe latter dominates China’s negotiating position.
In spring 1997, parts of the Chinese government changed their position concerning aparticipation in the AIJ pilot phase (Wu/Liu 1997). Now they promote AIJ investmentsin China. The reason for this reorientation was the idea to attract additional capital.Moreover, they realised that they would not receive intensive transfers of technology bypure grants as originally envisaged. Another positive influence for this reorientation wasthe reduction of local environmental pollution, as a side effect of the carbon mitigation.The need for reduction of local pollution has led to the first initiatives in this respect.The city of Beijing is currently converting all central heating boilers from coal to gas.
In 1997, the first Chinese AIJ pilot project was concluded with Japan. It entails theinstallation of dry fire-extinguishing facilities for coke at a large steel plant in Beijing toensure more effective use of heat energy at a cost of 24 million US$ and reduces 86,900t CO2 per year (Anonymous 1997f.). Asuka (1999) made an economic evaluation of thisproject. Various issues relating to the estimation of the specific size of the GHGemission reduction cost and amount through negotiation have become apparent. Inaddition, the monetary valuation of the local emission reduction effect of SO2 has hadan impact on cost assessment.
4.3 U.S.-China climate policy Co-operation
Already in the late 1970s, the U.S. promoted clean coal technologies in China and ajoint research programme on CO2 and climate change was agreed in 1987 (Price 1998).After ratification of the UNFCCC in 1994, the collaboration deepened considerably.The U.S. set up Energy Efficiency teams as a result of the Protocol for Co-operation inthe Fields of Energy Efficiency and Renewable Energy Technology Development and

23
Utilisation signed in February 1995 between the U.S. Department of Energy and theChinese State Science and Technology Commission (SSTC). In this context, the U.S.provided funding for energy efficiency studies (DOE-OIT 1997a). Obviously it wantedto open up markets for American technology. The U.S. Ex-Im Bank set up 50 millionUS$ export credits for renewable energy and energy efficiency projects (Anonymous1997b). Several workshops have taken place, inter alia a U.S-Japan-China workshop on„Technology transfer, GHG mitigation and sustainable development“ in November1997 (Ma et al. 1997). A joint U.S.-Chinese statement on energy and environment co-operation was signed during the visit of Jiang Zemin in the U.S. in October 1997. It wasan outgrowth of the U.S.-China Environment and Development Forum established inMarch 1997 during Gore’s visit to Beijing (White House 1997). The U.S. governmentinitiated the Technology Co-operation Agreement Pilot Project (TCAPP) in 1997 as amechanism for the technology transfers to the developing countries in the field of theclimate change. In 1997, China had identified 20 projects that would reduce carbonemissions, are financially viable, and for which U.S. investment would be welcome. Acollaborative effort between U.S. and Chinese researchers evaluated these projects(DOE-OIT 1997a). However, no U.S.-Chinese AIJ project has been notified so far evenif China has been one of the host countries which the US government is focusing itsefforts through TCAPP. So far, various investment programs and actions to removemarket barriers have been identified by the TCAPP China team (U.S. government,1999). When the U.S. vice president Al Gore and China’s Prime minister Zhu Ronqimet in Washington in April 1999, both sides agreed that they would establish a 100million $ fund for technology transfer in the field of energy conservation and powergeneration from the US to China. Concessional loans managed by the EXIM bank aresupposed to play a main role in this fund.
4.4 EU energy and climate policy co-operation with China
In the last years, the EU has called for a more active energy co-operation with China. In1995, the Commission issued a communication on long-term relations with Chinamentioning the energy sector. The latter was focus of a communication in 1996 on the„Europe-Asia co-operation strategy for energy“. It sets the following priorities:
- Modernising the electricity sector
- Introducing „clean coal“ technologies
- Raising energy efficiency

24
- Rural energy supply through use of renewables
- Promotion of natural gas
While the second point clearly has no greenhouse gas benefit, the third to fifth points alllead to emission reduction. The emission benefits of the first point depend on theconcrete measures. Interestingly, nuclear and hydro power are not mentioned.
There is no instrument of co-operation concentrating on China. The JOULE-THERMIEand the SYNERGY programme provide funds for energy projects. THERMIE hasfinanced a couple of conferences on energy issues, focusing on coal technologies. Itsoverall funding for projects in China in 1991-1996 was 1.29 million ECU (EP 1996, p.121g). SYNERGY is only funded with 8 million ECU per annum and thus not relevant.Its role has been confined to energy management courses for over 3,000 people (EP1996, p. 108). The European Investment Bank in 1995 signed a framework agreementwith China mentioning energy and environment projects. The first loan of 55 millionECU financed an offshore oil operation.
Environment co-operation is much less developed. In 1996 negotiations on anEU/China Environmental Management Co-operation Programme were held. TheNetherlands concluded an two-year agreement on environmental co-operation in 1996including greenhouse gas emission reduction (EP 1996, p. 98).
Compared to U.S. companies, EU companies have been less active in energy-relatedFDI in China, even though the member states pursue a policy of strong subsidisation bypublic funds to procure Chinese orders. For example, a third of the total amount ofGerman development assistance was used to build subway lines in Shanghai andGuangzhou.
4.5 Japanese climate co-operation
Asuka (1999) discusses that Asian countries, especially China, may be considering theexisting financial and technological support from Japan as part of the „post-warcompensation“. Therefore, it can be predicted that the issue of „financial additionality“,which states that the funds for the international collaboration for global warmingmitigation measure should be newly and additional, may strongly be persisted on.Moreover, even if the government of the host country approves utilising the existing

25
ODA, Japan will be forced to compromise in other parts, and as a result, it is possiblethat the cost becomes higher.
Therefore, in regards with public funds, it is better to clarify the distinction between thepart dealing with fields such as global warming which is a multi-lateral internationalenvironmental policy based on economic rationality as well as a domestic industrialeconomic policy and the part dealing with bilateral development aid which is adiplomatic tool against developing countries with historical complications. Furthermore,it is considered that the Japanese Export/Import Bank loans that do not count as anODA, can be used constructively in the international collaboration on global warmingmitigation. In other words, by giving a part of the public fund a „fresh new look“, a titleas such as the „Climate Fund“ implemented by the Norwegian government, and aspecial budget on an onerous financial support could be provided. Needless to say, suchas an expansion of subsidies (i.e. the current Green Aid Plan by MITI) with energy-related tax as the originating fund and 'flexible' application of the Export Insurancecould be considered as well. For example, it could be considered that the ExportInsurance system could be modified to be able to absorb the risk of the price volatilityof the carbon credit. In this context, establishment of carbon tax as a fund source wouldbe an important issue for further discussion in near future. In any rate, from both sidesof the appeal to the international society and of the accountability to the domesticsociety, the consideration of the introduction of a budget with a new title regarding thepublic support of global warming mitigation by international collaboration is necessary.
Asuka (1999) recommends Japan to consider the global warming issues as importantdiplomatic and economic issues. It should thus deal with it more positively andconstruct a mechanism in Asia similar to the World Bank Prototype Carbon Fund. Inspecific, it can be considered to let the Asian Development Bank (ADB) carry out suchfunction. As a matter of fact, in Europe, the European Bank for Reconstruction andDevelopment (EBRD) has a plan to begin its own Carbon Brokering Program (EnergyEfficiency Equity Fund) other than that of the World Bank. Furthermore, it should bepossible to relate the institution building regarding the global warming issue with theinstitution building with regard to the acidification issue, which is also an urgent issuein the East Asia.

26
5. OPTIONS FOR A COMBINATION OF CDM WITH COMMERCIALACTIVITIES IN CHINA
If the crediting of CDM projects will be allowed after COP 6, an incentive for CDMprojects could be that investors can credit emission reductions against carbon taxes andother climate policy instruments. Thus investors earn an extra revenue throughprovision of efficient energy technology.
5.1 Energy supply
The BOT modus offers a good possibility to introduce CDM projects, because theinvestor controls the performance of the project. We will discuss different project typesand start with the coal sector due to its overwhelming importance. Obviously, generalcoal-to-gas conversion would yield enormous greenhouse gas benefits, but is difficultdue to the need for big infrastructure investment. However, Logan/Luo (1999, p. 12ff.)roughly calculate that a CDM credit valued between 5 and 10 US$/t CO2 would lead toequal power prices from coal and gas fired power plants over much of China. Due tohigh coal transport costs, gas would already now be the cheapest option in southerncoastal provinces.
5.1.1 Upgrading of existing and new coal-fired power stations
An especially interesting CDM option is the substitution of small-scale, extremely oldand inefficient plants through large efficient ones. Whereas in the past the small plantshad to remain operative because of the demand surplus, China has stated its intention toshut down these plants progressively (Anonymous 1998a). However, even if larger unitsare built, this will not necessarily entail use of advanced technology such as integratedcoal gasification (IGCC) due to the price differential. Internationally, the cost ofbuilding an IGCC plant lay at 1450 US$/kW in 1997, while pulverised coal (PC) plantscost 1150 US$/kW. The cost disadvantage is substantially greater in China, where thecapital cost of building a PC plant has been, in some cases, less than 500 US$/kW; theaverage cost of well-designed plants (including desulphurisation) is about $880US$/kW (Nautilus Institute 1999). Even „normal“ supercritical units with efficienciesof 40% are not necessarily the default option; currently only 6 GW are operating inChina (Vernon 1999, p. 16). There is thus a wide range for CDM projects. Anotheroption is to upgrade old facilities as the example below shows:

27
Case study: Upgrading of 125 MW coal-fired power plant
A plant improvement study of the Banshan Power Station, Hangzhou, supported by theAustralian Government, recommended the following activities to improve efficiency andreliability (Anonymous 1998b):- complete turbine upgrade;- reinstatement of sootblowers and burner tilts; reduction in excess oxygen levels and
unburnt carbon losses through furnace modelling and improvements to- mill maintenance;- air heater upgrades to improve thermal efficiency;- upgrade of the boiler airflow and draft control system.The expected benefits from these upgrades with a gross investment of about 3.5 millionUS$ were an improvement in plant relative thermal efficiency of 7.2% and an increase inthe maximum output of 6.4% to 133 MW. The impact on CO2 emissions would be areduction of about 94 kt per year. The pay-back time for the proposed improvementswould be four years, making the project profitable.The plant operator has now decided to proceed with the turbine upgrade, which in itselfwill reduce CO2 emissions per kWh by 5.1%. Moreover, switching from local coal toimported coal with a lower ash content and higher specific energy would reduce coalconsumption by 27% for the same output. Modelling indicated that switching wouldimprove boiler efficiency from 86.6 to 87.9%, so that 1.3% less fuel energy would berequired. This would result in a 6% reduction in specific CO2 emissions from 1211 g/kWhto 1137 g/kWh. The plant operator is considering replacing or blending existing coals withhigher-quality imported coal (Vernon 1999, p. 14f.).
Would this project be attractive as CDM project or not?- Rules may decide that profitable projects are not eligible for the CDM. However, the
investor could argue that in the Chinese context barriers have to be overcome (seesection 3.). This is shown by the fact that only the turbine upgrade is doneautonomously.
- Due to the reduction of SO2 by 1720 t per year local benefits would amount to 90,000to 1.3 million $ (taking the figures from section 2.3).
- Use of import coal may be difficult due to foreign exchange restraints- The project is easily replicable as Zhejiang province has 19 power stations of
the same design.

28
Liu (1999) made a feasibility study of cogeneration (CHP) and circulating fluid-bedcombustion (CFBC) power stations. CHP and CFBC reduce energy consumption aswell as air pollutants. There are currently 285 MW of CFBC operating in China(Vernon 1999). The baseline scenario in this case study was the conventional low-efficient industrial boiler in a specific city of Henan province. According to itsincremental cost calculation, the emission reduction cost was 6.40 US $ /ton CO2.
5.1.2 Capture of coalbed methane
All coal mines, especially underground ones, emit methane that has to be collected andventilated to guarantee safety. Captured coalbed methane can be used like natural gas.The reserves of coalbed methane in China are estimated at 30 to 55 trillion m3
(Anonymous 1998c), i.e. 25 to 40 times its natural gas reserves (BP Amoco 1999). InJanuary 1998, Texaco contracted with the China United Coalbed Methane Corporationto capture 0.5 billion m3 per year in Anhui province (Logan/Zhang 1998, p. 16), i.e.about 2% of Chinese natural gas production. Three other companies have followedsince (Logan/Luo 1999). Wei and Chen (1998, p. 48) calculate a cost of 16 $/t CO2 butuse a strange baseline (they do not calculate the methane reduction but compare CO2
emissions from burning of coal and burning of methane).
5.1.3 Electricity and natural gas import from Russia
In relative geographic proximity to China the vast energy resources of Eastern Siberiaare situated. This invites speculation on large-scale export of electricity and natural gasfrom Russia to energy-hungry China. Even if Russia will not need CDM investmentsdue to its lax emission targets, it might be interested to sell CDM emission creditsachieved through projects in China to other industrial countries.
Russia has a relatively low CO2 intensity for power production (approximately 500 gCO2 per kWh). Due to the shutdown of heavy industry there is a power oversupply inmost regions of Siberia that is mainly based on hydropower. Recent improvement inpower transmission technology makes power export from Russia a realistic option.Besides Russian companies, also the German Siemens showed interest in technicalrealisation of such projects. Concrete plans have already been developed by the utilityIrkutskenergo that calculates the costs for a long-distance line with 1.5 billion US$.Then it could export 18 TWh per annum to China, i.e. 1.5% of China’s currentconsumption (Ziener 1998). As Irkutskenergo generates more than two thirds of itselectricity by hydropower, the CO2 content per kWh would be less than a third of the

29
Chinese average. A rough, but cautious calculation using a difference of 500 gCO2/kWh gives a potential CO2 credit of 9 million ton per year.
Already in late 1997 China signed a memorandum of understanding with Russia tobuild a US$12 billion pipeline system from Siberia to China's Pacific coast. Thedistance from Russia's Irkutsk Basin gas fields to China's eastern coast is comparable tothe distance covered by the existing pipelines from Western Siberia to Western Europe.
According to estimates of gas demand in China made by the Institute of Energy Strategyin Moscow, in 2010 gas export to China could reach 10-12 billion m3, i.e. 50% ofcurrent Chinese natural gas production. Several versions of pipelines are underdiscussion, with two of them considered by the Russian gas monopolist GAZPROM asfeasible: 1) Kovykta - Irkutsk - Mongolia - Beijing with branches to Ulan-Ude andChita, in total 3000 km and capable to carry 30 billion m3; 2) Kovykta - Irkutsk -Tsitsikar (China) - Beijing with branches to Ulan-Ude, Chita and Kharbin, in total 4580km. Projected capital expenses vary depending on sources from 3.5 - 4.8 billion US$estimated by the Russian Ministry of Fuel and Energy (1999) to 7 billion US$(Logan/Chandler 1998). Again using a rough estimate coal-to gas conversion yieldscredits of 2.5 million t CO2/ billion m3, i.e. the pipeline 25 to 75 million tons per year.
In the current state of Russian economy financing of large-scale electricity and naturalgas export from Russia to China is unavailable. Only the involvement of internationalbanks and foreign investors could help to overcome this barrier. Therefore power andgas export from Russia could prove its financial additionality and qualify for CDM. Thedifferent carbon intensity of power generation for Russia and China could serve asbaseline. Due to the mentioned oversupply of electricity, there would be no leakage.
5.1.4 Renewable energy
A promising field for small-scale CDM projects in China is wind power (for a goodoverview see Lin 1998). By 1997, there were 140,000 small, locally manufacturedturbines in rural China providing electricity for lighting, radios, televisions and smallappliances. Most are located in Inner Mongolia, due to favourable policies by the localgovernment started already in the early 1980s; about 35% of the non-grid-connectedpopulation there is now electrified in this manner, reaching 90% in some areas (for adetailed description of the situation see Zhang et al. 1999). These small turbinescontributed about 19 MW to installed capacity. These programs have been successful increating a domestic industry of wind turbines: however, these are mostly 100 W units

30
used in single households (Lew et al. 1996). China has a technical potential of 250 GWand plans to increase its installed capacity from below 100 MW to 1 GW in 2000 and 3GW by 2010. The best sites with a potential of 1 GW in Inner Mongolia have averageannual windspeeds of 9 m/s (Zhou et al. 1997, p. 19ff; Lew et al. 1996). Because ofimport duties on wind turbines of 20%, the price per kWh amounts to 5 US cents whichis not yet commercially viable if compared to the 2-3 US cents a coal-fired kWh cost inNorth China (Lew et al 1996, p. 6). Zhou et al. thus recommend the set-up of domesticturbine manufacturing that could lower costs by around 40% (Lew et al. 1996, p. A9).As long as the fixed buy-back rate for wind power, set by the State PlanningCommission for each province, is held up, wind power development is clearlyprofitable. In 1996 buy-back rates ranged from a low in Inner Mongolia of 6.5-7.6 UScents/kWh over 7.8-8.4 US cents/kWh in Nan'ao Island to a high of 10.5 US cents/kWhin the far western region of Xinjiang (Lew et al 1996, S. 3). Installed windpower haspicked up recently, albeit from a low base (see Table 8).
Table 8:Installed wind power
1992 1993 1994 1995 1996 1997 1998
MW 5 13 31 n.a. 57 70 224
Source: Sinton (1996), Lindley (1999)
Besides large wind farms, also small scale wind/solar hybrid rural electrification can beinteresting. The province of Inner Mongolia has set up a legal framework to facilitatesuch projects by setting up revolving accounts (U.S. Embassy 1996b). Biogas is also arelevant option for the major part of the rural areas. In Guangdong province alone,160,000 biogas household digesters were constructed in 1996, while 19 larger projectsprovided 110 MWh of electricity (Anonymous, 1997c). Moreover, 2.1 million ha shallbe afforested for fuel use. Nevertheless, in the short term woody biomass use cannot beexpanded sharply as almost 90% of the fuelwood forests is young (Clarke 1998, p. 11).Overall biomass electricity capacity shall reach 50 MW by 2000. The same target is setfor geothermal electricity generation and an additional heat use of 0.75 mtce. Tidalpower, which currently has 6 MW installed has a target of 50 MW for 2000 and 300MW for 2010. Solar thermal power shall reach 1.5 mtce (U.S. Embassy 1997a). Alreadynow the installed thermal collector area equals the European level (Chun/Ruhdorfer1997). The U.S. has financed a rural photovoltaics project in Gansu in 1995 to provide600 20 W systems with 0.2 million US$. It provides subsidised credit and operates as a

31
revolving fund (U.S. Embassy 1996b). Total installed photovoltaic capacity amountedto 8.5 MW in 1996.
5.2 Energy demand
As the Chinese energy prices reach world market prices, efficiency projects on theenergy demand side become interesting for commercial investors. For the time being,they are still only done if additional foreign funds can be obtained. Despite theachievements outlined above, the Beijing Centre for Energy Efficiency (BECon)established in 1993 and partly funded by the U.S. and WWF estimates the no-regretpotential at over 30% (BECon 1995, p. 2).
Table 9:Energy conservation potential compared to business-as-usual
Year 2000 2010
Sector EnergyconservationpotentialMtce (%)
CO2 emissionreduction potential
MtC(%)
Energy conservationpotential
Mtce (%)
CO2 emissionreduction potential
MtC(%)
Industry 183.6 (79.6) 131.6 (84.0) 354.0 (74.1) 257.9 (79.5)
Agriculture 11.3 (4.9) 7.4 (4.7) 16.3 (3.4) 11.2 (3.5)
Transportation 13.5 (5.9) 8.7 (5.6) 38.1 (8.0) 23.4 (7.2)
Household 22.2 (9.5) 9.0 (5.7) 69.1 (14.5) 32.1 (9.9)
Total 230.6 (100) 156.7 (100) 477.5 (100) 324.6 (100)
Reference: Tsinghua University (1995)
The Global Environment Facility (GEF) plays a pioneering role in this respect. Itfinances the upgrading of industrial boilers with 32.8 million $. The average efficiencyof the 430,000 Chinese industrial boilers is 65% whereas industrial countries attain80%. The corresponding upgrade would save 1.7 EJ. Part of the difference is due to lowcoal quality (BECon 1995).

32
Table 10:Comparison of unit energy consumption of industrial processes using furnaces
(GJ/t)
Production process China Japan China:Japan
Steel 29 18 1.6
Coarse copper 50 41 1.2
Cement clinker 5.6 2.9 1.9
Liquid glass 88 41 (UK) 2.1 (UK)
Source: BECon 1995, p. 8
In 1996, a big GEF project started to set up three energy service companies (ESCOs) inBeijing, Liaoning and Shandong. Funding entails a 35 million US$ grant from the GEF,4.5 million from the EU, a 65 million loan from the World Bank and about 100 milliondomestic funds (Anonymous, 1997a). At payback period of 1 to 3 years, these projectsshould be profitable after initial hurdles have been overcome. In a second stage, ESCOsshall be established countrywide. Zhou et al. (1997, p. 17) estimate the carbon reductionat 5.5 million t per year for a 10 year period.
According to the World Bank (1994), internal rates of return for typical industrialenergy efficiency projects ranged between 20 and 100%. Why has this potential so faronly been tapped to a small extent? A detailed explanation is provided by BECon (1995,p. 21): One main reason is the „expansion drive“. It is a legacy of the centrally plannedperiod, when government agencies at all levels set high production targets. Governmentofficials and managers still tend to stress expanding production by increasing inputswhile neglecting to raise internal efficiency. Those managers who are willing to investin energy efficiency are often unable to obtain a loan because the government pressuresbanks to direct their limited financial resources to capital construction projects, leavingvery little for energy conservation.
Unclear ownership rights also affect efficiency. Managers still do not own theirenterprises and are often transferred between different enterprises. Therefore, they haveno stake in the firm's long-term success or failure. In order to get a good performancereview and be promoted to manager of a bigger plant, the manager must produce moreoutput value, more profits, and more benefits for workers. This emphasis on short-termresults discourages investment in energy efficiency. When an engineer proposes an

33
energy conservation project (e.g., replacing an inefficient piece of equipment with ahighly efficient one) to the manager, and suggests that the loans be paid back in threeyears, the first thought that occurs to the manager is that his/her term is just three years,and that s/he may not even be around to receive praise when the investment begins topay off. Thus, the manager has no incentive to take the risk associated with a long-terminvestment.
"Forced substitution" refers to the involuntary use of inappropriate inputs due toshortages, a common phenomenon in planned economies. This particular type ofshortage is not an absolute but relative; it is the result of irrational allocation of goods inthe absence of market mechanisms. Forced substitution results in the use ofinappropriate types and qualities of fuel and equipment. For example, due to scarcity,most Chinese enterprises use coal rather than oil or gas, and they often use low qualitycoal that is not suitable for their equipment, both of which lead to lower efficiency.Limited selection of equipment poses a similar problem.
Corruption is another contributing factor. Managers are classified as "officials" inChina. Government agencies at all levels often appoint officials as managers, or transfermanagers to official posts. Exchanges of power and money within this unified systemsometimes interfere with raising energy efficiency. For example, low efficiency,substandard products can easily be sold on "commission" or through "connections,"while highly efficient products are unable to compete.
China’s lighting is a major area for efficiency improvement as it is currently responsiblefor 15% of electricity use. Lighting levels are set to increase sharply as until now,recommended light intensities were only 20-40% of industrial countries' values (Min etal. 1997). Chinese companies produced 300 million compact fluorescent lamps (CFLs)in 1996, 80% of which are exported. The quality of the CFLs sold on the domesticmarket is low: studies showed that the average lifetime is below 1,000 hours while theinternational average is 10,000 (Zhou et al. 1997). Its efficiency is also only 50% ofinternational average (Min et al. 1997, p. 80). Shandong province already hasdifferentiated electricity tariffs and a diffusion programme for CFLs which led to salesof over 10 million lamps in 1996. Thus, energy savings of 400 MW peak load, i.e. 7%of total electricity use, could be reached in 1996. In the city of Waifang alone the sale of4 million CFLs led to a decrease of power cuts by 89%. Nevertheless, evaluationshowed significant takeback effects of over 50% and high failure rates of CFLs (Zhou etal. 1997, Anonymous 1997d). Shanghai set a goal to raise energy efficiency by 6% per

34
year (Anonymous 1997e). BECon also offers various projects in this area. It supportsthe China Green Lights government five-year dissemination project for CFLs byhousing an exhibition and issuing recommendations for the distribution of 60 millionUS$ subsidised loans (BECon 1997). UNDP granted 995,000 $ for the project. Thetarget is to save 7.2 GW peak load by 2000 by distribution of 200 million CFLs and 100million efficient tubes - an emission reduction of 7.4 million t C (Zhou et al. 1997, p.5f.). National standards for CFLs aim to increase their reliability. A National EnergyEfficiency Center has been set up that delivers information to companies free of charge.
From 1986 to 1996, the number of cars quadrupled. However, there is still only one carper 100 people. The share of transport in energy use is currently 7%. Fuel consumptionof trucks is 20-30% higher than in industrial countries. To alleviate local air pollution,there are some trials with natural-gas fuelled vehicles (Cannon 1998). LPG use forbuses has already started on a small scale in Guangzhou, Shenzhen and Haikou and 300LPG buses are to be introduced in Beijing this year.
5.3 Overarching programmes
The World Bank launched a Clean Coal Initiative in 1996. According to Takahashi(1998), the Initiative is a whole coal chain approach starting from win-win options suchas coal and power sector reform. As the first step of the Initiative, the World Bank hasstarted a Clean Coal Programme in China that includes coal mining, transportation andutilisation. As the low efficiency of the coal power stations is partly due to the lack ofcoal processing, coal washing could increase efficiency by more than a percentage point(Zhang Zhongxiang 1997, p. 291). Domestic and industrial coal use can be reduced by20% if briquette use is introduced everywhere.
In the programme two parallel activities have been started: one starts from sector reformand another start with Clean Coal Technology Assessment and Environmental ControlOptions Least Cost Case Study. This study in Henan province identified cost-effectivecountermeasures to CO2 emission for energy supply, households and industry. Forexample, briquette use at rural households replacing coal can reduce 25 million tons ofCO2 during 1997-2020 at a cost of $15/ton of CO2, while briquette use in industry canreduce 70 million tons of CO2 at the same period at a cost of $25/ton of CO2. In thepower sector, accelerated retirement of small inefficient power plant is the most cost-effective way, and it can reduce 33 million tons of CO2 at a cost of $25/ton. On theother hands, highly advanced technology such as IGCC remove 15 million tons of CO2
at a cost of $260/ton.

35
Sector programmes can be an important framework for clusters of successful CDMprojects. However, it is unclear whether they could create greenhouse gas credits ontheir own.
6. CONCLUSIONS: CHANCES AND RISKS OF ENERGY-RELATEDCDM PROJECTS IN CHINA
The preceding discussion has shown that there is a wealth of possible CDM projects inthe Chinese energy sector including projects of widely different scale. However, a clearmethodology for baseline-setting, additionality determination, monitoring, verificationand certification will be necessary before large-scale CDM can take off. It is likely thatthe cornerstones will be set by the 6th Conference of the Parties to the UNFCCC inNovember 2000. Even if this is done, the huge Chinese CDM potential can only betapped if the following prerequisites for successful CDM investment can be fulfilled(DOE-OIT 1997b):
- transparency , i.e., how can companies identify the public institutions with authority
to implement contracts and projects;
- security, i.e., how can repayment be guaranteed and how can financial security be
provided; and
- initial project support, i.e., how can companies find sources of support for feasibilitystudies and other initial project costs.
6.1 Opportunities
China gives CDM investors the broadest possible portfolio of project types. CDMprojects offer an accelerated market penetration and an extra revenue to investors whilethe Chinese local environment is going to improve. Especially the latter reason may bethe key to convince local and provincial authorities.
6.2 Risks
Risks result mainly from the political insecurities in China as we see from the sluggishand distorted FDI in the energy sector. The energy market is still highly regulated, andchanges of the political framework could occur overnight, without warning.Decentralisation leads to higher barriers of penetration of efficient technologies(Martinot et al. 1997, p. 389).

36
The current oversupply in the electricity supply sector may be another barrier. Besidesthese constraints, there seems to be a fundamental problem in the context of the Kyotomechanisms. That is the fear, anxiety and scepticism shared by the Chinese side thatparticipation in the CDM might trigger discussions on quantitative emission reductioncommitment in the near future. In other words, at this moment it is very difficult forChina to judge the consequence of the CDM in the long run, which naturally results in acautious attitude towards CDM. This may change, however, after the 6th Conference ofthe Parties.

37
References
Anonymous (1997a)GEF/World Bank ESCO project, in: China Energy Efficiency InformationBulletin, 3, 1
Anonymous (1997b)Minister Ye Qing´s visit, in: China Energy Efficiency Information Bulletin, 3, 4
Anonymous (1997c)Rural energy development helps Guangdong's economy, in: China EnergyEfficiency Information Bulletin, 3, 6
Anonymous (1997d)Shandong leads in saving energy, in: China Energy Efficiency InformationBulletin, 3, 9
Anonymous (1997e)Shanghai promoting energy conservation, in: China Energy EfficiencyInformation Bulletin, 3, 9
Anonymous (1997f)Japan, China to start joint greenhouse gas-cut project, in: China EnvironmentReporter, 2,5.
Anonymous (1998a)China to decommission 10 GW of small power plants, in: China EnergyEfficiency Information Bulletin, 4, 1
Anonymous (1998b)Greener electricity – from coal, in: Ecoal, 28, 1-2
Anonymous (1998c)Coal bed methane: a clean, green future, in: Ecoal, 28, 4-5
Asuka, Jusen (1999)Economic Evaluation of the International Collaboration Project on GlobalWarming Countermeasures - From the Experience of Activities ImplementedJointly (AIJ) of the World and Japan -, paper prepared for the BeSeToSymposium, International Environmental Business in the 21st Century - How toOperate the CDM -, July 5th, 1999, Tokyo, Japan
Beijing Energy Efficiency Center (BECon) (1995)Energy efficiency opportunities in China: industrial equipment and smallcogeneration, Washington, D.C.
Beijing Energy Efficiency Center (BECon) (1997)China Green Lights Program, Special issue of BECon News, 2
Blackman, Allen; Xun Wu (1997)Climate impacts of foreign direct investment in the Chinese power sector: barriersand opportunities, Washington, D.C.
Blackman, Allen; Xun Wu (1999)Foreign direct investment in China´s power sector: trends, benefits and barriers,in: Energy Policy, 27, p. 695-711
BP Amoco (1999)BP Amoco statistical review of world energy, London

38
Cannon, James (1998)China at the crossroads: energy, transportation and the 21st century, INFORM,New York
Chun Yau; Ruhdorfer, Klaus (1997)Nutzung erneuerbarer Energien, in: Wirtschaftswelt China, 5, 4-5
Clarke, Rosemary (1998)The impact of China´s economic reform on its forests and wetlands, Paperpresnted at the Second International Conference of the European Society forEcological Economics, 4.-7- March 1998, Geneva
Dasgupta, Susmita; Hua Wang; Wheeler, David (1997)Surviving success: policy reform and the future of industrial pollution in China,Washington, D.C.
Department of Energy, Office of International Trade (1997a)International activities in China - China status report energy policy, September1997, Washington, D.C.
Department of Energy, Office of International Trade (1997b)International activities in China - China status report finance, September 1997,Washington, D.C.
Duffy, John (1996)Energy labeling, standards and building codes, Washington, D.C.
Electric Power Publishing House of China (1995)The yearbook of electric power in China, Beijing
European Parliament, Directorate General for Research (1996)European Union - China energy cooperation, Energy and Research Series W-24,Luxemburg
Hogue, Cheryl (1997)Kyoto negotiators set to adopt pact calling for 6 percent cut by 2008-2012, in:Bureau of National Affairs, 11.12. 1997
IIASA (1998)Regional Air Pollution Information and Simulation, in: Options, 2, 6-16
Information Office of the State Council of the People´s Republic of China (1996)White Paper - Environmental protection in China, Beijing
Lao Qi (1998)Economic Value of the Damage caused by the Acid Rain, a paper presented at theworkshop "Environmental issues in China and international cooperation“,organized by the Center for the Japan-Sino Science Technology and Culture inOct. 23, 1998, Tokyo
Lew, Debra; Williams, Robert; Xie Saoxiong; Zhang Shihui (1996)Industrial wind power in China, Princeton
Li Peng (1997)China´s Energy Policy, in: The People´s Daily, Overseas edition, 30.5.
Lin Gan (1998)Wind energy development and dissemination in China, CICERO Working Paper1998:7, Oslo

39
Lindley, David (1999)Country survey China, in: Wind Directions, 4, p. 10-14
Liu Deshun (1999)Cost benefit analysis of the small CFBC/CHP power plant as a AIJ pilot project inChina, in: Report on the AIJ projects in China, Global Industry Society ProgressInstitute, Tokyo.
Logan, Jeffrey; Luo Dongkun (1999)Natural gas and China´s environment, paper presented at the IEA-China NaturalGas Industry Conference in Beijing, 10 November 1999
Logan, Jeffrey; Chandler, William (1998)Natural gas gains momentum, in: The China Business Review, July, 40-43
Logan, Jeffrey; Zhang Jiqiang (1998)Powering non-nuclear growth in China with natural gas and renewable enrgytechnologies, in: China Environment Series, 2, 12-19
Ma Zhong; Nitta, Yoshitaka; Toman, Michael (1997)International cooperation for reducing greenhouse gas emissions, Washington,D.C.
Martinot, Eric; Sinton, Jonathan; Haddad, Brent (1997)International technology transfer for climate change mitigation and the cases ofRussia and China, in: Annual Review of Energy and Environment, 22, 357-401
Mathai, Koshy (1997)Estimating the price responsiveness of Chinese state-owned enterprises:implications for environmental policy, Washington, D.C.
Min Guanfu; Mills, Evans; Zhang Qin (1997)Energy efficient lighting in China, in: Energy Policy, 25,1, p. 77-83
Ministry of Fuel and Energy of the Russian Federation (1999)Kyoto Protocol and Russian energy, Moscow
Nautilus Institute (1999)Financing clean coal technologies in China, mimeo, Berkeley
Ögütçü, Mehmet (1999)China's Rise in World Energy: Its Global Search for Supply Security, in:Sinosphere, 2, 4, 6-21
Price, Robert (1998)A history of Sino-American energy cooperation, in: China Environment series, 2,3-11
Qiu, Daxiong; Gu Shuhua; Catania, Peter; Kun Huang (1996)Diffusion of improved biomass stoves in China, in: Energy Policy, 24,5, p. 463-469
Rumsey, Peter; Flanigan, Ted (1995)Compendium: Asian energy efficiency success stories, Washington, D.C.
Sathaye, Jayant (1992)Economics of improving efficiency of China’s electricity supply and use: Areefficiency investments cost-effective?, Berkeley
Shin Ei (1999)Separation of the transmission and distribution starts in China“, in Foreign energy,Denryoku Shinbun (Electricity Newspaper), August 4, Tokyo
Sinton, Jonathan (ed.) (1996)China energy databook, Berkeley

40
Sinton, Jonathan; Levine, Mark; Wang Qingyi (1998)Energy efficiency in China: accomplishments and challenges, in: Energy Policy,26, 11, 813-829
Studwell, Joe (1997)How China-specialized economists read the numbers, in: China EconomicQuarterly 1,1
Sun, J.W. (1996)Real rural residential energy consumption in China, in: Energy Policy, 24,9, p.827-839
Takahashi, Masaki (1998)Cost Effective Environmental Control Options – Technology Priorities andStrategies in China, Washington, D.C.
Tsinghua University (1995)Study on the National Policy on the Climate Change, Institute of Nuclear EnergyTechnology, Tsinghua University, Beijing
U.S. Embassy Beijing (1996a)Solar electric energy in Western China - Gansu, Qinghai and Tibet, Beijing
U.S. Embassy Beijing (1996b)U.S. DOE renewable energy mission to Inner Mongolia - rural electrification andlarge wind farm development, Beijing
U.S. Embassy Beijing (1997a)PRC rural energy conservation, supply and demand 1996-2000, Beijing
U.S. Embassy Beijing (1997b)U.S.-China energy efficiency progress, Beijing
U.S. Embassy Beijing (2000)PRC planners' new energy strategy: Oil not coal, February 2000, Beijing
U.S. Government (1999)Program for technology transfer: a paper submitted for the SBSTA 10,Development and Transfer of Technologies, FCCC/SBSTA/1999/MISC.5, Bonn,63-64
Vernon, Jan (1999)Clean coal technology transfer: CO2 reduction in power generation, IEA CoalResearch, Cheltenham
Wang, Alex (1999)A comparative analysis of the 1997 energy conservation law of China and theimplementing regulations of Shandong, Zhejiang and Shanghai, Washington, D.C.
Wei Zhihong; Chen Wenying (1998)Identification and implementation of priority energy technologies to address GHGmitigation in China, in: IEA (ed.): Proceedings of CTI/Industry joint seminar ontechnology diffusion in Asia, Beijing 19-20 May, Paris, 39-49
White House, Office of the Vice President (1997)Vice President announces United States and China advance energy andenvironment cooperation, Press release 29.10., Washington, D.C.
Wiesegart, Kurt (1998)Die Stromerzeugung in der VR China, Pacific Consult, Hirschberg

41
World Bank (1994)China, issues and options in greenhouse gas emissions control, Washington, D.C.
Wu Changhua; Liu, Andrew (1997)Round up: progress made, more challenges ahead, in: China EnvironmentReporter 1,2
Wu Changhua; Logan, Jeffrey (1997)Choosing a post-Kyoto course for China, China Environment Reporter SpecialEdition, 30.12.
Wu Kang; Li Binsheng (1995)Energy development in China, in: Energy Policy, 23,2, p. 167-178
Zhang Shouyi (1997)Statistics and the Great Leap Forward, in: China Economic Quarterly 1,1
Zhang Xiliang; Lin Gan; Gu Shuhua;Liu Wenqiang (1999)Wind energy technology development and diffusion. A case study of InnerMongolia, China, CICERO Working Paper 1999:5, Oslo
Zhang Zhongxiang (1995)Energy conservation in China, in: Energy Policy, 23, 2, 159-166
Zhang Zhongxiang (1997)Operationalization and priority of Joint Implementation projects, in:Intereconomics, 6, 260-292
Zhang Zhongxiang (1998)The economics of energy policy in China: implications for global climate change,Cheltenham
Zhou Dadi, Zhou Fengqi, Yu Cong, Shi Yingyi, Logan, Jeffrey (1997)Climate change mitigation: case studies from China, Pacific Northwest NationalLaboratory, Washington, D.C.
Ziener, Markus (1998)Kooperation mit China soll Stromabsatz stabilisieren, in: Handelsblatt, 11.8.